Scott County, MN
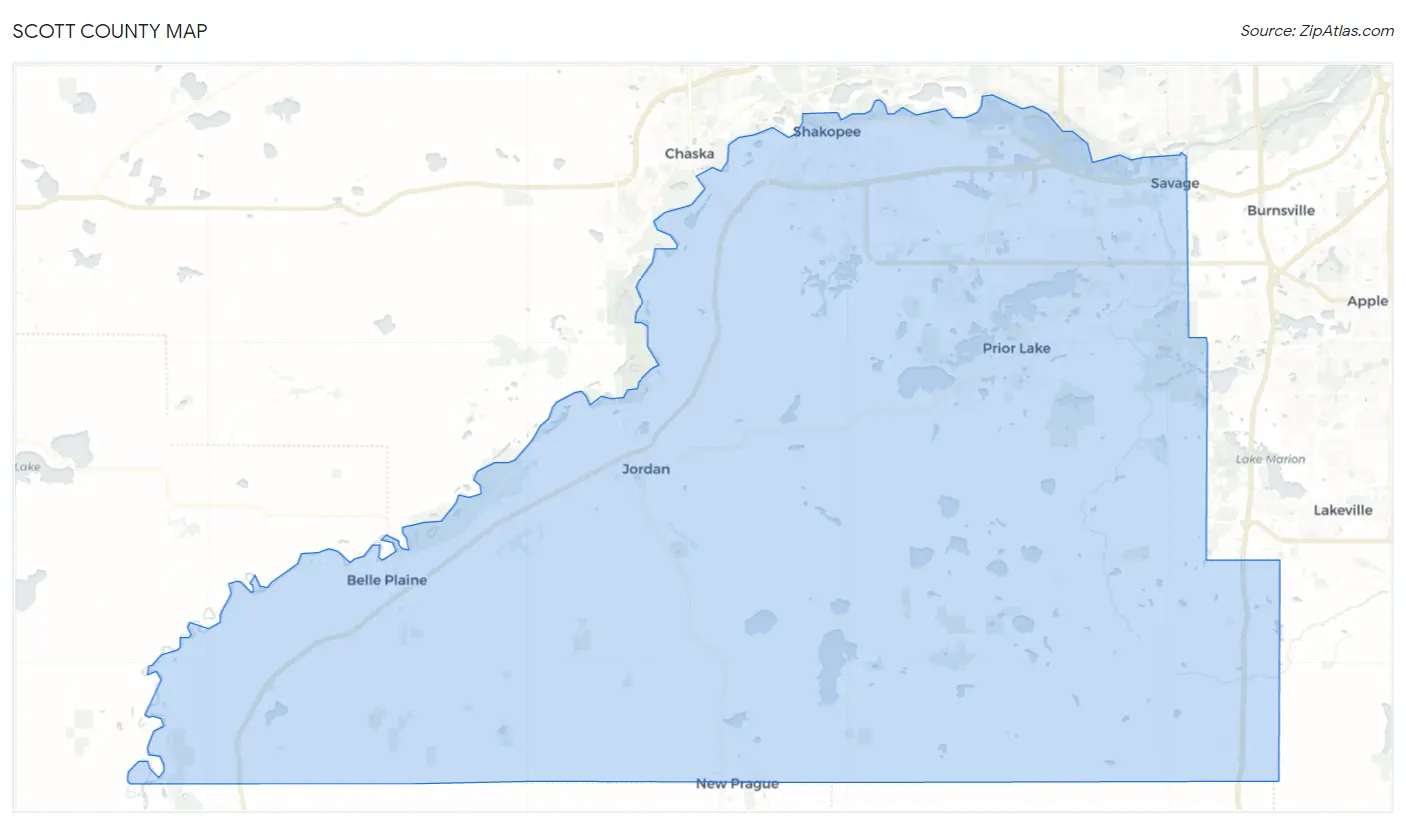
Scott County Map
Scott County Overview
151,347
TOTAL POPULATION
75,749
MALE POPULATION
75,598
FEMALE POPULATION
100.20
MALES / 100 FEMALES
99.80
FEMALES / 100 MALES
37.3
MEDIAN AGE
3.2
AVG FAMILY SIZE
2.8
AVG HOUSEHOLD SIZE
$51,259
PER CAPITA INCOME
$133,884
AVG FAMILY INCOME
$118,268
AVG HOUSEHOLD INCOME
31.4%
WAGE / INCOME GAP [ % ]
68.6¢/ $1
WAGE / INCOME GAP [ $ ]
$11,142
FAMILY INCOME DEFICIT
0.41
INEQUALITY / GINI INDEX
87,460
LABOR FORCE [ PEOPLE ]
75.4%
PERCENT IN LABOR FORCE
3.2%
UNEMPLOYMENT RATE
Scott County Area Codes
Race in Scott County
The most populous races in Scott County are White / Caucasian (121,217 | 80.1%), Asian (9,644 | 6.4%), and Hispanic or Latino (8,517 | 5.6%).
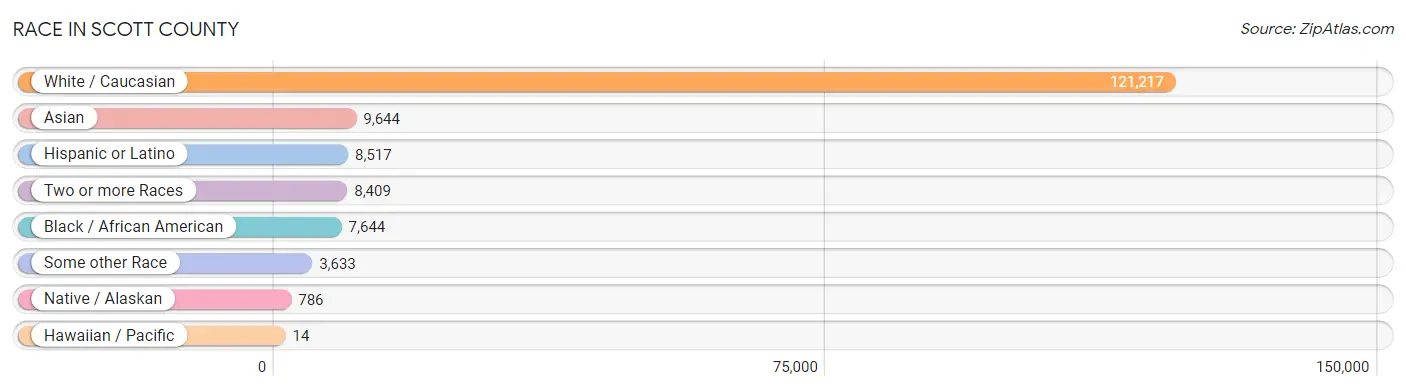
| Race | # Population | % Population |
| Asian | 9,644 | 6.4% |
| Black / African American | 7,644 | 5.1% |
| Hawaiian / Pacific | 14 | 0.0% |
| Hispanic or Latino | 8,517 | 5.6% |
| Native / Alaskan | 786 | 0.5% |
| White / Caucasian | 121,217 | 80.1% |
| Two or more Races | 8,409 | 5.6% |
| Some other Race | 3,633 | 2.4% |
| Total | 151,347 | 100.0% |
Ancestry in Scott County
The most populous ancestries reported in Scott County are German (50,224 | 33.2%), Norwegian (18,009 | 11.9%), Irish (16,030 | 10.6%), English (8,057 | 5.3%), and Swedish (7,713 | 5.1%), together accounting for 66.1% of all Scott County residents.
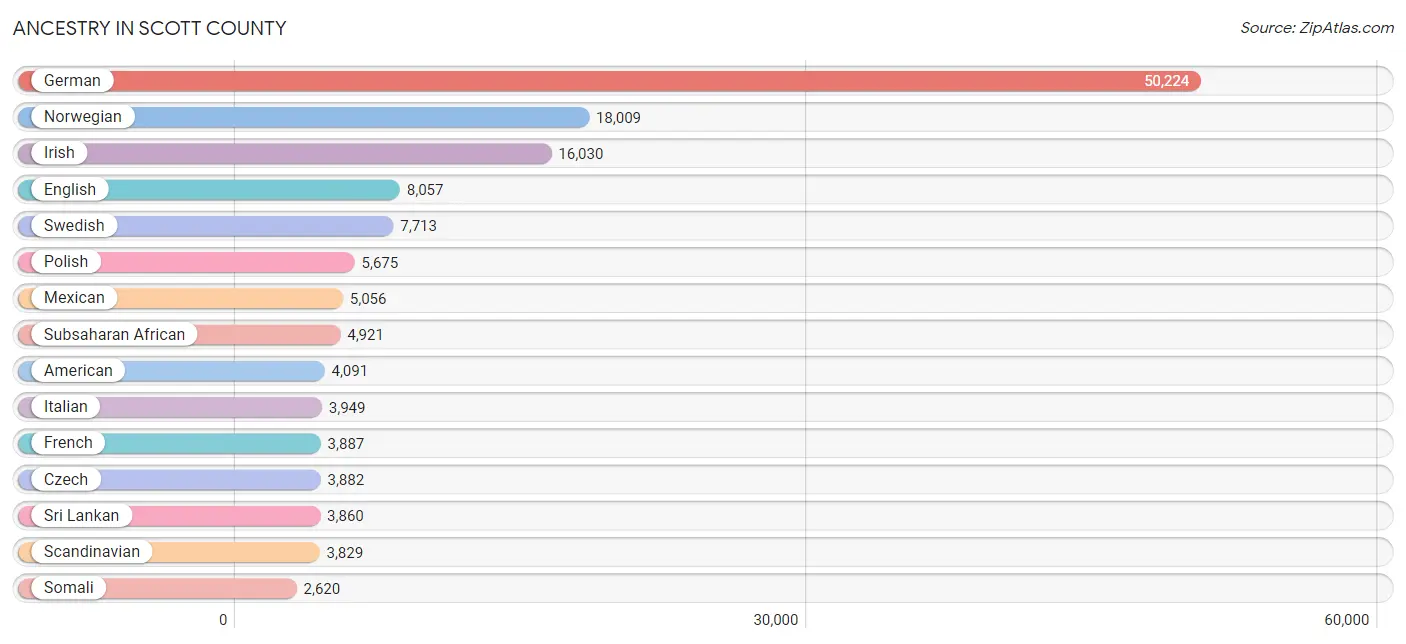
| Ancestry | # Population | % Population |
| Afghan | 12 | 0.0% |
| African | 376 | 0.3% |
| Alaska Native | 1 | 0.0% |
| Aleut | 20 | 0.0% |
| American | 4,091 | 2.7% |
| Apache | 154 | 0.1% |
| Arab | 321 | 0.2% |
| Argentinean | 34 | 0.0% |
| Armenian | 3 | 0.0% |
| Austrian | 256 | 0.2% |
| Bangladeshi | 209 | 0.1% |
| Basque | 17 | 0.0% |
| Belgian | 465 | 0.3% |
| Bhutanese | 526 | 0.4% |
| Blackfeet | 92 | 0.1% |
| Brazilian | 83 | 0.1% |
| British | 367 | 0.2% |
| British West Indian | 12 | 0.0% |
| Burmese | 661 | 0.4% |
| Canadian | 338 | 0.2% |
| Carpatho Rusyn | 4 | 0.0% |
| Celtic | 74 | 0.1% |
| Central American | 1,091 | 0.7% |
| Central American Indian | 187 | 0.1% |
| Cherokee | 327 | 0.2% |
| Chickasaw | 35 | 0.0% |
| Chilean | 34 | 0.0% |
| Chippewa | 433 | 0.3% |
| Choctaw | 1 | 0.0% |
| Colombian | 112 | 0.1% |
| Costa Rican | 12 | 0.0% |
| Cree | 35 | 0.0% |
| Croatian | 360 | 0.2% |
| Cuban | 152 | 0.1% |
| Czech | 3,882 | 2.6% |
| Czechoslovakian | 554 | 0.4% |
| Danish | 1,467 | 1.0% |
| Dominican | 91 | 0.1% |
| Dutch | 1,859 | 1.2% |
| Eastern European | 280 | 0.2% |
| Ecuadorian | 111 | 0.1% |
| Egyptian | 62 | 0.0% |
| English | 8,057 | 5.3% |
| Estonian | 15 | 0.0% |
| Ethiopian | 636 | 0.4% |
| European | 2,477 | 1.6% |
| Finnish | 1,449 | 1.0% |
| French | 3,887 | 2.6% |
| French American Indian | 1 | 0.0% |
| French Canadian | 1,181 | 0.8% |
| German | 50,224 | 33.2% |
| German Russian | 31 | 0.0% |
| Ghanaian | 680 | 0.4% |
| Greek | 247 | 0.2% |
| Guamanian / Chamorro | 8 | 0.0% |
| Guatemalan | 357 | 0.2% |
| Guyanese | 291 | 0.2% |
| Honduran | 128 | 0.1% |
| Hungarian | 216 | 0.1% |
| Icelander | 56 | 0.0% |
| Indian (Asian) | 1,549 | 1.0% |
| Irish | 16,030 | 10.6% |
| Israeli | 205 | 0.1% |
| Italian | 3,949 | 2.6% |
| Japanese | 1,233 | 0.8% |
| Kenyan | 123 | 0.1% |
| Korean | 706 | 0.5% |
| Laotian | 88 | 0.1% |
| Latvian | 110 | 0.1% |
| Lebanese | 114 | 0.1% |
| Liberian | 39 | 0.0% |
| Lithuanian | 69 | 0.1% |
| Lumbee | 2 | 0.0% |
| Luxembourger | 124 | 0.1% |
| Malaysian | 1,119 | 0.7% |
| Mexican | 5,056 | 3.3% |
| Mexican American Indian | 17 | 0.0% |
| Moroccan | 26 | 0.0% |
| Native Hawaiian | 313 | 0.2% |
| Nicaraguan | 65 | 0.0% |
| Nigerian | 473 | 0.3% |
| Northern European | 353 | 0.2% |
| Norwegian | 18,009 | 11.9% |
| Pakistani | 12 | 0.0% |
| Palestinian | 24 | 0.0% |
| Panamanian | 143 | 0.1% |
| Pennsylvania German | 24 | 0.0% |
| Peruvian | 278 | 0.2% |
| Polish | 5,675 | 3.7% |
| Portuguese | 78 | 0.1% |
| Puerto Rican | 646 | 0.4% |
| Romanian | 57 | 0.0% |
| Russian | 1,761 | 1.2% |
| Salvadoran | 386 | 0.3% |
| Scandinavian | 3,829 | 2.5% |
| Scotch-Irish | 489 | 0.3% |
| Scottish | 1,815 | 1.2% |
| Serbian | 59 | 0.0% |
| Sioux | 552 | 0.4% |
| Slavic | 57 | 0.0% |
| Slovak | 224 | 0.2% |
| Slovene | 146 | 0.1% |
| Somali | 2,620 | 1.7% |
| South American | 711 | 0.5% |
| South American Indian | 172 | 0.1% |
| Spaniard | 317 | 0.2% |
| Spanish | 45 | 0.0% |
| Sri Lankan | 3,860 | 2.5% |
| Subsaharan African | 4,921 | 3.3% |
| Sudanese | 16 | 0.0% |
| Swedish | 7,713 | 5.1% |
| Swiss | 432 | 0.3% |
| Syrian | 68 | 0.0% |
| Thai | 1,806 | 1.2% |
| Trinidadian and Tobagonian | 77 | 0.1% |
| Turkish | 65 | 0.0% |
| Ukrainian | 765 | 0.5% |
| Ute | 1 | 0.0% |
| Venezuelan | 139 | 0.1% |
| Vietnamese | 35 | 0.0% |
| Welsh | 452 | 0.3% |
| West Indian | 112 | 0.1% |
| Yugoslavian | 78 | 0.1% |
| Yuman | 24 | 0.0% | View All 124 Rows |
Immigrants in Scott County
The most numerous immigrant groups reported in Scott County came from Asia (6,000 | 4.0%), Latin America (3,355 | 2.2%), Africa (3,324 | 2.2%), South Eastern Asia (3,254 | 2.1%), and Central America (2,591 | 1.7%), together accounting for 12.2% of all Scott County residents.
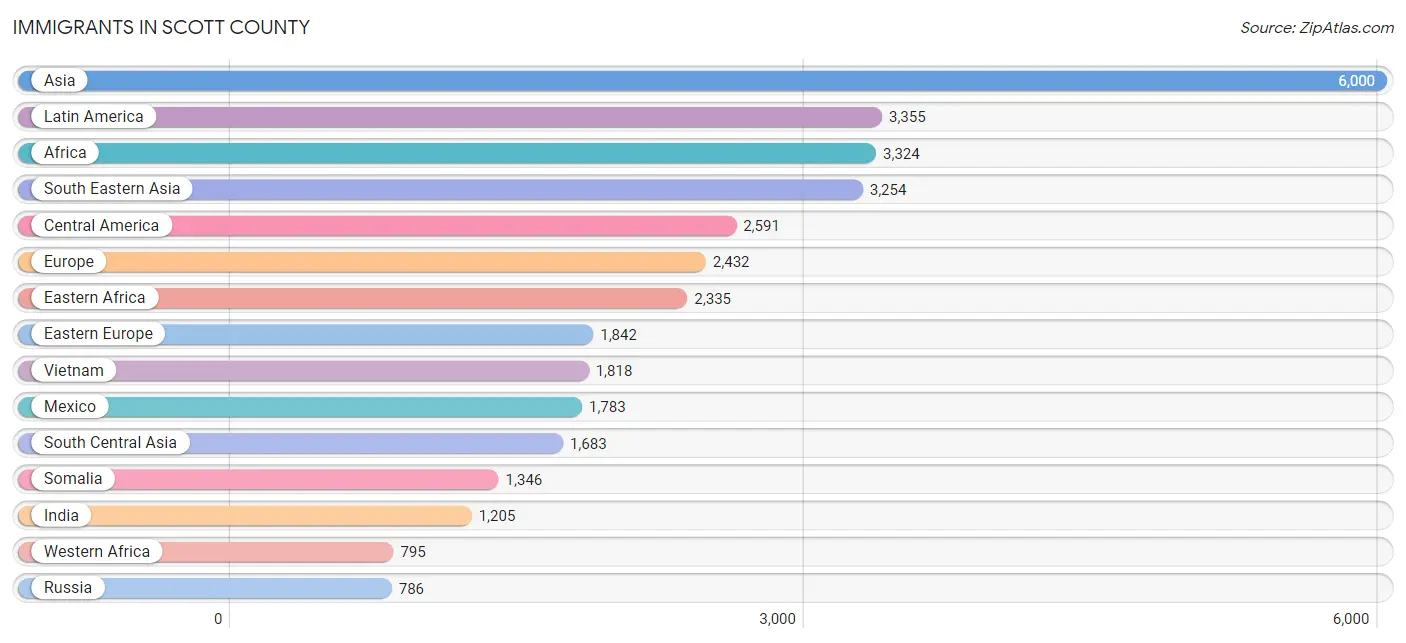
| Immigration Origin | # Population | % Population |
| Africa | 3,324 | 2.2% |
| Argentina | 26 | 0.0% |
| Armenia | 3 | 0.0% |
| Asia | 6,000 | 4.0% |
| Bangladesh | 35 | 0.0% |
| Bosnia and Herzegovina | 12 | 0.0% |
| Brazil | 23 | 0.0% |
| Cambodia | 710 | 0.5% |
| Cameroon | 74 | 0.1% |
| Canada | 304 | 0.2% |
| Caribbean | 135 | 0.1% |
| Central America | 2,591 | 1.7% |
| China | 419 | 0.3% |
| Colombia | 53 | 0.0% |
| Cuba | 47 | 0.0% |
| Czechoslovakia | 30 | 0.0% |
| Denmark | 40 | 0.0% |
| Eastern Africa | 2,335 | 1.5% |
| Eastern Asia | 730 | 0.5% |
| Eastern Europe | 1,842 | 1.2% |
| Ecuador | 104 | 0.1% |
| Egypt | 46 | 0.0% |
| El Salvador | 180 | 0.1% |
| England | 65 | 0.0% |
| Eritrea | 41 | 0.0% |
| Ethiopia | 659 | 0.4% |
| Europe | 2,432 | 1.6% |
| France | 16 | 0.0% |
| Germany | 225 | 0.2% |
| Ghana | 411 | 0.3% |
| Guatemala | 545 | 0.4% |
| Guyana | 245 | 0.2% |
| Honduras | 31 | 0.0% |
| Hong Kong | 33 | 0.0% |
| Hungary | 46 | 0.0% |
| India | 1,205 | 0.8% |
| Indonesia | 88 | 0.1% |
| Italy | 27 | 0.0% |
| Japan | 15 | 0.0% |
| Kazakhstan | 168 | 0.1% |
| Kenya | 157 | 0.1% |
| Korea | 296 | 0.2% |
| Laos | 257 | 0.2% |
| Latin America | 3,355 | 2.2% |
| Latvia | 33 | 0.0% |
| Liberia | 20 | 0.0% |
| Mexico | 1,783 | 1.2% |
| Middle Africa | 74 | 0.1% |
| Moldova | 42 | 0.0% |
| Morocco | 20 | 0.0% |
| Nepal | 153 | 0.1% |
| Netherlands | 7 | 0.0% |
| Nicaragua | 50 | 0.0% |
| Nigeria | 254 | 0.2% |
| Northern Africa | 82 | 0.1% |
| Northern Europe | 266 | 0.2% |
| Norway | 16 | 0.0% |
| Panama | 2 | 0.0% |
| Peru | 37 | 0.0% |
| Philippines | 322 | 0.2% |
| Poland | 316 | 0.2% |
| Romania | 22 | 0.0% |
| Russia | 786 | 0.5% |
| Saudi Arabia | 18 | 0.0% |
| Scotland | 31 | 0.0% |
| Serbia | 15 | 0.0% |
| Somalia | 1,346 | 0.9% |
| South Africa | 38 | 0.0% |
| South America | 629 | 0.4% |
| South Central Asia | 1,683 | 1.1% |
| South Eastern Asia | 3,254 | 2.1% |
| Southern Europe | 72 | 0.1% |
| Spain | 45 | 0.0% |
| Sudan | 16 | 0.0% |
| Sweden | 9 | 0.0% |
| Switzerland | 3 | 0.0% |
| Taiwan | 15 | 0.0% |
| Thailand | 59 | 0.0% |
| Trinidad and Tobago | 85 | 0.1% |
| Turkey | 65 | 0.0% |
| Uganda | 23 | 0.0% |
| Ukraine | 536 | 0.4% |
| Uzbekistan | 54 | 0.0% |
| Venezuela | 139 | 0.1% |
| Vietnam | 1,818 | 1.2% |
| Western Africa | 795 | 0.5% |
| Western Asia | 91 | 0.1% |
| Western Europe | 251 | 0.2% | View All 88 Rows |
Sex and Age in Scott County
Sex and Age in Scott County
The most populous age groups in Scott County are 35 to 39 Years (6,021 | 8.0%) for men and 5 to 9 Years (5,873 | 7.8%) for women.
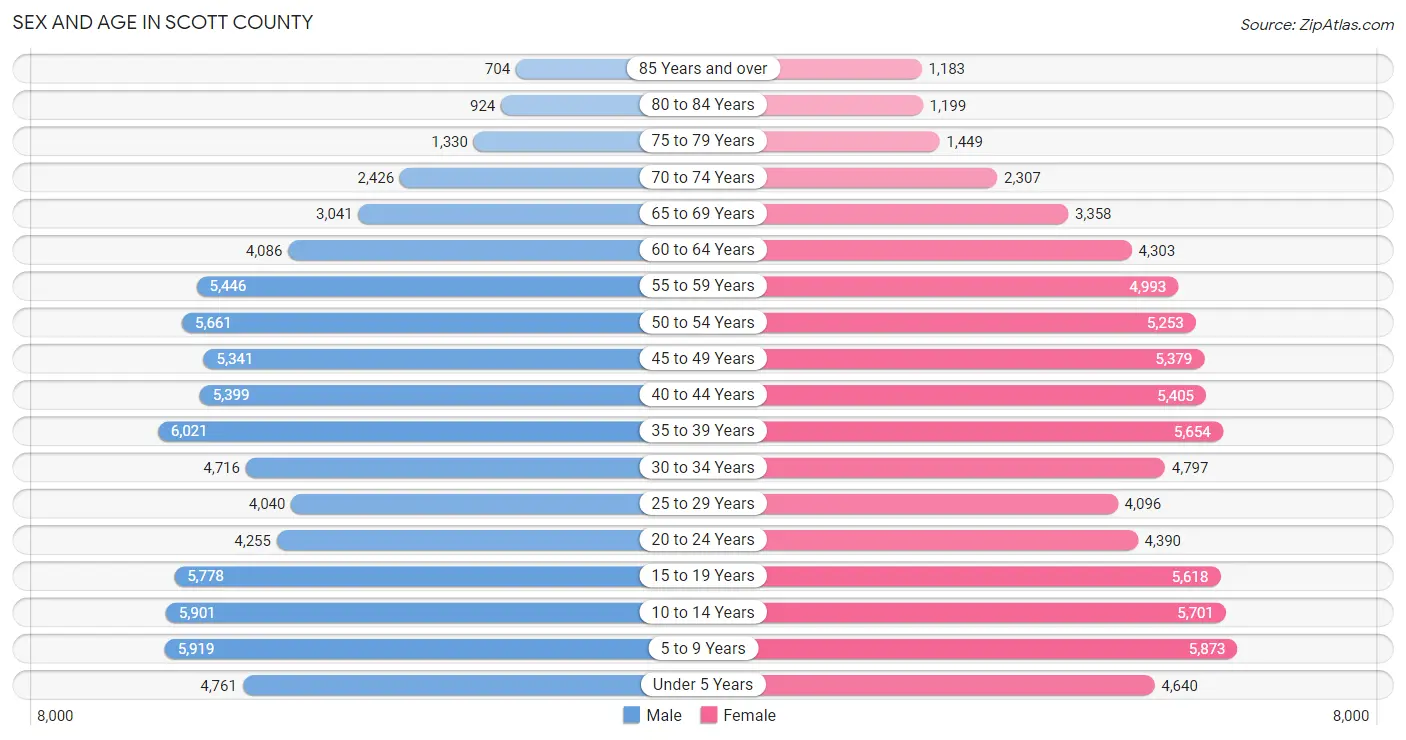
| Age Bracket | Male | Female |
| Under 5 Years | 4,761 (6.3%) | 4,640 (6.1%) |
| 5 to 9 Years | 5,919 (7.8%) | 5,873 (7.8%) |
| 10 to 14 Years | 5,901 (7.8%) | 5,701 (7.5%) |
| 15 to 19 Years | 5,778 (7.6%) | 5,618 (7.4%) |
| 20 to 24 Years | 4,255 (5.6%) | 4,390 (5.8%) |
| 25 to 29 Years | 4,040 (5.3%) | 4,096 (5.4%) |
| 30 to 34 Years | 4,716 (6.2%) | 4,797 (6.4%) |
| 35 to 39 Years | 6,021 (8.0%) | 5,654 (7.5%) |
| 40 to 44 Years | 5,399 (7.1%) | 5,405 (7.1%) |
| 45 to 49 Years | 5,341 (7.0%) | 5,379 (7.1%) |
| 50 to 54 Years | 5,661 (7.5%) | 5,253 (7.0%) |
| 55 to 59 Years | 5,446 (7.2%) | 4,993 (6.6%) |
| 60 to 64 Years | 4,086 (5.4%) | 4,303 (5.7%) |
| 65 to 69 Years | 3,041 (4.0%) | 3,358 (4.4%) |
| 70 to 74 Years | 2,426 (3.2%) | 2,307 (3.0%) |
| 75 to 79 Years | 1,330 (1.8%) | 1,449 (1.9%) |
| 80 to 84 Years | 924 (1.2%) | 1,199 (1.6%) |
| 85 Years and over | 704 (0.9%) | 1,183 (1.6%) |
| Total | 75,749 (100.0%) | 75,598 (100.0%) |
Families and Households in Scott County
Median Family Size in Scott County
The median family size in Scott County is 3.21 persons per family, with married-couple families (32,456 | 79.6%) accounting for the largest median family size of 3.28 persons per family. On the other hand, single male/father families (3,089 | 7.6%) represent the smallest median family size with 2.70 persons per family.
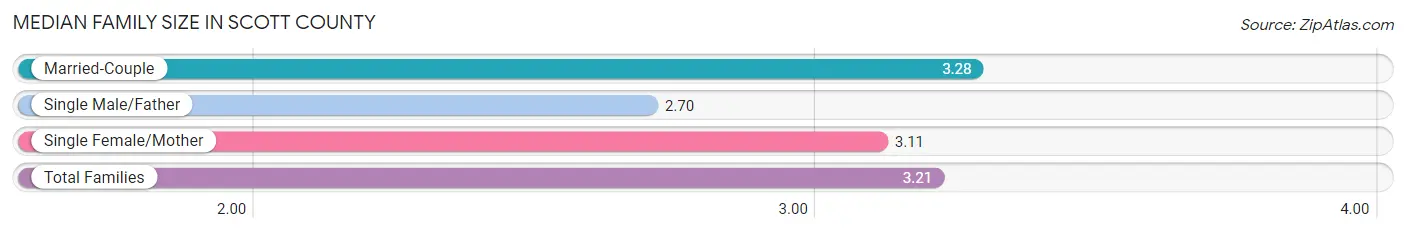
| Family Type | # Families | Family Size |
| Married-Couple | 32,456 (79.6%) | 3.28 |
| Single Male/Father | 3,089 (7.6%) | 2.70 |
| Single Female/Mother | 5,214 (12.8%) | 3.11 |
| Total Families | 40,759 (100.0%) | 3.21 |
Median Household Size in Scott County
The median household size in Scott County is 2.83 persons per household, with single female/mother households (5,214 | 9.8%) accounting for the largest median household size of 3.35 persons per household. non-family households (12,255 | 23.1%) represent the smallest median household size with 1.30 persons per household.
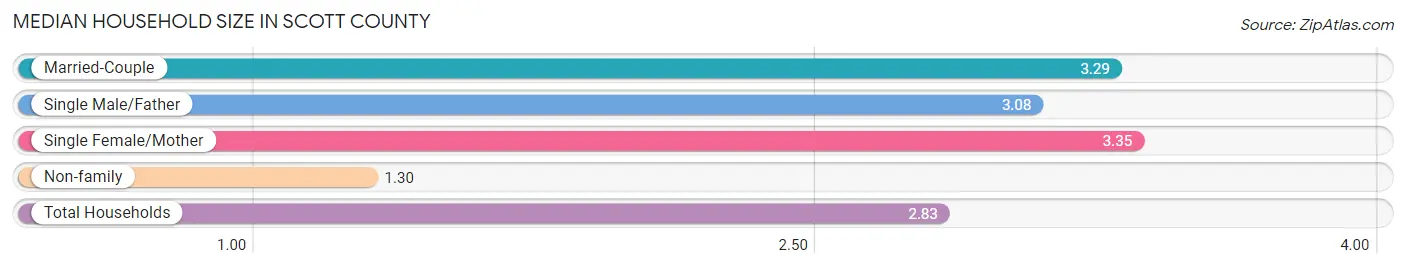
| Household Type | # Households | Household Size |
| Married-Couple | 32,456 (61.2%) | 3.29 |
| Single Male/Father | 3,089 (5.8%) | 3.08 |
| Single Female/Mother | 5,214 (9.8%) | 3.35 |
| Non-family | 12,255 (23.1%) | 1.30 |
| Total Households | 53,014 (100.0%) | 2.83 |
Household Size by Marriage Status in Scott County
Out of a total of 53,014 households in Scott County, 40,759 (76.9%) are family households, while 12,255 (23.1%) are nonfamily households. The most numerous type of family households are 2-person households, comprising 14,967, and the most common type of nonfamily households are 1-person households, comprising 9,401.
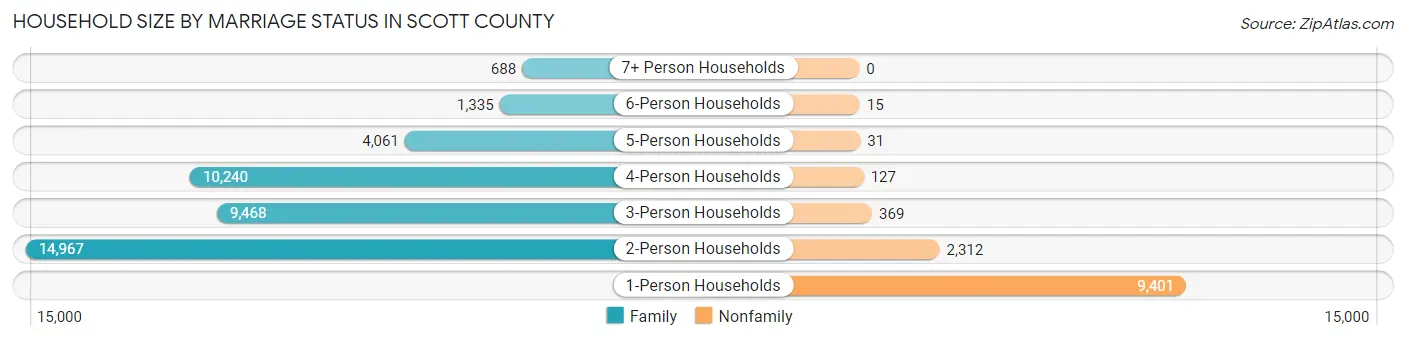
| Household Size | Family Households | Nonfamily Households |
| 1-Person Households | - | 9,401 (17.7%) |
| 2-Person Households | 14,967 (28.2%) | 2,312 (4.4%) |
| 3-Person Households | 9,468 (17.9%) | 369 (0.7%) |
| 4-Person Households | 10,240 (19.3%) | 127 (0.2%) |
| 5-Person Households | 4,061 (7.7%) | 31 (0.1%) |
| 6-Person Households | 1,335 (2.5%) | 15 (0.0%) |
| 7+ Person Households | 688 (1.3%) | 0 (0.0%) |
| Total | 40,759 (76.9%) | 12,255 (23.1%) |
Female Fertility in Scott County
Fertility by Age in Scott County
Average fertility rate in Scott County is 45.0 births per 1,000 women. Women in the age bracket of 20 to 34 years have the highest fertility rate with 91.0 births per 1,000 women. Women in the age bracket of 20 to 34 years acount for 72.6% of all women with births.
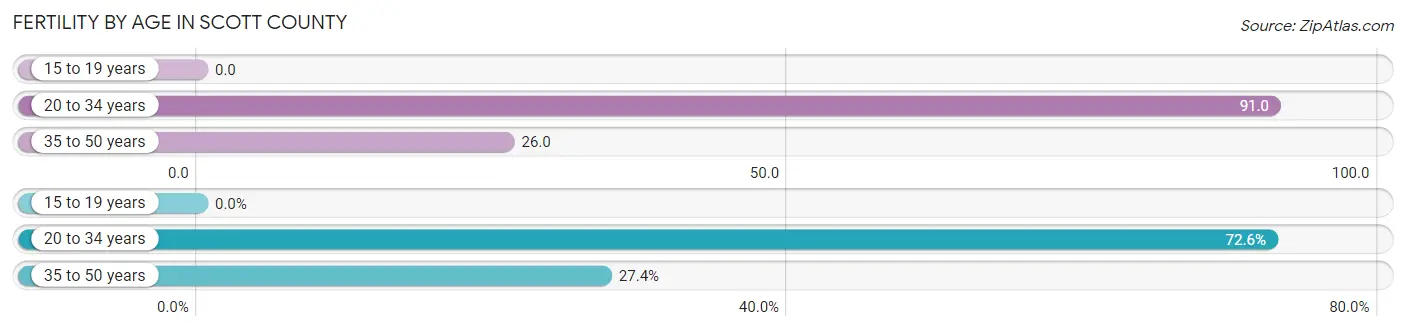
| Age Bracket | Women with Births | Births / 1,000 Women |
| 15 to 19 years | 0 (0.0%) | 0.0 |
| 20 to 34 years | 1,205 (72.6%) | 91.0 |
| 35 to 50 years | 455 (27.4%) | 26.0 |
| Total | 1,660 (100.0%) | 45.0 |
Fertility by Age by Marriage Status in Scott County
92.0% of women with births (1,660) in Scott County are married. The highest percentage of unmarried women with births falls into 35 to 50 years age bracket with 10.5% of them unmarried at the time of birth, while the lowest percentage of unmarried women with births belong to 20 to 34 years age bracket with 7.1% of them unmarried.
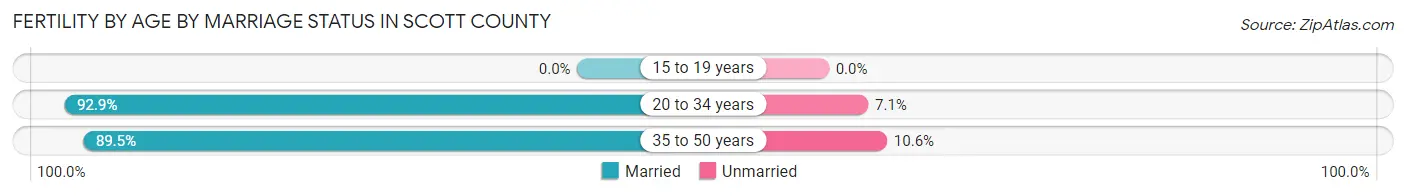
| Age Bracket | Married | Unmarried |
| 15 to 19 years | 0 (0.0%) | 0 (0.0%) |
| 20 to 34 years | 1,119 (92.9%) | 86 (7.1%) |
| 35 to 50 years | 407 (89.4%) | 48 (10.5%) |
| Total | 1,527 (92.0%) | 133 (8.0%) |
Fertility by Education in Scott County
Average fertility rate in Scott County is 45.0 births per 1,000 women. Women with the education attainment of high school diploma have the highest fertility rate of 52.0 births per 1,000 women, while women with the education attainment of less than high school have the lowest fertility at 23.0 births per 1,000 women. Women with the education attainment of bachelor's degree represent 31.6% of all women with births.
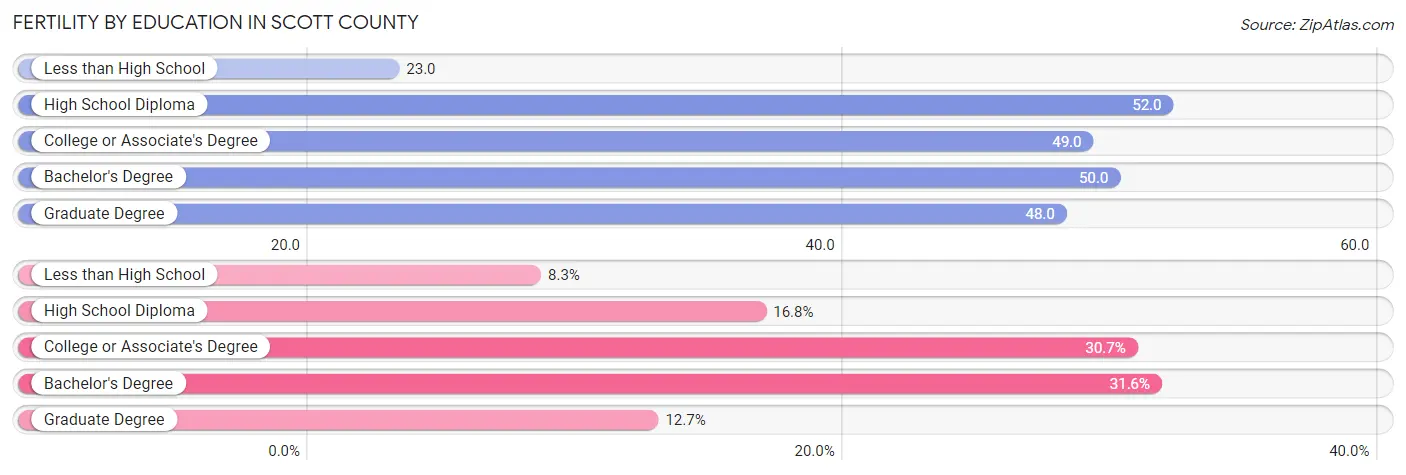
| Educational Attainment | Women with Births | Births / 1,000 Women |
| Less than High School | 138 (8.3%) | 23.0 |
| High School Diploma | 278 (16.8%) | 52.0 |
| College or Associate's Degree | 509 (30.7%) | 49.0 |
| Bachelor's Degree | 524 (31.6%) | 50.0 |
| Graduate Degree | 211 (12.7%) | 48.0 |
| Total | 1,660 (100.0%) | 45.0 |
Fertility by Education by Marriage Status in Scott County
8.0% of women with births in Scott County are unmarried. Women with the educational attainment of graduate degree are most likely to be married with 98.6% of them married at childbirth, while women with the educational attainment of high school diploma are least likely to be married with 14.0% of them unmarried at childbirth.
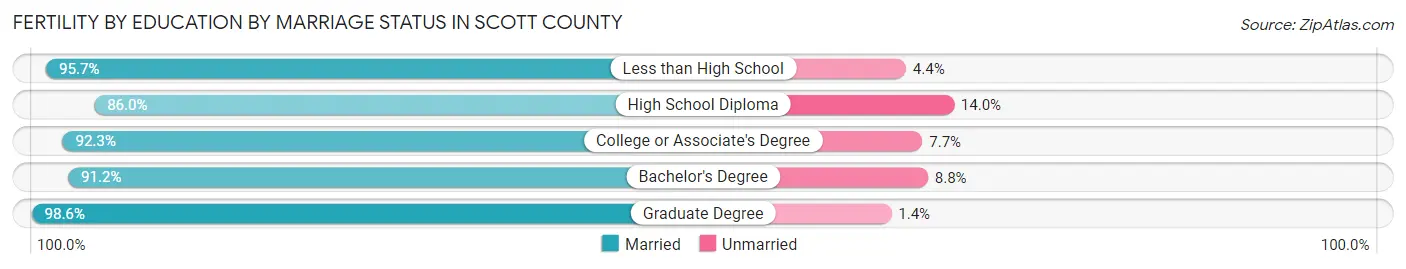
| Educational Attainment | Married | Unmarried |
| Less than High School | 132 (95.7%) | 6 (4.3%) |
| High School Diploma | 239 (86.0%) | 39 (14.0%) |
| College or Associate's Degree | 470 (92.3%) | 39 (7.7%) |
| Bachelor's Degree | 478 (91.2%) | 46 (8.8%) |
| Graduate Degree | 208 (98.6%) | 3 (1.4%) |
| Total | 1,527 (92.0%) | 133 (8.0%) |
Income in Scott County
Income Overview in Scott County
Per Capita Income in Scott County is $51,259, while median incomes of families and households are $133,884 and $118,268 respectively.
| Characteristic | Number | Measure |
| Per Capita Income | 151,347 | $51,259 |
| Median Family Income | 40,759 | $133,884 |
| Mean Family Income | 40,759 | $159,342 |
| Median Household Income | 53,014 | $118,268 |
| Mean Household Income | 53,014 | $144,751 |
| Income Deficit | 40,759 | $11,142 |
| Wage / Income Gap (%) | 151,347 | 31.43% |
| Wage / Income Gap ($) | 151,347 | 68.57¢ per $1 |
| Gini / Inequality Index | 151,347 | 0.41 |
Earnings by Sex in Scott County
Average Earnings in Scott County are $56,025, $66,892 for men and $45,869 for women, a difference of 31.4%.
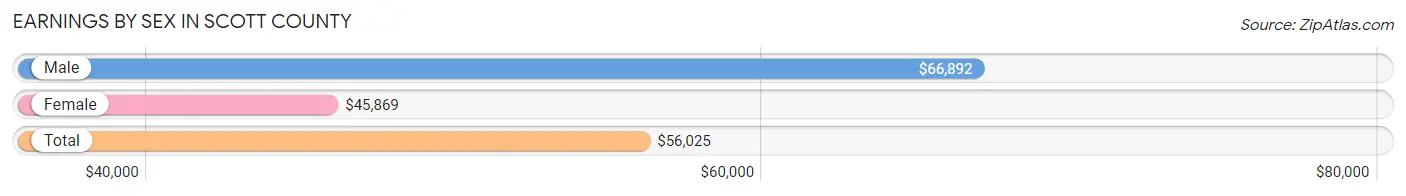
| Sex | Number | Average Earnings |
| Male | 48,007 (52.5%) | $66,892 |
| Female | 43,417 (47.5%) | $45,869 |
| Total | 91,424 (100.0%) | $56,025 |
Earnings by Sex by Income Bracket in Scott County
The most common earnings brackets in Scott County are $100,000+ for men (13,869 | 28.9%) and $100,000+ for women (7,055 | 16.3%).
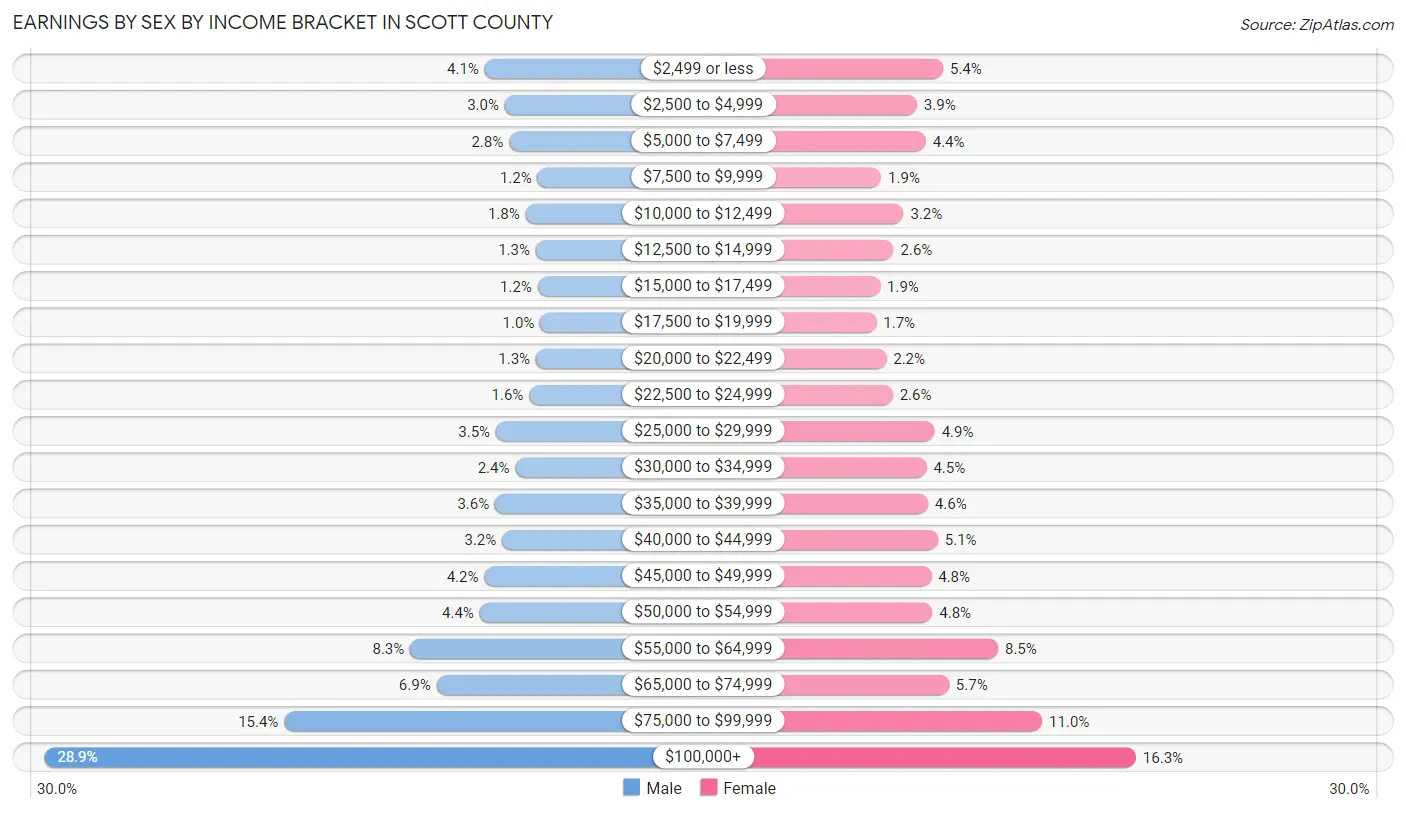
| Income | Male | Female |
| $2,499 or less | 1,987 (4.1%) | 2,347 (5.4%) |
| $2,500 to $4,999 | 1,444 (3.0%) | 1,710 (3.9%) |
| $5,000 to $7,499 | 1,331 (2.8%) | 1,929 (4.4%) |
| $7,500 to $9,999 | 561 (1.2%) | 836 (1.9%) |
| $10,000 to $12,499 | 883 (1.8%) | 1,386 (3.2%) |
| $12,500 to $14,999 | 608 (1.3%) | 1,144 (2.6%) |
| $15,000 to $17,499 | 558 (1.2%) | 810 (1.9%) |
| $17,500 to $19,999 | 491 (1.0%) | 720 (1.7%) |
| $20,000 to $22,499 | 604 (1.3%) | 966 (2.2%) |
| $22,500 to $24,999 | 785 (1.6%) | 1,118 (2.6%) |
| $25,000 to $29,999 | 1,684 (3.5%) | 2,145 (4.9%) |
| $30,000 to $34,999 | 1,164 (2.4%) | 1,944 (4.5%) |
| $35,000 to $39,999 | 1,710 (3.6%) | 1,978 (4.6%) |
| $40,000 to $44,999 | 1,516 (3.2%) | 2,225 (5.1%) |
| $45,000 to $49,999 | 1,998 (4.2%) | 2,062 (4.8%) |
| $50,000 to $54,999 | 2,124 (4.4%) | 2,089 (4.8%) |
| $55,000 to $64,999 | 4,000 (8.3%) | 3,691 (8.5%) |
| $65,000 to $74,999 | 3,290 (6.9%) | 2,494 (5.7%) |
| $75,000 to $99,999 | 7,400 (15.4%) | 4,768 (11.0%) |
| $100,000+ | 13,869 (28.9%) | 7,055 (16.3%) |
| Total | 48,007 (100.0%) | 43,417 (100.0%) |
Earnings by Sex by Educational Attainment in Scott County
Average earnings in Scott County are $77,216 for men and $53,478 for women, a difference of 30.7%. Men with an educational attainment of graduate degree enjoy the highest average annual earnings of $108,421, while those with less than high school education earn the least with $44,750. Women with an educational attainment of graduate degree earn the most with the average annual earnings of $83,974, while those with less than high school education have the smallest earnings of $32,742.
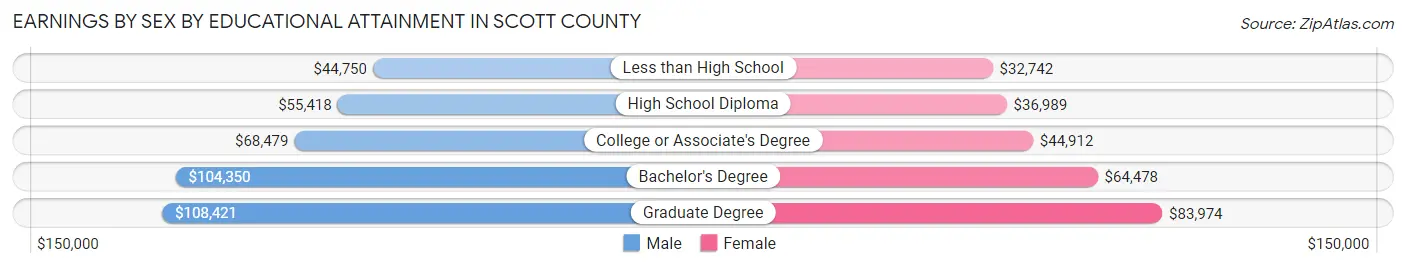
| Educational Attainment | Male Income | Female Income |
| Less than High School | $44,750 | $32,742 |
| High School Diploma | $55,418 | $36,989 |
| College or Associate's Degree | $68,479 | $44,912 |
| Bachelor's Degree | $104,350 | $64,478 |
| Graduate Degree | $108,421 | $83,974 |
| Total | $77,216 | $53,478 |
Family Income in Scott County
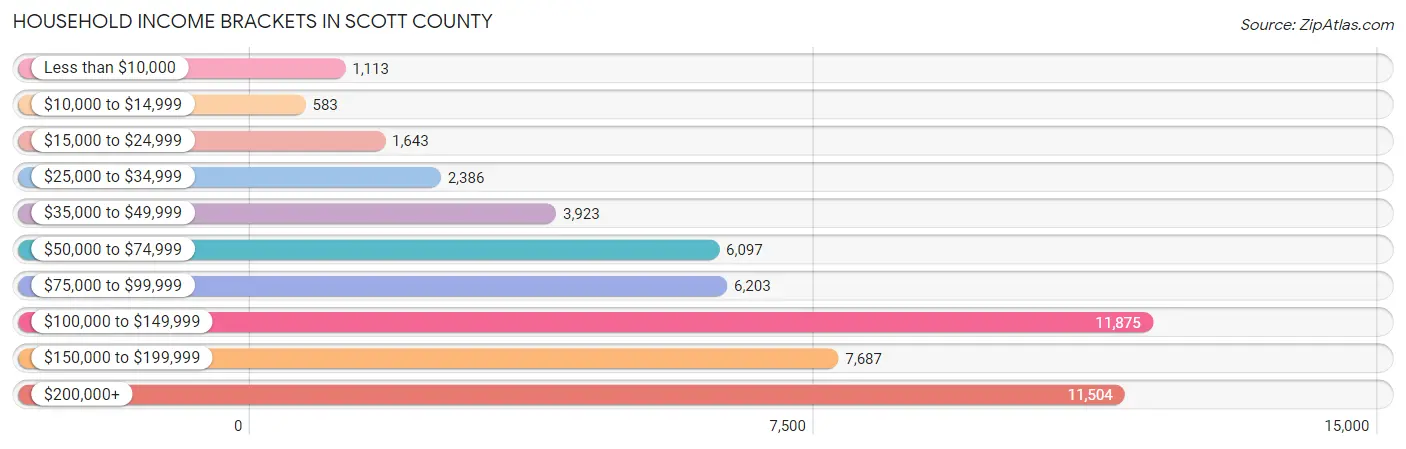
Family Income Brackets in Scott County
According to the Scott County family income data, there are 10,557 families falling into the $200,000+ income range, which is the most common income bracket and makes up 25.9% of all families. Conversely, the $10,000 to $14,999 income bracket is the least frequent group with only 204 families (0.5%) belonging to this category.
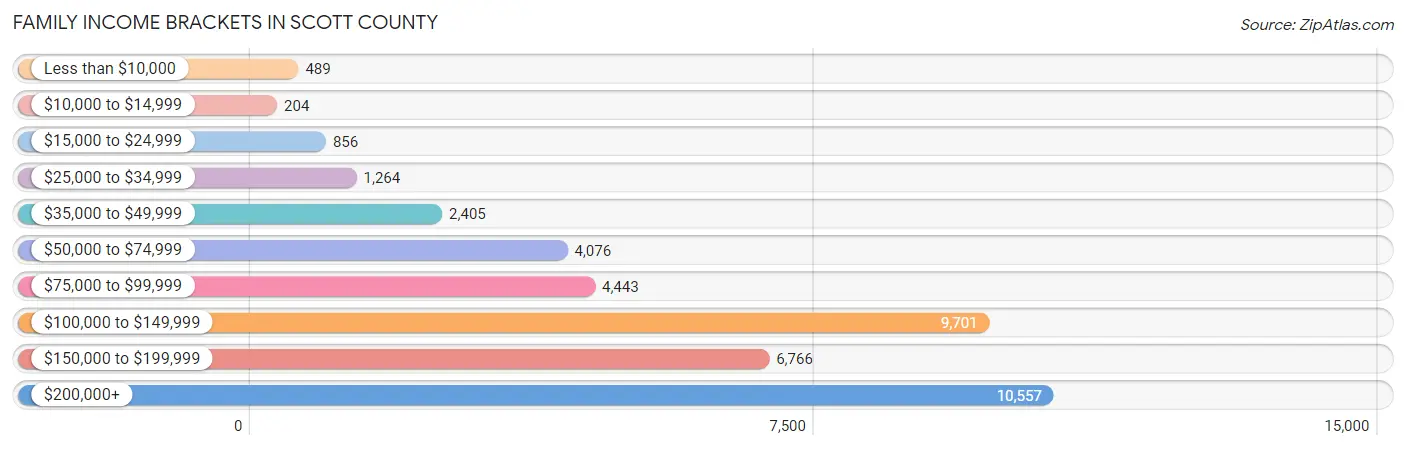
| Income Bracket | # Families | % Families |
| Less than $10,000 | 489 | 1.2% |
| $10,000 to $14,999 | 204 | 0.5% |
| $15,000 to $24,999 | 856 | 2.1% |
| $25,000 to $34,999 | 1,264 | 3.1% |
| $35,000 to $49,999 | 2,405 | 5.9% |
| $50,000 to $74,999 | 4,076 | 10.0% |
| $75,000 to $99,999 | 4,443 | 10.9% |
| $100,000 to $149,999 | 9,701 | 23.8% |
| $150,000 to $199,999 | 6,766 | 16.6% |
| $200,000+ | 10,557 | 25.9% |
Family Income by Famaliy Size in Scott County
4-person families (9,892 | 24.3%) account for the highest median family income in Scott County with $157,190 per family, while 2-person families (15,876 | 39.0%) have the highest median income of $53,661 per family member.
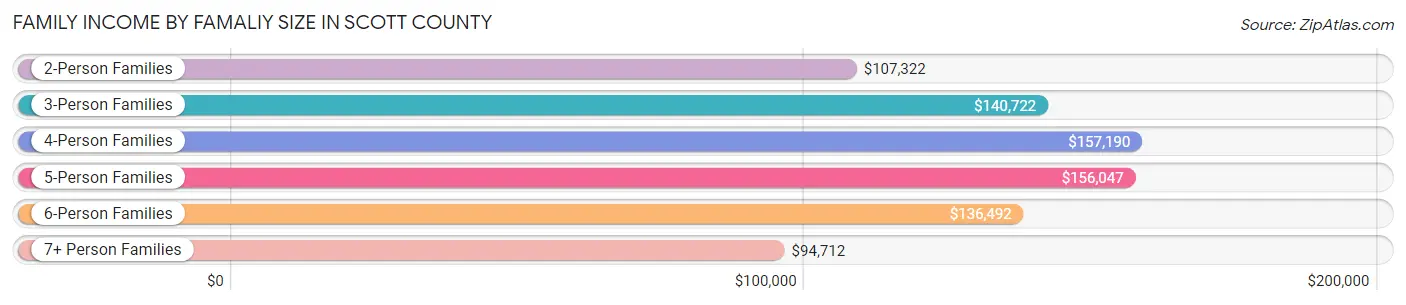
| Income Bracket | # Families | Median Income |
| 2-Person Families | 15,876 (39.0%) | $107,322 |
| 3-Person Families | 9,482 (23.3%) | $140,722 |
| 4-Person Families | 9,892 (24.3%) | $157,190 |
| 5-Person Families | 3,618 (8.9%) | $156,047 |
| 6-Person Families | 1,319 (3.2%) | $136,492 |
| 7+ Person Families | 572 (1.4%) | $94,712 |
| Total | 40,759 (100.0%) | $133,884 |
Family Income by Number of Earners in Scott County
The median family income in Scott County is $133,884, with families comprising 3+ earners (7,348) having the highest median family income of $182,369, while families with no earners (3,144) have the lowest median family income of $63,326, accounting for 18.0% and 7.7% of families, respectively.
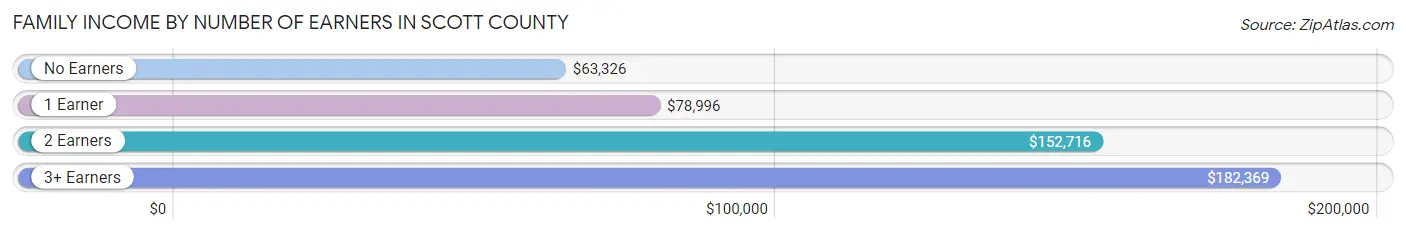
| Number of Earners | # Families | Median Income |
| No Earners | 3,144 (7.7%) | $63,326 |
| 1 Earner | 9,490 (23.3%) | $78,996 |
| 2 Earners | 20,777 (51.0%) | $152,716 |
| 3+ Earners | 7,348 (18.0%) | $182,369 |
| Total | 40,759 (100.0%) | $133,884 |
Household Income in Scott County
Household Income Brackets in Scott County
With 11,875 households falling in the category, the $100,000 to $149,999 income range is the most frequent in Scott County, accounting for 22.4% of all households. In contrast, only 583 households (1.1%) fall into the $10,000 to $14,999 income bracket, making it the least populous group.
| Income Bracket | # Households | % Households |
| Less than $10,000 | 1,113 | 2.1% |
| $10,000 to $14,999 | 583 | 1.1% |
| $15,000 to $24,999 | 1,643 | 3.1% |
| $25,000 to $34,999 | 2,386 | 4.5% |
| $35,000 to $49,999 | 3,923 | 7.4% |
| $50,000 to $74,999 | 6,097 | 11.5% |
| $75,000 to $99,999 | 6,203 | 11.7% |
| $100,000 to $149,999 | 11,875 | 22.4% |
| $150,000 to $199,999 | 7,687 | 14.5% |
| $200,000+ | 11,504 | 21.7% |
Household Income by Householder Age in Scott County
The median household income in Scott County is $118,268, with the highest median household income of $143,482 found in the 45 to 64 years age bracket for the primary householder. A total of 21,887 households (41.3%) fall into this category. Meanwhile, the 65+ years age bracket for the primary householder has the lowest median household income of $66,593, with 10,457 households (19.7%) in this group.
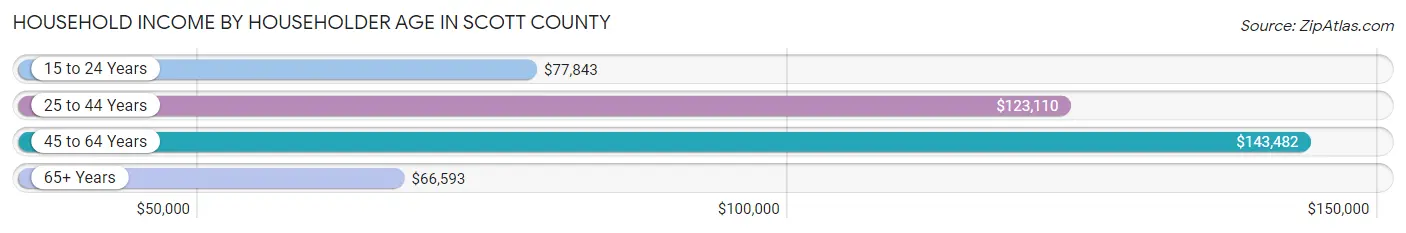
| Income Bracket | # Households | Median Income |
| 15 to 24 Years | 1,475 (2.8%) | $77,843 |
| 25 to 44 Years | 19,195 (36.2%) | $123,110 |
| 45 to 64 Years | 21,887 (41.3%) | $143,482 |
| 65+ Years | 10,457 (19.7%) | $66,593 |
| Total | 53,014 (100.0%) | $118,268 |
Poverty in Scott County
Income Below Poverty by Sex and Age in Scott County
With 4.3% poverty level for males and 5.7% for females among the residents of Scott County, 5 year old males and 6 to 11 year old females are the most vulnerable to poverty, with 114 males (12.4%) and 733 females (10.5%) in their respective age groups living below the poverty level.
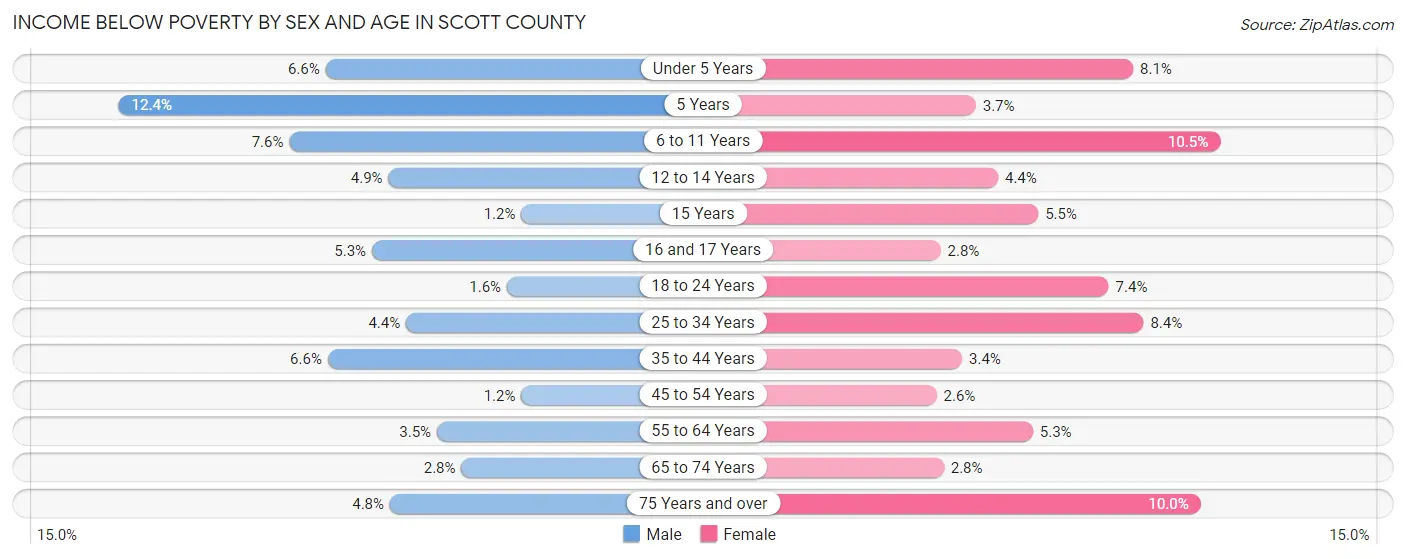
| Age Bracket | Male | Female |
| Under 5 Years | 314 (6.6%) | 376 (8.1%) |
| 5 Years | 114 (12.4%) | 37 (3.7%) |
| 6 to 11 Years | 558 (7.6%) | 733 (10.5%) |
| 12 to 14 Years | 157 (4.9%) | 152 (4.3%) |
| 15 Years | 14 (1.2%) | 74 (5.5%) |
| 16 and 17 Years | 120 (5.3%) | 70 (2.8%) |
| 18 to 24 Years | 103 (1.6%) | 452 (7.4%) |
| 25 to 34 Years | 382 (4.4%) | 724 (8.4%) |
| 35 to 44 Years | 748 (6.6%) | 365 (3.4%) |
| 45 to 54 Years | 129 (1.2%) | 279 (2.6%) |
| 55 to 64 Years | 334 (3.5%) | 491 (5.3%) |
| 65 to 74 Years | 154 (2.8%) | 160 (2.8%) |
| 75 Years and over | 132 (4.8%) | 345 (10.0%) |
| Total | 3,259 (4.3%) | 4,258 (5.7%) |
Income Above Poverty by Sex and Age in Scott County
According to the poverty statistics in Scott County, males aged 15 years and females aged 45 to 54 years are the age groups that are most secure financially, with 98.8% of males and 97.4% of females in these age groups living above the poverty line.
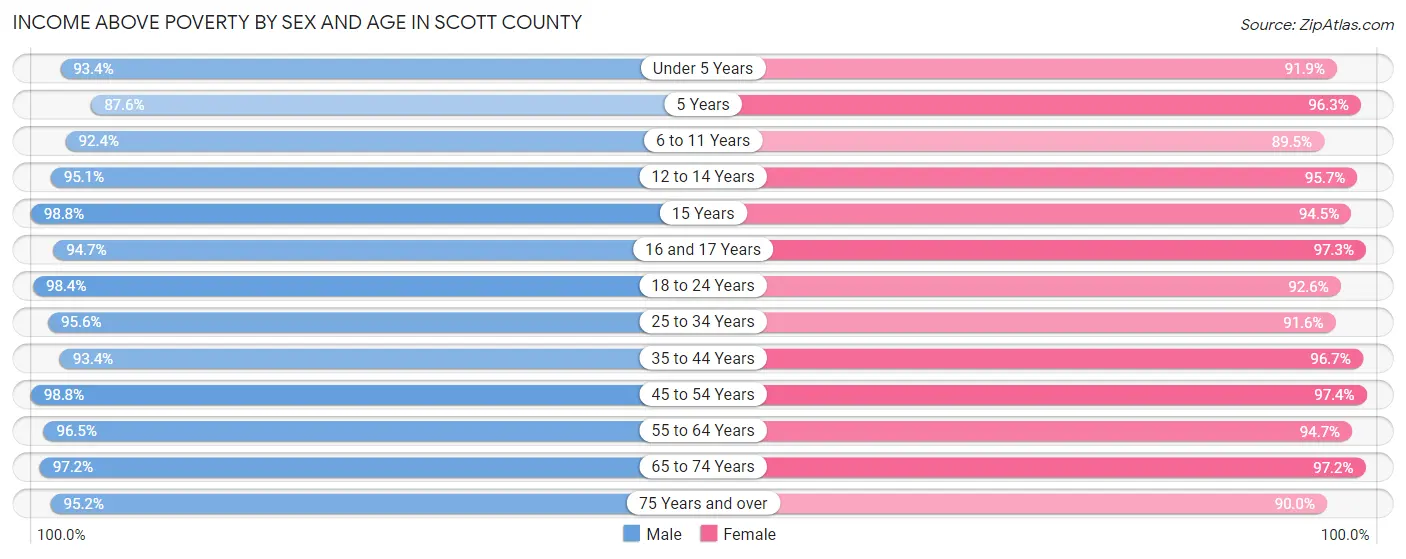
| Age Bracket | Male | Female |
| Under 5 Years | 4,428 (93.4%) | 4,258 (91.9%) |
| 5 Years | 807 (87.6%) | 954 (96.3%) |
| 6 to 11 Years | 6,752 (92.4%) | 6,225 (89.5%) |
| 12 to 14 Years | 3,066 (95.1%) | 3,339 (95.7%) |
| 15 Years | 1,187 (98.8%) | 1,278 (94.5%) |
| 16 and 17 Years | 2,132 (94.7%) | 2,473 (97.3%) |
| 18 to 24 Years | 6,447 (98.4%) | 5,634 (92.6%) |
| 25 to 34 Years | 8,334 (95.6%) | 7,894 (91.6%) |
| 35 to 44 Years | 10,650 (93.4%) | 10,543 (96.7%) |
| 45 to 54 Years | 10,851 (98.8%) | 10,288 (97.4%) |
| 55 to 64 Years | 9,164 (96.5%) | 8,732 (94.7%) |
| 65 to 74 Years | 5,278 (97.2%) | 5,477 (97.2%) |
| 75 Years and over | 2,603 (95.2%) | 3,110 (90.0%) |
| Total | 71,699 (95.7%) | 70,205 (94.3%) |
Income Below Poverty Among Married-Couple Families in Scott County
The poverty statistics for married-couple families in Scott County show that 1.8% or 586 of the total 32,456 families live below the poverty line. Families with 5 or more children have the highest poverty rate of 48.6%, comprising of 154 families. On the other hand, families with 1 or 2 children have the lowest poverty rate of 1.1%, which includes 143 families.
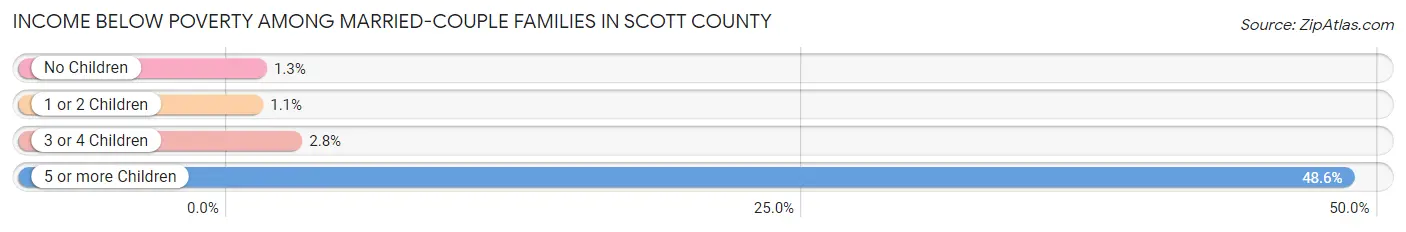
| Children | Above Poverty | Below Poverty |
| No Children | 15,799 (98.7%) | 202 (1.3%) |
| 1 or 2 Children | 12,891 (98.9%) | 143 (1.1%) |
| 3 or 4 Children | 3,017 (97.2%) | 87 (2.8%) |
| 5 or more Children | 163 (51.4%) | 154 (48.6%) |
| Total | 31,870 (98.2%) | 586 (1.8%) |
Income Below Poverty Among Single-Parent Households in Scott County
According to the poverty data in Scott County, 9.7% or 298 single-father households and 9.1% or 477 single-mother households are living below the poverty line. Among single-father households, those with 3 or 4 children have the highest poverty rate, with 150 households (66.1%) experiencing poverty. Likewise, among single-mother households, those with 5 or more children have the highest poverty rate, with 72 households (100.0%) falling below the poverty line.
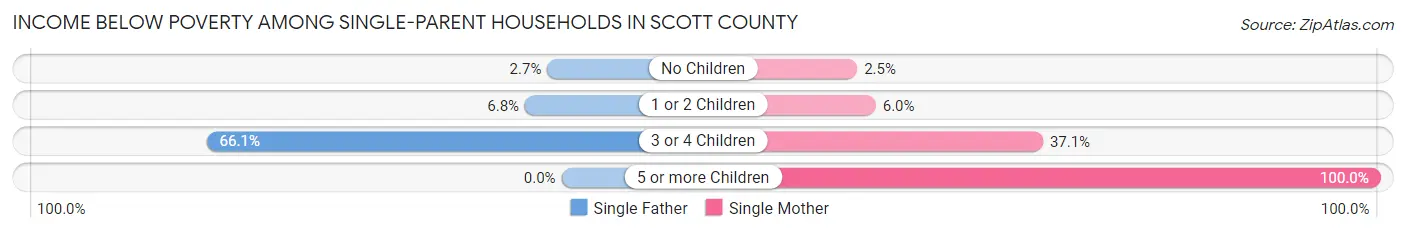
| Children | Single Father | Single Mother |
| No Children | 29 (2.6%) | 47 (2.5%) |
| 1 or 2 Children | 119 (6.8%) | 165 (6.0%) |
| 3 or 4 Children | 150 (66.1%) | 193 (37.1%) |
| 5 or more Children | 0 (0.0%) | 72 (100.0%) |
| Total | 298 (9.7%) | 477 (9.1%) |
Income Below Poverty Among Married-Couple vs Single-Parent Households in Scott County
The poverty data for Scott County shows that 586 of the married-couple family households (1.8%) and 775 of the single-parent households (9.3%) are living below the poverty level. Within the married-couple family households, those with 5 or more children have the highest poverty rate, with 154 households (48.6%) falling below the poverty line. Among the single-parent households, those with 5 or more children have the highest poverty rate, with 72 household (78.3%) living below poverty.
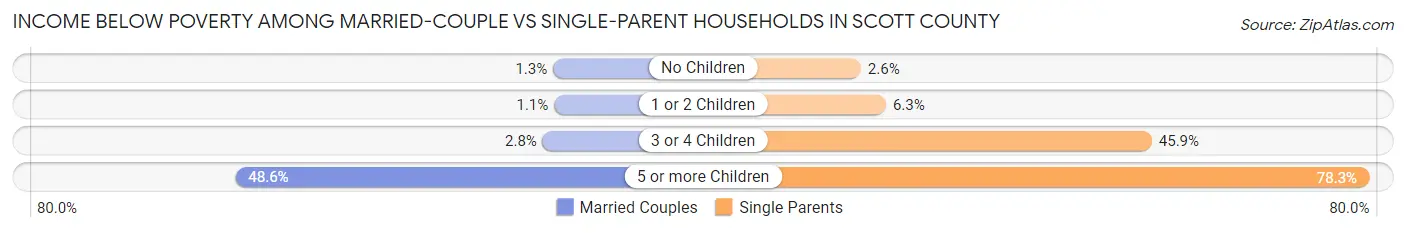
| Children | Married-Couple Families | Single-Parent Households |
| No Children | 202 (1.3%) | 76 (2.6%) |
| 1 or 2 Children | 143 (1.1%) | 284 (6.3%) |
| 3 or 4 Children | 87 (2.8%) | 343 (45.9%) |
| 5 or more Children | 154 (48.6%) | 72 (78.3%) |
| Total | 586 (1.8%) | 775 (9.3%) |
Employment Characteristics in Scott County
Employment by Class of Employer in Scott County
Among the 83,336 employed individuals in Scott County, private company employees (60,781 | 72.9%), not-for-profit organizations (7,139 | 8.6%), and local government employees (5,227 | 6.3%) make up the most common classes of employment.
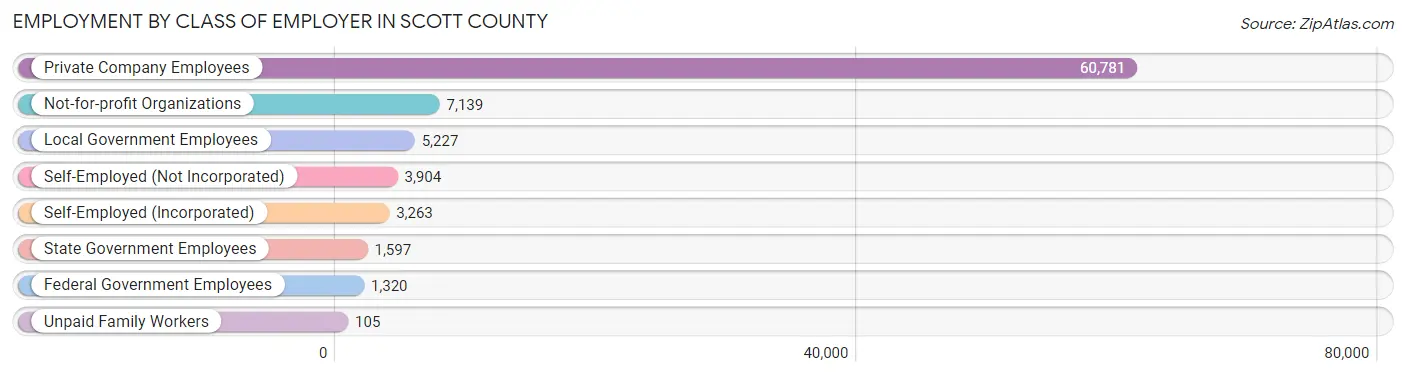
| Employer Class | # Employees | % Employees |
| Private Company Employees | 60,781 | 72.9% |
| Self-Employed (Incorporated) | 3,263 | 3.9% |
| Self-Employed (Not Incorporated) | 3,904 | 4.7% |
| Not-for-profit Organizations | 7,139 | 8.6% |
| Local Government Employees | 5,227 | 6.3% |
| State Government Employees | 1,597 | 1.9% |
| Federal Government Employees | 1,320 | 1.6% |
| Unpaid Family Workers | 105 | 0.1% |
| Total | 83,336 | 100.0% |
Employment Status by Age in Scott County
According to the labor force statistics for Scott County, out of the total population over 16 years of age (115,995), 75.4% or 87,460 individuals are in the labor force, with 3.2% or 2,799 of them unemployed. The age group with the highest labor force participation rate is 45 to 54 years, with 91.5% or 19,795 individuals in the labor force. Within the labor force, the 16 to 19 years age range has the highest percentage of unemployed individuals, with 6.2% or 286 of them being unemployed.
| Age Bracket | In Labor Force | Unemployed |
| 16 to 19 Years | 4,614 (52.2%) | 286 (6.2%) |
| 20 to 24 Years | 7,772 (89.9%) | 459 (5.9%) |
| 25 to 29 Years | 7,127 (87.6%) | 392 (5.5%) |
| 30 to 34 Years | 8,524 (89.6%) | 307 (3.6%) |
| 35 to 44 Years | 20,343 (90.5%) | 468 (2.3%) |
| 45 to 54 Years | 19,795 (91.5%) | 515 (2.6%) |
| 55 to 59 Years | 9,061 (86.8%) | 145 (1.6%) |
| 60 to 64 Years | 6,132 (73.1%) | 184 (3.0%) |
| 65 to 74 Years | 3,551 (31.9%) | 32 (0.9%) |
| 75 Years and over | 516 (7.6%) | 2 (0.4%) |
| Total | 87,460 (75.4%) | 2,799 (3.2%) |
Employment Status by Educational Attainment in Scott County
According to labor force statistics for Scott County, 88.1% of individuals (71,000) out of the total population between 25 and 64 years of age (80,590) are in the labor force, with 2.8% or 1,988 of them being unemployed. The group with the highest labor force participation rate are those with the educational attainment of bachelor's degree or higher, with 92.9% or 34,143 individuals in the labor force. Within the labor force, individuals with less than high school education have the highest percentage of unemployment, with 6.6% or 180 of them being unemployed.
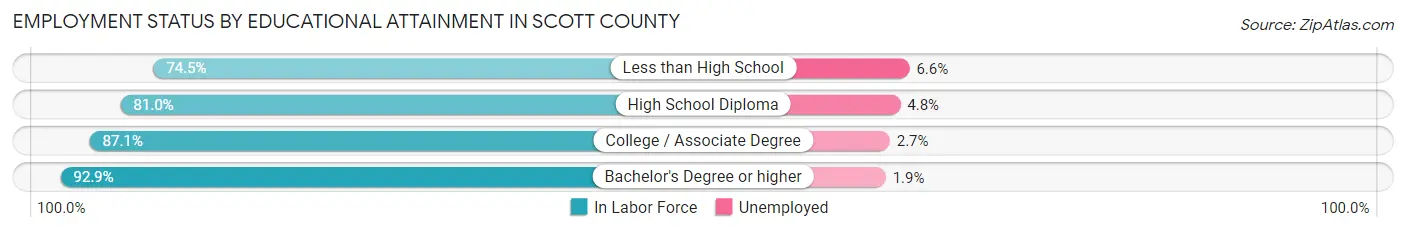
| Educational Attainment | In Labor Force | Unemployed |
| Less than High School | 2,729 (74.5%) | 242 (6.6%) |
| High School Diploma | 11,564 (81.0%) | 685 (4.8%) |
| College / Associate Degree | 22,558 (87.1%) | 699 (2.7%) |
| Bachelor's Degree or higher | 34,143 (92.9%) | 698 (1.9%) |
| Total | 71,000 (88.1%) | 2,257 (2.8%) |
Employment Occupations by Sex in Scott County
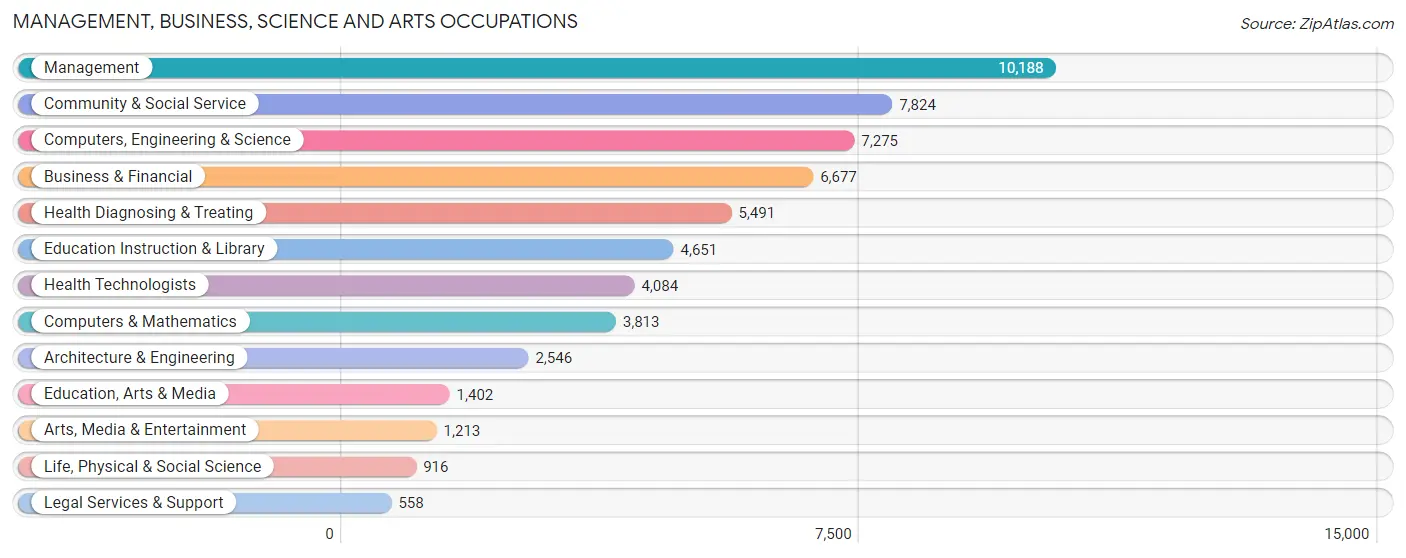
Management, Business, Science and Arts Occupations
The most common Management, Business, Science and Arts occupations in Scott County are Management (10,188 | 12.1%), Community & Social Service (7,824 | 9.3%), Computers, Engineering & Science (7,275 | 8.6%), Business & Financial (6,677 | 7.9%), and Health Diagnosing & Treating (5,491 | 6.5%).
Management, Business, Science and Arts Occupations by Sex
Within the Management, Business, Science and Arts occupations in Scott County, the most male-oriented occupations are Architecture & Engineering (83.9%), Computers & Mathematics (71.2%), and Computers, Engineering & Science (70.5%), while the most female-oriented occupations are Health Technologists (84.1%), Legal Services & Support (84.1%), and Health Diagnosing & Treating (81.8%).
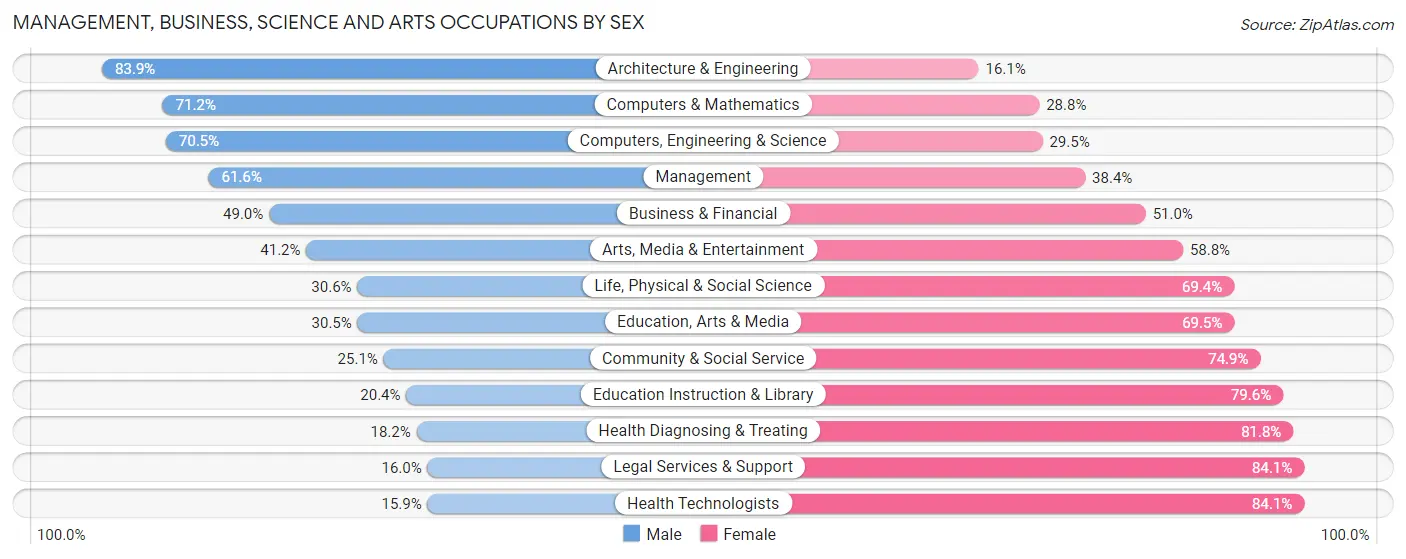
| Occupation | Male | Female |
| Management | 6,278 (61.6%) | 3,910 (38.4%) |
| Business & Financial | 3,271 (49.0%) | 3,406 (51.0%) |
| Computers, Engineering & Science | 5,130 (70.5%) | 2,145 (29.5%) |
| Computers & Mathematics | 2,715 (71.2%) | 1,098 (28.8%) |
| Architecture & Engineering | 2,135 (83.9%) | 411 (16.1%) |
| Life, Physical & Social Science | 280 (30.6%) | 636 (69.4%) |
| Community & Social Service | 1,964 (25.1%) | 5,860 (74.9%) |
| Education, Arts & Media | 428 (30.5%) | 974 (69.5%) |
| Legal Services & Support | 89 (16.0%) | 469 (84.1%) |
| Education Instruction & Library | 947 (20.4%) | 3,704 (79.6%) |
| Arts, Media & Entertainment | 500 (41.2%) | 713 (58.8%) |
| Health Diagnosing & Treating | 1,001 (18.2%) | 4,490 (81.8%) |
| Health Technologists | 651 (15.9%) | 3,433 (84.1%) |
| Total (Category) | 17,644 (47.1%) | 19,811 (52.9%) |
| Total (Overall) | 44,749 (53.0%) | 39,754 (47.0%) |
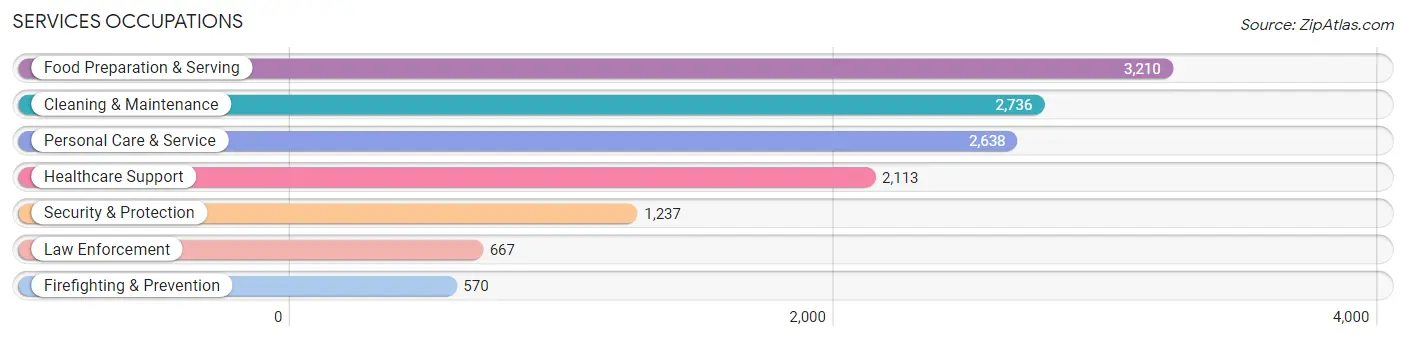
Services Occupations
The most common Services occupations in Scott County are Food Preparation & Serving (3,210 | 3.8%), Cleaning & Maintenance (2,736 | 3.2%), Personal Care & Service (2,638 | 3.1%), Healthcare Support (2,113 | 2.5%), and Security & Protection (1,237 | 1.5%).
Services Occupations by Sex
Within the Services occupations in Scott County, the most male-oriented occupations are Law Enforcement (78.9%), Security & Protection (77.9%), and Firefighting & Prevention (76.8%), while the most female-oriented occupations are Healthcare Support (82.7%), Personal Care & Service (77.1%), and Food Preparation & Serving (61.5%).
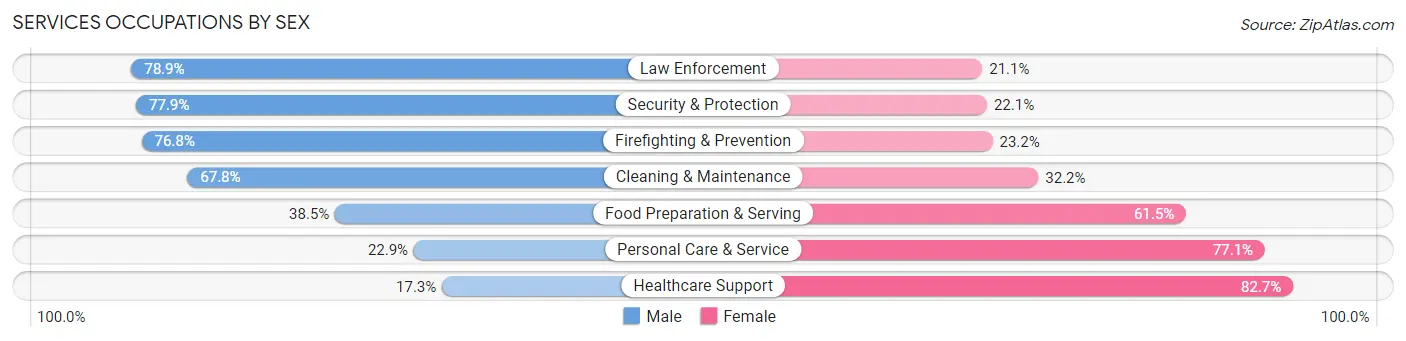
| Occupation | Male | Female |
| Healthcare Support | 366 (17.3%) | 1,747 (82.7%) |
| Security & Protection | 964 (77.9%) | 273 (22.1%) |
| Firefighting & Prevention | 438 (76.8%) | 132 (23.2%) |
| Law Enforcement | 526 (78.9%) | 141 (21.1%) |
| Food Preparation & Serving | 1,236 (38.5%) | 1,974 (61.5%) |
| Cleaning & Maintenance | 1,854 (67.8%) | 882 (32.2%) |
| Personal Care & Service | 604 (22.9%) | 2,034 (77.1%) |
| Total (Category) | 5,024 (42.1%) | 6,910 (57.9%) |
| Total (Overall) | 44,749 (53.0%) | 39,754 (47.0%) |
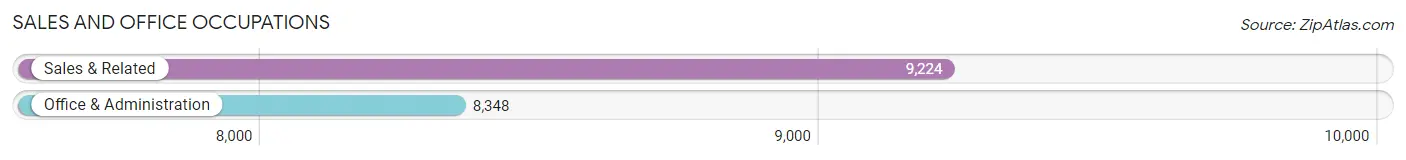
Sales and Office Occupations
The most common Sales and Office occupations in Scott County are Sales & Related (9,224 | 10.9%), and Office & Administration (8,348 | 9.9%).
Sales and Office Occupations by Sex
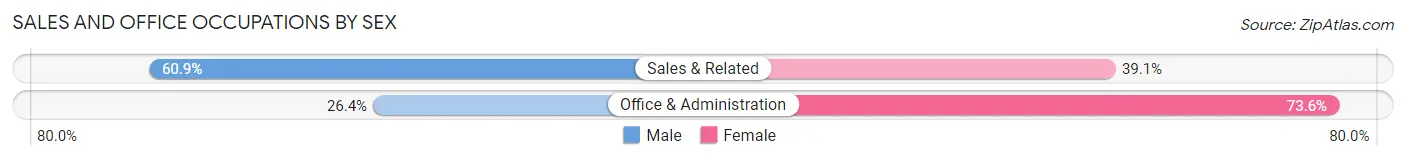
| Occupation | Male | Female |
| Sales & Related | 5,614 (60.9%) | 3,610 (39.1%) |
| Office & Administration | 2,205 (26.4%) | 6,143 (73.6%) |
| Total (Category) | 7,819 (44.5%) | 9,753 (55.5%) |
| Total (Overall) | 44,749 (53.0%) | 39,754 (47.0%) |
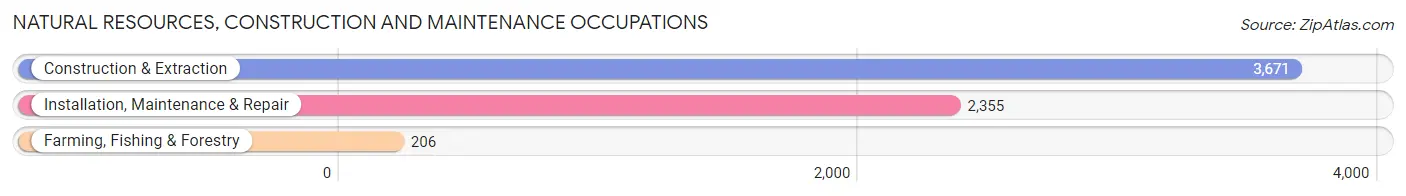
Natural Resources, Construction and Maintenance Occupations
The most common Natural Resources, Construction and Maintenance occupations in Scott County are Construction & Extraction (3,671 | 4.3%), Installation, Maintenance & Repair (2,355 | 2.8%), and Farming, Fishing & Forestry (206 | 0.2%).
Natural Resources, Construction and Maintenance Occupations by Sex
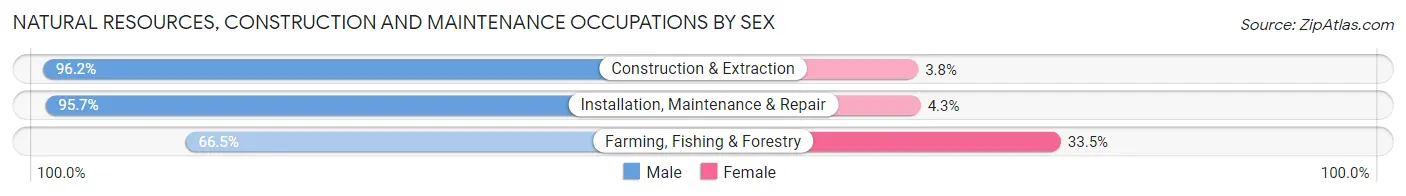
| Occupation | Male | Female |
| Farming, Fishing & Forestry | 137 (66.5%) | 69 (33.5%) |
| Construction & Extraction | 3,531 (96.2%) | 140 (3.8%) |
| Installation, Maintenance & Repair | 2,253 (95.7%) | 102 (4.3%) |
| Total (Category) | 5,921 (95.0%) | 311 (5.0%) |
| Total (Overall) | 44,749 (53.0%) | 39,754 (47.0%) |
Production, Transportation and Moving Occupations
The most common Production, Transportation and Moving occupations in Scott County are Production (5,452 | 6.5%), Transportation (3,272 | 3.9%), and Material Moving (2,586 | 3.1%).
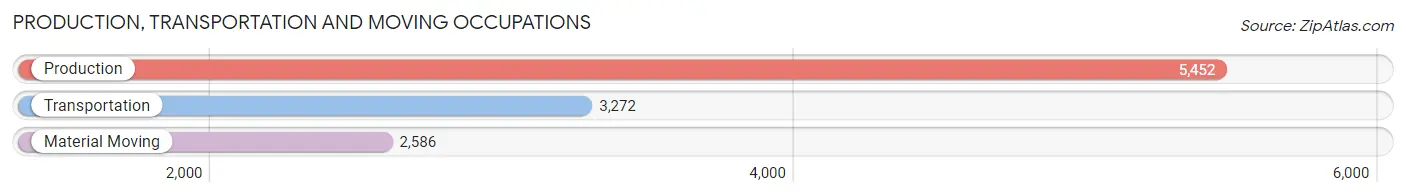
Production, Transportation and Moving Occupations by Sex
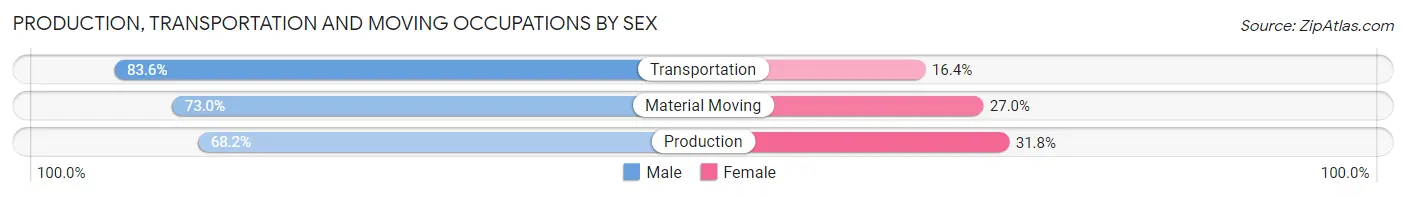
| Occupation | Male | Female |
| Production | 3,719 (68.2%) | 1,733 (31.8%) |
| Transportation | 2,735 (83.6%) | 537 (16.4%) |
| Material Moving | 1,887 (73.0%) | 699 (27.0%) |
| Total (Category) | 8,341 (73.8%) | 2,969 (26.3%) |
| Total (Overall) | 44,749 (53.0%) | 39,754 (47.0%) |
Employment Industries by Sex in Scott County
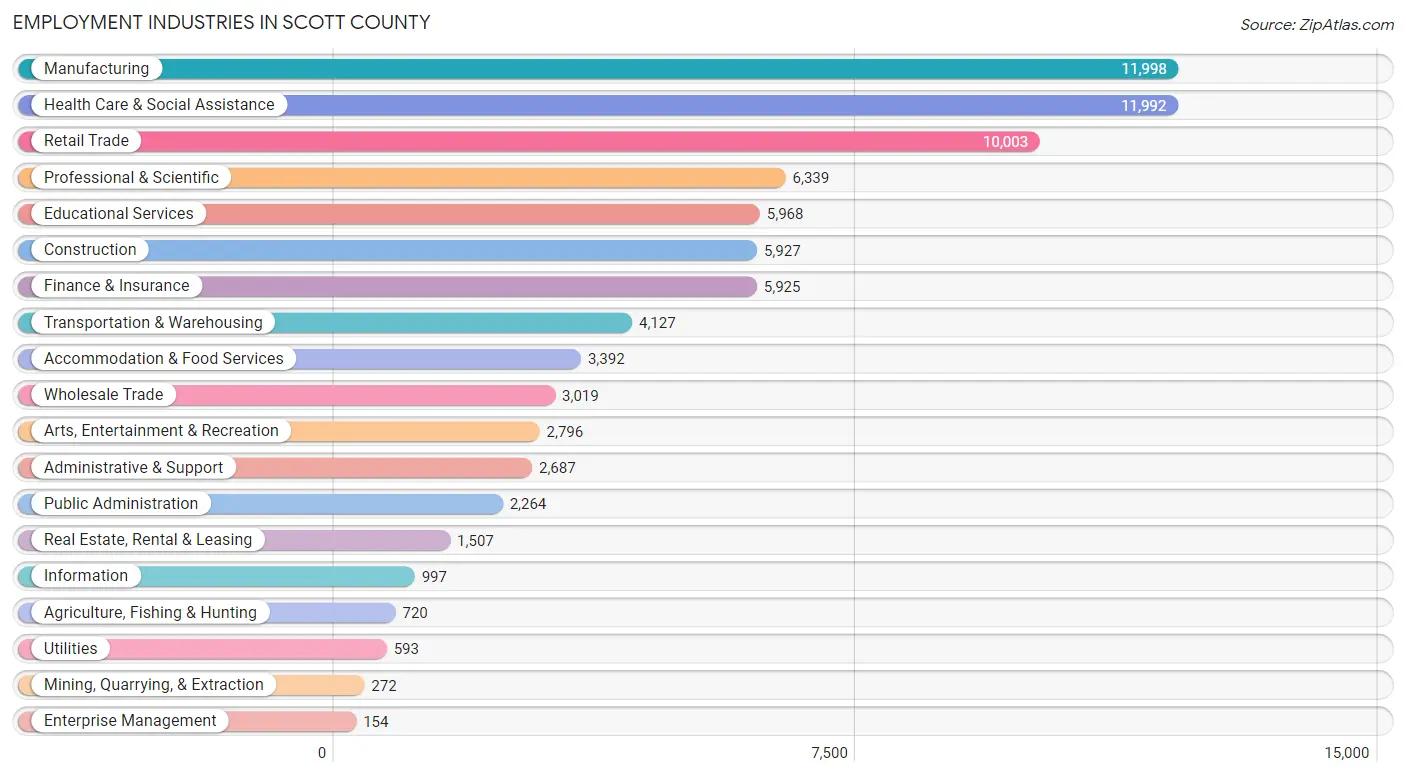
Employment Industries in Scott County
The major employment industries in Scott County include Manufacturing (11,998 | 14.2%), Health Care & Social Assistance (11,992 | 14.2%), Retail Trade (10,003 | 11.8%), Professional & Scientific (6,339 | 7.5%), and Educational Services (5,968 | 7.1%).
Employment Industries by Sex in Scott County
The Scott County industries that see more men than women are Agriculture, Fishing & Hunting (87.2%), Construction (84.0%), and Utilities (80.3%), whereas the industries that tend to have a higher number of women are Health Care & Social Assistance (81.1%), Educational Services (74.5%), and Accommodation & Food Services (56.1%).
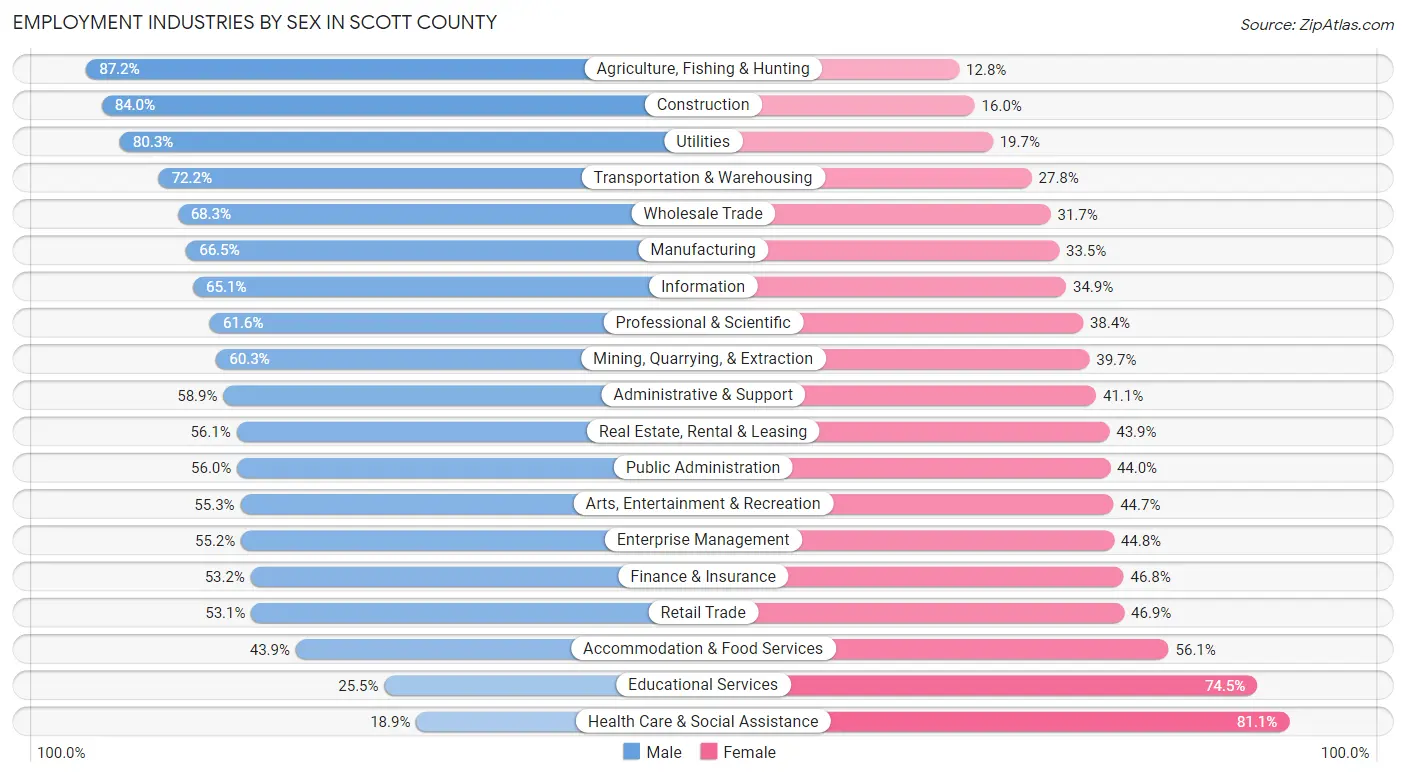
| Industry | Male | Female |
| Agriculture, Fishing & Hunting | 628 (87.2%) | 92 (12.8%) |
| Mining, Quarrying, & Extraction | 164 (60.3%) | 108 (39.7%) |
| Construction | 4,979 (84.0%) | 948 (16.0%) |
| Manufacturing | 7,982 (66.5%) | 4,016 (33.5%) |
| Wholesale Trade | 2,062 (68.3%) | 957 (31.7%) |
| Retail Trade | 5,310 (53.1%) | 4,693 (46.9%) |
| Transportation & Warehousing | 2,981 (72.2%) | 1,146 (27.8%) |
| Utilities | 476 (80.3%) | 117 (19.7%) |
| Information | 649 (65.1%) | 348 (34.9%) |
| Finance & Insurance | 3,152 (53.2%) | 2,773 (46.8%) |
| Real Estate, Rental & Leasing | 846 (56.1%) | 661 (43.9%) |
| Professional & Scientific | 3,905 (61.6%) | 2,434 (38.4%) |
| Enterprise Management | 85 (55.2%) | 69 (44.8%) |
| Administrative & Support | 1,582 (58.9%) | 1,105 (41.1%) |
| Educational Services | 1,524 (25.5%) | 4,444 (74.5%) |
| Health Care & Social Assistance | 2,271 (18.9%) | 9,721 (81.1%) |
| Arts, Entertainment & Recreation | 1,547 (55.3%) | 1,249 (44.7%) |
| Accommodation & Food Services | 1,488 (43.9%) | 1,904 (56.1%) |
| Public Administration | 1,268 (56.0%) | 996 (44.0%) |
| Total | 44,749 (53.0%) | 39,754 (47.0%) |
Education in Scott County
School Enrollment in Scott County
The most common levels of schooling among the 40,464 students in Scott County are high school (10,231 | 25.3%), elementary school (9,634 | 23.8%), and middle school (8,810 | 21.8%).
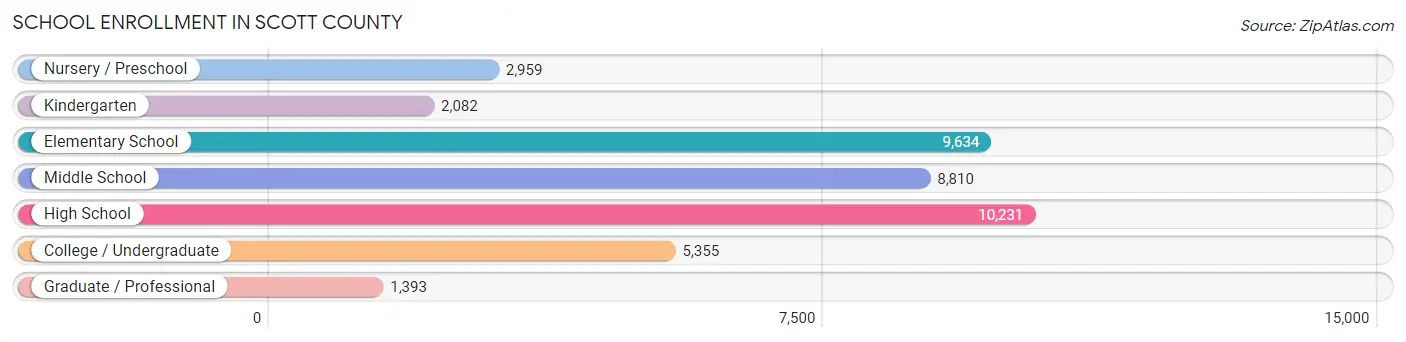
| School Level | # Students | % Students |
| Nursery / Preschool | 2,959 | 7.3% |
| Kindergarten | 2,082 | 5.1% |
| Elementary School | 9,634 | 23.8% |
| Middle School | 8,810 | 21.8% |
| High School | 10,231 | 25.3% |
| College / Undergraduate | 5,355 | 13.2% |
| Graduate / Professional | 1,393 | 3.4% |
| Total | 40,464 | 100.0% |
School Enrollment by Age by Funding Source in Scott County
Out of a total of 40,464 students who are enrolled in schools in Scott County, 5,908 (14.6%) attend a private institution, while the remaining 34,556 (85.4%) are enrolled in public schools. The age group of 3 to 4 year olds has the highest likelihood of being enrolled in private schools, with 767 (38.8% in the age bracket) enrolled. Conversely, the age group of 15 to 17 year olds has the lowest likelihood of being enrolled in a private school, with 6,929 (94.9% in the age bracket) attending a public institution.
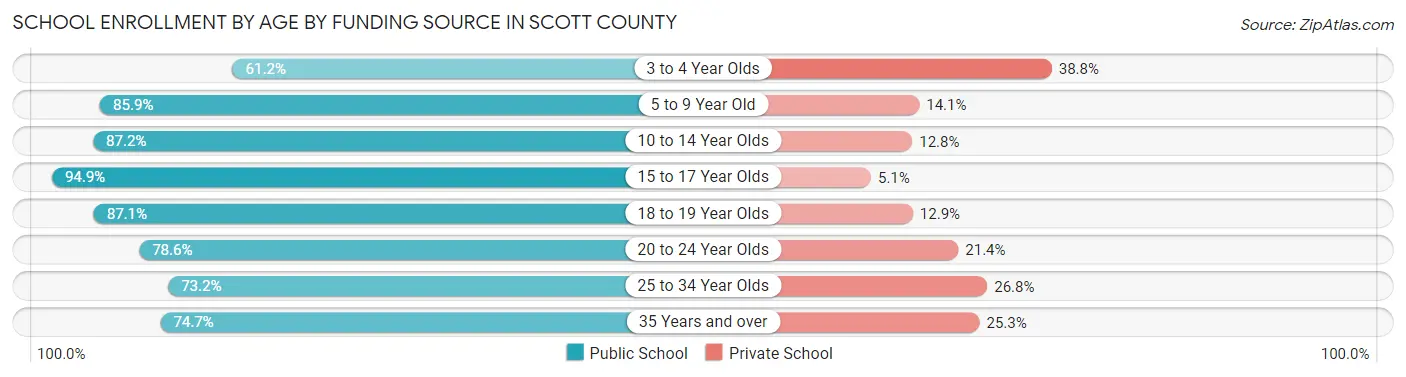
| Age Bracket | Public School | Private School |
| 3 to 4 Year Olds | 1,212 (61.2%) | 767 (38.8%) |
| 5 to 9 Year Old | 9,439 (85.9%) | 1,547 (14.1%) |
| 10 to 14 Year Olds | 9,902 (87.2%) | 1,451 (12.8%) |
| 15 to 17 Year Olds | 6,929 (94.9%) | 372 (5.1%) |
| 18 to 19 Year Olds | 2,653 (87.1%) | 393 (12.9%) |
| 20 to 24 Year Olds | 2,294 (78.6%) | 623 (21.4%) |
| 25 to 34 Year Olds | 1,092 (73.2%) | 399 (26.8%) |
| 35 Years and over | 1,039 (74.7%) | 352 (25.3%) |
| Total | 34,556 (85.4%) | 5,908 (14.6%) |
Educational Attainment by Field of Study in Scott County
Business (11,298 | 24.6%), education (5,420 | 11.8%), science & technology (5,011 | 10.9%), engineering (3,491 | 7.6%), and social sciences (3,275 | 7.1%) are the most common fields of study among 45,870 individuals in Scott County who have obtained a bachelor's degree or higher.
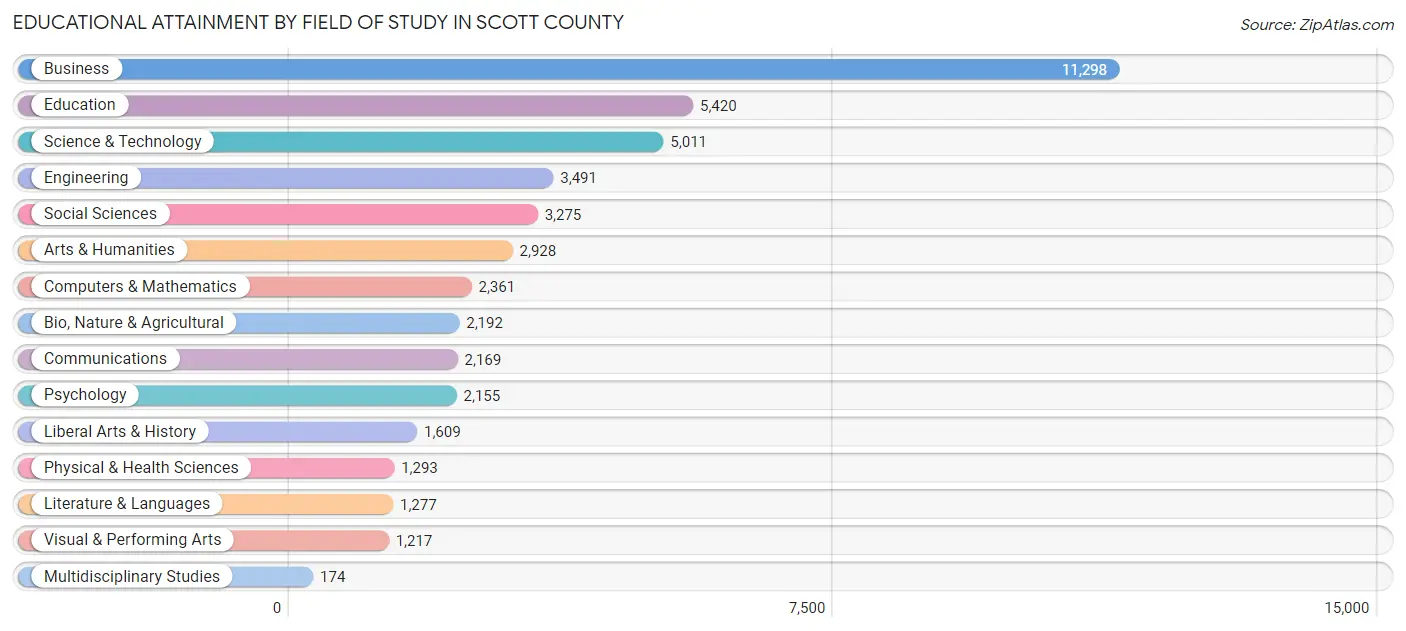
| Field of Study | # Graduates | % Graduates |
| Computers & Mathematics | 2,361 | 5.1% |
| Bio, Nature & Agricultural | 2,192 | 4.8% |
| Physical & Health Sciences | 1,293 | 2.8% |
| Psychology | 2,155 | 4.7% |
| Social Sciences | 3,275 | 7.1% |
| Engineering | 3,491 | 7.6% |
| Multidisciplinary Studies | 174 | 0.4% |
| Science & Technology | 5,011 | 10.9% |
| Business | 11,298 | 24.6% |
| Education | 5,420 | 11.8% |
| Literature & Languages | 1,277 | 2.8% |
| Liberal Arts & History | 1,609 | 3.5% |
| Visual & Performing Arts | 1,217 | 2.6% |
| Communications | 2,169 | 4.7% |
| Arts & Humanities | 2,928 | 6.4% |
| Total | 45,870 | 100.0% |
Transportation & Commute in Scott County
Vehicle Availability by Sex in Scott County
The most prevalent vehicle ownership categories in Scott County are males with 2 vehicles (20,470, accounting for 46.4%) and females with 2 vehicles (16,963, making up 52.3%).
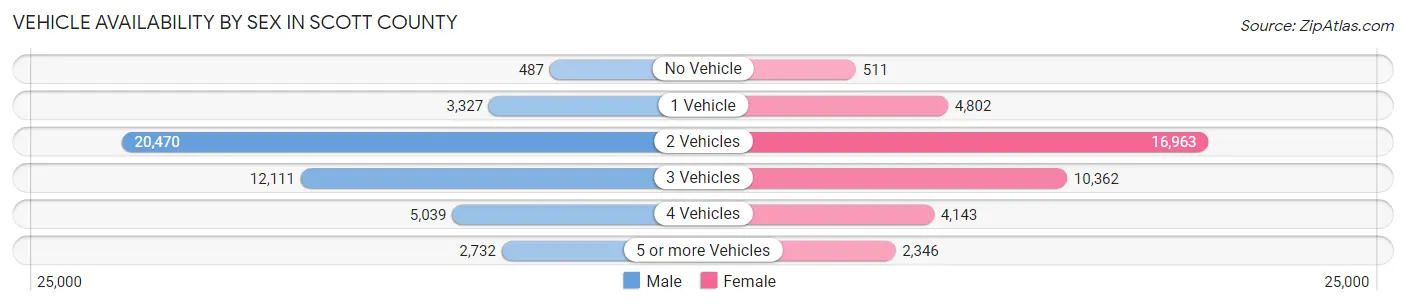
| Vehicles Available | Male | Female |
| No Vehicle | 487 (1.1%) | 511 (1.3%) |
| 1 Vehicle | 3,327 (7.5%) | 4,802 (12.3%) |
| 2 Vehicles | 20,470 (46.4%) | 16,963 (43.3%) |
| 3 Vehicles | 12,111 (27.4%) | 10,362 (26.5%) |
| 4 Vehicles | 5,039 (11.4%) | 4,143 (10.6%) |
| 5 or more Vehicles | 2,732 (6.2%) | 2,346 (6.0%) |
| Total | 44,166 (100.0%) | 39,127 (100.0%) |
Commute Time in Scott County
The most frequently occuring commute durations in Scott County are 30 to 34 minutes (12,110 commuters, 17.3%), 20 to 24 minutes (9,318 commuters, 13.3%), and 15 to 19 minutes (9,255 commuters, 13.2%).
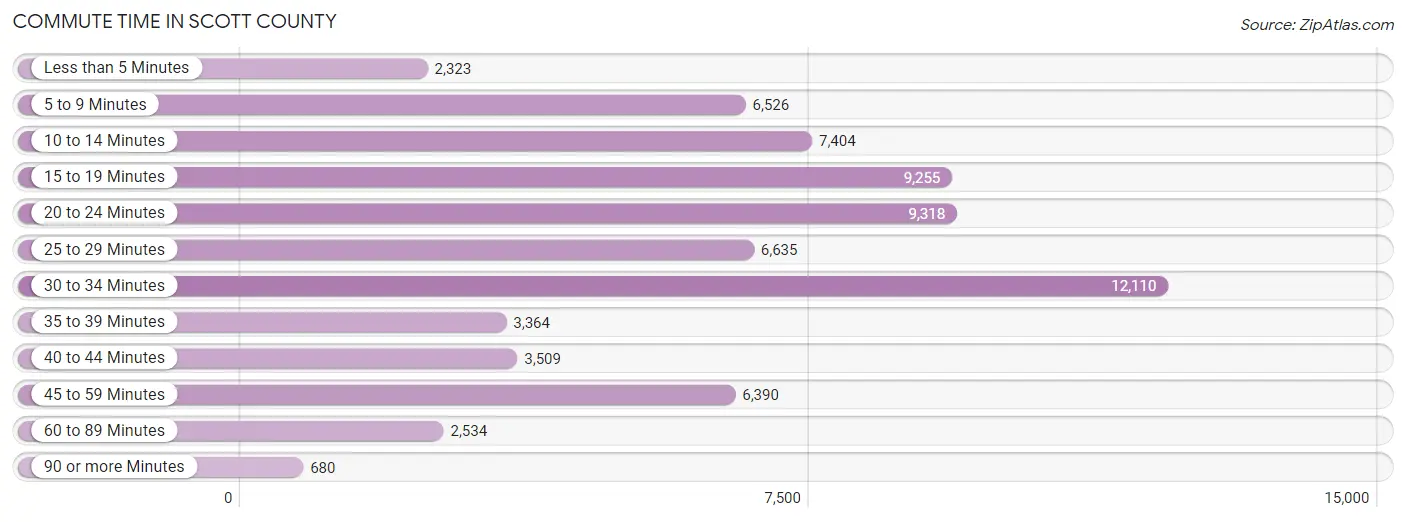
| Commute Time | # Commuters | % Commuters |
| Less than 5 Minutes | 2,323 | 3.3% |
| 5 to 9 Minutes | 6,526 | 9.3% |
| 10 to 14 Minutes | 7,404 | 10.6% |
| 15 to 19 Minutes | 9,255 | 13.2% |
| 20 to 24 Minutes | 9,318 | 13.3% |
| 25 to 29 Minutes | 6,635 | 9.5% |
| 30 to 34 Minutes | 12,110 | 17.3% |
| 35 to 39 Minutes | 3,364 | 4.8% |
| 40 to 44 Minutes | 3,509 | 5.0% |
| 45 to 59 Minutes | 6,390 | 9.1% |
| 60 to 89 Minutes | 2,534 | 3.6% |
| 90 or more Minutes | 680 | 1.0% |
Commute Time by Sex in Scott County
The most common commute times in Scott County are 30 to 34 minutes (6,697 commuters, 17.8%) for males and 30 to 34 minutes (5,413 commuters, 16.6%) for females.
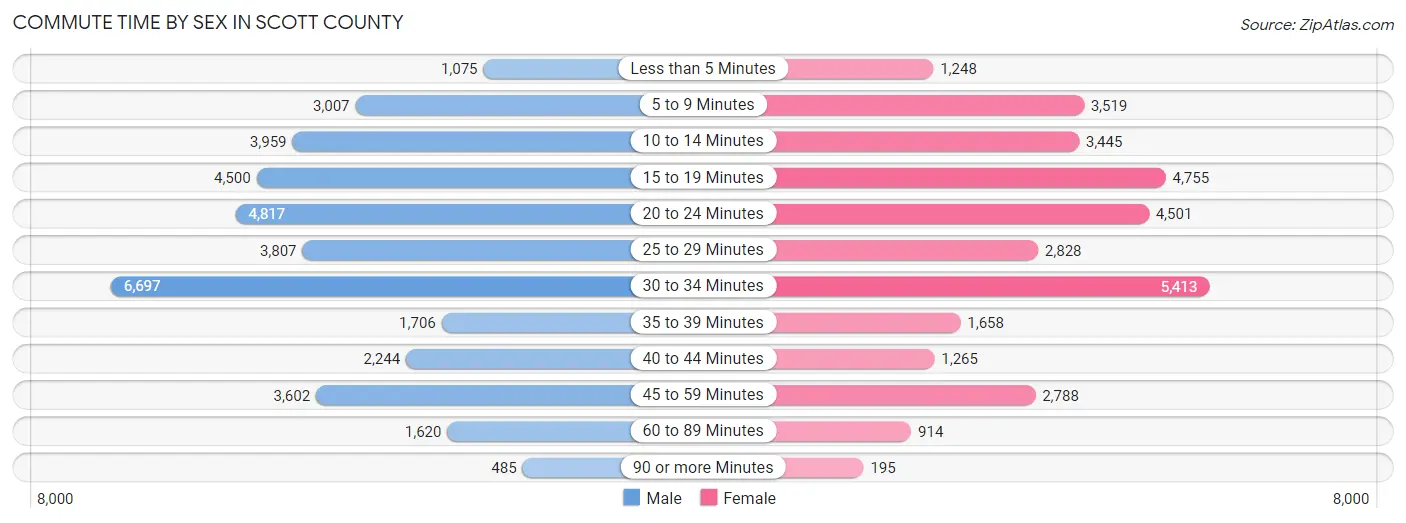
| Commute Time | Male | Female |
| Less than 5 Minutes | 1,075 (2.9%) | 1,248 (3.8%) |
| 5 to 9 Minutes | 3,007 (8.0%) | 3,519 (10.8%) |
| 10 to 14 Minutes | 3,959 (10.5%) | 3,445 (10.6%) |
| 15 to 19 Minutes | 4,500 (12.0%) | 4,755 (14.6%) |
| 20 to 24 Minutes | 4,817 (12.8%) | 4,501 (13.8%) |
| 25 to 29 Minutes | 3,807 (10.2%) | 2,828 (8.7%) |
| 30 to 34 Minutes | 6,697 (17.8%) | 5,413 (16.6%) |
| 35 to 39 Minutes | 1,706 (4.5%) | 1,658 (5.1%) |
| 40 to 44 Minutes | 2,244 (6.0%) | 1,265 (3.9%) |
| 45 to 59 Minutes | 3,602 (9.6%) | 2,788 (8.6%) |
| 60 to 89 Minutes | 1,620 (4.3%) | 914 (2.8%) |
| 90 or more Minutes | 485 (1.3%) | 195 (0.6%) |
Time of Departure to Work by Sex in Scott County
The most frequent times of departure to work in Scott County are 7:00 AM to 7:29 AM (5,969, 15.9%) for males and 7:00 AM to 7:29 AM (5,002, 15.4%) for females.
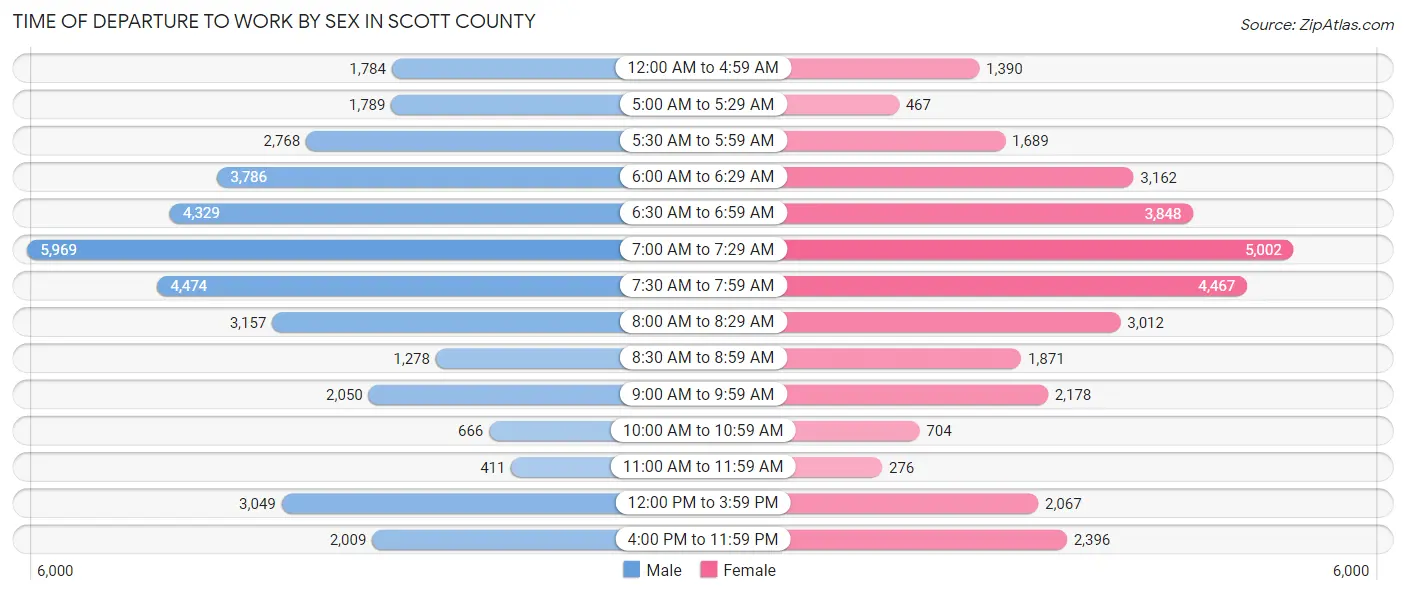
| Time of Departure | Male | Female |
| 12:00 AM to 4:59 AM | 1,784 (4.8%) | 1,390 (4.3%) |
| 5:00 AM to 5:29 AM | 1,789 (4.8%) | 467 (1.4%) |
| 5:30 AM to 5:59 AM | 2,768 (7.4%) | 1,689 (5.2%) |
| 6:00 AM to 6:29 AM | 3,786 (10.1%) | 3,162 (9.7%) |
| 6:30 AM to 6:59 AM | 4,329 (11.5%) | 3,848 (11.8%) |
| 7:00 AM to 7:29 AM | 5,969 (15.9%) | 5,002 (15.4%) |
| 7:30 AM to 7:59 AM | 4,474 (11.9%) | 4,467 (13.7%) |
| 8:00 AM to 8:29 AM | 3,157 (8.4%) | 3,012 (9.3%) |
| 8:30 AM to 8:59 AM | 1,278 (3.4%) | 1,871 (5.8%) |
| 9:00 AM to 9:59 AM | 2,050 (5.5%) | 2,178 (6.7%) |
| 10:00 AM to 10:59 AM | 666 (1.8%) | 704 (2.2%) |
| 11:00 AM to 11:59 AM | 411 (1.1%) | 276 (0.9%) |
| 12:00 PM to 3:59 PM | 3,049 (8.1%) | 2,067 (6.4%) |
| 4:00 PM to 11:59 PM | 2,009 (5.3%) | 2,396 (7.4%) |
| Total | 37,519 (100.0%) | 32,529 (100.0%) |
Housing Occupancy in Scott County
Occupancy by Ownership in Scott County
Of the total 53,014 dwellings in Scott County, owner-occupied units account for 44,244 (83.5%), while renter-occupied units make up 8,770 (16.5%).
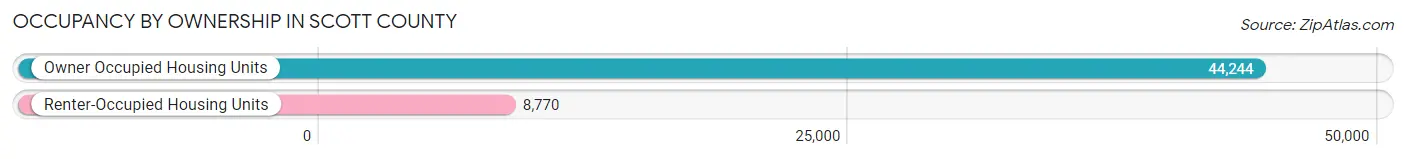
| Occupancy | # Housing Units | % Housing Units |
| Owner Occupied Housing Units | 44,244 | 83.5% |
| Renter-Occupied Housing Units | 8,770 | 16.5% |
| Total Occupied Housing Units | 53,014 | 100.0% |
Occupancy by Household Size in Scott County
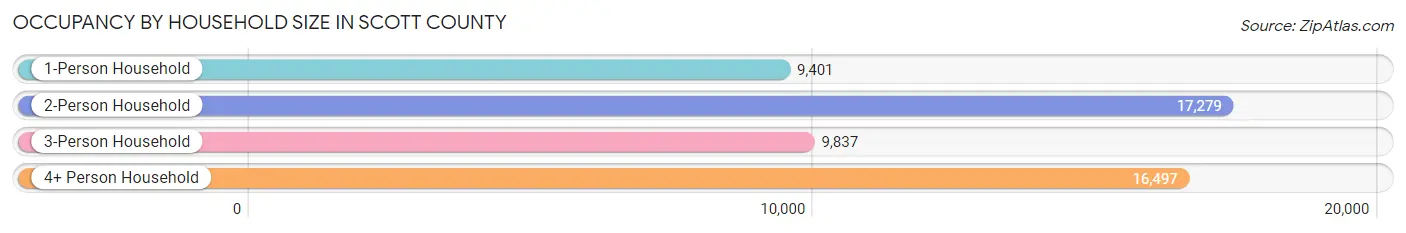
| Household Size | # Housing Units | % Housing Units |
| 1-Person Household | 9,401 | 17.7% |
| 2-Person Household | 17,279 | 32.6% |
| 3-Person Household | 9,837 | 18.6% |
| 4+ Person Household | 16,497 | 31.1% |
| Total Housing Units | 53,014 | 100.0% |
Occupancy by Ownership by Household Size in Scott County
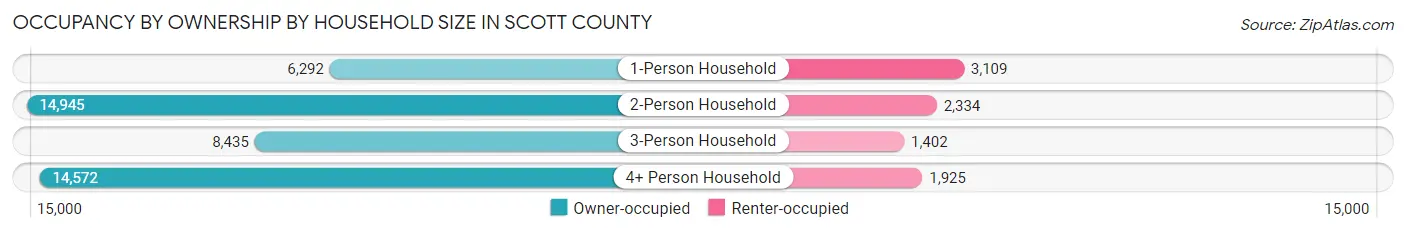
| Household Size | Owner-occupied | Renter-occupied |
| 1-Person Household | 6,292 (66.9%) | 3,109 (33.1%) |
| 2-Person Household | 14,945 (86.5%) | 2,334 (13.5%) |
| 3-Person Household | 8,435 (85.8%) | 1,402 (14.2%) |
| 4+ Person Household | 14,572 (88.3%) | 1,925 (11.7%) |
| Total Housing Units | 44,244 (83.5%) | 8,770 (16.5%) |
Occupancy by Educational Attainment in Scott County
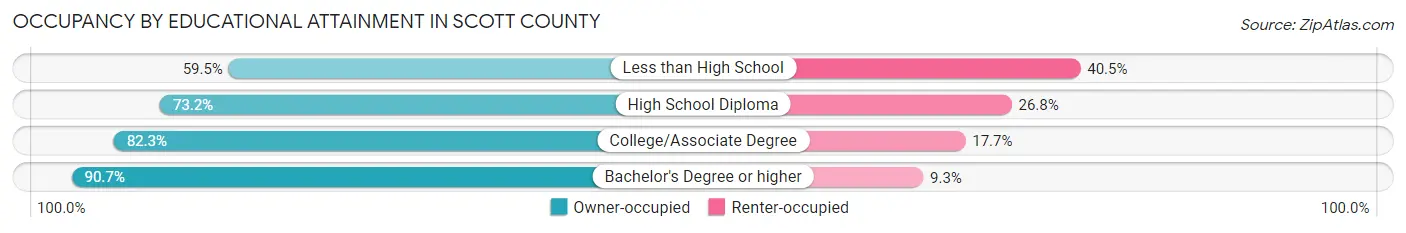
| Household Size | Owner-occupied | Renter-occupied |
| Less than High School | 1,374 (59.5%) | 934 (40.5%) |
| High School Diploma | 6,977 (73.2%) | 2,560 (26.8%) |
| College/Associate Degree | 14,216 (82.3%) | 3,052 (17.7%) |
| Bachelor's Degree or higher | 21,677 (90.7%) | 2,224 (9.3%) |
Occupancy by Age of Householder in Scott County
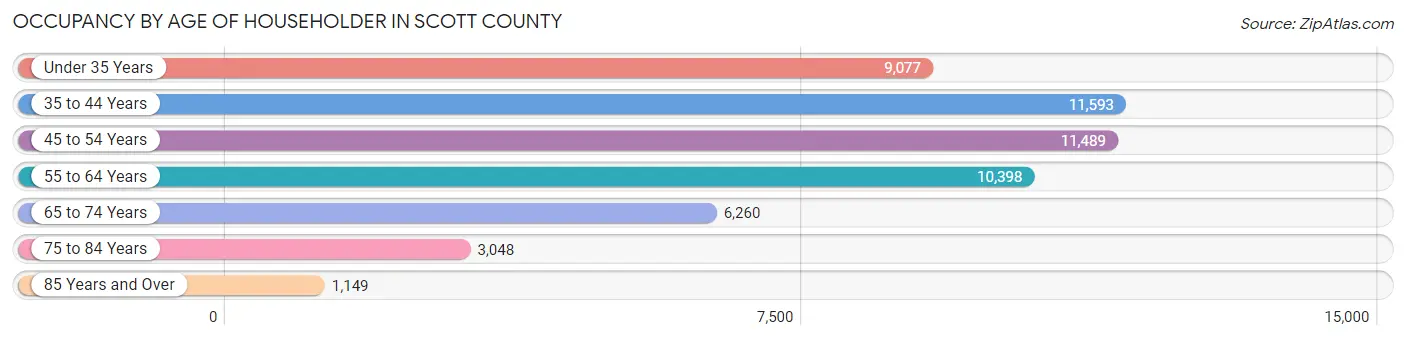
| Age Bracket | # Households | % Households |
| Under 35 Years | 9,077 | 17.1% |
| 35 to 44 Years | 11,593 | 21.9% |
| 45 to 54 Years | 11,489 | 21.7% |
| 55 to 64 Years | 10,398 | 19.6% |
| 65 to 74 Years | 6,260 | 11.8% |
| 75 to 84 Years | 3,048 | 5.8% |
| 85 Years and Over | 1,149 | 2.2% |
| Total | 53,014 | 100.0% |
Housing Finances in Scott County
Median Income by Occupancy in Scott County
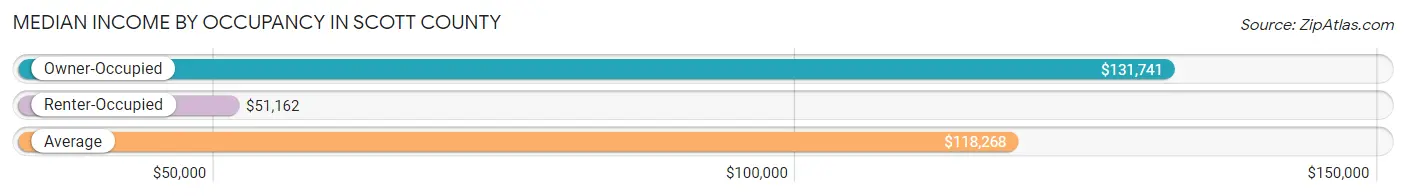
| Occupancy Type | # Households | Median Income |
| Owner-Occupied | 44,244 (83.5%) | $131,741 |
| Renter-Occupied | 8,770 (16.5%) | $51,162 |
| Average | 53,014 (100.0%) | $118,268 |
Occupancy by Householder Income Bracket in Scott County
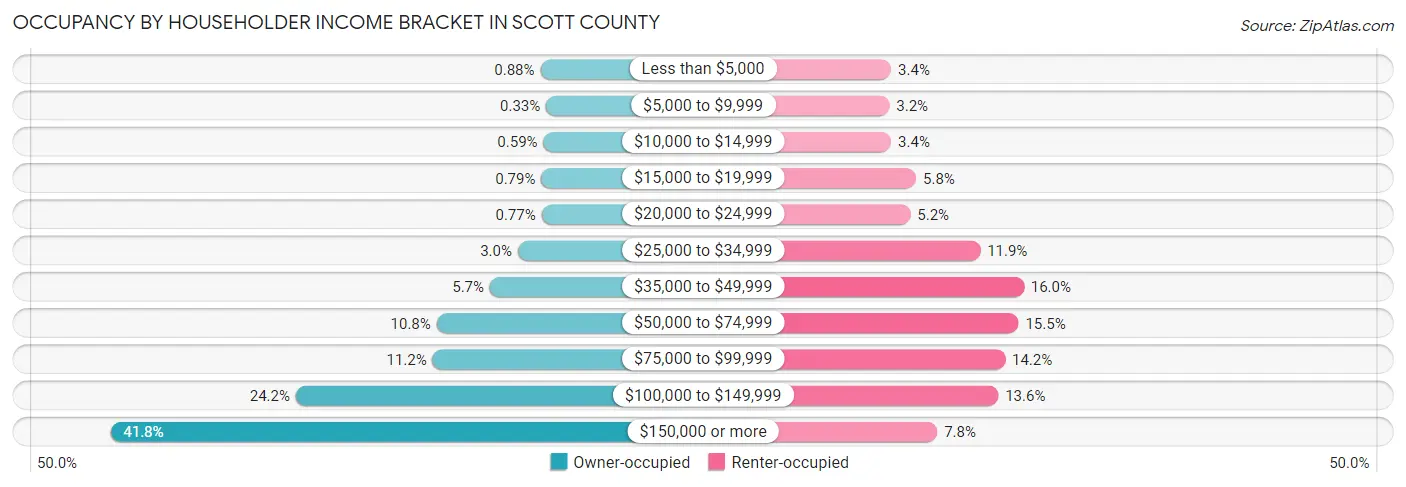
| Income Bracket | Owner-occupied | Renter-occupied |
| Less than $5,000 | 388 (0.9%) | 297 (3.4%) |
| $5,000 to $9,999 | 146 (0.3%) | 282 (3.2%) |
| $10,000 to $14,999 | 263 (0.6%) | 297 (3.4%) |
| $15,000 to $19,999 | 349 (0.8%) | 506 (5.8%) |
| $20,000 to $24,999 | 342 (0.8%) | 458 (5.2%) |
| $25,000 to $34,999 | 1,340 (3.0%) | 1,041 (11.9%) |
| $35,000 to $49,999 | 2,519 (5.7%) | 1,405 (16.0%) |
| $50,000 to $74,999 | 4,761 (10.8%) | 1,361 (15.5%) |
| $75,000 to $99,999 | 4,935 (11.2%) | 1,249 (14.2%) |
| $100,000 to $149,999 | 10,693 (24.2%) | 1,192 (13.6%) |
| $150,000 or more | 18,508 (41.8%) | 682 (7.8%) |
| Total | 44,244 (100.0%) | 8,770 (100.0%) |
Monthly Housing Cost Tiers in Scott County
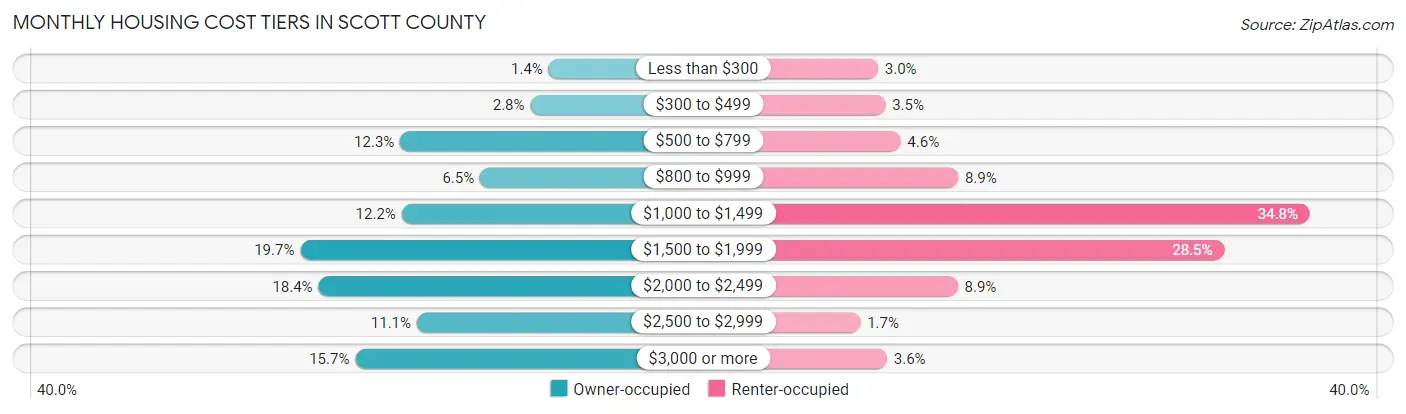
| Monthly Cost | Owner-occupied | Renter-occupied |
| Less than $300 | 618 (1.4%) | 261 (3.0%) |
| $300 to $499 | 1,217 (2.8%) | 309 (3.5%) |
| $500 to $799 | 5,459 (12.3%) | 407 (4.6%) |
| $800 to $999 | 2,857 (6.5%) | 779 (8.9%) |
| $1,000 to $1,499 | 5,413 (12.2%) | 3,051 (34.8%) |
| $1,500 to $1,999 | 8,718 (19.7%) | 2,499 (28.5%) |
| $2,000 to $2,499 | 8,122 (18.4%) | 776 (8.8%) |
| $2,500 to $2,999 | 4,916 (11.1%) | 147 (1.7%) |
| $3,000 or more | 6,924 (15.7%) | 319 (3.6%) |
| Total | 44,244 (100.0%) | 8,770 (100.0%) |
Physical Housing Characteristics in Scott County
Housing Structures in Scott County
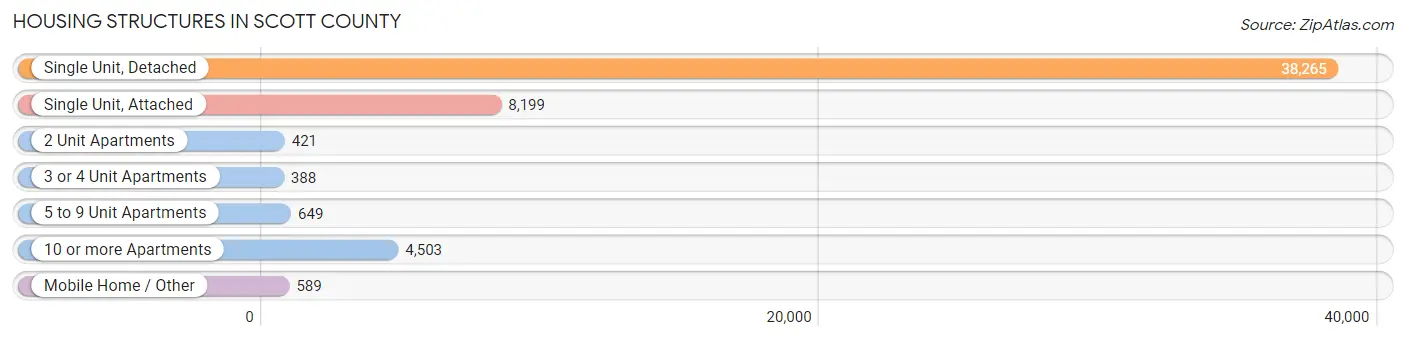
| Structure Type | # Housing Units | % Housing Units |
| Single Unit, Detached | 38,265 | 72.2% |
| Single Unit, Attached | 8,199 | 15.5% |
| 2 Unit Apartments | 421 | 0.8% |
| 3 or 4 Unit Apartments | 388 | 0.7% |
| 5 to 9 Unit Apartments | 649 | 1.2% |
| 10 or more Apartments | 4,503 | 8.5% |
| Mobile Home / Other | 589 | 1.1% |
| Total | 53,014 | 100.0% |
Housing Structures by Occupancy in Scott County
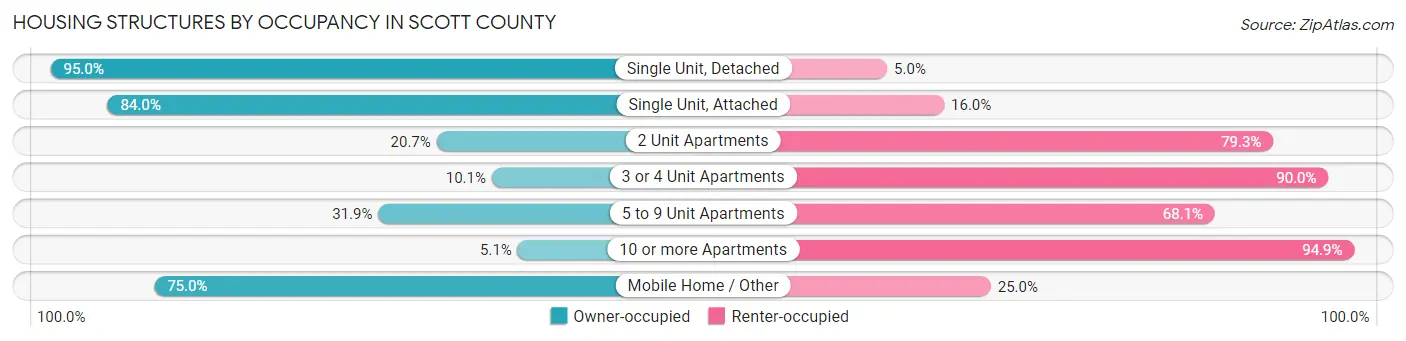
| Structure Type | Owner-occupied | Renter-occupied |
| Single Unit, Detached | 36,351 (95.0%) | 1,914 (5.0%) |
| Single Unit, Attached | 6,890 (84.0%) | 1,309 (16.0%) |
| 2 Unit Apartments | 87 (20.7%) | 334 (79.3%) |
| 3 or 4 Unit Apartments | 39 (10.1%) | 349 (89.9%) |
| 5 to 9 Unit Apartments | 207 (31.9%) | 442 (68.1%) |
| 10 or more Apartments | 228 (5.1%) | 4,275 (94.9%) |
| Mobile Home / Other | 442 (75.0%) | 147 (25.0%) |
| Total | 44,244 (83.5%) | 8,770 (16.5%) |
Housing Structures by Number of Rooms in Scott County
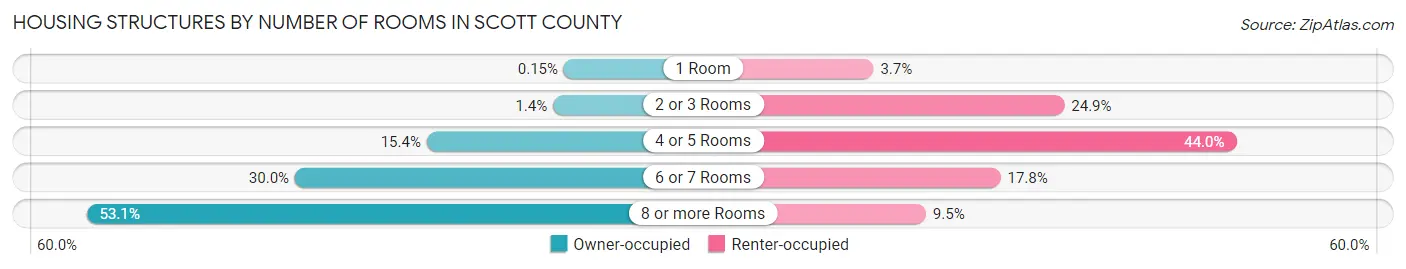
| Number of Rooms | Owner-occupied | Renter-occupied |
| 1 Room | 68 (0.2%) | 326 (3.7%) |
| 2 or 3 Rooms | 598 (1.3%) | 2,185 (24.9%) |
| 4 or 5 Rooms | 6,802 (15.4%) | 3,858 (44.0%) |
| 6 or 7 Rooms | 13,271 (30.0%) | 1,564 (17.8%) |
| 8 or more Rooms | 23,505 (53.1%) | 837 (9.5%) |
| Total | 44,244 (100.0%) | 8,770 (100.0%) |
Housing Structure by Heating Type in Scott County
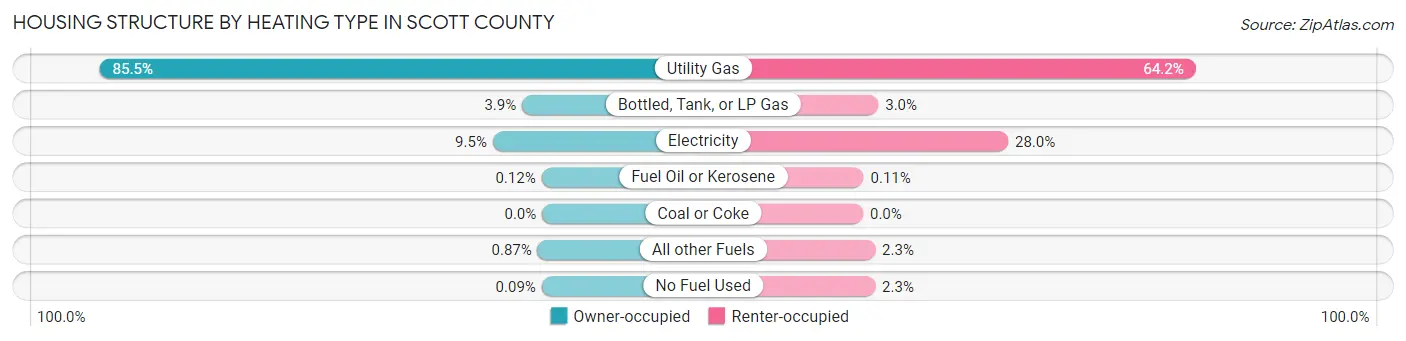
| Heating Type | Owner-occupied | Renter-occupied |
| Utility Gas | 37,829 (85.5%) | 5,634 (64.2%) |
| Bottled, Tank, or LP Gas | 1,713 (3.9%) | 259 (2.9%) |
| Electricity | 4,223 (9.5%) | 2,457 (28.0%) |
| Fuel Oil or Kerosene | 55 (0.1%) | 10 (0.1%) |
| Coal or Coke | 0 (0.0%) | 0 (0.0%) |
| All other Fuels | 383 (0.9%) | 205 (2.3%) |
| No Fuel Used | 41 (0.1%) | 205 (2.3%) |
| Total | 44,244 (100.0%) | 8,770 (100.0%) |
Household Vehicle Usage in Scott County
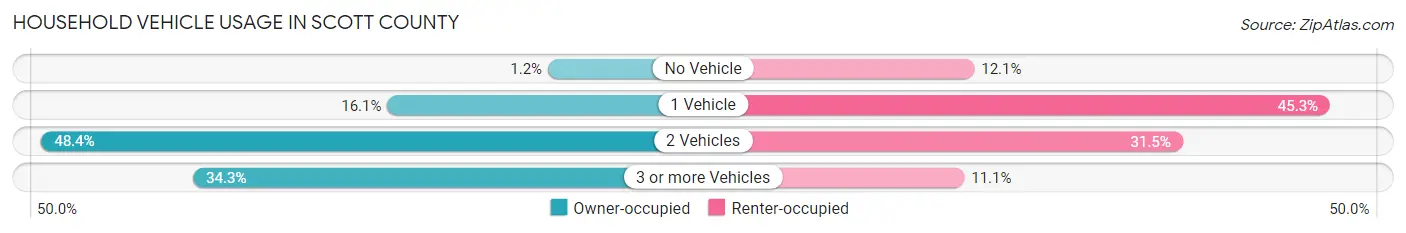
| Vehicles per Household | Owner-occupied | Renter-occupied |
| No Vehicle | 507 (1.1%) | 1,059 (12.1%) |
| 1 Vehicle | 7,143 (16.1%) | 3,970 (45.3%) |
| 2 Vehicles | 21,431 (48.4%) | 2,764 (31.5%) |
| 3 or more Vehicles | 15,163 (34.3%) | 977 (11.1%) |
| Total | 44,244 (100.0%) | 8,770 (100.0%) |
Real Estate & Mortgages in Scott County
Real Estate and Mortgage Overview in Scott County
| Characteristic | Without Mortgage | With Mortgage |
| Housing Units | 11,094 | 33,150 |
| Median Property Value | $362,500 | $380,000 |
| Median Household Income | $96,485 | $15,122 |
| Monthly Housing Costs | $718 | $6,922 |
| Real Estate Taxes | $3,868 | $719 |
Property Value by Mortgage Status in Scott County
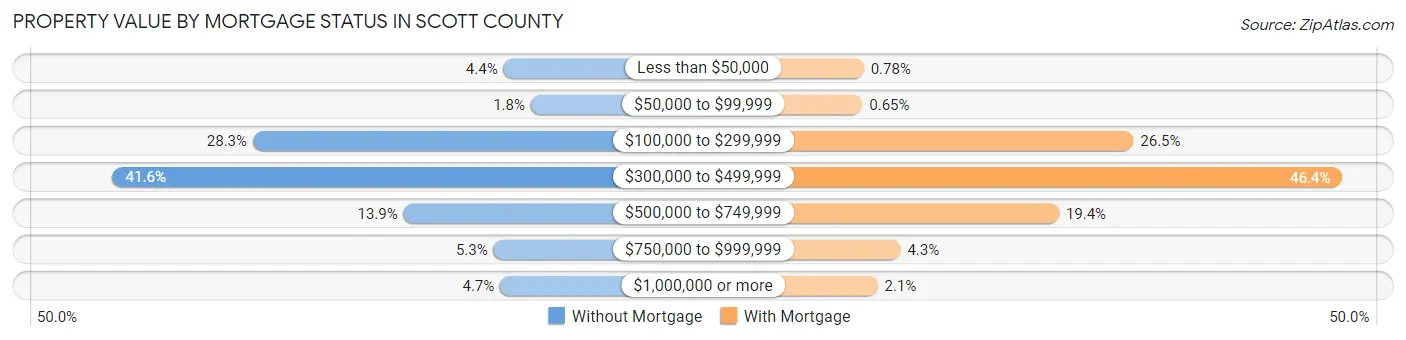
| Property Value | Without Mortgage | With Mortgage |
| Less than $50,000 | 487 (4.4%) | 258 (0.8%) |
| $50,000 to $99,999 | 199 (1.8%) | 215 (0.6%) |
| $100,000 to $299,999 | 3,135 (28.3%) | 8,773 (26.5%) |
| $300,000 to $499,999 | 4,616 (41.6%) | 15,369 (46.4%) |
| $500,000 to $749,999 | 1,543 (13.9%) | 6,420 (19.4%) |
| $750,000 to $999,999 | 592 (5.3%) | 1,420 (4.3%) |
| $1,000,000 or more | 522 (4.7%) | 695 (2.1%) |
| Total | 11,094 (100.0%) | 33,150 (100.0%) |
Household Income by Mortgage Status in Scott County
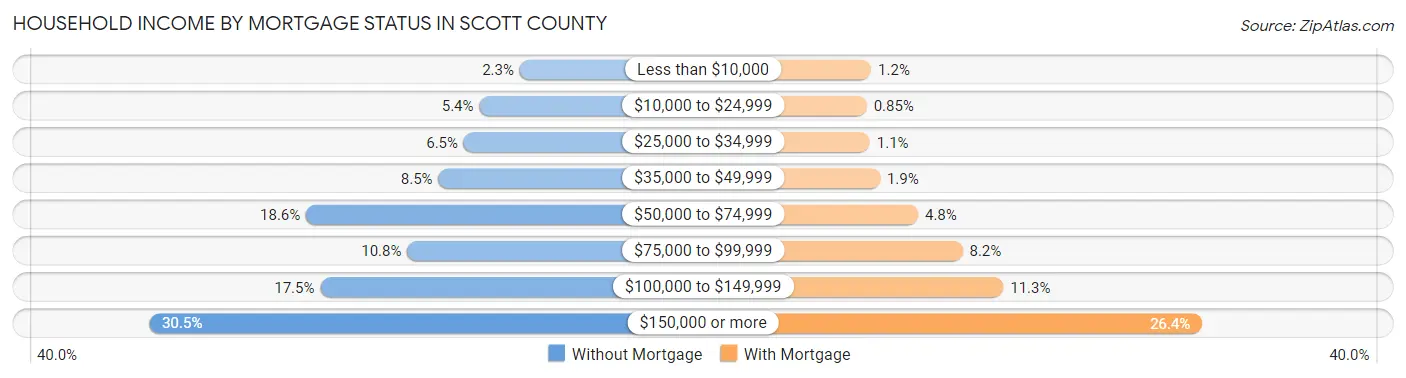
| Household Income | Without Mortgage | With Mortgage |
| Less than $10,000 | 252 (2.3%) | 394 (1.2%) |
| $10,000 to $24,999 | 593 (5.3%) | 282 (0.9%) |
| $25,000 to $34,999 | 724 (6.5%) | 361 (1.1%) |
| $35,000 to $49,999 | 940 (8.5%) | 616 (1.9%) |
| $50,000 to $74,999 | 2,058 (18.5%) | 1,579 (4.8%) |
| $75,000 to $99,999 | 1,203 (10.8%) | 2,703 (8.2%) |
| $100,000 to $149,999 | 1,938 (17.5%) | 3,732 (11.3%) |
| $150,000 or more | 3,386 (30.5%) | 8,755 (26.4%) |
| Total | 11,094 (100.0%) | 33,150 (100.0%) |
Property Value to Household Income Ratio in Scott County
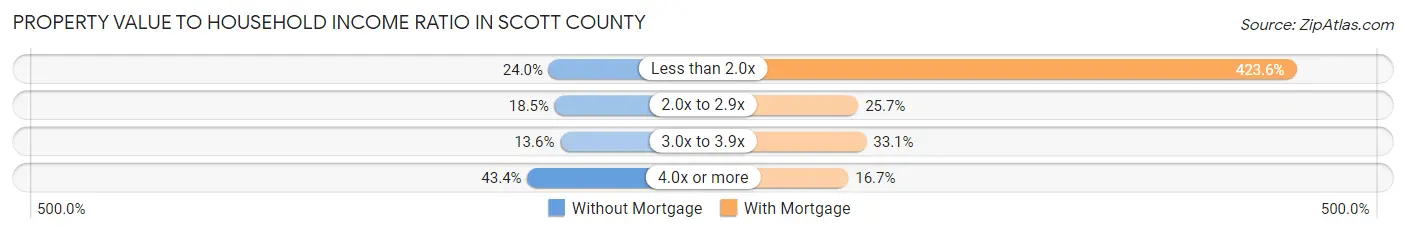
| Value-to-Income Ratio | Without Mortgage | With Mortgage |
| Less than 2.0x | 2,658 (24.0%) | 140,416 (423.6%) |
| 2.0x to 2.9x | 2,049 (18.5%) | 8,513 (25.7%) |
| 3.0x to 3.9x | 1,509 (13.6%) | 10,960 (33.1%) |
| 4.0x or more | 4,816 (43.4%) | 5,539 (16.7%) |
| Total | 11,094 (100.0%) | 33,150 (100.0%) |
Real Estate Taxes by Mortgage Status in Scott County
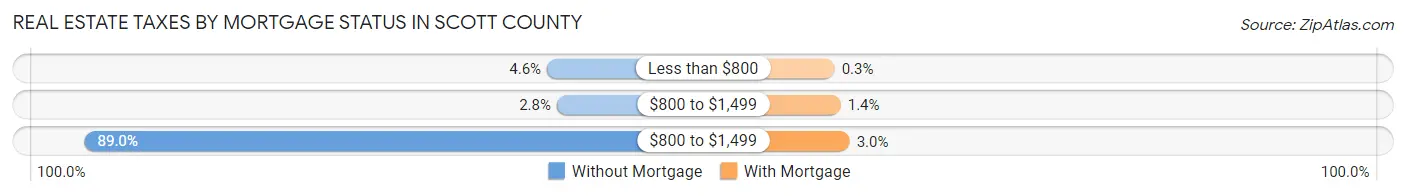
| Property Taxes | Without Mortgage | With Mortgage |
| Less than $800 | 510 (4.6%) | 99 (0.3%) |
| $800 to $1,499 | 309 (2.8%) | 466 (1.4%) |
| $800 to $1,499 | 9,877 (89.0%) | 1,008 (3.0%) |
| Total | 11,094 (100.0%) | 33,150 (100.0%) |
Health & Disability in Scott County
Health Insurance Coverage by Age in Scott County
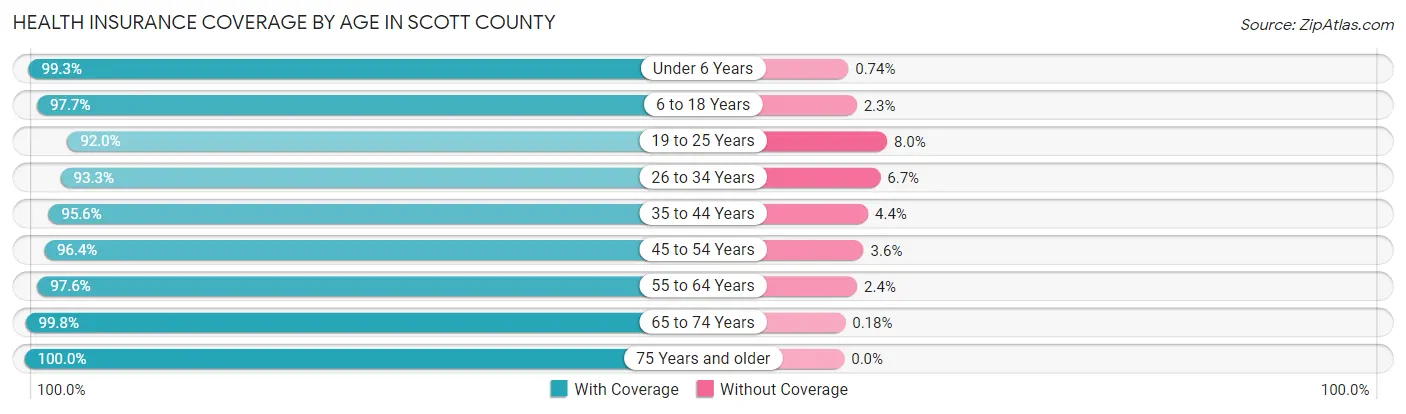
| Age Bracket | With Coverage | Without Coverage |
| Under 6 Years | 11,340 (99.3%) | 84 (0.7%) |
| 6 to 18 Years | 30,573 (97.7%) | 726 (2.3%) |
| 19 to 25 Years | 10,629 (92.0%) | 920 (8.0%) |
| 26 to 34 Years | 14,752 (93.3%) | 1,062 (6.7%) |
| 35 to 44 Years | 21,239 (95.6%) | 987 (4.4%) |
| 45 to 54 Years | 20,720 (96.4%) | 777 (3.6%) |
| 55 to 64 Years | 18,272 (97.6%) | 449 (2.4%) |
| 65 to 74 Years | 11,049 (99.8%) | 20 (0.2%) |
| 75 Years and older | 6,190 (100.0%) | 0 (0.0%) |
| Total | 144,764 (96.7%) | 5,025 (3.4%) |
Health Insurance Coverage by Citizenship Status in Scott County
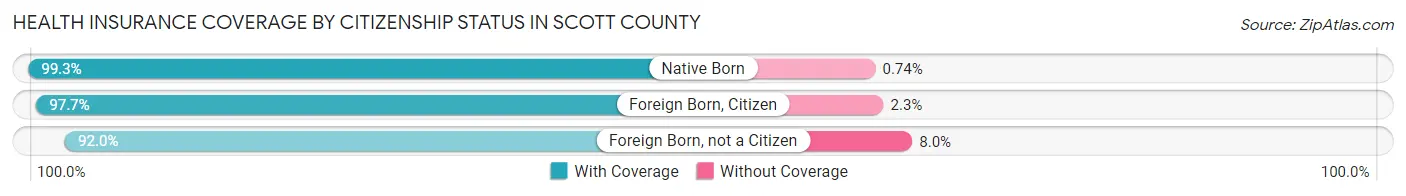
| Citizenship Status | With Coverage | Without Coverage |
| Native Born | 11,340 (99.3%) | 84 (0.7%) |
| Foreign Born, Citizen | 30,573 (97.7%) | 726 (2.3%) |
| Foreign Born, not a Citizen | 10,629 (92.0%) | 920 (8.0%) |
Health Insurance Coverage by Household Income in Scott County
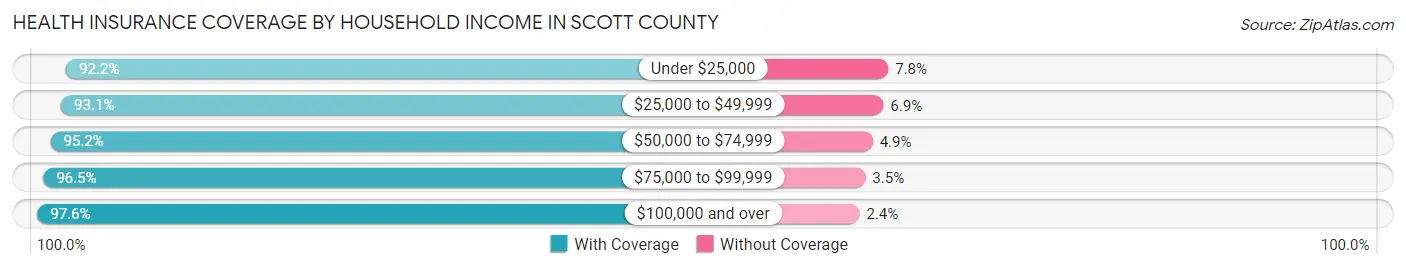
| Household Income | With Coverage | Without Coverage |
| Under $25,000 | 5,345 (92.2%) | 450 (7.8%) |
| $25,000 to $49,999 | 12,552 (93.1%) | 924 (6.9%) |
| $50,000 to $74,999 | 12,975 (95.2%) | 662 (4.9%) |
| $75,000 to $99,999 | 16,840 (96.5%) | 609 (3.5%) |
| $100,000 and over | 96,901 (97.6%) | 2,377 (2.4%) |
Public vs Private Health Insurance Coverage by Age in Scott County
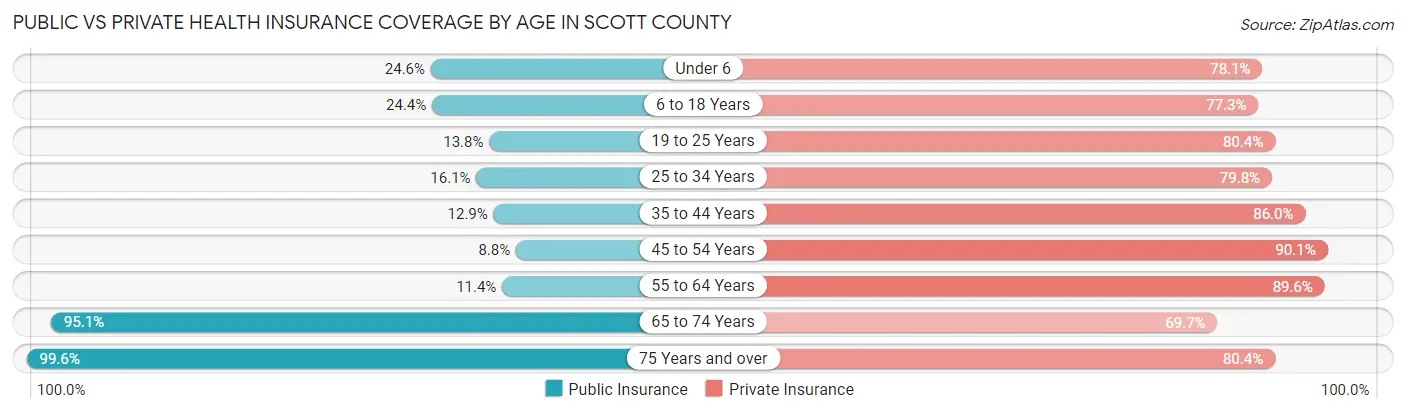
| Age Bracket | Public Insurance | Private Insurance |
| Under 6 | 2,809 (24.6%) | 8,919 (78.1%) |
| 6 to 18 Years | 7,623 (24.4%) | 24,196 (77.3%) |
| 19 to 25 Years | 1,588 (13.8%) | 9,286 (80.4%) |
| 25 to 34 Years | 2,553 (16.1%) | 12,625 (79.8%) |
| 35 to 44 Years | 2,877 (12.9%) | 19,119 (86.0%) |
| 45 to 54 Years | 1,887 (8.8%) | 19,377 (90.1%) |
| 55 to 64 Years | 2,124 (11.4%) | 16,779 (89.6%) |
| 65 to 74 Years | 10,528 (95.1%) | 7,717 (69.7%) |
| 75 Years and over | 6,167 (99.6%) | 4,977 (80.4%) |
| Total | 38,156 (25.5%) | 122,995 (82.1%) |
Disability Status by Sex by Age in Scott County
| Age Bracket | Male | Female |
| Under 5 Years | 35 (0.7%) | 125 (2.7%) |
| 5 to 17 Years | 476 (3.1%) | 582 (3.8%) |
| 18 to 34 Years | 888 (5.8%) | 1,086 (7.4%) |
| 35 to 64 Years | 2,141 (6.7%) | 1,994 (6.5%) |
| 65 to 74 Years | 1,323 (24.4%) | 850 (15.1%) |
| 75 Years and over | 1,169 (42.7%) | 1,495 (43.3%) |
Disability Class by Sex by Age in Scott County
Disability Class: Hearing Difficulty
| Age Bracket | Male | Female |
| Under 5 Years | 29 (0.6%) | 98 (2.1%) |
| 5 to 17 Years | 34 (0.2%) | 42 (0.3%) |
| 18 to 34 Years | 90 (0.6%) | 85 (0.6%) |
| 35 to 64 Years | 754 (2.4%) | 364 (1.2%) |
| 65 to 74 Years | 562 (10.3%) | 198 (3.5%) |
| 75 Years and over | 666 (24.3%) | 555 (16.1%) |
Disability Class: Vision Difficulty
| Age Bracket | Male | Female |
| Under 5 Years | 6 (0.1%) | 27 (0.6%) |
| 5 to 17 Years | 12 (0.1%) | 186 (1.2%) |
| 18 to 34 Years | 102 (0.7%) | 47 (0.3%) |
| 35 to 64 Years | 207 (0.6%) | 348 (1.1%) |
| 65 to 74 Years | 183 (3.4%) | 76 (1.3%) |
| 75 Years and over | 232 (8.5%) | 279 (8.1%) |
Disability Class: Cognitive Difficulty
| Age Bracket | Male | Female |
| 5 to 17 Years | 401 (2.6%) | 353 (2.3%) |
| 18 to 34 Years | 613 (4.0%) | 769 (5.2%) |
| 35 to 64 Years | 615 (1.9%) | 686 (2.2%) |
| 65 to 74 Years | 194 (3.6%) | 131 (2.3%) |
| 75 Years and over | 327 (12.0%) | 261 (7.5%) |
Disability Class: Ambulatory Difficulty
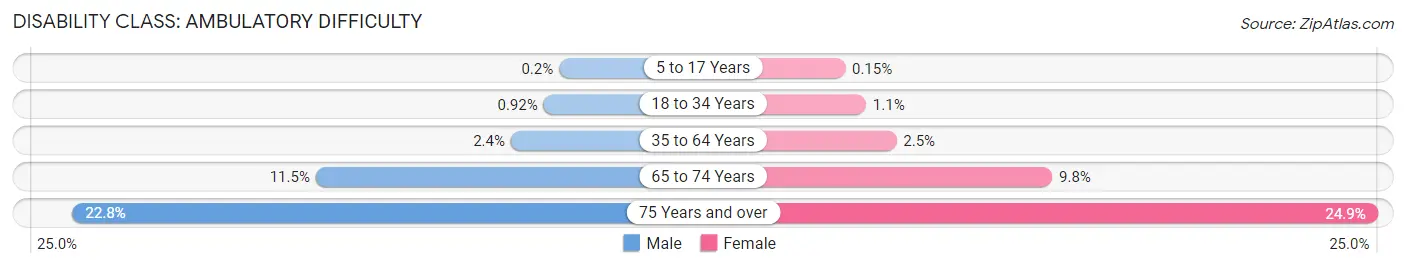
| Age Bracket | Male | Female |
| 5 to 17 Years | 31 (0.2%) | 23 (0.2%) |
| 18 to 34 Years | 140 (0.9%) | 164 (1.1%) |
| 35 to 64 Years | 775 (2.4%) | 778 (2.5%) |
| 65 to 74 Years | 624 (11.5%) | 550 (9.8%) |
| 75 Years and over | 623 (22.8%) | 859 (24.9%) |
Disability Class: Self-Care Difficulty
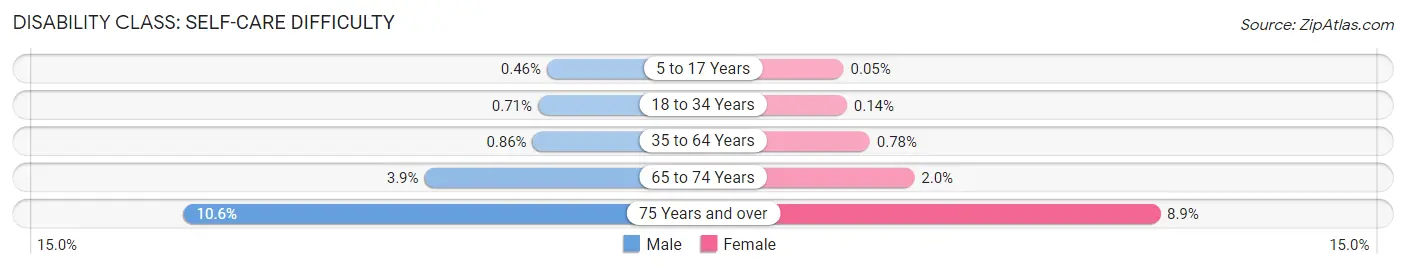
| Age Bracket | Male | Female |
| 5 to 17 Years | 71 (0.5%) | 7 (0.1%) |
| 18 to 34 Years | 108 (0.7%) | 21 (0.1%) |
| 35 to 64 Years | 273 (0.9%) | 239 (0.8%) |
| 65 to 74 Years | 210 (3.9%) | 114 (2.0%) |
| 75 Years and over | 289 (10.6%) | 306 (8.9%) |
Technology Access in Scott County
Computing Device Access in Scott County
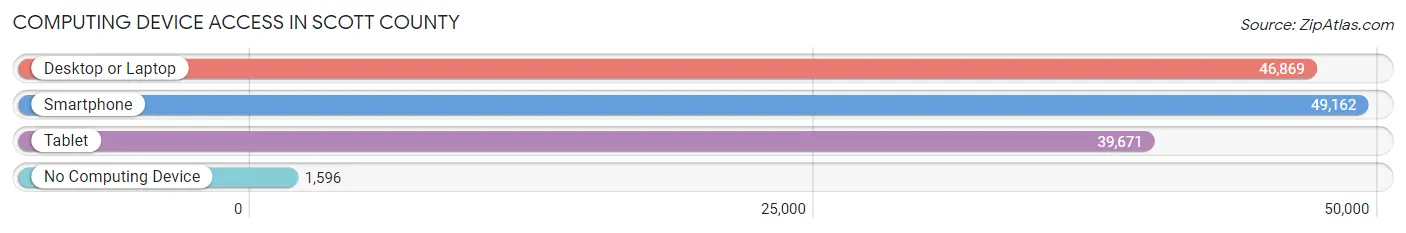
| Device Type | # Households | % Households |
| Desktop or Laptop | 46,869 | 88.4% |
| Smartphone | 49,162 | 92.7% |
| Tablet | 39,671 | 74.8% |
| No Computing Device | 1,596 | 3.0% |
| Total | 53,014 | 100.0% |
Internet Access in Scott County
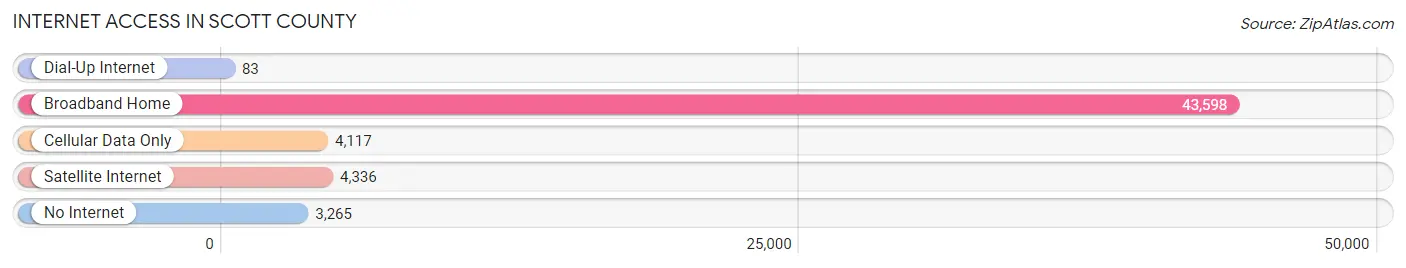
| Internet Type | # Households | % Households |
| Dial-Up Internet | 83 | 0.2% |
| Broadband Home | 43,598 | 82.2% |
| Cellular Data Only | 4,117 | 7.8% |
| Satellite Internet | 4,336 | 8.2% |
| No Internet | 3,265 | 6.2% |
| Total | 53,014 | 100.0% |
Scott County Summary
Scott County is located in the southeastern corner of Minnesota, and is part of the Minneapolis-St. Paul metropolitan area. It is bordered by Dakota County to the north, Rice County to the east, Le Sueur County to the south, and Carver and Hennepin counties to the west. The county seat is Shakopee, and the county is named after General Winfield Scott, a hero of the War of 1812.
History
The area that is now Scott County was originally inhabited by the Mdewakanton Dakota people. The first European settlers arrived in the area in the early 1800s, and the county was officially established in 1853. The county was initially populated by farmers, and the first railroad line was built in 1867.
In the late 1800s, the county began to experience rapid growth due to the influx of immigrants from Germany, Ireland, and Scandinavia. This growth was further fueled by the construction of the Minneapolis and St. Louis Railway in 1882.
The county continued to grow throughout the 20th century, and by the 2000s, it had become one of the fastest-growing counties in the state. This growth was largely due to the influx of people from the Twin Cities, who were attracted to the area’s affordable housing and proximity to the cities.
Geography
Scott County is located in the southeastern corner of Minnesota, and is part of the Minneapolis-St. Paul metropolitan area. It is bordered by Dakota County to the north, Rice County to the east, Le Sueur County to the south, and Carver and Hennepin counties to the west.
The county is mostly flat, with some rolling hills in the northern and western parts. The Minnesota River flows through the county, and there are several lakes, including Prior Lake, Lake Riley, and Lake O’Dowd.
The county has a total area of 517 square miles, of which 498 square miles is land and 19 square miles is water.
Economy
Scott County’s economy is largely driven by the service sector, with the largest employers being health care, retail, and hospitality. The county is also home to several large companies, including the Shakopee Mdewakanton Sioux Community, Mystic Lake Casino, and the Minnesota Zoo.
The county is also home to several large industrial parks, including the Shakopee Industrial Park and the Scott County Industrial Park. These parks are home to a variety of businesses, including manufacturing, logistics, and technology companies.
Demographics
As of the 2010 census, Scott County had a population of 129,928. The population was 53.2% white, 22.2% Hispanic or Latino, 15.2% African American, 5.2% Asian, and 4.2% Native American.
The median household income was $76,845, and the median family income was $90,945. The per capita income was $33,945. The poverty rate was 8.2%.
Conclusion
Scott County is located in the southeastern corner of Minnesota, and is part of the Minneapolis-St. Paul metropolitan area. It has a rich history, and has experienced rapid growth in recent years due to its proximity to the Twin Cities and its affordable housing. The county’s economy is largely driven by the service sector, and it is home to several large companies and industrial parks. The population is diverse, with the largest groups being white, Hispanic or Latino, African American, Asian, and Native American.
Common Questions
What is the Total Population of Scott County?
Total Population of Scott County is 151,347.
What is the Total Male Population of Scott County?
Total Male Population of Scott County is 75,749.
What is the Total Female Population of Scott County?
Total Female Population of Scott County is 75,598.
What is the Ratio of Males per 100 Females in Scott County?
There are 100.20 Males per 100 Females in Scott County.
What is the Ratio of Females per 100 Males in Scott County?
There are 99.80 Females per 100 Males in Scott County.
What is the Median Population Age in Scott County?
Median Population Age in Scott County is 37.3 Years.
What is the Average Family Size in Scott County
Average Family Size in Scott County is 3.2 People.
What is the Average Household Size in Scott County
Average Household Size in Scott County is 2.8 People.
What is Per Capita Income in Scott County?
Per Capita income in Scott County is $51,259.
What is the Median Family Income in Scott County?
Median Family Income in Scott County is $133,884.
What is the Median Household income in Scott County?
Median Household Income in Scott County is $118,268.
What is Income or Wage Gap in Scott County?
Income or Wage Gap in Scott County is 31.4%.
Women in Scott County earn 68.6 cents for every dollar earned by a man.
What is Family Income Deficit in Scott County?
Family Income Deficit in Scott County is $11,142.
Families that are below poverty line in Scott County earn $11,142 less on average than the poverty threshold level.
What is Inequality or Gini Index in Scott County?
Inequality or Gini Index in Scott County is 0.41.
How Large is the Labor Force in Scott County?
There are 87,460 People in the Labor Forcein in Scott County.
What is the Percentage of People in the Labor Force in Scott County?
75.4% of People are in the Labor Force in Scott County.
What is the Unemployment Rate in Scott County?
Unemployment Rate in Scott County is 3.2%.