Rock County, MN
Rock County Map

Rock County Overview
9,659
TOTAL POPULATION
4,701
MALE POPULATION
4,958
FEMALE POPULATION
94.82
MALES / 100 FEMALES
105.47
FEMALES / 100 MALES
40.9
MEDIAN AGE
3.0
AVG FAMILY SIZE
2.4
AVG HOUSEHOLD SIZE
$38,472
PER CAPITA INCOME
$94,484
AVG FAMILY INCOME
$75,060
AVG HOUSEHOLD INCOME
24.3%
WAGE / INCOME GAP [ % ]
75.7¢/ $1
WAGE / INCOME GAP [ $ ]
0.44
INEQUALITY / GINI INDEX
5,149
LABOR FORCE [ PEOPLE ]
68.2%
PERCENT IN LABOR FORCE
2.8%
UNEMPLOYMENT RATE
Rock County Area Codes
Race in Rock County
The most populous races in Rock County are White / Caucasian (9,166 | 94.9%), Hispanic or Latino (326 | 3.4%), and Two or more Races (305 | 3.2%).

| Race | # Population | % Population |
| Asian | 67 | 0.7% |
| Black / African American | 16 | 0.2% |
| Hawaiian / Pacific | 0 | 0.0% |
| Hispanic or Latino | 326 | 3.4% |
| Native / Alaskan | 68 | 0.7% |
| White / Caucasian | 9,166 | 94.9% |
| Two or more Races | 305 | 3.2% |
| Some other Race | 37 | 0.4% |
| Total | 9,659 | 100.0% |
Ancestry in Rock County
The most populous ancestries reported in Rock County are German (4,099 | 42.4%), Dutch (1,992 | 20.6%), Norwegian (1,633 | 16.9%), Irish (522 | 5.4%), and English (279 | 2.9%), together accounting for 88.3% of all Rock County residents.

| Ancestry | # Population | % Population |
| American | 168 | 1.7% |
| Arab | 17 | 0.2% |
| Belgian | 81 | 0.8% |
| Bolivian | 2 | 0.0% |
| British | 7 | 0.1% |
| Burmese | 1 | 0.0% |
| Canadian | 42 | 0.4% |
| Central American | 16 | 0.2% |
| Chippewa | 4 | 0.0% |
| Colombian | 2 | 0.0% |
| Czech | 60 | 0.6% |
| Czechoslovakian | 15 | 0.2% |
| Danish | 168 | 1.7% |
| Dominican | 37 | 0.4% |
| Dutch | 1,992 | 20.6% |
| Ecuadorian | 86 | 0.9% |
| Egyptian | 14 | 0.1% |
| English | 279 | 2.9% |
| Estonian | 46 | 0.5% |
| European | 66 | 0.7% |
| Finnish | 23 | 0.2% |
| French | 97 | 1.0% |
| French Canadian | 16 | 0.2% |
| German | 4,099 | 42.4% |
| Guatemalan | 16 | 0.2% |
| Hungarian | 1 | 0.0% |
| Indian (Asian) | 2 | 0.0% |
| Irish | 522 | 5.4% |
| Italian | 108 | 1.1% |
| Japanese | 53 | 0.5% |
| Korean | 32 | 0.3% |
| Lebanese | 3 | 0.0% |
| Luxembourger | 22 | 0.2% |
| Malaysian | 5 | 0.1% |
| Mexican | 145 | 1.5% |
| Norwegian | 1,633 | 16.9% |
| Pennsylvania German | 2 | 0.0% |
| Polish | 80 | 0.8% |
| Portuguese | 1 | 0.0% |
| Puerto Rican | 17 | 0.2% |
| Romanian | 16 | 0.2% |
| Russian | 103 | 1.1% |
| Scandinavian | 68 | 0.7% |
| Scotch-Irish | 11 | 0.1% |
| Scottish | 117 | 1.2% |
| Sioux | 58 | 0.6% |
| Slovak | 14 | 0.1% |
| Slovene | 33 | 0.3% |
| South American | 90 | 0.9% |
| Spanish | 3 | 0.0% |
| Sri Lankan | 5 | 0.1% |
| Subsaharan African | 10 | 0.1% |
| Sudanese | 10 | 0.1% |
| Swedish | 252 | 2.6% |
| Swiss | 57 | 0.6% |
| Turkish | 2 | 0.0% |
| Ukrainian | 39 | 0.4% |
| Welsh | 18 | 0.2% |
| Yugoslavian | 47 | 0.5% | View All 59 Rows |
Immigrants in Rock County
The most numerous immigrant groups reported in Rock County came from Latin America (57 | 0.6%), Asia (39 | 0.4%), Central America (38 | 0.4%), South Eastern Asia (36 | 0.4%), and Mexico (32 | 0.3%), together accounting for 2.1% of all Rock County residents.

| Immigration Origin | # Population | % Population |
| Africa | 14 | 0.1% |
| Asia | 39 | 0.4% |
| Bolivia | 2 | 0.0% |
| Canada | 22 | 0.2% |
| Central America | 38 | 0.4% |
| China | 2 | 0.0% |
| Eastern Asia | 3 | 0.0% |
| Eastern Europe | 23 | 0.2% |
| Ecuador | 17 | 0.2% |
| Egypt | 14 | 0.1% |
| England | 1 | 0.0% |
| Europe | 30 | 0.3% |
| Germany | 2 | 0.0% |
| Guatemala | 6 | 0.1% |
| Korea | 1 | 0.0% |
| Laos | 4 | 0.0% |
| Latin America | 57 | 0.6% |
| Mexico | 32 | 0.3% |
| Northern Africa | 14 | 0.1% |
| Northern Europe | 1 | 0.0% |
| Philippines | 32 | 0.3% |
| Portugal | 4 | 0.0% |
| Romania | 1 | 0.0% |
| Russia | 4 | 0.0% |
| South America | 19 | 0.2% |
| South Eastern Asia | 36 | 0.4% |
| Southern Europe | 4 | 0.0% |
| Taiwan | 2 | 0.0% |
| Ukraine | 11 | 0.1% |
| Western Europe | 2 | 0.0% | View All 30 Rows |
Sex and Age in Rock County
Sex and Age in Rock County
The most populous age groups in Rock County are 15 to 19 Years (388 | 8.3%) for men and 10 to 14 Years (390 | 7.9%) for women.

| Age Bracket | Male | Female |
| Under 5 Years | 252 (5.4%) | 288 (5.8%) |
| 5 to 9 Years | 331 (7.0%) | 368 (7.4%) |
| 10 to 14 Years | 343 (7.3%) | 390 (7.9%) |
| 15 to 19 Years | 388 (8.3%) | 314 (6.3%) |
| 20 to 24 Years | 242 (5.1%) | 255 (5.1%) |
| 25 to 29 Years | 292 (6.2%) | 260 (5.2%) |
| 30 to 34 Years | 236 (5.0%) | 232 (4.7%) |
| 35 to 39 Years | 246 (5.2%) | 299 (6.0%) |
| 40 to 44 Years | 298 (6.3%) | 304 (6.1%) |
| 45 to 49 Years | 284 (6.0%) | 258 (5.2%) |
| 50 to 54 Years | 252 (5.4%) | 270 (5.4%) |
| 55 to 59 Years | 343 (7.3%) | 340 (6.9%) |
| 60 to 64 Years | 310 (6.6%) | 329 (6.6%) |
| 65 to 69 Years | 240 (5.1%) | 313 (6.3%) |
| 70 to 74 Years | 260 (5.5%) | 199 (4.0%) |
| 75 to 79 Years | 167 (3.5%) | 212 (4.3%) |
| 80 to 84 Years | 109 (2.3%) | 133 (2.7%) |
| 85 Years and over | 108 (2.3%) | 194 (3.9%) |
| Total | 4,701 (100.0%) | 4,958 (100.0%) |
Families and Households in Rock County
Median Family Size in Rock County
The median family size in Rock County is 2.98 persons per family, with married-couple families (2,165 | 84.0%) accounting for the largest median family size of 3.04 persons per family. On the other hand, single male/father families (73 | 2.8%) represent the smallest median family size with 2.41 persons per family.

| Family Type | # Families | Family Size |
| Married-Couple | 2,165 (84.0%) | 3.04 |
| Single Male/Father | 73 (2.8%) | 2.41 |
| Single Female/Mother | 341 (13.2%) | 2.74 |
| Total Families | 2,579 (100.0%) | 2.98 |
Median Household Size in Rock County
The median household size in Rock County is 2.39 persons per household, with single female/mother households (341 | 8.7%) accounting for the largest median household size of 3.12 persons per household. non-family households (1,344 | 34.3%) represent the smallest median household size with 1.12 persons per household.

| Household Type | # Households | Household Size |
| Married-Couple | 2,165 (55.2%) | 3.06 |
| Single Male/Father | 73 (1.9%) | 2.73 |
| Single Female/Mother | 341 (8.7%) | 3.12 |
| Non-family | 1,344 (34.3%) | 1.12 |
| Total Households | 3,923 (100.0%) | 2.39 |
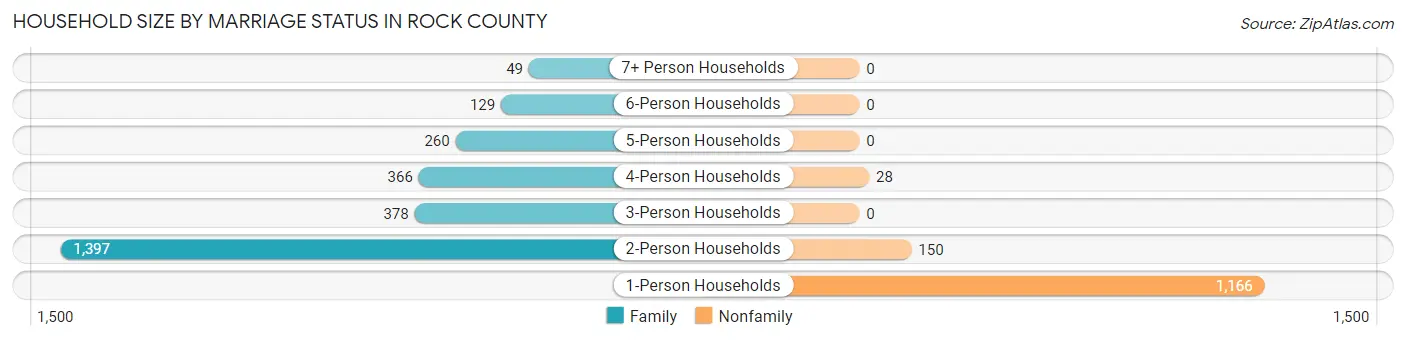
Household Size by Marriage Status in Rock County
Out of a total of 3,923 households in Rock County, 2,579 (65.7%) are family households, while 1,344 (34.3%) are nonfamily households. The most numerous type of family households are 2-person households, comprising 1,397, and the most common type of nonfamily households are 1-person households, comprising 1,166.
| Household Size | Family Households | Nonfamily Households |
| 1-Person Households | - | 1,166 (29.7%) |
| 2-Person Households | 1,397 (35.6%) | 150 (3.8%) |
| 3-Person Households | 378 (9.6%) | 0 (0.0%) |
| 4-Person Households | 366 (9.3%) | 28 (0.7%) |
| 5-Person Households | 260 (6.6%) | 0 (0.0%) |
| 6-Person Households | 129 (3.3%) | 0 (0.0%) |
| 7+ Person Households | 49 (1.3%) | 0 (0.0%) |
| Total | 2,579 (65.7%) | 1,344 (34.3%) |
Female Fertility in Rock County
Fertility by Age in Rock County
Average fertility rate in Rock County is 118.0 births per 1,000 women. Women in the age bracket of 20 to 34 years have the highest fertility rate with 300.0 births per 1,000 women. Women in the age bracket of 20 to 34 years acount for 96.6% of all women with births.

| Age Bracket | Women with Births | Births / 1,000 Women |
| 15 to 19 years | 0 (0.0%) | 0.0 |
| 20 to 34 years | 224 (96.6%) | 300.0 |
| 35 to 50 years | 8 (3.5%) | 9.0 |
| Total | 232 (100.0%) | 118.0 |
Fertility by Age by Marriage Status in Rock County
81.9% of women with births (232) in Rock County are married. The highest percentage of unmarried women with births falls into 20 to 34 years age bracket with 18.8% of them unmarried at the time of birth, while the lowest percentage of unmarried women with births belong to 35 to 50 years age bracket with 0.0% of them unmarried.

| Age Bracket | Married | Unmarried |
| 15 to 19 years | 0 (0.0%) | 0 (0.0%) |
| 20 to 34 years | 182 (81.2%) | 42 (18.8%) |
| 35 to 50 years | 8 (100.0%) | 0 (0.0%) |
| Total | 190 (81.9%) | 42 (18.1%) |
Fertility by Education in Rock County

| Educational Attainment | Women with Births | Births / 1,000 Women |
| Less than High School | 0 (0.0%) | 0.0 |
| High School Diploma | 28 (12.1%) | 87.0 |
| College or Associate's Degree | 37 (16.0%) | 57.0 |
| Bachelor's Degree | 149 (64.2%) | 294.0 |
| Graduate Degree | 18 (7.8%) | 113.0 |
| Total | 232 (100.0%) | 118.0 |
Fertility by Education by Marriage Status in Rock County
18.1% of women with births in Rock County are unmarried. Women with the educational attainment of graduate degree are most likely to be married with 100.0% of them married at childbirth, while women with the educational attainment of high school diploma are least likely to be married with 78.6% of them unmarried at childbirth.

| Educational Attainment | Married | Unmarried |
| Less than High School | 0 (0.0%) | 0 (0.0%) |
| High School Diploma | 6 (21.4%) | 22 (78.6%) |
| College or Associate's Degree | 29 (78.4%) | 8 (21.6%) |
| Bachelor's Degree | 137 (91.9%) | 12 (8.1%) |
| Graduate Degree | 18 (100.0%) | 0 (0.0%) |
| Total | 190 (81.9%) | 42 (18.1%) |
Income in Rock County
Income Overview in Rock County
Per Capita Income in Rock County is $38,472, while median incomes of families and households are $94,484 and $75,060 respectively.
| Characteristic | Number | Measure |
| Per Capita Income | 9,659 | $38,472 |
| Median Family Income | 2,579 | $94,484 |
| Mean Family Income | 2,579 | $107,414 |
| Median Household Income | 3,923 | $75,060 |
| Mean Household Income | 3,923 | $93,192 |
| Income Deficit | 2,579 | $0 |
| Wage / Income Gap (%) | 9,659 | 24.26% |
| Wage / Income Gap ($) | 9,659 | 75.74¢ per $1 |
| Gini / Inequality Index | 9,659 | 0.44 |
Earnings by Sex in Rock County
Average Earnings in Rock County are $42,079, $46,944 for men and $35,557 for women, a difference of 24.3%.

| Sex | Number | Average Earnings |
| Male | 2,908 (52.4%) | $46,944 |
| Female | 2,643 (47.6%) | $35,557 |
| Total | 5,551 (100.0%) | $42,079 |
Earnings by Sex by Income Bracket in Rock County
The most common earnings brackets in Rock County are $100,000+ for men (394 | 13.6%) and $2,499 or less for women (258 | 9.8%).

| Income | Male | Female |
| $2,499 or less | 182 (6.3%) | 258 (9.8%) |
| $2,500 to $4,999 | 60 (2.1%) | 123 (4.6%) |
| $5,000 to $7,499 | 96 (3.3%) | 72 (2.7%) |
| $7,500 to $9,999 | 51 (1.8%) | 53 (2.0%) |
| $10,000 to $12,499 | 66 (2.3%) | 98 (3.7%) |
| $12,500 to $14,999 | 47 (1.6%) | 32 (1.2%) |
| $15,000 to $17,499 | 85 (2.9%) | 132 (5.0%) |
| $17,500 to $19,999 | 58 (2.0%) | 22 (0.8%) |
| $20,000 to $22,499 | 43 (1.5%) | 171 (6.5%) |
| $22,500 to $24,999 | 111 (3.8%) | 90 (3.4%) |
| $25,000 to $29,999 | 126 (4.3%) | 128 (4.8%) |
| $30,000 to $34,999 | 146 (5.0%) | 120 (4.5%) |
| $35,000 to $39,999 | 67 (2.3%) | 163 (6.2%) |
| $40,000 to $44,999 | 239 (8.2%) | 165 (6.2%) |
| $45,000 to $49,999 | 168 (5.8%) | 113 (4.3%) |
| $50,000 to $54,999 | 192 (6.6%) | 163 (6.2%) |
| $55,000 to $64,999 | 319 (11.0%) | 217 (8.2%) |
| $65,000 to $74,999 | 171 (5.9%) | 195 (7.4%) |
| $75,000 to $99,999 | 287 (9.9%) | 229 (8.7%) |
| $100,000+ | 394 (13.6%) | 99 (3.7%) |
| Total | 2,908 (100.0%) | 2,643 (100.0%) |
Earnings by Sex by Educational Attainment in Rock County
Average earnings in Rock County are $52,568 for men and $41,883 for women, a difference of 20.3%. Men with an educational attainment of graduate degree enjoy the highest average annual earnings of $82,292, while those with less than high school education earn the least with $42,969. Women with an educational attainment of graduate degree earn the most with the average annual earnings of $68,199, while those with less than high school education have the smallest earnings of $22,500.

| Educational Attainment | Male Income | Female Income |
| Less than High School | $42,969 | $22,500 |
| High School Diploma | $46,154 | $25,667 |
| College or Associate's Degree | $49,401 | $36,453 |
| Bachelor's Degree | $63,059 | $51,091 |
| Graduate Degree | $82,292 | $68,199 |
| Total | $52,568 | $41,883 |
Family Income in Rock County
Family Income Brackets in Rock County
According to the Rock County family income data, there are 606 families falling into the $100,000 to $149,999 income range, which is the most common income bracket and makes up 23.5% of all families. Conversely, the $10,000 to $14,999 income bracket is the least frequent group with only 31 families (1.2%) belonging to this category.

| Income Bracket | # Families | % Families |
| Less than $10,000 | 36 | 1.4% |
| $10,000 to $14,999 | 31 | 1.2% |
| $15,000 to $24,999 | 88 | 3.4% |
| $25,000 to $34,999 | 106 | 4.1% |
| $35,000 to $49,999 | 268 | 10.4% |
| $50,000 to $74,999 | 402 | 15.6% |
| $75,000 to $99,999 | 518 | 20.1% |
| $100,000 to $149,999 | 606 | 23.5% |
| $150,000 to $199,999 | 348 | 13.5% |
| $200,000+ | 173 | 6.7% |
Family Income by Famaliy Size in Rock County
5-person families (256 | 9.9%) account for the highest median family income in Rock County with $116,250 per family, while 2-person families (1,492 | 57.9%) have the highest median income of $45,092 per family member.

| Income Bracket | # Families | Median Income |
| 2-Person Families | 1,492 (57.9%) | $90,183 |
| 3-Person Families | 340 (13.2%) | $88,750 |
| 4-Person Families | 322 (12.5%) | $96,250 |
| 5-Person Families | 256 (9.9%) | $116,250 |
| 6-Person Families | 120 (4.6%) | $115,625 |
| 7+ Person Families | 49 (1.9%) | $90,313 |
| Total | 2,579 (100.0%) | $94,484 |
Family Income by Number of Earners in Rock County
The median family income in Rock County is $94,484, with families comprising 3+ earners (288) having the highest median family income of $136,667, while families with 1 earner (738) have the lowest median family income of $61,250, accounting for 11.2% and 28.6% of families, respectively.

| Number of Earners | # Families | Median Income |
| No Earners | 242 (9.4%) | $65,278 |
| 1 Earner | 738 (28.6%) | $61,250 |
| 2 Earners | 1,311 (50.8%) | $106,295 |
| 3+ Earners | 288 (11.2%) | $136,667 |
| Total | 2,579 (100.0%) | $94,484 |
Household Income in Rock County
Household Income Brackets in Rock County
With 679 households falling in the category, the $100,000 to $149,999 income range is the most frequent in Rock County, accounting for 17.3% of all households. In contrast, only 141 households (3.6%) fall into the $10,000 to $14,999 income bracket, making it the least populous group.

| Income Bracket | # Households | % Households |
| Less than $10,000 | 173 | 4.4% |
| $10,000 to $14,999 | 141 | 3.6% |
| $15,000 to $24,999 | 314 | 8.0% |
| $25,000 to $34,999 | 310 | 7.9% |
| $35,000 to $49,999 | 384 | 9.8% |
| $50,000 to $74,999 | 636 | 16.2% |
| $75,000 to $99,999 | 655 | 16.7% |
| $100,000 to $149,999 | 679 | 17.3% |
| $150,000 to $199,999 | 373 | 9.5% |
| $200,000+ | 259 | 6.6% |
Household Income by Householder Age in Rock County
The median household income in Rock County is $75,060, with the highest median household income of $96,759 found in the 25 to 44 years age bracket for the primary householder. A total of 1,154 households (29.4%) fall into this category. Meanwhile, the 15 to 24 years age bracket for the primary householder has the lowest median household income of $28,646, with 209 households (5.3%) in this group.

| Income Bracket | # Households | Median Income |
| 15 to 24 Years | 209 (5.3%) | $28,646 |
| 25 to 44 Years | 1,154 (29.4%) | $96,759 |
| 45 to 64 Years | 1,406 (35.8%) | $87,500 |
| 65+ Years | 1,154 (29.4%) | $47,778 |
| Total | 3,923 (100.0%) | $75,060 |
Poverty in Rock County
Income Below Poverty by Sex and Age in Rock County
With 8.2% poverty level for males and 9.4% for females among the residents of Rock County, 18 to 24 year old males and 6 to 11 year old females are the most vulnerable to poverty, with 58 males (14.8%) and 83 females (19.2%) in their respective age groups living below the poverty level.

| Age Bracket | Male | Female |
| Under 5 Years | 36 (14.3%) | 10 (3.5%) |
| 5 Years | 1 (1.4%) | 1 (2.7%) |
| 6 to 11 Years | 29 (7.4%) | 83 (19.2%) |
| 12 to 14 Years | 15 (7.6%) | 27 (10.0%) |
| 15 Years | 8 (10.7%) | 0 (0.0%) |
| 16 and 17 Years | 18 (11.5%) | 1 (0.6%) |
| 18 to 24 Years | 58 (14.8%) | 58 (16.3%) |
| 25 to 34 Years | 12 (2.3%) | 48 (9.8%) |
| 35 to 44 Years | 34 (6.2%) | 34 (5.7%) |
| 45 to 54 Years | 50 (9.4%) | 24 (4.5%) |
| 55 to 64 Years | 26 (4.1%) | 75 (11.2%) |
| 65 to 74 Years | 58 (12.0%) | 34 (6.7%) |
| 75 Years and over | 29 (9.7%) | 58 (13.2%) |
| Total | 374 (8.2%) | 453 (9.4%) |
Income Above Poverty by Sex and Age in Rock County
According to the poverty statistics in Rock County, males aged 5 years and females aged 15 years are the age groups that are most secure financially, with 98.6% of males and 100.0% of females in these age groups living above the poverty line.

| Age Bracket | Male | Female |
| Under 5 Years | 216 (85.7%) | 278 (96.5%) |
| 5 Years | 70 (98.6%) | 36 (97.3%) |
| 6 to 11 Years | 365 (92.6%) | 350 (80.8%) |
| 12 to 14 Years | 183 (92.4%) | 243 (90.0%) |
| 15 Years | 67 (89.3%) | 61 (100.0%) |
| 16 and 17 Years | 139 (88.5%) | 152 (99.4%) |
| 18 to 24 Years | 333 (85.2%) | 297 (83.7%) |
| 25 to 34 Years | 516 (97.7%) | 444 (90.2%) |
| 35 to 44 Years | 510 (93.8%) | 568 (94.4%) |
| 45 to 54 Years | 483 (90.6%) | 504 (95.5%) |
| 55 to 64 Years | 616 (96.0%) | 592 (88.8%) |
| 65 to 74 Years | 425 (88.0%) | 475 (93.3%) |
| 75 Years and over | 271 (90.3%) | 383 (86.9%) |
| Total | 4,194 (91.8%) | 4,383 (90.6%) |
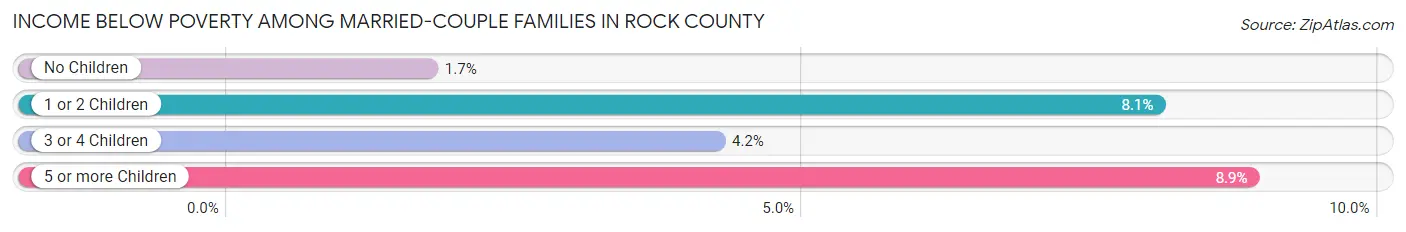
Income Below Poverty Among Married-Couple Families in Rock County
The poverty statistics for married-couple families in Rock County show that 3.6% or 79 of the total 2,165 families live below the poverty line. Families with 5 or more children have the highest poverty rate of 8.9%, comprising of 4 families. On the other hand, families with no children have the lowest poverty rate of 1.7%, which includes 23 families.
| Children | Above Poverty | Below Poverty |
| No Children | 1,296 (98.3%) | 23 (1.7%) |
| 1 or 2 Children | 433 (91.9%) | 38 (8.1%) |
| 3 or 4 Children | 316 (95.8%) | 14 (4.2%) |
| 5 or more Children | 41 (91.1%) | 4 (8.9%) |
| Total | 2,086 (96.4%) | 79 (3.6%) |
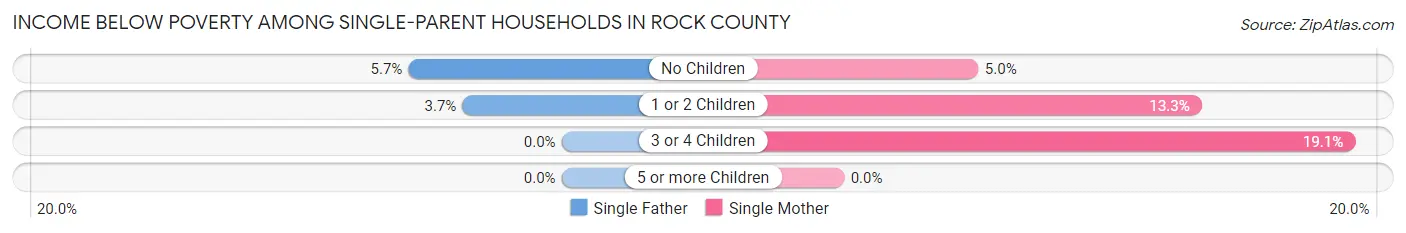
Income Below Poverty Among Single-Parent Households in Rock County
According to the poverty data in Rock County, 4.1% or 3 single-father households and 11.7% or 40 single-mother households are living below the poverty line. Among single-father households, those with no children have the highest poverty rate, with 2 households (5.7%) experiencing poverty. Likewise, among single-mother households, those with 3 or 4 children have the highest poverty rate, with 4 households (19.1%) falling below the poverty line.
| Children | Single Father | Single Mother |
| No Children | 2 (5.7%) | 4 (5.0%) |
| 1 or 2 Children | 1 (3.7%) | 32 (13.3%) |
| 3 or 4 Children | 0 (0.0%) | 4 (19.1%) |
| 5 or more Children | 0 (0.0%) | 0 (0.0%) |
| Total | 3 (4.1%) | 40 (11.7%) |
Income Below Poverty Among Married-Couple vs Single-Parent Households in Rock County
The poverty data for Rock County shows that 79 of the married-couple family households (3.6%) and 43 of the single-parent households (10.4%) are living below the poverty level. Within the married-couple family households, those with 5 or more children have the highest poverty rate, with 4 households (8.9%) falling below the poverty line. Among the single-parent households, those with 3 or 4 children have the highest poverty rate, with 4 household (13.3%) living below poverty.

| Children | Married-Couple Families | Single-Parent Households |
| No Children | 23 (1.7%) | 6 (5.2%) |
| 1 or 2 Children | 38 (8.1%) | 33 (12.4%) |
| 3 or 4 Children | 14 (4.2%) | 4 (13.3%) |
| 5 or more Children | 4 (8.9%) | 0 (0.0%) |
| Total | 79 (3.6%) | 43 (10.4%) |
Employment Characteristics in Rock County
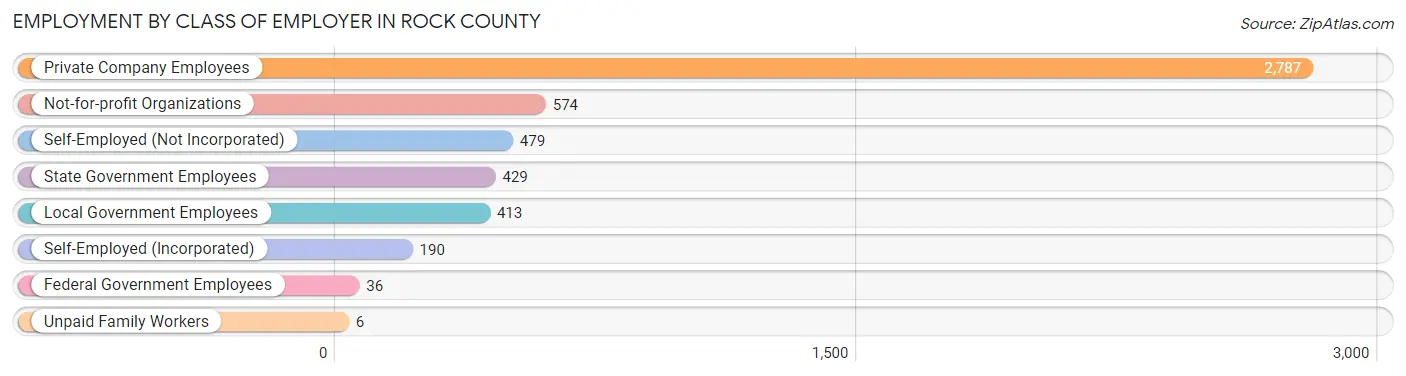
Employment by Class of Employer in Rock County
Among the 4,914 employed individuals in Rock County, private company employees (2,787 | 56.7%), not-for-profit organizations (574 | 11.7%), and self-employed (not incorporated) (479 | 9.8%) make up the most common classes of employment.
| Employer Class | # Employees | % Employees |
| Private Company Employees | 2,787 | 56.7% |
| Self-Employed (Incorporated) | 190 | 3.9% |
| Self-Employed (Not Incorporated) | 479 | 9.8% |
| Not-for-profit Organizations | 574 | 11.7% |
| Local Government Employees | 413 | 8.4% |
| State Government Employees | 429 | 8.7% |
| Federal Government Employees | 36 | 0.7% |
| Unpaid Family Workers | 6 | 0.1% |
| Total | 4,914 | 100.0% |
Employment Status by Age in Rock County
According to the labor force statistics for Rock County, out of the total population over 16 years of age (7,550), 68.2% or 5,149 individuals are in the labor force, with 2.8% or 144 of them unemployed. The age group with the highest labor force participation rate is 25 to 29 years, with 94.7% or 523 individuals in the labor force. Within the labor force, the 16 to 19 years age range has the highest percentage of unemployed individuals, with 7.2% or 25 of them being unemployed.

| Age Bracket | In Labor Force | Unemployed |
| 16 to 19 Years | 346 (61.2%) | 25 (7.2%) |
| 20 to 24 Years | 470 (94.6%) | 0 (0.0%) |
| 25 to 29 Years | 523 (94.7%) | 6 (1.1%) |
| 30 to 34 Years | 411 (87.8%) | 0 (0.0%) |
| 35 to 44 Years | 996 (86.8%) | 14 (1.4%) |
| 45 to 54 Years | 930 (87.4%) | 63 (6.8%) |
| 55 to 59 Years | 557 (81.6%) | 12 (2.2%) |
| 60 to 64 Years | 459 (71.8%) | 22 (4.8%) |
| 65 to 74 Years | 389 (38.4%) | 1 (0.3%) |
| 75 Years and over | 68 (7.4%) | 0 (0.0%) |
| Total | 5,149 (68.2%) | 144 (2.8%) |
Employment Status by Educational Attainment in Rock County
According to labor force statistics for Rock County, 85.1% of individuals (3,875) out of the total population between 25 and 64 years of age (4,553) are in the labor force, with 3.0% or 116 of them being unemployed. The group with the highest labor force participation rate are those with the educational attainment of bachelor's degree or higher, with 91.9% or 1,365 individuals in the labor force. Within the labor force, individuals with less than high school education have the highest percentage of unemployment, with 5.7% or 8 of them being unemployed.

| Educational Attainment | In Labor Force | Unemployed |
| Less than High School | 141 (74.2%) | 11 (5.7%) |
| High School Diploma | 1,047 (81.0%) | 74 (5.7%) |
| College / Associate Degree | 1,323 (83.5%) | 38 (2.4%) |
| Bachelor's Degree or higher | 1,365 (91.9%) | 18 (1.2%) |
| Total | 3,875 (85.1%) | 137 (3.0%) |
Employment Occupations by Sex in Rock County
Management, Business, Science and Arts Occupations
The most common Management, Business, Science and Arts occupations in Rock County are Management (652 | 13.1%), Community & Social Service (538 | 10.8%), Health Diagnosing & Treating (471 | 9.4%), Health Technologists (326 | 6.5%), and Education Instruction & Library (321 | 6.4%).

Management, Business, Science and Arts Occupations by Sex
Within the Management, Business, Science and Arts occupations in Rock County, the most male-oriented occupations are Architecture & Engineering (100.0%), Legal Services & Support (87.9%), and Life, Physical & Social Science (84.6%), while the most female-oriented occupations are Health Diagnosing & Treating (84.1%), Health Technologists (82.5%), and Business & Financial (76.2%).
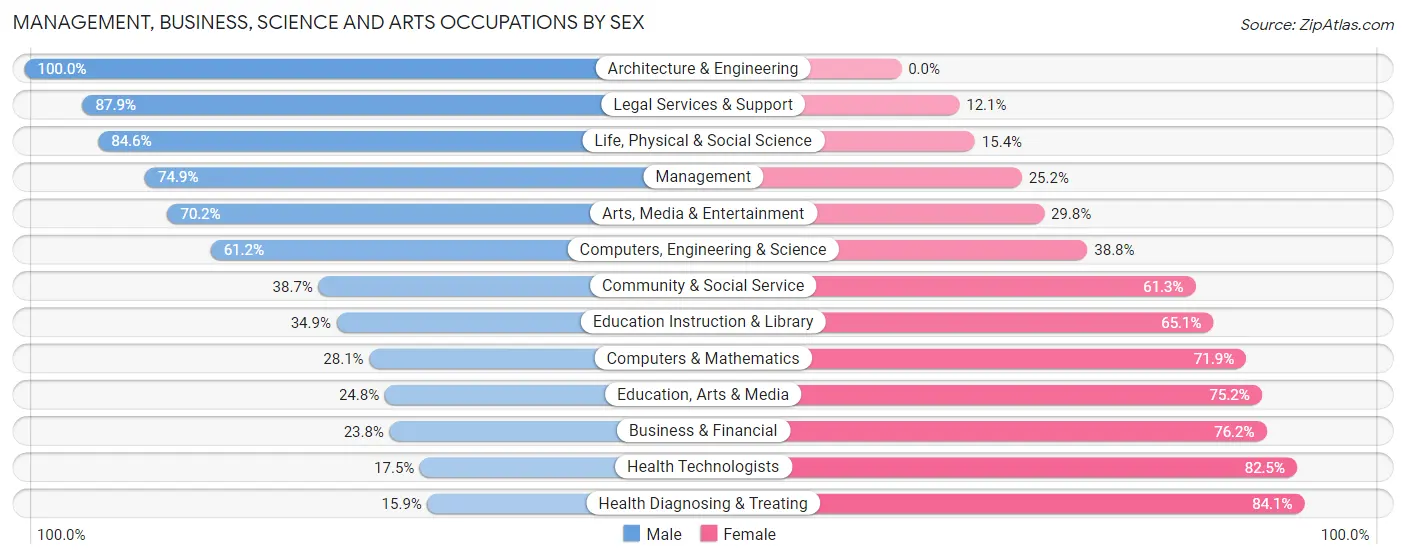
| Occupation | Male | Female |
| Management | 488 (74.9%) | 164 (25.2%) |
| Business & Financial | 72 (23.8%) | 230 (76.2%) |
| Computers, Engineering & Science | 74 (61.2%) | 47 (38.8%) |
| Computers & Mathematics | 16 (28.1%) | 41 (71.9%) |
| Architecture & Engineering | 25 (100.0%) | 0 (0.0%) |
| Life, Physical & Social Science | 33 (84.6%) | 6 (15.4%) |
| Community & Social Service | 208 (38.7%) | 330 (61.3%) |
| Education, Arts & Media | 34 (24.8%) | 103 (75.2%) |
| Legal Services & Support | 29 (87.9%) | 4 (12.1%) |
| Education Instruction & Library | 112 (34.9%) | 209 (65.1%) |
| Arts, Media & Entertainment | 33 (70.2%) | 14 (29.8%) |
| Health Diagnosing & Treating | 75 (15.9%) | 396 (84.1%) |
| Health Technologists | 57 (17.5%) | 269 (82.5%) |
| Total (Category) | 917 (44.0%) | 1,167 (56.0%) |
| Total (Overall) | 2,639 (52.8%) | 2,358 (47.2%) |
Services Occupations
The most common Services occupations in Rock County are Food Preparation & Serving (351 | 7.0%), Cleaning & Maintenance (264 | 5.3%), Healthcare Support (223 | 4.5%), Personal Care & Service (126 | 2.5%), and Security & Protection (72 | 1.4%).

Services Occupations by Sex
Within the Services occupations in Rock County, the most male-oriented occupations are Cleaning & Maintenance (72.0%), Firefighting & Prevention (52.9%), and Security & Protection (25.0%), while the most female-oriented occupations are Healthcare Support (87.0%), Law Enforcement (83.6%), and Personal Care & Service (80.9%).

| Occupation | Male | Female |
| Healthcare Support | 29 (13.0%) | 194 (87.0%) |
| Security & Protection | 18 (25.0%) | 54 (75.0%) |
| Firefighting & Prevention | 9 (52.9%) | 8 (47.1%) |
| Law Enforcement | 9 (16.4%) | 46 (83.6%) |
| Food Preparation & Serving | 84 (23.9%) | 267 (76.1%) |
| Cleaning & Maintenance | 190 (72.0%) | 74 (28.0%) |
| Personal Care & Service | 24 (19.1%) | 102 (80.9%) |
| Total (Category) | 345 (33.3%) | 691 (66.7%) |
| Total (Overall) | 2,639 (52.8%) | 2,358 (47.2%) |
Sales and Office Occupations
The most common Sales and Office occupations in Rock County are Office & Administration (475 | 9.5%), and Sales & Related (247 | 4.9%).

Sales and Office Occupations by Sex

| Occupation | Male | Female |
| Sales & Related | 161 (65.2%) | 86 (34.8%) |
| Office & Administration | 147 (30.9%) | 328 (69.1%) |
| Total (Category) | 308 (42.7%) | 414 (57.3%) |
| Total (Overall) | 2,639 (52.8%) | 2,358 (47.2%) |
Natural Resources, Construction and Maintenance Occupations
The most common Natural Resources, Construction and Maintenance occupations in Rock County are Construction & Extraction (176 | 3.5%), Installation, Maintenance & Repair (171 | 3.4%), and Farming, Fishing & Forestry (85 | 1.7%).

Natural Resources, Construction and Maintenance Occupations by Sex

| Occupation | Male | Female |
| Farming, Fishing & Forestry | 75 (88.2%) | 10 (11.8%) |
| Construction & Extraction | 176 (100.0%) | 0 (0.0%) |
| Installation, Maintenance & Repair | 169 (98.8%) | 2 (1.2%) |
| Total (Category) | 420 (97.2%) | 12 (2.8%) |
| Total (Overall) | 2,639 (52.8%) | 2,358 (47.2%) |
Production, Transportation and Moving Occupations
The most common Production, Transportation and Moving occupations in Rock County are Transportation (294 | 5.9%), Production (287 | 5.7%), and Material Moving (142 | 2.8%).

Production, Transportation and Moving Occupations by Sex

| Occupation | Male | Female |
| Production | 241 (84.0%) | 46 (16.0%) |
| Transportation | 284 (96.6%) | 10 (3.4%) |
| Material Moving | 124 (87.3%) | 18 (12.7%) |
| Total (Category) | 649 (89.8%) | 74 (10.2%) |
| Total (Overall) | 2,639 (52.8%) | 2,358 (47.2%) |
Employment Industries by Sex in Rock County
Employment Industries in Rock County
The major employment industries in Rock County include Health Care & Social Assistance (1,027 | 20.5%), Educational Services (530 | 10.6%), Agriculture, Fishing & Hunting (462 | 9.2%), Retail Trade (415 | 8.3%), and Accommodation & Food Services (368 | 7.4%).

Employment Industries by Sex in Rock County
The Rock County industries that see more men than women are Utilities (100.0%), Construction (96.3%), and Transportation & Warehousing (93.0%), whereas the industries that tend to have a higher number of women are Enterprise Management (100.0%), Health Care & Social Assistance (83.1%), and Real Estate, Rental & Leasing (75.0%).

| Industry | Male | Female |
| Agriculture, Fishing & Hunting | 412 (89.2%) | 50 (10.8%) |
| Mining, Quarrying, & Extraction | 14 (87.5%) | 2 (12.5%) |
| Construction | 286 (96.3%) | 11 (3.7%) |
| Manufacturing | 292 (81.3%) | 67 (18.7%) |
| Wholesale Trade | 98 (68.5%) | 45 (31.5%) |
| Retail Trade | 298 (71.8%) | 117 (28.2%) |
| Transportation & Warehousing | 213 (93.0%) | 16 (7.0%) |
| Utilities | 78 (100.0%) | 0 (0.0%) |
| Information | 14 (70.0%) | 6 (30.0%) |
| Finance & Insurance | 116 (37.2%) | 196 (62.8%) |
| Real Estate, Rental & Leasing | 7 (25.0%) | 21 (75.0%) |
| Professional & Scientific | 77 (38.3%) | 124 (61.7%) |
| Enterprise Management | 0 (0.0%) | 6 (100.0%) |
| Administrative & Support | 83 (92.2%) | 7 (7.8%) |
| Educational Services | 159 (30.0%) | 371 (70.0%) |
| Health Care & Social Assistance | 174 (16.9%) | 853 (83.1%) |
| Arts, Entertainment & Recreation | 14 (31.1%) | 31 (68.9%) |
| Accommodation & Food Services | 138 (37.5%) | 230 (62.5%) |
| Public Administration | 44 (25.6%) | 128 (74.4%) |
| Total | 2,639 (52.8%) | 2,358 (47.2%) |
Education in Rock County
School Enrollment in Rock County
The most common levels of schooling among the 2,408 students in Rock County are high school (603 | 25.0%), middle school (590 | 24.5%), and elementary school (553 | 23.0%).

| School Level | # Students | % Students |
| Nursery / Preschool | 124 | 5.1% |
| Kindergarten | 99 | 4.1% |
| Elementary School | 553 | 23.0% |
| Middle School | 590 | 24.5% |
| High School | 603 | 25.0% |
| College / Undergraduate | 397 | 16.5% |
| Graduate / Professional | 42 | 1.7% |
| Total | 2,408 | 100.0% |
School Enrollment by Age by Funding Source in Rock County
Out of a total of 2,408 students who are enrolled in schools in Rock County, 255 (10.6%) attend a private institution, while the remaining 2,153 (89.4%) are enrolled in public schools. The age group of 3 to 4 year olds has the highest likelihood of being enrolled in private schools, with 17 (28.3% in the age bracket) enrolled. Conversely, the age group of 20 to 24 year olds has the lowest likelihood of being enrolled in a private school, with 214 (99.5% in the age bracket) attending a public institution.

| Age Bracket | Public School | Private School |
| 3 to 4 Year Olds | 43 (71.7%) | 17 (28.3%) |
| 5 to 9 Year Old | 567 (88.3%) | 75 (11.7%) |
| 10 to 14 Year Olds | 635 (89.1%) | 78 (10.9%) |
| 15 to 17 Year Olds | 380 (93.4%) | 27 (6.6%) |
| 18 to 19 Year Olds | 144 (80.9%) | 34 (19.1%) |
| 20 to 24 Year Olds | 214 (99.5%) | 1 (0.5%) |
| 25 to 34 Year Olds | 69 (94.5%) | 4 (5.5%) |
| 35 Years and over | 100 (83.3%) | 20 (16.7%) |
| Total | 2,153 (89.4%) | 255 (10.6%) |
Educational Attainment by Field of Study in Rock County
Education (435 | 22.7%), business (302 | 15.8%), bio, nature & agricultural (217 | 11.3%), science & technology (188 | 9.8%), and arts & humanities (136 | 7.1%) are the most common fields of study among 1,918 individuals in Rock County who have obtained a bachelor's degree or higher.

| Field of Study | # Graduates | % Graduates |
| Computers & Mathematics | 111 | 5.8% |
| Bio, Nature & Agricultural | 217 | 11.3% |
| Physical & Health Sciences | 8 | 0.4% |
| Psychology | 102 | 5.3% |
| Social Sciences | 127 | 6.6% |
| Engineering | 22 | 1.1% |
| Multidisciplinary Studies | 7 | 0.4% |
| Science & Technology | 188 | 9.8% |
| Business | 302 | 15.8% |
| Education | 435 | 22.7% |
| Literature & Languages | 103 | 5.4% |
| Liberal Arts & History | 79 | 4.1% |
| Visual & Performing Arts | 56 | 2.9% |
| Communications | 25 | 1.3% |
| Arts & Humanities | 136 | 7.1% |
| Total | 1,918 | 100.0% |
Transportation & Commute in Rock County
Vehicle Availability by Sex in Rock County
The most prevalent vehicle ownership categories in Rock County are males with 2 vehicles (1,002, accounting for 38.8%) and females with 2 vehicles (850, making up 43.4%).

| Vehicles Available | Male | Female |
| No Vehicle | 19 (0.7%) | 47 (2.0%) |
| 1 Vehicle | 264 (10.2%) | 335 (14.5%) |
| 2 Vehicles | 1,002 (38.8%) | 850 (36.8%) |
| 3 Vehicles | 599 (23.2%) | 530 (23.0%) |
| 4 Vehicles | 419 (16.2%) | 343 (14.9%) |
| 5 or more Vehicles | 279 (10.8%) | 203 (8.8%) |
| Total | 2,582 (100.0%) | 2,308 (100.0%) |
Commute Time in Rock County
The most frequently occuring commute durations in Rock County are 5 to 9 minutes (1,253 commuters, 28.3%), 30 to 34 minutes (613 commuters, 13.9%), and less than 5 minutes (515 commuters, 11.7%).

| Commute Time | # Commuters | % Commuters |
| Less than 5 Minutes | 515 | 11.7% |
| 5 to 9 Minutes | 1,253 | 28.3% |
| 10 to 14 Minutes | 386 | 8.7% |
| 15 to 19 Minutes | 389 | 8.8% |
| 20 to 24 Minutes | 377 | 8.5% |
| 25 to 29 Minutes | 203 | 4.6% |
| 30 to 34 Minutes | 613 | 13.9% |
| 35 to 39 Minutes | 173 | 3.9% |
| 40 to 44 Minutes | 218 | 4.9% |
| 45 to 59 Minutes | 229 | 5.2% |
| 60 to 89 Minutes | 42 | 0.9% |
| 90 or more Minutes | 22 | 0.5% |
Commute Time by Sex in Rock County
The most common commute times in Rock County are 5 to 9 minutes (656 commuters, 28.0%) for males and 5 to 9 minutes (597 commuters, 28.7%) for females.

| Commute Time | Male | Female |
| Less than 5 Minutes | 342 (14.6%) | 173 (8.3%) |
| 5 to 9 Minutes | 656 (28.0%) | 597 (28.7%) |
| 10 to 14 Minutes | 226 (9.7%) | 160 (7.7%) |
| 15 to 19 Minutes | 211 (9.0%) | 178 (8.6%) |
| 20 to 24 Minutes | 204 (8.7%) | 173 (8.3%) |
| 25 to 29 Minutes | 95 (4.1%) | 108 (5.2%) |
| 30 to 34 Minutes | 277 (11.8%) | 336 (16.2%) |
| 35 to 39 Minutes | 81 (3.5%) | 92 (4.4%) |
| 40 to 44 Minutes | 96 (4.1%) | 122 (5.9%) |
| 45 to 59 Minutes | 123 (5.2%) | 106 (5.1%) |
| 60 to 89 Minutes | 18 (0.8%) | 24 (1.2%) |
| 90 or more Minutes | 14 (0.6%) | 8 (0.4%) |
Time of Departure to Work by Sex in Rock County
The most frequent times of departure to work in Rock County are 7:00 AM to 7:29 AM (606, 25.9%) for males and 7:00 AM to 7:29 AM (541, 26.1%) for females.

| Time of Departure | Male | Female |
| 12:00 AM to 4:59 AM | 84 (3.6%) | 26 (1.3%) |
| 5:00 AM to 5:29 AM | 99 (4.2%) | 26 (1.3%) |
| 5:30 AM to 5:59 AM | 138 (5.9%) | 90 (4.3%) |
| 6:00 AM to 6:29 AM | 109 (4.6%) | 161 (7.7%) |
| 6:30 AM to 6:59 AM | 263 (11.2%) | 164 (7.9%) |
| 7:00 AM to 7:29 AM | 606 (25.9%) | 541 (26.1%) |
| 7:30 AM to 7:59 AM | 403 (17.2%) | 445 (21.4%) |
| 8:00 AM to 8:29 AM | 215 (9.2%) | 112 (5.4%) |
| 8:30 AM to 8:59 AM | 39 (1.7%) | 66 (3.2%) |
| 9:00 AM to 9:59 AM | 61 (2.6%) | 112 (5.4%) |
| 10:00 AM to 10:59 AM | 65 (2.8%) | 51 (2.5%) |
| 11:00 AM to 11:59 AM | 22 (0.9%) | 33 (1.6%) |
| 12:00 PM to 3:59 PM | 149 (6.4%) | 141 (6.8%) |
| 4:00 PM to 11:59 PM | 90 (3.8%) | 109 (5.2%) |
| Total | 2,343 (100.0%) | 2,077 (100.0%) |
Housing Occupancy in Rock County
Occupancy by Ownership in Rock County
Of the total 3,923 dwellings in Rock County, owner-occupied units account for 3,025 (77.1%), while renter-occupied units make up 898 (22.9%).

| Occupancy | # Housing Units | % Housing Units |
| Owner Occupied Housing Units | 3,025 | 77.1% |
| Renter-Occupied Housing Units | 898 | 22.9% |
| Total Occupied Housing Units | 3,923 | 100.0% |
Occupancy by Household Size in Rock County

| Household Size | # Housing Units | % Housing Units |
| 1-Person Household | 1,166 | 29.7% |
| 2-Person Household | 1,547 | 39.4% |
| 3-Person Household | 378 | 9.6% |
| 4+ Person Household | 832 | 21.2% |
| Total Housing Units | 3,923 | 100.0% |
Occupancy by Ownership by Household Size in Rock County

| Household Size | Owner-occupied | Renter-occupied |
| 1-Person Household | 701 (60.1%) | 465 (39.9%) |
| 2-Person Household | 1,341 (86.7%) | 206 (13.3%) |
| 3-Person Household | 271 (71.7%) | 107 (28.3%) |
| 4+ Person Household | 712 (85.6%) | 120 (14.4%) |
| Total Housing Units | 3,025 (77.1%) | 898 (22.9%) |
Occupancy by Educational Attainment in Rock County

| Household Size | Owner-occupied | Renter-occupied |
| Less than High School | 138 (54.8%) | 114 (45.2%) |
| High School Diploma | 950 (74.3%) | 328 (25.7%) |
| College/Associate Degree | 965 (73.2%) | 354 (26.8%) |
| Bachelor's Degree or higher | 972 (90.5%) | 102 (9.5%) |
Occupancy by Age of Householder in Rock County

| Age Bracket | # Households | % Households |
| Under 35 Years | 693 | 17.7% |
| 35 to 44 Years | 670 | 17.1% |
| 45 to 54 Years | 660 | 16.8% |
| 55 to 64 Years | 746 | 19.0% |
| 65 to 74 Years | 635 | 16.2% |
| 75 to 84 Years | 359 | 9.1% |
| 85 Years and Over | 160 | 4.1% |
| Total | 3,923 | 100.0% |
Housing Finances in Rock County
Median Income by Occupancy in Rock County

| Occupancy Type | # Households | Median Income |
| Owner-Occupied | 3,025 (77.1%) | $89,947 |
| Renter-Occupied | 898 (22.9%) | $36,714 |
| Average | 3,923 (100.0%) | $75,060 |
Occupancy by Householder Income Bracket in Rock County

| Income Bracket | Owner-occupied | Renter-occupied |
| Less than $5,000 | 63 (2.1%) | 57 (6.4%) |
| $5,000 to $9,999 | 44 (1.5%) | 9 (1.0%) |
| $10,000 to $14,999 | 58 (1.9%) | 85 (9.5%) |
| $15,000 to $19,999 | 84 (2.8%) | 79 (8.8%) |
| $20,000 to $24,999 | 85 (2.8%) | 65 (7.2%) |
| $25,000 to $34,999 | 181 (6.0%) | 130 (14.5%) |
| $35,000 to $49,999 | 243 (8.0%) | 142 (15.8%) |
| $50,000 to $74,999 | 485 (16.0%) | 150 (16.7%) |
| $75,000 to $99,999 | 593 (19.6%) | 62 (6.9%) |
| $100,000 to $149,999 | 607 (20.1%) | 73 (8.1%) |
| $150,000 or more | 582 (19.2%) | 46 (5.1%) |
| Total | 3,025 (100.0%) | 898 (100.0%) |
Monthly Housing Cost Tiers in Rock County

| Monthly Cost | Owner-occupied | Renter-occupied |
| Less than $300 | 178 (5.9%) | 56 (6.2%) |
| $300 to $499 | 399 (13.2%) | 130 (14.5%) |
| $500 to $799 | 798 (26.4%) | 237 (26.4%) |
| $800 to $999 | 336 (11.1%) | 145 (16.2%) |
| $1,000 to $1,499 | 617 (20.4%) | 184 (20.5%) |
| $1,500 to $1,999 | 362 (12.0%) | 59 (6.6%) |
| $2,000 to $2,499 | 179 (5.9%) | 9 (1.0%) |
| $2,500 to $2,999 | 90 (3.0%) | 5 (0.6%) |
| $3,000 or more | 66 (2.2%) | 12 (1.3%) |
| Total | 3,025 (100.0%) | 898 (100.0%) |
Physical Housing Characteristics in Rock County
Housing Structures in Rock County

| Structure Type | # Housing Units | % Housing Units |
| Single Unit, Detached | 3,394 | 86.5% |
| Single Unit, Attached | 103 | 2.6% |
| 2 Unit Apartments | 51 | 1.3% |
| 3 or 4 Unit Apartments | 42 | 1.1% |
| 5 to 9 Unit Apartments | 59 | 1.5% |
| 10 or more Apartments | 236 | 6.0% |
| Mobile Home / Other | 38 | 1.0% |
| Total | 3,923 | 100.0% |
Housing Structures by Occupancy in Rock County

| Structure Type | Owner-occupied | Renter-occupied |
| Single Unit, Detached | 2,935 (86.5%) | 459 (13.5%) |
| Single Unit, Attached | 59 (57.3%) | 44 (42.7%) |
| 2 Unit Apartments | 4 (7.8%) | 47 (92.2%) |
| 3 or 4 Unit Apartments | 3 (7.1%) | 39 (92.9%) |
| 5 to 9 Unit Apartments | 0 (0.0%) | 59 (100.0%) |
| 10 or more Apartments | 0 (0.0%) | 236 (100.0%) |
| Mobile Home / Other | 24 (63.2%) | 14 (36.8%) |
| Total | 3,025 (77.1%) | 898 (22.9%) |
Housing Structures by Number of Rooms in Rock County

| Number of Rooms | Owner-occupied | Renter-occupied |
| 1 Room | 0 (0.0%) | 2 (0.2%) |
| 2 or 3 Rooms | 34 (1.1%) | 227 (25.3%) |
| 4 or 5 Rooms | 569 (18.8%) | 318 (35.4%) |
| 6 or 7 Rooms | 1,068 (35.3%) | 242 (27.0%) |
| 8 or more Rooms | 1,354 (44.8%) | 109 (12.1%) |
| Total | 3,025 (100.0%) | 898 (100.0%) |
Housing Structure by Heating Type in Rock County

| Heating Type | Owner-occupied | Renter-occupied |
| Utility Gas | 1,334 (44.1%) | 221 (24.6%) |
| Bottled, Tank, or LP Gas | 935 (30.9%) | 226 (25.2%) |
| Electricity | 514 (17.0%) | 395 (44.0%) |
| Fuel Oil or Kerosene | 88 (2.9%) | 7 (0.8%) |
| Coal or Coke | 0 (0.0%) | 0 (0.0%) |
| All other Fuels | 81 (2.7%) | 21 (2.3%) |
| No Fuel Used | 73 (2.4%) | 28 (3.1%) |
| Total | 3,025 (100.0%) | 898 (100.0%) |
Household Vehicle Usage in Rock County

| Vehicles per Household | Owner-occupied | Renter-occupied |
| No Vehicle | 81 (2.7%) | 160 (17.8%) |
| 1 Vehicle | 414 (13.7%) | 350 (39.0%) |
| 2 Vehicles | 1,371 (45.3%) | 190 (21.2%) |
| 3 or more Vehicles | 1,159 (38.3%) | 198 (22.1%) |
| Total | 3,025 (100.0%) | 898 (100.0%) |
Real Estate & Mortgages in Rock County
Real Estate and Mortgage Overview in Rock County
| Characteristic | Without Mortgage | With Mortgage |
| Housing Units | 1,359 | 1,666 |
| Median Property Value | $183,700 | $193,600 |
| Median Household Income | $67,853 | $347 |
| Monthly Housing Costs | $534 | $64 |
| Real Estate Taxes | $1,355 | $7 |
Property Value by Mortgage Status in Rock County

| Property Value | Without Mortgage | With Mortgage |
| Less than $50,000 | 149 (11.0%) | 31 (1.9%) |
| $50,000 to $99,999 | 152 (11.2%) | 156 (9.4%) |
| $100,000 to $299,999 | 762 (56.1%) | 1,128 (67.7%) |
| $300,000 to $499,999 | 220 (16.2%) | 261 (15.7%) |
| $500,000 to $749,999 | 41 (3.0%) | 74 (4.4%) |
| $750,000 to $999,999 | 21 (1.5%) | 14 (0.8%) |
| $1,000,000 or more | 14 (1.0%) | 2 (0.1%) |
| Total | 1,359 (100.0%) | 1,666 (100.0%) |
Household Income by Mortgage Status in Rock County

| Household Income | Without Mortgage | With Mortgage |
| Less than $10,000 | 76 (5.6%) | 6 (0.4%) |
| $10,000 to $24,999 | 137 (10.1%) | 31 (1.9%) |
| $25,000 to $34,999 | 144 (10.6%) | 90 (5.4%) |
| $35,000 to $49,999 | 163 (12.0%) | 37 (2.2%) |
| $50,000 to $74,999 | 225 (16.6%) | 80 (4.8%) |
| $75,000 to $99,999 | 199 (14.6%) | 260 (15.6%) |
| $100,000 to $149,999 | 180 (13.3%) | 394 (23.6%) |
| $150,000 or more | 235 (17.3%) | 427 (25.6%) |
| Total | 1,359 (100.0%) | 1,666 (100.0%) |
Property Value to Household Income Ratio in Rock County

| Value-to-Income Ratio | Without Mortgage | With Mortgage |
| Less than 2.0x | 516 (38.0%) | 96,630 (5,800.1%) |
| 2.0x to 2.9x | 216 (15.9%) | 838 (50.3%) |
| 3.0x to 3.9x | 221 (16.3%) | 417 (25.0%) |
| 4.0x or more | 397 (29.2%) | 150 (9.0%) |
| Total | 1,359 (100.0%) | 1,666 (100.0%) |
Real Estate Taxes by Mortgage Status in Rock County

| Property Taxes | Without Mortgage | With Mortgage |
| Less than $800 | 368 (27.1%) | 11 (0.7%) |
| $800 to $1,499 | 391 (28.8%) | 438 (26.3%) |
| $800 to $1,499 | 590 (43.4%) | 571 (34.3%) |
| Total | 1,359 (100.0%) | 1,666 (100.0%) |
Health & Disability in Rock County
Health Insurance Coverage by Age in Rock County

| Age Bracket | With Coverage | Without Coverage |
| Under 6 Years | 631 (97.4%) | 17 (2.6%) |
| 6 to 18 Years | 1,887 (97.1%) | 56 (2.9%) |
| 19 to 25 Years | 592 (93.2%) | 43 (6.8%) |
| 26 to 34 Years | 925 (97.2%) | 27 (2.8%) |
| 35 to 44 Years | 1,051 (92.1%) | 90 (7.9%) |
| 45 to 54 Years | 1,002 (94.4%) | 59 (5.6%) |
| 55 to 64 Years | 1,206 (92.1%) | 103 (7.9%) |
| 65 to 74 Years | 992 (100.0%) | 0 (0.0%) |
| 75 Years and older | 741 (100.0%) | 0 (0.0%) |
| Total | 9,027 (95.8%) | 395 (4.2%) |
Health Insurance Coverage by Citizenship Status in Rock County

| Citizenship Status | With Coverage | Without Coverage |
| Native Born | 631 (97.4%) | 17 (2.6%) |
| Foreign Born, Citizen | 1,887 (97.1%) | 56 (2.9%) |
| Foreign Born, not a Citizen | 592 (93.2%) | 43 (6.8%) |
Health Insurance Coverage by Household Income in Rock County

| Household Income | With Coverage | Without Coverage |
| Under $25,000 | 884 (96.5%) | 32 (3.5%) |
| $25,000 to $49,999 | 1,297 (92.2%) | 109 (7.7%) |
| $50,000 to $74,999 | 1,256 (91.1%) | 123 (8.9%) |
| $75,000 to $99,999 | 1,869 (97.5%) | 48 (2.5%) |
| $100,000 and over | 3,673 (97.8%) | 83 (2.2%) |
Public vs Private Health Insurance Coverage by Age in Rock County

| Age Bracket | Public Insurance | Private Insurance |
| Under 6 | 196 (30.2%) | 483 (74.5%) |
| 6 to 18 Years | 672 (34.6%) | 1,377 (70.9%) |
| 19 to 25 Years | 98 (15.4%) | 524 (82.5%) |
| 25 to 34 Years | 172 (18.1%) | 771 (81.0%) |
| 35 to 44 Years | 224 (19.6%) | 917 (80.4%) |
| 45 to 54 Years | 171 (16.1%) | 857 (80.8%) |
| 55 to 64 Years | 167 (12.8%) | 1,062 (81.1%) |
| 65 to 74 Years | 977 (98.5%) | 693 (69.9%) |
| 75 Years and over | 741 (100.0%) | 450 (60.7%) |
| Total | 3,418 (36.3%) | 7,134 (75.7%) |
Disability Status by Sex by Age in Rock County

| Age Bracket | Male | Female |
| Under 5 Years | 0 (0.0%) | 0 (0.0%) |
| 5 to 17 Years | 82 (9.1%) | 58 (6.0%) |
| 18 to 34 Years | 33 (3.6%) | 61 (7.2%) |
| 35 to 64 Years | 117 (6.8%) | 220 (12.2%) |
| 65 to 74 Years | 110 (22.8%) | 102 (20.0%) |
| 75 Years and over | 149 (49.7%) | 179 (40.6%) |
Disability Class by Sex by Age in Rock County
Disability Class: Hearing Difficulty

| Age Bracket | Male | Female |
| Under 5 Years | 0 (0.0%) | 0 (0.0%) |
| 5 to 17 Years | 0 (0.0%) | 16 (1.7%) |
| 18 to 34 Years | 12 (1.3%) | 21 (2.5%) |
| 35 to 64 Years | 34 (2.0%) | 21 (1.2%) |
| 65 to 74 Years | 79 (16.4%) | 51 (10.0%) |
| 75 Years and over | 97 (32.3%) | 70 (15.9%) |
Disability Class: Vision Difficulty
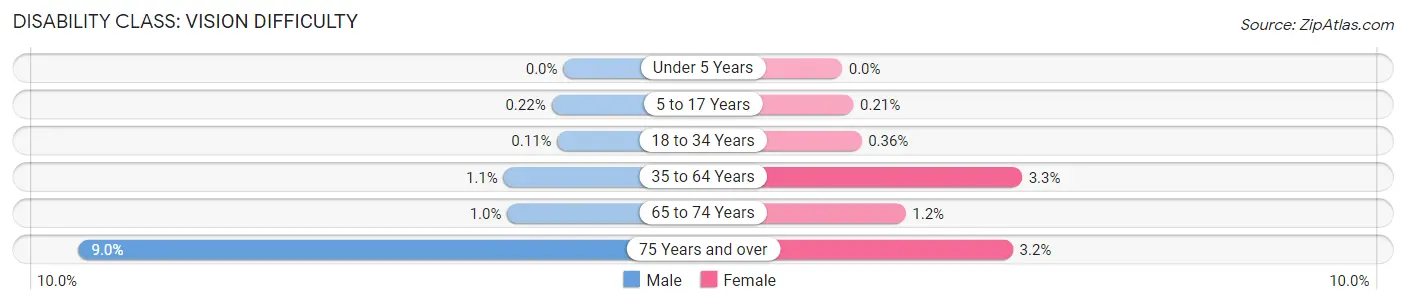
| Age Bracket | Male | Female |
| Under 5 Years | 0 (0.0%) | 0 (0.0%) |
| 5 to 17 Years | 2 (0.2%) | 2 (0.2%) |
| 18 to 34 Years | 1 (0.1%) | 3 (0.4%) |
| 35 to 64 Years | 19 (1.1%) | 60 (3.3%) |
| 65 to 74 Years | 5 (1.0%) | 6 (1.2%) |
| 75 Years and over | 27 (9.0%) | 14 (3.2%) |
Disability Class: Cognitive Difficulty

| Age Bracket | Male | Female |
| 5 to 17 Years | 54 (6.0%) | 36 (3.7%) |
| 18 to 34 Years | 16 (1.7%) | 37 (4.4%) |
| 35 to 64 Years | 29 (1.7%) | 140 (7.8%) |
| 65 to 74 Years | 9 (1.9%) | 11 (2.2%) |
| 75 Years and over | 22 (7.3%) | 67 (15.2%) |
Disability Class: Ambulatory Difficulty

| Age Bracket | Male | Female |
| 5 to 17 Years | 0 (0.0%) | 14 (1.4%) |
| 18 to 34 Years | 12 (1.3%) | 6 (0.7%) |
| 35 to 64 Years | 67 (3.9%) | 96 (5.3%) |
| 65 to 74 Years | 43 (8.9%) | 39 (7.7%) |
| 75 Years and over | 76 (25.3%) | 151 (34.2%) |
Disability Class: Self-Care Difficulty

| Age Bracket | Male | Female |
| 5 to 17 Years | 27 (3.0%) | 28 (2.9%) |
| 18 to 34 Years | 1 (0.1%) | 8 (0.9%) |
| 35 to 64 Years | 20 (1.2%) | 53 (2.9%) |
| 65 to 74 Years | 7 (1.5%) | 16 (3.1%) |
| 75 Years and over | 19 (6.3%) | 31 (7.0%) |
Technology Access in Rock County
Computing Device Access in Rock County

| Device Type | # Households | % Households |
| Desktop or Laptop | 3,036 | 77.4% |
| Smartphone | 3,381 | 86.2% |
| Tablet | 2,422 | 61.7% |
| No Computing Device | 255 | 6.5% |
| Total | 3,923 | 100.0% |
Internet Access in Rock County

| Internet Type | # Households | % Households |
| Dial-Up Internet | 2 | 0.1% |
| Broadband Home | 2,996 | 76.4% |
| Cellular Data Only | 303 | 7.7% |
| Satellite Internet | 232 | 5.9% |
| No Internet | 463 | 11.8% |
| Total | 3,923 | 100.0% |
Rock County Summary
Rock County is a county located in the southwestern corner of the U.S. state of Minnesota. As of the 2010 census, the population was 9,687. Its county seat is Luverne.
History
Rock County was established in 1857 and was named for the rocky terrain of the area. The county was originally part of the Dakota Territory, and was later part of the Minnesota Territory. The first settlers arrived in the area in 1856.
Geography
Rock County is located in the southwestern corner of Minnesota. It is bordered by Pipestone County to the north, Nobles County to the east, Lyon County to the south, and South Dakota to the west. The county has a total area of 576 square miles, of which 575 square miles is land and 1.2 square miles (0.2%) is water.
The county is mostly flat, with some rolling hills in the northern part of the county. The Rock River flows through the county, and there are several small lakes and ponds scattered throughout the county.
Economy
The economy of Rock County is largely based on agriculture. The county is home to several large farms, and the main crops grown in the county are corn, soybeans, and wheat. The county also has a large dairy industry, and there are several large dairy farms in the area.
In addition to agriculture, Rock County also has a strong manufacturing sector. The county is home to several large manufacturing companies, including a large food processing plant and a large furniture manufacturer.
Demographics
As of the 2010 census, there were 9,687 people, 3,845 households, and 2,541 families living in Rock County. The population density was 17 people per square mile. The racial makeup of the county was 97.3% White, 0.3% African American, 0.3% Native American, 0.3% Asian, 0.1% Pacific Islander, 0.7% from other races, and 0.9% from two or more races. Hispanic or Latino of any race were 1.7% of the population.
The median income for a household in the county was $45,945, and the median income for a family was $54,945. The per capita income for the county was $21,945. About 8.3% of families and 11.2% of the population were below the poverty line, including 14.2% of those under age 18 and 8.2% of those age 65 or over.
Rock County is a rural county with a strong agricultural base. The county has a strong economy and a diverse population, and is a great place to live and work.
Common Questions
What is the Total Population of Rock County?
Total Population of Rock County is 9,659.
What is the Total Male Population of Rock County?
Total Male Population of Rock County is 4,701.
What is the Total Female Population of Rock County?
Total Female Population of Rock County is 4,958.
What is the Ratio of Males per 100 Females in Rock County?
There are 94.82 Males per 100 Females in Rock County.
What is the Ratio of Females per 100 Males in Rock County?
There are 105.47 Females per 100 Males in Rock County.
What is the Median Population Age in Rock County?
Median Population Age in Rock County is 40.9 Years.
What is the Average Family Size in Rock County
Average Family Size in Rock County is 3.0 People.
What is the Average Household Size in Rock County
Average Household Size in Rock County is 2.4 People.
What is Per Capita Income in Rock County?
Per Capita income in Rock County is $38,472.
What is the Median Family Income in Rock County?
Median Family Income in Rock County is $94,484.
What is the Median Household income in Rock County?
Median Household Income in Rock County is $75,060.
What is Income or Wage Gap in Rock County?
Income or Wage Gap in Rock County is 24.3%.
Women in Rock County earn 75.7 cents for every dollar earned by a man.
What is Inequality or Gini Index in Rock County?
Inequality or Gini Index in Rock County is 0.44.
How Large is the Labor Force in Rock County?
There are 5,149 People in the Labor Forcein in Rock County.
What is the Percentage of People in the Labor Force in Rock County?
68.2% of People are in the Labor Force in Rock County.
What is the Unemployment Rate in Rock County?
Unemployment Rate in Rock County is 2.8%.