Rice County, MN
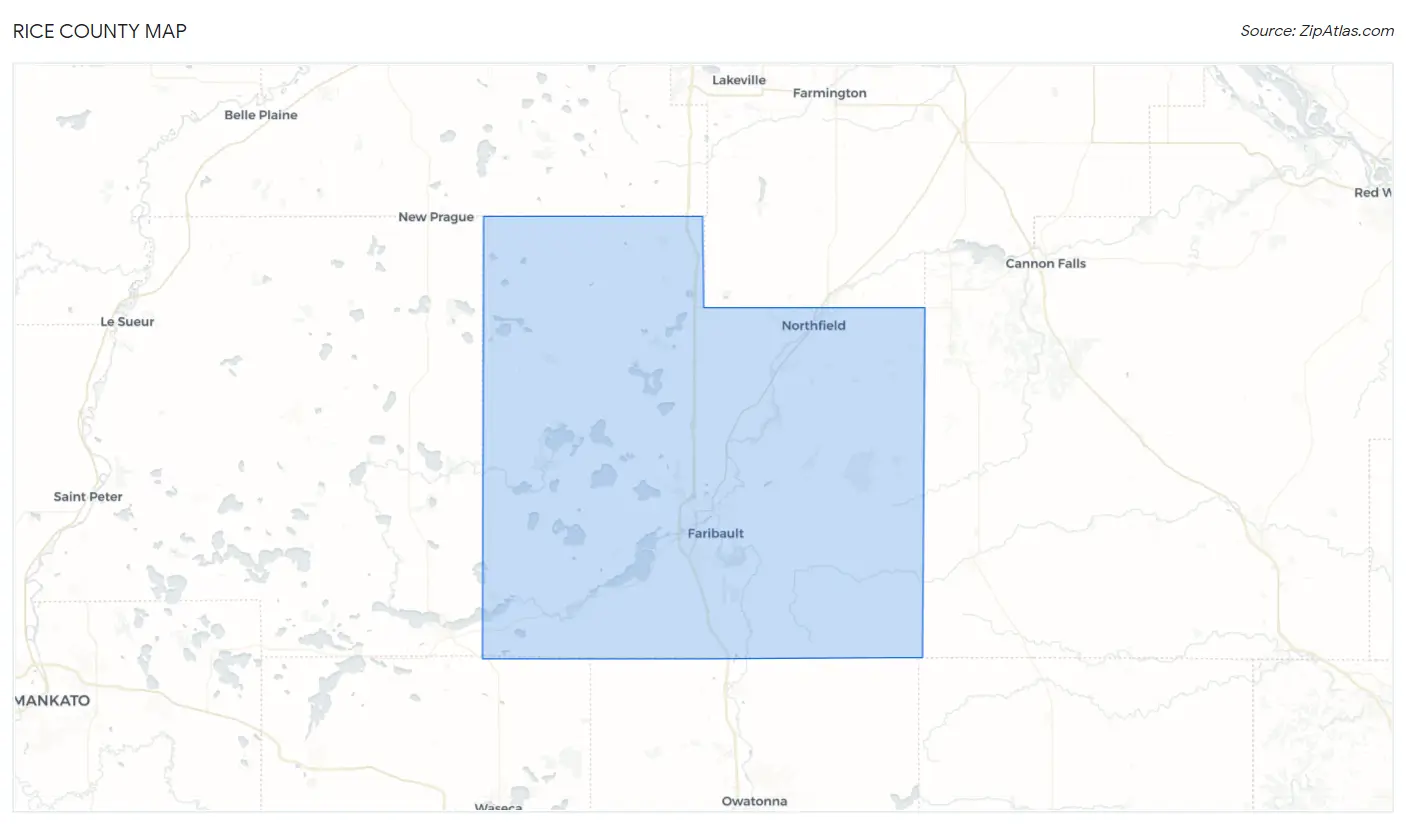
Rice County Map
Rice County Overview
67,152
TOTAL POPULATION
34,493
MALE POPULATION
32,659
FEMALE POPULATION
105.62
MALES / 100 FEMALES
94.68
FEMALES / 100 MALES
37.1
MEDIAN AGE
3.1
AVG FAMILY SIZE
2.5
AVG HOUSEHOLD SIZE
$37,050
PER CAPITA INCOME
$98,475
AVG FAMILY INCOME
$78,214
AVG HOUSEHOLD INCOME
31.0%
WAGE / INCOME GAP [ % ]
69.0¢/ $1
WAGE / INCOME GAP [ $ ]
$9,052
FAMILY INCOME DEFICIT
0.43
INEQUALITY / GINI INDEX
34,943
LABOR FORCE [ PEOPLE ]
64.2%
PERCENT IN LABOR FORCE
5.3%
UNEMPLOYMENT RATE
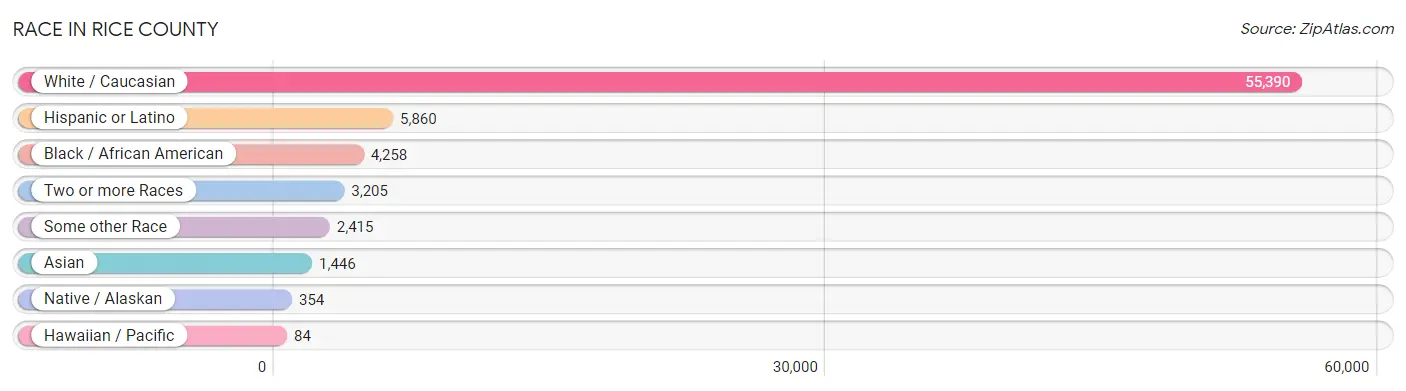
Race in Rice County
The most populous races in Rice County are White / Caucasian (55,390 | 82.5%), Hispanic or Latino (5,860 | 8.7%), and Black / African American (4,258 | 6.3%).
| Race | # Population | % Population |
| Asian | 1,446 | 2.1% |
| Black / African American | 4,258 | 6.3% |
| Hawaiian / Pacific | 84 | 0.1% |
| Hispanic or Latino | 5,860 | 8.7% |
| Native / Alaskan | 354 | 0.5% |
| White / Caucasian | 55,390 | 82.5% |
| Two or more Races | 3,205 | 4.8% |
| Some other Race | 2,415 | 3.6% |
| Total | 67,152 | 100.0% |
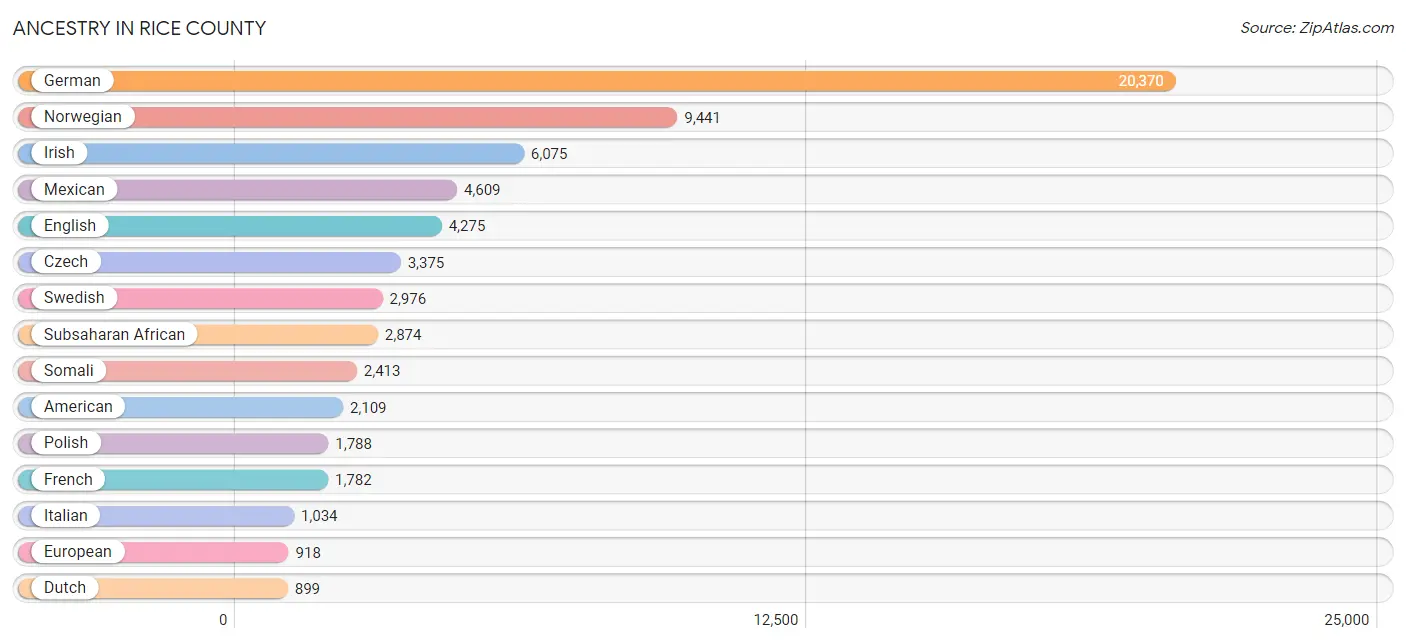
Ancestry in Rice County
The most populous ancestries reported in Rice County are German (20,370 | 30.3%), Norwegian (9,441 | 14.1%), Irish (6,075 | 9.0%), Mexican (4,609 | 6.9%), and English (4,275 | 6.4%), together accounting for 66.7% of all Rice County residents.
| Ancestry | # Population | % Population |
| African | 122 | 0.2% |
| Albanian | 17 | 0.0% |
| American | 2,109 | 3.1% |
| Apache | 2 | 0.0% |
| Arab | 51 | 0.1% |
| Argentinean | 27 | 0.0% |
| Armenian | 10 | 0.0% |
| Australian | 14 | 0.0% |
| Austrian | 238 | 0.4% |
| Bangladeshi | 144 | 0.2% |
| Belgian | 78 | 0.1% |
| Bhutanese | 173 | 0.3% |
| Bolivian | 75 | 0.1% |
| Brazilian | 9 | 0.0% |
| British | 181 | 0.3% |
| Bulgarian | 34 | 0.1% |
| Burmese | 414 | 0.6% |
| Canadian | 60 | 0.1% |
| Celtic | 3 | 0.0% |
| Central American | 382 | 0.6% |
| Central American Indian | 110 | 0.2% |
| Cherokee | 116 | 0.2% |
| Chickasaw | 1 | 0.0% |
| Chilean | 38 | 0.1% |
| Chippewa | 150 | 0.2% |
| Choctaw | 14 | 0.0% |
| Colombian | 44 | 0.1% |
| Costa Rican | 5 | 0.0% |
| Creek | 1 | 0.0% |
| Croatian | 33 | 0.1% |
| Cuban | 31 | 0.1% |
| Czech | 3,375 | 5.0% |
| Czechoslovakian | 382 | 0.6% |
| Danish | 502 | 0.7% |
| Dominican | 4 | 0.0% |
| Dutch | 899 | 1.3% |
| Eastern European | 149 | 0.2% |
| Ecuadorian | 92 | 0.1% |
| Egyptian | 8 | 0.0% |
| English | 4,275 | 6.4% |
| Estonian | 6 | 0.0% |
| Ethiopian | 85 | 0.1% |
| European | 918 | 1.4% |
| Filipino | 156 | 0.2% |
| Finnish | 343 | 0.5% |
| French | 1,782 | 2.6% |
| French American Indian | 20 | 0.0% |
| French Canadian | 707 | 1.1% |
| German | 20,370 | 30.3% |
| Greek | 220 | 0.3% |
| Guamanian / Chamorro | 83 | 0.1% |
| Guatemalan | 159 | 0.2% |
| Guyanese | 24 | 0.0% |
| Haitian | 7 | 0.0% |
| Honduran | 6 | 0.0% |
| Hungarian | 103 | 0.2% |
| Icelander | 52 | 0.1% |
| Indian (Asian) | 315 | 0.5% |
| Iranian | 27 | 0.0% |
| Irish | 6,075 | 9.0% |
| Iroquois | 1 | 0.0% |
| Italian | 1,034 | 1.5% |
| Jamaican | 15 | 0.0% |
| Japanese | 59 | 0.1% |
| Kenyan | 49 | 0.1% |
| Korean | 243 | 0.4% |
| Latvian | 34 | 0.1% |
| Lebanese | 40 | 0.1% |
| Liberian | 14 | 0.0% |
| Lithuanian | 16 | 0.0% |
| Luxembourger | 48 | 0.1% |
| Malaysian | 20 | 0.0% |
| Maltese | 117 | 0.2% |
| Mexican | 4,609 | 6.9% |
| Mexican American Indian | 19 | 0.0% |
| Mongolian | 5 | 0.0% |
| Moroccan | 3 | 0.0% |
| Native Hawaiian | 31 | 0.1% |
| Nicaraguan | 179 | 0.3% |
| Nigerian | 16 | 0.0% |
| Northern European | 81 | 0.1% |
| Norwegian | 9,441 | 14.1% |
| Pakistani | 27 | 0.0% |
| Pennsylvania German | 7 | 0.0% |
| Peruvian | 20 | 0.0% |
| Polish | 1,788 | 2.7% |
| Portuguese | 36 | 0.1% |
| Puerto Rican | 107 | 0.2% |
| Romanian | 43 | 0.1% |
| Russian | 245 | 0.4% |
| Salvadoran | 33 | 0.1% |
| Samoan | 32 | 0.1% |
| Scandinavian | 858 | 1.3% |
| Scotch-Irish | 347 | 0.5% |
| Scottish | 701 | 1.0% |
| Serbian | 21 | 0.0% |
| Sioux | 47 | 0.1% |
| Slavic | 19 | 0.0% |
| Slovak | 31 | 0.1% |
| Slovene | 74 | 0.1% |
| Somali | 2,413 | 3.6% |
| South American | 297 | 0.4% |
| South American Indian | 3 | 0.0% |
| Spaniard | 25 | 0.0% |
| Spanish | 228 | 0.3% |
| Spanish American Indian | 6 | 0.0% |
| Sri Lankan | 289 | 0.4% |
| Subsaharan African | 2,874 | 4.3% |
| Sudanese | 113 | 0.2% |
| Swedish | 2,976 | 4.4% |
| Swiss | 407 | 0.6% |
| Thai | 135 | 0.2% |
| Ukrainian | 106 | 0.2% |
| Venezuelan | 1 | 0.0% |
| Welsh | 336 | 0.5% |
| Yugoslavian | 5 | 0.0% | View All 116 Rows |
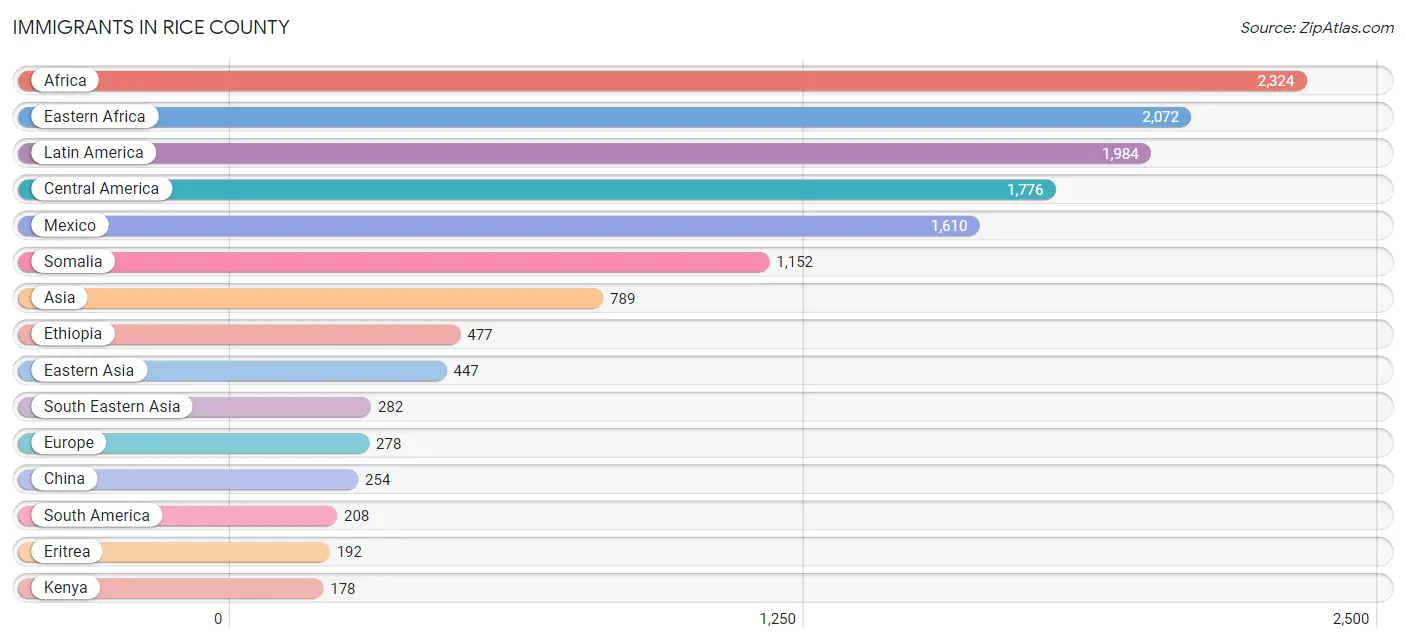
Immigrants in Rice County
The most numerous immigrant groups reported in Rice County came from Africa (2,324 | 3.5%), Eastern Africa (2,072 | 3.1%), Latin America (1,984 | 2.9%), Central America (1,776 | 2.6%), and Mexico (1,610 | 2.4%), together accounting for 14.5% of all Rice County residents.
| Immigration Origin | # Population | % Population |
| Africa | 2,324 | 3.5% |
| Albania | 17 | 0.0% |
| Argentina | 43 | 0.1% |
| Asia | 789 | 1.2% |
| Australia | 2 | 0.0% |
| Bangladesh | 2 | 0.0% |
| Bolivia | 45 | 0.1% |
| Brazil | 54 | 0.1% |
| Canada | 49 | 0.1% |
| Central America | 1,776 | 2.6% |
| China | 254 | 0.4% |
| Colombia | 5 | 0.0% |
| Costa Rica | 3 | 0.0% |
| Croatia | 5 | 0.0% |
| Eastern Africa | 2,072 | 3.1% |
| Eastern Asia | 447 | 0.7% |
| Eastern Europe | 142 | 0.2% |
| Ecuador | 37 | 0.1% |
| Egypt | 8 | 0.0% |
| El Salvador | 40 | 0.1% |
| England | 17 | 0.0% |
| Eritrea | 192 | 0.3% |
| Ethiopia | 477 | 0.7% |
| Europe | 278 | 0.4% |
| Germany | 86 | 0.1% |
| Guatemala | 74 | 0.1% |
| Honduras | 7 | 0.0% |
| India | 45 | 0.1% |
| Japan | 25 | 0.0% |
| Jordan | 8 | 0.0% |
| Kenya | 178 | 0.3% |
| Korea | 168 | 0.3% |
| Laos | 26 | 0.0% |
| Latin America | 1,984 | 2.9% |
| Latvia | 8 | 0.0% |
| Liberia | 45 | 0.1% |
| Mexico | 1,610 | 2.4% |
| Nicaragua | 42 | 0.1% |
| Nigeria | 22 | 0.0% |
| Northern Africa | 149 | 0.2% |
| Northern Europe | 32 | 0.1% |
| Oceania | 2 | 0.0% |
| Peru | 24 | 0.0% |
| Philippines | 63 | 0.1% |
| Romania | 8 | 0.0% |
| Russia | 77 | 0.1% |
| Senegal | 12 | 0.0% |
| Somalia | 1,152 | 1.7% |
| South Africa | 6 | 0.0% |
| South America | 208 | 0.3% |
| South Central Asia | 52 | 0.1% |
| South Eastern Asia | 282 | 0.4% |
| Southern Europe | 18 | 0.0% |
| Spain | 18 | 0.0% |
| Sudan | 141 | 0.2% |
| Taiwan | 40 | 0.1% |
| Thailand | 42 | 0.1% |
| Ukraine | 21 | 0.0% |
| Vietnam | 151 | 0.2% |
| Western Africa | 88 | 0.1% |
| Western Asia | 8 | 0.0% |
| Western Europe | 86 | 0.1% |
| Zimbabwe | 7 | 0.0% | View All 63 Rows |
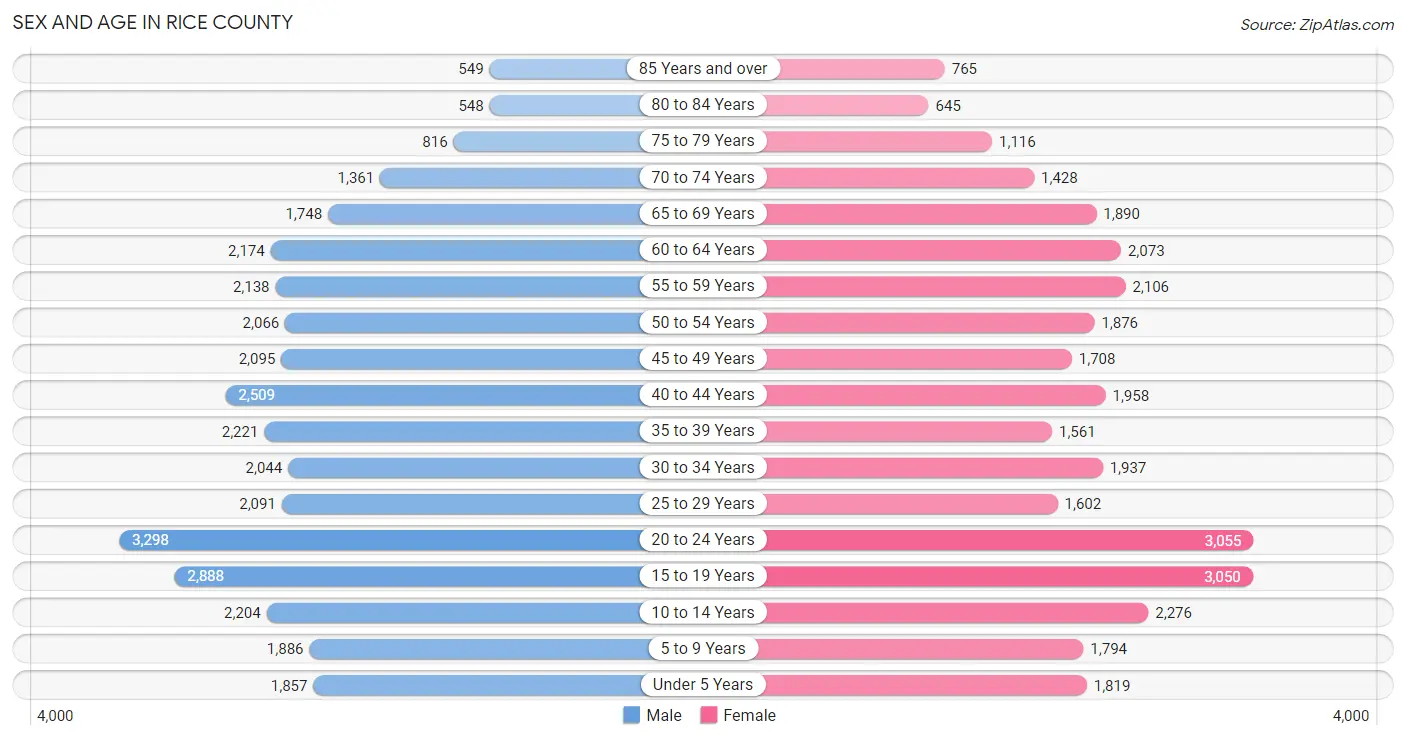
Sex and Age in Rice County
Sex and Age in Rice County
The most populous age groups in Rice County are 20 to 24 Years (3,298 | 9.6%) for men and 20 to 24 Years (3,055 | 9.3%) for women.
| Age Bracket | Male | Female |
| Under 5 Years | 1,857 (5.4%) | 1,819 (5.6%) |
| 5 to 9 Years | 1,886 (5.5%) | 1,794 (5.5%) |
| 10 to 14 Years | 2,204 (6.4%) | 2,276 (7.0%) |
| 15 to 19 Years | 2,888 (8.4%) | 3,050 (9.3%) |
| 20 to 24 Years | 3,298 (9.6%) | 3,055 (9.3%) |
| 25 to 29 Years | 2,091 (6.1%) | 1,602 (4.9%) |
| 30 to 34 Years | 2,044 (5.9%) | 1,937 (5.9%) |
| 35 to 39 Years | 2,221 (6.4%) | 1,561 (4.8%) |
| 40 to 44 Years | 2,509 (7.3%) | 1,958 (6.0%) |
| 45 to 49 Years | 2,095 (6.1%) | 1,708 (5.2%) |
| 50 to 54 Years | 2,066 (6.0%) | 1,876 (5.7%) |
| 55 to 59 Years | 2,138 (6.2%) | 2,106 (6.5%) |
| 60 to 64 Years | 2,174 (6.3%) | 2,073 (6.4%) |
| 65 to 69 Years | 1,748 (5.1%) | 1,890 (5.8%) |
| 70 to 74 Years | 1,361 (4.0%) | 1,428 (4.4%) |
| 75 to 79 Years | 816 (2.4%) | 1,116 (3.4%) |
| 80 to 84 Years | 548 (1.6%) | 645 (2.0%) |
| 85 Years and over | 549 (1.6%) | 765 (2.3%) |
| Total | 34,493 (100.0%) | 32,659 (100.0%) |
Families and Households in Rice County
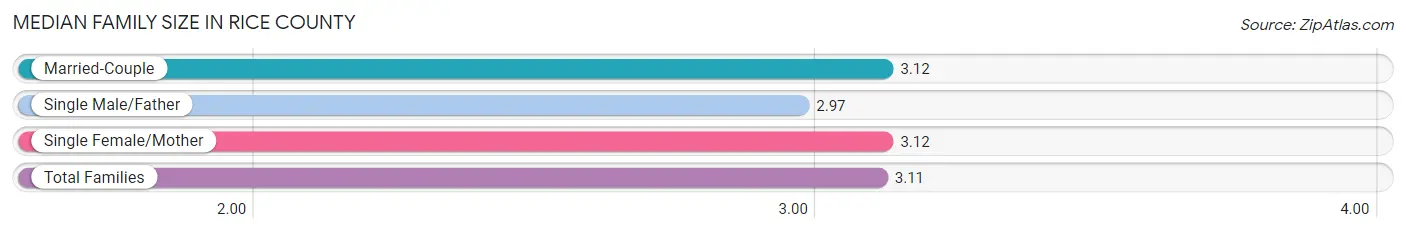
Median Family Size in Rice County
The median family size in Rice County is 3.11 persons per family, with married-couple families (12,261 | 79.3%) accounting for the largest median family size of 3.12 persons per family. On the other hand, single male/father families (1,135 | 7.3%) represent the smallest median family size with 2.97 persons per family.
| Family Type | # Families | Family Size |
| Married-Couple | 12,261 (79.3%) | 3.12 |
| Single Male/Father | 1,135 (7.3%) | 2.97 |
| Single Female/Mother | 2,058 (13.3%) | 3.12 |
| Total Families | 15,454 (100.0%) | 3.11 |
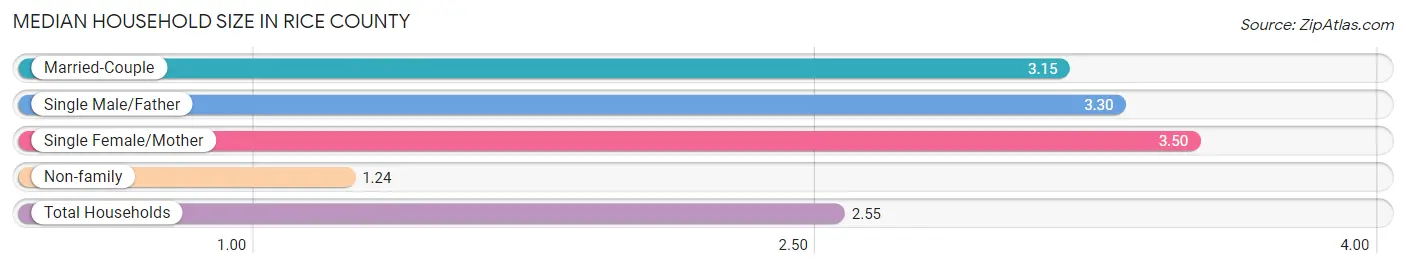
Median Household Size in Rice County
The median household size in Rice County is 2.55 persons per household, with single female/mother households (2,058 | 8.8%) accounting for the largest median household size of 3.5 persons per household. non-family households (7,811 | 33.6%) represent the smallest median household size with 1.24 persons per household.
| Household Type | # Households | Household Size |
| Married-Couple | 12,261 (52.7%) | 3.15 |
| Single Male/Father | 1,135 (4.9%) | 3.30 |
| Single Female/Mother | 2,058 (8.8%) | 3.50 |
| Non-family | 7,811 (33.6%) | 1.24 |
| Total Households | 23,265 (100.0%) | 2.55 |
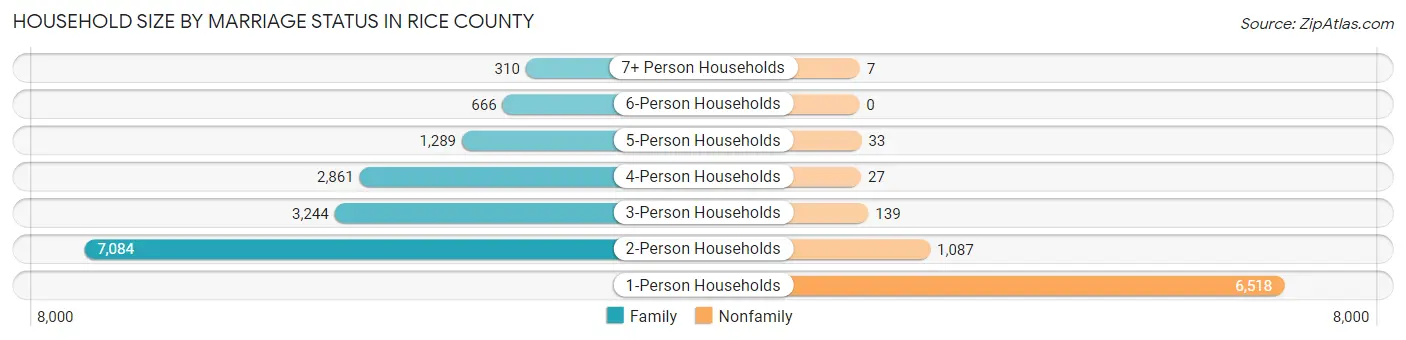
Household Size by Marriage Status in Rice County
Out of a total of 23,265 households in Rice County, 15,454 (66.4%) are family households, while 7,811 (33.6%) are nonfamily households. The most numerous type of family households are 2-person households, comprising 7,084, and the most common type of nonfamily households are 1-person households, comprising 6,518.
| Household Size | Family Households | Nonfamily Households |
| 1-Person Households | - | 6,518 (28.0%) |
| 2-Person Households | 7,084 (30.4%) | 1,087 (4.7%) |
| 3-Person Households | 3,244 (13.9%) | 139 (0.6%) |
| 4-Person Households | 2,861 (12.3%) | 27 (0.1%) |
| 5-Person Households | 1,289 (5.5%) | 33 (0.1%) |
| 6-Person Households | 666 (2.9%) | 0 (0.0%) |
| 7+ Person Households | 310 (1.3%) | 7 (0.0%) |
| Total | 15,454 (66.4%) | 7,811 (33.6%) |
Female Fertility in Rice County
Fertility by Age in Rice County
Average fertility rate in Rice County is 61.0 births per 1,000 women. Women in the age bracket of 20 to 34 years have the highest fertility rate with 116.0 births per 1,000 women. Women in the age bracket of 20 to 34 years acount for 82.2% of all women with births.
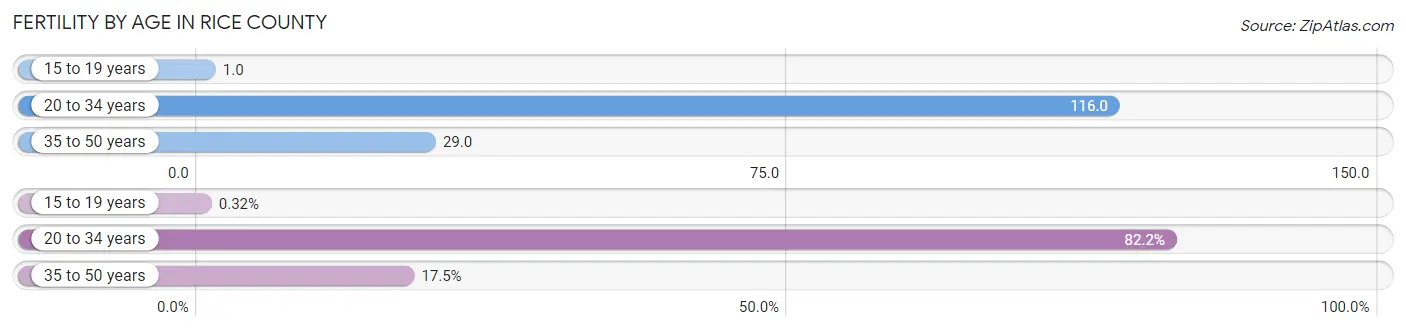
| Age Bracket | Women with Births | Births / 1,000 Women |
| 15 to 19 years | 3 (0.3%) | 1.0 |
| 20 to 34 years | 765 (82.2%) | 116.0 |
| 35 to 50 years | 163 (17.5%) | 29.0 |
| Total | 931 (100.0%) | 61.0 |
Fertility by Age by Marriage Status in Rice County
65.0% of women with births (931) in Rice County are married. The highest percentage of unmarried women with births falls into 15 to 19 years age bracket with 100.0% of them unmarried at the time of birth, while the lowest percentage of unmarried women with births belong to 20 to 34 years age bracket with 32.7% of them unmarried.
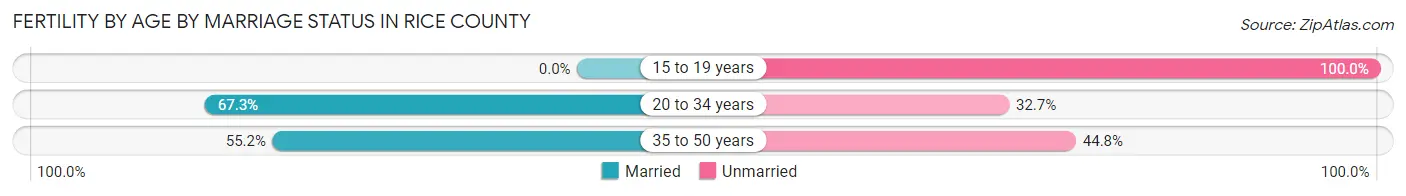
| Age Bracket | Married | Unmarried |
| 15 to 19 years | 0 (0.0%) | 3 (100.0%) |
| 20 to 34 years | 515 (67.3%) | 250 (32.7%) |
| 35 to 50 years | 90 (55.2%) | 73 (44.8%) |
| Total | 605 (65.0%) | 326 (35.0%) |
Fertility by Education in Rice County
Average fertility rate in Rice County is 61.0 births per 1,000 women. Women with the education attainment of bachelor's degree have the highest fertility rate of 71.0 births per 1,000 women, while women with the education attainment of graduate degree have the lowest fertility at 15.0 births per 1,000 women. Women with the education attainment of college or associate's degree represent 41.2% of all women with births.
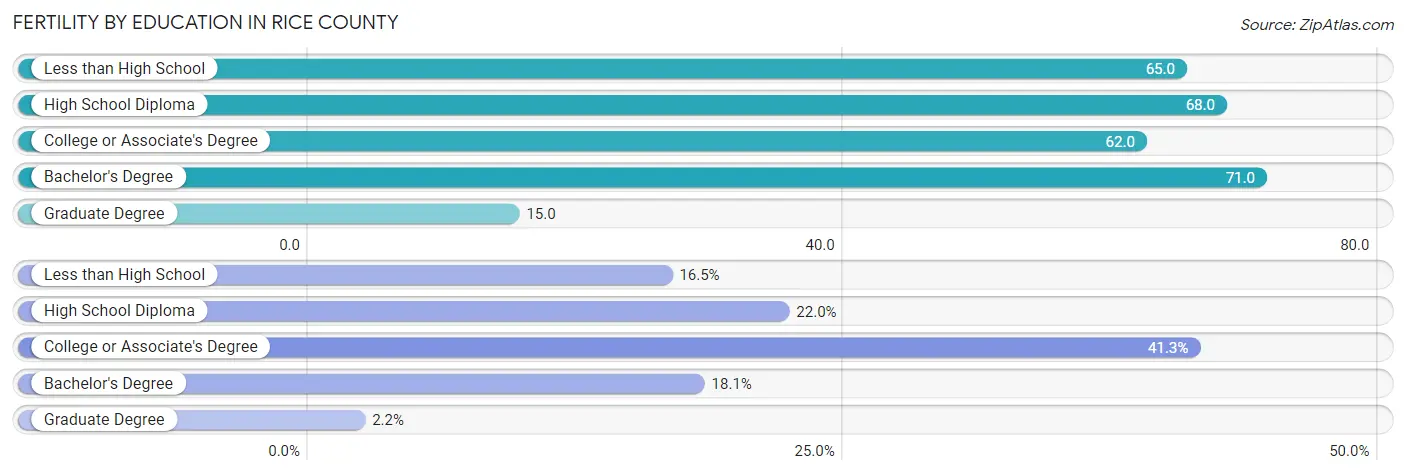
| Educational Attainment | Women with Births | Births / 1,000 Women |
| Less than High School | 154 (16.5%) | 65.0 |
| High School Diploma | 205 (22.0%) | 68.0 |
| College or Associate's Degree | 384 (41.2%) | 62.0 |
| Bachelor's Degree | 168 (18.0%) | 71.0 |
| Graduate Degree | 20 (2.1%) | 15.0 |
| Total | 931 (100.0%) | 61.0 |
Fertility by Education by Marriage Status in Rice County
35.0% of women with births in Rice County are unmarried. Women with the educational attainment of graduate degree are most likely to be married with 100.0% of them married at childbirth, while women with the educational attainment of high school diploma are least likely to be married with 69.8% of them unmarried at childbirth.
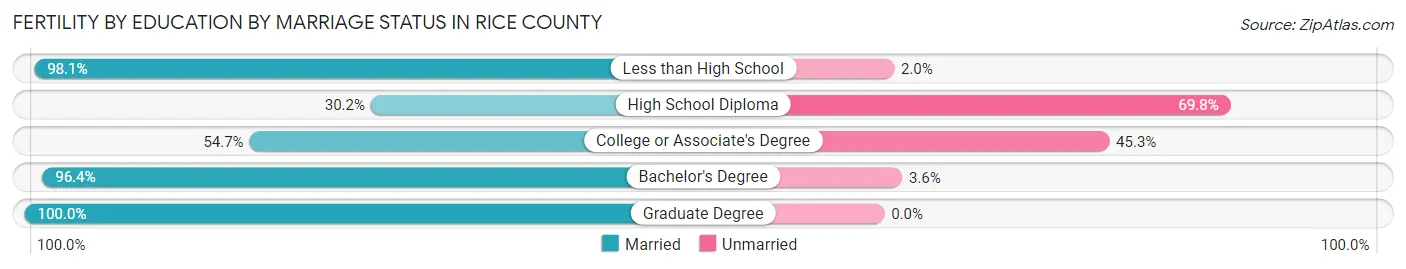
| Educational Attainment | Married | Unmarried |
| Less than High School | 151 (98.1%) | 3 (1.9%) |
| High School Diploma | 62 (30.2%) | 143 (69.8%) |
| College or Associate's Degree | 210 (54.7%) | 174 (45.3%) |
| Bachelor's Degree | 162 (96.4%) | 6 (3.6%) |
| Graduate Degree | 20 (100.0%) | 0 (0.0%) |
| Total | 605 (65.0%) | 326 (35.0%) |
Income in Rice County
Income Overview in Rice County
Per Capita Income in Rice County is $37,050, while median incomes of families and households are $98,475 and $78,214 respectively.
| Characteristic | Number | Measure |
| Per Capita Income | 67,152 | $37,050 |
| Median Family Income | 15,454 | $98,475 |
| Mean Family Income | 15,454 | $118,698 |
| Median Household Income | 23,265 | $78,214 |
| Mean Household Income | 23,265 | $99,972 |
| Income Deficit | 15,454 | $9,052 |
| Wage / Income Gap (%) | 67,152 | 31.03% |
| Wage / Income Gap ($) | 67,152 | 68.97¢ per $1 |
| Gini / Inequality Index | 67,152 | 0.43 |
Earnings by Sex in Rice County
Average Earnings in Rice County are $36,335, $44,608 for men and $30,764 for women, a difference of 31.0%.
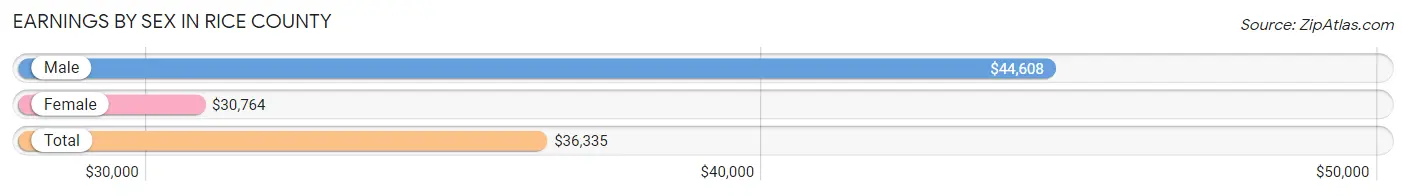
| Sex | Number | Average Earnings |
| Male | 20,428 (52.8%) | $44,608 |
| Female | 18,267 (47.2%) | $30,764 |
| Total | 38,695 (100.0%) | $36,335 |
Earnings by Sex by Income Bracket in Rice County
The most common earnings brackets in Rice County are $100,000+ for men (2,765 | 13.5%) and $2,499 or less for women (1,517 | 8.3%).
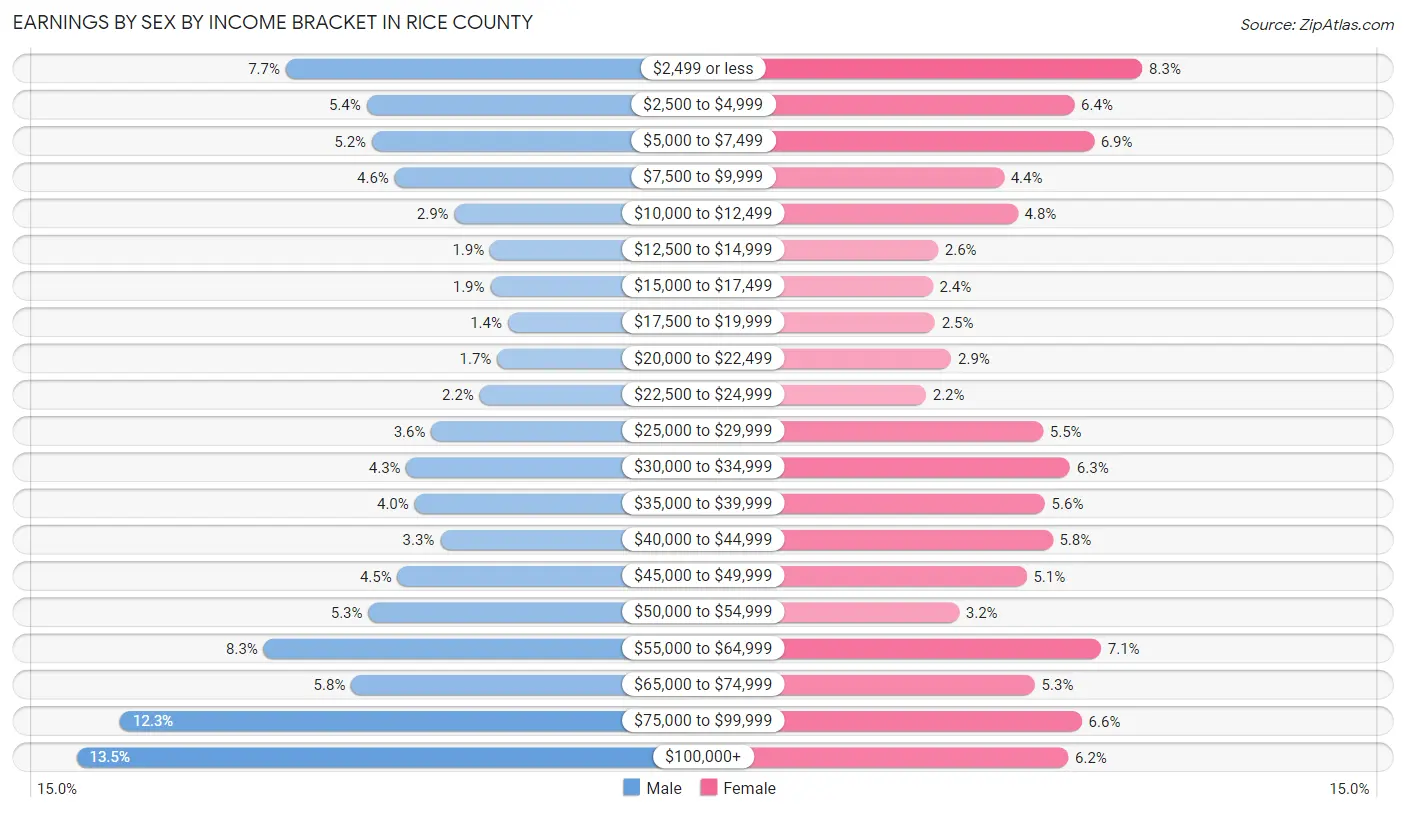
| Income | Male | Female |
| $2,499 or less | 1,564 (7.7%) | 1,517 (8.3%) |
| $2,500 to $4,999 | 1,102 (5.4%) | 1,167 (6.4%) |
| $5,000 to $7,499 | 1,071 (5.2%) | 1,268 (6.9%) |
| $7,500 to $9,999 | 939 (4.6%) | 805 (4.4%) |
| $10,000 to $12,499 | 596 (2.9%) | 877 (4.8%) |
| $12,500 to $14,999 | 392 (1.9%) | 468 (2.6%) |
| $15,000 to $17,499 | 390 (1.9%) | 440 (2.4%) |
| $17,500 to $19,999 | 290 (1.4%) | 451 (2.5%) |
| $20,000 to $22,499 | 351 (1.7%) | 536 (2.9%) |
| $22,500 to $24,999 | 452 (2.2%) | 406 (2.2%) |
| $25,000 to $29,999 | 730 (3.6%) | 1,006 (5.5%) |
| $30,000 to $34,999 | 872 (4.3%) | 1,145 (6.3%) |
| $35,000 to $39,999 | 826 (4.0%) | 1,015 (5.6%) |
| $40,000 to $44,999 | 678 (3.3%) | 1,056 (5.8%) |
| $45,000 to $49,999 | 923 (4.5%) | 922 (5.1%) |
| $50,000 to $54,999 | 1,090 (5.3%) | 575 (3.2%) |
| $55,000 to $64,999 | 1,691 (8.3%) | 1,305 (7.1%) |
| $65,000 to $74,999 | 1,189 (5.8%) | 965 (5.3%) |
| $75,000 to $99,999 | 2,517 (12.3%) | 1,206 (6.6%) |
| $100,000+ | 2,765 (13.5%) | 1,137 (6.2%) |
| Total | 20,428 (100.0%) | 18,267 (100.0%) |
Earnings by Sex by Educational Attainment in Rice County
Average earnings in Rice County are $54,767 for men and $41,114 for women, a difference of 24.9%. Men with an educational attainment of graduate degree enjoy the highest average annual earnings of $86,974, while those with less than high school education earn the least with $35,854. Women with an educational attainment of graduate degree earn the most with the average annual earnings of $71,188, while those with high school diploma education have the smallest earnings of $32,239.
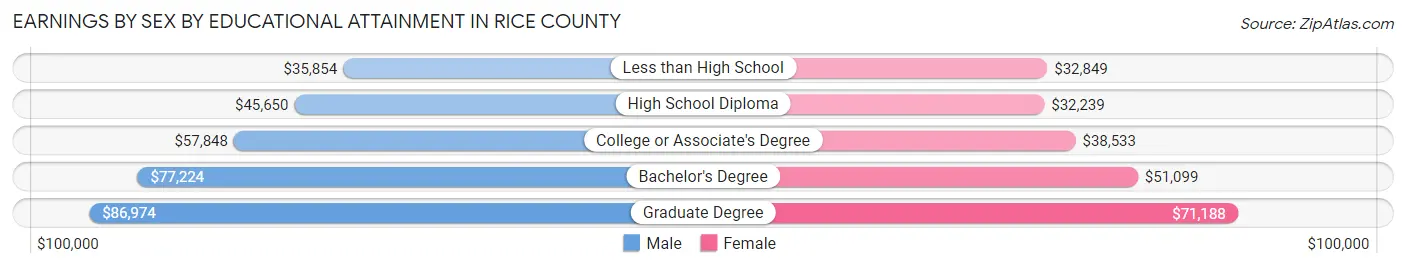
| Educational Attainment | Male Income | Female Income |
| Less than High School | $35,854 | $32,849 |
| High School Diploma | $45,650 | $32,239 |
| College or Associate's Degree | $57,848 | $38,533 |
| Bachelor's Degree | $77,224 | $51,099 |
| Graduate Degree | $86,974 | $71,188 |
| Total | $54,767 | $41,114 |
Family Income in Rice County
Family Income Brackets in Rice County
According to the Rice County family income data, there are 3,632 families falling into the $100,000 to $149,999 income range, which is the most common income bracket and makes up 23.5% of all families. Conversely, the $10,000 to $14,999 income bracket is the least frequent group with only 124 families (0.8%) belonging to this category.
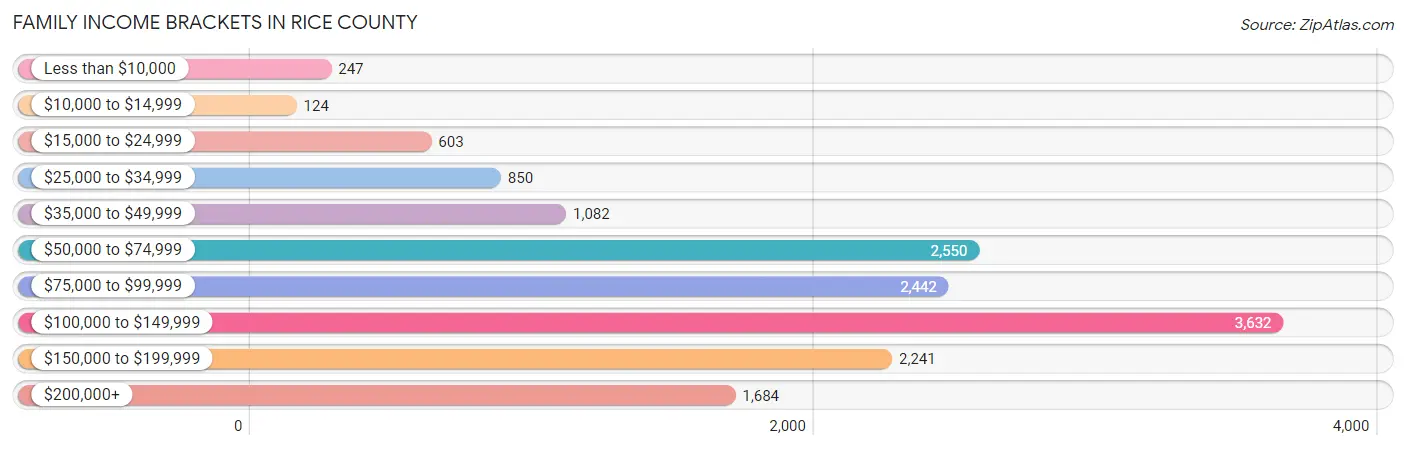
| Income Bracket | # Families | % Families |
| Less than $10,000 | 247 | 1.6% |
| $10,000 to $14,999 | 124 | 0.8% |
| $15,000 to $24,999 | 603 | 3.9% |
| $25,000 to $34,999 | 850 | 5.5% |
| $35,000 to $49,999 | 1,082 | 7.0% |
| $50,000 to $74,999 | 2,550 | 16.5% |
| $75,000 to $99,999 | 2,442 | 15.8% |
| $100,000 to $149,999 | 3,632 | 23.5% |
| $150,000 to $199,999 | 2,241 | 14.5% |
| $200,000+ | 1,684 | 10.9% |
Family Income by Famaliy Size in Rice County
5-person families (1,131 | 7.3%) account for the highest median family income in Rice County with $121,615 per family, while 2-person families (7,468 | 48.3%) have the highest median income of $45,518 per family member.
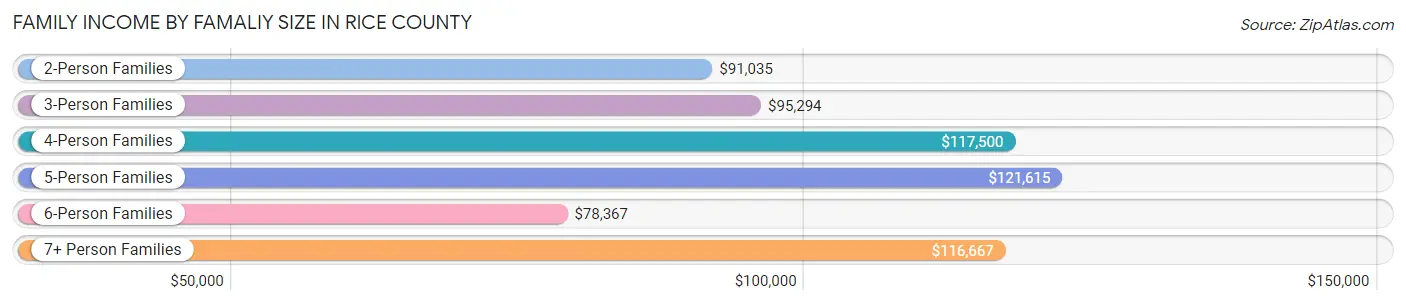
| Income Bracket | # Families | Median Income |
| 2-Person Families | 7,468 (48.3%) | $91,035 |
| 3-Person Families | 3,332 (21.6%) | $95,294 |
| 4-Person Families | 2,590 (16.8%) | $117,500 |
| 5-Person Families | 1,131 (7.3%) | $121,615 |
| 6-Person Families | 705 (4.6%) | $78,367 |
| 7+ Person Families | 228 (1.5%) | $116,667 |
| Total | 15,454 (100.0%) | $98,475 |
Family Income by Number of Earners in Rice County
The median family income in Rice County is $98,475, with families comprising 3+ earners (1,904) having the highest median family income of $153,981, while families with 1 earner (4,299) have the lowest median family income of $60,680, accounting for 12.3% and 27.8% of families, respectively.
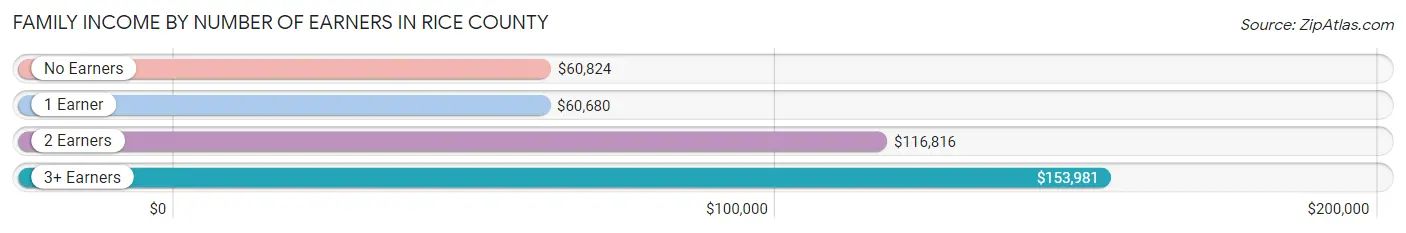
| Number of Earners | # Families | Median Income |
| No Earners | 2,023 (13.1%) | $60,824 |
| 1 Earner | 4,299 (27.8%) | $60,680 |
| 2 Earners | 7,228 (46.8%) | $116,816 |
| 3+ Earners | 1,904 (12.3%) | $153,981 |
| Total | 15,454 (100.0%) | $98,475 |
Household Income in Rice County
Household Income Brackets in Rice County
With 4,444 households falling in the category, the $100,000 to $149,999 income range is the most frequent in Rice County, accounting for 19.1% of all households. In contrast, only 512 households (2.2%) fall into the $10,000 to $14,999 income bracket, making it the least populous group.
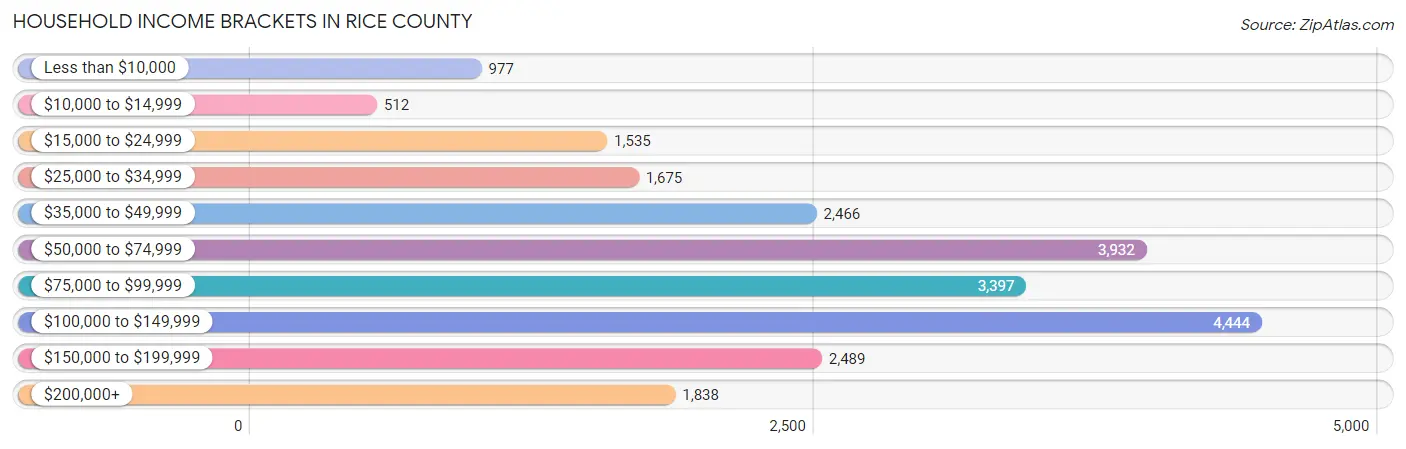
| Income Bracket | # Households | % Households |
| Less than $10,000 | 977 | 4.2% |
| $10,000 to $14,999 | 512 | 2.2% |
| $15,000 to $24,999 | 1,535 | 6.6% |
| $25,000 to $34,999 | 1,675 | 7.2% |
| $35,000 to $49,999 | 2,466 | 10.6% |
| $50,000 to $74,999 | 3,932 | 16.9% |
| $75,000 to $99,999 | 3,397 | 14.6% |
| $100,000 to $149,999 | 4,444 | 19.1% |
| $150,000 to $199,999 | 2,489 | 10.7% |
| $200,000+ | 1,838 | 7.9% |
Household Income by Householder Age in Rice County
The median household income in Rice County is $78,214, with the highest median household income of $98,468 found in the 45 to 64 years age bracket for the primary householder. A total of 8,592 households (36.9%) fall into this category. Meanwhile, the 15 to 24 years age bracket for the primary householder has the lowest median household income of $42,857, with 548 households (2.4%) in this group.
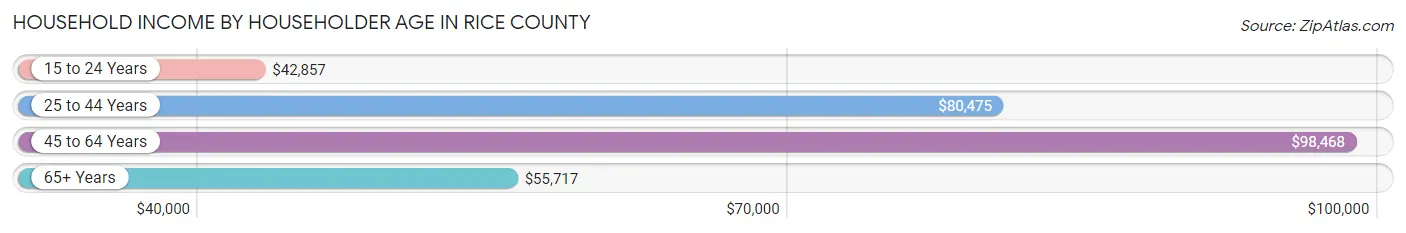
| Income Bracket | # Households | Median Income |
| 15 to 24 Years | 548 (2.4%) | $42,857 |
| 25 to 44 Years | 7,321 (31.5%) | $80,475 |
| 45 to 64 Years | 8,592 (36.9%) | $98,468 |
| 65+ Years | 6,804 (29.2%) | $55,717 |
| Total | 23,265 (100.0%) | $78,214 |
Poverty in Rice County
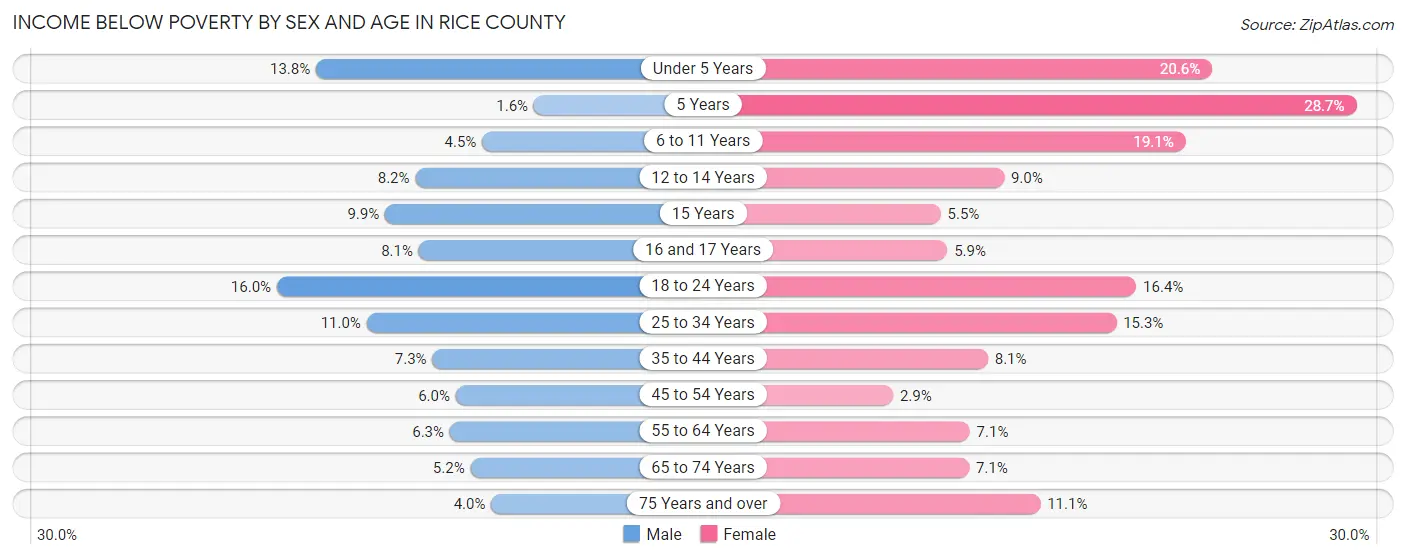
Income Below Poverty by Sex and Age in Rice County
With 8.0% poverty level for males and 10.6% for females among the residents of Rice County, 18 to 24 year old males and 5 year old females are the most vulnerable to poverty, with 399 males (16.0%) and 98 females (28.6%) in their respective age groups living below the poverty level.
| Age Bracket | Male | Female |
| Under 5 Years | 250 (13.8%) | 361 (20.6%) |
| 5 Years | 6 (1.6%) | 98 (28.6%) |
| 6 to 11 Years | 109 (4.5%) | 391 (19.1%) |
| 12 to 14 Years | 102 (8.2%) | 149 (9.0%) |
| 15 Years | 41 (9.9%) | 26 (5.5%) |
| 16 and 17 Years | 70 (8.1%) | 47 (5.9%) |
| 18 to 24 Years | 399 (16.0%) | 331 (16.4%) |
| 25 to 34 Years | 396 (11.0%) | 540 (15.3%) |
| 35 to 44 Years | 305 (7.3%) | 286 (8.1%) |
| 45 to 54 Years | 231 (6.0%) | 102 (2.9%) |
| 55 to 64 Years | 254 (6.3%) | 296 (7.1%) |
| 65 to 74 Years | 157 (5.2%) | 232 (7.1%) |
| 75 Years and over | 70 (4.0%) | 254 (11.1%) |
| Total | 2,390 (8.0%) | 3,113 (10.6%) |
Income Above Poverty by Sex and Age in Rice County
According to the poverty statistics in Rice County, males aged 5 years and females aged 45 to 54 years are the age groups that are most secure financially, with 98.4% of males and 97.2% of females in these age groups living above the poverty line.
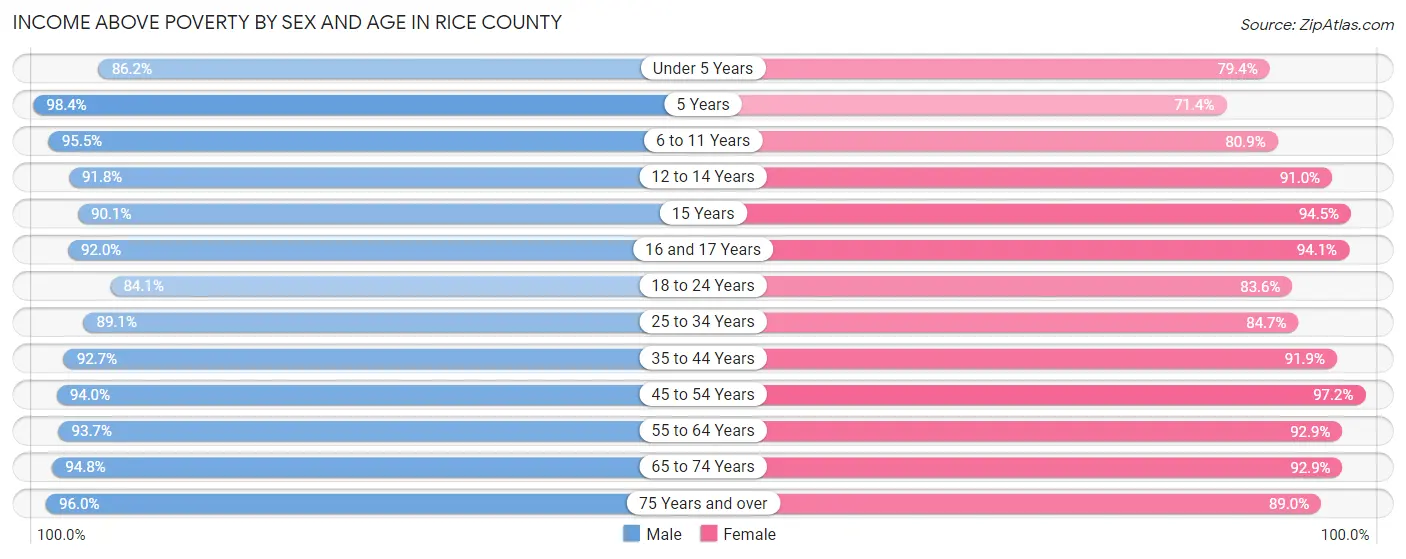
| Age Bracket | Male | Female |
| Under 5 Years | 1,565 (86.2%) | 1,390 (79.4%) |
| 5 Years | 359 (98.4%) | 244 (71.4%) |
| 6 to 11 Years | 2,300 (95.5%) | 1,652 (80.9%) |
| 12 to 14 Years | 1,136 (91.8%) | 1,501 (91.0%) |
| 15 Years | 372 (90.1%) | 447 (94.5%) |
| 16 and 17 Years | 800 (91.9%) | 754 (94.1%) |
| 18 to 24 Years | 2,103 (84.1%) | 1,689 (83.6%) |
| 25 to 34 Years | 3,220 (89.0%) | 2,993 (84.7%) |
| 35 to 44 Years | 3,876 (92.7%) | 3,233 (91.9%) |
| 45 to 54 Years | 3,626 (94.0%) | 3,482 (97.2%) |
| 55 to 64 Years | 3,768 (93.7%) | 3,860 (92.9%) |
| 65 to 74 Years | 2,880 (94.8%) | 3,046 (92.9%) |
| 75 Years and over | 1,675 (96.0%) | 2,044 (88.9%) |
| Total | 27,680 (92.0%) | 26,335 (89.4%) |
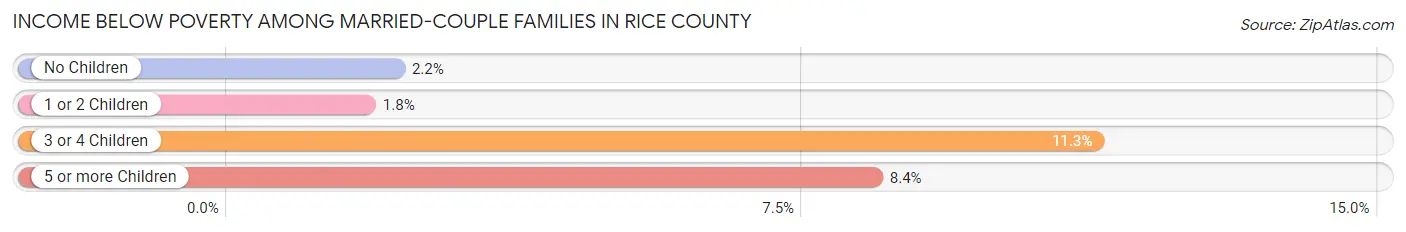
Income Below Poverty Among Married-Couple Families in Rice County
The poverty statistics for married-couple families in Rice County show that 3.2% or 390 of the total 12,261 families live below the poverty line. Families with 3 or 4 children have the highest poverty rate of 11.3%, comprising of 161 families. On the other hand, families with 1 or 2 children have the lowest poverty rate of 1.8%, which includes 63 families.
| Children | Above Poverty | Below Poverty |
| No Children | 7,090 (97.8%) | 158 (2.2%) |
| 1 or 2 Children | 3,431 (98.2%) | 63 (1.8%) |
| 3 or 4 Children | 1,263 (88.7%) | 161 (11.3%) |
| 5 or more Children | 87 (91.6%) | 8 (8.4%) |
| Total | 11,871 (96.8%) | 390 (3.2%) |
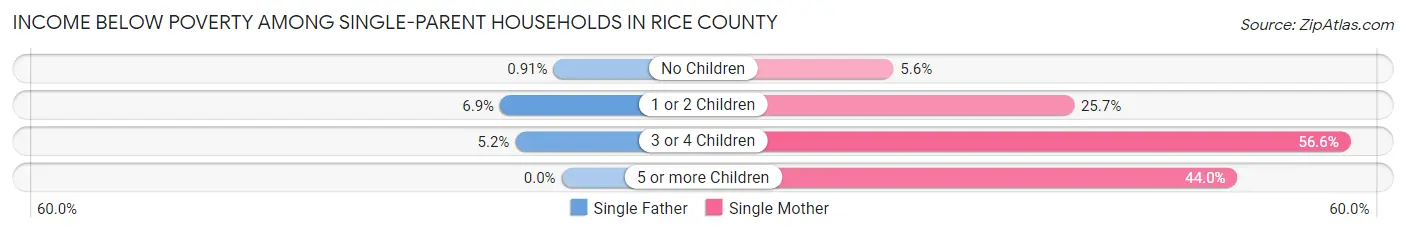
Income Below Poverty Among Single-Parent Households in Rice County
According to the poverty data in Rice County, 3.6% or 41 single-father households and 23.2% or 477 single-mother households are living below the poverty line. Among single-father households, those with 1 or 2 children have the highest poverty rate, with 33 households (6.9%) experiencing poverty. Likewise, among single-mother households, those with 3 or 4 children have the highest poverty rate, with 128 households (56.6%) falling below the poverty line.
| Children | Single Father | Single Mother |
| No Children | 5 (0.9%) | 35 (5.6%) |
| 1 or 2 Children | 33 (6.9%) | 303 (25.7%) |
| 3 or 4 Children | 3 (5.2%) | 128 (56.6%) |
| 5 or more Children | 0 (0.0%) | 11 (44.0%) |
| Total | 41 (3.6%) | 477 (23.2%) |
Income Below Poverty Among Married-Couple vs Single-Parent Households in Rice County
The poverty data for Rice County shows that 390 of the married-couple family households (3.2%) and 518 of the single-parent households (16.2%) are living below the poverty level. Within the married-couple family households, those with 3 or 4 children have the highest poverty rate, with 161 households (11.3%) falling below the poverty line. Among the single-parent households, those with 3 or 4 children have the highest poverty rate, with 131 household (46.1%) living below poverty.
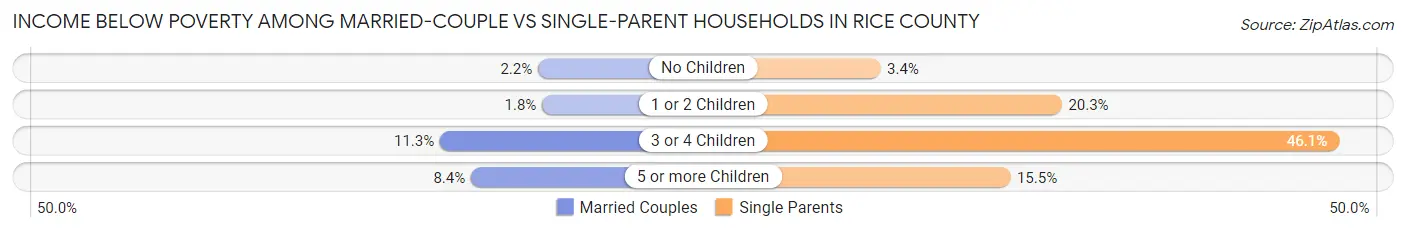
| Children | Married-Couple Families | Single-Parent Households |
| No Children | 158 (2.2%) | 40 (3.4%) |
| 1 or 2 Children | 63 (1.8%) | 336 (20.3%) |
| 3 or 4 Children | 161 (11.3%) | 131 (46.1%) |
| 5 or more Children | 8 (8.4%) | 11 (15.5%) |
| Total | 390 (3.2%) | 518 (16.2%) |
Employment Characteristics in Rice County
Employment by Class of Employer in Rice County
Among the 32,398 employed individuals in Rice County, private company employees (21,238 | 65.5%), not-for-profit organizations (4,085 | 12.6%), and local government employees (2,281 | 7.0%) make up the most common classes of employment.
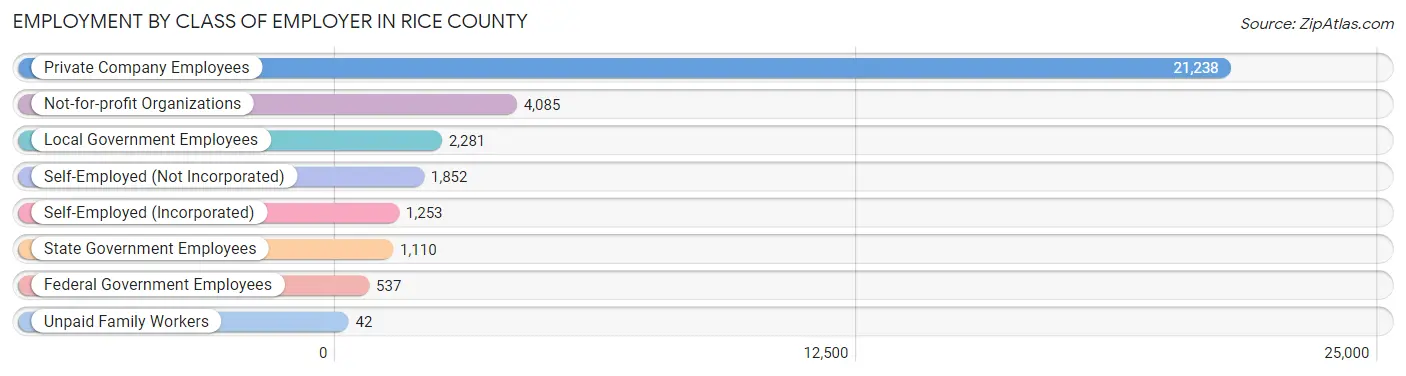
| Employer Class | # Employees | % Employees |
| Private Company Employees | 21,238 | 65.5% |
| Self-Employed (Incorporated) | 1,253 | 3.9% |
| Self-Employed (Not Incorporated) | 1,852 | 5.7% |
| Not-for-profit Organizations | 4,085 | 12.6% |
| Local Government Employees | 2,281 | 7.0% |
| State Government Employees | 1,110 | 3.4% |
| Federal Government Employees | 537 | 1.7% |
| Unpaid Family Workers | 42 | 0.1% |
| Total | 32,398 | 100.0% |
Employment Status by Age in Rice County
According to the labor force statistics for Rice County, out of the total population over 16 years of age (54,428), 64.2% or 34,943 individuals are in the labor force, with 5.3% or 1,852 of them unemployed. The age group with the highest labor force participation rate is 25 to 29 years, with 85.0% or 3,139 individuals in the labor force. Within the labor force, the 16 to 19 years age range has the highest percentage of unemployed individuals, with 10.2% or 313 of them being unemployed.
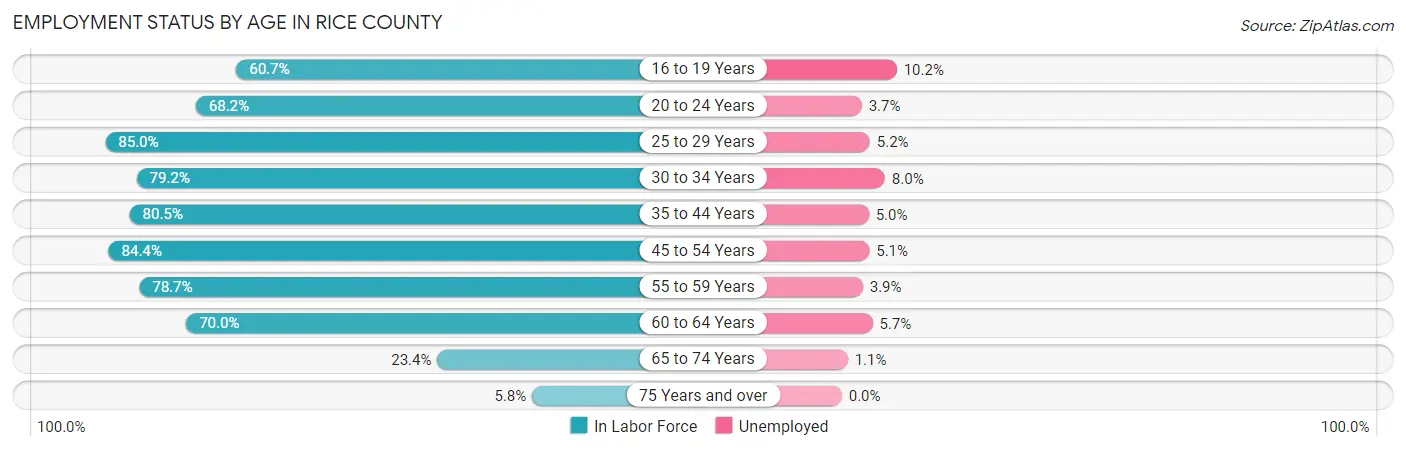
| Age Bracket | In Labor Force | Unemployed |
| 16 to 19 Years | 3,065 (60.7%) | 313 (10.2%) |
| 20 to 24 Years | 4,333 (68.2%) | 160 (3.7%) |
| 25 to 29 Years | 3,139 (85.0%) | 163 (5.2%) |
| 30 to 34 Years | 3,153 (79.2%) | 252 (8.0%) |
| 35 to 44 Years | 6,640 (80.5%) | 332 (5.0%) |
| 45 to 54 Years | 6,537 (84.4%) | 333 (5.1%) |
| 55 to 59 Years | 3,340 (78.7%) | 130 (3.9%) |
| 60 to 64 Years | 2,973 (70.0%) | 169 (5.7%) |
| 65 to 74 Years | 1,504 (23.4%) | 17 (1.1%) |
| 75 Years and over | 257 (5.8%) | 0 (0.0%) |
| Total | 34,943 (64.2%) | 1,852 (5.3%) |
Employment Status by Educational Attainment in Rice County
According to labor force statistics for Rice County, 80.2% of individuals (25,792) out of the total population between 25 and 64 years of age (32,159) are in the labor force, with 5.3% or 1,367 of them being unemployed. The group with the highest labor force participation rate are those with the educational attainment of bachelor's degree or higher, with 90.8% or 8,358 individuals in the labor force. Within the labor force, individuals with less than high school education have the highest percentage of unemployment, with 11.1% or 182 of them being unemployed.
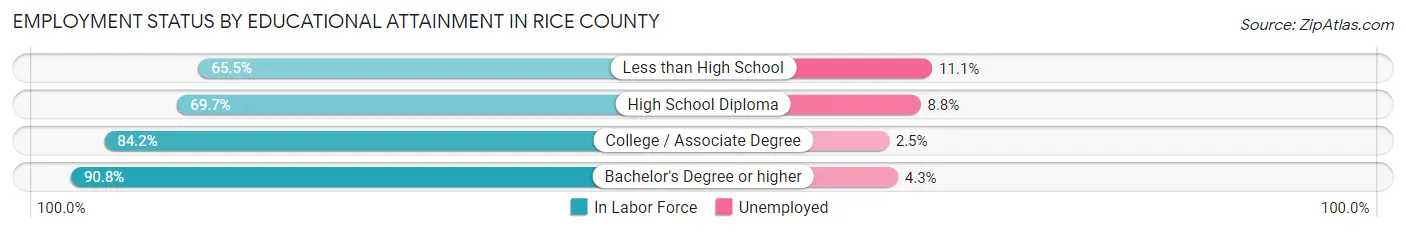
| Educational Attainment | In Labor Force | Unemployed |
| Less than High School | 1,636 (65.5%) | 277 (11.1%) |
| High School Diploma | 6,886 (69.7%) | 869 (8.8%) |
| College / Associate Degree | 8,906 (84.2%) | 264 (2.5%) |
| Bachelor's Degree or higher | 8,358 (90.8%) | 396 (4.3%) |
| Total | 25,792 (80.2%) | 1,704 (5.3%) |
Employment Occupations by Sex in Rice County
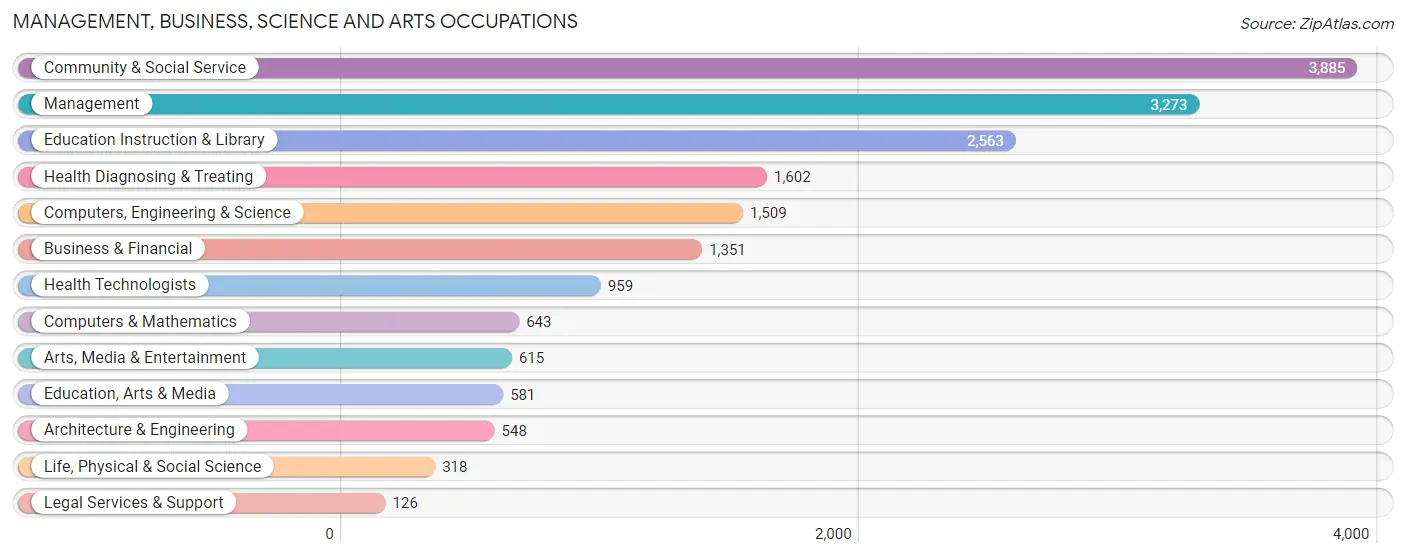
Management, Business, Science and Arts Occupations
The most common Management, Business, Science and Arts occupations in Rice County are Community & Social Service (3,885 | 11.8%), Management (3,273 | 9.9%), Education Instruction & Library (2,563 | 7.8%), Health Diagnosing & Treating (1,602 | 4.9%), and Computers, Engineering & Science (1,509 | 4.6%).
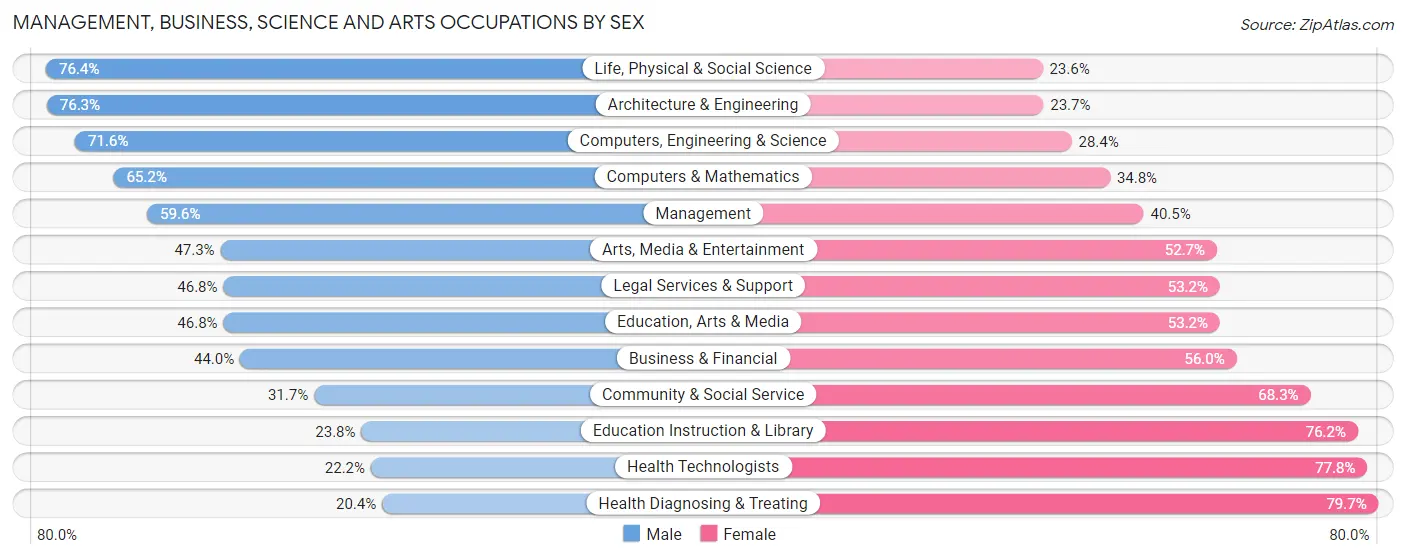
Management, Business, Science and Arts Occupations by Sex
Within the Management, Business, Science and Arts occupations in Rice County, the most male-oriented occupations are Life, Physical & Social Science (76.4%), Architecture & Engineering (76.3%), and Computers, Engineering & Science (71.6%), while the most female-oriented occupations are Health Diagnosing & Treating (79.6%), Health Technologists (77.8%), and Education Instruction & Library (76.2%).
| Occupation | Male | Female |
| Management | 1,949 (59.6%) | 1,324 (40.5%) |
| Business & Financial | 595 (44.0%) | 756 (56.0%) |
| Computers, Engineering & Science | 1,080 (71.6%) | 429 (28.4%) |
| Computers & Mathematics | 419 (65.2%) | 224 (34.8%) |
| Architecture & Engineering | 418 (76.3%) | 130 (23.7%) |
| Life, Physical & Social Science | 243 (76.4%) | 75 (23.6%) |
| Community & Social Service | 1,232 (31.7%) | 2,653 (68.3%) |
| Education, Arts & Media | 272 (46.8%) | 309 (53.2%) |
| Legal Services & Support | 59 (46.8%) | 67 (53.2%) |
| Education Instruction & Library | 610 (23.8%) | 1,953 (76.2%) |
| Arts, Media & Entertainment | 291 (47.3%) | 324 (52.7%) |
| Health Diagnosing & Treating | 326 (20.3%) | 1,276 (79.6%) |
| Health Technologists | 213 (22.2%) | 746 (77.8%) |
| Total (Category) | 5,182 (44.6%) | 6,438 (55.4%) |
| Total (Overall) | 17,122 (51.8%) | 15,904 (48.2%) |
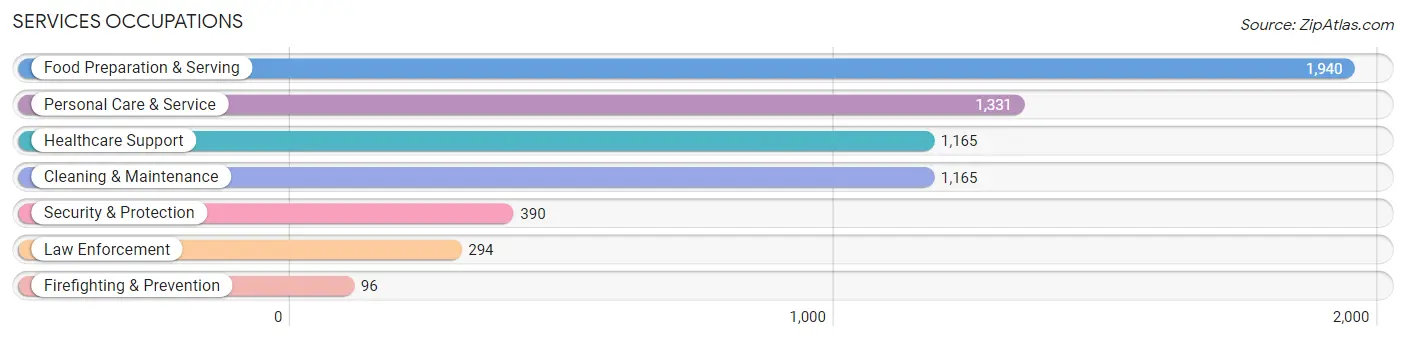
Services Occupations
The most common Services occupations in Rice County are Food Preparation & Serving (1,940 | 5.9%), Personal Care & Service (1,331 | 4.0%), Healthcare Support (1,165 | 3.5%), Cleaning & Maintenance (1,165 | 3.5%), and Security & Protection (390 | 1.2%).
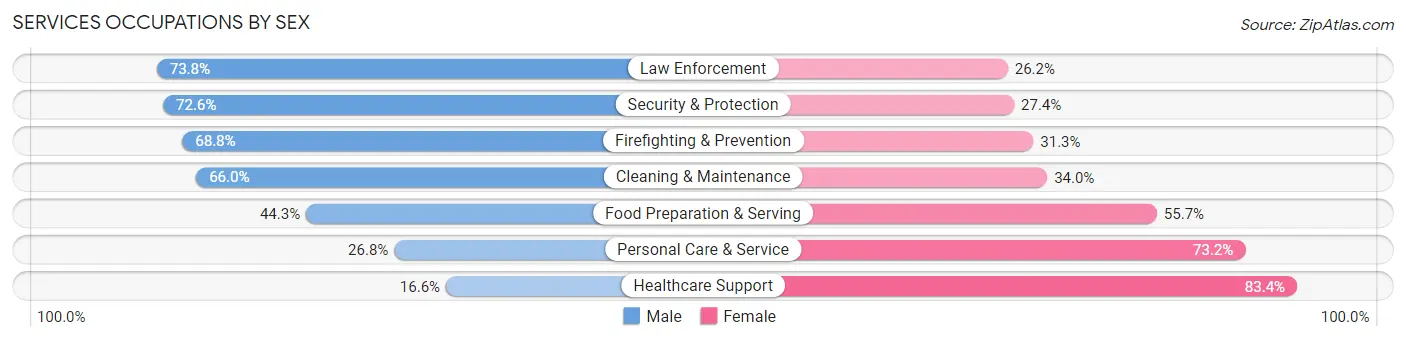
Services Occupations by Sex
Within the Services occupations in Rice County, the most male-oriented occupations are Law Enforcement (73.8%), Security & Protection (72.6%), and Firefighting & Prevention (68.8%), while the most female-oriented occupations are Healthcare Support (83.4%), Personal Care & Service (73.2%), and Food Preparation & Serving (55.7%).
| Occupation | Male | Female |
| Healthcare Support | 193 (16.6%) | 972 (83.4%) |
| Security & Protection | 283 (72.6%) | 107 (27.4%) |
| Firefighting & Prevention | 66 (68.8%) | 30 (31.2%) |
| Law Enforcement | 217 (73.8%) | 77 (26.2%) |
| Food Preparation & Serving | 859 (44.3%) | 1,081 (55.7%) |
| Cleaning & Maintenance | 769 (66.0%) | 396 (34.0%) |
| Personal Care & Service | 357 (26.8%) | 974 (73.2%) |
| Total (Category) | 2,461 (41.1%) | 3,530 (58.9%) |
| Total (Overall) | 17,122 (51.8%) | 15,904 (48.2%) |
Sales and Office Occupations
The most common Sales and Office occupations in Rice County are Office & Administration (3,573 | 10.8%), and Sales & Related (2,748 | 8.3%).
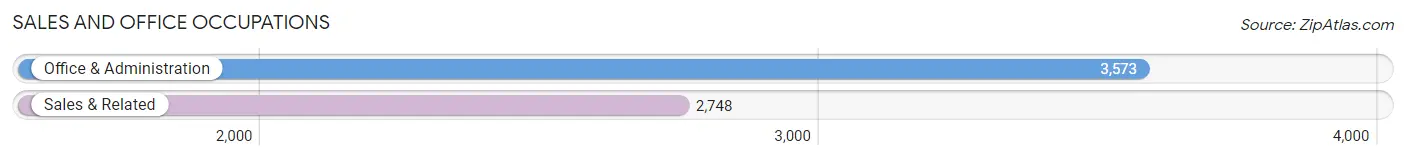
Sales and Office Occupations by Sex
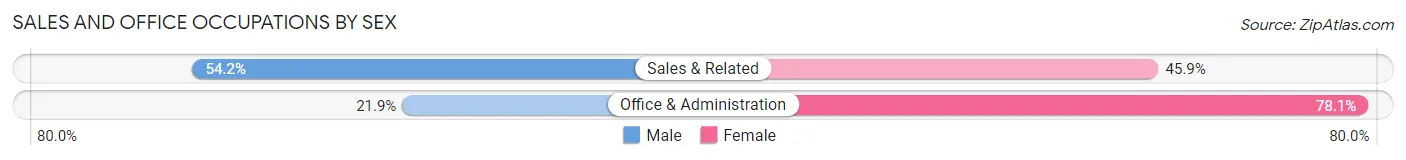
| Occupation | Male | Female |
| Sales & Related | 1,488 (54.1%) | 1,260 (45.9%) |
| Office & Administration | 783 (21.9%) | 2,790 (78.1%) |
| Total (Category) | 2,271 (35.9%) | 4,050 (64.1%) |
| Total (Overall) | 17,122 (51.8%) | 15,904 (48.2%) |
Natural Resources, Construction and Maintenance Occupations
The most common Natural Resources, Construction and Maintenance occupations in Rice County are Construction & Extraction (1,865 | 5.7%), Installation, Maintenance & Repair (1,502 | 4.5%), and Farming, Fishing & Forestry (323 | 1.0%).
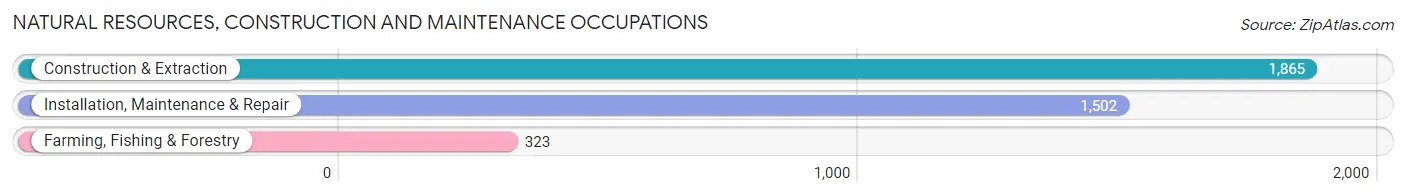
Natural Resources, Construction and Maintenance Occupations by Sex
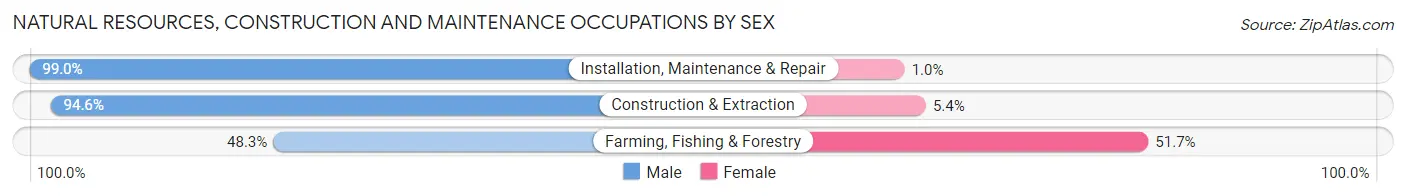
| Occupation | Male | Female |
| Farming, Fishing & Forestry | 156 (48.3%) | 167 (51.7%) |
| Construction & Extraction | 1,764 (94.6%) | 101 (5.4%) |
| Installation, Maintenance & Repair | 1,487 (99.0%) | 15 (1.0%) |
| Total (Category) | 3,407 (92.3%) | 283 (7.7%) |
| Total (Overall) | 17,122 (51.8%) | 15,904 (48.2%) |
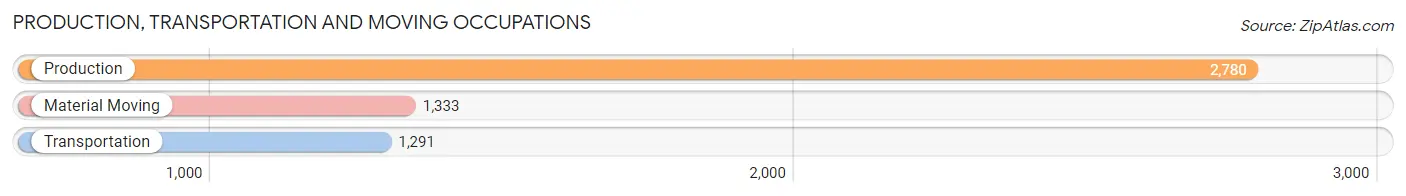
Production, Transportation and Moving Occupations
The most common Production, Transportation and Moving occupations in Rice County are Production (2,780 | 8.4%), Material Moving (1,333 | 4.0%), and Transportation (1,291 | 3.9%).
Production, Transportation and Moving Occupations by Sex
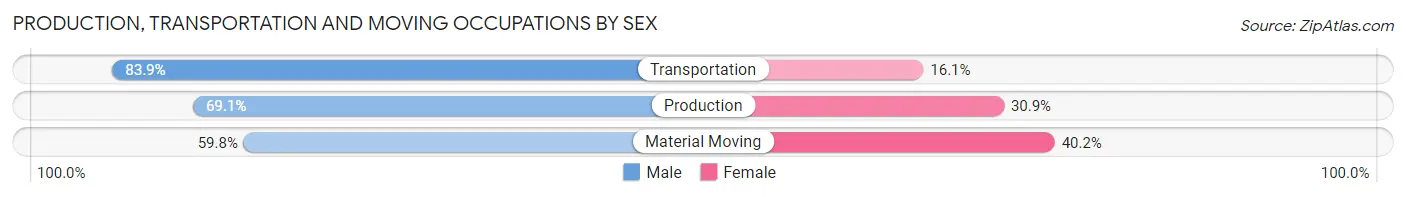
| Occupation | Male | Female |
| Production | 1,921 (69.1%) | 859 (30.9%) |
| Transportation | 1,083 (83.9%) | 208 (16.1%) |
| Material Moving | 797 (59.8%) | 536 (40.2%) |
| Total (Category) | 3,801 (70.3%) | 1,603 (29.7%) |
| Total (Overall) | 17,122 (51.8%) | 15,904 (48.2%) |
Employment Industries by Sex in Rice County
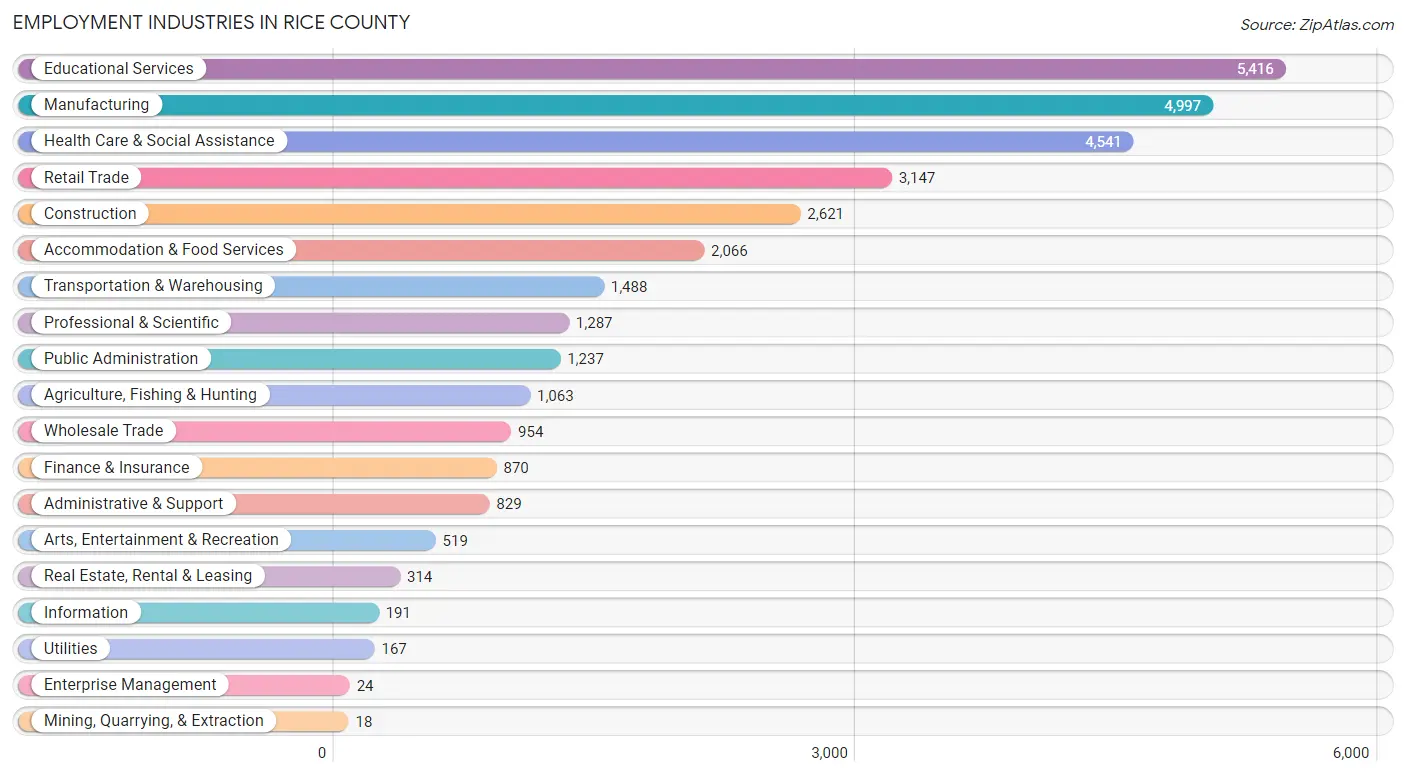
Employment Industries in Rice County
The major employment industries in Rice County include Educational Services (5,416 | 16.4%), Manufacturing (4,997 | 15.1%), Health Care & Social Assistance (4,541 | 13.8%), Retail Trade (3,147 | 9.5%), and Construction (2,621 | 7.9%).
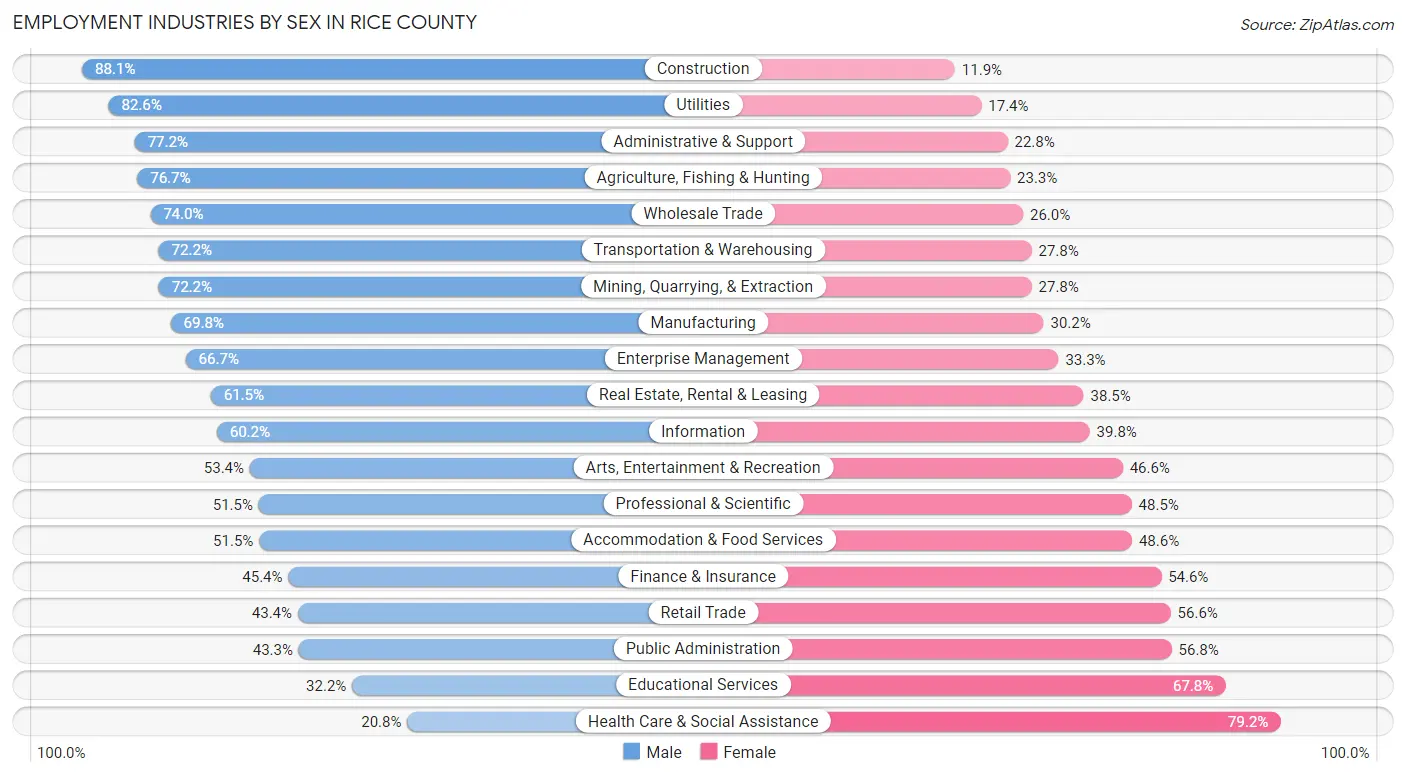
Employment Industries by Sex in Rice County
The Rice County industries that see more men than women are Construction (88.1%), Utilities (82.6%), and Administrative & Support (77.2%), whereas the industries that tend to have a higher number of women are Health Care & Social Assistance (79.2%), Educational Services (67.8%), and Public Administration (56.8%).
| Industry | Male | Female |
| Agriculture, Fishing & Hunting | 815 (76.7%) | 248 (23.3%) |
| Mining, Quarrying, & Extraction | 13 (72.2%) | 5 (27.8%) |
| Construction | 2,309 (88.1%) | 312 (11.9%) |
| Manufacturing | 3,486 (69.8%) | 1,511 (30.2%) |
| Wholesale Trade | 706 (74.0%) | 248 (26.0%) |
| Retail Trade | 1,367 (43.4%) | 1,780 (56.6%) |
| Transportation & Warehousing | 1,075 (72.2%) | 413 (27.8%) |
| Utilities | 138 (82.6%) | 29 (17.4%) |
| Information | 115 (60.2%) | 76 (39.8%) |
| Finance & Insurance | 395 (45.4%) | 475 (54.6%) |
| Real Estate, Rental & Leasing | 193 (61.5%) | 121 (38.5%) |
| Professional & Scientific | 663 (51.5%) | 624 (48.5%) |
| Enterprise Management | 16 (66.7%) | 8 (33.3%) |
| Administrative & Support | 640 (77.2%) | 189 (22.8%) |
| Educational Services | 1,744 (32.2%) | 3,672 (67.8%) |
| Health Care & Social Assistance | 944 (20.8%) | 3,597 (79.2%) |
| Arts, Entertainment & Recreation | 277 (53.4%) | 242 (46.6%) |
| Accommodation & Food Services | 1,063 (51.4%) | 1,003 (48.5%) |
| Public Administration | 535 (43.2%) | 702 (56.8%) |
| Total | 17,122 (51.8%) | 15,904 (48.2%) |
Education in Rice County
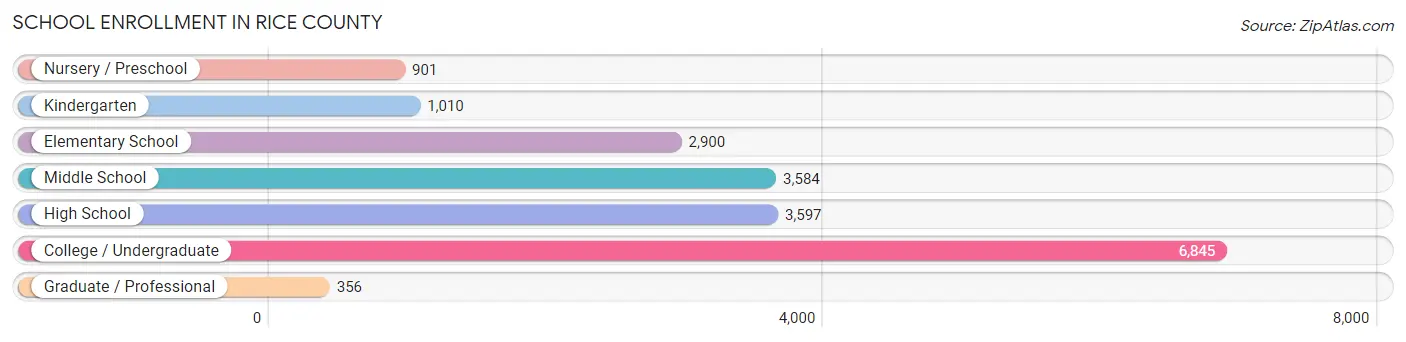
School Enrollment in Rice County
The most common levels of schooling among the 19,193 students in Rice County are college / undergraduate (6,845 | 35.7%), high school (3,597 | 18.7%), and middle school (3,584 | 18.7%).
| School Level | # Students | % Students |
| Nursery / Preschool | 901 | 4.7% |
| Kindergarten | 1,010 | 5.3% |
| Elementary School | 2,900 | 15.1% |
| Middle School | 3,584 | 18.7% |
| High School | 3,597 | 18.7% |
| College / Undergraduate | 6,845 | 35.7% |
| Graduate / Professional | 356 | 1.8% |
| Total | 19,193 | 100.0% |
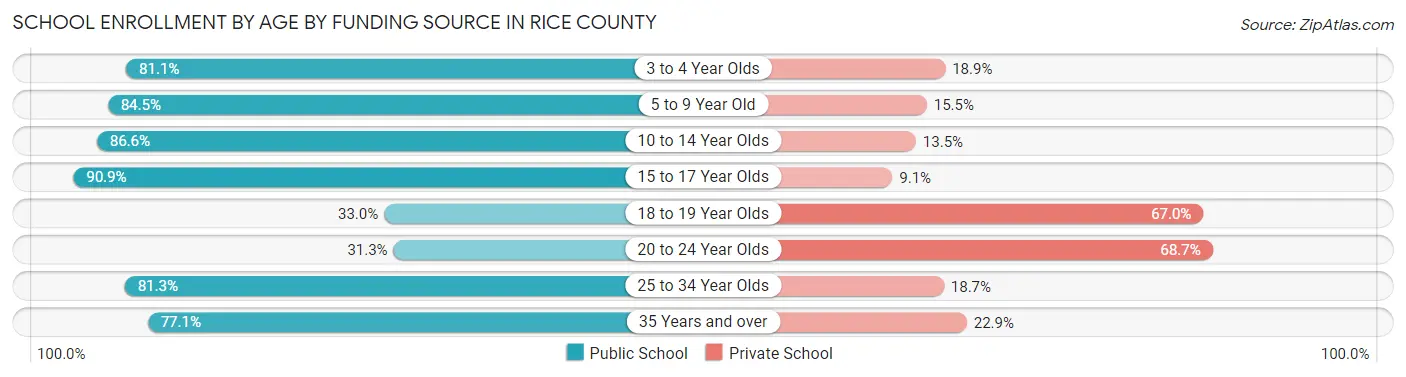
School Enrollment by Age by Funding Source in Rice County
Out of a total of 19,193 students who are enrolled in schools in Rice County, 6,430 (33.5%) attend a private institution, while the remaining 12,763 (66.5%) are enrolled in public schools. The age group of 20 to 24 year olds has the highest likelihood of being enrolled in private schools, with 2,529 (68.7% in the age bracket) enrolled. Conversely, the age group of 15 to 17 year olds has the lowest likelihood of being enrolled in a private school, with 2,315 (90.9% in the age bracket) attending a public institution.
| Age Bracket | Public School | Private School |
| 3 to 4 Year Olds | 613 (81.1%) | 143 (18.9%) |
| 5 to 9 Year Old | 3,038 (84.5%) | 557 (15.5%) |
| 10 to 14 Year Olds | 3,751 (86.6%) | 583 (13.5%) |
| 15 to 17 Year Olds | 2,315 (90.9%) | 231 (9.1%) |
| 18 to 19 Year Olds | 1,073 (33.0%) | 2,175 (67.0%) |
| 20 to 24 Year Olds | 1,152 (31.3%) | 2,529 (68.7%) |
| 25 to 34 Year Olds | 475 (81.3%) | 109 (18.7%) |
| 35 Years and over | 346 (77.1%) | 103 (22.9%) |
| Total | 12,763 (66.5%) | 6,430 (33.5%) |
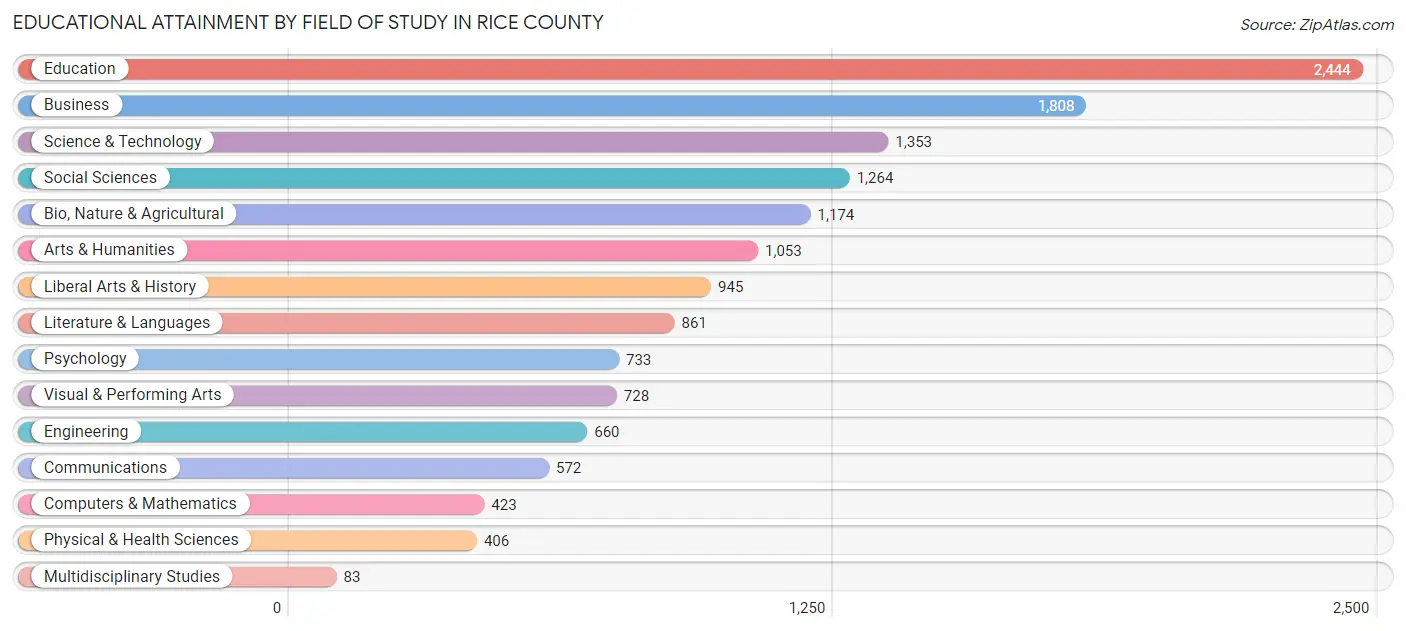
Educational Attainment by Field of Study in Rice County
Education (2,444 | 16.9%), business (1,808 | 12.5%), science & technology (1,353 | 9.3%), social sciences (1,264 | 8.7%), and bio, nature & agricultural (1,174 | 8.1%) are the most common fields of study among 14,507 individuals in Rice County who have obtained a bachelor's degree or higher.
| Field of Study | # Graduates | % Graduates |
| Computers & Mathematics | 423 | 2.9% |
| Bio, Nature & Agricultural | 1,174 | 8.1% |
| Physical & Health Sciences | 406 | 2.8% |
| Psychology | 733 | 5.1% |
| Social Sciences | 1,264 | 8.7% |
| Engineering | 660 | 4.5% |
| Multidisciplinary Studies | 83 | 0.6% |
| Science & Technology | 1,353 | 9.3% |
| Business | 1,808 | 12.5% |
| Education | 2,444 | 16.9% |
| Literature & Languages | 861 | 5.9% |
| Liberal Arts & History | 945 | 6.5% |
| Visual & Performing Arts | 728 | 5.0% |
| Communications | 572 | 3.9% |
| Arts & Humanities | 1,053 | 7.3% |
| Total | 14,507 | 100.0% |
Transportation & Commute in Rice County
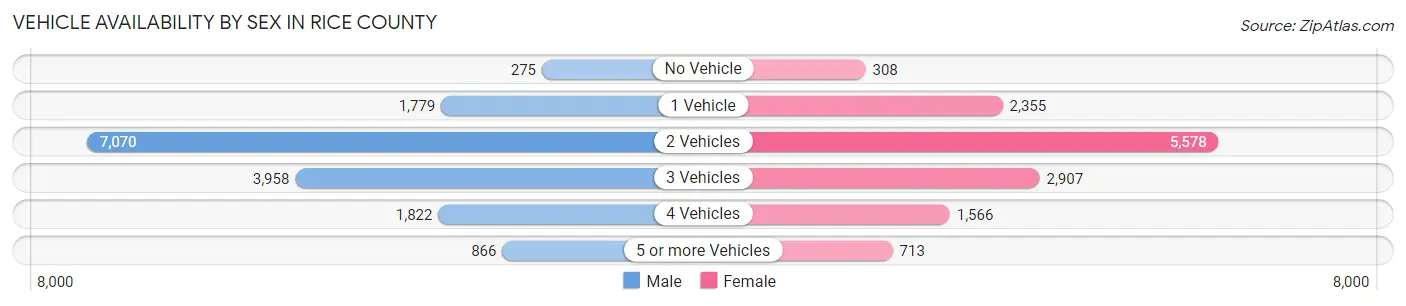
Vehicle Availability by Sex in Rice County
The most prevalent vehicle ownership categories in Rice County are males with 2 vehicles (7,070, accounting for 44.8%) and females with 2 vehicles (5,578, making up 52.7%).
| Vehicles Available | Male | Female |
| No Vehicle | 275 (1.7%) | 308 (2.3%) |
| 1 Vehicle | 1,779 (11.3%) | 2,355 (17.5%) |
| 2 Vehicles | 7,070 (44.8%) | 5,578 (41.5%) |
| 3 Vehicles | 3,958 (25.1%) | 2,907 (21.6%) |
| 4 Vehicles | 1,822 (11.6%) | 1,566 (11.7%) |
| 5 or more Vehicles | 866 (5.5%) | 713 (5.3%) |
| Total | 15,770 (100.0%) | 13,427 (100.0%) |
Commute Time in Rice County
The most frequently occuring commute durations in Rice County are 5 to 9 minutes (5,364 commuters, 19.1%), 10 to 14 minutes (5,133 commuters, 18.3%), and 20 to 24 minutes (3,252 commuters, 11.6%).
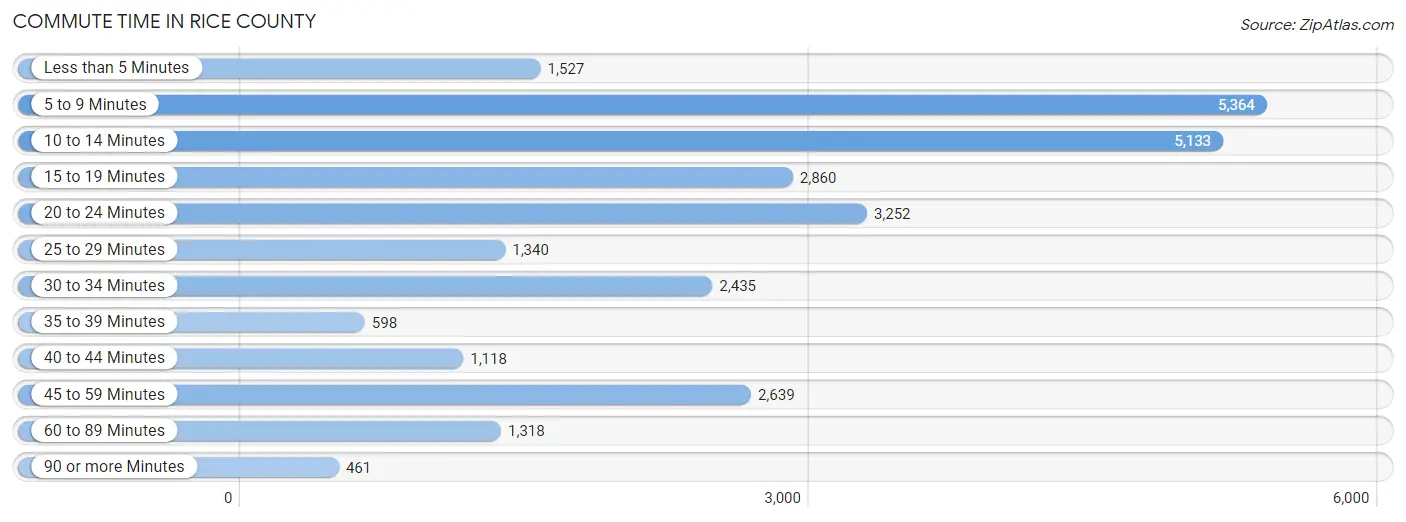
| Commute Time | # Commuters | % Commuters |
| Less than 5 Minutes | 1,527 | 5.4% |
| 5 to 9 Minutes | 5,364 | 19.1% |
| 10 to 14 Minutes | 5,133 | 18.3% |
| 15 to 19 Minutes | 2,860 | 10.2% |
| 20 to 24 Minutes | 3,252 | 11.6% |
| 25 to 29 Minutes | 1,340 | 4.8% |
| 30 to 34 Minutes | 2,435 | 8.7% |
| 35 to 39 Minutes | 598 | 2.1% |
| 40 to 44 Minutes | 1,118 | 4.0% |
| 45 to 59 Minutes | 2,639 | 9.4% |
| 60 to 89 Minutes | 1,318 | 4.7% |
| 90 or more Minutes | 461 | 1.6% |
Commute Time by Sex in Rice County
The most common commute times in Rice County are 10 to 14 minutes (2,603 commuters, 17.6%) for males and 5 to 9 minutes (3,134 commuters, 23.6%) for females.
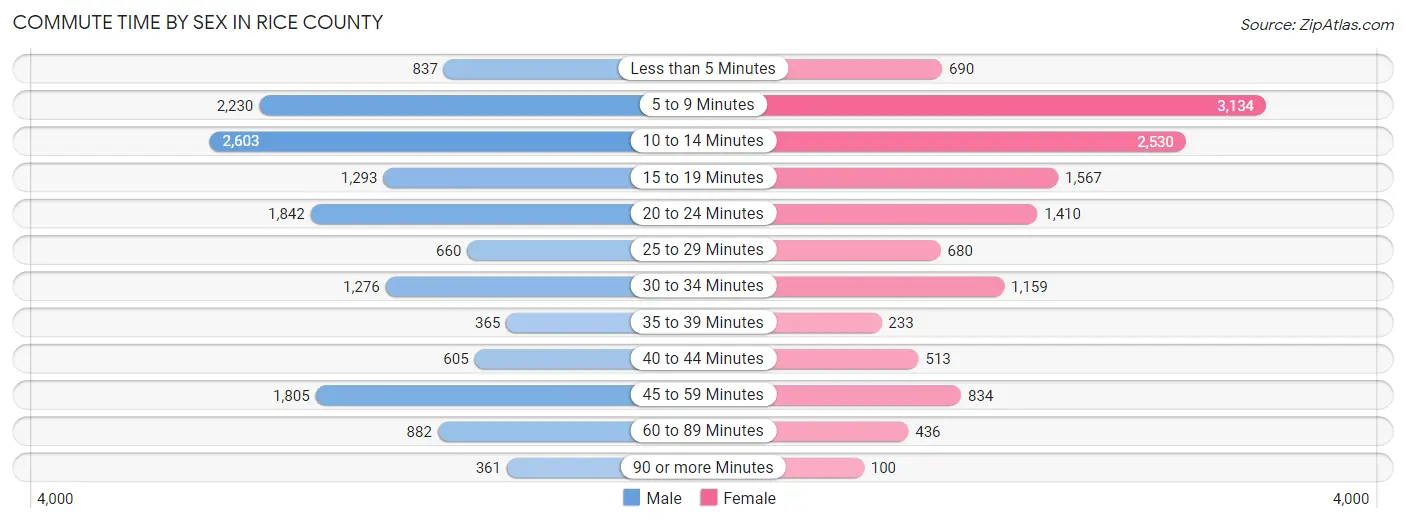
| Commute Time | Male | Female |
| Less than 5 Minutes | 837 (5.7%) | 690 (5.2%) |
| 5 to 9 Minutes | 2,230 (15.1%) | 3,134 (23.6%) |
| 10 to 14 Minutes | 2,603 (17.6%) | 2,530 (19.0%) |
| 15 to 19 Minutes | 1,293 (8.8%) | 1,567 (11.8%) |
| 20 to 24 Minutes | 1,842 (12.5%) | 1,410 (10.6%) |
| 25 to 29 Minutes | 660 (4.5%) | 680 (5.1%) |
| 30 to 34 Minutes | 1,276 (8.6%) | 1,159 (8.7%) |
| 35 to 39 Minutes | 365 (2.5%) | 233 (1.8%) |
| 40 to 44 Minutes | 605 (4.1%) | 513 (3.9%) |
| 45 to 59 Minutes | 1,805 (12.2%) | 834 (6.3%) |
| 60 to 89 Minutes | 882 (6.0%) | 436 (3.3%) |
| 90 or more Minutes | 361 (2.5%) | 100 (0.7%) |
Time of Departure to Work by Sex in Rice County
The most frequent times of departure to work in Rice County are 7:00 AM to 7:29 AM (1,758, 11.9%) for males and 7:00 AM to 7:29 AM (2,115, 15.9%) for females.
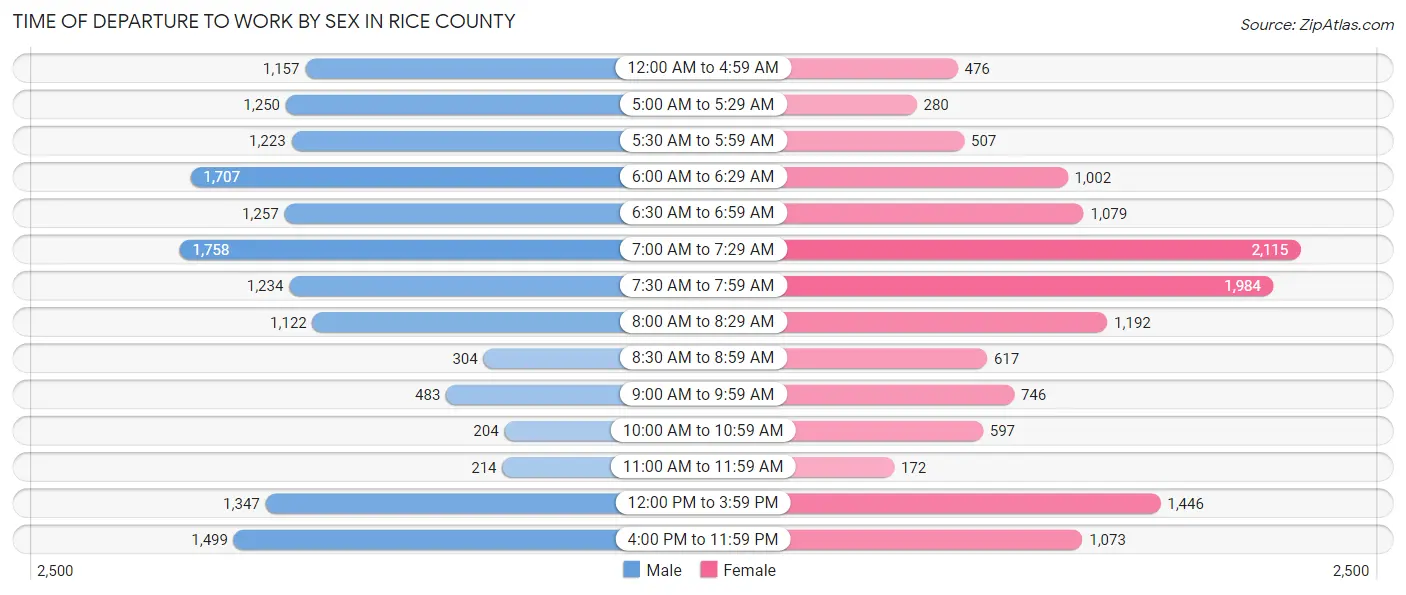
| Time of Departure | Male | Female |
| 12:00 AM to 4:59 AM | 1,157 (7.8%) | 476 (3.6%) |
| 5:00 AM to 5:29 AM | 1,250 (8.5%) | 280 (2.1%) |
| 5:30 AM to 5:59 AM | 1,223 (8.3%) | 507 (3.8%) |
| 6:00 AM to 6:29 AM | 1,707 (11.6%) | 1,002 (7.5%) |
| 6:30 AM to 6:59 AM | 1,257 (8.5%) | 1,079 (8.1%) |
| 7:00 AM to 7:29 AM | 1,758 (11.9%) | 2,115 (15.9%) |
| 7:30 AM to 7:59 AM | 1,234 (8.4%) | 1,984 (14.9%) |
| 8:00 AM to 8:29 AM | 1,122 (7.6%) | 1,192 (9.0%) |
| 8:30 AM to 8:59 AM | 304 (2.1%) | 617 (4.6%) |
| 9:00 AM to 9:59 AM | 483 (3.3%) | 746 (5.6%) |
| 10:00 AM to 10:59 AM | 204 (1.4%) | 597 (4.5%) |
| 11:00 AM to 11:59 AM | 214 (1.5%) | 172 (1.3%) |
| 12:00 PM to 3:59 PM | 1,347 (9.1%) | 1,446 (10.9%) |
| 4:00 PM to 11:59 PM | 1,499 (10.2%) | 1,073 (8.1%) |
| Total | 14,759 (100.0%) | 13,286 (100.0%) |
Housing Occupancy in Rice County
Occupancy by Ownership in Rice County
Of the total 23,265 dwellings in Rice County, owner-occupied units account for 17,566 (75.5%), while renter-occupied units make up 5,699 (24.5%).
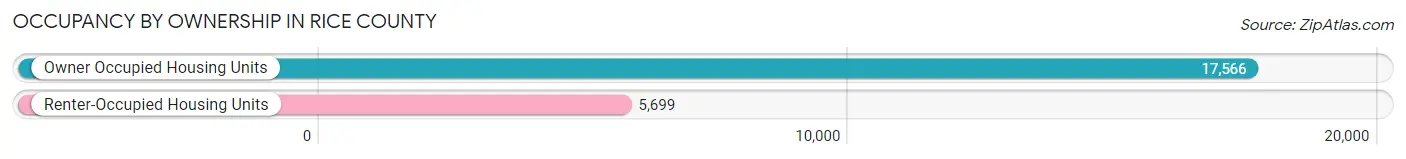
| Occupancy | # Housing Units | % Housing Units |
| Owner Occupied Housing Units | 17,566 | 75.5% |
| Renter-Occupied Housing Units | 5,699 | 24.5% |
| Total Occupied Housing Units | 23,265 | 100.0% |
Occupancy by Household Size in Rice County
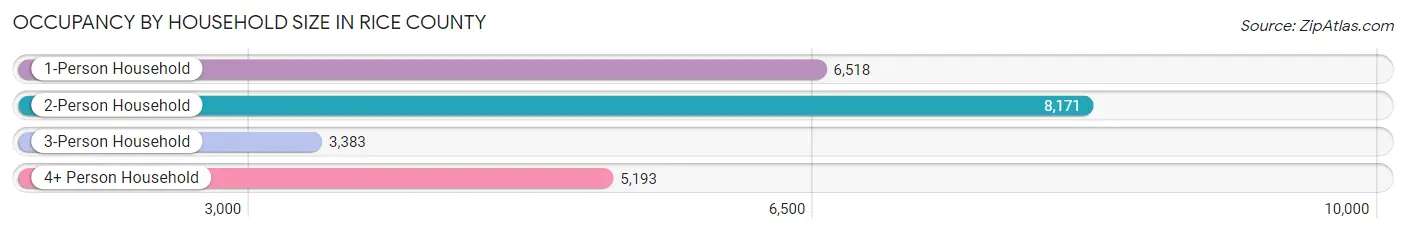
| Household Size | # Housing Units | % Housing Units |
| 1-Person Household | 6,518 | 28.0% |
| 2-Person Household | 8,171 | 35.1% |
| 3-Person Household | 3,383 | 14.5% |
| 4+ Person Household | 5,193 | 22.3% |
| Total Housing Units | 23,265 | 100.0% |
Occupancy by Ownership by Household Size in Rice County
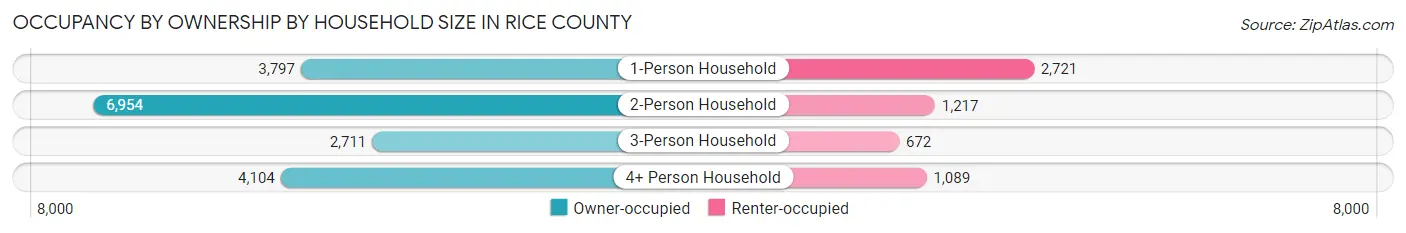
| Household Size | Owner-occupied | Renter-occupied |
| 1-Person Household | 3,797 (58.3%) | 2,721 (41.7%) |
| 2-Person Household | 6,954 (85.1%) | 1,217 (14.9%) |
| 3-Person Household | 2,711 (80.1%) | 672 (19.9%) |
| 4+ Person Household | 4,104 (79.0%) | 1,089 (21.0%) |
| Total Housing Units | 17,566 (75.5%) | 5,699 (24.5%) |
Occupancy by Educational Attainment in Rice County
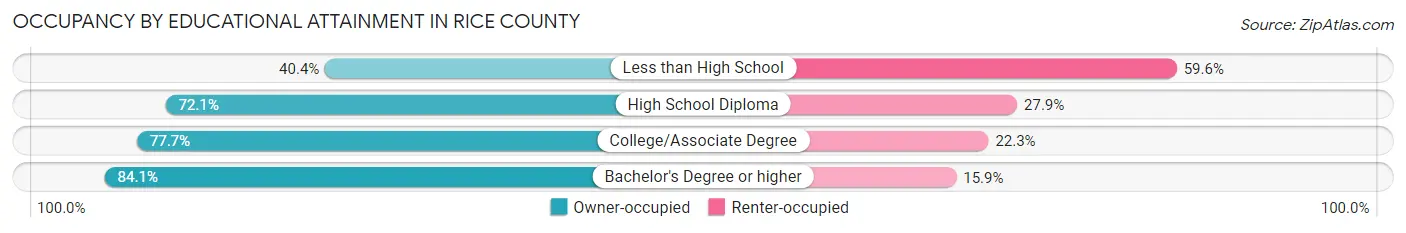
| Household Size | Owner-occupied | Renter-occupied |
| Less than High School | 702 (40.4%) | 1,035 (59.6%) |
| High School Diploma | 4,651 (72.1%) | 1,803 (27.9%) |
| College/Associate Degree | 5,695 (77.7%) | 1,631 (22.3%) |
| Bachelor's Degree or higher | 6,518 (84.1%) | 1,230 (15.9%) |
Occupancy by Age of Householder in Rice County
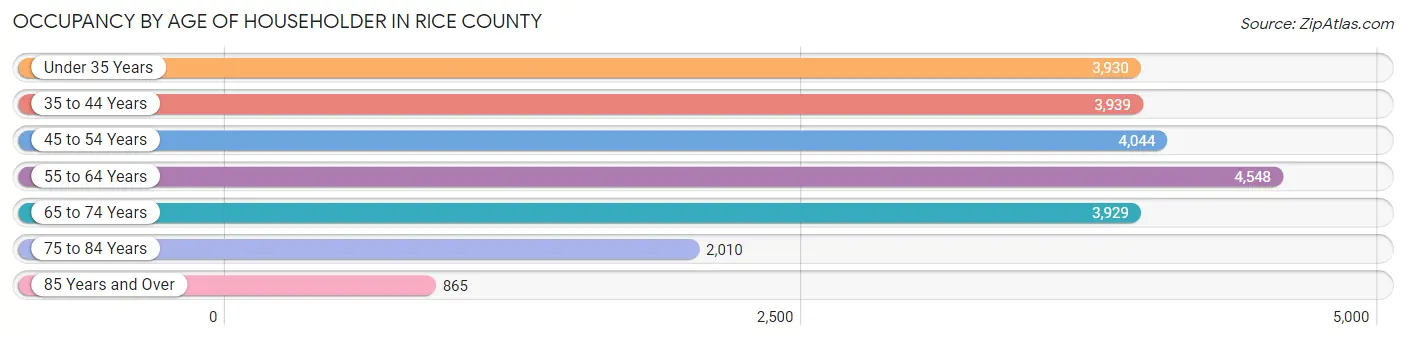
| Age Bracket | # Households | % Households |
| Under 35 Years | 3,930 | 16.9% |
| 35 to 44 Years | 3,939 | 16.9% |
| 45 to 54 Years | 4,044 | 17.4% |
| 55 to 64 Years | 4,548 | 19.6% |
| 65 to 74 Years | 3,929 | 16.9% |
| 75 to 84 Years | 2,010 | 8.6% |
| 85 Years and Over | 865 | 3.7% |
| Total | 23,265 | 100.0% |
Housing Finances in Rice County
Median Income by Occupancy in Rice County
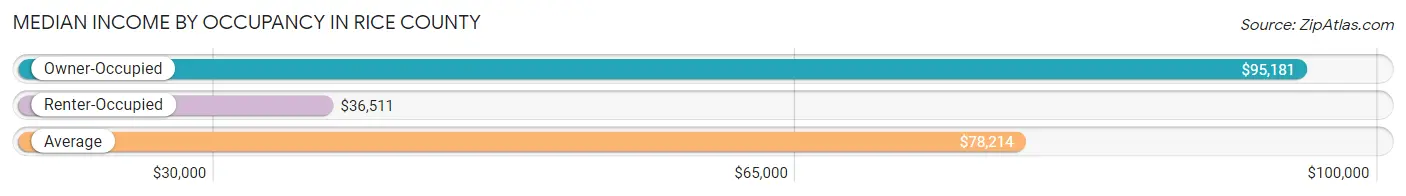
| Occupancy Type | # Households | Median Income |
| Owner-Occupied | 17,566 (75.5%) | $95,181 |
| Renter-Occupied | 5,699 (24.5%) | $36,511 |
| Average | 23,265 (100.0%) | $78,214 |
Occupancy by Householder Income Bracket in Rice County
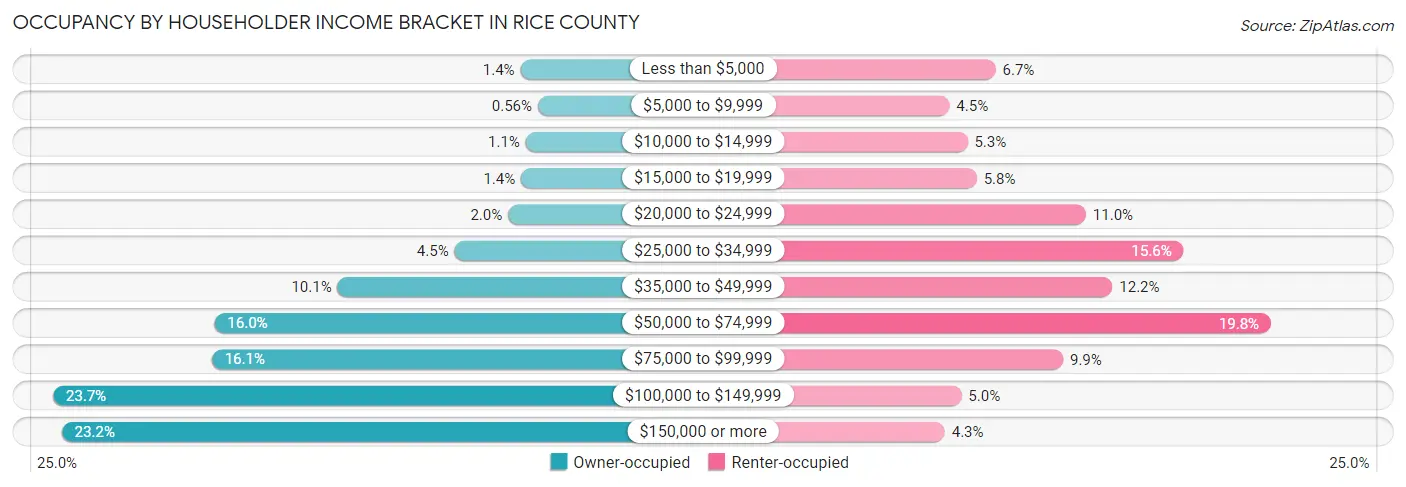
| Income Bracket | Owner-occupied | Renter-occupied |
| Less than $5,000 | 244 (1.4%) | 380 (6.7%) |
| $5,000 to $9,999 | 98 (0.6%) | 255 (4.5%) |
| $10,000 to $14,999 | 200 (1.1%) | 304 (5.3%) |
| $15,000 to $19,999 | 239 (1.4%) | 329 (5.8%) |
| $20,000 to $24,999 | 348 (2.0%) | 625 (11.0%) |
| $25,000 to $34,999 | 796 (4.5%) | 890 (15.6%) |
| $35,000 to $49,999 | 1,774 (10.1%) | 697 (12.2%) |
| $50,000 to $74,999 | 2,803 (16.0%) | 1,127 (19.8%) |
| $75,000 to $99,999 | 2,826 (16.1%) | 563 (9.9%) |
| $100,000 to $149,999 | 4,155 (23.6%) | 287 (5.0%) |
| $150,000 or more | 4,083 (23.2%) | 242 (4.3%) |
| Total | 17,566 (100.0%) | 5,699 (100.0%) |
Monthly Housing Cost Tiers in Rice County
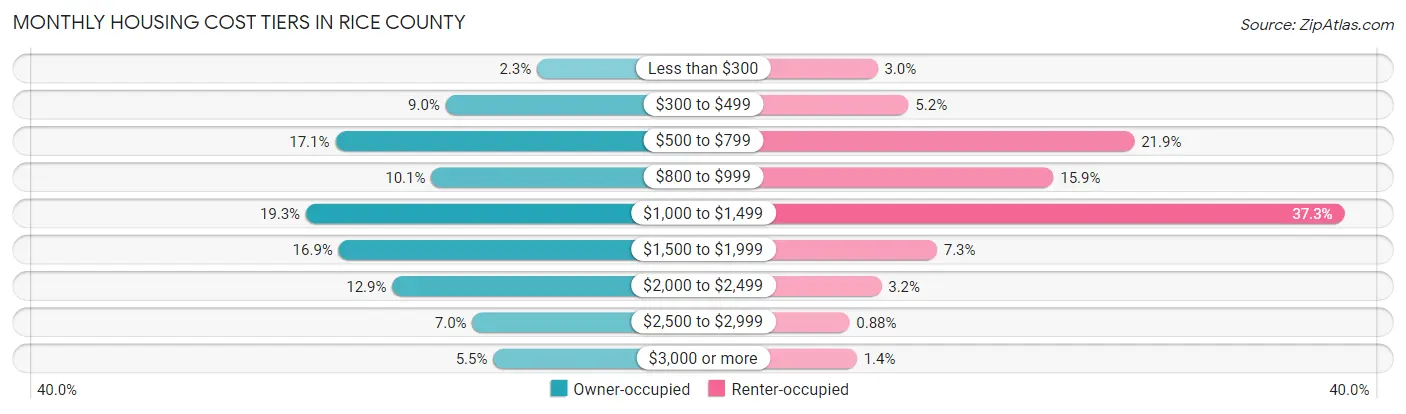
| Monthly Cost | Owner-occupied | Renter-occupied |
| Less than $300 | 397 (2.3%) | 168 (2.9%) |
| $300 to $499 | 1,580 (9.0%) | 298 (5.2%) |
| $500 to $799 | 3,008 (17.1%) | 1,246 (21.9%) |
| $800 to $999 | 1,766 (10.1%) | 906 (15.9%) |
| $1,000 to $1,499 | 3,386 (19.3%) | 2,128 (37.3%) |
| $1,500 to $1,999 | 2,963 (16.9%) | 417 (7.3%) |
| $2,000 to $2,499 | 2,270 (12.9%) | 184 (3.2%) |
| $2,500 to $2,999 | 1,233 (7.0%) | 50 (0.9%) |
| $3,000 or more | 963 (5.5%) | 81 (1.4%) |
| Total | 17,566 (100.0%) | 5,699 (100.0%) |
Physical Housing Characteristics in Rice County
Housing Structures in Rice County
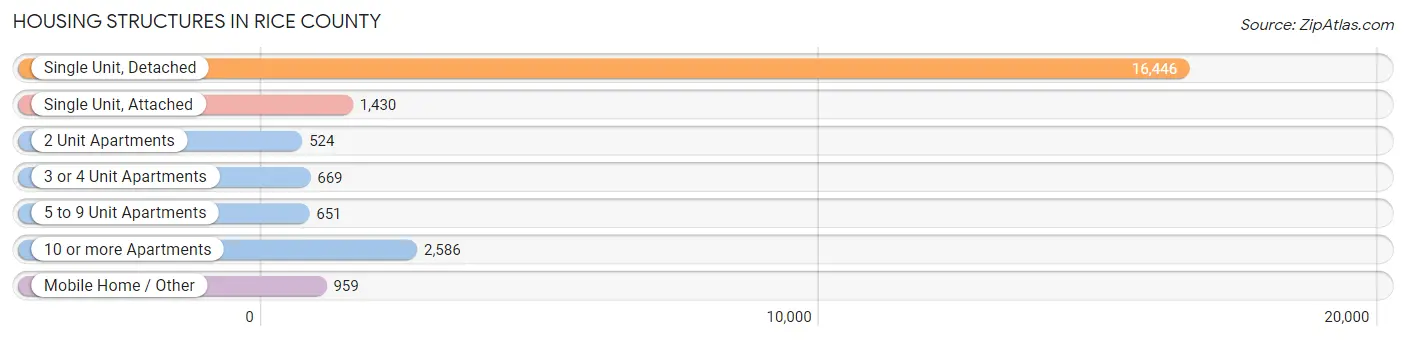
| Structure Type | # Housing Units | % Housing Units |
| Single Unit, Detached | 16,446 | 70.7% |
| Single Unit, Attached | 1,430 | 6.1% |
| 2 Unit Apartments | 524 | 2.2% |
| 3 or 4 Unit Apartments | 669 | 2.9% |
| 5 to 9 Unit Apartments | 651 | 2.8% |
| 10 or more Apartments | 2,586 | 11.1% |
| Mobile Home / Other | 959 | 4.1% |
| Total | 23,265 | 100.0% |
Housing Structures by Occupancy in Rice County
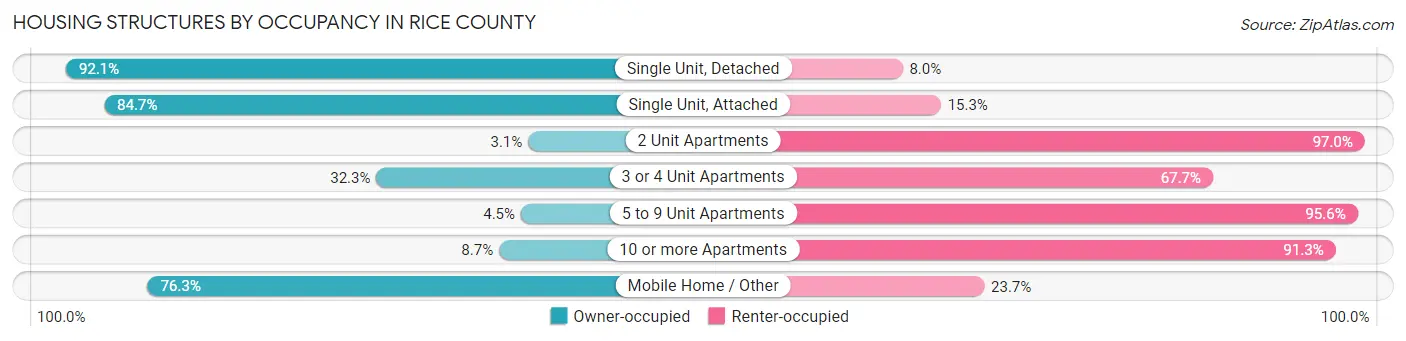
| Structure Type | Owner-occupied | Renter-occupied |
| Single Unit, Detached | 15,138 (92.0%) | 1,308 (8.0%) |
| Single Unit, Attached | 1,211 (84.7%) | 219 (15.3%) |
| 2 Unit Apartments | 16 (3.0%) | 508 (97.0%) |
| 3 or 4 Unit Apartments | 216 (32.3%) | 453 (67.7%) |
| 5 to 9 Unit Apartments | 29 (4.4%) | 622 (95.6%) |
| 10 or more Apartments | 224 (8.7%) | 2,362 (91.3%) |
| Mobile Home / Other | 732 (76.3%) | 227 (23.7%) |
| Total | 17,566 (75.5%) | 5,699 (24.5%) |
Housing Structures by Number of Rooms in Rice County
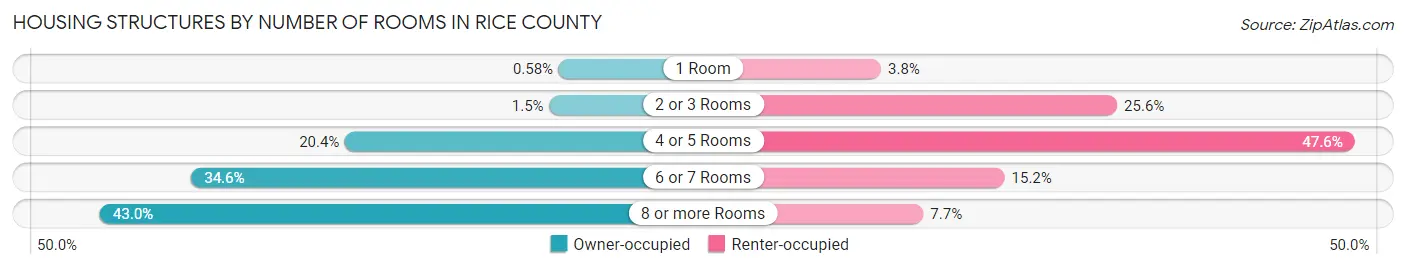
| Number of Rooms | Owner-occupied | Renter-occupied |
| 1 Room | 102 (0.6%) | 217 (3.8%) |
| 2 or 3 Rooms | 256 (1.5%) | 1,461 (25.6%) |
| 4 or 5 Rooms | 3,575 (20.3%) | 2,713 (47.6%) |
| 6 or 7 Rooms | 6,074 (34.6%) | 868 (15.2%) |
| 8 or more Rooms | 7,559 (43.0%) | 440 (7.7%) |
| Total | 17,566 (100.0%) | 5,699 (100.0%) |
Housing Structure by Heating Type in Rice County
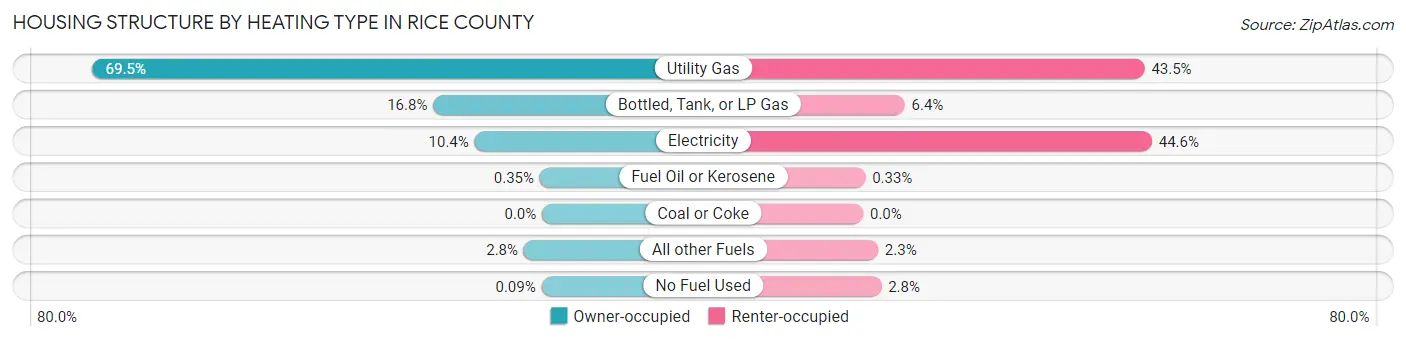
| Heating Type | Owner-occupied | Renter-occupied |
| Utility Gas | 12,205 (69.5%) | 2,479 (43.5%) |
| Bottled, Tank, or LP Gas | 2,956 (16.8%) | 366 (6.4%) |
| Electricity | 1,832 (10.4%) | 2,544 (44.6%) |
| Fuel Oil or Kerosene | 62 (0.4%) | 19 (0.3%) |
| Coal or Coke | 0 (0.0%) | 0 (0.0%) |
| All other Fuels | 495 (2.8%) | 131 (2.3%) |
| No Fuel Used | 16 (0.1%) | 160 (2.8%) |
| Total | 17,566 (100.0%) | 5,699 (100.0%) |
Household Vehicle Usage in Rice County
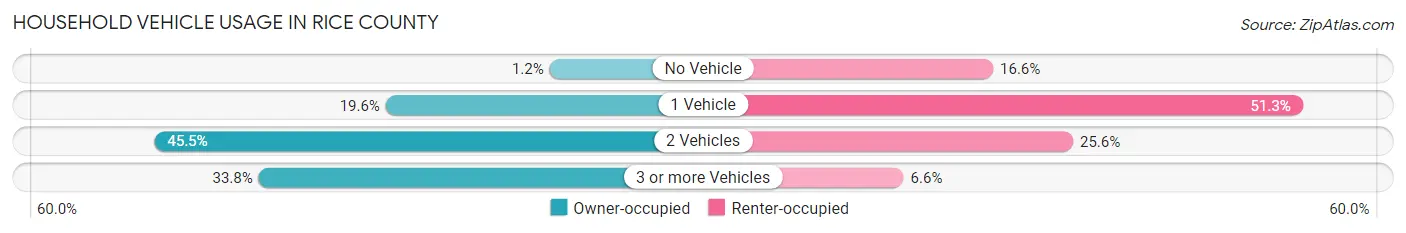
| Vehicles per Household | Owner-occupied | Renter-occupied |
| No Vehicle | 210 (1.2%) | 946 (16.6%) |
| 1 Vehicle | 3,434 (19.6%) | 2,922 (51.3%) |
| 2 Vehicles | 7,986 (45.5%) | 1,456 (25.6%) |
| 3 or more Vehicles | 5,936 (33.8%) | 375 (6.6%) |
| Total | 17,566 (100.0%) | 5,699 (100.0%) |
Real Estate & Mortgages in Rice County
Real Estate and Mortgage Overview in Rice County
| Characteristic | Without Mortgage | With Mortgage |
| Housing Units | 6,503 | 11,063 |
| Median Property Value | $253,600 | $291,200 |
| Median Household Income | $71,930 | $3,099 |
| Monthly Housing Costs | $618 | $875 |
| Real Estate Taxes | $2,647 | $186 |
Property Value by Mortgage Status in Rice County
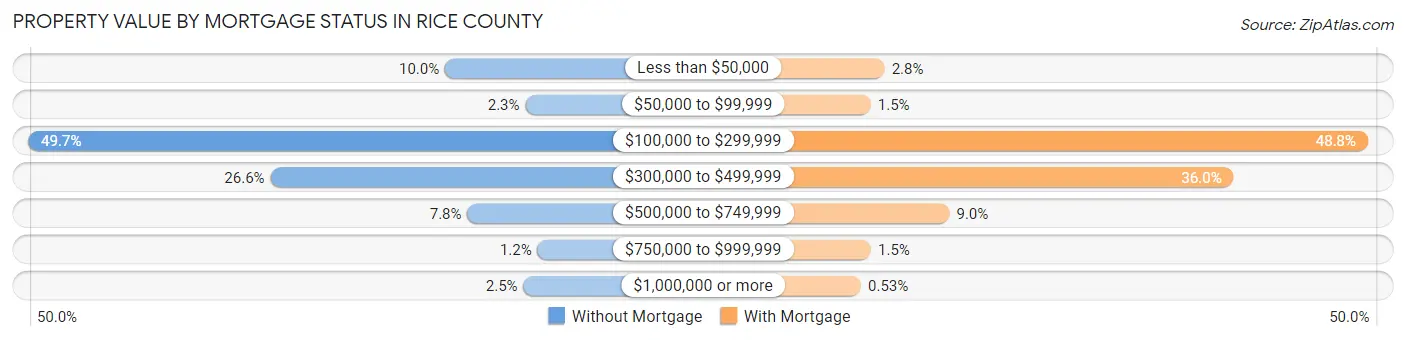
| Property Value | Without Mortgage | With Mortgage |
| Less than $50,000 | 648 (10.0%) | 307 (2.8%) |
| $50,000 to $99,999 | 150 (2.3%) | 162 (1.5%) |
| $100,000 to $299,999 | 3,230 (49.7%) | 5,398 (48.8%) |
| $300,000 to $499,999 | 1,729 (26.6%) | 3,983 (36.0%) |
| $500,000 to $749,999 | 509 (7.8%) | 990 (8.9%) |
| $750,000 to $999,999 | 75 (1.1%) | 164 (1.5%) |
| $1,000,000 or more | 162 (2.5%) | 59 (0.5%) |
| Total | 6,503 (100.0%) | 11,063 (100.0%) |
Household Income by Mortgage Status in Rice County
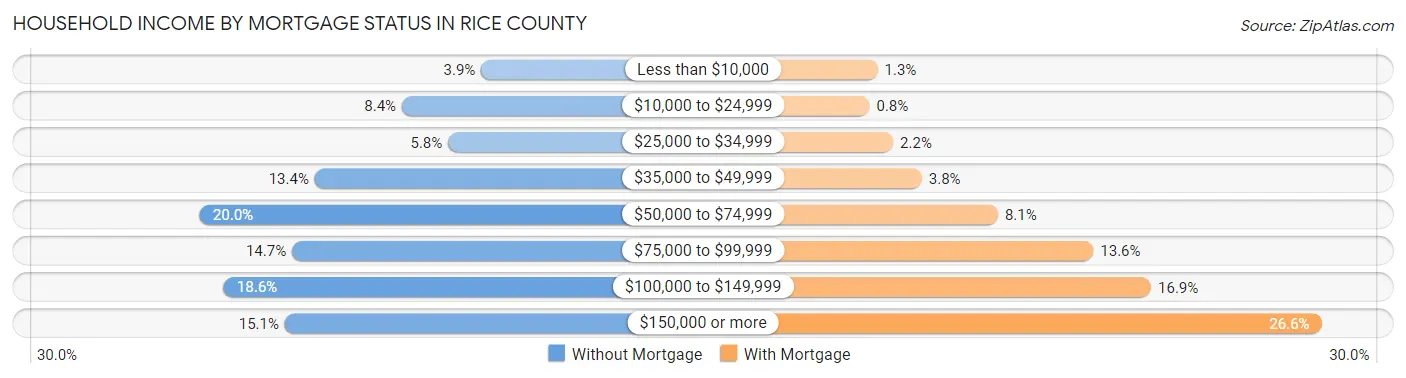
| Household Income | Without Mortgage | With Mortgage |
| Less than $10,000 | 254 (3.9%) | 139 (1.3%) |
| $10,000 to $24,999 | 549 (8.4%) | 88 (0.8%) |
| $25,000 to $34,999 | 377 (5.8%) | 238 (2.1%) |
| $35,000 to $49,999 | 873 (13.4%) | 419 (3.8%) |
| $50,000 to $74,999 | 1,299 (20.0%) | 901 (8.1%) |
| $75,000 to $99,999 | 957 (14.7%) | 1,504 (13.6%) |
| $100,000 to $149,999 | 1,210 (18.6%) | 1,869 (16.9%) |
| $150,000 or more | 984 (15.1%) | 2,945 (26.6%) |
| Total | 6,503 (100.0%) | 11,063 (100.0%) |
Property Value to Household Income Ratio in Rice County
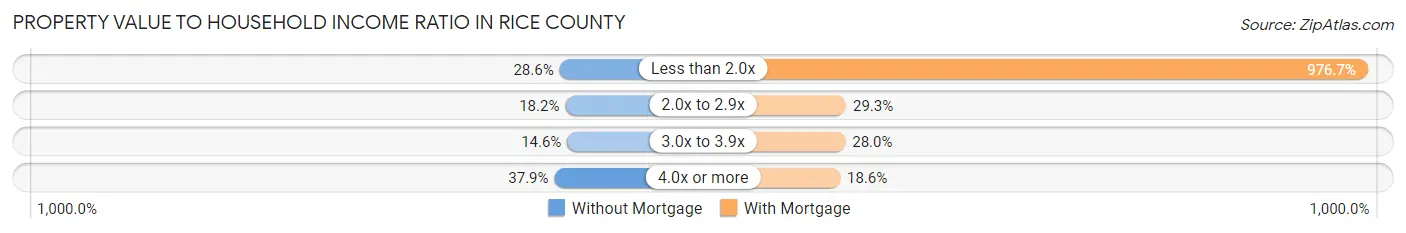
| Value-to-Income Ratio | Without Mortgage | With Mortgage |
| Less than 2.0x | 1,858 (28.6%) | 108,049 (976.7%) |
| 2.0x to 2.9x | 1,182 (18.2%) | 3,245 (29.3%) |
| 3.0x to 3.9x | 946 (14.5%) | 3,092 (28.0%) |
| 4.0x or more | 2,463 (37.9%) | 2,052 (18.5%) |
| Total | 6,503 (100.0%) | 11,063 (100.0%) |
Real Estate Taxes by Mortgage Status in Rice County
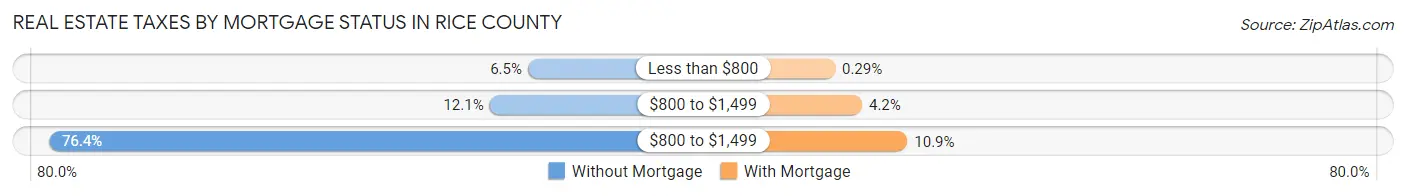
| Property Taxes | Without Mortgage | With Mortgage |
| Less than $800 | 421 (6.5%) | 32 (0.3%) |
| $800 to $1,499 | 785 (12.1%) | 469 (4.2%) |
| $800 to $1,499 | 4,971 (76.4%) | 1,201 (10.9%) |
| Total | 6,503 (100.0%) | 11,063 (100.0%) |
Health & Disability in Rice County
Health Insurance Coverage by Age in Rice County
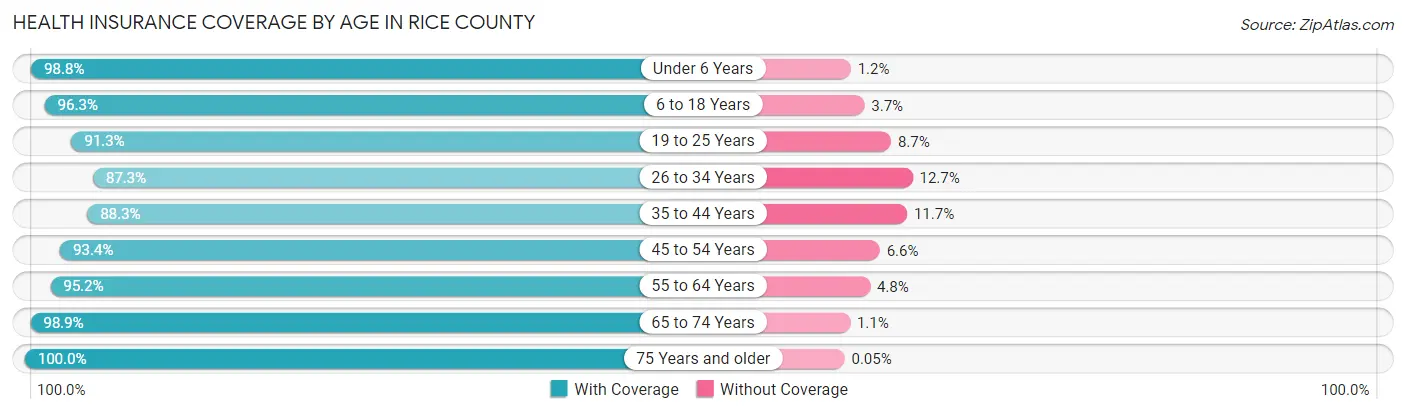
| Age Bracket | With Coverage | Without Coverage |
| Under 6 Years | 4,349 (98.8%) | 53 (1.2%) |
| 6 to 18 Years | 11,259 (96.3%) | 438 (3.7%) |
| 19 to 25 Years | 7,633 (91.3%) | 728 (8.7%) |
| 26 to 34 Years | 5,804 (87.3%) | 846 (12.7%) |
| 35 to 44 Years | 6,773 (88.3%) | 897 (11.7%) |
| 45 to 54 Years | 6,949 (93.4%) | 492 (6.6%) |
| 55 to 64 Years | 7,786 (95.2%) | 392 (4.8%) |
| 65 to 74 Years | 6,248 (98.9%) | 67 (1.1%) |
| 75 Years and older | 4,041 (100.0%) | 2 (0.1%) |
| Total | 60,842 (94.0%) | 3,915 (6.0%) |
Health Insurance Coverage by Citizenship Status in Rice County
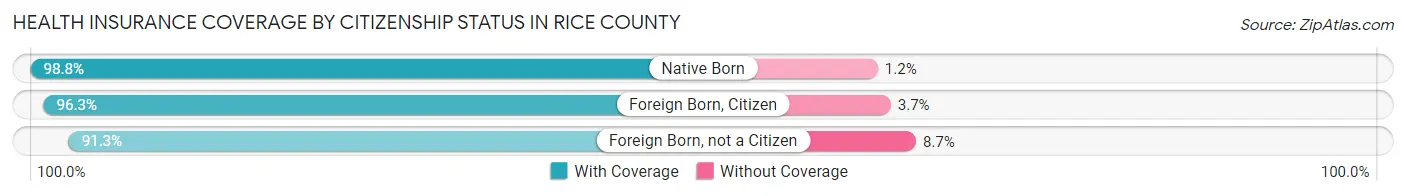
| Citizenship Status | With Coverage | Without Coverage |
| Native Born | 4,349 (98.8%) | 53 (1.2%) |
| Foreign Born, Citizen | 11,259 (96.3%) | 438 (3.7%) |
| Foreign Born, not a Citizen | 7,633 (91.3%) | 728 (8.7%) |
Health Insurance Coverage by Household Income in Rice County
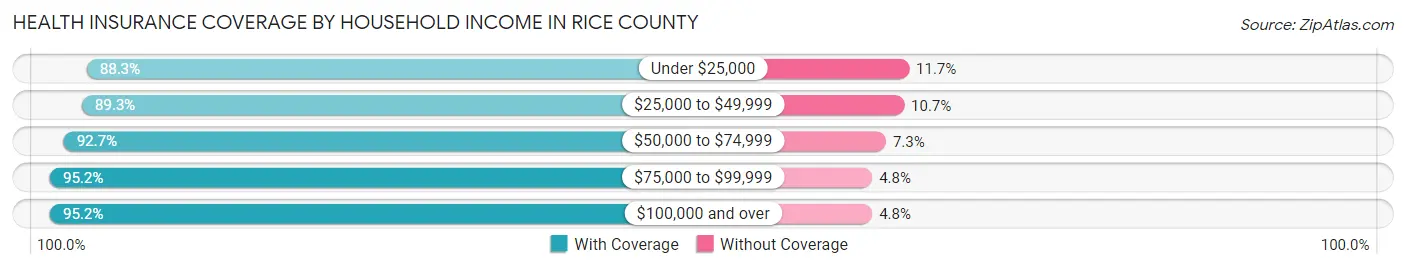
| Household Income | With Coverage | Without Coverage |
| Under $25,000 | 4,003 (88.3%) | 529 (11.7%) |
| $25,000 to $49,999 | 7,207 (89.3%) | 867 (10.7%) |
| $50,000 to $74,999 | 8,515 (92.7%) | 675 (7.3%) |
| $75,000 to $99,999 | 8,735 (95.2%) | 438 (4.8%) |
| $100,000 and over | 26,915 (95.2%) | 1,347 (4.8%) |
Public vs Private Health Insurance Coverage by Age in Rice County
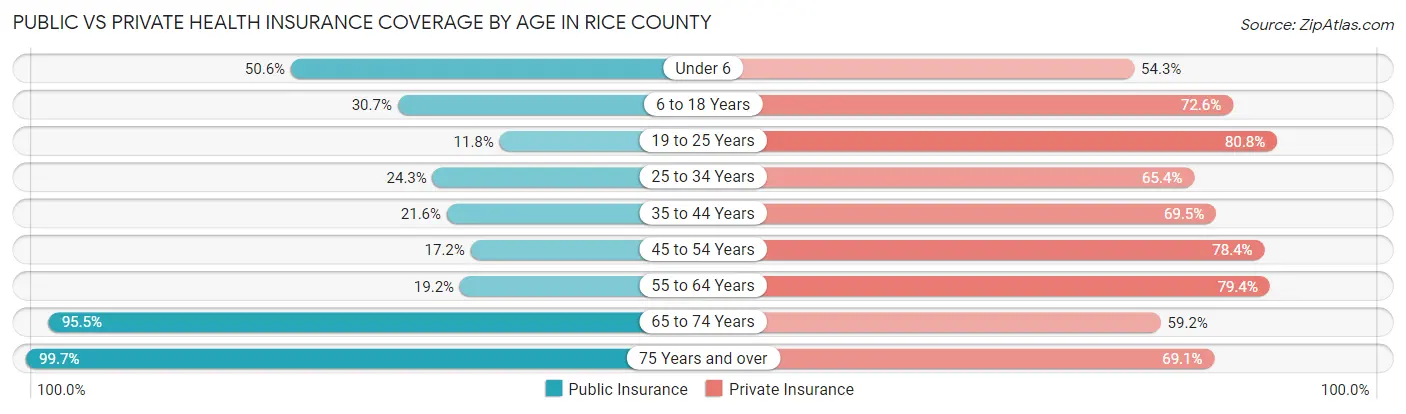
| Age Bracket | Public Insurance | Private Insurance |
| Under 6 | 2,226 (50.6%) | 2,389 (54.3%) |
| 6 to 18 Years | 3,596 (30.7%) | 8,493 (72.6%) |
| 19 to 25 Years | 989 (11.8%) | 6,756 (80.8%) |
| 25 to 34 Years | 1,614 (24.3%) | 4,349 (65.4%) |
| 35 to 44 Years | 1,658 (21.6%) | 5,328 (69.5%) |
| 45 to 54 Years | 1,281 (17.2%) | 5,837 (78.4%) |
| 55 to 64 Years | 1,570 (19.2%) | 6,496 (79.4%) |
| 65 to 74 Years | 6,032 (95.5%) | 3,738 (59.2%) |
| 75 Years and over | 4,031 (99.7%) | 2,795 (69.1%) |
| Total | 22,997 (35.5%) | 46,181 (71.3%) |
Disability Status by Sex by Age in Rice County
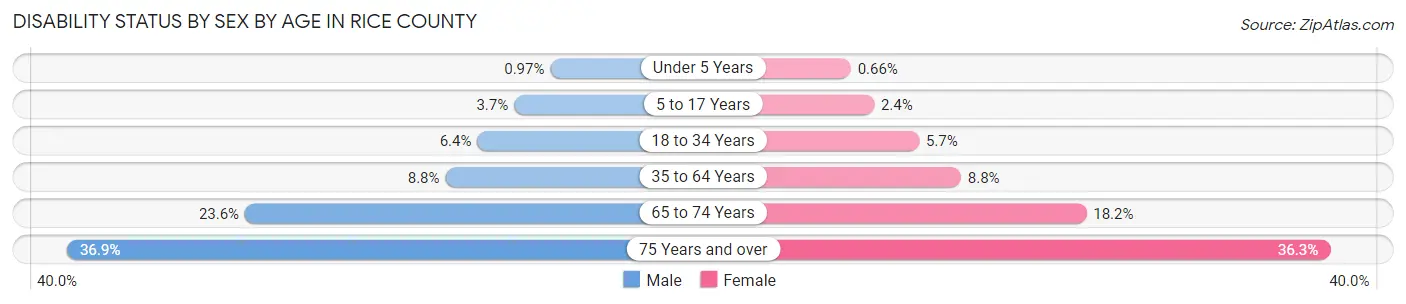
| Age Bracket | Male | Female |
| Under 5 Years | 18 (1.0%) | 12 (0.7%) |
| 5 to 17 Years | 197 (3.7%) | 128 (2.4%) |
| 18 to 34 Years | 534 (6.4%) | 479 (5.7%) |
| 35 to 64 Years | 1,054 (8.8%) | 995 (8.8%) |
| 65 to 74 Years | 718 (23.6%) | 595 (18.1%) |
| 75 Years and over | 643 (36.8%) | 833 (36.2%) |
Disability Class by Sex by Age in Rice County
Disability Class: Hearing Difficulty
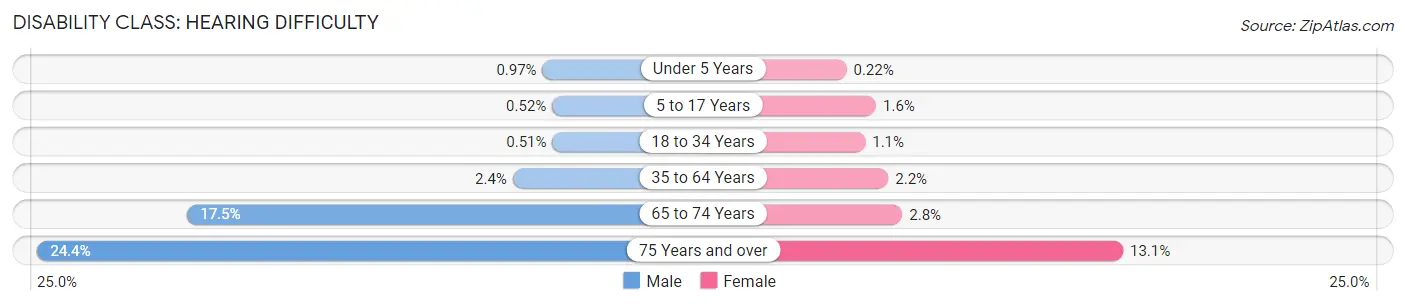
| Age Bracket | Male | Female |
| Under 5 Years | 18 (1.0%) | 4 (0.2%) |
| 5 to 17 Years | 28 (0.5%) | 85 (1.6%) |
| 18 to 34 Years | 43 (0.5%) | 91 (1.1%) |
| 35 to 64 Years | 283 (2.4%) | 243 (2.2%) |
| 65 to 74 Years | 530 (17.4%) | 92 (2.8%) |
| 75 Years and over | 426 (24.4%) | 300 (13.1%) |
Disability Class: Vision Difficulty
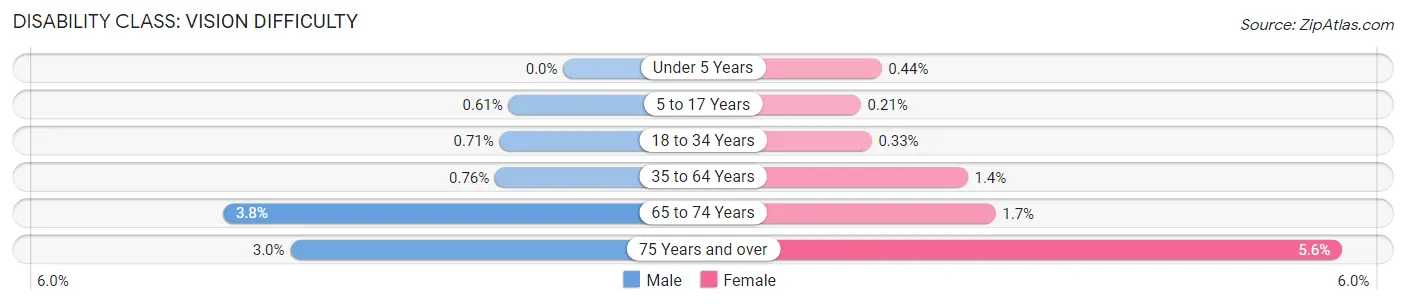
| Age Bracket | Male | Female |
| Under 5 Years | 0 (0.0%) | 8 (0.4%) |
| 5 to 17 Years | 33 (0.6%) | 11 (0.2%) |
| 18 to 34 Years | 59 (0.7%) | 28 (0.3%) |
| 35 to 64 Years | 92 (0.8%) | 158 (1.4%) |
| 65 to 74 Years | 115 (3.8%) | 56 (1.7%) |
| 75 Years and over | 53 (3.0%) | 128 (5.6%) |
Disability Class: Cognitive Difficulty
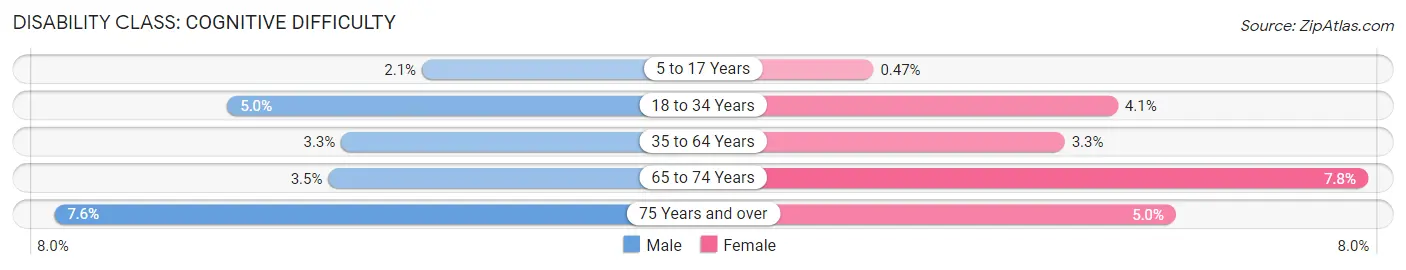
| Age Bracket | Male | Female |
| 5 to 17 Years | 113 (2.1%) | 25 (0.5%) |
| 18 to 34 Years | 417 (5.0%) | 343 (4.1%) |
| 35 to 64 Years | 397 (3.3%) | 373 (3.3%) |
| 65 to 74 Years | 106 (3.5%) | 256 (7.8%) |
| 75 Years and over | 132 (7.6%) | 114 (5.0%) |
Disability Class: Ambulatory Difficulty
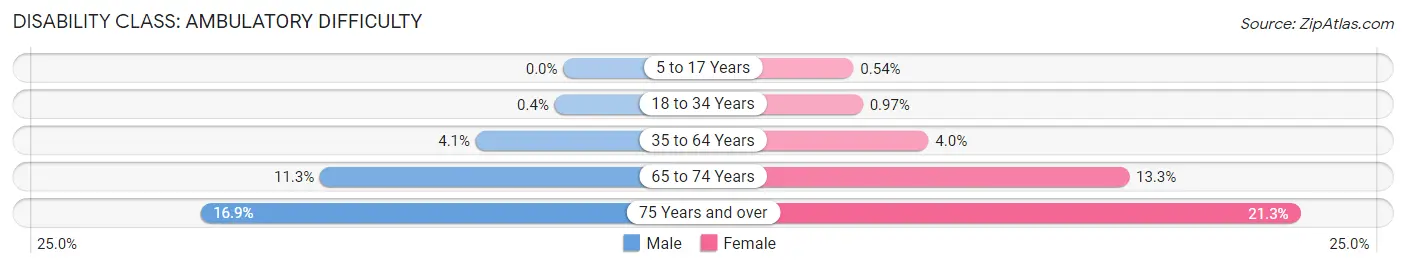
| Age Bracket | Male | Female |
| 5 to 17 Years | 0 (0.0%) | 29 (0.5%) |
| 18 to 34 Years | 33 (0.4%) | 81 (1.0%) |
| 35 to 64 Years | 489 (4.1%) | 452 (4.0%) |
| 65 to 74 Years | 343 (11.3%) | 437 (13.3%) |
| 75 Years and over | 294 (16.9%) | 489 (21.3%) |
Disability Class: Self-Care Difficulty
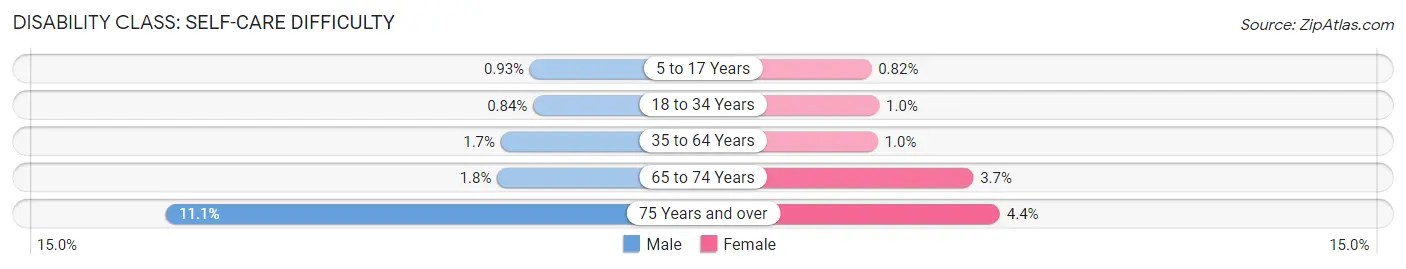
| Age Bracket | Male | Female |
| 5 to 17 Years | 50 (0.9%) | 44 (0.8%) |
| 18 to 34 Years | 70 (0.8%) | 87 (1.0%) |
| 35 to 64 Years | 209 (1.7%) | 112 (1.0%) |
| 65 to 74 Years | 56 (1.8%) | 120 (3.7%) |
| 75 Years and over | 193 (11.1%) | 101 (4.4%) |
Technology Access in Rice County
Computing Device Access in Rice County
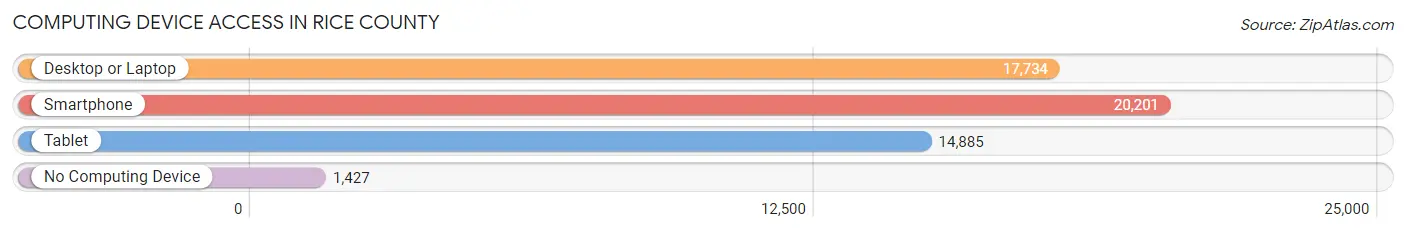
| Device Type | # Households | % Households |
| Desktop or Laptop | 17,734 | 76.2% |
| Smartphone | 20,201 | 86.8% |
| Tablet | 14,885 | 64.0% |
| No Computing Device | 1,427 | 6.1% |
| Total | 23,265 | 100.0% |
Internet Access in Rice County
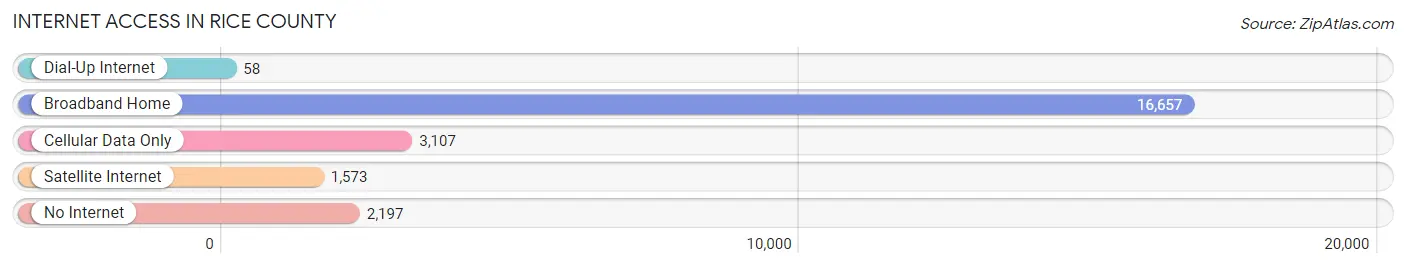
| Internet Type | # Households | % Households |
| Dial-Up Internet | 58 | 0.3% |
| Broadband Home | 16,657 | 71.6% |
| Cellular Data Only | 3,107 | 13.4% |
| Satellite Internet | 1,573 | 6.8% |
| No Internet | 2,197 | 9.4% |
| Total | 23,265 | 100.0% |
Rice County Summary
Rice County, Minnesota is located in the southeastern part of the state, and is part of the Twin Cities metropolitan area. It is bordered by Steele County to the north, Goodhue County to the east, Dakota County to the south, and Scott County to the west. The county seat is Faribault, and the county has a total area of 545 square miles.
History
Rice County was established in 1855 and named after Henry M. Rice, a prominent fur trader and politician in the area. The county was originally part of the Dakota Territory, and was part of the Minnesota Territory when it was established in 1849. The county was organized in 1855, and the first county seat was located in Faribault.
Geography
Rice County is located in the southeastern part of Minnesota, and is part of the Twin Cities metropolitan area. It is bordered by Steele County to the north, Goodhue County to the east, Dakota County to the south, and Scott County to the west. The county has a total area of 545 square miles, and is mostly flat with some rolling hills. The Cannon River runs through the county, and there are several small lakes and ponds scattered throughout the area.
Economy
Rice County has a diverse economy, with a mix of agriculture, manufacturing, and services. The county is home to several large employers, including Faribault Foods, Faribault Woolen Mills, and the Faribault Energy Park. Agriculture is a major part of the economy, with corn, soybeans, and wheat being the main crops. Manufacturing is also a major part of the economy, with several companies producing a variety of products, including medical devices, automotive parts, and food products. The service sector is also important, with several healthcare providers, educational institutions, and government agencies located in the county.
Demographics
As of the 2010 census, Rice County had a population of 64,142. The population was spread out, with 24.3% under the age of 18, 8.2% from 18 to 24, 28.2% from 25 to 44, 24.3% from 45 to 64, and 14.0% who were 65 years of age or older. The median age was 37.4 years. The gender makeup of the county was 49.3% male and 50.7% female.
The median income for a household in Rice County was $60,945, and the median income for a family was $76,945. The per capita income for the county was $27,945. About 6.2% of families and 8.7% of the population were below the poverty line, including 10.2% of those under age 18 and 6.2% of those age 65 or over.
Rice County is a diverse and vibrant community, with a mix of agriculture, manufacturing, and services. The county has a strong economy, and is home to several large employers. The population is diverse, with a mix of ages and incomes. Rice County is a great place to live, work, and play.
Common Questions
What is the Total Population of Rice County?
Total Population of Rice County is 67,152.
What is the Total Male Population of Rice County?
Total Male Population of Rice County is 34,493.
What is the Total Female Population of Rice County?
Total Female Population of Rice County is 32,659.
What is the Ratio of Males per 100 Females in Rice County?
There are 105.62 Males per 100 Females in Rice County.
What is the Ratio of Females per 100 Males in Rice County?
There are 94.68 Females per 100 Males in Rice County.
What is the Median Population Age in Rice County?
Median Population Age in Rice County is 37.1 Years.
What is the Average Family Size in Rice County
Average Family Size in Rice County is 3.1 People.
What is the Average Household Size in Rice County
Average Household Size in Rice County is 2.5 People.
What is Per Capita Income in Rice County?
Per Capita income in Rice County is $37,050.
What is the Median Family Income in Rice County?
Median Family Income in Rice County is $98,475.
What is the Median Household income in Rice County?
Median Household Income in Rice County is $78,214.
What is Income or Wage Gap in Rice County?
Income or Wage Gap in Rice County is 31.0%.
Women in Rice County earn 69.0 cents for every dollar earned by a man.
What is Family Income Deficit in Rice County?
Family Income Deficit in Rice County is $9,052.
Families that are below poverty line in Rice County earn $9,052 less on average than the poverty threshold level.
What is Inequality or Gini Index in Rice County?
Inequality or Gini Index in Rice County is 0.43.
How Large is the Labor Force in Rice County?
There are 34,943 People in the Labor Forcein in Rice County.
What is the Percentage of People in the Labor Force in Rice County?
64.2% of People are in the Labor Force in Rice County.
What is the Unemployment Rate in Rice County?
Unemployment Rate in Rice County is 5.3%.