Red Lake County, MN
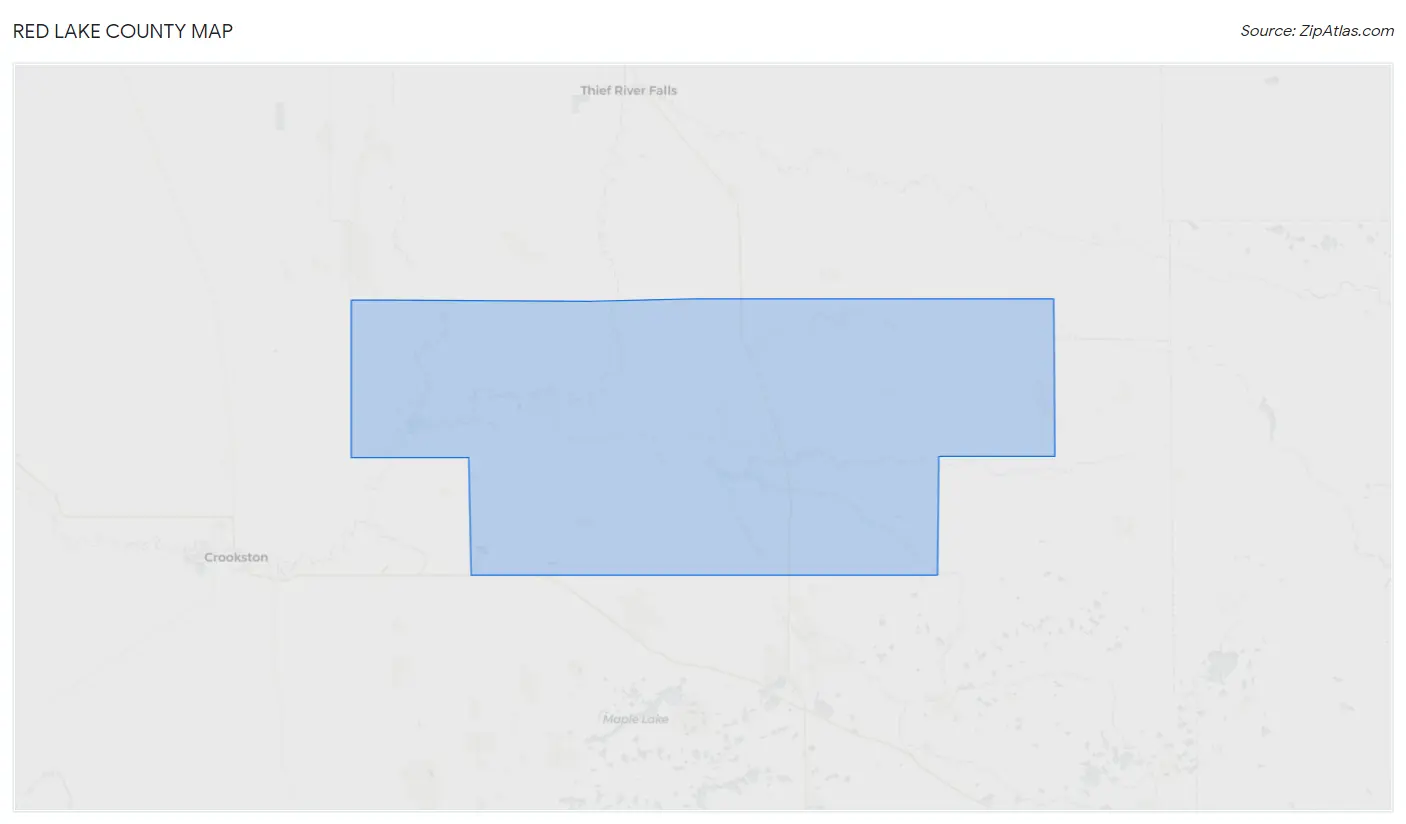
Red Lake County Map
Red Lake County Overview
3,912
TOTAL POPULATION
2,031
MALE POPULATION
1,881
FEMALE POPULATION
107.97
MALES / 100 FEMALES
92.61
FEMALES / 100 MALES
42.9
MEDIAN AGE
3.0
AVG FAMILY SIZE
2.4
AVG HOUSEHOLD SIZE
$35,198
PER CAPITA INCOME
$93,696
AVG FAMILY INCOME
$73,889
AVG HOUSEHOLD INCOME
25.3%
WAGE / INCOME GAP [ % ]
74.7¢/ $1
WAGE / INCOME GAP [ $ ]
0.40
INEQUALITY / GINI INDEX
1,995
LABOR FORCE [ PEOPLE ]
65.1%
PERCENT IN LABOR FORCE
1.5%
UNEMPLOYMENT RATE
Red Lake County Area Codes
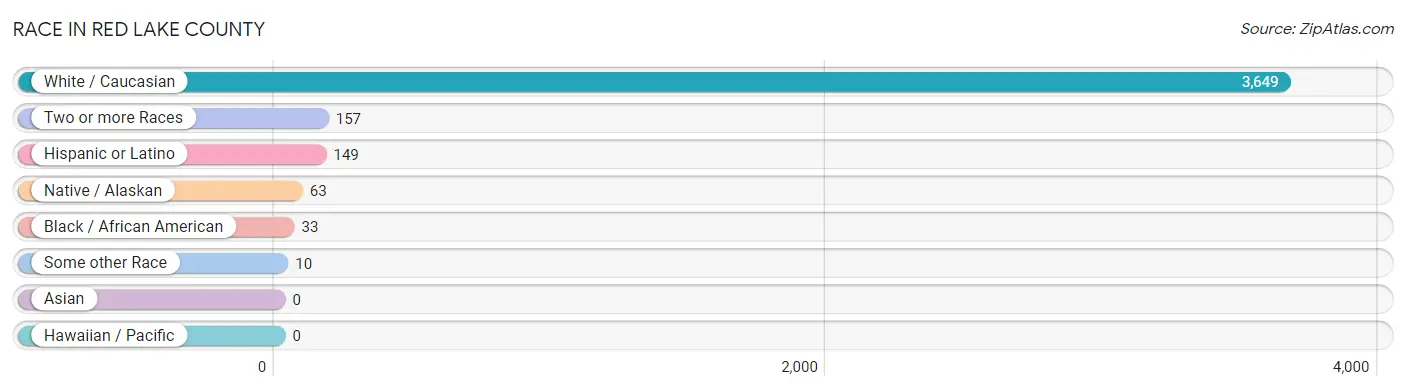
Race in Red Lake County
The most populous races in Red Lake County are White / Caucasian (3,649 | 93.3%), Two or more Races (157 | 4.0%), and Hispanic or Latino (149 | 3.8%).
| Race | # Population | % Population |
| Asian | 0 | 0.0% |
| Black / African American | 33 | 0.8% |
| Hawaiian / Pacific | 0 | 0.0% |
| Hispanic or Latino | 149 | 3.8% |
| Native / Alaskan | 63 | 1.6% |
| White / Caucasian | 3,649 | 93.3% |
| Two or more Races | 157 | 4.0% |
| Some other Race | 10 | 0.3% |
| Total | 3,912 | 100.0% |
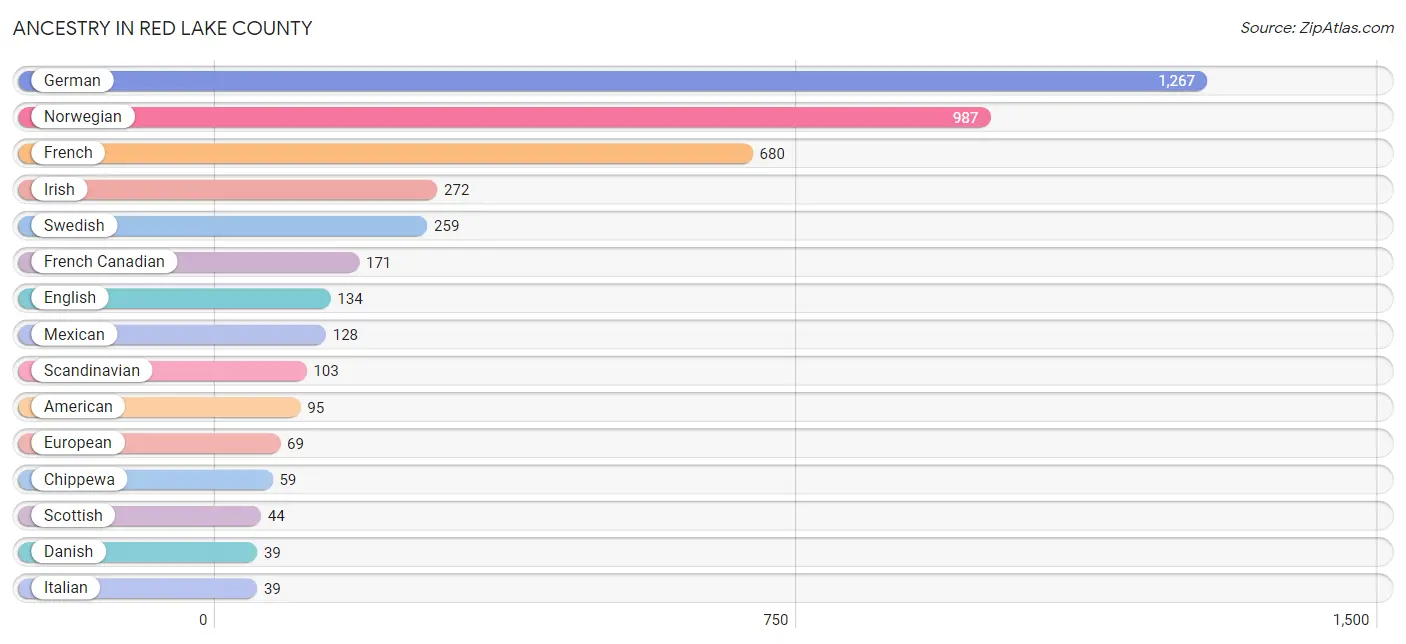
Ancestry in Red Lake County
The most populous ancestries reported in Red Lake County are German (1,267 | 32.4%), Norwegian (987 | 25.2%), French (680 | 17.4%), Irish (272 | 7.0%), and Swedish (259 | 6.6%), together accounting for 88.6% of all Red Lake County residents.
| Ancestry | # Population | % Population |
| African | 1 | 0.0% |
| American | 95 | 2.4% |
| Belgian | 14 | 0.4% |
| Burmese | 14 | 0.4% |
| Central American | 4 | 0.1% |
| Cherokee | 4 | 0.1% |
| Chippewa | 59 | 1.5% |
| Colombian | 1 | 0.0% |
| Creek | 2 | 0.1% |
| Croatian | 3 | 0.1% |
| Cuban | 2 | 0.1% |
| Czech | 33 | 0.8% |
| Czechoslovakian | 9 | 0.2% |
| Danish | 39 | 1.0% |
| Dutch | 32 | 0.8% |
| English | 134 | 3.4% |
| European | 69 | 1.8% |
| Finnish | 34 | 0.9% |
| French | 680 | 17.4% |
| French American Indian | 8 | 0.2% |
| French Canadian | 171 | 4.4% |
| German | 1,267 | 32.4% |
| Honduran | 4 | 0.1% |
| Hungarian | 2 | 0.1% |
| Irish | 272 | 7.0% |
| Italian | 39 | 1.0% |
| Jamaican | 3 | 0.1% |
| Korean | 5 | 0.1% |
| Lithuanian | 2 | 0.1% |
| Mexican | 128 | 3.3% |
| Northern European | 4 | 0.1% |
| Norwegian | 987 | 25.2% |
| Polish | 39 | 1.0% |
| Puerto Rican | 2 | 0.1% |
| Russian | 14 | 0.4% |
| Scandinavian | 103 | 2.6% |
| Scotch-Irish | 6 | 0.2% |
| Scottish | 44 | 1.1% |
| Sioux | 3 | 0.1% |
| Slavic | 7 | 0.2% |
| Slovak | 3 | 0.1% |
| South American | 1 | 0.0% |
| Spaniard | 4 | 0.1% |
| Subsaharan African | 1 | 0.0% |
| Swedish | 259 | 6.6% |
| Swiss | 1 | 0.0% |
| Thai | 2 | 0.1% |
| Ukrainian | 14 | 0.4% |
| Welsh | 7 | 0.2% |
| Yugoslavian | 2 | 0.1% | View All 50 Rows |
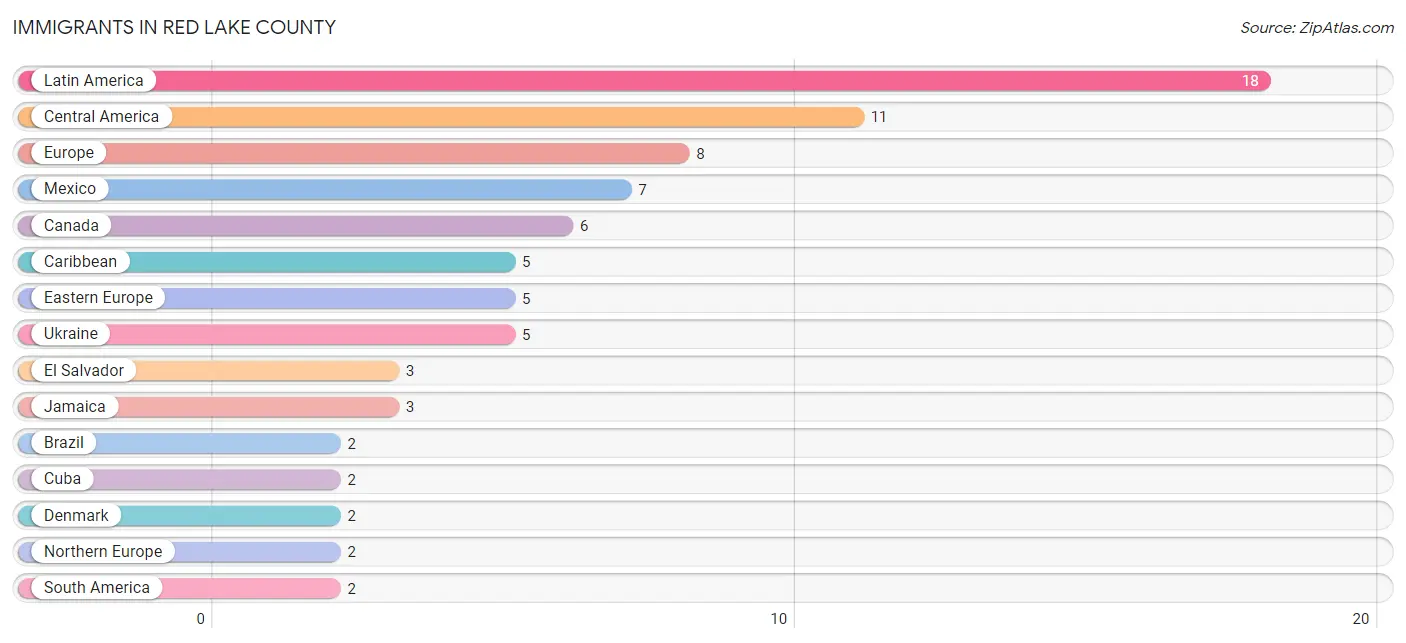
Immigrants in Red Lake County
The most numerous immigrant groups reported in Red Lake County came from Latin America (18 | 0.5%), Central America (11 | 0.3%), Europe (8 | 0.2%), Mexico (7 | 0.2%), and Canada (6 | 0.2%), together accounting for 1.3% of all Red Lake County residents.
| Immigration Origin | # Population | % Population |
| Brazil | 2 | 0.1% |
| Canada | 6 | 0.2% |
| Caribbean | 5 | 0.1% |
| Central America | 11 | 0.3% |
| Cuba | 2 | 0.1% |
| Denmark | 2 | 0.1% |
| Eastern Europe | 5 | 0.1% |
| El Salvador | 3 | 0.1% |
| Europe | 8 | 0.2% |
| Germany | 1 | 0.0% |
| Guatemala | 1 | 0.0% |
| Jamaica | 3 | 0.1% |
| Latin America | 18 | 0.5% |
| Mexico | 7 | 0.2% |
| Northern Europe | 2 | 0.1% |
| South America | 2 | 0.1% |
| Ukraine | 5 | 0.1% |
| Western Europe | 1 | 0.0% | View All 18 Rows |
Sex and Age in Red Lake County
Sex and Age in Red Lake County
The most populous age groups in Red Lake County are 55 to 59 Years (183 | 9.0%) for men and 60 to 64 Years (148 | 7.9%) for women.

| Age Bracket | Male | Female |
| Under 5 Years | 116 (5.7%) | 107 (5.7%) |
| 5 to 9 Years | 126 (6.2%) | 135 (7.2%) |
| 10 to 14 Years | 179 (8.8%) | 118 (6.3%) |
| 15 to 19 Years | 127 (6.2%) | 113 (6.0%) |
| 20 to 24 Years | 83 (4.1%) | 74 (3.9%) |
| 25 to 29 Years | 91 (4.5%) | 83 (4.4%) |
| 30 to 34 Years | 93 (4.6%) | 75 (4.0%) |
| 35 to 39 Years | 127 (6.2%) | 141 (7.5%) |
| 40 to 44 Years | 133 (6.6%) | 144 (7.7%) |
| 45 to 49 Years | 102 (5.0%) | 93 (4.9%) |
| 50 to 54 Years | 111 (5.5%) | 105 (5.6%) |
| 55 to 59 Years | 183 (9.0%) | 126 (6.7%) |
| 60 to 64 Years | 127 (6.2%) | 148 (7.9%) |
| 65 to 69 Years | 150 (7.4%) | 118 (6.3%) |
| 70 to 74 Years | 110 (5.4%) | 91 (4.8%) |
| 75 to 79 Years | 67 (3.3%) | 83 (4.4%) |
| 80 to 84 Years | 38 (1.9%) | 55 (2.9%) |
| 85 Years and over | 68 (3.4%) | 72 (3.8%) |
| Total | 2,031 (100.0%) | 1,881 (100.0%) |
Families and Households in Red Lake County
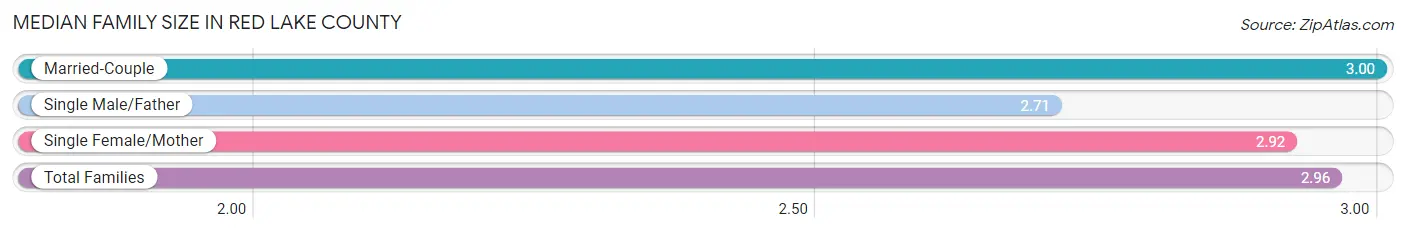
Median Family Size in Red Lake County
The median family size in Red Lake County is 2.96 persons per family, with married-couple families (855 | 80.7%) accounting for the largest median family size of 3 persons per family. On the other hand, single male/father families (91 | 8.6%) represent the smallest median family size with 2.71 persons per family.
| Family Type | # Families | Family Size |
| Married-Couple | 855 (80.7%) | 3.00 |
| Single Male/Father | 91 (8.6%) | 2.71 |
| Single Female/Mother | 114 (10.7%) | 2.92 |
| Total Families | 1,060 (100.0%) | 2.96 |
Median Household Size in Red Lake County
The median household size in Red Lake County is 2.36 persons per household, with single female/mother households (114 | 7.0%) accounting for the largest median household size of 3.44 persons per household. non-family households (578 | 35.3%) represent the smallest median household size with 1.11 persons per household.

| Household Type | # Households | Household Size |
| Married-Couple | 855 (52.2%) | 3.00 |
| Single Male/Father | 91 (5.6%) | 3.05 |
| Single Female/Mother | 114 (7.0%) | 3.44 |
| Non-family | 578 (35.3%) | 1.11 |
| Total Households | 1,638 (100.0%) | 2.36 |
Household Size by Marriage Status in Red Lake County
Out of a total of 1,638 households in Red Lake County, 1,060 (64.7%) are family households, while 578 (35.3%) are nonfamily households. The most numerous type of family households are 2-person households, comprising 586, and the most common type of nonfamily households are 1-person households, comprising 517.

| Household Size | Family Households | Nonfamily Households |
| 1-Person Households | - | 517 (31.6%) |
| 2-Person Households | 586 (35.8%) | 44 (2.7%) |
| 3-Person Households | 170 (10.4%) | 17 (1.0%) |
| 4-Person Households | 174 (10.6%) | 0 (0.0%) |
| 5-Person Households | 82 (5.0%) | 0 (0.0%) |
| 6-Person Households | 32 (1.9%) | 0 (0.0%) |
| 7+ Person Households | 16 (1.0%) | 0 (0.0%) |
| Total | 1,060 (64.7%) | 578 (35.3%) |
Female Fertility in Red Lake County
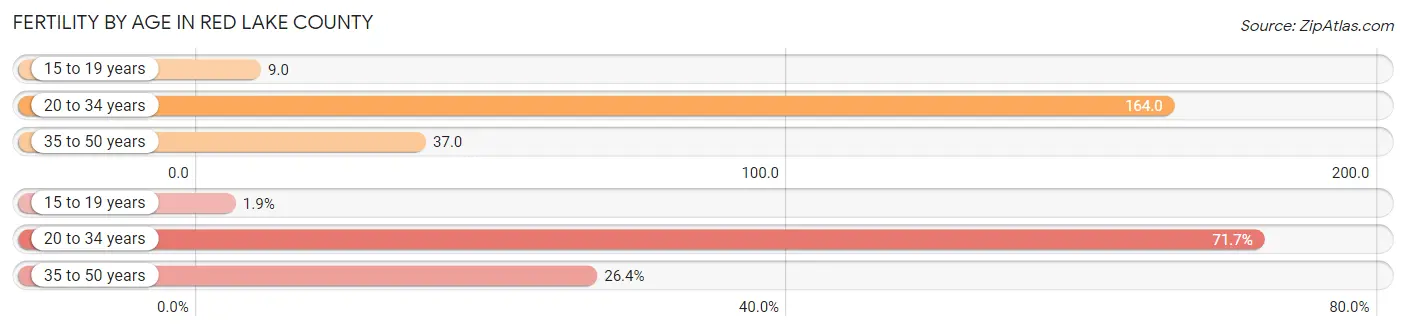
Fertility by Age in Red Lake County
Average fertility rate in Red Lake County is 73.0 births per 1,000 women. Women in the age bracket of 20 to 34 years have the highest fertility rate with 164.0 births per 1,000 women. Women in the age bracket of 20 to 34 years acount for 71.7% of all women with births.
| Age Bracket | Women with Births | Births / 1,000 Women |
| 15 to 19 years | 1 (1.9%) | 9.0 |
| 20 to 34 years | 38 (71.7%) | 164.0 |
| 35 to 50 years | 14 (26.4%) | 37.0 |
| Total | 53 (100.0%) | 73.0 |
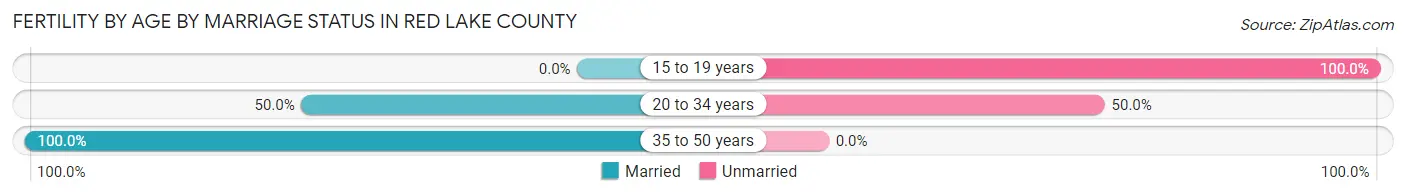
Fertility by Age by Marriage Status in Red Lake County
62.3% of women with births (53) in Red Lake County are married. The highest percentage of unmarried women with births falls into 15 to 19 years age bracket with 100.0% of them unmarried at the time of birth, while the lowest percentage of unmarried women with births belong to 35 to 50 years age bracket with 0.0% of them unmarried.
| Age Bracket | Married | Unmarried |
| 15 to 19 years | 0 (0.0%) | 1 (100.0%) |
| 20 to 34 years | 19 (50.0%) | 19 (50.0%) |
| 35 to 50 years | 14 (100.0%) | 0 (0.0%) |
| Total | 33 (62.3%) | 20 (37.7%) |
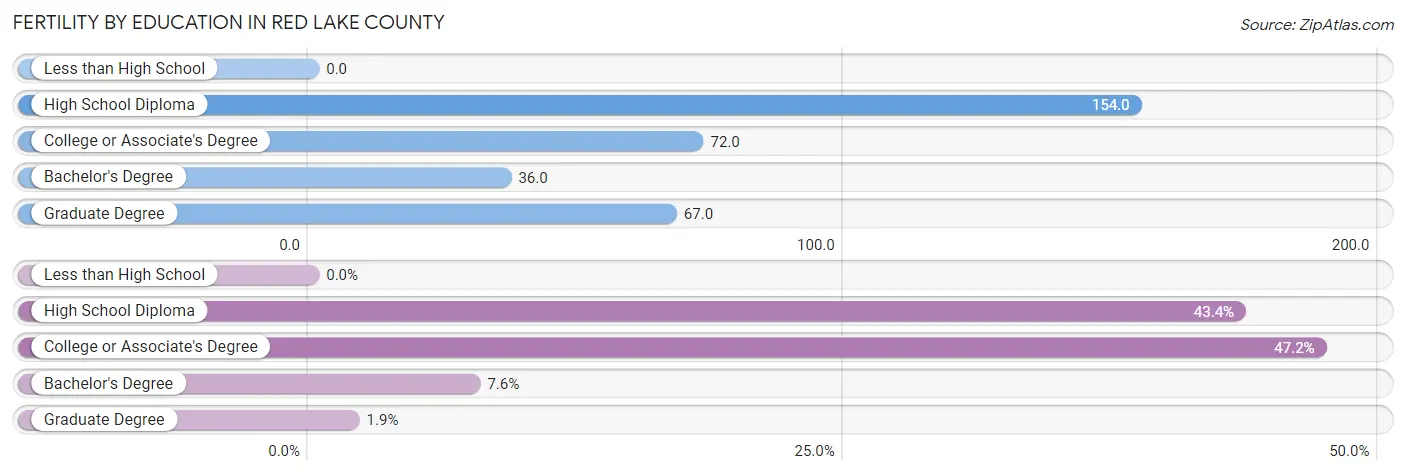
Fertility by Education in Red Lake County
| Educational Attainment | Women with Births | Births / 1,000 Women |
| Less than High School | 0 (0.0%) | 0.0 |
| High School Diploma | 23 (43.4%) | 154.0 |
| College or Associate's Degree | 25 (47.2%) | 72.0 |
| Bachelor's Degree | 4 (7.5%) | 36.0 |
| Graduate Degree | 1 (1.9%) | 67.0 |
| Total | 53 (100.0%) | 73.0 |
Fertility by Education by Marriage Status in Red Lake County
37.7% of women with births in Red Lake County are unmarried. Women with the educational attainment of bachelor's degree are most likely to be married with 100.0% of them married at childbirth, while women with the educational attainment of high school diploma are least likely to be married with 43.5% of them unmarried at childbirth.
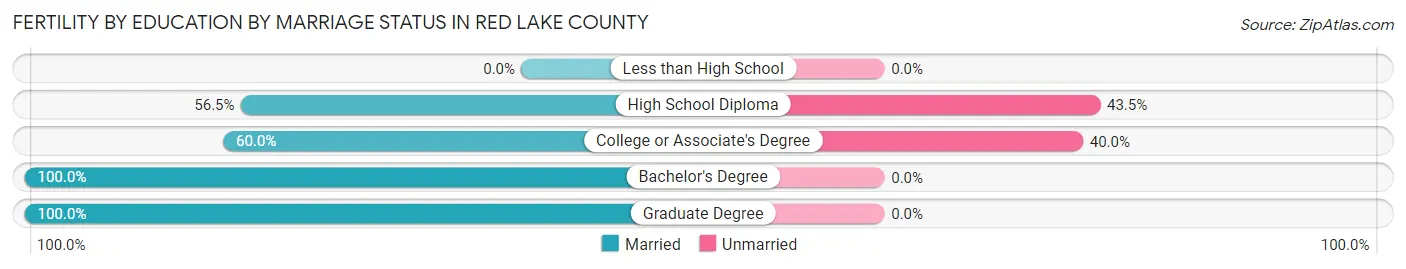
| Educational Attainment | Married | Unmarried |
| Less than High School | 0 (0.0%) | 0 (0.0%) |
| High School Diploma | 13 (56.5%) | 10 (43.5%) |
| College or Associate's Degree | 15 (60.0%) | 10 (40.0%) |
| Bachelor's Degree | 4 (100.0%) | 0 (0.0%) |
| Graduate Degree | 1 (100.0%) | 0 (0.0%) |
| Total | 33 (62.3%) | 20 (37.7%) |
Income in Red Lake County
Income Overview in Red Lake County
Per Capita Income in Red Lake County is $35,198, while median incomes of families and households are $93,696 and $73,889 respectively.
| Characteristic | Number | Measure |
| Per Capita Income | 3,912 | $35,198 |
| Median Family Income | 1,060 | $93,696 |
| Mean Family Income | 1,060 | $104,659 |
| Median Household Income | 1,638 | $73,889 |
| Mean Household Income | 1,638 | $83,685 |
| Income Deficit | 1,060 | $0 |
| Wage / Income Gap (%) | 3,912 | 25.30% |
| Wage / Income Gap ($) | 3,912 | 74.70¢ per $1 |
| Gini / Inequality Index | 3,912 | 0.40 |
Earnings by Sex in Red Lake County
Average Earnings in Red Lake County are $44,830, $51,726 for men and $38,640 for women, a difference of 25.3%.
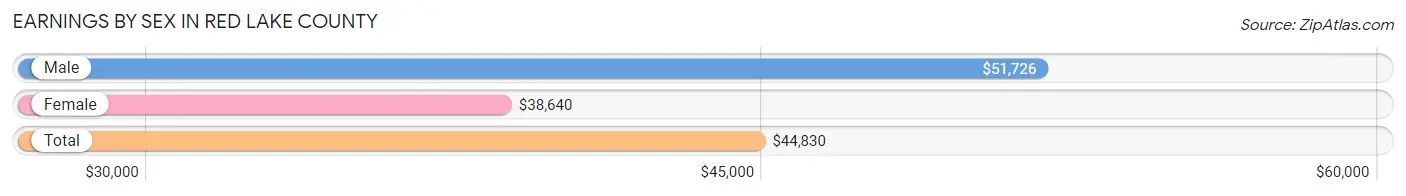
| Sex | Number | Average Earnings |
| Male | 1,157 (53.1%) | $51,726 |
| Female | 1,021 (46.9%) | $38,640 |
| Total | 2,178 (100.0%) | $44,830 |
Earnings by Sex by Income Bracket in Red Lake County
The most common earnings brackets in Red Lake County are $75,000 to $99,999 for men (153 | 13.2%) and $55,000 to $64,999 for women (96 | 9.4%).
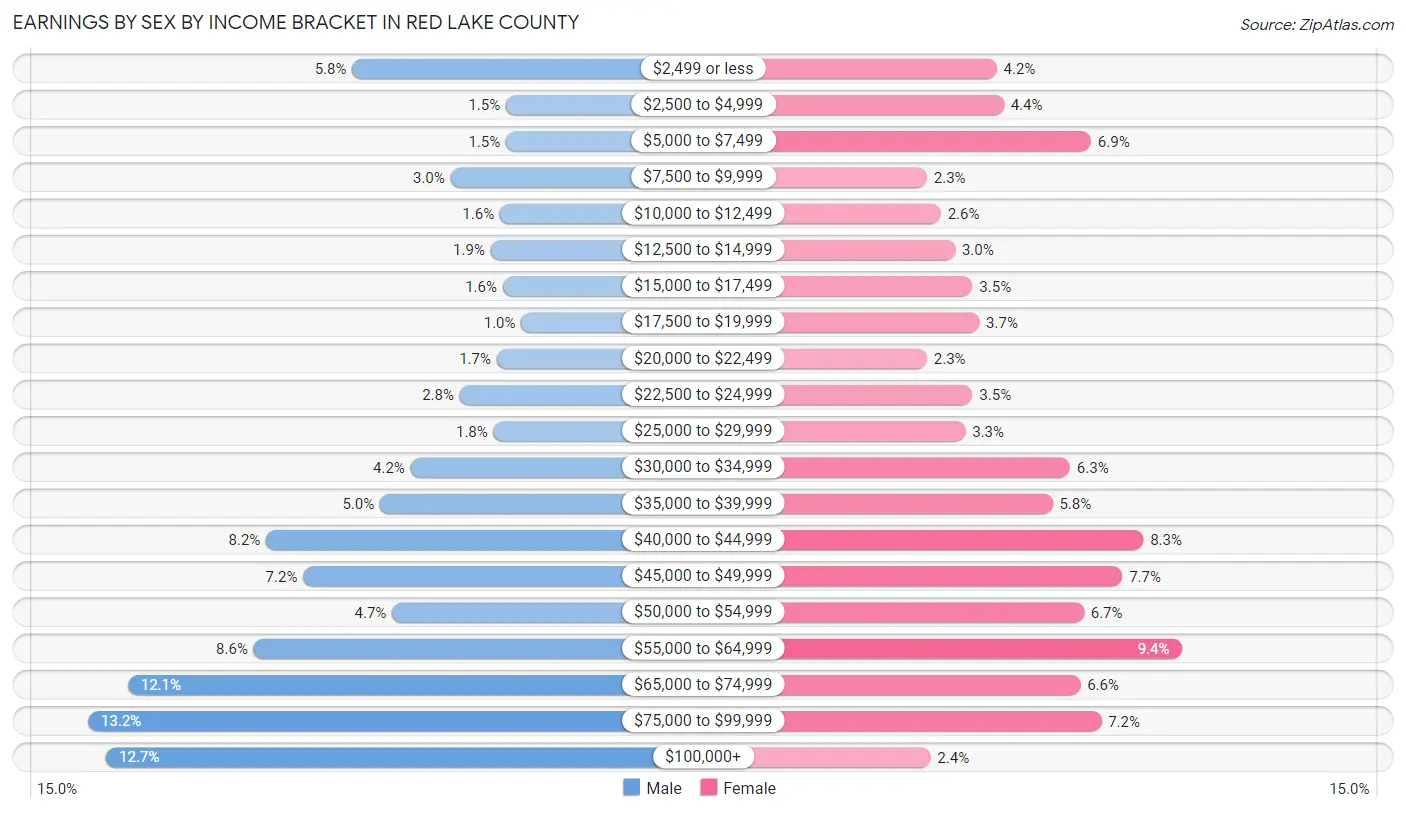
| Income | Male | Female |
| $2,499 or less | 67 (5.8%) | 43 (4.2%) |
| $2,500 to $4,999 | 17 (1.5%) | 45 (4.4%) |
| $5,000 to $7,499 | 17 (1.5%) | 70 (6.9%) |
| $7,500 to $9,999 | 35 (3.0%) | 23 (2.2%) |
| $10,000 to $12,499 | 19 (1.6%) | 27 (2.6%) |
| $12,500 to $14,999 | 22 (1.9%) | 31 (3.0%) |
| $15,000 to $17,499 | 18 (1.6%) | 36 (3.5%) |
| $17,500 to $19,999 | 12 (1.0%) | 38 (3.7%) |
| $20,000 to $22,499 | 20 (1.7%) | 23 (2.2%) |
| $22,500 to $24,999 | 32 (2.8%) | 36 (3.5%) |
| $25,000 to $29,999 | 21 (1.8%) | 34 (3.3%) |
| $30,000 to $34,999 | 48 (4.2%) | 64 (6.3%) |
| $35,000 to $39,999 | 58 (5.0%) | 59 (5.8%) |
| $40,000 to $44,999 | 95 (8.2%) | 85 (8.3%) |
| $45,000 to $49,999 | 83 (7.2%) | 79 (7.7%) |
| $50,000 to $54,999 | 54 (4.7%) | 68 (6.7%) |
| $55,000 to $64,999 | 99 (8.6%) | 96 (9.4%) |
| $65,000 to $74,999 | 140 (12.1%) | 67 (6.6%) |
| $75,000 to $99,999 | 153 (13.2%) | 73 (7.1%) |
| $100,000+ | 147 (12.7%) | 24 (2.4%) |
| Total | 1,157 (100.0%) | 1,021 (100.0%) |
Earnings by Sex by Educational Attainment in Red Lake County
Average earnings in Red Lake County are $57,619 for men and $41,351 for women, a difference of 28.2%. Men with an educational attainment of bachelor's degree enjoy the highest average annual earnings of $68,250, while those with less than high school education earn the least with $32,656. Women with an educational attainment of graduate degree earn the most with the average annual earnings of $68,333, while those with less than high school education have the smallest earnings of $29,375.
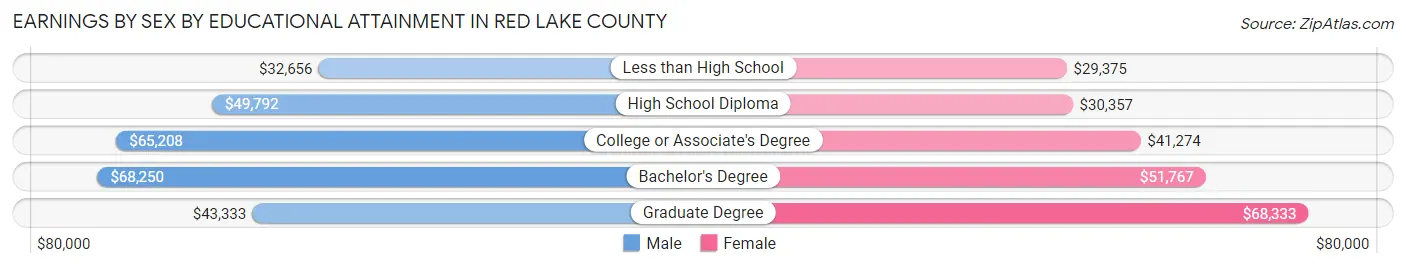
| Educational Attainment | Male Income | Female Income |
| Less than High School | $32,656 | $29,375 |
| High School Diploma | $49,792 | $30,357 |
| College or Associate's Degree | $65,208 | $41,274 |
| Bachelor's Degree | $68,250 | $51,767 |
| Graduate Degree | $43,333 | $68,333 |
| Total | $57,619 | $41,351 |
Family Income in Red Lake County
Family Income Brackets in Red Lake County
According to the Red Lake County family income data, there are 310 families falling into the $100,000 to $149,999 income range, which is the most common income bracket and makes up 29.2% of all families. Conversely, the less than $10,000 income bracket is the least frequent group with only 8 families (0.7%) belonging to this category.

| Income Bracket | # Families | % Families |
| Less than $10,000 | 8 | 0.8% |
| $10,000 to $14,999 | 11 | 1.0% |
| $15,000 to $24,999 | 36 | 3.4% |
| $25,000 to $34,999 | 49 | 4.6% |
| $35,000 to $49,999 | 107 | 10.1% |
| $50,000 to $74,999 | 153 | 14.4% |
| $75,000 to $99,999 | 209 | 19.7% |
| $100,000 to $149,999 | 310 | 29.2% |
| $150,000 to $199,999 | 120 | 11.3% |
| $200,000+ | 57 | 5.4% |
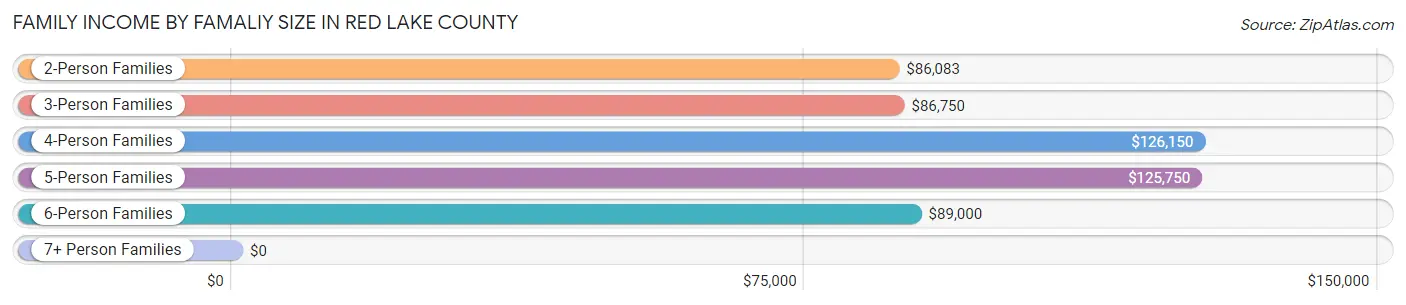
Family Income by Famaliy Size in Red Lake County
4-person families (155 | 14.6%) account for the highest median family income in Red Lake County with $126,150 per family, while 2-person families (639 | 60.3%) have the highest median income of $43,042 per family member.
| Income Bracket | # Families | Median Income |
| 2-Person Families | 639 (60.3%) | $86,083 |
| 3-Person Families | 137 (12.9%) | $86,750 |
| 4-Person Families | 155 (14.6%) | $126,150 |
| 5-Person Families | 83 (7.8%) | $125,750 |
| 6-Person Families | 36 (3.4%) | $89,000 |
| 7+ Person Families | 10 (0.9%) | $0 |
| Total | 1,060 (100.0%) | $93,696 |
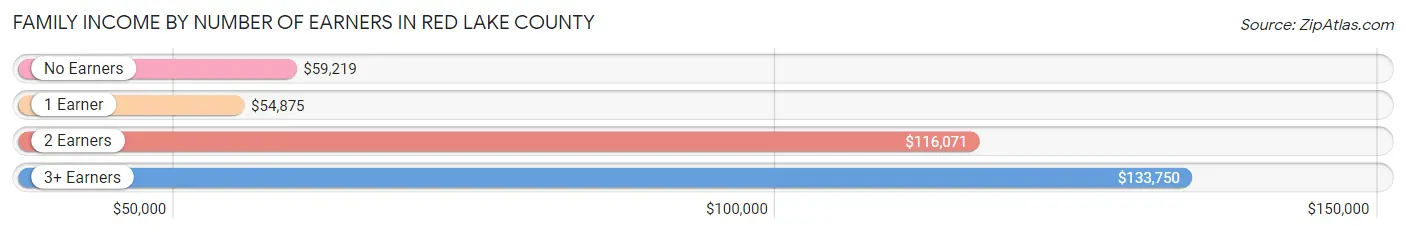
Family Income by Number of Earners in Red Lake County
The median family income in Red Lake County is $93,696, with families comprising 3+ earners (84) having the highest median family income of $133,750, while families with 1 earner (287) have the lowest median family income of $54,875, accounting for 7.9% and 27.1% of families, respectively.
| Number of Earners | # Families | Median Income |
| No Earners | 115 (10.8%) | $59,219 |
| 1 Earner | 287 (27.1%) | $54,875 |
| 2 Earners | 574 (54.1%) | $116,071 |
| 3+ Earners | 84 (7.9%) | $133,750 |
| Total | 1,060 (100.0%) | $93,696 |
Household Income in Red Lake County
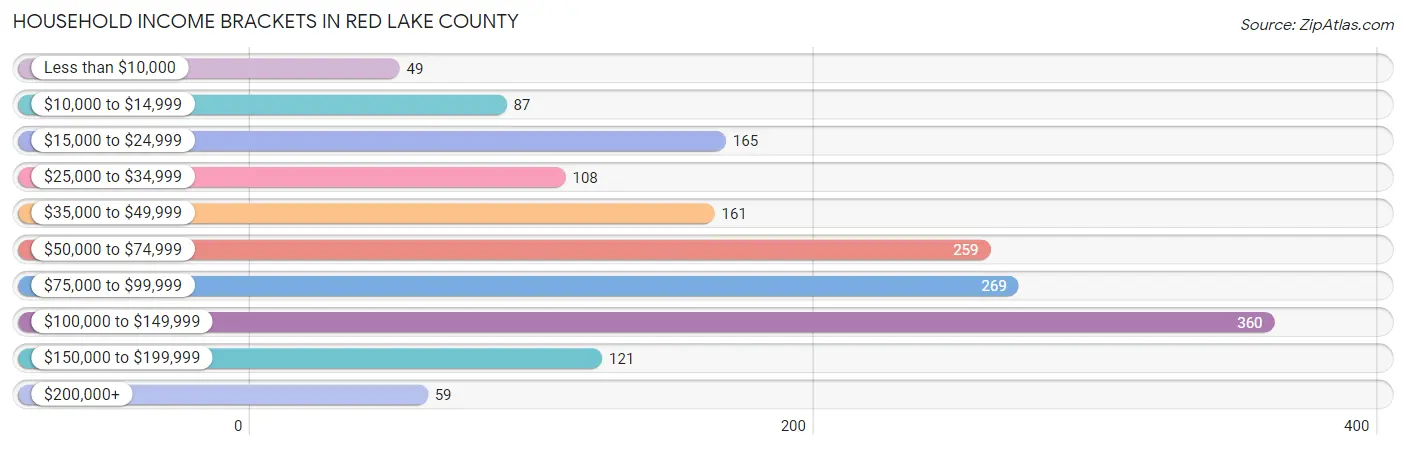
Household Income Brackets in Red Lake County
With 360 households falling in the category, the $100,000 to $149,999 income range is the most frequent in Red Lake County, accounting for 22.0% of all households. In contrast, only 49 households (3.0%) fall into the less than $10,000 income bracket, making it the least populous group.
| Income Bracket | # Households | % Households |
| Less than $10,000 | 49 | 3.0% |
| $10,000 to $14,999 | 87 | 5.3% |
| $15,000 to $24,999 | 165 | 10.1% |
| $25,000 to $34,999 | 108 | 6.6% |
| $35,000 to $49,999 | 161 | 9.8% |
| $50,000 to $74,999 | 259 | 15.8% |
| $75,000 to $99,999 | 269 | 16.4% |
| $100,000 to $149,999 | 360 | 22.0% |
| $150,000 to $199,999 | 121 | 7.4% |
| $200,000+ | 59 | 3.6% |
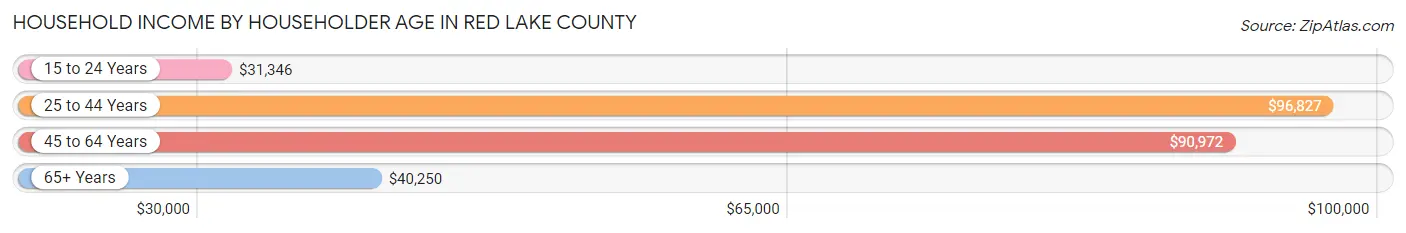
Household Income by Householder Age in Red Lake County
The median household income in Red Lake County is $73,889, with the highest median household income of $96,827 found in the 25 to 44 years age bracket for the primary householder. A total of 461 households (28.1%) fall into this category. Meanwhile, the 15 to 24 years age bracket for the primary householder has the lowest median household income of $31,346, with 46 households (2.8%) in this group.
| Income Bracket | # Households | Median Income |
| 15 to 24 Years | 46 (2.8%) | $31,346 |
| 25 to 44 Years | 461 (28.1%) | $96,827 |
| 45 to 64 Years | 559 (34.1%) | $90,972 |
| 65+ Years | 572 (34.9%) | $40,250 |
| Total | 1,638 (100.0%) | $73,889 |
Poverty in Red Lake County
Income Below Poverty by Sex and Age in Red Lake County
With 10.4% poverty level for males and 8.2% for females among the residents of Red Lake County, 15 year old males and 18 to 24 year old females are the most vulnerable to poverty, with 8 males (22.9%) and 15 females (14.6%) in their respective age groups living below the poverty level.
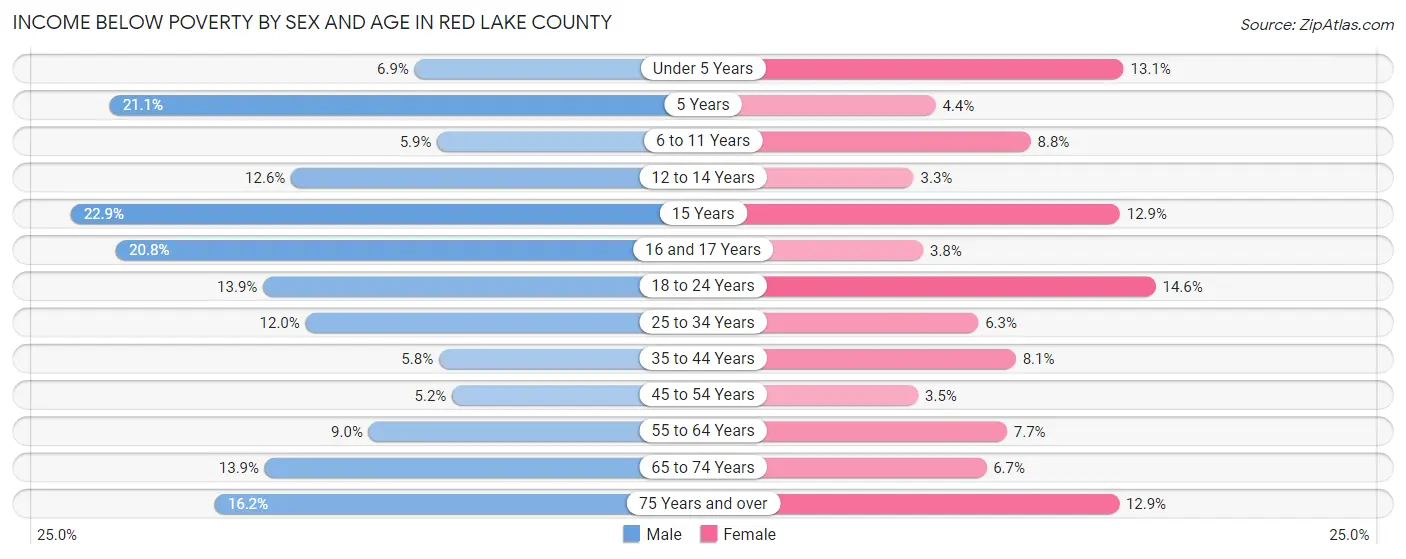
| Age Bracket | Male | Female |
| Under 5 Years | 8 (6.9%) | 14 (13.1%) |
| 5 Years | 4 (21.0%) | 1 (4.3%) |
| 6 to 11 Years | 11 (5.9%) | 12 (8.8%) |
| 12 to 14 Years | 12 (12.6%) | 3 (3.3%) |
| 15 Years | 8 (22.9%) | 4 (12.9%) |
| 16 and 17 Years | 11 (20.7%) | 2 (3.8%) |
| 18 to 24 Years | 17 (13.9%) | 15 (14.6%) |
| 25 to 34 Years | 22 (12.0%) | 10 (6.3%) |
| 35 to 44 Years | 15 (5.8%) | 23 (8.1%) |
| 45 to 54 Years | 11 (5.2%) | 7 (3.5%) |
| 55 to 64 Years | 28 (9.0%) | 21 (7.7%) |
| 65 to 74 Years | 36 (13.9%) | 14 (6.7%) |
| 75 Years and over | 27 (16.2%) | 27 (12.9%) |
| Total | 210 (10.4%) | 153 (8.2%) |
Income Above Poverty by Sex and Age in Red Lake County
According to the poverty statistics in Red Lake County, males aged 45 to 54 years and females aged 12 to 14 years are the age groups that are most secure financially, with 94.8% of males and 96.7% of females in these age groups living above the poverty line.
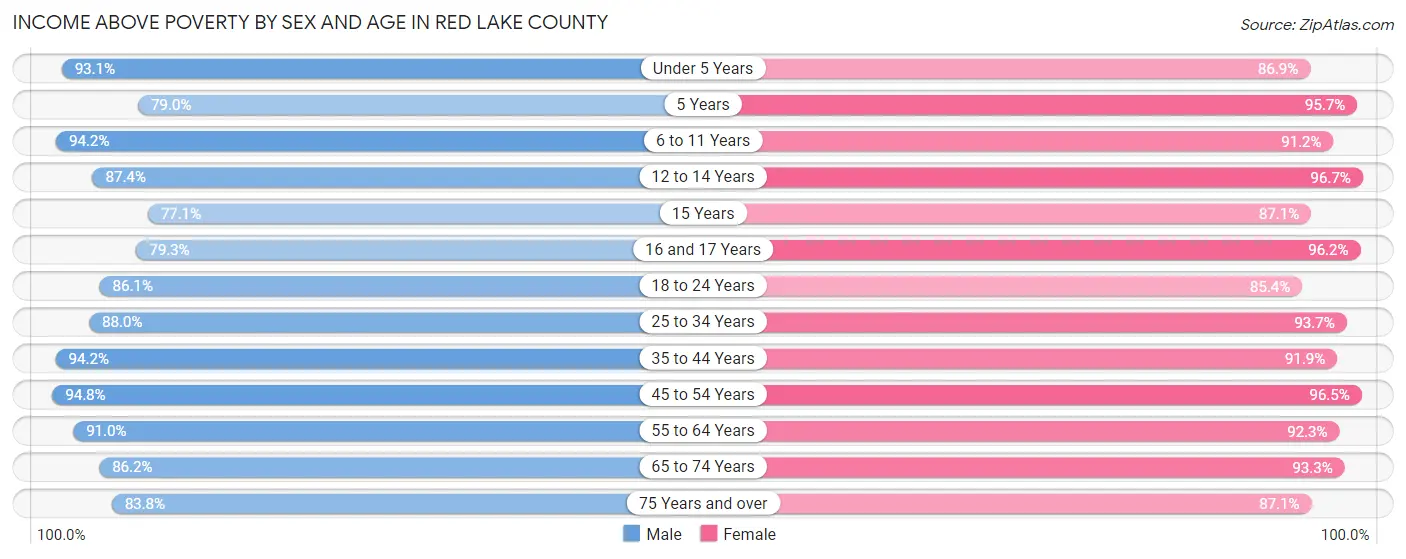
| Age Bracket | Male | Female |
| Under 5 Years | 108 (93.1%) | 93 (86.9%) |
| 5 Years | 15 (78.9%) | 22 (95.7%) |
| 6 to 11 Years | 177 (94.2%) | 125 (91.2%) |
| 12 to 14 Years | 83 (87.4%) | 87 (96.7%) |
| 15 Years | 27 (77.1%) | 27 (87.1%) |
| 16 and 17 Years | 42 (79.2%) | 51 (96.2%) |
| 18 to 24 Years | 105 (86.1%) | 88 (85.4%) |
| 25 to 34 Years | 162 (88.0%) | 148 (93.7%) |
| 35 to 44 Years | 245 (94.2%) | 262 (91.9%) |
| 45 to 54 Years | 202 (94.8%) | 191 (96.5%) |
| 55 to 64 Years | 282 (91.0%) | 253 (92.3%) |
| 65 to 74 Years | 224 (86.2%) | 195 (93.3%) |
| 75 Years and over | 140 (83.8%) | 183 (87.1%) |
| Total | 1,812 (89.6%) | 1,725 (91.8%) |
Income Below Poverty Among Married-Couple Families in Red Lake County
The poverty statistics for married-couple families in Red Lake County show that 2.3% or 20 of the total 855 families live below the poverty line. Families with no children have the highest poverty rate of 2.5%, comprising of 14 families. On the other hand, families with 5 or more children have the lowest poverty rate of 0.0%, which includes 0 families.
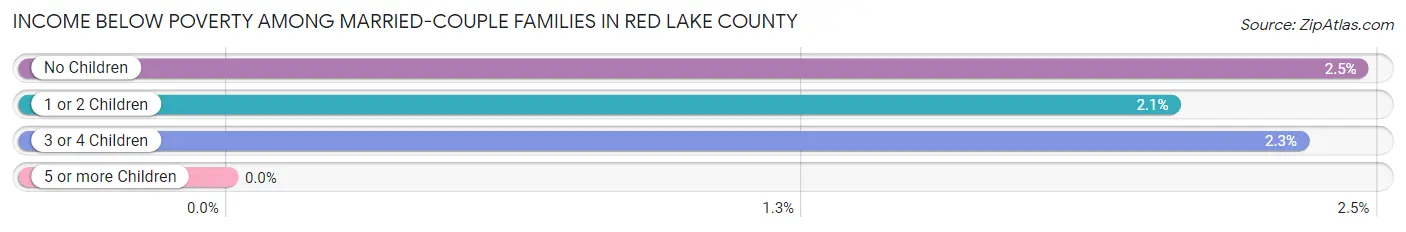
| Children | Above Poverty | Below Poverty |
| No Children | 554 (97.5%) | 14 (2.5%) |
| 1 or 2 Children | 191 (98.0%) | 4 (2.1%) |
| 3 or 4 Children | 84 (97.7%) | 2 (2.3%) |
| 5 or more Children | 6 (100.0%) | 0 (0.0%) |
| Total | 835 (97.7%) | 20 (2.3%) |
Income Below Poverty Among Single-Parent Households in Red Lake County
According to the poverty data in Red Lake County, 9.9% or 9 single-father households and 14.0% or 16 single-mother households are living below the poverty line. Among single-father households, those with 5 or more children have the highest poverty rate, with 3 households (100.0%) experiencing poverty. Likewise, among single-mother households, those with 3 or 4 children have the highest poverty rate, with 1 households (25.0%) falling below the poverty line.
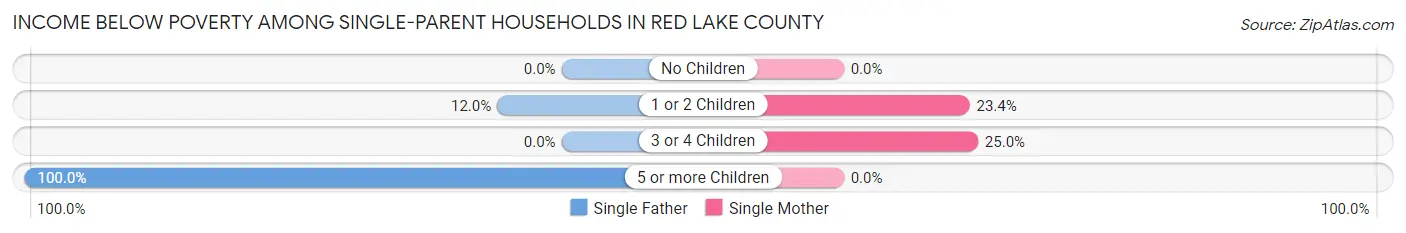
| Children | Single Father | Single Mother |
| No Children | 0 (0.0%) | 0 (0.0%) |
| 1 or 2 Children | 6 (12.0%) | 15 (23.4%) |
| 3 or 4 Children | 0 (0.0%) | 1 (25.0%) |
| 5 or more Children | 3 (100.0%) | 0 (0.0%) |
| Total | 9 (9.9%) | 16 (14.0%) |
Income Below Poverty Among Married-Couple vs Single-Parent Households in Red Lake County
The poverty data for Red Lake County shows that 20 of the married-couple family households (2.3%) and 25 of the single-parent households (12.2%) are living below the poverty level. Within the married-couple family households, those with no children have the highest poverty rate, with 14 households (2.5%) falling below the poverty line. Among the single-parent households, those with 5 or more children have the highest poverty rate, with 3 household (50.0%) living below poverty.
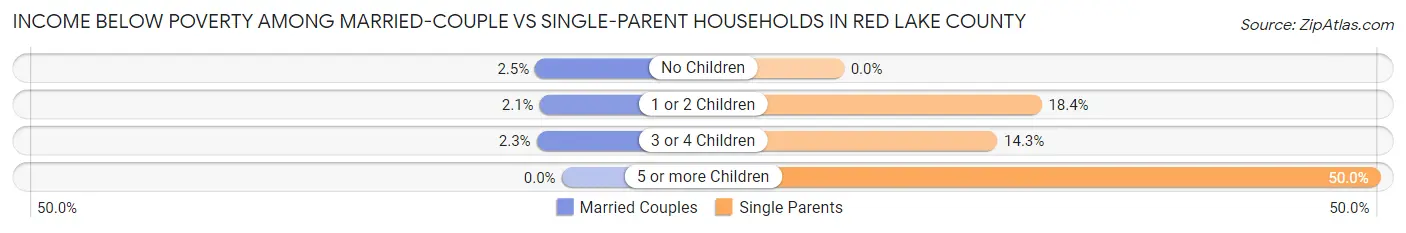
| Children | Married-Couple Families | Single-Parent Households |
| No Children | 14 (2.5%) | 0 (0.0%) |
| 1 or 2 Children | 4 (2.1%) | 21 (18.4%) |
| 3 or 4 Children | 2 (2.3%) | 1 (14.3%) |
| 5 or more Children | 0 (0.0%) | 3 (50.0%) |
| Total | 20 (2.3%) | 25 (12.2%) |
Employment Characteristics in Red Lake County
Employment by Class of Employer in Red Lake County
Among the 1,945 employed individuals in Red Lake County, private company employees (1,371 | 70.5%), local government employees (153 | 7.9%), and not-for-profit organizations (148 | 7.6%) make up the most common classes of employment.
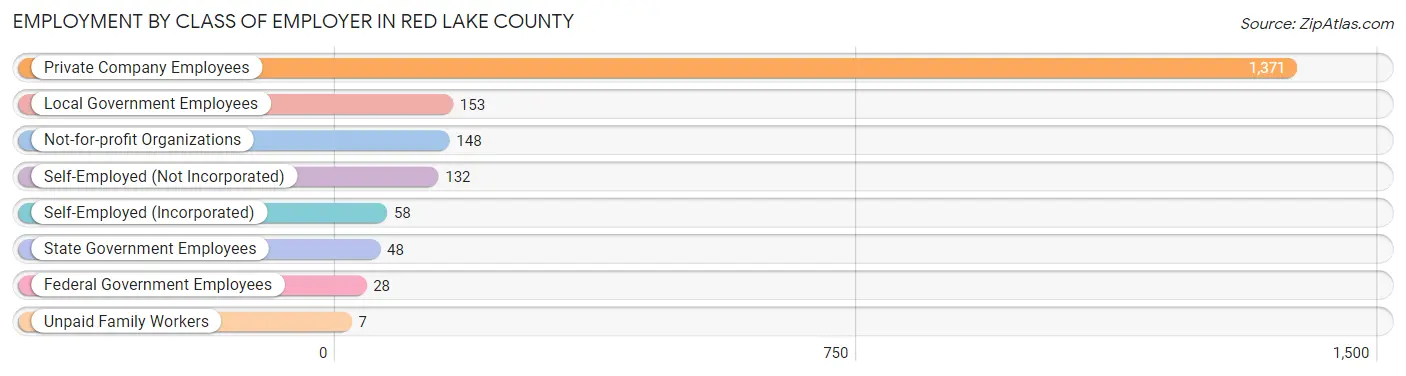
| Employer Class | # Employees | % Employees |
| Private Company Employees | 1,371 | 70.5% |
| Self-Employed (Incorporated) | 58 | 3.0% |
| Self-Employed (Not Incorporated) | 132 | 6.8% |
| Not-for-profit Organizations | 148 | 7.6% |
| Local Government Employees | 153 | 7.9% |
| State Government Employees | 48 | 2.5% |
| Federal Government Employees | 28 | 1.4% |
| Unpaid Family Workers | 7 | 0.4% |
| Total | 1,945 | 100.0% |
Employment Status by Age in Red Lake County
According to the labor force statistics for Red Lake County, out of the total population over 16 years of age (3,065), 65.1% or 1,995 individuals are in the labor force, with 1.5% or 30 of them unemployed. The age group with the highest labor force participation rate is 30 to 34 years, with 96.4% or 162 individuals in the labor force. Within the labor force, the 75 years and over age range has the highest percentage of unemployed individuals, with 12.8% or 5 of them being unemployed.
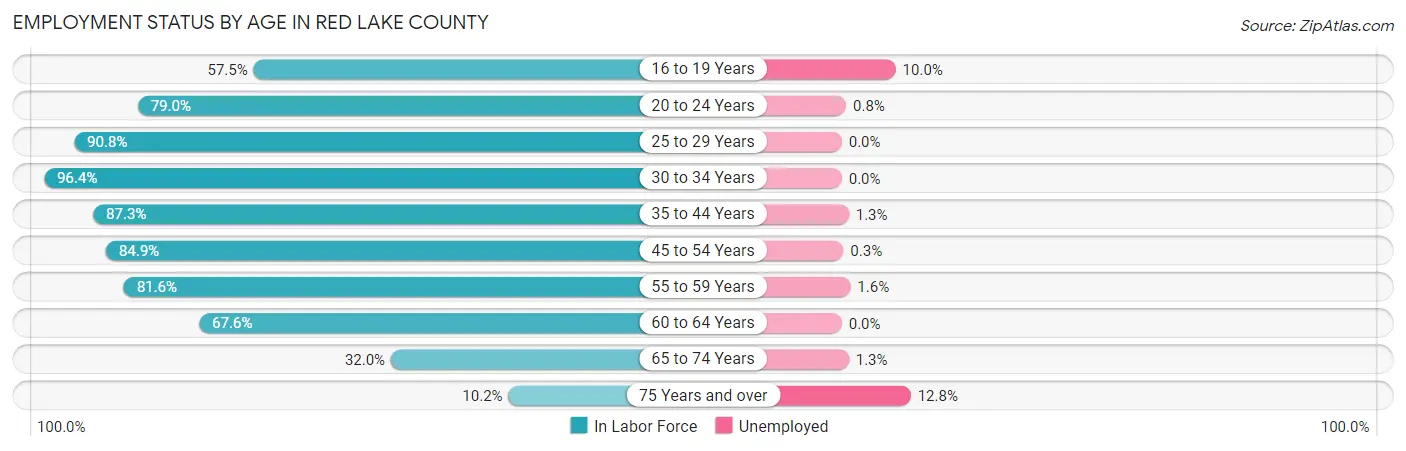
| Age Bracket | In Labor Force | Unemployed |
| 16 to 19 Years | 100 (57.5%) | 10 (10.0%) |
| 20 to 24 Years | 124 (79.0%) | 1 (0.8%) |
| 25 to 29 Years | 158 (90.8%) | 0 (0.0%) |
| 30 to 34 Years | 162 (96.4%) | 0 (0.0%) |
| 35 to 44 Years | 476 (87.3%) | 6 (1.3%) |
| 45 to 54 Years | 349 (84.9%) | 1 (0.3%) |
| 55 to 59 Years | 252 (81.6%) | 4 (1.6%) |
| 60 to 64 Years | 186 (67.6%) | 0 (0.0%) |
| 65 to 74 Years | 150 (32.0%) | 2 (1.3%) |
| 75 Years and over | 39 (10.2%) | 5 (12.8%) |
| Total | 1,995 (65.1%) | 30 (1.5%) |
Employment Status by Educational Attainment in Red Lake County
According to labor force statistics for Red Lake County, 84.1% of individuals (1,583) out of the total population between 25 and 64 years of age (1,882) are in the labor force, with 0.7% or 11 of them being unemployed. The group with the highest labor force participation rate are those with the educational attainment of bachelor's degree or higher, with 89.7% or 341 individuals in the labor force. Within the labor force, individuals with high school diploma education have the highest percentage of unemployment, with 1.1% or 5 of them being unemployed.
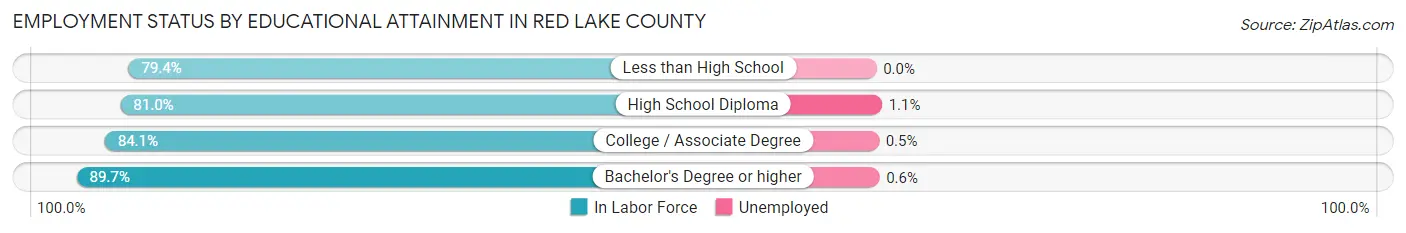
| Educational Attainment | In Labor Force | Unemployed |
| Less than High School | 50 (79.4%) | 0 (0.0%) |
| High School Diploma | 464 (81.0%) | 6 (1.1%) |
| College / Associate Degree | 728 (84.1%) | 4 (0.5%) |
| Bachelor's Degree or higher | 341 (89.7%) | 2 (0.6%) |
| Total | 1,583 (84.1%) | 13 (0.7%) |
Employment Occupations by Sex in Red Lake County
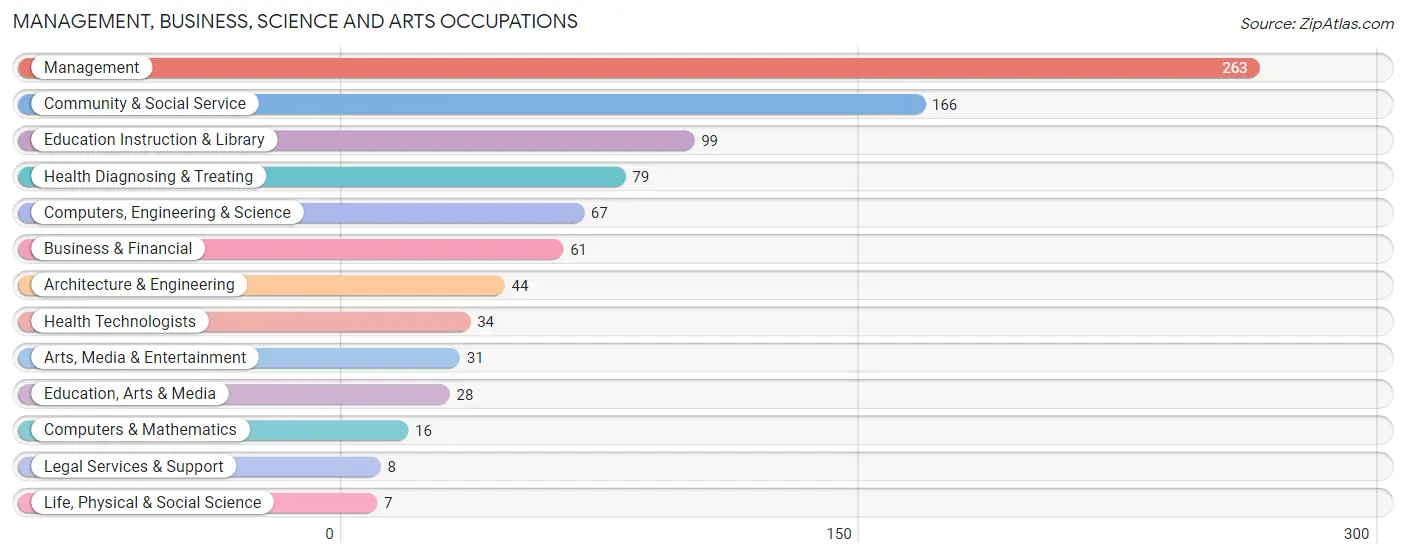
Management, Business, Science and Arts Occupations
The most common Management, Business, Science and Arts occupations in Red Lake County are Management (263 | 13.4%), Community & Social Service (166 | 8.4%), Education Instruction & Library (99 | 5.0%), Health Diagnosing & Treating (79 | 4.0%), and Computers, Engineering & Science (67 | 3.4%).
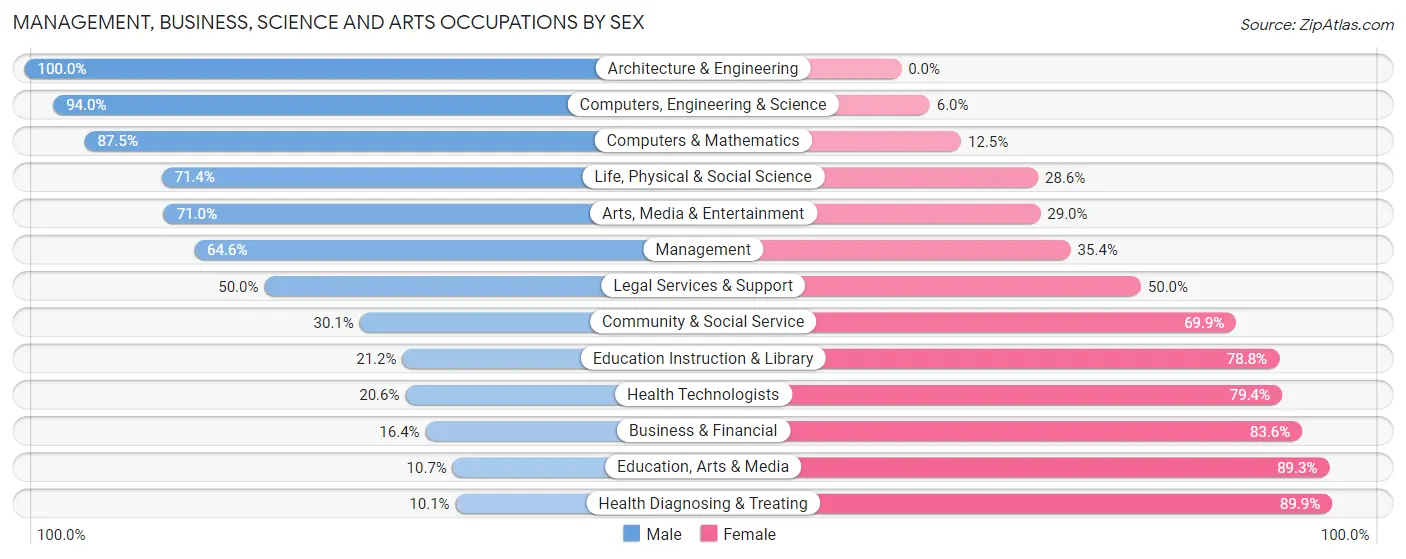
Management, Business, Science and Arts Occupations by Sex
Within the Management, Business, Science and Arts occupations in Red Lake County, the most male-oriented occupations are Architecture & Engineering (100.0%), Computers, Engineering & Science (94.0%), and Computers & Mathematics (87.5%), while the most female-oriented occupations are Health Diagnosing & Treating (89.9%), Education, Arts & Media (89.3%), and Business & Financial (83.6%).
| Occupation | Male | Female |
| Management | 170 (64.6%) | 93 (35.4%) |
| Business & Financial | 10 (16.4%) | 51 (83.6%) |
| Computers, Engineering & Science | 63 (94.0%) | 4 (6.0%) |
| Computers & Mathematics | 14 (87.5%) | 2 (12.5%) |
| Architecture & Engineering | 44 (100.0%) | 0 (0.0%) |
| Life, Physical & Social Science | 5 (71.4%) | 2 (28.6%) |
| Community & Social Service | 50 (30.1%) | 116 (69.9%) |
| Education, Arts & Media | 3 (10.7%) | 25 (89.3%) |
| Legal Services & Support | 4 (50.0%) | 4 (50.0%) |
| Education Instruction & Library | 21 (21.2%) | 78 (78.8%) |
| Arts, Media & Entertainment | 22 (71.0%) | 9 (29.0%) |
| Health Diagnosing & Treating | 8 (10.1%) | 71 (89.9%) |
| Health Technologists | 7 (20.6%) | 27 (79.4%) |
| Total (Category) | 301 (47.3%) | 335 (52.7%) |
| Total (Overall) | 1,050 (53.4%) | 917 (46.6%) |
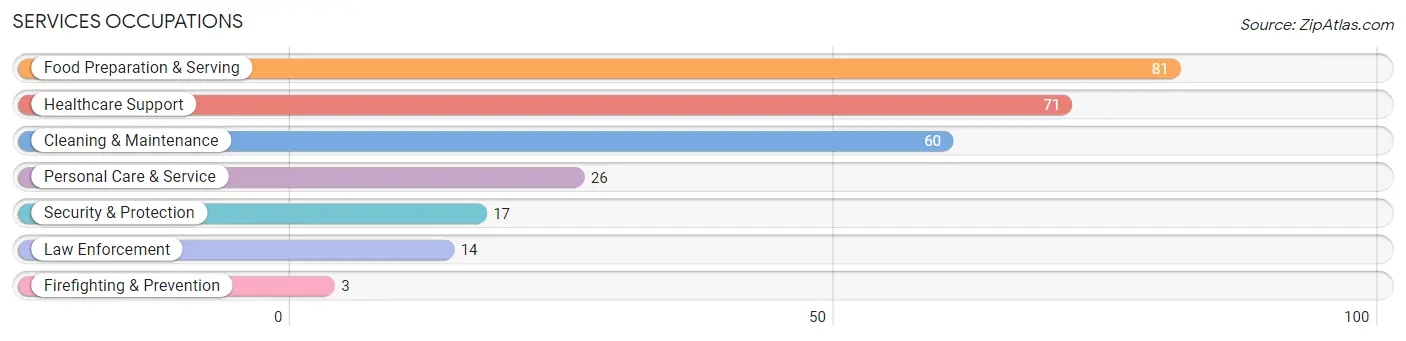
Services Occupations
The most common Services occupations in Red Lake County are Food Preparation & Serving (81 | 4.1%), Healthcare Support (71 | 3.6%), Cleaning & Maintenance (60 | 3.0%), Personal Care & Service (26 | 1.3%), and Security & Protection (17 | 0.9%).
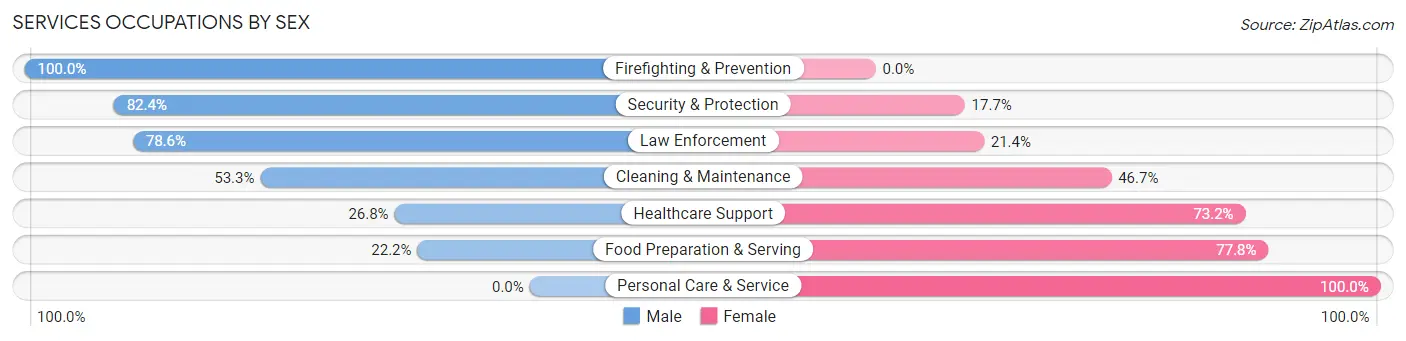
Services Occupations by Sex
Within the Services occupations in Red Lake County, the most male-oriented occupations are Firefighting & Prevention (100.0%), Security & Protection (82.4%), and Law Enforcement (78.6%), while the most female-oriented occupations are Personal Care & Service (100.0%), Food Preparation & Serving (77.8%), and Healthcare Support (73.2%).
| Occupation | Male | Female |
| Healthcare Support | 19 (26.8%) | 52 (73.2%) |
| Security & Protection | 14 (82.4%) | 3 (17.6%) |
| Firefighting & Prevention | 3 (100.0%) | 0 (0.0%) |
| Law Enforcement | 11 (78.6%) | 3 (21.4%) |
| Food Preparation & Serving | 18 (22.2%) | 63 (77.8%) |
| Cleaning & Maintenance | 32 (53.3%) | 28 (46.7%) |
| Personal Care & Service | 0 (0.0%) | 26 (100.0%) |
| Total (Category) | 83 (32.6%) | 172 (67.4%) |
| Total (Overall) | 1,050 (53.4%) | 917 (46.6%) |
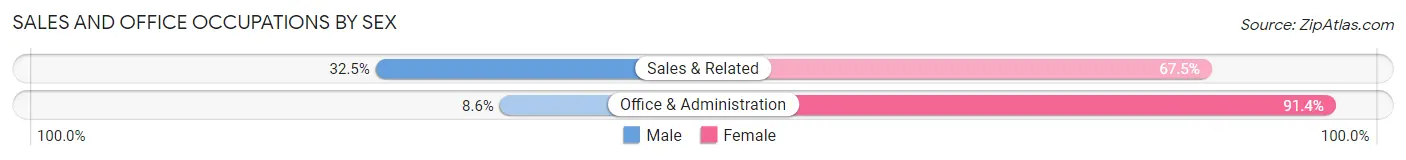
Sales and Office Occupations
The most common Sales and Office occupations in Red Lake County are Office & Administration (220 | 11.2%), and Sales & Related (200 | 10.2%).

Sales and Office Occupations by Sex
| Occupation | Male | Female |
| Sales & Related | 65 (32.5%) | 135 (67.5%) |
| Office & Administration | 19 (8.6%) | 201 (91.4%) |
| Total (Category) | 84 (20.0%) | 336 (80.0%) |
| Total (Overall) | 1,050 (53.4%) | 917 (46.6%) |
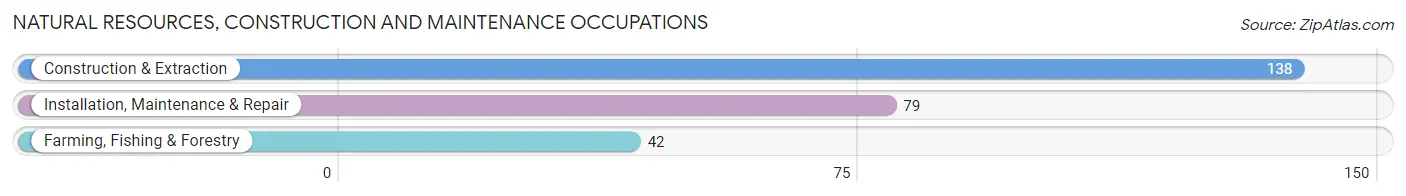
Natural Resources, Construction and Maintenance Occupations
The most common Natural Resources, Construction and Maintenance occupations in Red Lake County are Construction & Extraction (138 | 7.0%), Installation, Maintenance & Repair (79 | 4.0%), and Farming, Fishing & Forestry (42 | 2.1%).
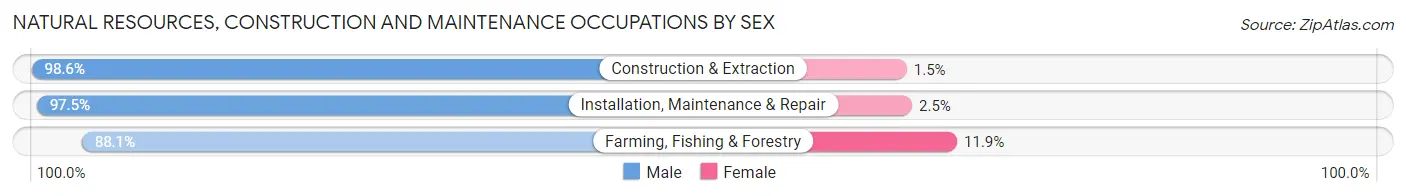
Natural Resources, Construction and Maintenance Occupations by Sex
| Occupation | Male | Female |
| Farming, Fishing & Forestry | 37 (88.1%) | 5 (11.9%) |
| Construction & Extraction | 136 (98.6%) | 2 (1.5%) |
| Installation, Maintenance & Repair | 77 (97.5%) | 2 (2.5%) |
| Total (Category) | 250 (96.5%) | 9 (3.5%) |
| Total (Overall) | 1,050 (53.4%) | 917 (46.6%) |
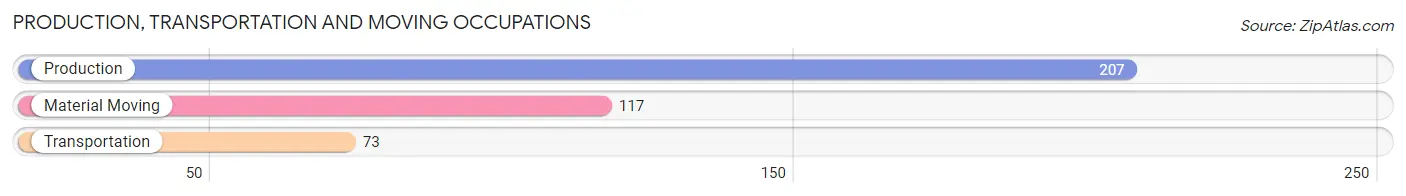
Production, Transportation and Moving Occupations
The most common Production, Transportation and Moving occupations in Red Lake County are Production (207 | 10.5%), Material Moving (117 | 5.9%), and Transportation (73 | 3.7%).
Production, Transportation and Moving Occupations by Sex
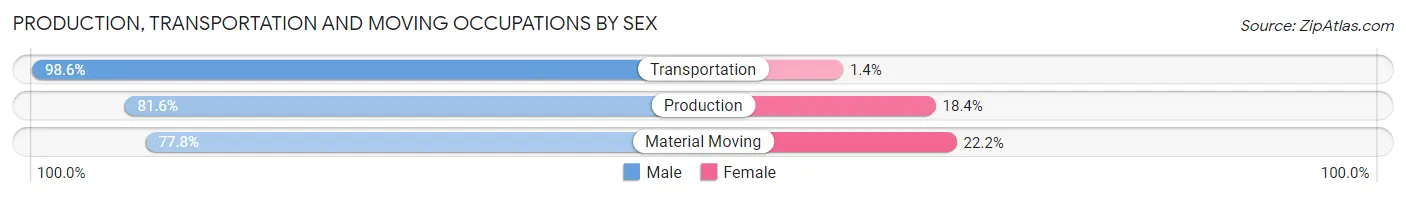
| Occupation | Male | Female |
| Production | 169 (81.6%) | 38 (18.4%) |
| Transportation | 72 (98.6%) | 1 (1.4%) |
| Material Moving | 91 (77.8%) | 26 (22.2%) |
| Total (Category) | 332 (83.6%) | 65 (16.4%) |
| Total (Overall) | 1,050 (53.4%) | 917 (46.6%) |
Employment Industries by Sex in Red Lake County
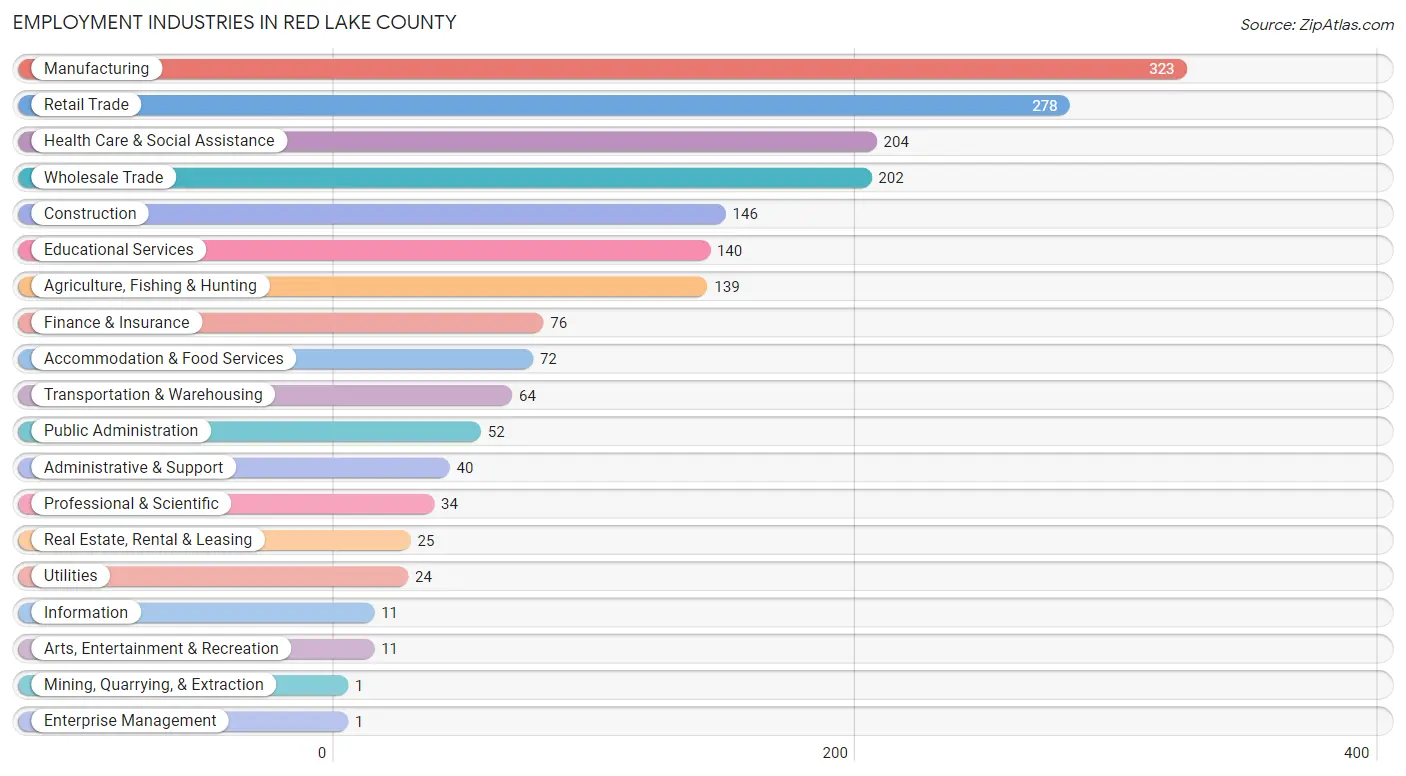
Employment Industries in Red Lake County
The major employment industries in Red Lake County include Manufacturing (323 | 16.4%), Retail Trade (278 | 14.1%), Health Care & Social Assistance (204 | 10.4%), Wholesale Trade (202 | 10.3%), and Construction (146 | 7.4%).
Employment Industries by Sex in Red Lake County
The Red Lake County industries that see more men than women are Mining, Quarrying, & Extraction (100.0%), Enterprise Management (100.0%), and Construction (98.6%), whereas the industries that tend to have a higher number of women are Health Care & Social Assistance (88.7%), Accommodation & Food Services (81.9%), and Educational Services (74.3%).

| Industry | Male | Female |
| Agriculture, Fishing & Hunting | 125 (89.9%) | 14 (10.1%) |
| Mining, Quarrying, & Extraction | 1 (100.0%) | 0 (0.0%) |
| Construction | 144 (98.6%) | 2 (1.4%) |
| Manufacturing | 232 (71.8%) | 91 (28.2%) |
| Wholesale Trade | 91 (45.1%) | 111 (54.9%) |
| Retail Trade | 115 (41.4%) | 163 (58.6%) |
| Transportation & Warehousing | 54 (84.4%) | 10 (15.6%) |
| Utilities | 16 (66.7%) | 8 (33.3%) |
| Information | 5 (45.5%) | 6 (54.5%) |
| Finance & Insurance | 23 (30.3%) | 53 (69.7%) |
| Real Estate, Rental & Leasing | 19 (76.0%) | 6 (24.0%) |
| Professional & Scientific | 11 (32.4%) | 23 (67.6%) |
| Enterprise Management | 1 (100.0%) | 0 (0.0%) |
| Administrative & Support | 30 (75.0%) | 10 (25.0%) |
| Educational Services | 36 (25.7%) | 104 (74.3%) |
| Health Care & Social Assistance | 23 (11.3%) | 181 (88.7%) |
| Arts, Entertainment & Recreation | 9 (81.8%) | 2 (18.2%) |
| Accommodation & Food Services | 13 (18.1%) | 59 (81.9%) |
| Public Administration | 26 (50.0%) | 26 (50.0%) |
| Total | 1,050 (53.4%) | 917 (46.6%) |
Education in Red Lake County
School Enrollment in Red Lake County
The most common levels of schooling among the 868 students in Red Lake County are elementary school (229 | 26.4%), middle school (223 | 25.7%), and high school (215 | 24.8%).

| School Level | # Students | % Students |
| Nursery / Preschool | 67 | 7.7% |
| Kindergarten | 49 | 5.7% |
| Elementary School | 229 | 26.4% |
| Middle School | 223 | 25.7% |
| High School | 215 | 24.8% |
| College / Undergraduate | 69 | 8.0% |
| Graduate / Professional | 16 | 1.8% |
| Total | 868 | 100.0% |
School Enrollment by Age by Funding Source in Red Lake County
Out of a total of 868 students who are enrolled in schools in Red Lake County, 57 (6.6%) attend a private institution, while the remaining 811 (93.4%) are enrolled in public schools. The age group of 25 to 34 year olds has the highest likelihood of being enrolled in private schools, with 4 (36.4% in the age bracket) enrolled. Conversely, the age group of 20 to 24 year olds has the lowest likelihood of being enrolled in a private school, with 20 (100.0% in the age bracket) attending a public institution.
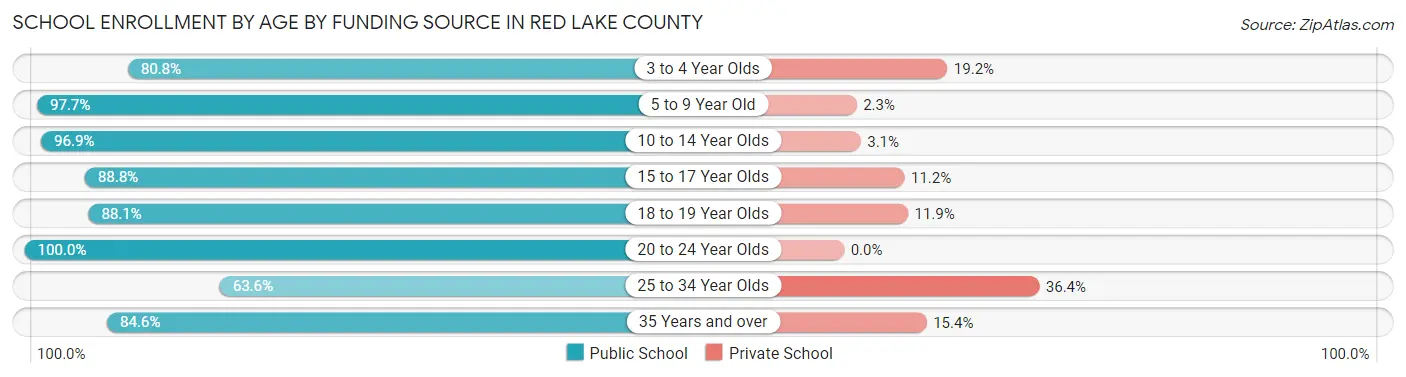
| Age Bracket | Public School | Private School |
| 3 to 4 Year Olds | 42 (80.8%) | 10 (19.2%) |
| 5 to 9 Year Old | 251 (97.7%) | 6 (2.3%) |
| 10 to 14 Year Olds | 282 (96.9%) | 9 (3.1%) |
| 15 to 17 Year Olds | 150 (88.8%) | 19 (11.2%) |
| 18 to 19 Year Olds | 37 (88.1%) | 5 (11.9%) |
| 20 to 24 Year Olds | 20 (100.0%) | 0 (0.0%) |
| 25 to 34 Year Olds | 7 (63.6%) | 4 (36.4%) |
| 35 Years and over | 22 (84.6%) | 4 (15.4%) |
| Total | 811 (93.4%) | 57 (6.6%) |
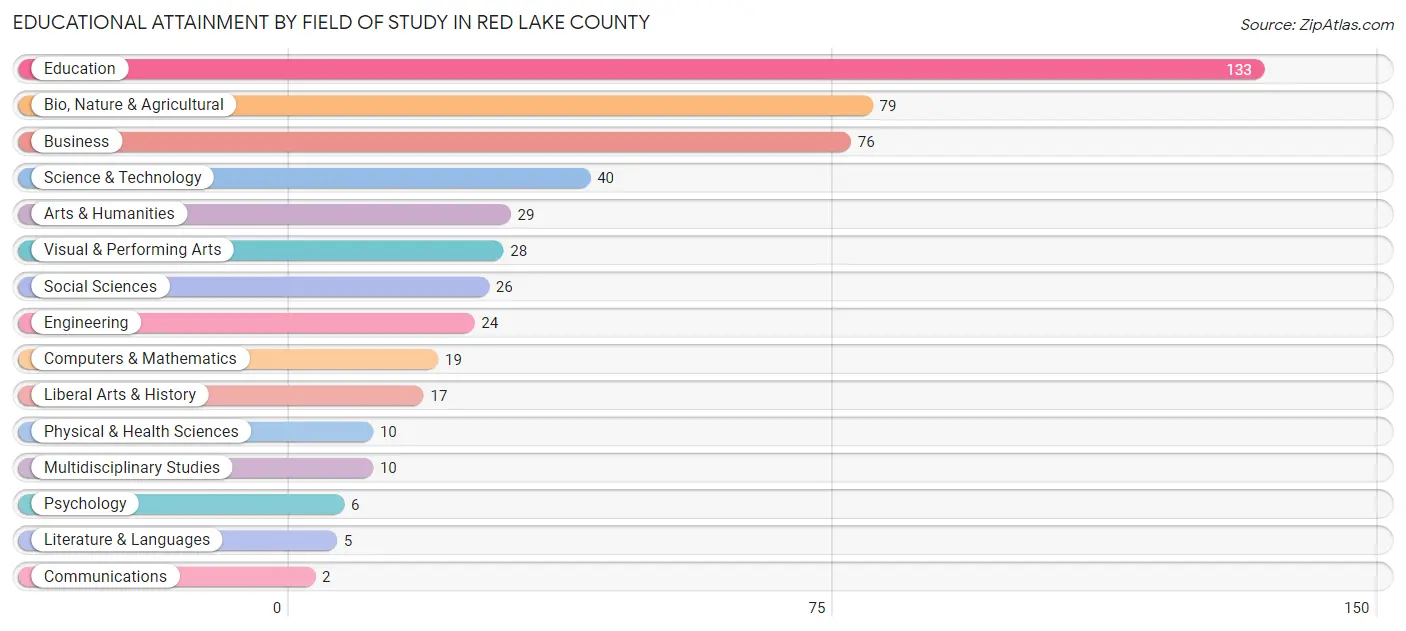
Educational Attainment by Field of Study in Red Lake County
Education (133 | 26.4%), bio, nature & agricultural (79 | 15.7%), business (76 | 15.1%), science & technology (40 | 7.9%), and arts & humanities (29 | 5.8%) are the most common fields of study among 504 individuals in Red Lake County who have obtained a bachelor's degree or higher.
| Field of Study | # Graduates | % Graduates |
| Computers & Mathematics | 19 | 3.8% |
| Bio, Nature & Agricultural | 79 | 15.7% |
| Physical & Health Sciences | 10 | 2.0% |
| Psychology | 6 | 1.2% |
| Social Sciences | 26 | 5.2% |
| Engineering | 24 | 4.8% |
| Multidisciplinary Studies | 10 | 2.0% |
| Science & Technology | 40 | 7.9% |
| Business | 76 | 15.1% |
| Education | 133 | 26.4% |
| Literature & Languages | 5 | 1.0% |
| Liberal Arts & History | 17 | 3.4% |
| Visual & Performing Arts | 28 | 5.6% |
| Communications | 2 | 0.4% |
| Arts & Humanities | 29 | 5.8% |
| Total | 504 | 100.0% |
Transportation & Commute in Red Lake County
Vehicle Availability by Sex in Red Lake County
The most prevalent vehicle ownership categories in Red Lake County are males with 2 vehicles (361, accounting for 34.6%) and females with 2 vehicles (293, making up 40.3%).
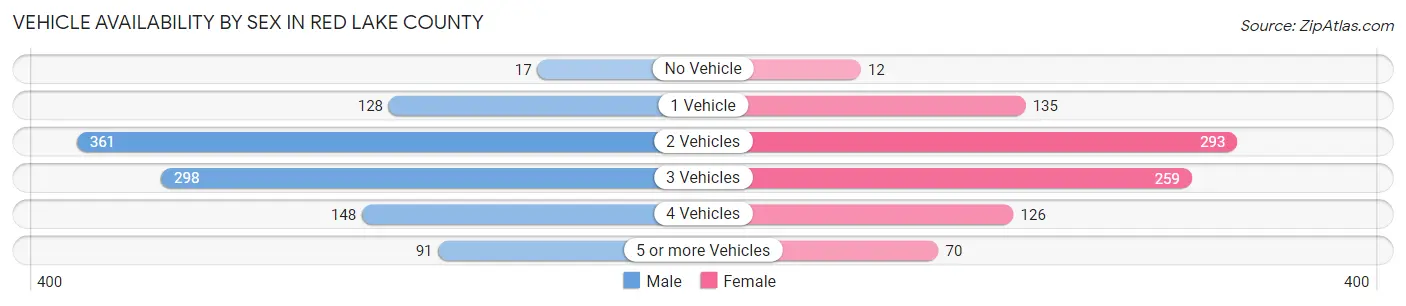
| Vehicles Available | Male | Female |
| No Vehicle | 17 (1.6%) | 12 (1.3%) |
| 1 Vehicle | 128 (12.3%) | 135 (15.1%) |
| 2 Vehicles | 361 (34.6%) | 293 (32.7%) |
| 3 Vehicles | 298 (28.6%) | 259 (28.9%) |
| 4 Vehicles | 148 (14.2%) | 126 (14.1%) |
| 5 or more Vehicles | 91 (8.7%) | 70 (7.8%) |
| Total | 1,043 (100.0%) | 895 (100.0%) |
Commute Time in Red Lake County
The most frequently occuring commute durations in Red Lake County are less than 5 minutes (301 commuters, 17.0%), 20 to 24 minutes (257 commuters, 14.5%), and 30 to 34 minutes (216 commuters, 12.2%).
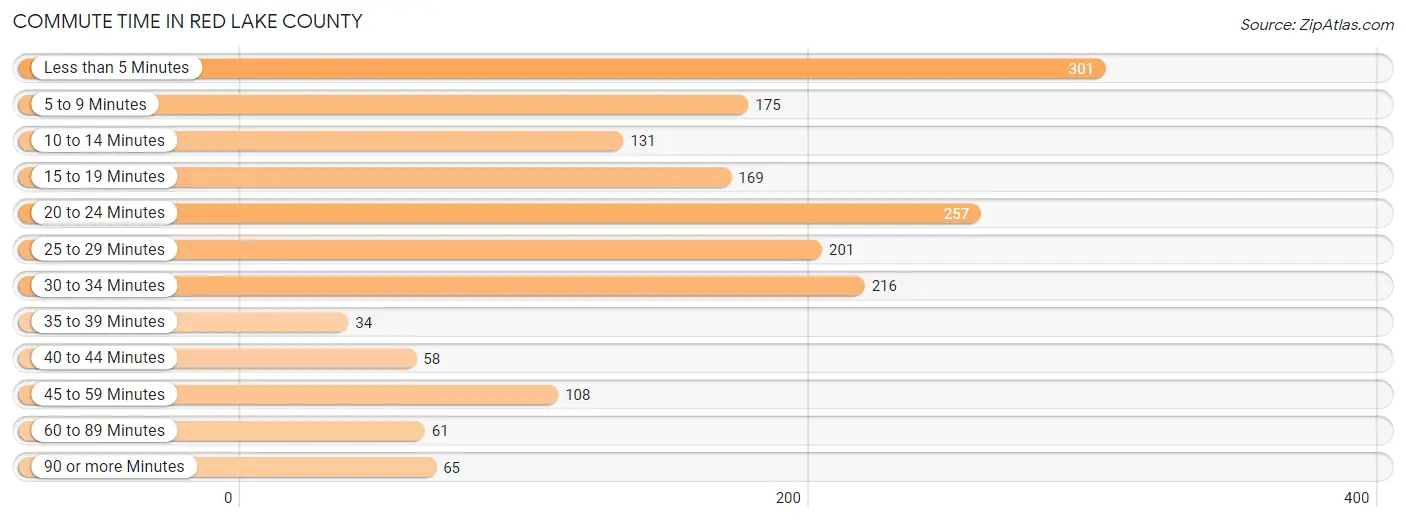
| Commute Time | # Commuters | % Commuters |
| Less than 5 Minutes | 301 | 17.0% |
| 5 to 9 Minutes | 175 | 9.9% |
| 10 to 14 Minutes | 131 | 7.4% |
| 15 to 19 Minutes | 169 | 9.5% |
| 20 to 24 Minutes | 257 | 14.5% |
| 25 to 29 Minutes | 201 | 11.3% |
| 30 to 34 Minutes | 216 | 12.2% |
| 35 to 39 Minutes | 34 | 1.9% |
| 40 to 44 Minutes | 58 | 3.3% |
| 45 to 59 Minutes | 108 | 6.1% |
| 60 to 89 Minutes | 61 | 3.4% |
| 90 or more Minutes | 65 | 3.7% |
Commute Time by Sex in Red Lake County
The most common commute times in Red Lake County are less than 5 minutes (169 commuters, 17.5%) for males and less than 5 minutes (132 commuters, 16.3%) for females.
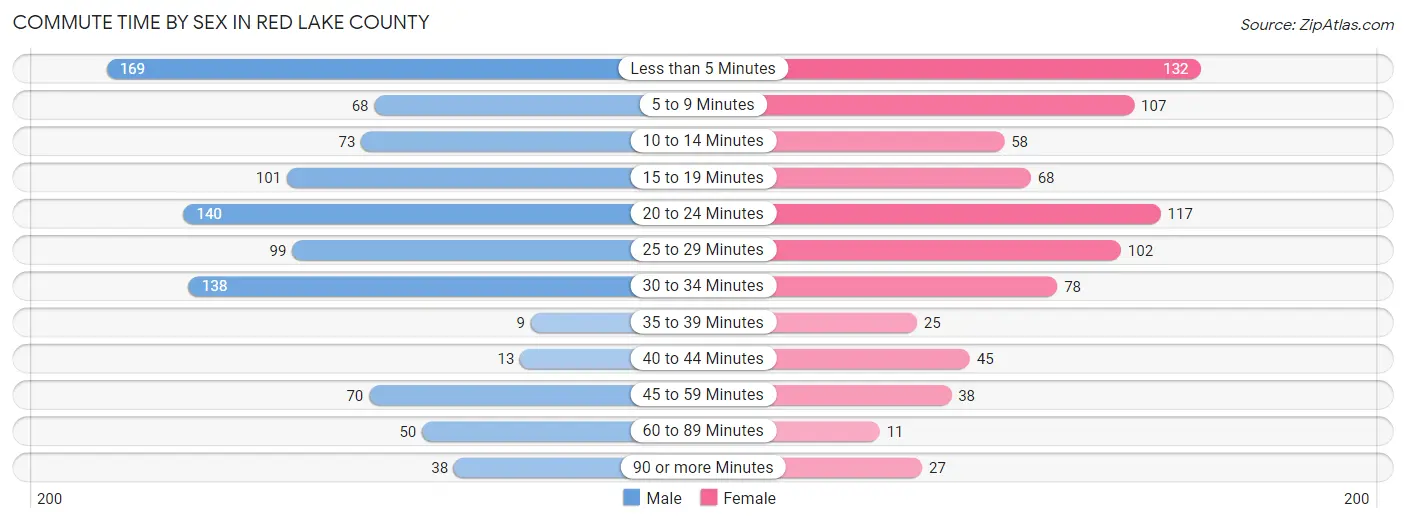
| Commute Time | Male | Female |
| Less than 5 Minutes | 169 (17.5%) | 132 (16.3%) |
| 5 to 9 Minutes | 68 (7.0%) | 107 (13.2%) |
| 10 to 14 Minutes | 73 (7.5%) | 58 (7.2%) |
| 15 to 19 Minutes | 101 (10.4%) | 68 (8.4%) |
| 20 to 24 Minutes | 140 (14.5%) | 117 (14.5%) |
| 25 to 29 Minutes | 99 (10.2%) | 102 (12.6%) |
| 30 to 34 Minutes | 138 (14.3%) | 78 (9.7%) |
| 35 to 39 Minutes | 9 (0.9%) | 25 (3.1%) |
| 40 to 44 Minutes | 13 (1.3%) | 45 (5.6%) |
| 45 to 59 Minutes | 70 (7.2%) | 38 (4.7%) |
| 60 to 89 Minutes | 50 (5.2%) | 11 (1.4%) |
| 90 or more Minutes | 38 (3.9%) | 27 (3.3%) |
Time of Departure to Work by Sex in Red Lake County
The most frequent times of departure to work in Red Lake County are 7:30 AM to 7:59 AM (138, 14.3%) for males and 7:30 AM to 7:59 AM (168, 20.8%) for females.
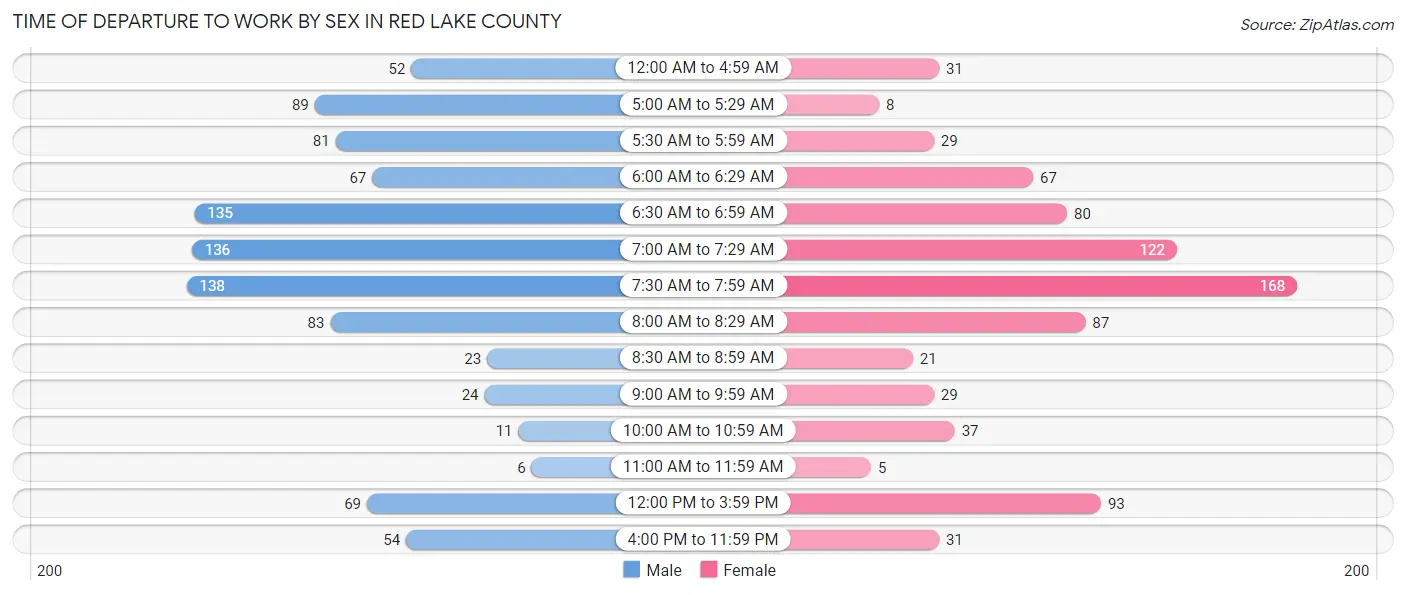
| Time of Departure | Male | Female |
| 12:00 AM to 4:59 AM | 52 (5.4%) | 31 (3.8%) |
| 5:00 AM to 5:29 AM | 89 (9.2%) | 8 (1.0%) |
| 5:30 AM to 5:59 AM | 81 (8.4%) | 29 (3.6%) |
| 6:00 AM to 6:29 AM | 67 (6.9%) | 67 (8.3%) |
| 6:30 AM to 6:59 AM | 135 (14.0%) | 80 (9.9%) |
| 7:00 AM to 7:29 AM | 136 (14.1%) | 122 (15.1%) |
| 7:30 AM to 7:59 AM | 138 (14.3%) | 168 (20.8%) |
| 8:00 AM to 8:29 AM | 83 (8.6%) | 87 (10.8%) |
| 8:30 AM to 8:59 AM | 23 (2.4%) | 21 (2.6%) |
| 9:00 AM to 9:59 AM | 24 (2.5%) | 29 (3.6%) |
| 10:00 AM to 10:59 AM | 11 (1.1%) | 37 (4.6%) |
| 11:00 AM to 11:59 AM | 6 (0.6%) | 5 (0.6%) |
| 12:00 PM to 3:59 PM | 69 (7.1%) | 93 (11.5%) |
| 4:00 PM to 11:59 PM | 54 (5.6%) | 31 (3.8%) |
| Total | 968 (100.0%) | 808 (100.0%) |
Housing Occupancy in Red Lake County
Occupancy by Ownership in Red Lake County
Of the total 1,638 dwellings in Red Lake County, owner-occupied units account for 1,349 (82.4%), while renter-occupied units make up 289 (17.6%).

| Occupancy | # Housing Units | % Housing Units |
| Owner Occupied Housing Units | 1,349 | 82.4% |
| Renter-Occupied Housing Units | 289 | 17.6% |
| Total Occupied Housing Units | 1,638 | 100.0% |
Occupancy by Household Size in Red Lake County
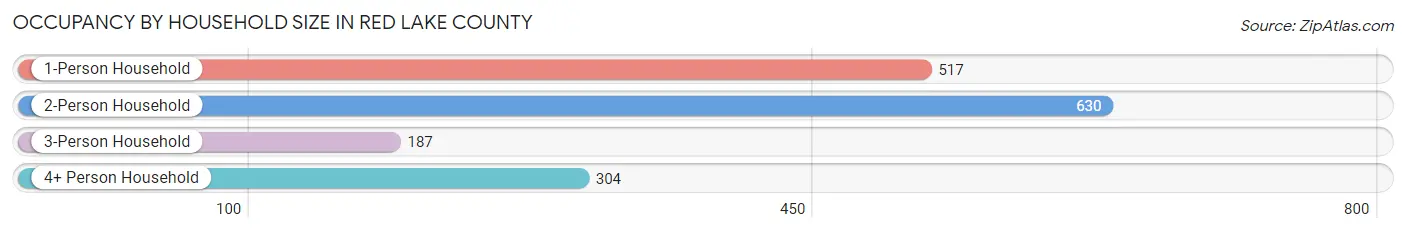
| Household Size | # Housing Units | % Housing Units |
| 1-Person Household | 517 | 31.6% |
| 2-Person Household | 630 | 38.5% |
| 3-Person Household | 187 | 11.4% |
| 4+ Person Household | 304 | 18.6% |
| Total Housing Units | 1,638 | 100.0% |
Occupancy by Ownership by Household Size in Red Lake County

| Household Size | Owner-occupied | Renter-occupied |
| 1-Person Household | 351 (67.9%) | 166 (32.1%) |
| 2-Person Household | 551 (87.5%) | 79 (12.5%) |
| 3-Person Household | 162 (86.6%) | 25 (13.4%) |
| 4+ Person Household | 285 (93.8%) | 19 (6.2%) |
| Total Housing Units | 1,349 (82.4%) | 289 (17.6%) |
Occupancy by Educational Attainment in Red Lake County
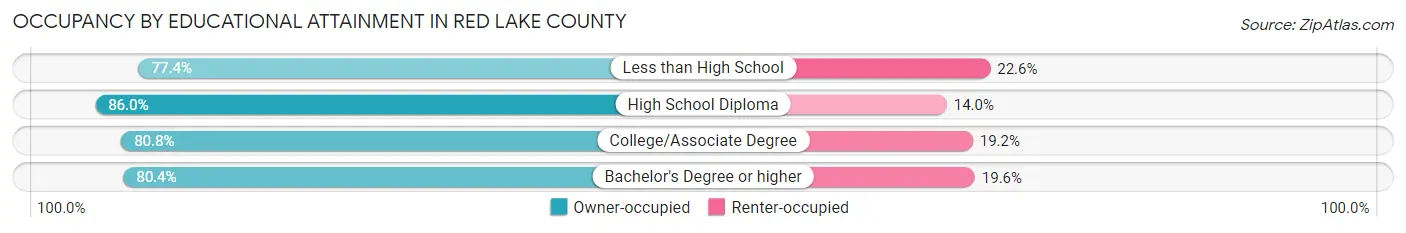
| Household Size | Owner-occupied | Renter-occupied |
| Less than High School | 65 (77.4%) | 19 (22.6%) |
| High School Diploma | 485 (86.0%) | 79 (14.0%) |
| College/Associate Degree | 540 (80.8%) | 128 (19.2%) |
| Bachelor's Degree or higher | 259 (80.4%) | 63 (19.6%) |
Occupancy by Age of Householder in Red Lake County
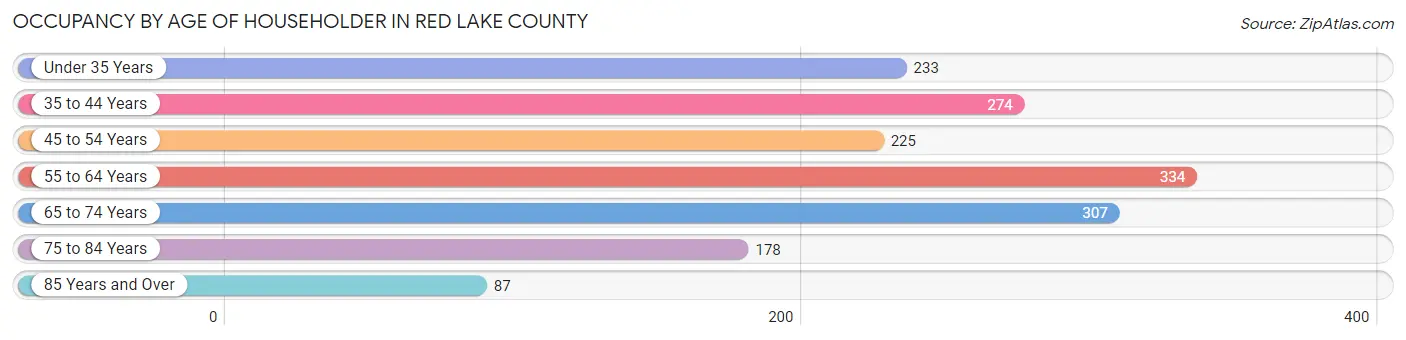
| Age Bracket | # Households | % Households |
| Under 35 Years | 233 | 14.2% |
| 35 to 44 Years | 274 | 16.7% |
| 45 to 54 Years | 225 | 13.7% |
| 55 to 64 Years | 334 | 20.4% |
| 65 to 74 Years | 307 | 18.7% |
| 75 to 84 Years | 178 | 10.9% |
| 85 Years and Over | 87 | 5.3% |
| Total | 1,638 | 100.0% |
Housing Finances in Red Lake County
Median Income by Occupancy in Red Lake County
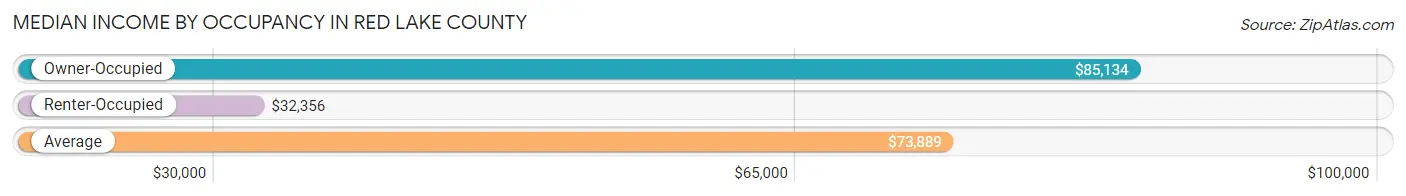
| Occupancy Type | # Households | Median Income |
| Owner-Occupied | 1,349 (82.4%) | $85,134 |
| Renter-Occupied | 289 (17.6%) | $32,356 |
| Average | 1,638 (100.0%) | $73,889 |
Occupancy by Householder Income Bracket in Red Lake County
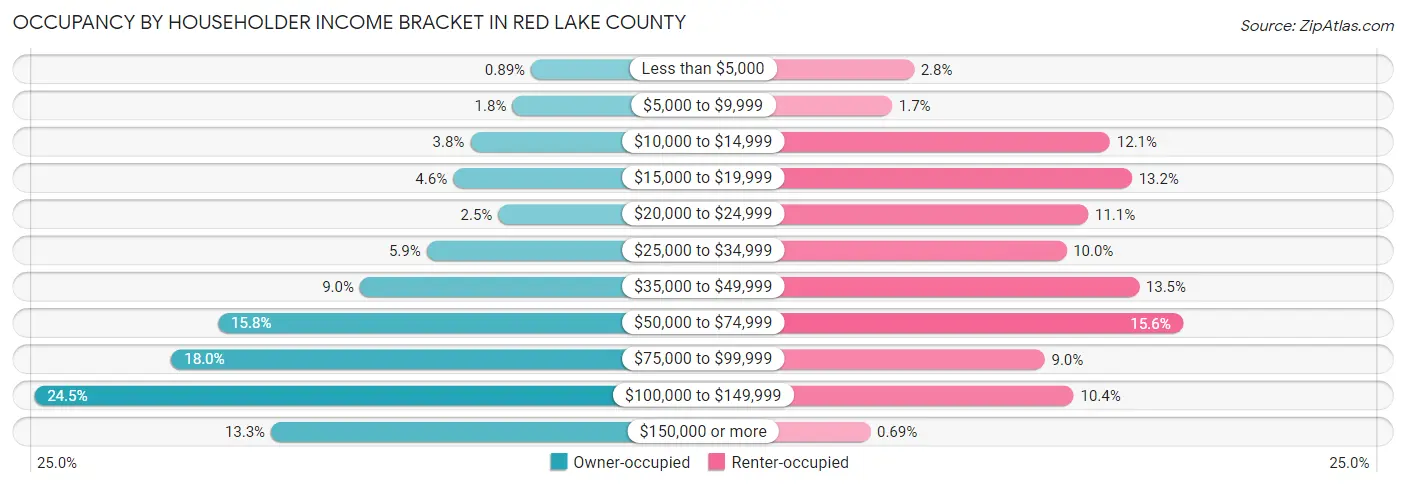
| Income Bracket | Owner-occupied | Renter-occupied |
| Less than $5,000 | 12 (0.9%) | 8 (2.8%) |
| $5,000 to $9,999 | 24 (1.8%) | 5 (1.7%) |
| $10,000 to $14,999 | 51 (3.8%) | 35 (12.1%) |
| $15,000 to $19,999 | 62 (4.6%) | 38 (13.2%) |
| $20,000 to $24,999 | 33 (2.5%) | 32 (11.1%) |
| $25,000 to $34,999 | 79 (5.9%) | 29 (10.0%) |
| $35,000 to $49,999 | 122 (9.0%) | 39 (13.5%) |
| $50,000 to $74,999 | 213 (15.8%) | 45 (15.6%) |
| $75,000 to $99,999 | 243 (18.0%) | 26 (9.0%) |
| $100,000 to $149,999 | 331 (24.5%) | 30 (10.4%) |
| $150,000 or more | 179 (13.3%) | 2 (0.7%) |
| Total | 1,349 (100.0%) | 289 (100.0%) |
Monthly Housing Cost Tiers in Red Lake County
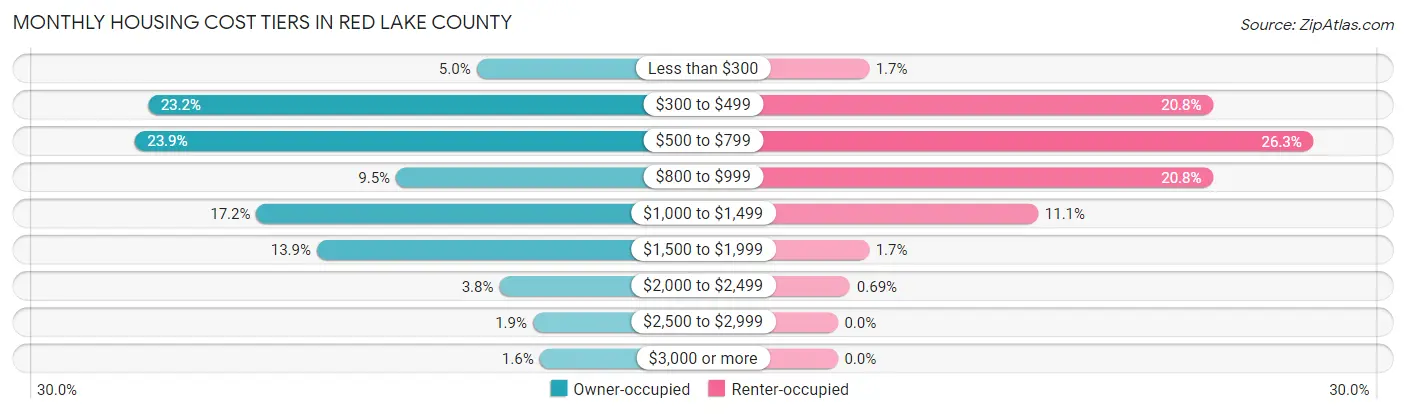
| Monthly Cost | Owner-occupied | Renter-occupied |
| Less than $300 | 68 (5.0%) | 5 (1.7%) |
| $300 to $499 | 313 (23.2%) | 60 (20.8%) |
| $500 to $799 | 323 (23.9%) | 76 (26.3%) |
| $800 to $999 | 128 (9.5%) | 60 (20.8%) |
| $1,000 to $1,499 | 232 (17.2%) | 32 (11.1%) |
| $1,500 to $1,999 | 187 (13.9%) | 5 (1.7%) |
| $2,000 to $2,499 | 51 (3.8%) | 2 (0.7%) |
| $2,500 to $2,999 | 26 (1.9%) | 0 (0.0%) |
| $3,000 or more | 21 (1.6%) | 0 (0.0%) |
| Total | 1,349 (100.0%) | 289 (100.0%) |
Physical Housing Characteristics in Red Lake County
Housing Structures in Red Lake County
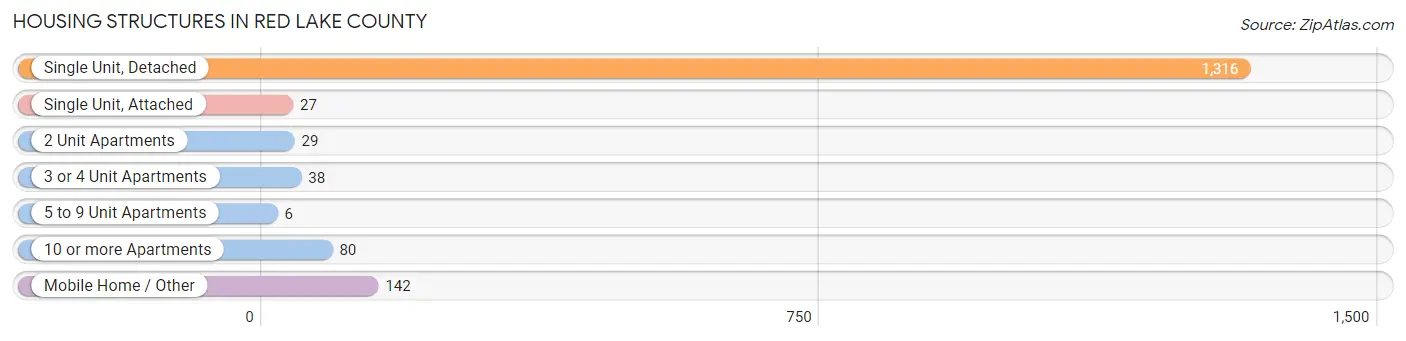
| Structure Type | # Housing Units | % Housing Units |
| Single Unit, Detached | 1,316 | 80.3% |
| Single Unit, Attached | 27 | 1.7% |
| 2 Unit Apartments | 29 | 1.8% |
| 3 or 4 Unit Apartments | 38 | 2.3% |
| 5 to 9 Unit Apartments | 6 | 0.4% |
| 10 or more Apartments | 80 | 4.9% |
| Mobile Home / Other | 142 | 8.7% |
| Total | 1,638 | 100.0% |
Housing Structures by Occupancy in Red Lake County
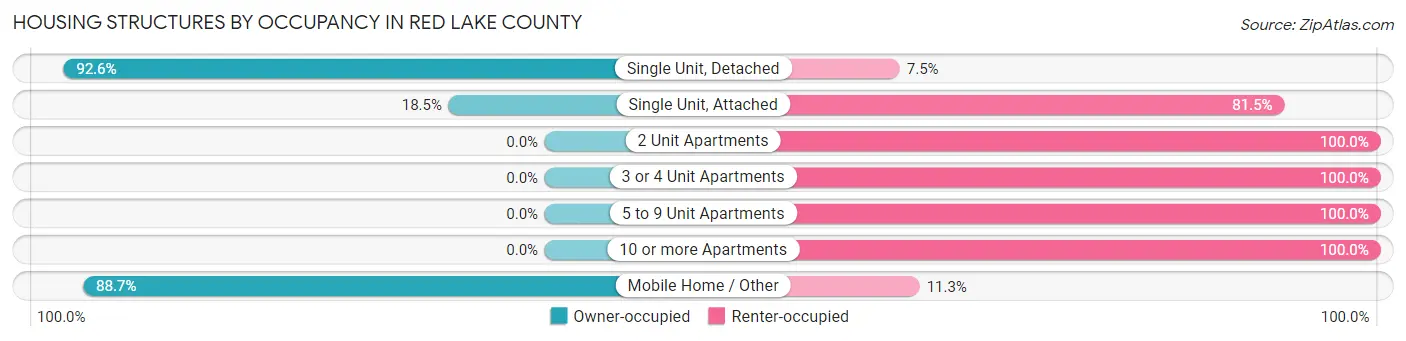
| Structure Type | Owner-occupied | Renter-occupied |
| Single Unit, Detached | 1,218 (92.5%) | 98 (7.4%) |
| Single Unit, Attached | 5 (18.5%) | 22 (81.5%) |
| 2 Unit Apartments | 0 (0.0%) | 29 (100.0%) |
| 3 or 4 Unit Apartments | 0 (0.0%) | 38 (100.0%) |
| 5 to 9 Unit Apartments | 0 (0.0%) | 6 (100.0%) |
| 10 or more Apartments | 0 (0.0%) | 80 (100.0%) |
| Mobile Home / Other | 126 (88.7%) | 16 (11.3%) |
| Total | 1,349 (82.4%) | 289 (17.6%) |
Housing Structures by Number of Rooms in Red Lake County
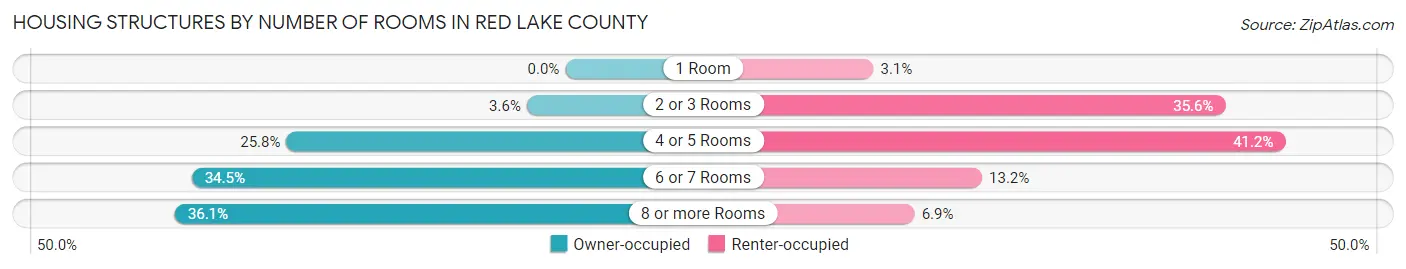
| Number of Rooms | Owner-occupied | Renter-occupied |
| 1 Room | 0 (0.0%) | 9 (3.1%) |
| 2 or 3 Rooms | 48 (3.6%) | 103 (35.6%) |
| 4 or 5 Rooms | 348 (25.8%) | 119 (41.2%) |
| 6 or 7 Rooms | 466 (34.5%) | 38 (13.2%) |
| 8 or more Rooms | 487 (36.1%) | 20 (6.9%) |
| Total | 1,349 (100.0%) | 289 (100.0%) |
Housing Structure by Heating Type in Red Lake County
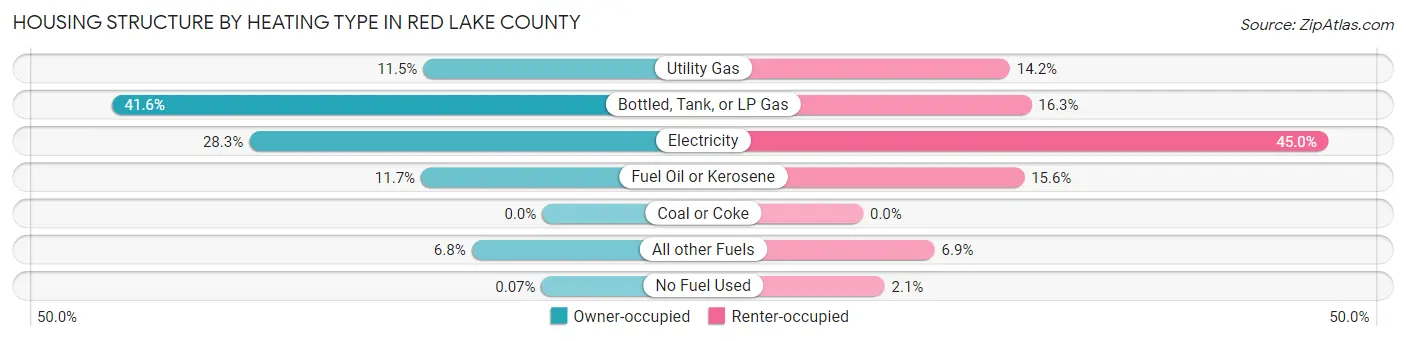
| Heating Type | Owner-occupied | Renter-occupied |
| Utility Gas | 155 (11.5%) | 41 (14.2%) |
| Bottled, Tank, or LP Gas | 561 (41.6%) | 47 (16.3%) |
| Electricity | 382 (28.3%) | 130 (45.0%) |
| Fuel Oil or Kerosene | 158 (11.7%) | 45 (15.6%) |
| Coal or Coke | 0 (0.0%) | 0 (0.0%) |
| All other Fuels | 92 (6.8%) | 20 (6.9%) |
| No Fuel Used | 1 (0.1%) | 6 (2.1%) |
| Total | 1,349 (100.0%) | 289 (100.0%) |
Household Vehicle Usage in Red Lake County
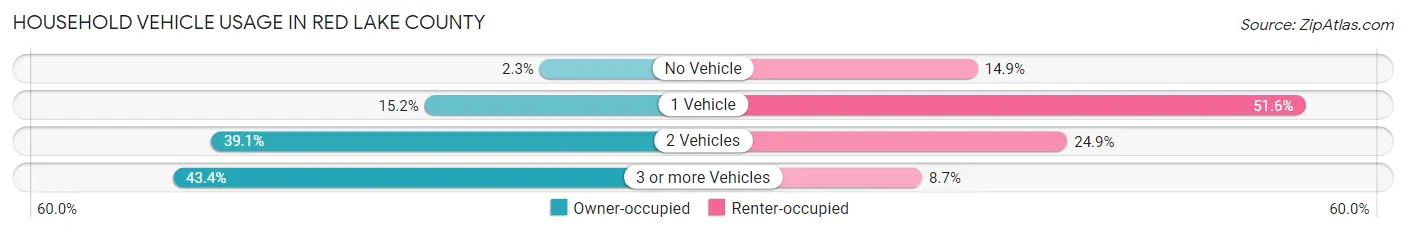
| Vehicles per Household | Owner-occupied | Renter-occupied |
| No Vehicle | 31 (2.3%) | 43 (14.9%) |
| 1 Vehicle | 205 (15.2%) | 149 (51.6%) |
| 2 Vehicles | 528 (39.1%) | 72 (24.9%) |
| 3 or more Vehicles | 585 (43.4%) | 25 (8.6%) |
| Total | 1,349 (100.0%) | 289 (100.0%) |
Real Estate & Mortgages in Red Lake County
Real Estate and Mortgage Overview in Red Lake County
| Characteristic | Without Mortgage | With Mortgage |
| Housing Units | 743 | 606 |
| Median Property Value | $123,400 | $163,500 |
| Median Household Income | $59,292 | $107 |
| Monthly Housing Costs | $503 | $20 |
| Real Estate Taxes | $1,274 | $5 |
Property Value by Mortgage Status in Red Lake County
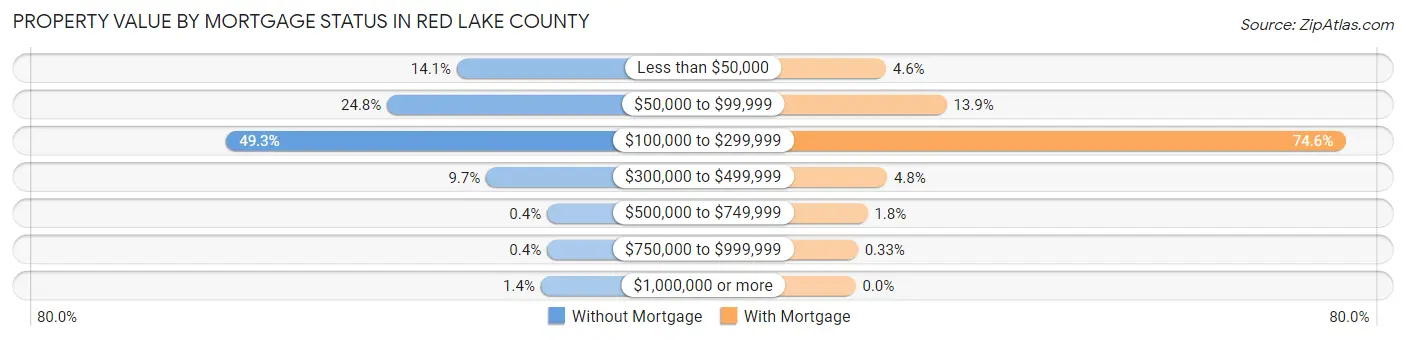
| Property Value | Without Mortgage | With Mortgage |
| Less than $50,000 | 105 (14.1%) | 28 (4.6%) |
| $50,000 to $99,999 | 184 (24.8%) | 84 (13.9%) |
| $100,000 to $299,999 | 366 (49.3%) | 452 (74.6%) |
| $300,000 to $499,999 | 72 (9.7%) | 29 (4.8%) |
| $500,000 to $749,999 | 3 (0.4%) | 11 (1.8%) |
| $750,000 to $999,999 | 3 (0.4%) | 2 (0.3%) |
| $1,000,000 or more | 10 (1.3%) | 0 (0.0%) |
| Total | 743 (100.0%) | 606 (100.0%) |
Household Income by Mortgage Status in Red Lake County

| Household Income | Without Mortgage | With Mortgage |
| Less than $10,000 | 27 (3.6%) | 3 (0.5%) |
| $10,000 to $24,999 | 111 (14.9%) | 9 (1.5%) |
| $25,000 to $34,999 | 69 (9.3%) | 35 (5.8%) |
| $35,000 to $49,999 | 86 (11.6%) | 10 (1.7%) |
| $50,000 to $74,999 | 148 (19.9%) | 36 (5.9%) |
| $75,000 to $99,999 | 110 (14.8%) | 65 (10.7%) |
| $100,000 to $149,999 | 120 (16.2%) | 133 (22.0%) |
| $150,000 or more | 72 (9.7%) | 211 (34.8%) |
| Total | 743 (100.0%) | 606 (100.0%) |
Property Value to Household Income Ratio in Red Lake County
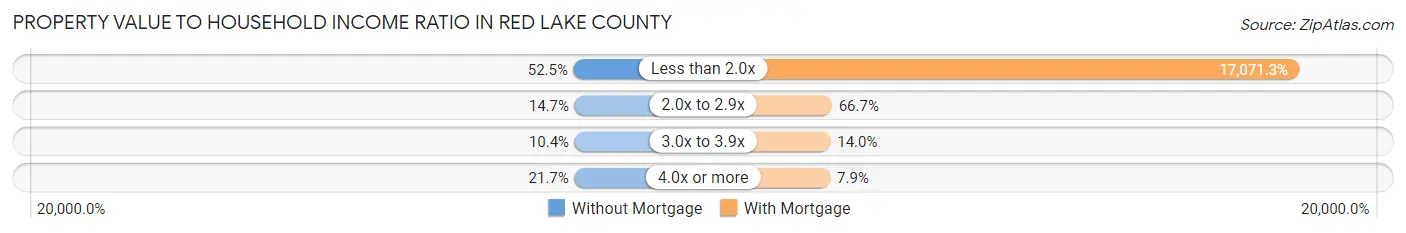
| Value-to-Income Ratio | Without Mortgage | With Mortgage |
| Less than 2.0x | 390 (52.5%) | 103,452 (17,071.3%) |
| 2.0x to 2.9x | 109 (14.7%) | 404 (66.7%) |
| 3.0x to 3.9x | 77 (10.4%) | 85 (14.0%) |
| 4.0x or more | 161 (21.7%) | 48 (7.9%) |
| Total | 743 (100.0%) | 606 (100.0%) |
Real Estate Taxes by Mortgage Status in Red Lake County

| Property Taxes | Without Mortgage | With Mortgage |
| Less than $800 | 216 (29.1%) | 2 (0.3%) |
| $800 to $1,499 | 221 (29.7%) | 111 (18.3%) |
| $800 to $1,499 | 306 (41.2%) | 172 (28.4%) |
| Total | 743 (100.0%) | 606 (100.0%) |
Health & Disability in Red Lake County
Health Insurance Coverage by Age in Red Lake County
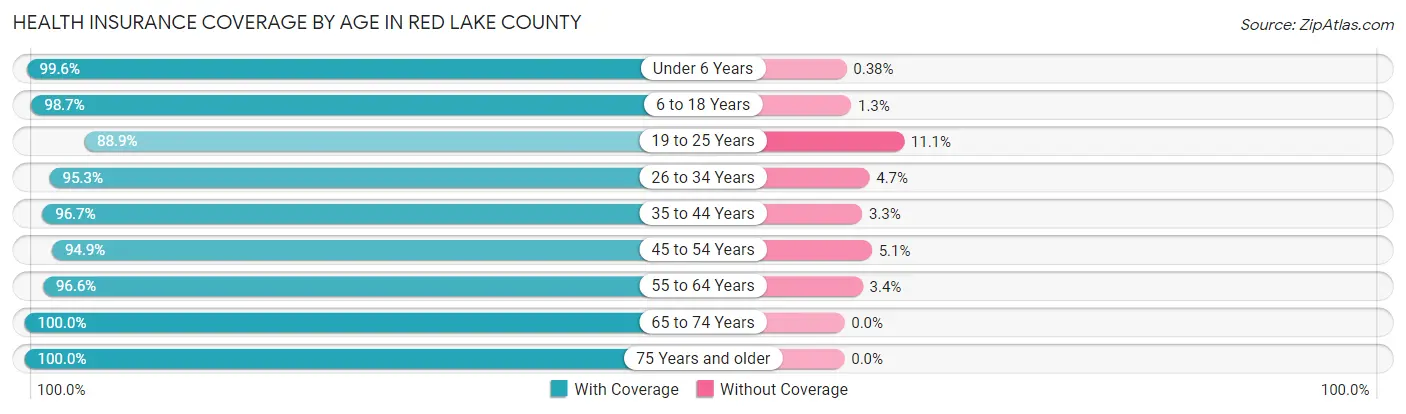
| Age Bracket | With Coverage | Without Coverage |
| Under 6 Years | 264 (99.6%) | 1 (0.4%) |
| 6 to 18 Years | 708 (98.7%) | 9 (1.3%) |
| 19 to 25 Years | 192 (88.9%) | 24 (11.1%) |
| 26 to 34 Years | 307 (95.3%) | 15 (4.7%) |
| 35 to 44 Years | 527 (96.7%) | 18 (3.3%) |
| 45 to 54 Years | 390 (94.9%) | 21 (5.1%) |
| 55 to 64 Years | 564 (96.6%) | 20 (3.4%) |
| 65 to 74 Years | 469 (100.0%) | 0 (0.0%) |
| 75 Years and older | 377 (100.0%) | 0 (0.0%) |
| Total | 3,798 (97.2%) | 108 (2.8%) |
Health Insurance Coverage by Citizenship Status in Red Lake County
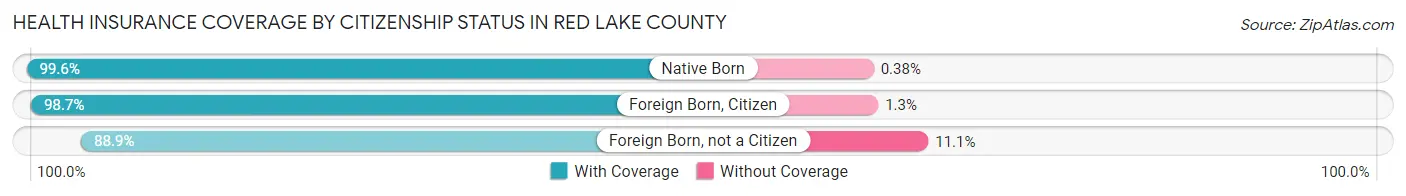
| Citizenship Status | With Coverage | Without Coverage |
| Native Born | 264 (99.6%) | 1 (0.4%) |
| Foreign Born, Citizen | 708 (98.7%) | 9 (1.3%) |
| Foreign Born, not a Citizen | 192 (88.9%) | 24 (11.1%) |
Health Insurance Coverage by Household Income in Red Lake County
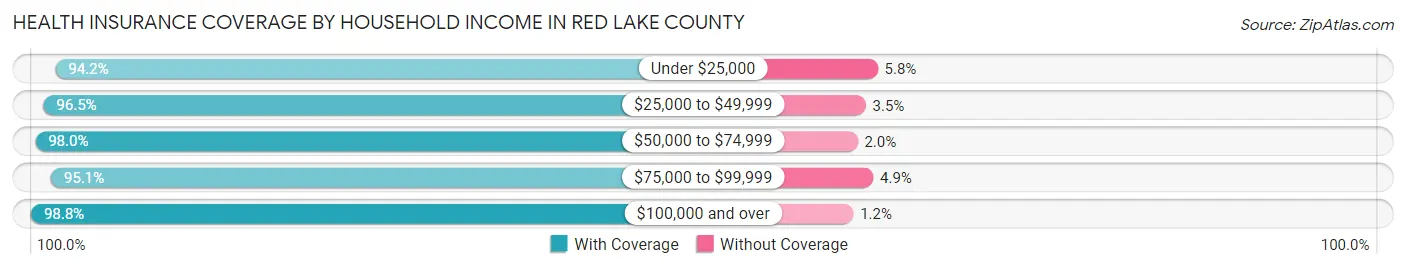
| Household Income | With Coverage | Without Coverage |
| Under $25,000 | 359 (94.2%) | 22 (5.8%) |
| $25,000 to $49,999 | 465 (96.5%) | 17 (3.5%) |
| $50,000 to $74,999 | 587 (98.0%) | 12 (2.0%) |
| $75,000 to $99,999 | 713 (95.1%) | 37 (4.9%) |
| $100,000 and over | 1,641 (98.8%) | 20 (1.2%) |
Public vs Private Health Insurance Coverage by Age in Red Lake County

| Age Bracket | Public Insurance | Private Insurance |
| Under 6 | 110 (41.5%) | 193 (72.8%) |
| 6 to 18 Years | 248 (34.6%) | 507 (70.7%) |
| 19 to 25 Years | 21 (9.7%) | 177 (81.9%) |
| 25 to 34 Years | 69 (21.4%) | 258 (80.1%) |
| 35 to 44 Years | 80 (14.7%) | 451 (82.8%) |
| 45 to 54 Years | 61 (14.8%) | 342 (83.2%) |
| 55 to 64 Years | 116 (19.9%) | 480 (82.2%) |
| 65 to 74 Years | 450 (96.0%) | 325 (69.3%) |
| 75 Years and over | 373 (98.9%) | 302 (80.1%) |
| Total | 1,528 (39.1%) | 3,035 (77.7%) |
Disability Status by Sex by Age in Red Lake County
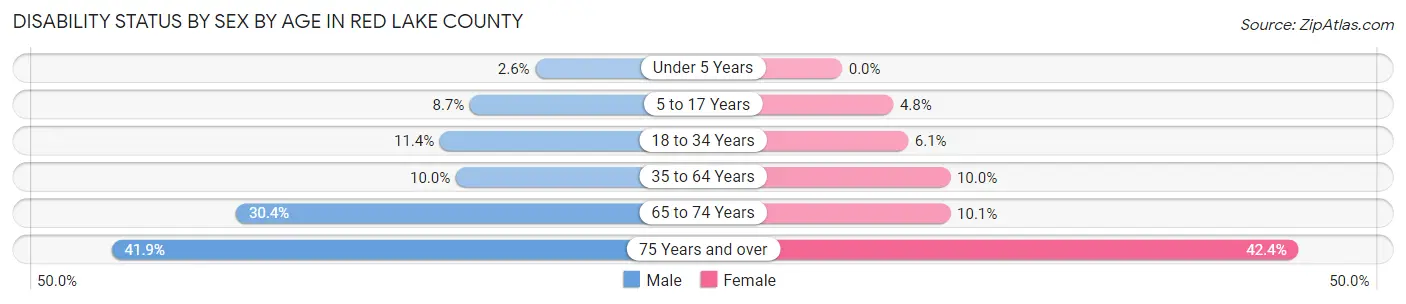
| Age Bracket | Male | Female |
| Under 5 Years | 3 (2.6%) | 0 (0.0%) |
| 5 to 17 Years | 34 (8.6%) | 16 (4.8%) |
| 18 to 34 Years | 35 (11.4%) | 16 (6.1%) |
| 35 to 64 Years | 78 (10.0%) | 76 (10.0%) |
| 65 to 74 Years | 79 (30.4%) | 21 (10.1%) |
| 75 Years and over | 70 (41.9%) | 89 (42.4%) |
Disability Class by Sex by Age in Red Lake County
Disability Class: Hearing Difficulty
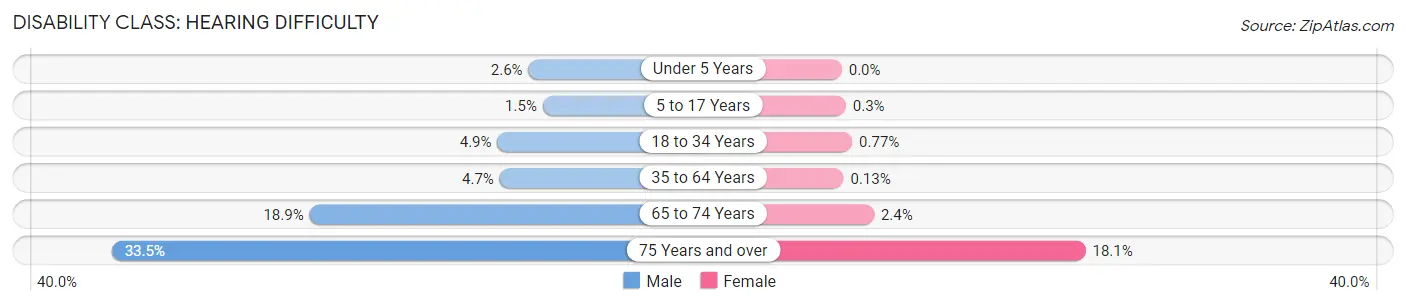
| Age Bracket | Male | Female |
| Under 5 Years | 3 (2.6%) | 0 (0.0%) |
| 5 to 17 Years | 6 (1.5%) | 1 (0.3%) |
| 18 to 34 Years | 15 (4.9%) | 2 (0.8%) |
| 35 to 64 Years | 37 (4.7%) | 1 (0.1%) |
| 65 to 74 Years | 49 (18.9%) | 5 (2.4%) |
| 75 Years and over | 56 (33.5%) | 38 (18.1%) |
Disability Class: Vision Difficulty

| Age Bracket | Male | Female |
| Under 5 Years | 0 (0.0%) | 0 (0.0%) |
| 5 to 17 Years | 0 (0.0%) | 0 (0.0%) |
| 18 to 34 Years | 5 (1.6%) | 3 (1.1%) |
| 35 to 64 Years | 20 (2.5%) | 26 (3.4%) |
| 65 to 74 Years | 18 (6.9%) | 3 (1.4%) |
| 75 Years and over | 10 (6.0%) | 20 (9.5%) |
Disability Class: Cognitive Difficulty
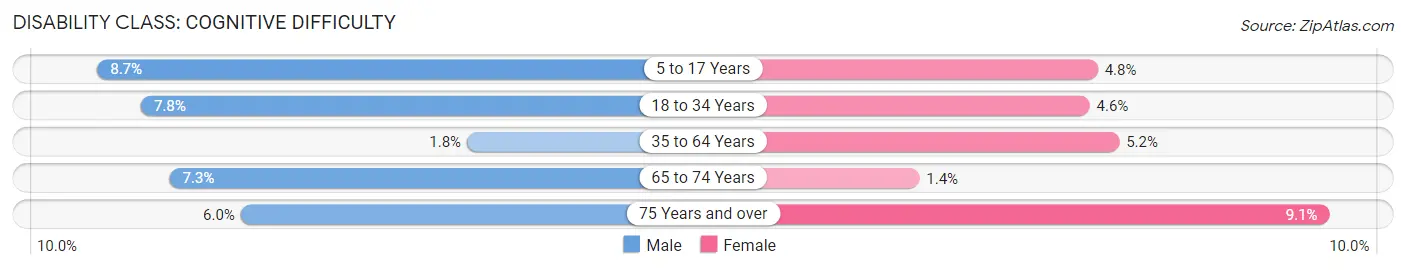
| Age Bracket | Male | Female |
| 5 to 17 Years | 34 (8.6%) | 16 (4.8%) |
| 18 to 34 Years | 24 (7.8%) | 12 (4.6%) |
| 35 to 64 Years | 14 (1.8%) | 39 (5.1%) |
| 65 to 74 Years | 19 (7.3%) | 3 (1.4%) |
| 75 Years and over | 10 (6.0%) | 19 (9.0%) |
Disability Class: Ambulatory Difficulty
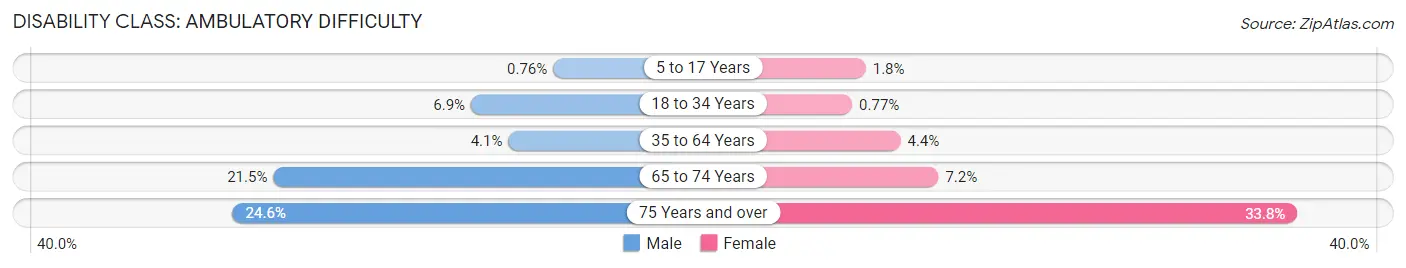
| Age Bracket | Male | Female |
| 5 to 17 Years | 3 (0.8%) | 6 (1.8%) |
| 18 to 34 Years | 21 (6.9%) | 2 (0.8%) |
| 35 to 64 Years | 32 (4.1%) | 33 (4.4%) |
| 65 to 74 Years | 56 (21.5%) | 15 (7.2%) |
| 75 Years and over | 41 (24.5%) | 71 (33.8%) |
Disability Class: Self-Care Difficulty
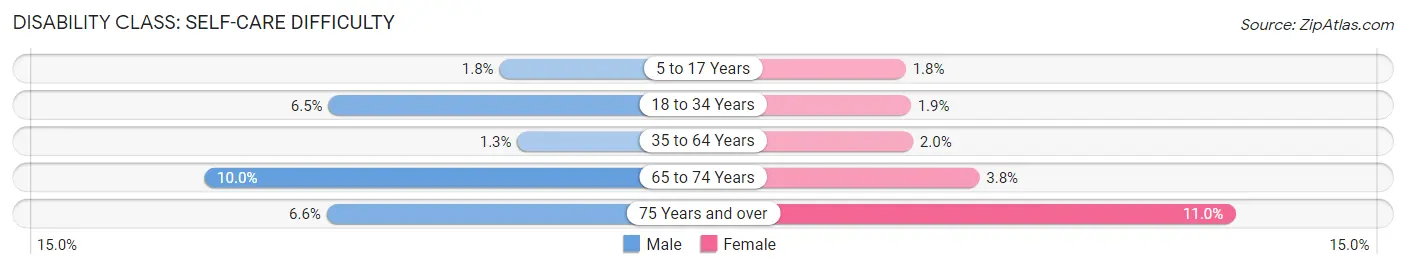
| Age Bracket | Male | Female |
| 5 to 17 Years | 7 (1.8%) | 6 (1.8%) |
| 18 to 34 Years | 20 (6.5%) | 5 (1.9%) |
| 35 to 64 Years | 10 (1.3%) | 15 (2.0%) |
| 65 to 74 Years | 26 (10.0%) | 8 (3.8%) |
| 75 Years and over | 11 (6.6%) | 23 (11.0%) |
Technology Access in Red Lake County
Computing Device Access in Red Lake County
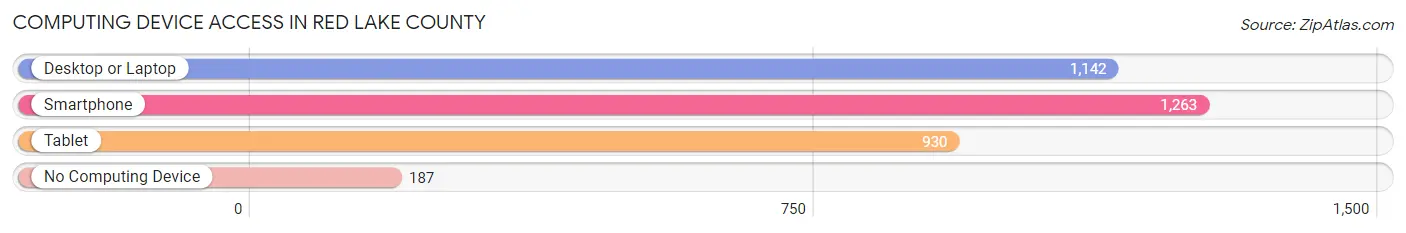
| Device Type | # Households | % Households |
| Desktop or Laptop | 1,142 | 69.7% |
| Smartphone | 1,263 | 77.1% |
| Tablet | 930 | 56.8% |
| No Computing Device | 187 | 11.4% |
| Total | 1,638 | 100.0% |
Internet Access in Red Lake County
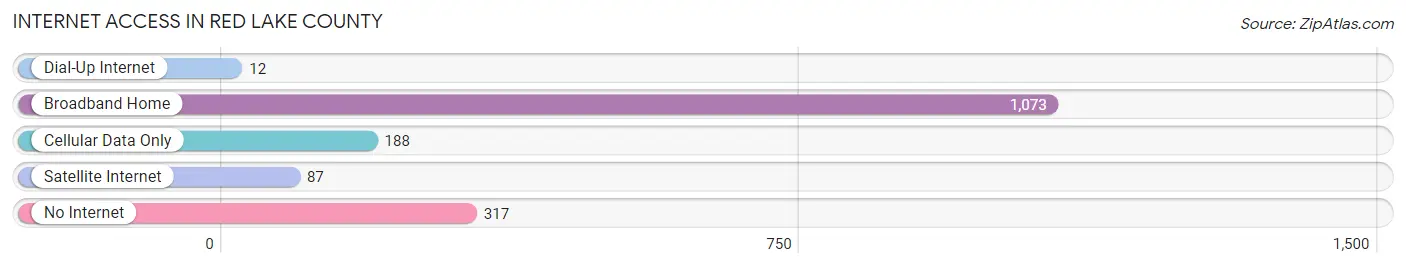
| Internet Type | # Households | % Households |
| Dial-Up Internet | 12 | 0.7% |
| Broadband Home | 1,073 | 65.5% |
| Cellular Data Only | 188 | 11.5% |
| Satellite Internet | 87 | 5.3% |
| No Internet | 317 | 19.4% |
| Total | 1,638 | 100.0% |
Red Lake County Summary
Red Lake County is located in the northwestern corner of Minnesota, and is bordered by Clearwater County to the north, Pennington County to the east, Polk County to the south, and Norman County to the west. The county seat is Red Lake Falls, and the county has a total area of 576 square miles.
History
Red Lake County was established in 1866, and was named after the Red Lake River, which flows through the county. The area was originally inhabited by the Ojibwe people, who were the first to settle in the area. The first white settlers arrived in the area in the late 1800s, and the county was officially organized in 1866.
The county was initially an agricultural area, with the main crops being wheat, oats, and potatoes. In the early 1900s, the county began to diversify its economy, and the timber industry began to take off. The county also saw an influx of immigrants from Norway, Sweden, and Finland, who helped to shape the culture of the area.
Geography
Red Lake County is located in the northwestern corner of Minnesota, and is bordered by Clearwater County to the north, Pennington County to the east, Polk County to the south, and Norman County to the west. The county has a total area of 576 square miles, and is mostly covered in forests and wetlands. The Red Lake River flows through the county, and is a major source of recreation for the area.
The county is home to several state parks, including Red Lake State Park, which is located on the shores of Red Lake. The park offers camping, fishing, and other outdoor activities. The county is also home to several wildlife refuges, including the Red Lake National Wildlife Refuge, which is home to a variety of birds and other wildlife.
Economy
Red Lake County has a diverse economy, with the main industries being agriculture, timber, and tourism. Agriculture is the largest industry in the county, and the main crops are wheat, oats, and potatoes. The timber industry is also important to the county, and the county is home to several sawmills and paper mills.
Tourism is also an important part of the county’s economy, and the county is home to several state parks and wildlife refuges. The county also has several lakes, which are popular for fishing and other recreational activities.
Demographics
As of the 2010 census, the population of Red Lake County was 5,813. The population is mostly white (94.3%), with the remaining population being made up of Native American (3.2%), African American (0.7%), and Asian (0.6%). The median household income in the county is $41,945, and the median age is 44.7 years.
Conclusion
Red Lake County is a rural county located in the northwestern corner of Minnesota. The county has a diverse economy, with the main industries being agriculture, timber, and tourism. The county is also home to several state parks and wildlife refuges, and is a popular destination for outdoor recreation. The population of the county is mostly white, with the median household income being $41,945.
Common Questions
What is the Total Population of Red Lake County?
Total Population of Red Lake County is 3,912.
What is the Total Male Population of Red Lake County?
Total Male Population of Red Lake County is 2,031.
What is the Total Female Population of Red Lake County?
Total Female Population of Red Lake County is 1,881.
What is the Ratio of Males per 100 Females in Red Lake County?
There are 107.97 Males per 100 Females in Red Lake County.
What is the Ratio of Females per 100 Males in Red Lake County?
There are 92.61 Females per 100 Males in Red Lake County.
What is the Median Population Age in Red Lake County?
Median Population Age in Red Lake County is 42.9 Years.
What is the Average Family Size in Red Lake County
Average Family Size in Red Lake County is 3.0 People.
What is the Average Household Size in Red Lake County
Average Household Size in Red Lake County is 2.4 People.
What is Per Capita Income in Red Lake County?
Per Capita income in Red Lake County is $35,198.
What is the Median Family Income in Red Lake County?
Median Family Income in Red Lake County is $93,696.
What is the Median Household income in Red Lake County?
Median Household Income in Red Lake County is $73,889.
What is Income or Wage Gap in Red Lake County?
Income or Wage Gap in Red Lake County is 25.3%.
Women in Red Lake County earn 74.7 cents for every dollar earned by a man.
What is Inequality or Gini Index in Red Lake County?
Inequality or Gini Index in Red Lake County is 0.40.
How Large is the Labor Force in Red Lake County?
There are 1,995 People in the Labor Forcein in Red Lake County.
What is the Percentage of People in the Labor Force in Red Lake County?
65.1% of People are in the Labor Force in Red Lake County.
What is the Unemployment Rate in Red Lake County?
Unemployment Rate in Red Lake County is 1.5%.