Ramsey County, MN
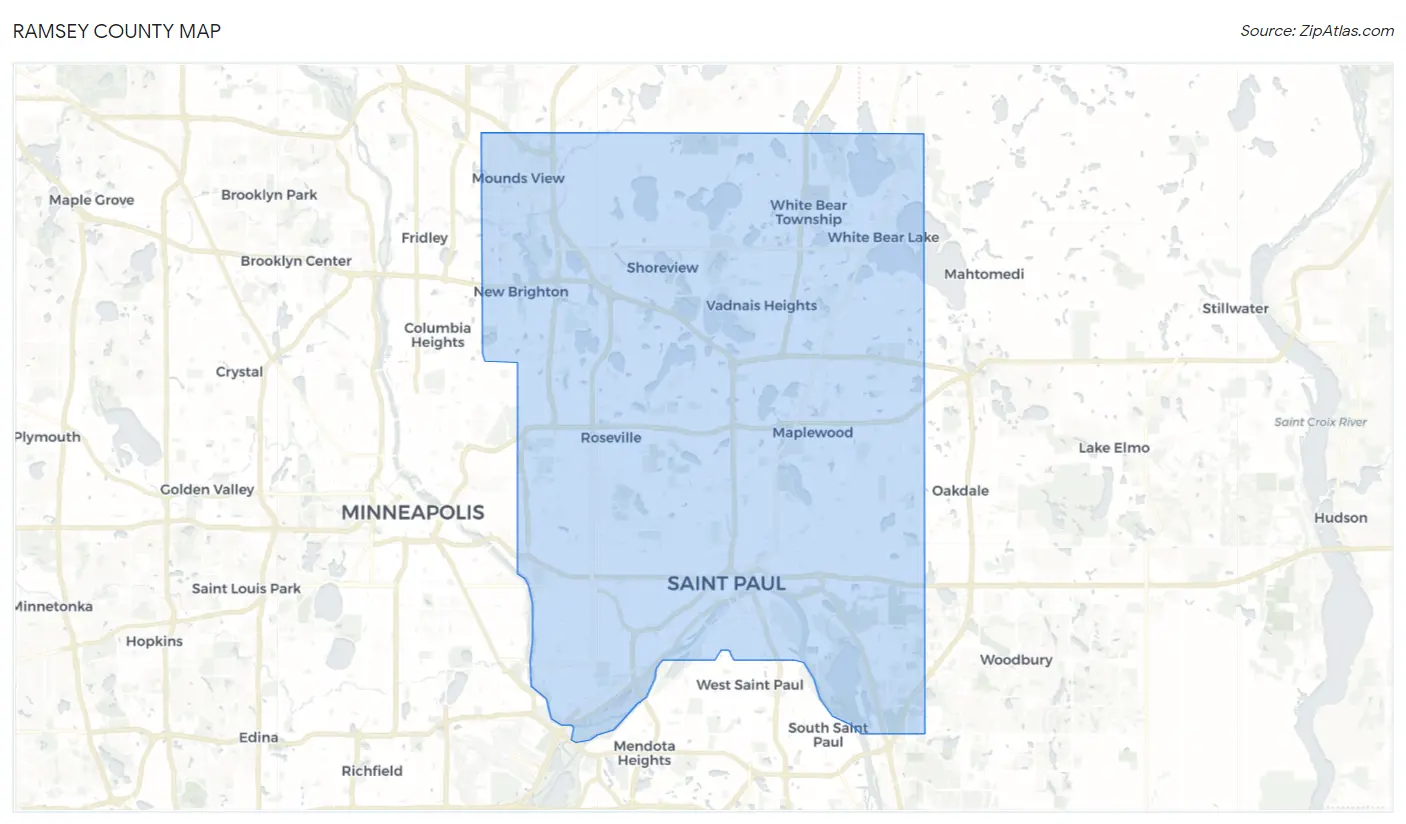
Ramsey County Map
Ramsey County Overview
547,202
TOTAL POPULATION
269,113
MALE POPULATION
278,089
FEMALE POPULATION
96.77
MALES / 100 FEMALES
103.34
FEMALES / 100 MALES
35.7
MEDIAN AGE
3.2
AVG FAMILY SIZE
2.5
AVG HOUSEHOLD SIZE
$43,203
PER CAPITA INCOME
$103,235
AVG FAMILY INCOME
$78,108
AVG HOUSEHOLD INCOME
17.8%
WAGE / INCOME GAP [ % ]
82.2¢/ $1
WAGE / INCOME GAP [ $ ]
$11,968
FAMILY INCOME DEFICIT
0.46
INEQUALITY / GINI INDEX
297,326
LABOR FORCE [ PEOPLE ]
68.5%
PERCENT IN LABOR FORCE
4.7%
UNEMPLOYMENT RATE
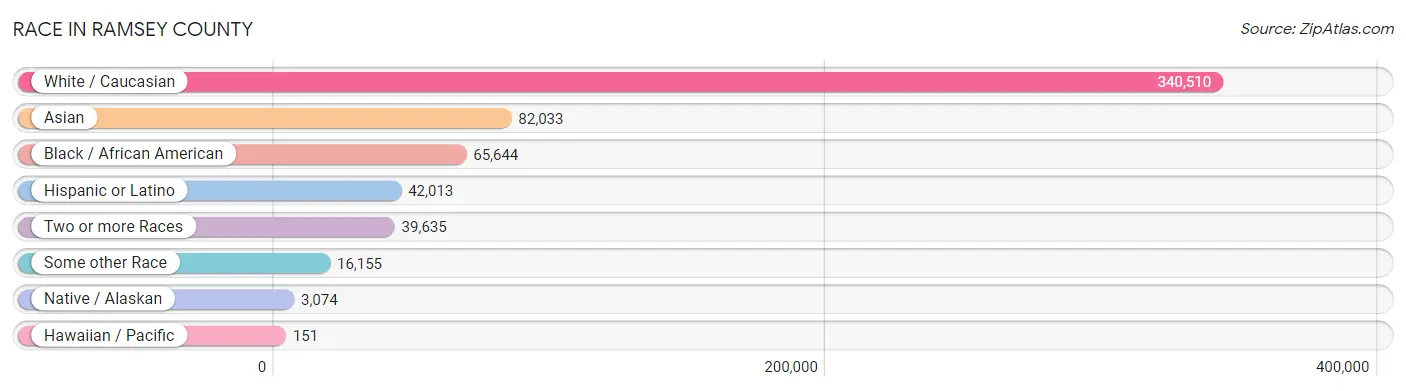
Race in Ramsey County
The most populous races in Ramsey County are White / Caucasian (340,510 | 62.2%), Asian (82,033 | 15.0%), and Black / African American (65,644 | 12.0%).
| Race | # Population | % Population |
| Asian | 82,033 | 15.0% |
| Black / African American | 65,644 | 12.0% |
| Hawaiian / Pacific | 151 | 0.0% |
| Hispanic or Latino | 42,013 | 7.7% |
| Native / Alaskan | 3,074 | 0.6% |
| White / Caucasian | 340,510 | 62.2% |
| Two or more Races | 39,635 | 7.2% |
| Some other Race | 16,155 | 2.9% |
| Total | 547,202 | 100.0% |
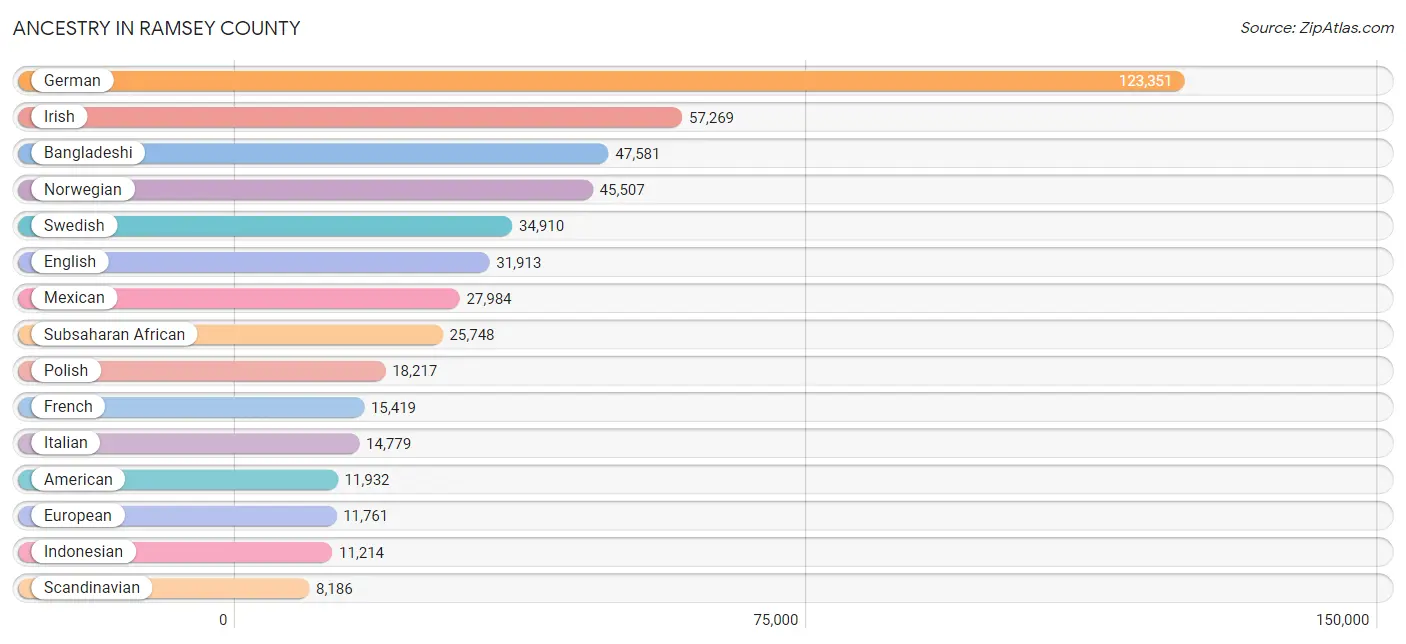
Ancestry in Ramsey County
The most populous ancestries reported in Ramsey County are German (123,351 | 22.5%), Irish (57,269 | 10.5%), Bangladeshi (47,581 | 8.7%), Norwegian (45,507 | 8.3%), and Swedish (34,910 | 6.4%), together accounting for 56.4% of all Ramsey County residents.
| Ancestry | # Population | % Population |
| Afghan | 84 | 0.0% |
| African | 5,197 | 0.9% |
| Alaska Native | 6 | 0.0% |
| Albanian | 191 | 0.0% |
| Aleut | 19 | 0.0% |
| Alsatian | 25 | 0.0% |
| American | 11,932 | 2.2% |
| Apache | 93 | 0.0% |
| Arab | 1,729 | 0.3% |
| Argentinean | 269 | 0.1% |
| Armenian | 120 | 0.0% |
| Assyrian / Chaldean / Syriac | 17 | 0.0% |
| Australian | 32 | 0.0% |
| Austrian | 2,251 | 0.4% |
| Bahamian | 51 | 0.0% |
| Bangladeshi | 47,581 | 8.7% |
| Barbadian | 30 | 0.0% |
| Basque | 18 | 0.0% |
| Belgian | 1,024 | 0.2% |
| Belizean | 20 | 0.0% |
| Bermudan | 13 | 0.0% |
| Bhutanese | 2,381 | 0.4% |
| Blackfeet | 850 | 0.2% |
| Bolivian | 31 | 0.0% |
| Brazilian | 321 | 0.1% |
| British | 2,880 | 0.5% |
| British West Indian | 3 | 0.0% |
| Bulgarian | 192 | 0.0% |
| Burmese | 3,312 | 0.6% |
| Cajun | 17 | 0.0% |
| Cambodian | 85 | 0.0% |
| Canadian | 350 | 0.1% |
| Carpatho Rusyn | 11 | 0.0% |
| Celtic | 83 | 0.0% |
| Central American | 5,459 | 1.0% |
| Central American Indian | 241 | 0.0% |
| Cherokee | 541 | 0.1% |
| Chickasaw | 16 | 0.0% |
| Chilean | 138 | 0.0% |
| Chippewa | 3,034 | 0.5% |
| Choctaw | 278 | 0.1% |
| Colombian | 906 | 0.2% |
| Costa Rican | 364 | 0.1% |
| Cree | 3 | 0.0% |
| Creek | 5 | 0.0% |
| Croatian | 509 | 0.1% |
| Cuban | 1,067 | 0.2% |
| Czech | 5,135 | 0.9% |
| Czechoslovakian | 708 | 0.1% |
| Danish | 5,513 | 1.0% |
| Dominican | 246 | 0.0% |
| Dutch | 5,817 | 1.1% |
| Eastern European | 1,394 | 0.3% |
| Ecuadorian | 459 | 0.1% |
| Egyptian | 275 | 0.1% |
| English | 31,913 | 5.8% |
| Estonian | 64 | 0.0% |
| Ethiopian | 6,709 | 1.2% |
| European | 11,761 | 2.1% |
| Filipino | 230 | 0.0% |
| Finnish | 4,705 | 0.9% |
| French | 15,419 | 2.8% |
| French American Indian | 790 | 0.1% |
| French Canadian | 4,499 | 0.8% |
| German | 123,351 | 22.5% |
| German Russian | 50 | 0.0% |
| Ghanaian | 648 | 0.1% |
| Greek | 1,120 | 0.2% |
| Guamanian / Chamorro | 120 | 0.0% |
| Guatemalan | 665 | 0.1% |
| Guyanese | 177 | 0.0% |
| Haitian | 98 | 0.0% |
| Honduran | 712 | 0.1% |
| Hopi | 258 | 0.1% |
| Hungarian | 2,235 | 0.4% |
| Icelander | 67 | 0.0% |
| Indian (Asian) | 6,228 | 1.1% |
| Indonesian | 11,214 | 2.1% |
| Inupiat | 639 | 0.1% |
| Iranian | 407 | 0.1% |
| Iraqi | 15 | 0.0% |
| Irish | 57,269 | 10.5% |
| Iroquois | 58 | 0.0% |
| Israeli | 58 | 0.0% |
| Italian | 14,779 | 2.7% |
| Jamaican | 921 | 0.2% |
| Japanese | 1,046 | 0.2% |
| Jordanian | 20 | 0.0% |
| Kenyan | 1,732 | 0.3% |
| Kiowa | 18 | 0.0% |
| Korean | 3,377 | 0.6% |
| Laotian | 157 | 0.0% |
| Latvian | 324 | 0.1% |
| Lebanese | 572 | 0.1% |
| Liberian | 785 | 0.1% |
| Lithuanian | 979 | 0.2% |
| Luxembourger | 957 | 0.2% |
| Macedonian | 94 | 0.0% |
| Malaysian | 690 | 0.1% |
| Maltese | 86 | 0.0% |
| Menominee | 53 | 0.0% |
| Mexican | 27,984 | 5.1% |
| Mexican American Indian | 817 | 0.2% |
| Mongolian | 105 | 0.0% |
| Moroccan | 149 | 0.0% |
| Native Hawaiian | 234 | 0.0% |
| Navajo | 51 | 0.0% |
| New Zealander | 11 | 0.0% |
| Nicaraguan | 285 | 0.1% |
| Nigerian | 1,625 | 0.3% |
| Northern European | 1,746 | 0.3% |
| Norwegian | 45,507 | 8.3% |
| Osage | 16 | 0.0% |
| Pakistani | 1,134 | 0.2% |
| Palestinian | 89 | 0.0% |
| Panamanian | 180 | 0.0% |
| Paraguayan | 38 | 0.0% |
| Pennsylvania German | 84 | 0.0% |
| Peruvian | 334 | 0.1% |
| Polish | 18,217 | 3.3% |
| Portuguese | 254 | 0.1% |
| Potawatomi | 44 | 0.0% |
| Puerto Rican | 1,954 | 0.4% |
| Puget Sound Salish | 10 | 0.0% |
| Romanian | 604 | 0.1% |
| Russian | 3,005 | 0.5% |
| Salvadoran | 3,226 | 0.6% |
| Samoan | 185 | 0.0% |
| Scandinavian | 8,186 | 1.5% |
| Scotch-Irish | 3,363 | 0.6% |
| Scottish | 6,769 | 1.2% |
| Seminole | 67 | 0.0% |
| Senegalese | 6 | 0.0% |
| Serbian | 549 | 0.1% |
| Sierra Leonean | 333 | 0.1% |
| Sioux | 1,271 | 0.2% |
| Slavic | 278 | 0.1% |
| Slovak | 1,142 | 0.2% |
| Slovene | 990 | 0.2% |
| Somali | 7,384 | 1.3% |
| South African | 87 | 0.0% |
| South American | 2,740 | 0.5% |
| South American Indian | 46 | 0.0% |
| Spaniard | 910 | 0.2% |
| Spanish | 591 | 0.1% |
| Spanish American | 27 | 0.0% |
| Sri Lankan | 4,221 | 0.8% |
| Subsaharan African | 25,748 | 4.7% |
| Sudanese | 317 | 0.1% |
| Swedish | 34,910 | 6.4% |
| Swiss | 2,559 | 0.5% |
| Syrian | 144 | 0.0% |
| Thai | 4,934 | 0.9% |
| Tlingit-Haida | 11 | 0.0% |
| Tohono O'Odham | 37 | 0.0% |
| Trinidadian and Tobagonian | 603 | 0.1% |
| Turkish | 258 | 0.1% |
| U.S. Virgin Islander | 34 | 0.0% |
| Ugandan | 181 | 0.0% |
| Ukrainian | 1,319 | 0.2% |
| Uruguayan | 121 | 0.0% |
| Ute | 14 | 0.0% |
| Venezuelan | 375 | 0.1% |
| Vietnamese | 115 | 0.0% |
| Welsh | 1,933 | 0.4% |
| West Indian | 336 | 0.1% |
| Yaqui | 9 | 0.0% |
| Yugoslavian | 238 | 0.0% |
| Yup'ik | 12 | 0.0% |
| Zimbabwean | 54 | 0.0% | View All 170 Rows |
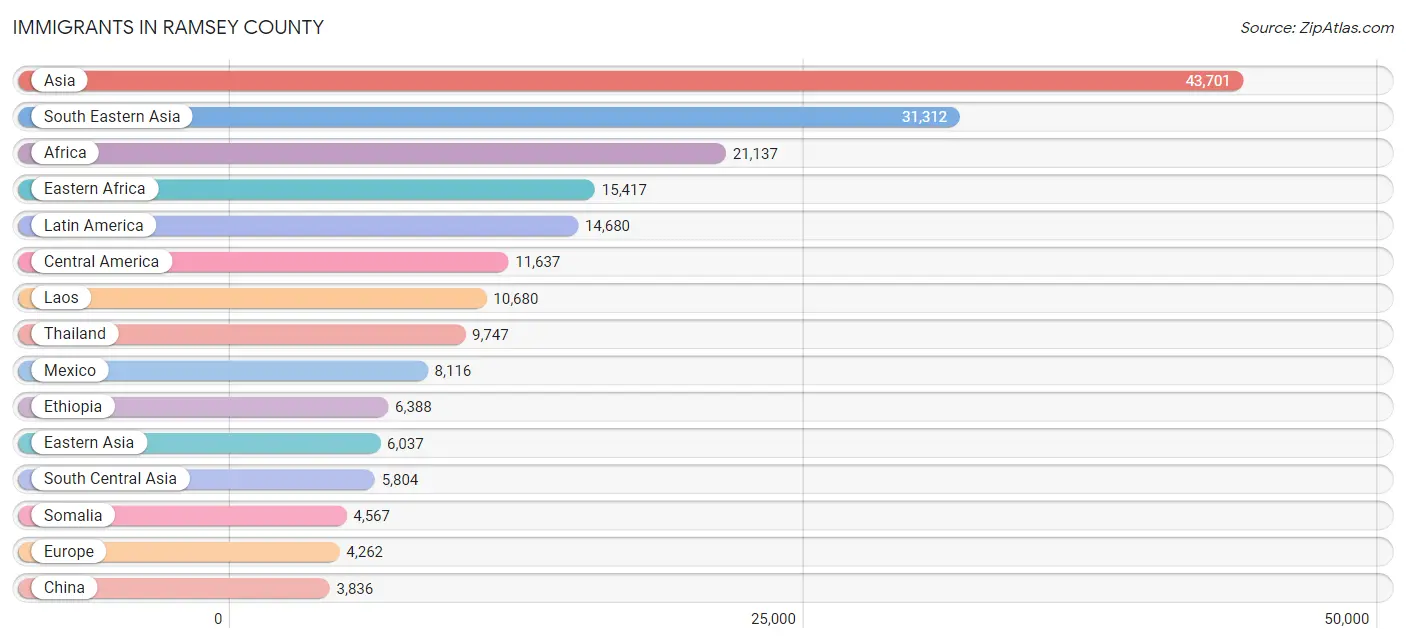
Immigrants in Ramsey County
The most numerous immigrant groups reported in Ramsey County came from Asia (43,701 | 8.0%), South Eastern Asia (31,312 | 5.7%), Africa (21,137 | 3.9%), Eastern Africa (15,417 | 2.8%), and Latin America (14,680 | 2.7%), together accounting for 23.1% of all Ramsey County residents.
| Immigration Origin | # Population | % Population |
| Afghanistan | 135 | 0.0% |
| Africa | 21,137 | 3.9% |
| Albania | 26 | 0.0% |
| Argentina | 123 | 0.0% |
| Armenia | 10 | 0.0% |
| Asia | 43,701 | 8.0% |
| Australia | 241 | 0.0% |
| Austria | 81 | 0.0% |
| Bahamas | 40 | 0.0% |
| Bangladesh | 92 | 0.0% |
| Barbados | 31 | 0.0% |
| Belarus | 41 | 0.0% |
| Belgium | 37 | 0.0% |
| Belize | 49 | 0.0% |
| Bolivia | 26 | 0.0% |
| Bosnia and Herzegovina | 67 | 0.0% |
| Brazil | 230 | 0.0% |
| Bulgaria | 76 | 0.0% |
| Cambodia | 471 | 0.1% |
| Cameroon | 494 | 0.1% |
| Canada | 1,113 | 0.2% |
| Caribbean | 781 | 0.1% |
| Central America | 11,637 | 2.1% |
| Chile | 69 | 0.0% |
| China | 3,836 | 0.7% |
| Colombia | 653 | 0.1% |
| Congo | 120 | 0.0% |
| Costa Rica | 292 | 0.1% |
| Croatia | 8 | 0.0% |
| Cuba | 237 | 0.0% |
| Czechoslovakia | 72 | 0.0% |
| Denmark | 11 | 0.0% |
| Dominican Republic | 158 | 0.0% |
| Eastern Africa | 15,417 | 2.8% |
| Eastern Asia | 6,037 | 1.1% |
| Eastern Europe | 1,813 | 0.3% |
| Ecuador | 339 | 0.1% |
| Egypt | 213 | 0.0% |
| El Salvador | 1,940 | 0.4% |
| England | 312 | 0.1% |
| Eritrea | 1,291 | 0.2% |
| Ethiopia | 6,388 | 1.2% |
| Europe | 4,262 | 0.8% |
| Fiji | 10 | 0.0% |
| France | 239 | 0.0% |
| Germany | 772 | 0.1% |
| Ghana | 510 | 0.1% |
| Greece | 9 | 0.0% |
| Guatemala | 381 | 0.1% |
| Guyana | 237 | 0.0% |
| Haiti | 49 | 0.0% |
| Honduras | 557 | 0.1% |
| Hong Kong | 221 | 0.0% |
| Hungary | 131 | 0.0% |
| India | 2,795 | 0.5% |
| Indonesia | 37 | 0.0% |
| Iran | 310 | 0.1% |
| Iraq | 28 | 0.0% |
| Ireland | 225 | 0.0% |
| Israel | 88 | 0.0% |
| Italy | 50 | 0.0% |
| Jamaica | 175 | 0.0% |
| Japan | 460 | 0.1% |
| Jordan | 69 | 0.0% |
| Kazakhstan | 18 | 0.0% |
| Kenya | 2,144 | 0.4% |
| Korea | 1,711 | 0.3% |
| Laos | 10,680 | 1.9% |
| Latin America | 14,680 | 2.7% |
| Latvia | 39 | 0.0% |
| Lebanon | 70 | 0.0% |
| Liberia | 897 | 0.2% |
| Lithuania | 8 | 0.0% |
| Malaysia | 127 | 0.0% |
| Mexico | 8,116 | 1.5% |
| Middle Africa | 849 | 0.2% |
| Moldova | 76 | 0.0% |
| Morocco | 98 | 0.0% |
| Nepal | 1,087 | 0.2% |
| Netherlands | 61 | 0.0% |
| Nicaragua | 237 | 0.0% |
| Nigeria | 1,322 | 0.2% |
| North Macedonia | 11 | 0.0% |
| Northern Africa | 589 | 0.1% |
| Northern Europe | 991 | 0.2% |
| Norway | 26 | 0.0% |
| Oceania | 285 | 0.1% |
| Pakistan | 349 | 0.1% |
| Panama | 46 | 0.0% |
| Peru | 209 | 0.0% |
| Philippines | 1,382 | 0.3% |
| Poland | 249 | 0.1% |
| Portugal | 15 | 0.0% |
| Romania | 82 | 0.0% |
| Russia | 356 | 0.1% |
| Saudi Arabia | 25 | 0.0% |
| Scotland | 30 | 0.0% |
| Senegal | 6 | 0.0% |
| Serbia | 38 | 0.0% |
| Sierra Leone | 287 | 0.1% |
| Singapore | 27 | 0.0% |
| Somalia | 4,567 | 0.8% |
| South Africa | 202 | 0.0% |
| South America | 2,262 | 0.4% |
| South Central Asia | 5,804 | 1.1% |
| South Eastern Asia | 31,312 | 5.7% |
| Southern Europe | 213 | 0.0% |
| Spain | 121 | 0.0% |
| Sri Lanka | 102 | 0.0% |
| Sudan | 247 | 0.1% |
| Sweden | 139 | 0.0% |
| Switzerland | 34 | 0.0% |
| Taiwan | 354 | 0.1% |
| Thailand | 9,747 | 1.8% |
| Trinidad and Tobago | 91 | 0.0% |
| Turkey | 108 | 0.0% |
| Uganda | 302 | 0.1% |
| Ukraine | 386 | 0.1% |
| Uruguay | 60 | 0.0% |
| Venezuela | 249 | 0.1% |
| Vietnam | 2,361 | 0.4% |
| Western Africa | 3,612 | 0.7% |
| Western Asia | 538 | 0.1% |
| Western Europe | 1,224 | 0.2% |
| Yemen | 83 | 0.0% |
| Zaire | 235 | 0.0% |
| Zimbabwe | 39 | 0.0% | View All 127 Rows |
Sex and Age in Ramsey County
Sex and Age in Ramsey County
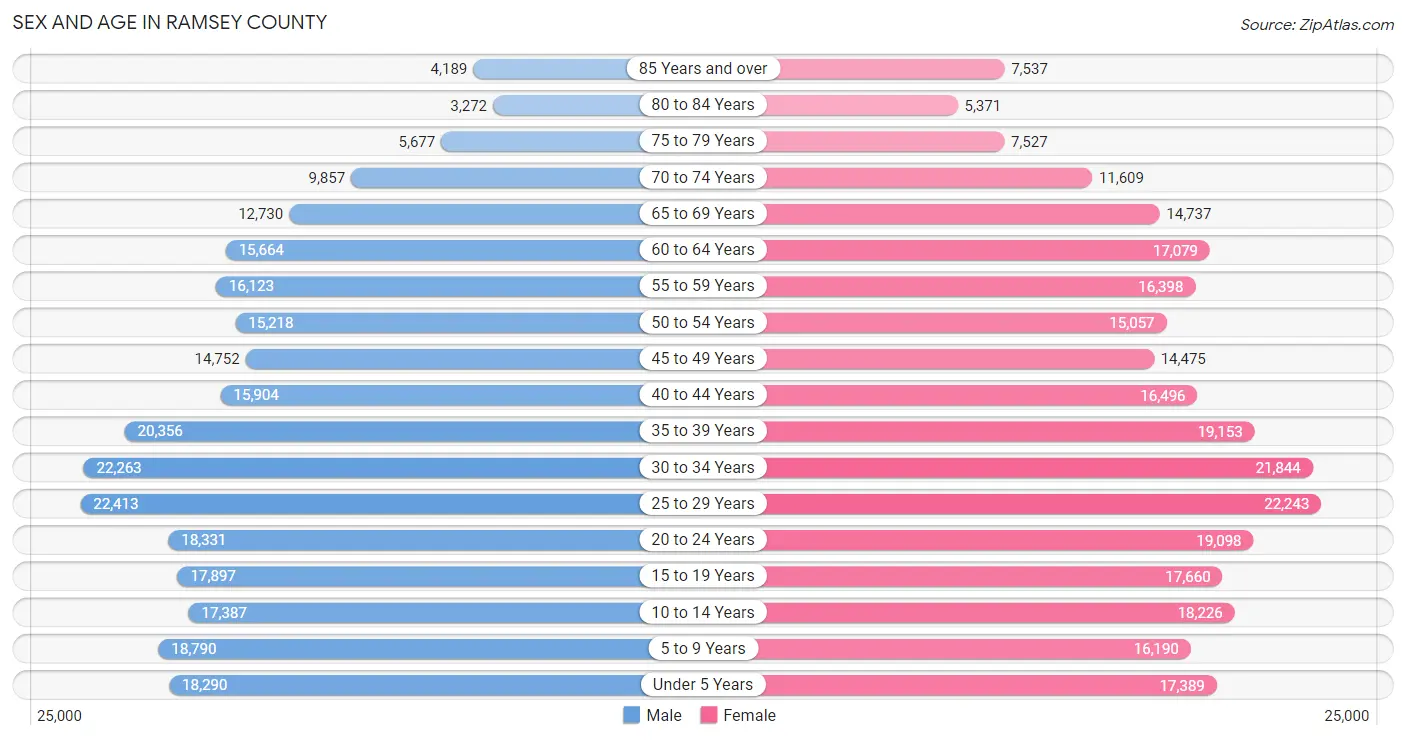
The most populous age groups in Ramsey County are 25 to 29 Years (22,413 | 8.3%) for men and 25 to 29 Years (22,243 | 8.0%) for women.
| Age Bracket | Male | Female |
| Under 5 Years | 18,290 (6.8%) | 17,389 (6.2%) |
| 5 to 9 Years | 18,790 (7.0%) | 16,190 (5.8%) |
| 10 to 14 Years | 17,387 (6.5%) | 18,226 (6.6%) |
| 15 to 19 Years | 17,897 (6.7%) | 17,660 (6.4%) |
| 20 to 24 Years | 18,331 (6.8%) | 19,098 (6.9%) |
| 25 to 29 Years | 22,413 (8.3%) | 22,243 (8.0%) |
| 30 to 34 Years | 22,263 (8.3%) | 21,844 (7.9%) |
| 35 to 39 Years | 20,356 (7.6%) | 19,153 (6.9%) |
| 40 to 44 Years | 15,904 (5.9%) | 16,496 (5.9%) |
| 45 to 49 Years | 14,752 (5.5%) | 14,475 (5.2%) |
| 50 to 54 Years | 15,218 (5.7%) | 15,057 (5.4%) |
| 55 to 59 Years | 16,123 (6.0%) | 16,398 (5.9%) |
| 60 to 64 Years | 15,664 (5.8%) | 17,079 (6.1%) |
| 65 to 69 Years | 12,730 (4.7%) | 14,737 (5.3%) |
| 70 to 74 Years | 9,857 (3.7%) | 11,609 (4.2%) |
| 75 to 79 Years | 5,677 (2.1%) | 7,527 (2.7%) |
| 80 to 84 Years | 3,272 (1.2%) | 5,371 (1.9%) |
| 85 Years and over | 4,189 (1.6%) | 7,537 (2.7%) |
| Total | 269,113 (100.0%) | 278,089 (100.0%) |
Families and Households in Ramsey County
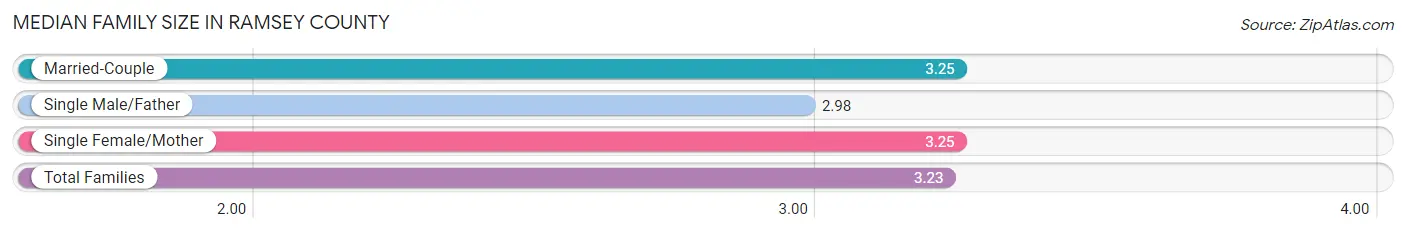
Median Family Size in Ramsey County
The median family size in Ramsey County is 3.23 persons per family, with married-couple families (87,831 | 71.4%) accounting for the largest median family size of 3.25 persons per family. On the other hand, single male/father families (9,952 | 8.1%) represent the smallest median family size with 2.98 persons per family.
| Family Type | # Families | Family Size |
| Married-Couple | 87,831 (71.4%) | 3.25 |
| Single Male/Father | 9,952 (8.1%) | 2.98 |
| Single Female/Mother | 25,243 (20.5%) | 3.25 |
| Total Families | 123,026 (100.0%) | 3.23 |
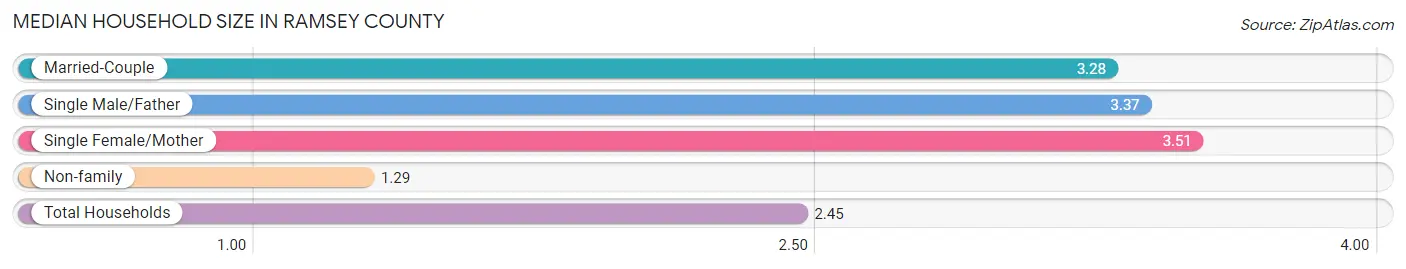
Median Household Size in Ramsey County
The median household size in Ramsey County is 2.45 persons per household, with single female/mother households (25,243 | 11.6%) accounting for the largest median household size of 3.51 persons per household. non-family households (93,943 | 43.3%) represent the smallest median household size with 1.29 persons per household.
| Household Type | # Households | Household Size |
| Married-Couple | 87,831 (40.5%) | 3.28 |
| Single Male/Father | 9,952 (4.6%) | 3.37 |
| Single Female/Mother | 25,243 (11.6%) | 3.51 |
| Non-family | 93,943 (43.3%) | 1.29 |
| Total Households | 216,969 (100.0%) | 2.45 |
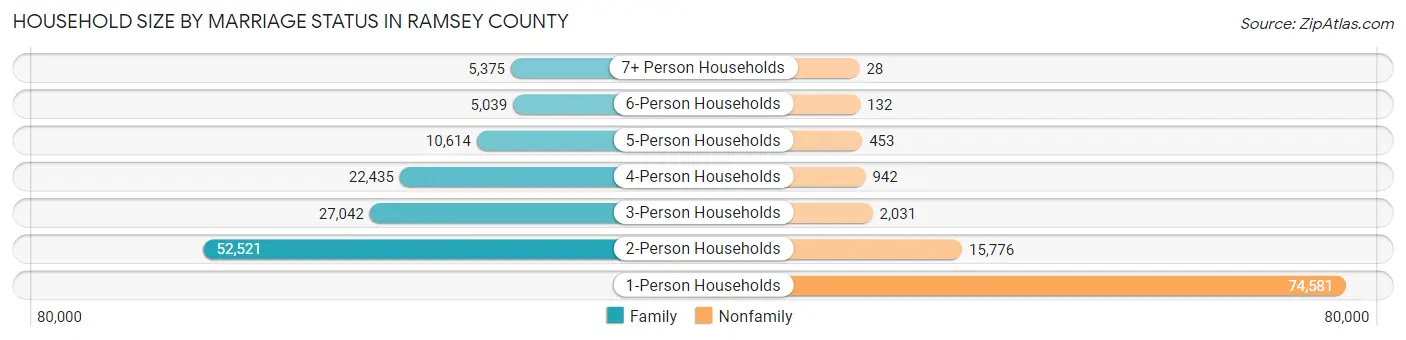
Household Size by Marriage Status in Ramsey County
Out of a total of 216,969 households in Ramsey County, 123,026 (56.7%) are family households, while 93,943 (43.3%) are nonfamily households. The most numerous type of family households are 2-person households, comprising 52,521, and the most common type of nonfamily households are 1-person households, comprising 74,581.
| Household Size | Family Households | Nonfamily Households |
| 1-Person Households | - | 74,581 (34.4%) |
| 2-Person Households | 52,521 (24.2%) | 15,776 (7.3%) |
| 3-Person Households | 27,042 (12.5%) | 2,031 (0.9%) |
| 4-Person Households | 22,435 (10.3%) | 942 (0.4%) |
| 5-Person Households | 10,614 (4.9%) | 453 (0.2%) |
| 6-Person Households | 5,039 (2.3%) | 132 (0.1%) |
| 7+ Person Households | 5,375 (2.5%) | 28 (0.0%) |
| Total | 123,026 (56.7%) | 93,943 (43.3%) |
Female Fertility in Ramsey County
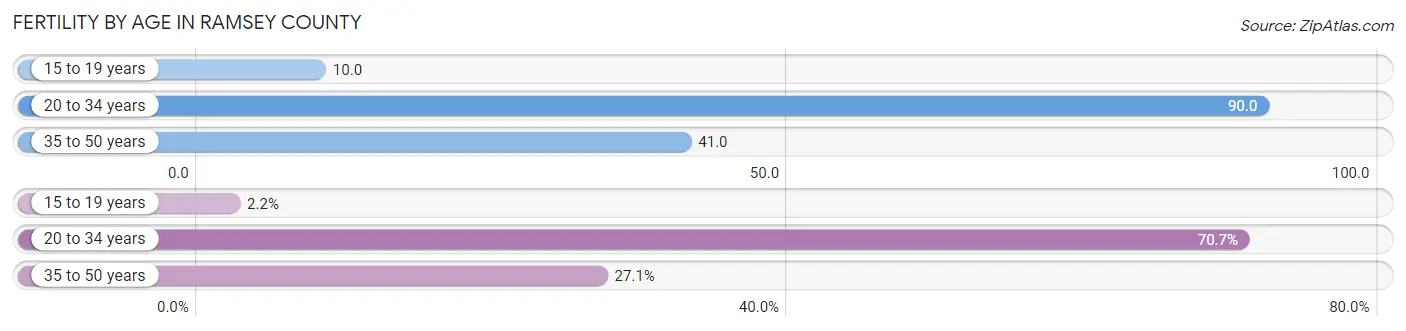
Fertility by Age in Ramsey County
Average fertility rate in Ramsey County is 60.0 births per 1,000 women. Women in the age bracket of 20 to 34 years have the highest fertility rate with 90.0 births per 1,000 women. Women in the age bracket of 20 to 34 years acount for 70.7% of all women with births.
| Age Bracket | Women with Births | Births / 1,000 Women |
| 15 to 19 years | 175 (2.2%) | 10.0 |
| 20 to 34 years | 5,671 (70.7%) | 90.0 |
| 35 to 50 years | 2,175 (27.1%) | 41.0 |
| Total | 8,021 (100.0%) | 60.0 |
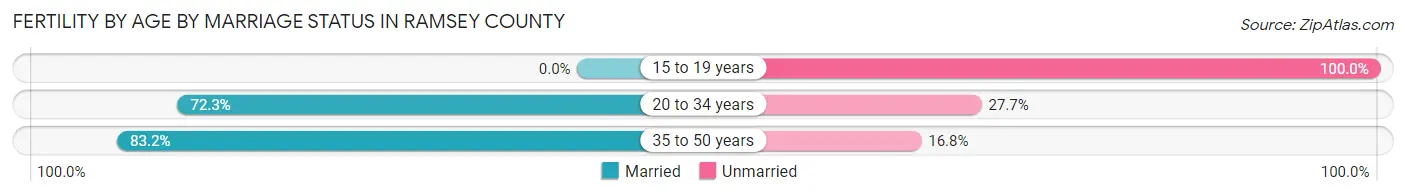
Fertility by Age by Marriage Status in Ramsey County
73.7% of women with births (8,021) in Ramsey County are married. The highest percentage of unmarried women with births falls into 15 to 19 years age bracket with 100.0% of them unmarried at the time of birth, while the lowest percentage of unmarried women with births belong to 35 to 50 years age bracket with 16.8% of them unmarried.
| Age Bracket | Married | Unmarried |
| 15 to 19 years | 0 (0.0%) | 175 (100.0%) |
| 20 to 34 years | 4,100 (72.3%) | 1,571 (27.7%) |
| 35 to 50 years | 1,810 (83.2%) | 365 (16.8%) |
| Total | 5,911 (73.7%) | 2,110 (26.3%) |
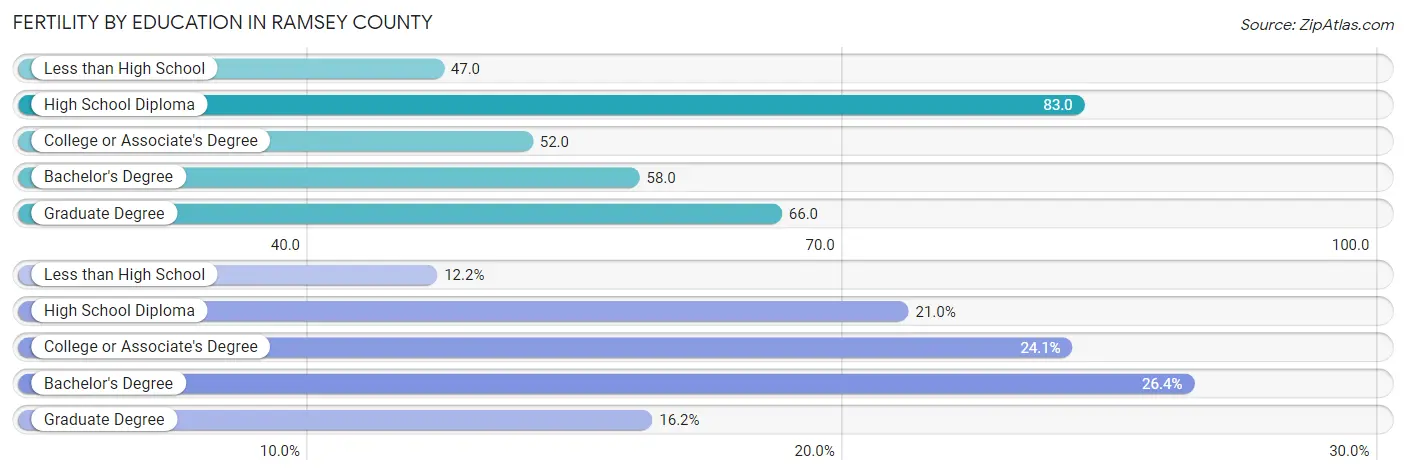
Fertility by Education in Ramsey County
Average fertility rate in Ramsey County is 60.0 births per 1,000 women. Women with the education attainment of high school diploma have the highest fertility rate of 83.0 births per 1,000 women, while women with the education attainment of less than high school have the lowest fertility at 47.0 births per 1,000 women. Women with the education attainment of bachelor's degree represent 26.4% of all women with births.
| Educational Attainment | Women with Births | Births / 1,000 Women |
| Less than High School | 979 (12.2%) | 47.0 |
| High School Diploma | 1,688 (21.0%) | 83.0 |
| College or Associate's Degree | 1,934 (24.1%) | 52.0 |
| Bachelor's Degree | 2,117 (26.4%) | 58.0 |
| Graduate Degree | 1,303 (16.2%) | 66.0 |
| Total | 8,021 (100.0%) | 60.0 |
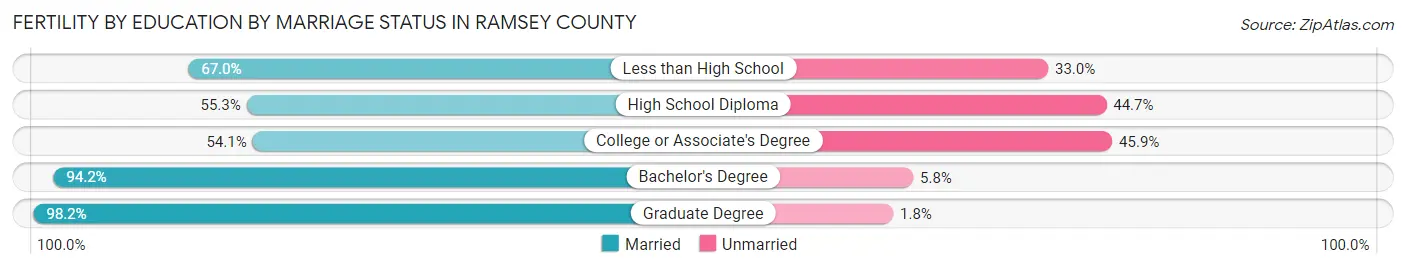
Fertility by Education by Marriage Status in Ramsey County
26.3% of women with births in Ramsey County are unmarried. Women with the educational attainment of graduate degree are most likely to be married with 98.2% of them married at childbirth, while women with the educational attainment of college or associate's degree are least likely to be married with 45.9% of them unmarried at childbirth.
| Educational Attainment | Married | Unmarried |
| Less than High School | 656 (67.0%) | 323 (33.0%) |
| High School Diploma | 933 (55.3%) | 755 (44.7%) |
| College or Associate's Degree | 1,046 (54.1%) | 888 (45.9%) |
| Bachelor's Degree | 1,994 (94.2%) | 123 (5.8%) |
| Graduate Degree | 1,280 (98.2%) | 23 (1.8%) |
| Total | 5,911 (73.7%) | 2,110 (26.3%) |
Income in Ramsey County
Income Overview in Ramsey County
Per Capita Income in Ramsey County is $43,203, while median incomes of families and households are $103,235 and $78,108 respectively.
| Characteristic | Number | Measure |
| Per Capita Income | 547,202 | $43,203 |
| Median Family Income | 123,026 | $103,235 |
| Mean Family Income | 123,026 | $131,750 |
| Median Household Income | 216,969 | $78,108 |
| Mean Household Income | 216,969 | $106,904 |
| Income Deficit | 123,026 | $11,968 |
| Wage / Income Gap (%) | 547,202 | 17.75% |
| Wage / Income Gap ($) | 547,202 | 82.25¢ per $1 |
| Gini / Inequality Index | 547,202 | 0.46 |
Earnings by Sex in Ramsey County
Average Earnings in Ramsey County are $44,050, $48,314 for men and $39,738 for women, a difference of 17.7%.
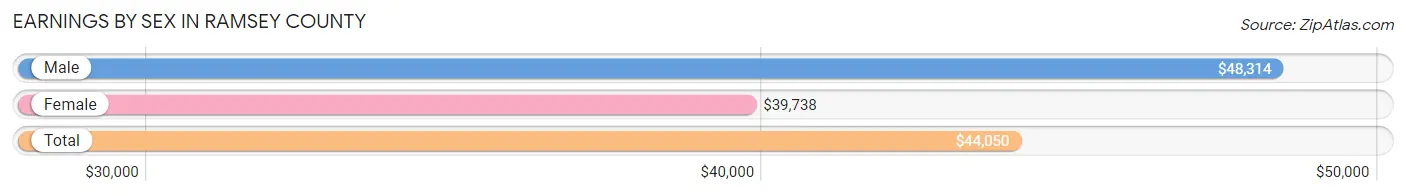
| Sex | Number | Average Earnings |
| Male | 159,258 (50.9%) | $48,314 |
| Female | 153,818 (49.1%) | $39,738 |
| Total | 313,076 (100.0%) | $44,050 |
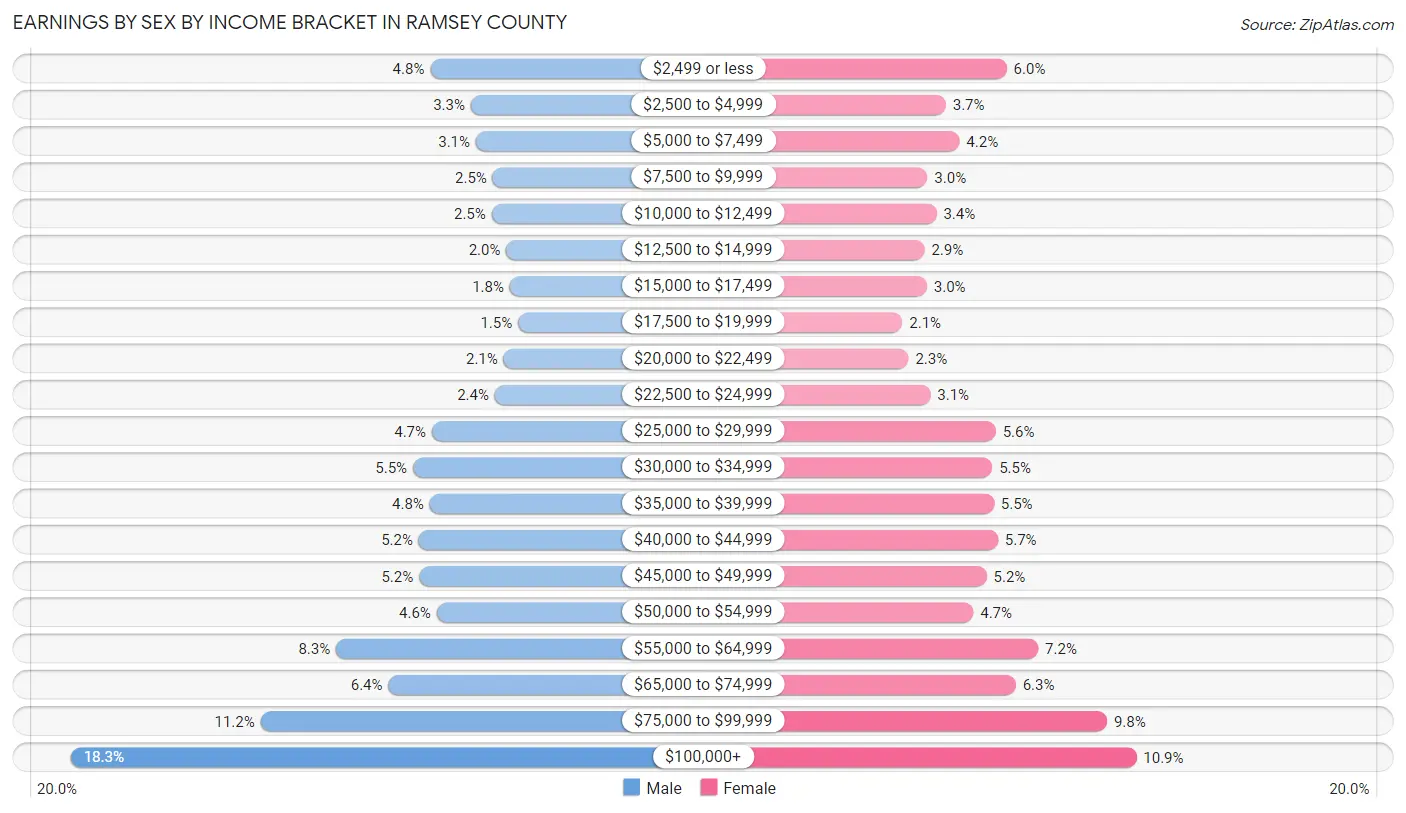
Earnings by Sex by Income Bracket in Ramsey County
The most common earnings brackets in Ramsey County are $100,000+ for men (29,101 | 18.3%) and $100,000+ for women (16,690 | 10.8%).
| Income | Male | Female |
| $2,499 or less | 7,643 (4.8%) | 9,215 (6.0%) |
| $2,500 to $4,999 | 5,219 (3.3%) | 5,701 (3.7%) |
| $5,000 to $7,499 | 4,918 (3.1%) | 6,494 (4.2%) |
| $7,500 to $9,999 | 3,916 (2.5%) | 4,652 (3.0%) |
| $10,000 to $12,499 | 3,982 (2.5%) | 5,163 (3.4%) |
| $12,500 to $14,999 | 3,111 (1.9%) | 4,483 (2.9%) |
| $15,000 to $17,499 | 2,900 (1.8%) | 4,608 (3.0%) |
| $17,500 to $19,999 | 2,403 (1.5%) | 3,192 (2.1%) |
| $20,000 to $22,499 | 3,263 (2.1%) | 3,551 (2.3%) |
| $22,500 to $24,999 | 3,789 (2.4%) | 4,815 (3.1%) |
| $25,000 to $29,999 | 7,547 (4.7%) | 8,589 (5.6%) |
| $30,000 to $34,999 | 8,679 (5.4%) | 8,379 (5.4%) |
| $35,000 to $39,999 | 7,681 (4.8%) | 8,474 (5.5%) |
| $40,000 to $44,999 | 8,337 (5.2%) | 8,705 (5.7%) |
| $45,000 to $49,999 | 8,315 (5.2%) | 8,054 (5.2%) |
| $50,000 to $54,999 | 7,265 (4.6%) | 7,294 (4.7%) |
| $55,000 to $64,999 | 13,269 (8.3%) | 11,034 (7.2%) |
| $65,000 to $74,999 | 10,148 (6.4%) | 9,732 (6.3%) |
| $75,000 to $99,999 | 17,772 (11.2%) | 14,993 (9.8%) |
| $100,000+ | 29,101 (18.3%) | 16,690 (10.8%) |
| Total | 159,258 (100.0%) | 153,818 (100.0%) |
Earnings by Sex by Educational Attainment in Ramsey County
Average earnings in Ramsey County are $56,307 for men and $46,338 for women, a difference of 17.7%. Men with an educational attainment of graduate degree enjoy the highest average annual earnings of $90,418, while those with less than high school education earn the least with $32,556. Women with an educational attainment of graduate degree earn the most with the average annual earnings of $76,131, while those with less than high school education have the smallest earnings of $27,188.
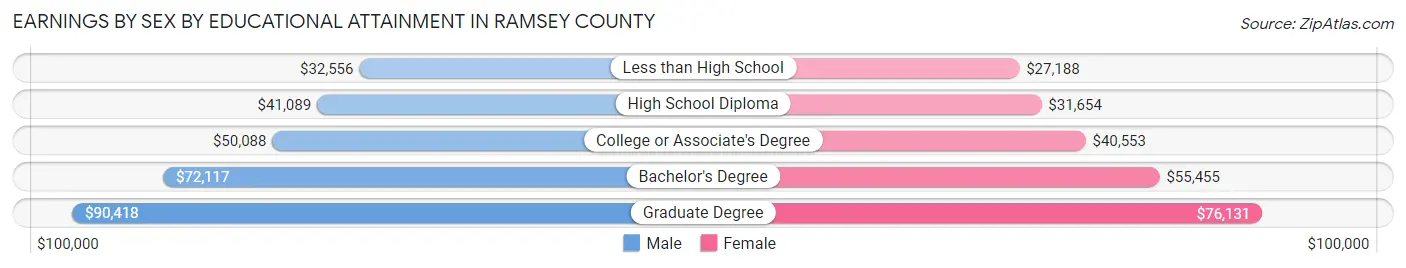
| Educational Attainment | Male Income | Female Income |
| Less than High School | $32,556 | $27,188 |
| High School Diploma | $41,089 | $31,654 |
| College or Associate's Degree | $50,088 | $40,553 |
| Bachelor's Degree | $72,117 | $55,455 |
| Graduate Degree | $90,418 | $76,131 |
| Total | $56,307 | $46,338 |
Family Income in Ramsey County
Family Income Brackets in Ramsey County
According to the Ramsey County family income data, there are 26,451 families falling into the $100,000 to $149,999 income range, which is the most common income bracket and makes up 21.5% of all families. Conversely, the $10,000 to $14,999 income bracket is the least frequent group with only 1,722 families (1.4%) belonging to this category.
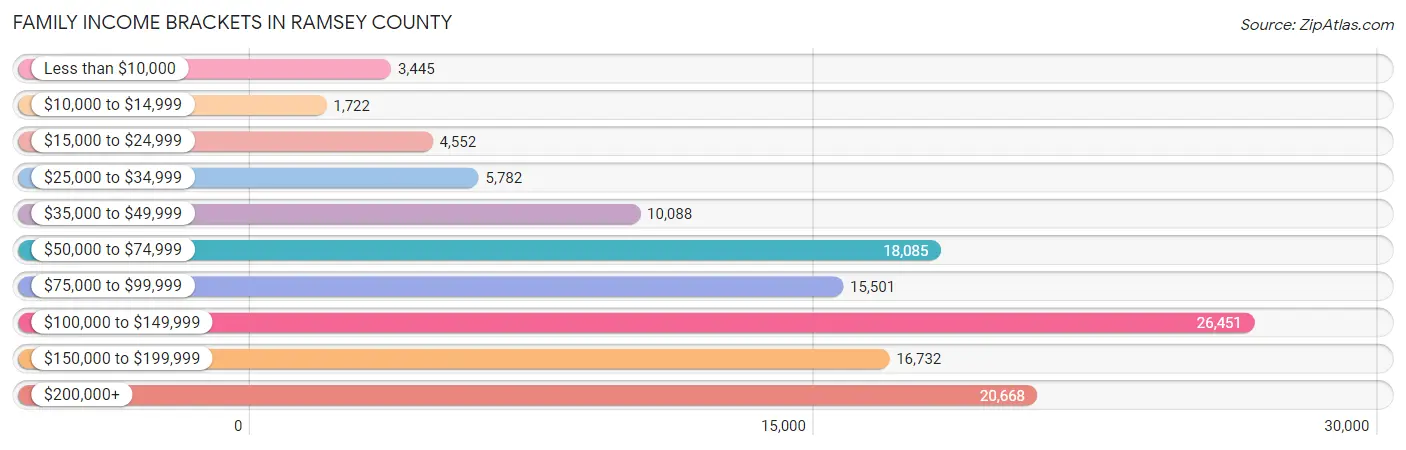
| Income Bracket | # Families | % Families |
| Less than $10,000 | 3,445 | 2.8% |
| $10,000 to $14,999 | 1,722 | 1.4% |
| $15,000 to $24,999 | 4,552 | 3.7% |
| $25,000 to $34,999 | 5,782 | 4.7% |
| $35,000 to $49,999 | 10,088 | 8.2% |
| $50,000 to $74,999 | 18,085 | 14.7% |
| $75,000 to $99,999 | 15,501 | 12.6% |
| $100,000 to $149,999 | 26,451 | 21.5% |
| $150,000 to $199,999 | 16,732 | 13.6% |
| $200,000+ | 20,668 | 16.8% |
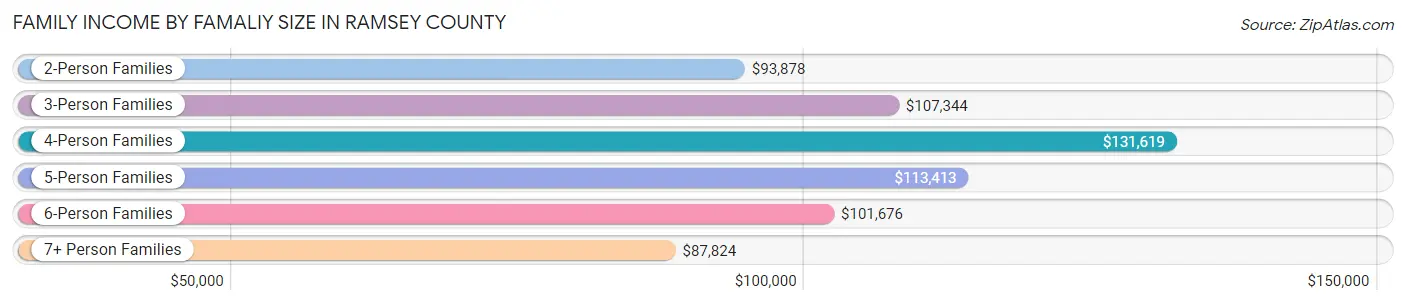
Family Income by Famaliy Size in Ramsey County
4-person families (20,889 | 17.0%) account for the highest median family income in Ramsey County with $131,619 per family, while 2-person families (56,741 | 46.1%) have the highest median income of $46,939 per family member.
| Income Bracket | # Families | Median Income |
| 2-Person Families | 56,741 (46.1%) | $93,878 |
| 3-Person Families | 26,118 (21.2%) | $107,344 |
| 4-Person Families | 20,889 (17.0%) | $131,619 |
| 5-Person Families | 9,855 (8.0%) | $113,413 |
| 6-Person Families | 4,748 (3.9%) | $101,676 |
| 7+ Person Families | 4,675 (3.8%) | $87,824 |
| Total | 123,026 (100.0%) | $103,235 |
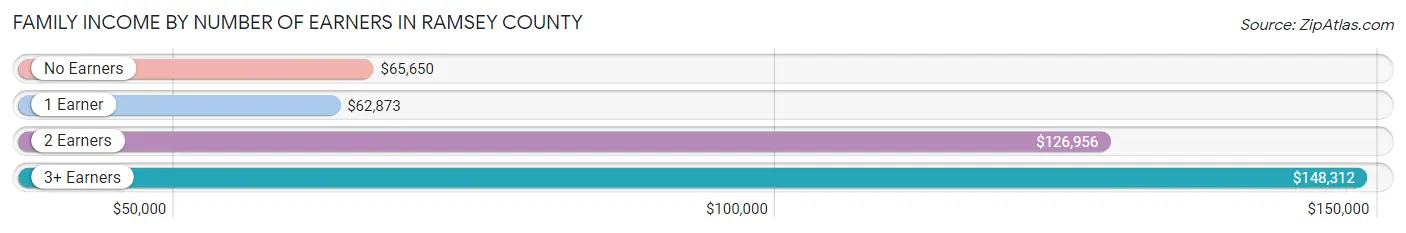
Family Income by Number of Earners in Ramsey County
The median family income in Ramsey County is $103,235, with families comprising 3+ earners (17,547) having the highest median family income of $148,312, while families with 1 earner (36,323) have the lowest median family income of $62,873, accounting for 14.3% and 29.5% of families, respectively.
| Number of Earners | # Families | Median Income |
| No Earners | 14,787 (12.0%) | $65,650 |
| 1 Earner | 36,323 (29.5%) | $62,873 |
| 2 Earners | 54,369 (44.2%) | $126,956 |
| 3+ Earners | 17,547 (14.3%) | $148,312 |
| Total | 123,026 (100.0%) | $103,235 |
Household Income in Ramsey County
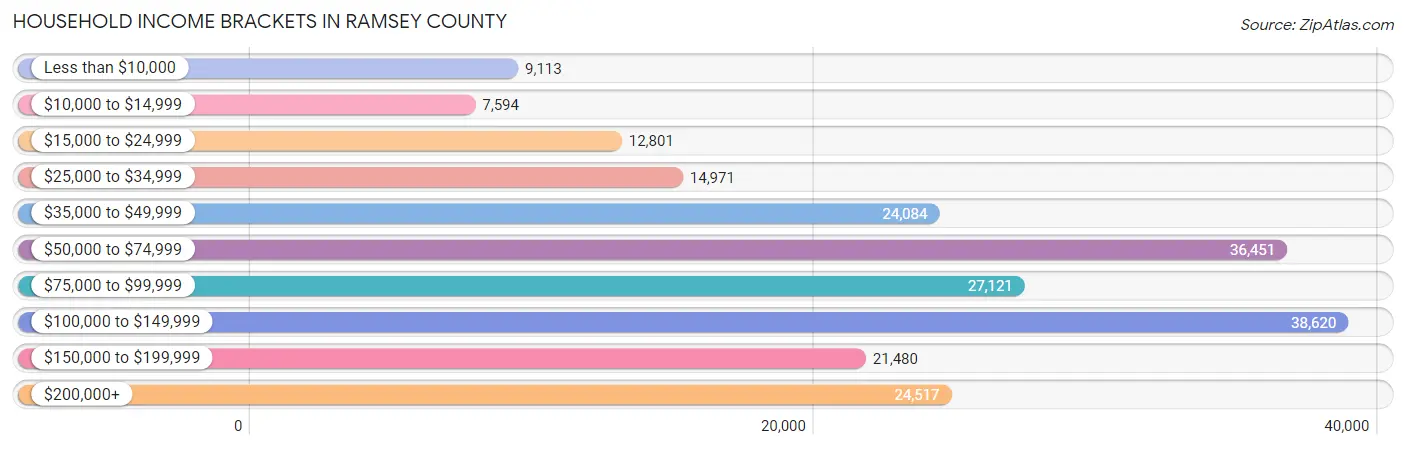
Household Income Brackets in Ramsey County
With 38,620 households falling in the category, the $100,000 to $149,999 income range is the most frequent in Ramsey County, accounting for 17.8% of all households. In contrast, only 7,594 households (3.5%) fall into the $10,000 to $14,999 income bracket, making it the least populous group.
| Income Bracket | # Households | % Households |
| Less than $10,000 | 9,113 | 4.2% |
| $10,000 to $14,999 | 7,594 | 3.5% |
| $15,000 to $24,999 | 12,801 | 5.9% |
| $25,000 to $34,999 | 14,971 | 6.9% |
| $35,000 to $49,999 | 24,084 | 11.1% |
| $50,000 to $74,999 | 36,451 | 16.8% |
| $75,000 to $99,999 | 27,121 | 12.5% |
| $100,000 to $149,999 | 38,620 | 17.8% |
| $150,000 to $199,999 | 21,480 | 9.9% |
| $200,000+ | 24,517 | 11.3% |
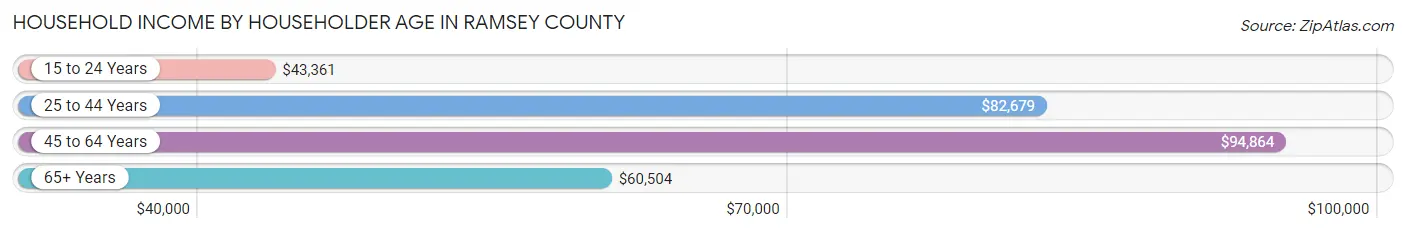
Household Income by Householder Age in Ramsey County
The median household income in Ramsey County is $78,108, with the highest median household income of $94,864 found in the 45 to 64 years age bracket for the primary householder. A total of 73,482 households (33.9%) fall into this category. Meanwhile, the 15 to 24 years age bracket for the primary householder has the lowest median household income of $43,361, with 9,293 households (4.3%) in this group.
| Income Bracket | # Households | Median Income |
| 15 to 24 Years | 9,293 (4.3%) | $43,361 |
| 25 to 44 Years | 81,088 (37.4%) | $82,679 |
| 45 to 64 Years | 73,482 (33.9%) | $94,864 |
| 65+ Years | 53,106 (24.5%) | $60,504 |
| Total | 216,969 (100.0%) | $78,108 |
Poverty in Ramsey County
Income Below Poverty by Sex and Age in Ramsey County
With 11.9% poverty level for males and 13.8% for females among the residents of Ramsey County, 18 to 24 year old males and 18 to 24 year old females are the most vulnerable to poverty, with 4,449 males (19.7%) and 5,439 females (24.0%) in their respective age groups living below the poverty level.
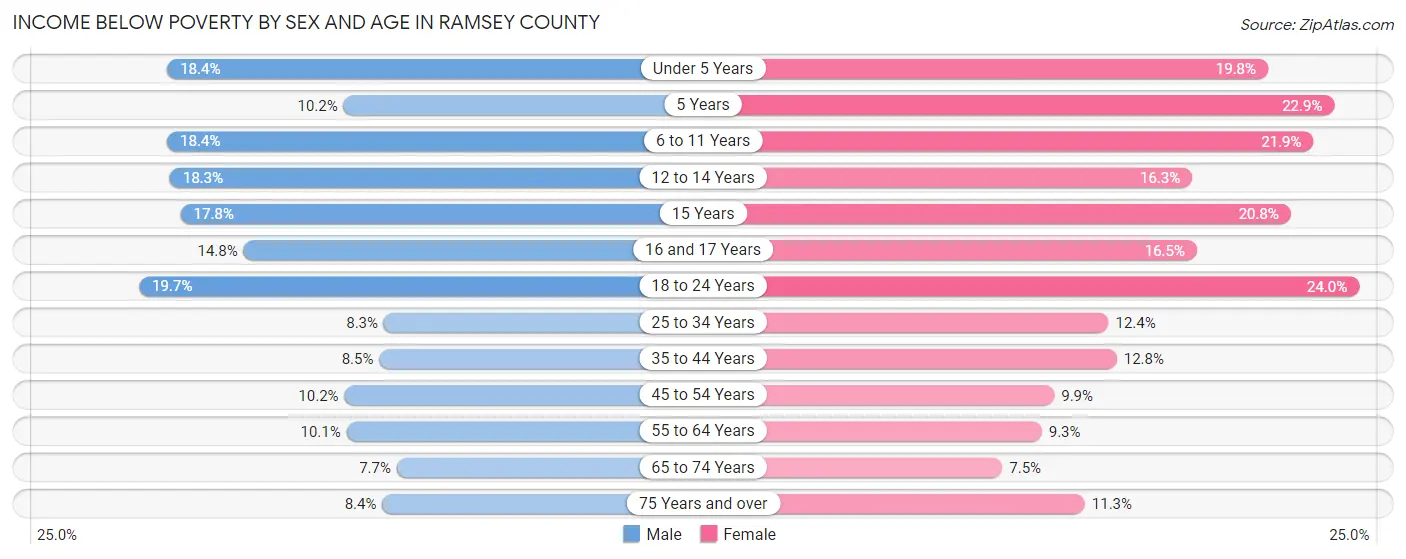
| Age Bracket | Male | Female |
| Under 5 Years | 3,317 (18.4%) | 3,383 (19.8%) |
| 5 Years | 384 (10.2%) | 833 (22.9%) |
| 6 to 11 Years | 3,927 (18.4%) | 4,187 (21.9%) |
| 12 to 14 Years | 1,886 (18.3%) | 1,782 (16.3%) |
| 15 Years | 645 (17.8%) | 673 (20.8%) |
| 16 and 17 Years | 987 (14.8%) | 1,093 (16.5%) |
| 18 to 24 Years | 4,449 (19.7%) | 5,439 (24.0%) |
| 25 to 34 Years | 3,695 (8.3%) | 5,448 (12.4%) |
| 35 to 44 Years | 3,082 (8.5%) | 4,546 (12.8%) |
| 45 to 54 Years | 3,028 (10.2%) | 2,908 (9.9%) |
| 55 to 64 Years | 3,185 (10.1%) | 3,097 (9.3%) |
| 65 to 74 Years | 1,710 (7.7%) | 1,937 (7.4%) |
| 75 Years and over | 1,040 (8.4%) | 2,128 (11.3%) |
| Total | 31,335 (11.9%) | 37,454 (13.8%) |
Income Above Poverty by Sex and Age in Ramsey County
According to the poverty statistics in Ramsey County, males aged 65 to 74 years and females aged 65 to 74 years are the age groups that are most secure financially, with 92.3% of males and 92.5% of females in these age groups living above the poverty line.
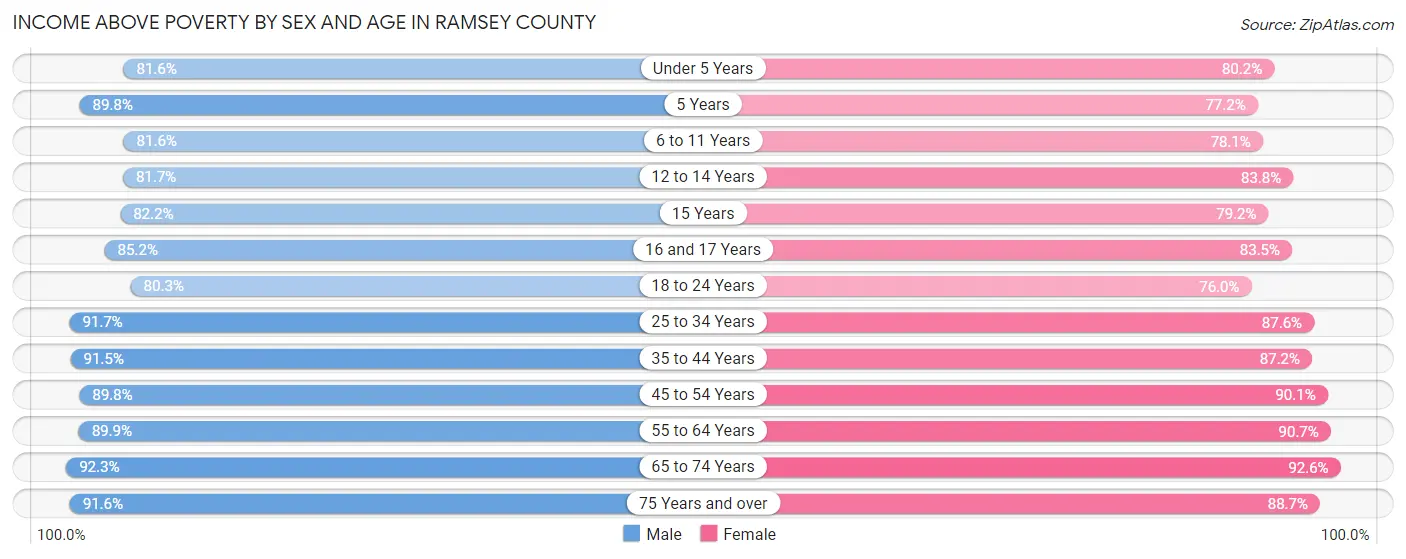
| Age Bracket | Male | Female |
| Under 5 Years | 14,731 (81.6%) | 13,733 (80.2%) |
| 5 Years | 3,381 (89.8%) | 2,813 (77.1%) |
| 6 to 11 Years | 17,429 (81.6%) | 14,947 (78.1%) |
| 12 to 14 Years | 8,443 (81.7%) | 9,184 (83.8%) |
| 15 Years | 2,987 (82.2%) | 2,558 (79.2%) |
| 16 and 17 Years | 5,663 (85.2%) | 5,545 (83.5%) |
| 18 to 24 Years | 18,147 (80.3%) | 17,220 (76.0%) |
| 25 to 34 Years | 40,649 (91.7%) | 38,570 (87.6%) |
| 35 to 44 Years | 33,011 (91.5%) | 31,074 (87.2%) |
| 45 to 54 Years | 26,775 (89.8%) | 26,570 (90.1%) |
| 55 to 64 Years | 28,487 (89.9%) | 30,261 (90.7%) |
| 65 to 74 Years | 20,418 (92.3%) | 24,053 (92.5%) |
| 75 Years and over | 11,342 (91.6%) | 16,742 (88.7%) |
| Total | 231,463 (88.1%) | 233,270 (86.2%) |
Income Below Poverty Among Married-Couple Families in Ramsey County
The poverty statistics for married-couple families in Ramsey County show that 3.8% or 3,352 of the total 87,831 families live below the poverty line. Families with 5 or more children have the highest poverty rate of 34.0%, comprising of 613 families. On the other hand, families with no children have the lowest poverty rate of 1.9%, which includes 944 families.
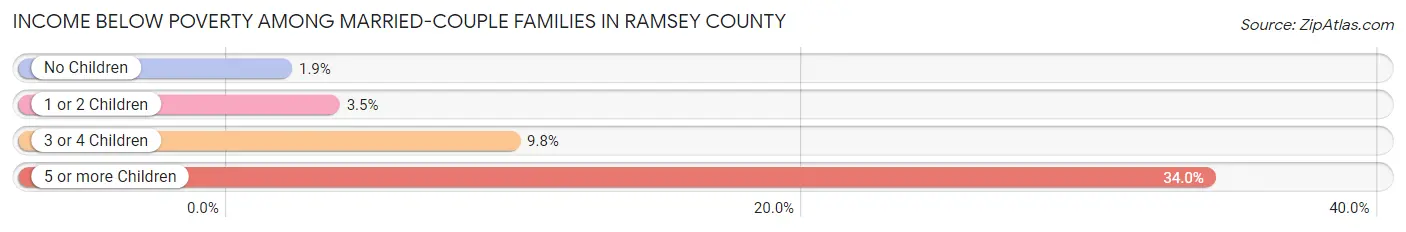
| Children | Above Poverty | Below Poverty |
| No Children | 49,373 (98.1%) | 944 (1.9%) |
| 1 or 2 Children | 26,308 (96.5%) | 966 (3.5%) |
| 3 or 4 Children | 7,610 (90.2%) | 829 (9.8%) |
| 5 or more Children | 1,188 (66.0%) | 613 (34.0%) |
| Total | 84,479 (96.2%) | 3,352 (3.8%) |
Income Below Poverty Among Single-Parent Households in Ramsey County
According to the poverty data in Ramsey County, 12.9% or 1,284 single-father households and 22.6% or 5,706 single-mother households are living below the poverty line. Among single-father households, those with 5 or more children have the highest poverty rate, with 33 households (75.0%) experiencing poverty. Likewise, among single-mother households, those with 5 or more children have the highest poverty rate, with 415 households (61.0%) falling below the poverty line.
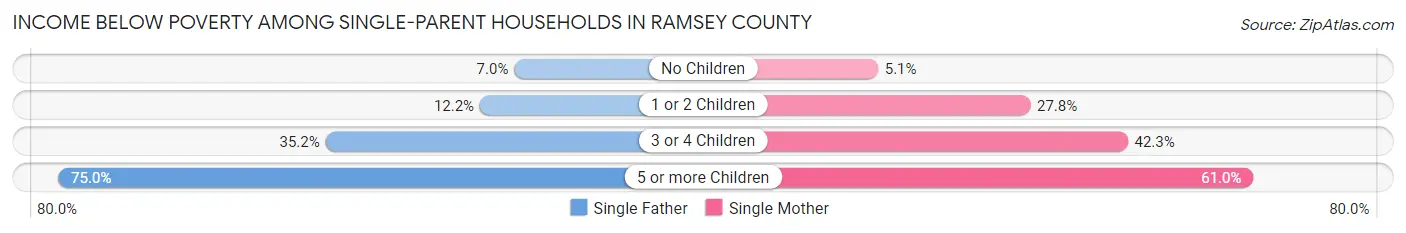
| Children | Single Father | Single Mother |
| No Children | 304 (7.0%) | 441 (5.1%) |
| 1 or 2 Children | 537 (12.1%) | 3,572 (27.8%) |
| 3 or 4 Children | 410 (35.2%) | 1,278 (42.3%) |
| 5 or more Children | 33 (75.0%) | 415 (61.0%) |
| Total | 1,284 (12.9%) | 5,706 (22.6%) |
Income Below Poverty Among Married-Couple vs Single-Parent Households in Ramsey County
The poverty data for Ramsey County shows that 3,352 of the married-couple family households (3.8%) and 6,990 of the single-parent households (19.9%) are living below the poverty level. Within the married-couple family households, those with 5 or more children have the highest poverty rate, with 613 households (34.0%) falling below the poverty line. Among the single-parent households, those with 5 or more children have the highest poverty rate, with 448 household (61.9%) living below poverty.
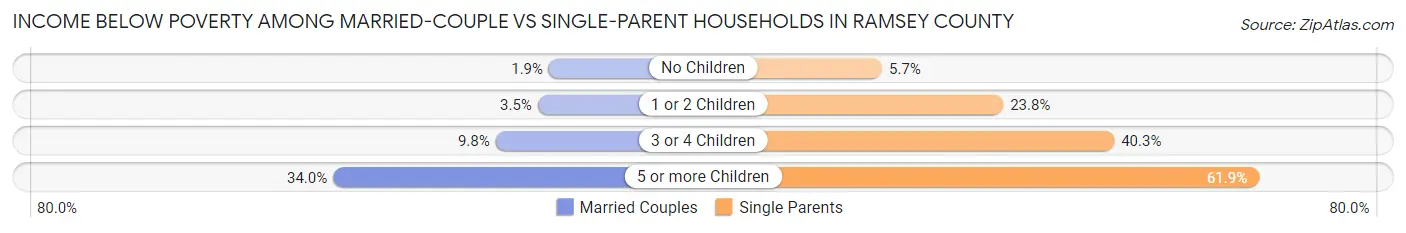
| Children | Married-Couple Families | Single-Parent Households |
| No Children | 944 (1.9%) | 745 (5.7%) |
| 1 or 2 Children | 966 (3.5%) | 4,109 (23.8%) |
| 3 or 4 Children | 829 (9.8%) | 1,688 (40.3%) |
| 5 or more Children | 613 (34.0%) | 448 (61.9%) |
| Total | 3,352 (3.8%) | 6,990 (19.9%) |
Employment Characteristics in Ramsey County
Employment by Class of Employer in Ramsey County
Among the 277,111 employed individuals in Ramsey County, private company employees (178,658 | 64.5%), not-for-profit organizations (40,849 | 14.7%), and local government employees (17,759 | 6.4%) make up the most common classes of employment.
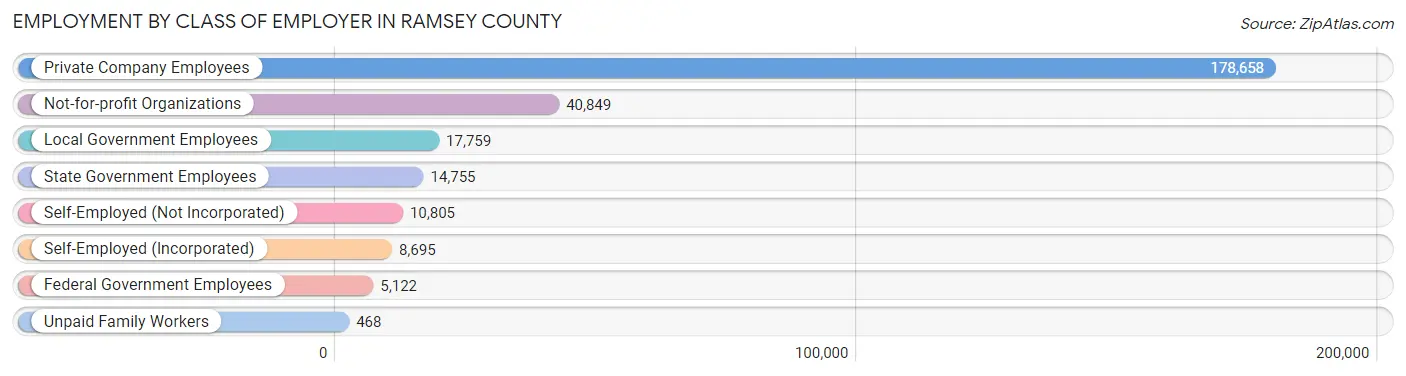
| Employer Class | # Employees | % Employees |
| Private Company Employees | 178,658 | 64.5% |
| Self-Employed (Incorporated) | 8,695 | 3.1% |
| Self-Employed (Not Incorporated) | 10,805 | 3.9% |
| Not-for-profit Organizations | 40,849 | 14.7% |
| Local Government Employees | 17,759 | 6.4% |
| State Government Employees | 14,755 | 5.3% |
| Federal Government Employees | 5,122 | 1.8% |
| Unpaid Family Workers | 468 | 0.2% |
| Total | 277,111 | 100.0% |
Employment Status by Age in Ramsey County
According to the labor force statistics for Ramsey County, out of the total population over 16 years of age (434,052), 68.5% or 297,326 individuals are in the labor force, with 4.7% or 13,974 of them unemployed. The age group with the highest labor force participation rate is 25 to 29 years, with 88.9% or 39,699 individuals in the labor force. Within the labor force, the 16 to 19 years age range has the highest percentage of unemployed individuals, with 14.1% or 2,054 of them being unemployed.
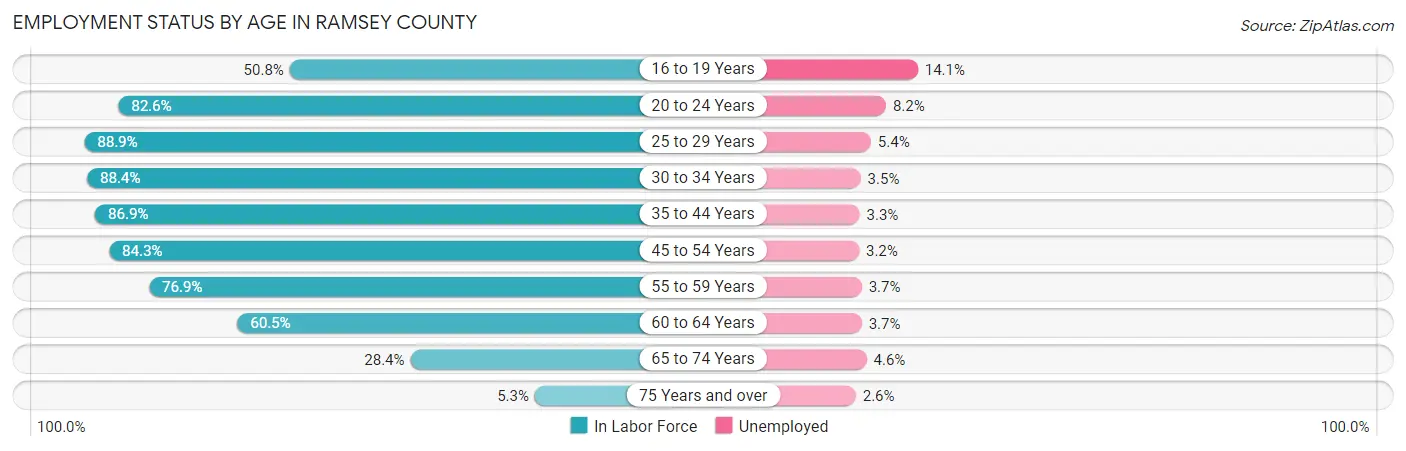
| Age Bracket | In Labor Force | Unemployed |
| 16 to 19 Years | 14,569 (50.8%) | 2,054 (14.1%) |
| 20 to 24 Years | 30,916 (82.6%) | 2,535 (8.2%) |
| 25 to 29 Years | 39,699 (88.9%) | 2,144 (5.4%) |
| 30 to 34 Years | 38,991 (88.4%) | 1,365 (3.5%) |
| 35 to 44 Years | 62,489 (86.9%) | 2,062 (3.3%) |
| 45 to 54 Years | 50,160 (84.3%) | 1,605 (3.2%) |
| 55 to 59 Years | 25,009 (76.9%) | 925 (3.7%) |
| 60 to 64 Years | 19,810 (60.5%) | 733 (3.7%) |
| 65 to 74 Years | 13,897 (28.4%) | 639 (4.6%) |
| 75 Years and over | 1,779 (5.3%) | 46 (2.6%) |
| Total | 297,326 (68.5%) | 13,974 (4.7%) |
Employment Status by Educational Attainment in Ramsey County
According to labor force statistics for Ramsey County, 82.7% of individuals (236,057) out of the total population between 25 and 64 years of age (285,438) are in the labor force, with 3.7% or 8,734 of them being unemployed. The group with the highest labor force participation rate are those with the educational attainment of bachelor's degree or higher, with 90.0% or 118,273 individuals in the labor force. Within the labor force, individuals with less than high school education have the highest percentage of unemployment, with 5.5% or 836 of them being unemployed.
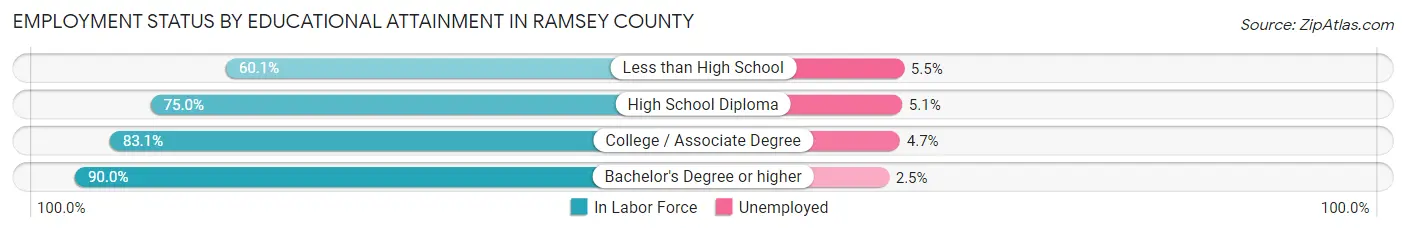
| Educational Attainment | In Labor Force | Unemployed |
| Less than High School | 15,194 (60.1%) | 1,391 (5.5%) |
| High School Diploma | 39,543 (75.0%) | 2,689 (5.1%) |
| College / Associate Degree | 63,171 (83.1%) | 3,573 (4.7%) |
| Bachelor's Degree or higher | 118,273 (90.0%) | 3,285 (2.5%) |
| Total | 236,057 (82.7%) | 10,561 (3.7%) |
Employment Occupations by Sex in Ramsey County
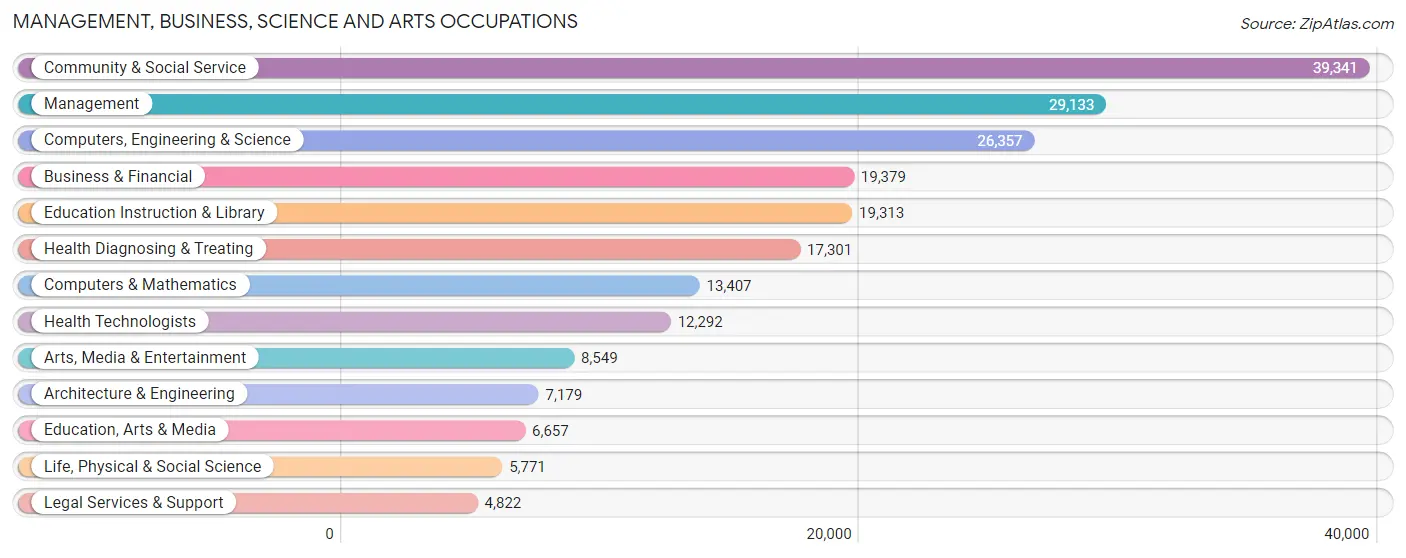
Management, Business, Science and Arts Occupations
The most common Management, Business, Science and Arts occupations in Ramsey County are Community & Social Service (39,341 | 13.9%), Management (29,133 | 10.3%), Computers, Engineering & Science (26,357 | 9.3%), Business & Financial (19,379 | 6.9%), and Education Instruction & Library (19,313 | 6.8%).
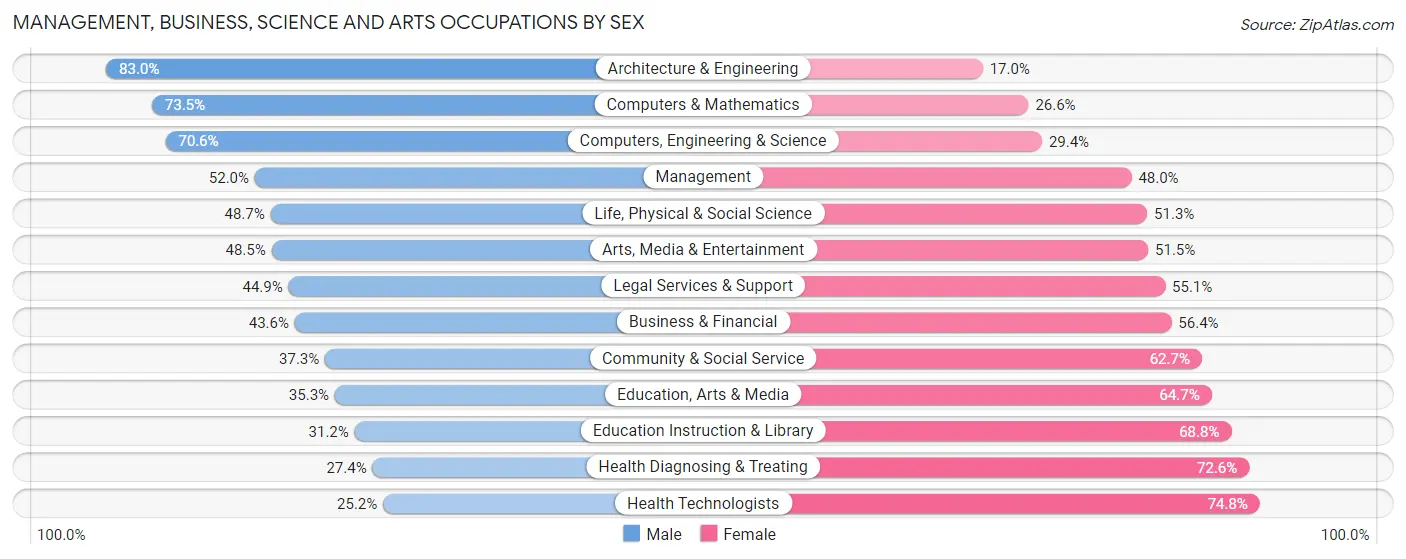
Management, Business, Science and Arts Occupations by Sex
Within the Management, Business, Science and Arts occupations in Ramsey County, the most male-oriented occupations are Architecture & Engineering (83.0%), Computers & Mathematics (73.5%), and Computers, Engineering & Science (70.6%), while the most female-oriented occupations are Health Technologists (74.8%), Health Diagnosing & Treating (72.6%), and Education Instruction & Library (68.8%).
| Occupation | Male | Female |
| Management | 15,137 (52.0%) | 13,996 (48.0%) |
| Business & Financial | 8,456 (43.6%) | 10,923 (56.4%) |
| Computers, Engineering & Science | 18,616 (70.6%) | 7,741 (29.4%) |
| Computers & Mathematics | 9,848 (73.5%) | 3,559 (26.6%) |
| Architecture & Engineering | 5,958 (83.0%) | 1,221 (17.0%) |
| Life, Physical & Social Science | 2,810 (48.7%) | 2,961 (51.3%) |
| Community & Social Service | 14,678 (37.3%) | 24,663 (62.7%) |
| Education, Arts & Media | 2,348 (35.3%) | 4,309 (64.7%) |
| Legal Services & Support | 2,167 (44.9%) | 2,655 (55.1%) |
| Education Instruction & Library | 6,018 (31.2%) | 13,295 (68.8%) |
| Arts, Media & Entertainment | 4,145 (48.5%) | 4,404 (51.5%) |
| Health Diagnosing & Treating | 4,745 (27.4%) | 12,556 (72.6%) |
| Health Technologists | 3,100 (25.2%) | 9,192 (74.8%) |
| Total (Category) | 61,632 (46.9%) | 69,879 (53.1%) |
| Total (Overall) | 143,924 (50.8%) | 139,152 (49.2%) |
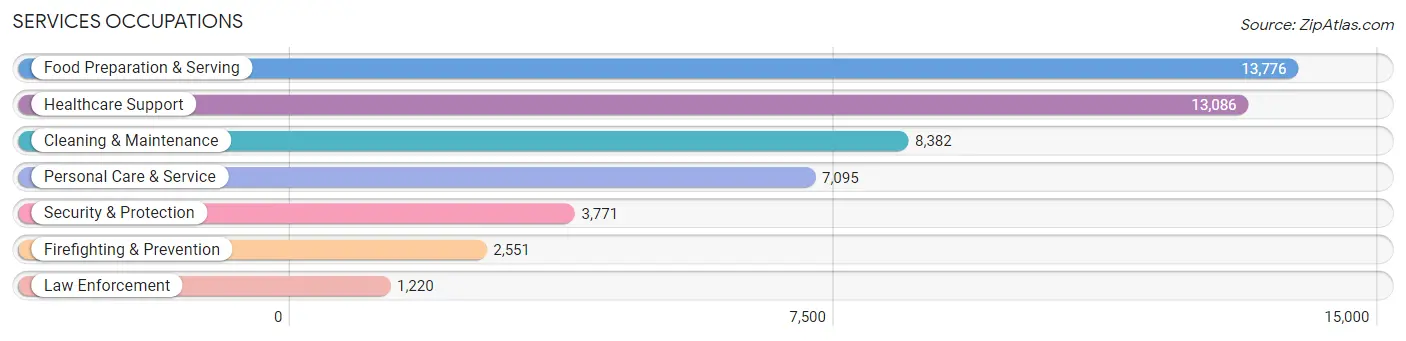
Services Occupations
The most common Services occupations in Ramsey County are Food Preparation & Serving (13,776 | 4.9%), Healthcare Support (13,086 | 4.6%), Cleaning & Maintenance (8,382 | 3.0%), Personal Care & Service (7,095 | 2.5%), and Security & Protection (3,771 | 1.3%).
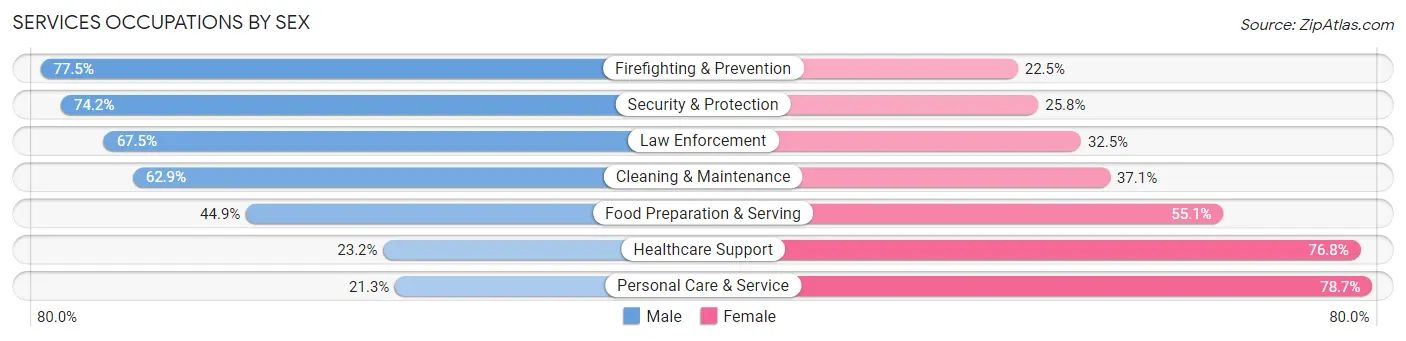
Services Occupations by Sex
Within the Services occupations in Ramsey County, the most male-oriented occupations are Firefighting & Prevention (77.5%), Security & Protection (74.2%), and Law Enforcement (67.5%), while the most female-oriented occupations are Personal Care & Service (78.7%), Healthcare Support (76.8%), and Food Preparation & Serving (55.1%).
| Occupation | Male | Female |
| Healthcare Support | 3,032 (23.2%) | 10,054 (76.8%) |
| Security & Protection | 2,799 (74.2%) | 972 (25.8%) |
| Firefighting & Prevention | 1,976 (77.5%) | 575 (22.5%) |
| Law Enforcement | 823 (67.5%) | 397 (32.5%) |
| Food Preparation & Serving | 6,185 (44.9%) | 7,591 (55.1%) |
| Cleaning & Maintenance | 5,269 (62.9%) | 3,113 (37.1%) |
| Personal Care & Service | 1,511 (21.3%) | 5,584 (78.7%) |
| Total (Category) | 18,796 (40.8%) | 27,314 (59.2%) |
| Total (Overall) | 143,924 (50.8%) | 139,152 (49.2%) |
Sales and Office Occupations
The most common Sales and Office occupations in Ramsey County are Office & Administration (31,238 | 11.0%), and Sales & Related (22,684 | 8.0%).

Sales and Office Occupations by Sex
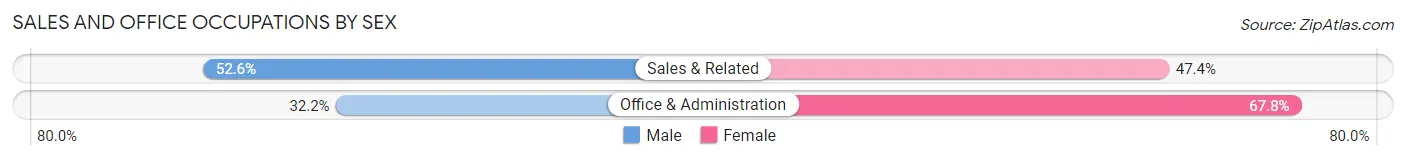
| Occupation | Male | Female |
| Sales & Related | 11,927 (52.6%) | 10,757 (47.4%) |
| Office & Administration | 10,053 (32.2%) | 21,185 (67.8%) |
| Total (Category) | 21,980 (40.8%) | 31,942 (59.2%) |
| Total (Overall) | 143,924 (50.8%) | 139,152 (49.2%) |
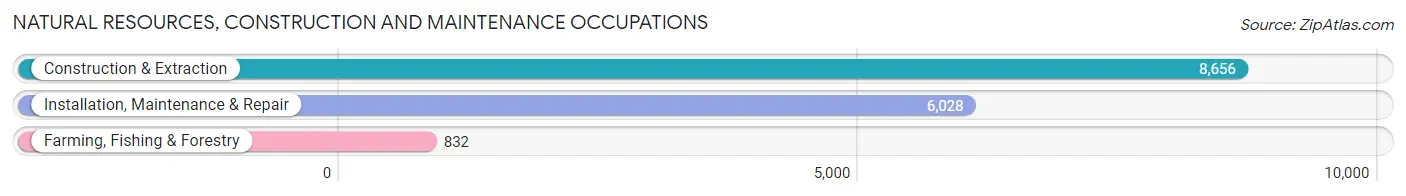
Natural Resources, Construction and Maintenance Occupations
The most common Natural Resources, Construction and Maintenance occupations in Ramsey County are Construction & Extraction (8,656 | 3.1%), Installation, Maintenance & Repair (6,028 | 2.1%), and Farming, Fishing & Forestry (832 | 0.3%).
Natural Resources, Construction and Maintenance Occupations by Sex
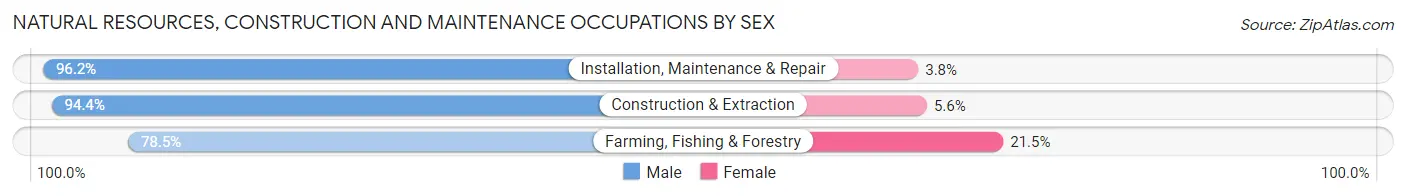
| Occupation | Male | Female |
| Farming, Fishing & Forestry | 653 (78.5%) | 179 (21.5%) |
| Construction & Extraction | 8,169 (94.4%) | 487 (5.6%) |
| Installation, Maintenance & Repair | 5,798 (96.2%) | 230 (3.8%) |
| Total (Category) | 14,620 (94.2%) | 896 (5.8%) |
| Total (Overall) | 143,924 (50.8%) | 139,152 (49.2%) |
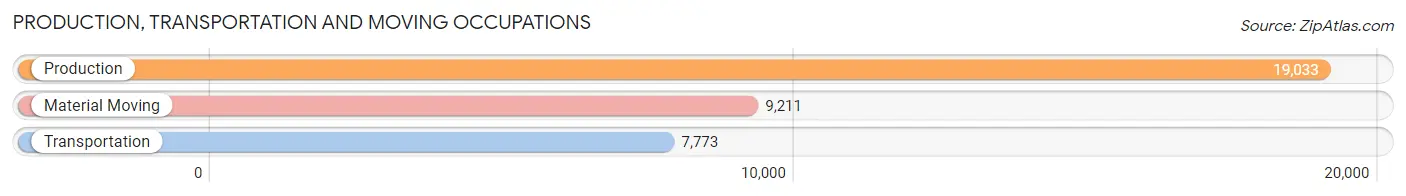
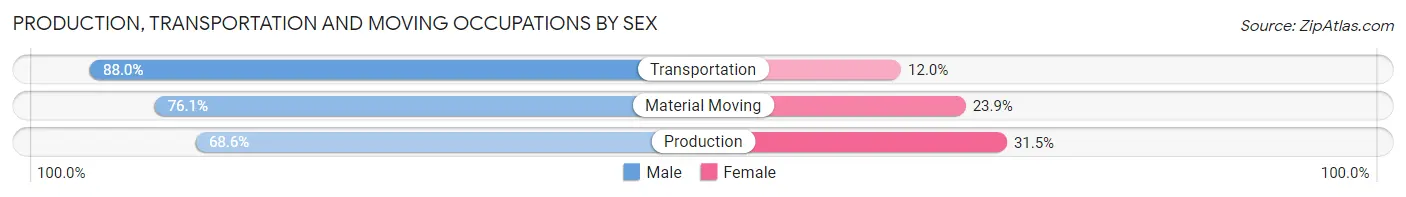
Production, Transportation and Moving Occupations
The most common Production, Transportation and Moving occupations in Ramsey County are Production (19,033 | 6.7%), Material Moving (9,211 | 3.3%), and Transportation (7,773 | 2.8%).
Production, Transportation and Moving Occupations by Sex
| Occupation | Male | Female |
| Production | 13,047 (68.5%) | 5,986 (31.5%) |
| Transportation | 6,838 (88.0%) | 935 (12.0%) |
| Material Moving | 7,011 (76.1%) | 2,200 (23.9%) |
| Total (Category) | 26,896 (74.7%) | 9,121 (25.3%) |
| Total (Overall) | 143,924 (50.8%) | 139,152 (49.2%) |
Employment Industries by Sex in Ramsey County
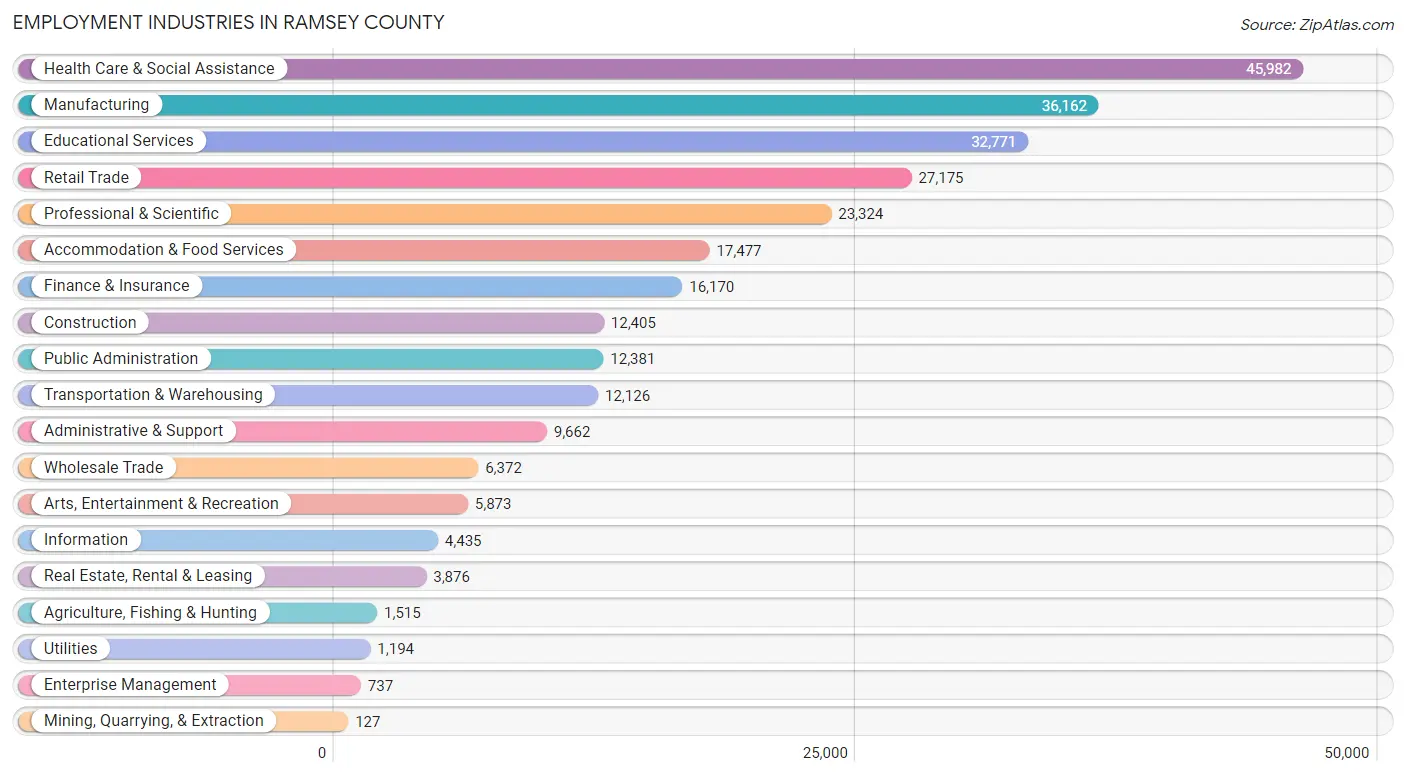
Employment Industries in Ramsey County
The major employment industries in Ramsey County include Health Care & Social Assistance (45,982 | 16.2%), Manufacturing (36,162 | 12.8%), Educational Services (32,771 | 11.6%), Retail Trade (27,175 | 9.6%), and Professional & Scientific (23,324 | 8.2%).
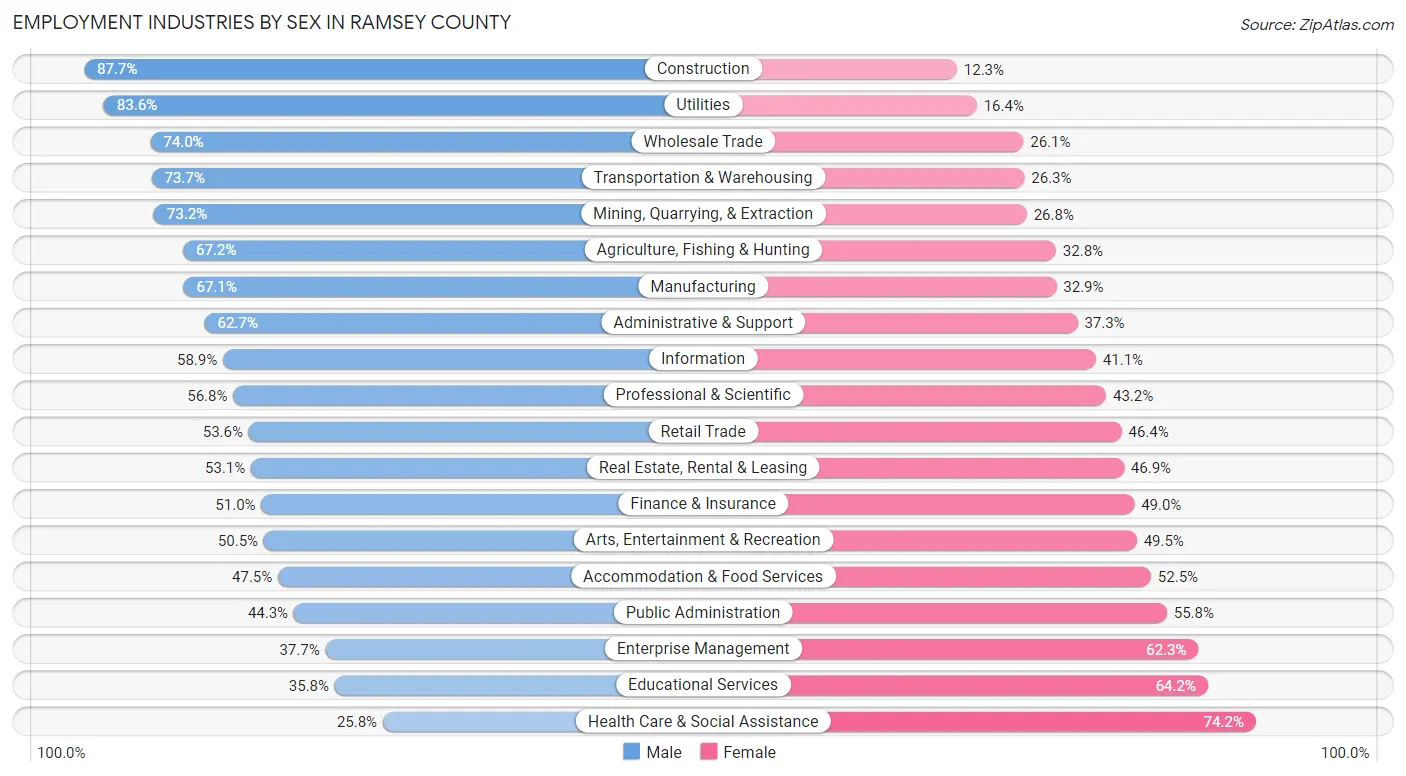
Employment Industries by Sex in Ramsey County
The Ramsey County industries that see more men than women are Construction (87.7%), Utilities (83.6%), and Wholesale Trade (74.0%), whereas the industries that tend to have a higher number of women are Health Care & Social Assistance (74.2%), Educational Services (64.2%), and Enterprise Management (62.3%).
| Industry | Male | Female |
| Agriculture, Fishing & Hunting | 1,018 (67.2%) | 497 (32.8%) |
| Mining, Quarrying, & Extraction | 93 (73.2%) | 34 (26.8%) |
| Construction | 10,879 (87.7%) | 1,526 (12.3%) |
| Manufacturing | 24,265 (67.1%) | 11,897 (32.9%) |
| Wholesale Trade | 4,712 (74.0%) | 1,660 (26.1%) |
| Retail Trade | 14,562 (53.6%) | 12,613 (46.4%) |
| Transportation & Warehousing | 8,940 (73.7%) | 3,186 (26.3%) |
| Utilities | 998 (83.6%) | 196 (16.4%) |
| Information | 2,613 (58.9%) | 1,822 (41.1%) |
| Finance & Insurance | 8,245 (51.0%) | 7,925 (49.0%) |
| Real Estate, Rental & Leasing | 2,059 (53.1%) | 1,817 (46.9%) |
| Professional & Scientific | 13,251 (56.8%) | 10,073 (43.2%) |
| Enterprise Management | 278 (37.7%) | 459 (62.3%) |
| Administrative & Support | 6,062 (62.7%) | 3,600 (37.3%) |
| Educational Services | 11,727 (35.8%) | 21,044 (64.2%) |
| Health Care & Social Assistance | 11,877 (25.8%) | 34,105 (74.2%) |
| Arts, Entertainment & Recreation | 2,964 (50.5%) | 2,909 (49.5%) |
| Accommodation & Food Services | 8,306 (47.5%) | 9,171 (52.5%) |
| Public Administration | 5,479 (44.3%) | 6,902 (55.7%) |
| Total | 143,924 (50.8%) | 139,152 (49.2%) |
Education in Ramsey County
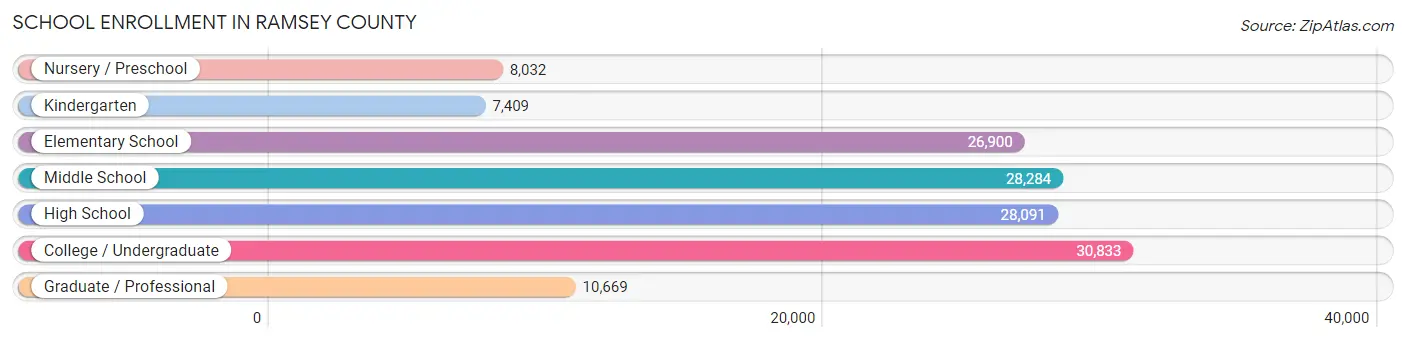
School Enrollment in Ramsey County
The most common levels of schooling among the 140,218 students in Ramsey County are college / undergraduate (30,833 | 22.0%), middle school (28,284 | 20.2%), and high school (28,091 | 20.0%).
| School Level | # Students | % Students |
| Nursery / Preschool | 8,032 | 5.7% |
| Kindergarten | 7,409 | 5.3% |
| Elementary School | 26,900 | 19.2% |
| Middle School | 28,284 | 20.2% |
| High School | 28,091 | 20.0% |
| College / Undergraduate | 30,833 | 22.0% |
| Graduate / Professional | 10,669 | 7.6% |
| Total | 140,218 | 100.0% |
School Enrollment by Age by Funding Source in Ramsey County
Out of a total of 140,218 students who are enrolled in schools in Ramsey County, 31,409 (22.4%) attend a private institution, while the remaining 108,809 (77.6%) are enrolled in public schools. The age group of 20 to 24 year olds has the highest likelihood of being enrolled in private schools, with 7,604 (49.3% in the age bracket) enrolled. Conversely, the age group of 15 to 17 year olds has the lowest likelihood of being enrolled in a private school, with 17,591 (88.7% in the age bracket) attending a public institution.
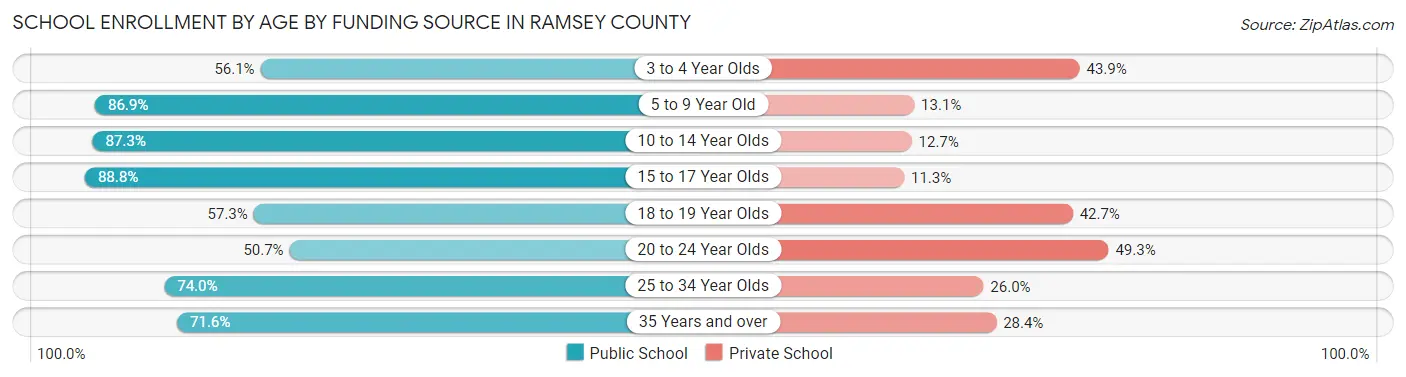
| Age Bracket | Public School | Private School |
| 3 to 4 Year Olds | 3,212 (56.1%) | 2,517 (43.9%) |
| 5 to 9 Year Old | 28,558 (86.9%) | 4,317 (13.1%) |
| 10 to 14 Year Olds | 30,486 (87.3%) | 4,418 (12.7%) |
| 15 to 17 Year Olds | 17,591 (88.7%) | 2,229 (11.3%) |
| 18 to 19 Year Olds | 6,919 (57.3%) | 5,148 (42.7%) |
| 20 to 24 Year Olds | 7,810 (50.7%) | 7,604 (49.3%) |
| 25 to 34 Year Olds | 9,132 (74.0%) | 3,213 (26.0%) |
| 35 Years and over | 5,057 (71.6%) | 2,007 (28.4%) |
| Total | 108,809 (77.6%) | 31,409 (22.4%) |
Educational Attainment by Field of Study in Ramsey County
Business (25,763 | 13.9%), social sciences (18,910 | 10.2%), education (16,573 | 8.9%), science & technology (14,242 | 7.7%), and bio, nature & agricultural (14,213 | 7.7%) are the most common fields of study among 185,422 individuals in Ramsey County who have obtained a bachelor's degree or higher.
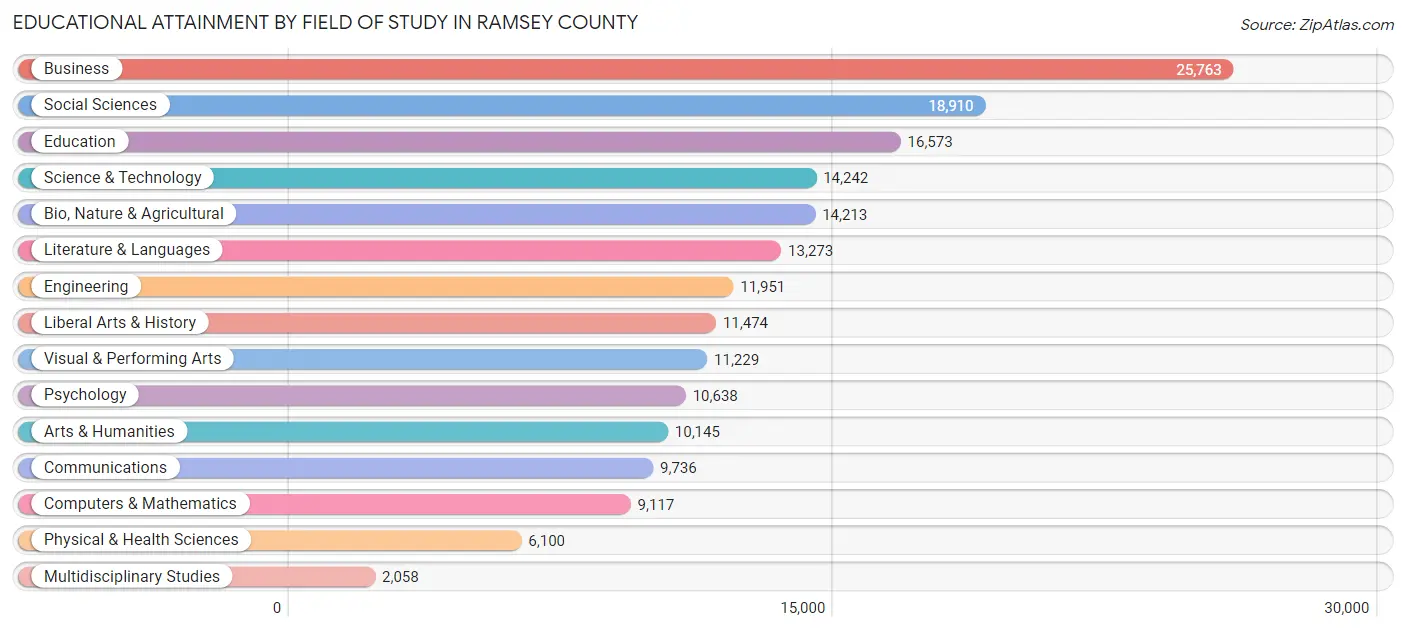
| Field of Study | # Graduates | % Graduates |
| Computers & Mathematics | 9,117 | 4.9% |
| Bio, Nature & Agricultural | 14,213 | 7.7% |
| Physical & Health Sciences | 6,100 | 3.3% |
| Psychology | 10,638 | 5.7% |
| Social Sciences | 18,910 | 10.2% |
| Engineering | 11,951 | 6.5% |
| Multidisciplinary Studies | 2,058 | 1.1% |
| Science & Technology | 14,242 | 7.7% |
| Business | 25,763 | 13.9% |
| Education | 16,573 | 8.9% |
| Literature & Languages | 13,273 | 7.2% |
| Liberal Arts & History | 11,474 | 6.2% |
| Visual & Performing Arts | 11,229 | 6.1% |
| Communications | 9,736 | 5.2% |
| Arts & Humanities | 10,145 | 5.5% |
| Total | 185,422 | 100.0% |
Transportation & Commute in Ramsey County
Vehicle Availability by Sex in Ramsey County
The most prevalent vehicle ownership categories in Ramsey County are males with 2 vehicles (61,245, accounting for 44.0%) and females with 2 vehicles (56,952, making up 46.0%).
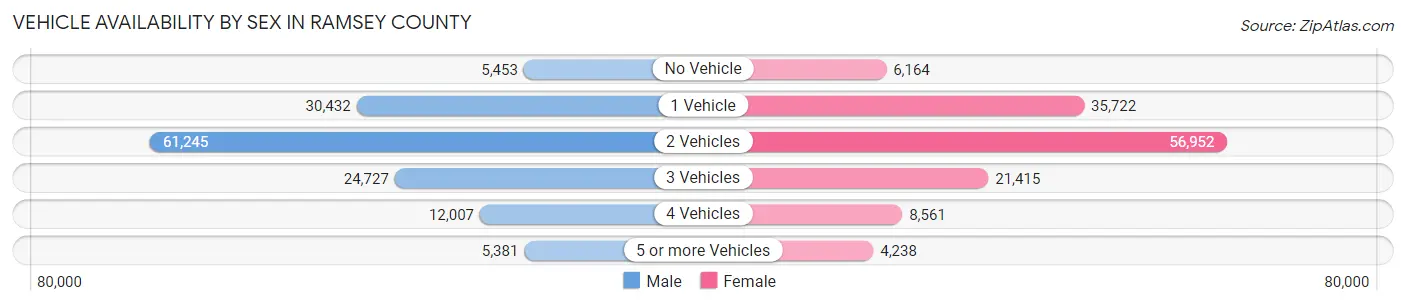
| Vehicles Available | Male | Female |
| No Vehicle | 5,453 (3.9%) | 6,164 (4.6%) |
| 1 Vehicle | 30,432 (21.9%) | 35,722 (26.9%) |
| 2 Vehicles | 61,245 (44.0%) | 56,952 (42.8%) |
| 3 Vehicles | 24,727 (17.8%) | 21,415 (16.1%) |
| 4 Vehicles | 12,007 (8.6%) | 8,561 (6.4%) |
| 5 or more Vehicles | 5,381 (3.9%) | 4,238 (3.2%) |
| Total | 139,245 (100.0%) | 133,052 (100.0%) |
Commute Time in Ramsey County
The most frequently occuring commute durations in Ramsey County are 20 to 24 minutes (44,768 commuters, 19.1%), 15 to 19 minutes (42,697 commuters, 18.2%), and 10 to 14 minutes (33,526 commuters, 14.3%).
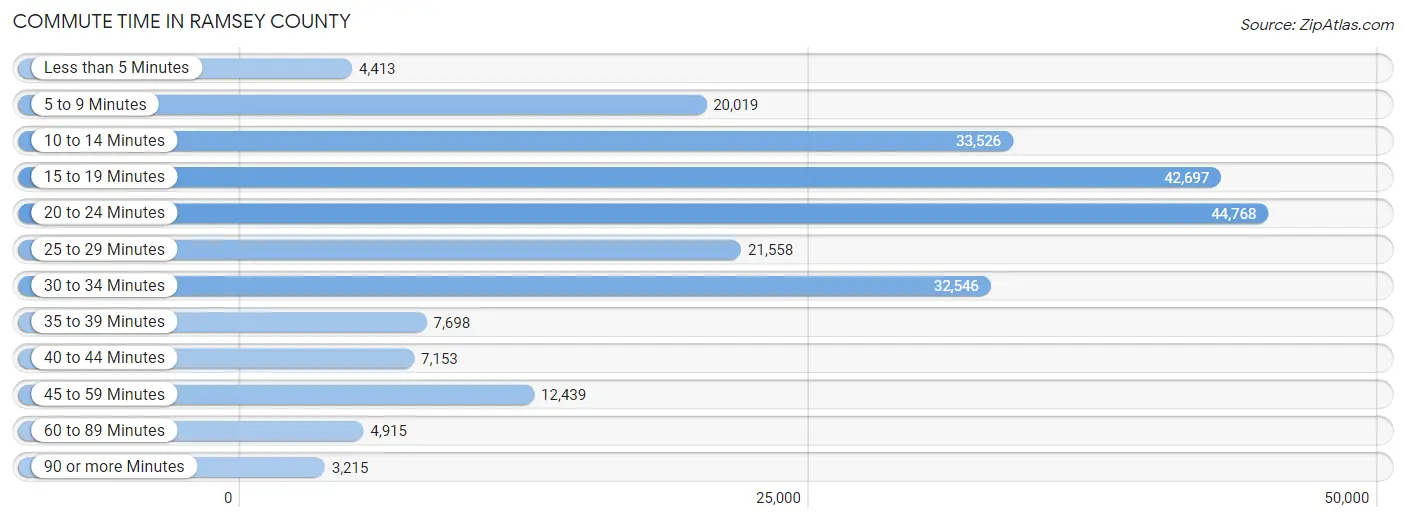
| Commute Time | # Commuters | % Commuters |
| Less than 5 Minutes | 4,413 | 1.9% |
| 5 to 9 Minutes | 20,019 | 8.5% |
| 10 to 14 Minutes | 33,526 | 14.3% |
| 15 to 19 Minutes | 42,697 | 18.2% |
| 20 to 24 Minutes | 44,768 | 19.1% |
| 25 to 29 Minutes | 21,558 | 9.2% |
| 30 to 34 Minutes | 32,546 | 13.9% |
| 35 to 39 Minutes | 7,698 | 3.3% |
| 40 to 44 Minutes | 7,153 | 3.0% |
| 45 to 59 Minutes | 12,439 | 5.3% |
| 60 to 89 Minutes | 4,915 | 2.1% |
| 90 or more Minutes | 3,215 | 1.4% |
Commute Time by Sex in Ramsey County
The most common commute times in Ramsey County are 20 to 24 minutes (24,114 commuters, 19.9%) for males and 15 to 19 minutes (21,597 commuters, 19.0%) for females.
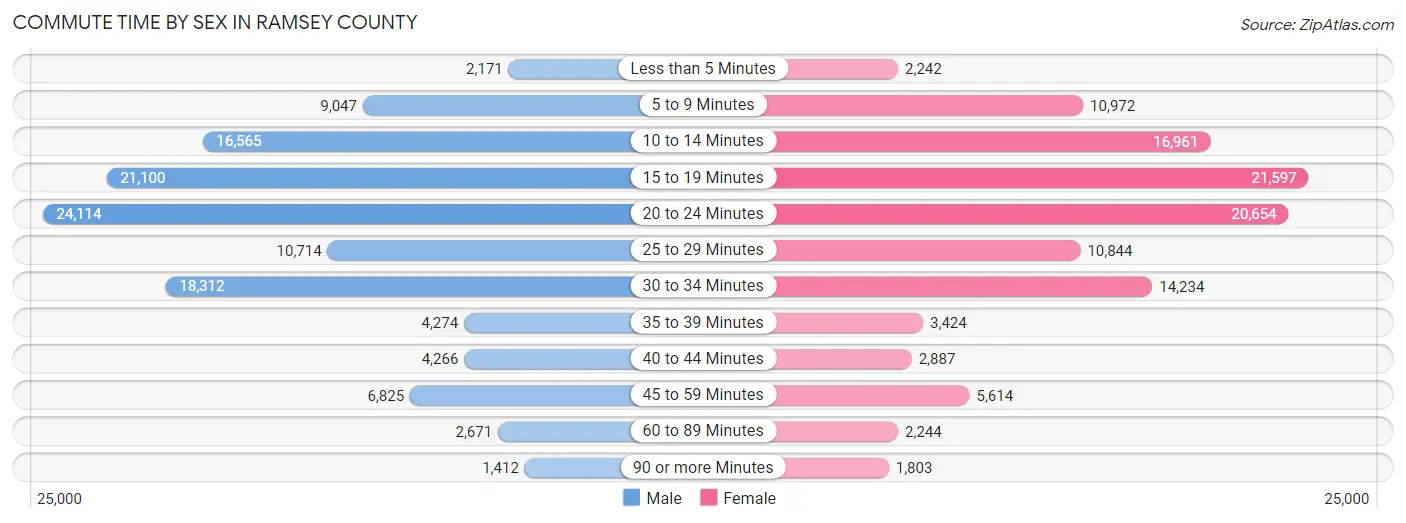
| Commute Time | Male | Female |
| Less than 5 Minutes | 2,171 (1.8%) | 2,242 (2.0%) |
| 5 to 9 Minutes | 9,047 (7.4%) | 10,972 (9.7%) |
| 10 to 14 Minutes | 16,565 (13.6%) | 16,961 (14.9%) |
| 15 to 19 Minutes | 21,100 (17.4%) | 21,597 (19.0%) |
| 20 to 24 Minutes | 24,114 (19.9%) | 20,654 (18.2%) |
| 25 to 29 Minutes | 10,714 (8.8%) | 10,844 (9.6%) |
| 30 to 34 Minutes | 18,312 (15.1%) | 14,234 (12.5%) |
| 35 to 39 Minutes | 4,274 (3.5%) | 3,424 (3.0%) |
| 40 to 44 Minutes | 4,266 (3.5%) | 2,887 (2.5%) |
| 45 to 59 Minutes | 6,825 (5.6%) | 5,614 (5.0%) |
| 60 to 89 Minutes | 2,671 (2.2%) | 2,244 (2.0%) |
| 90 or more Minutes | 1,412 (1.2%) | 1,803 (1.6%) |
Time of Departure to Work by Sex in Ramsey County
The most frequent times of departure to work in Ramsey County are 7:00 AM to 7:29 AM (15,671, 12.9%) for males and 7:00 AM to 7:29 AM (15,820, 13.9%) for females.
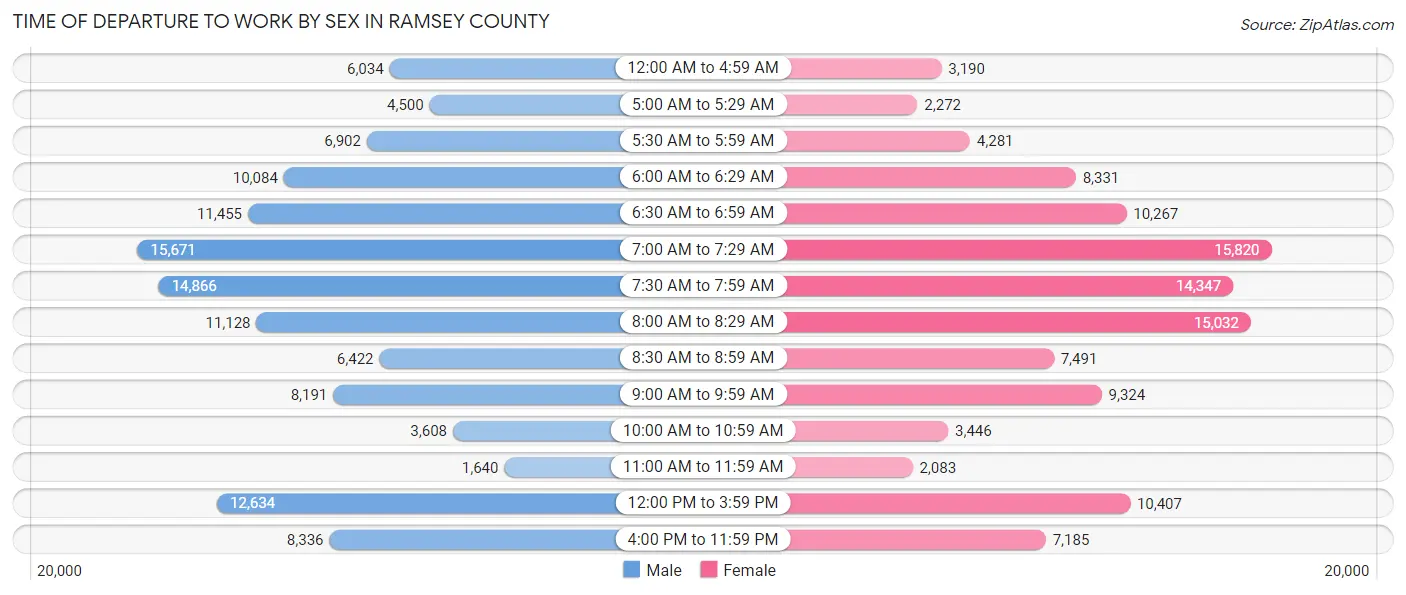
| Time of Departure | Male | Female |
| 12:00 AM to 4:59 AM | 6,034 (5.0%) | 3,190 (2.8%) |
| 5:00 AM to 5:29 AM | 4,500 (3.7%) | 2,272 (2.0%) |
| 5:30 AM to 5:59 AM | 6,902 (5.7%) | 4,281 (3.8%) |
| 6:00 AM to 6:29 AM | 10,084 (8.3%) | 8,331 (7.3%) |
| 6:30 AM to 6:59 AM | 11,455 (9.4%) | 10,267 (9.0%) |
| 7:00 AM to 7:29 AM | 15,671 (12.9%) | 15,820 (13.9%) |
| 7:30 AM to 7:59 AM | 14,866 (12.2%) | 14,347 (12.6%) |
| 8:00 AM to 8:29 AM | 11,128 (9.2%) | 15,032 (13.3%) |
| 8:30 AM to 8:59 AM | 6,422 (5.3%) | 7,491 (6.6%) |
| 9:00 AM to 9:59 AM | 8,191 (6.7%) | 9,324 (8.2%) |
| 10:00 AM to 10:59 AM | 3,608 (3.0%) | 3,446 (3.0%) |
| 11:00 AM to 11:59 AM | 1,640 (1.3%) | 2,083 (1.8%) |
| 12:00 PM to 3:59 PM | 12,634 (10.4%) | 10,407 (9.2%) |
| 4:00 PM to 11:59 PM | 8,336 (6.9%) | 7,185 (6.3%) |
| Total | 121,471 (100.0%) | 113,476 (100.0%) |
Housing Occupancy in Ramsey County
Occupancy by Ownership in Ramsey County
Of the total 216,969 dwellings in Ramsey County, owner-occupied units account for 132,415 (61.0%), while renter-occupied units make up 84,554 (39.0%).
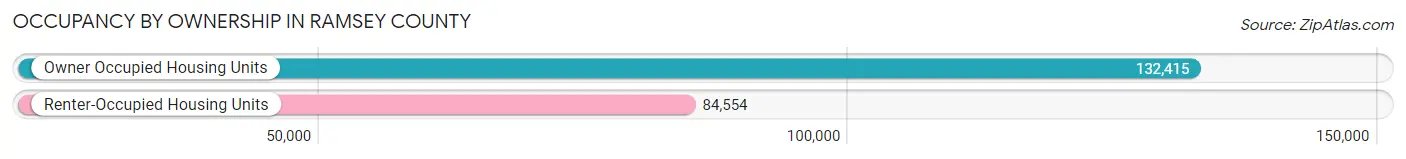
| Occupancy | # Housing Units | % Housing Units |
| Owner Occupied Housing Units | 132,415 | 61.0% |
| Renter-Occupied Housing Units | 84,554 | 39.0% |
| Total Occupied Housing Units | 216,969 | 100.0% |
Occupancy by Household Size in Ramsey County
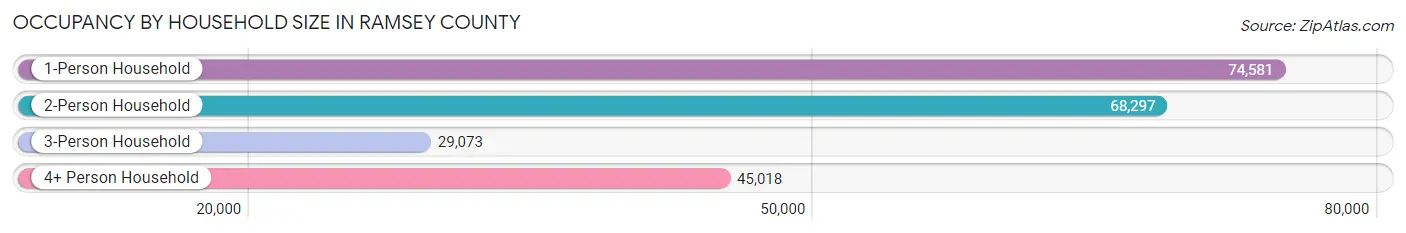
| Household Size | # Housing Units | % Housing Units |
| 1-Person Household | 74,581 | 34.4% |
| 2-Person Household | 68,297 | 31.5% |
| 3-Person Household | 29,073 | 13.4% |
| 4+ Person Household | 45,018 | 20.7% |
| Total Housing Units | 216,969 | 100.0% |
Occupancy by Ownership by Household Size in Ramsey County
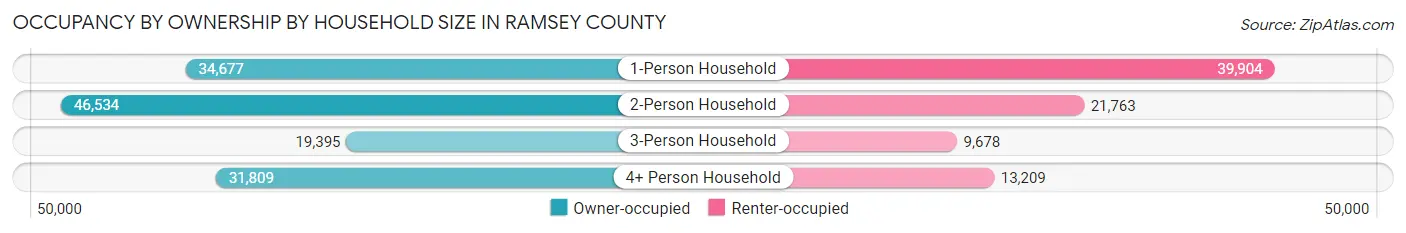
| Household Size | Owner-occupied | Renter-occupied |
| 1-Person Household | 34,677 (46.5%) | 39,904 (53.5%) |
| 2-Person Household | 46,534 (68.1%) | 21,763 (31.9%) |
| 3-Person Household | 19,395 (66.7%) | 9,678 (33.3%) |
| 4+ Person Household | 31,809 (70.7%) | 13,209 (29.3%) |
| Total Housing Units | 132,415 (61.0%) | 84,554 (39.0%) |
Occupancy by Educational Attainment in Ramsey County
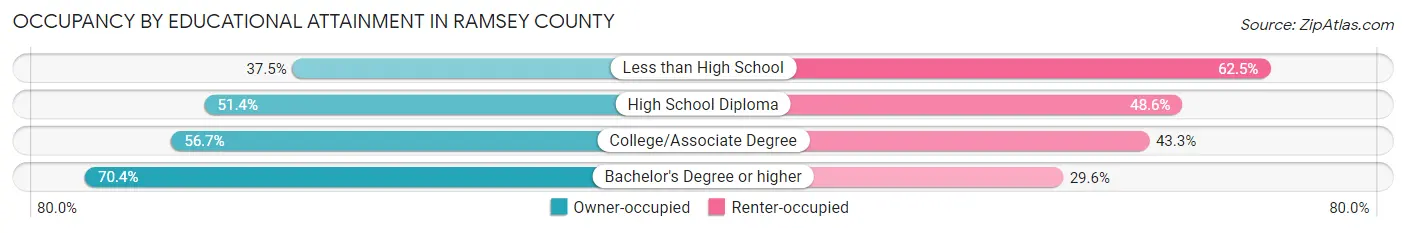
| Household Size | Owner-occupied | Renter-occupied |
| Less than High School | 5,311 (37.5%) | 8,848 (62.5%) |
| High School Diploma | 20,387 (51.4%) | 19,246 (48.6%) |
| College/Associate Degree | 33,921 (56.7%) | 25,868 (43.3%) |
| Bachelor's Degree or higher | 72,796 (70.4%) | 30,592 (29.6%) |
Occupancy by Age of Householder in Ramsey County
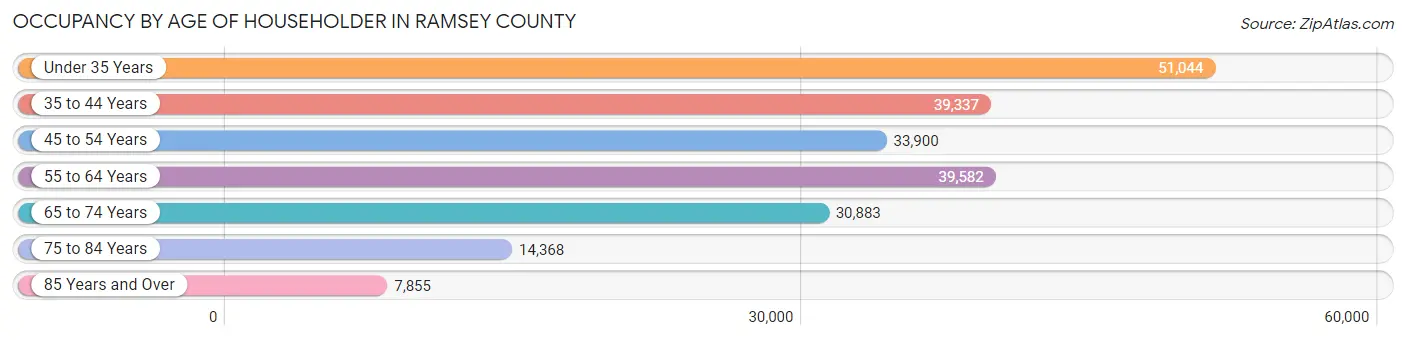
| Age Bracket | # Households | % Households |
| Under 35 Years | 51,044 | 23.5% |
| 35 to 44 Years | 39,337 | 18.1% |
| 45 to 54 Years | 33,900 | 15.6% |
| 55 to 64 Years | 39,582 | 18.2% |
| 65 to 74 Years | 30,883 | 14.2% |
| 75 to 84 Years | 14,368 | 6.6% |
| 85 Years and Over | 7,855 | 3.6% |
| Total | 216,969 | 100.0% |
Housing Finances in Ramsey County
Median Income by Occupancy in Ramsey County
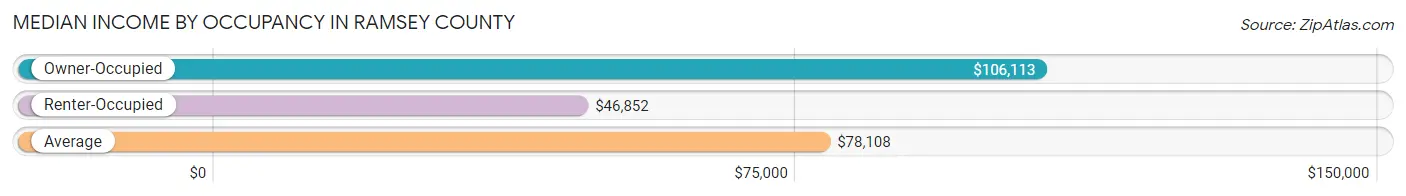
| Occupancy Type | # Households | Median Income |
| Owner-Occupied | 132,415 (61.0%) | $106,113 |
| Renter-Occupied | 84,554 (39.0%) | $46,852 |
| Average | 216,969 (100.0%) | $78,108 |
Occupancy by Householder Income Bracket in Ramsey County
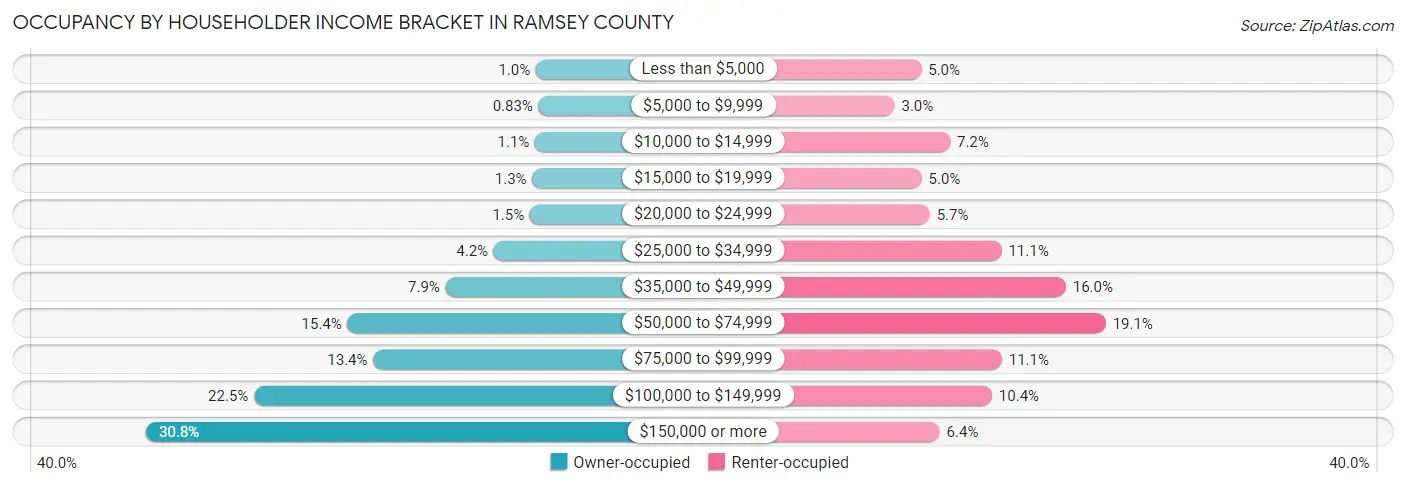
| Income Bracket | Owner-occupied | Renter-occupied |
| Less than $5,000 | 1,358 (1.0%) | 4,234 (5.0%) |
| $5,000 to $9,999 | 1,093 (0.8%) | 2,509 (3.0%) |
| $10,000 to $14,999 | 1,458 (1.1%) | 6,092 (7.2%) |
| $15,000 to $19,999 | 1,738 (1.3%) | 4,255 (5.0%) |
| $20,000 to $24,999 | 1,978 (1.5%) | 4,777 (5.7%) |
| $25,000 to $34,999 | 5,611 (4.2%) | 9,402 (11.1%) |
| $35,000 to $49,999 | 10,493 (7.9%) | 13,546 (16.0%) |
| $50,000 to $74,999 | 20,378 (15.4%) | 16,112 (19.1%) |
| $75,000 to $99,999 | 17,788 (13.4%) | 9,419 (11.1%) |
| $100,000 to $149,999 | 29,802 (22.5%) | 8,786 (10.4%) |
| $150,000 or more | 40,718 (30.7%) | 5,422 (6.4%) |
| Total | 132,415 (100.0%) | 84,554 (100.0%) |
Monthly Housing Cost Tiers in Ramsey County
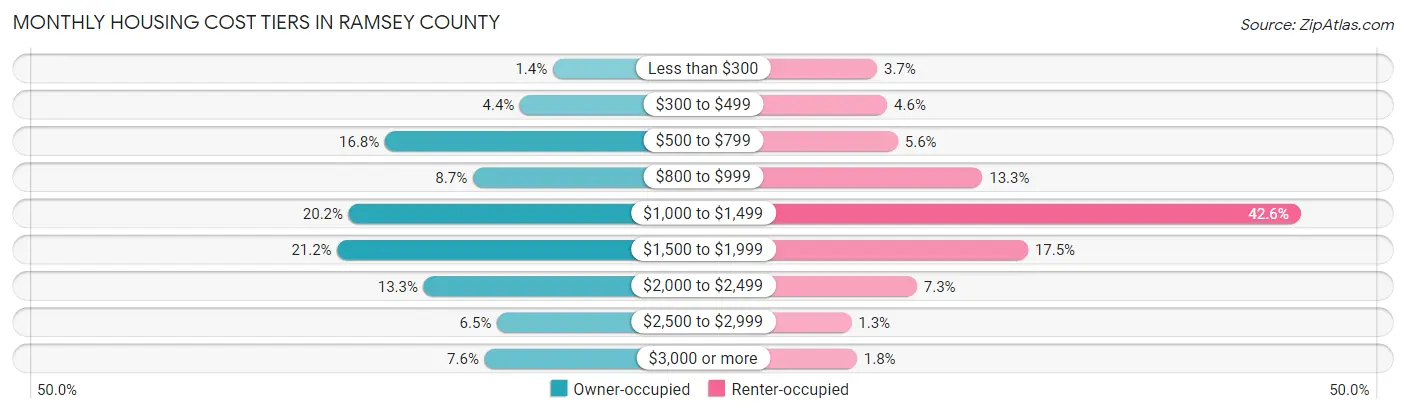
| Monthly Cost | Owner-occupied | Renter-occupied |
| Less than $300 | 1,784 (1.3%) | 3,082 (3.6%) |
| $300 to $499 | 5,799 (4.4%) | 3,869 (4.6%) |
| $500 to $799 | 22,261 (16.8%) | 4,704 (5.6%) |
| $800 to $999 | 11,549 (8.7%) | 11,277 (13.3%) |
| $1,000 to $1,499 | 26,687 (20.2%) | 36,056 (42.6%) |
| $1,500 to $1,999 | 28,075 (21.2%) | 14,832 (17.5%) |
| $2,000 to $2,499 | 17,549 (13.3%) | 6,181 (7.3%) |
| $2,500 to $2,999 | 8,589 (6.5%) | 1,082 (1.3%) |
| $3,000 or more | 10,122 (7.6%) | 1,517 (1.8%) |
| Total | 132,415 (100.0%) | 84,554 (100.0%) |
Physical Housing Characteristics in Ramsey County
Housing Structures in Ramsey County
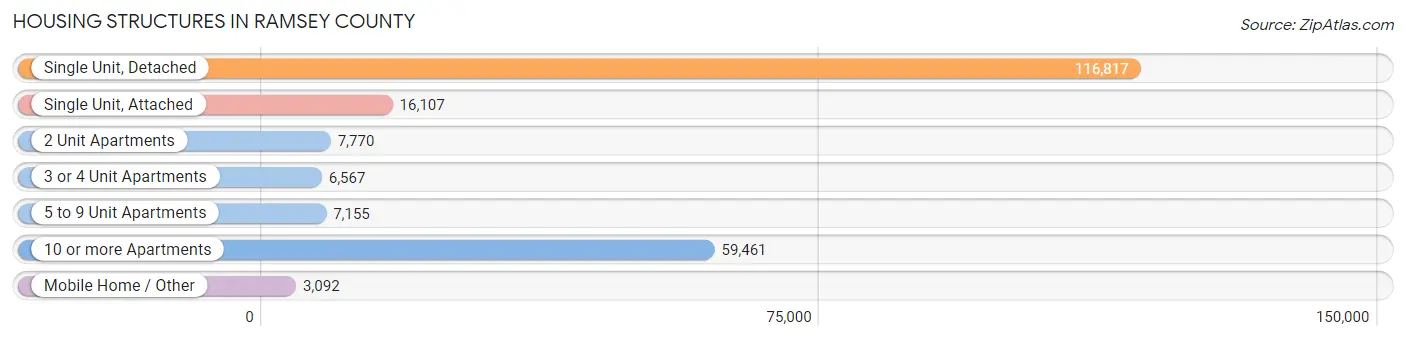
| Structure Type | # Housing Units | % Housing Units |
| Single Unit, Detached | 116,817 | 53.8% |
| Single Unit, Attached | 16,107 | 7.4% |
| 2 Unit Apartments | 7,770 | 3.6% |
| 3 or 4 Unit Apartments | 6,567 | 3.0% |
| 5 to 9 Unit Apartments | 7,155 | 3.3% |
| 10 or more Apartments | 59,461 | 27.4% |
| Mobile Home / Other | 3,092 | 1.4% |
| Total | 216,969 | 100.0% |
Housing Structures by Occupancy in Ramsey County
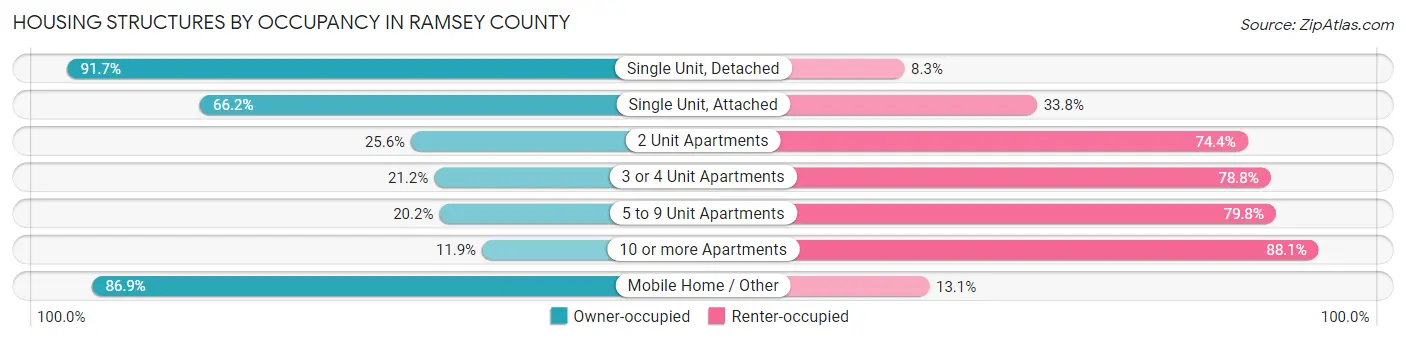
| Structure Type | Owner-occupied | Renter-occupied |
| Single Unit, Detached | 107,139 (91.7%) | 9,678 (8.3%) |
| Single Unit, Attached | 10,663 (66.2%) | 5,444 (33.8%) |
| 2 Unit Apartments | 1,990 (25.6%) | 5,780 (74.4%) |
| 3 or 4 Unit Apartments | 1,391 (21.2%) | 5,176 (78.8%) |
| 5 to 9 Unit Apartments | 1,443 (20.2%) | 5,712 (79.8%) |
| 10 or more Apartments | 7,101 (11.9%) | 52,360 (88.1%) |
| Mobile Home / Other | 2,688 (86.9%) | 404 (13.1%) |
| Total | 132,415 (61.0%) | 84,554 (39.0%) |
Housing Structures by Number of Rooms in Ramsey County
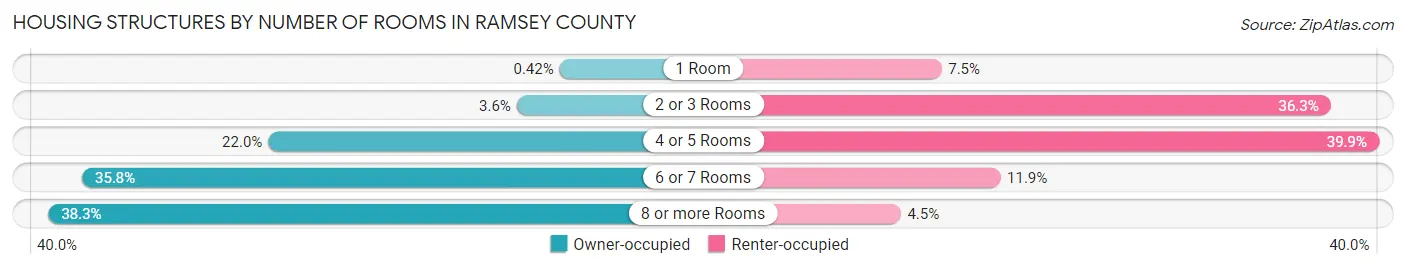
| Number of Rooms | Owner-occupied | Renter-occupied |
| 1 Room | 557 (0.4%) | 6,343 (7.5%) |
| 2 or 3 Rooms | 4,755 (3.6%) | 30,691 (36.3%) |
| 4 or 5 Rooms | 29,101 (22.0%) | 33,713 (39.9%) |
| 6 or 7 Rooms | 47,349 (35.8%) | 10,020 (11.8%) |
| 8 or more Rooms | 50,653 (38.3%) | 3,787 (4.5%) |
| Total | 132,415 (100.0%) | 84,554 (100.0%) |
Housing Structure by Heating Type in Ramsey County
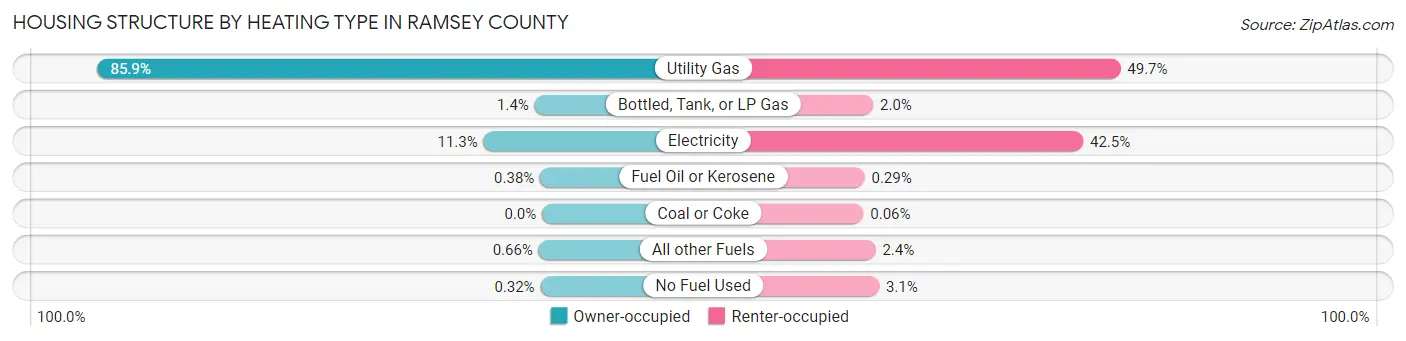
| Heating Type | Owner-occupied | Renter-occupied |
| Utility Gas | 113,737 (85.9%) | 42,039 (49.7%) |
| Bottled, Tank, or LP Gas | 1,898 (1.4%) | 1,647 (1.9%) |
| Electricity | 14,976 (11.3%) | 35,944 (42.5%) |
| Fuel Oil or Kerosene | 503 (0.4%) | 248 (0.3%) |
| Coal or Coke | 0 (0.0%) | 50 (0.1%) |
| All other Fuels | 879 (0.7%) | 2,030 (2.4%) |
| No Fuel Used | 422 (0.3%) | 2,596 (3.1%) |
| Total | 132,415 (100.0%) | 84,554 (100.0%) |
Household Vehicle Usage in Ramsey County
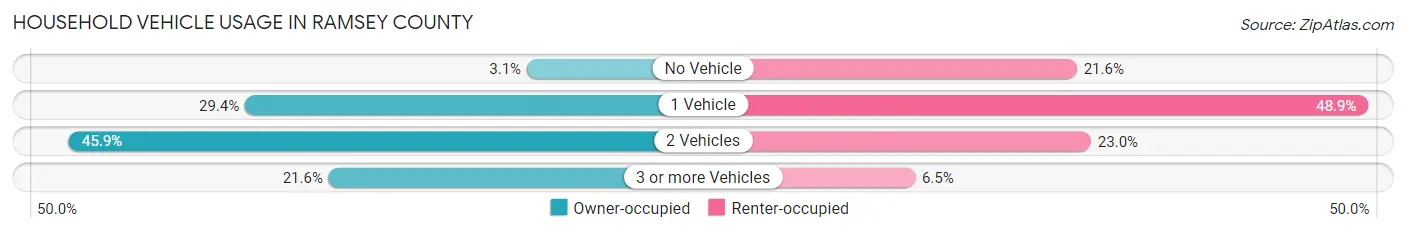
| Vehicles per Household | Owner-occupied | Renter-occupied |
| No Vehicle | 4,117 (3.1%) | 18,296 (21.6%) |
| 1 Vehicle | 38,957 (29.4%) | 41,314 (48.9%) |
| 2 Vehicles | 60,729 (45.9%) | 19,410 (23.0%) |
| 3 or more Vehicles | 28,612 (21.6%) | 5,534 (6.5%) |
| Total | 132,415 (100.0%) | 84,554 (100.0%) |
Real Estate & Mortgages in Ramsey County
Real Estate and Mortgage Overview in Ramsey County
| Characteristic | Without Mortgage | With Mortgage |
| Housing Units | 45,967 | 86,448 |
| Median Property Value | $281,800 | $292,900 |
| Median Household Income | $83,038 | $30,395 |
| Monthly Housing Costs | $725 | $9,889 |
| Real Estate Taxes | $3,589 | $1,609 |
Property Value by Mortgage Status in Ramsey County
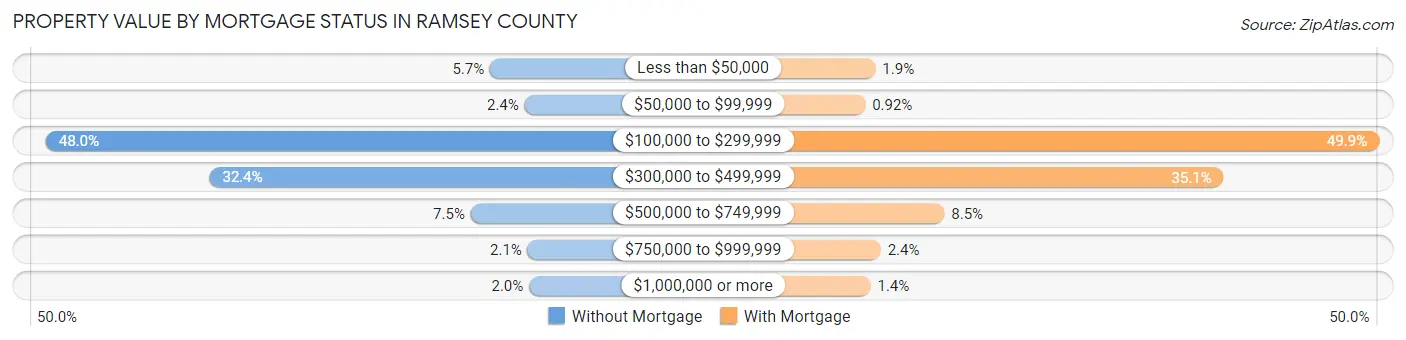
| Property Value | Without Mortgage | With Mortgage |
| Less than $50,000 | 2,606 (5.7%) | 1,632 (1.9%) |
| $50,000 to $99,999 | 1,095 (2.4%) | 792 (0.9%) |
| $100,000 to $299,999 | 22,055 (48.0%) | 43,094 (49.8%) |
| $300,000 to $499,999 | 14,898 (32.4%) | 30,299 (35.0%) |
| $500,000 to $749,999 | 3,453 (7.5%) | 7,315 (8.5%) |
| $750,000 to $999,999 | 962 (2.1%) | 2,079 (2.4%) |
| $1,000,000 or more | 898 (1.9%) | 1,237 (1.4%) |
| Total | 45,967 (100.0%) | 86,448 (100.0%) |
Household Income by Mortgage Status in Ramsey County
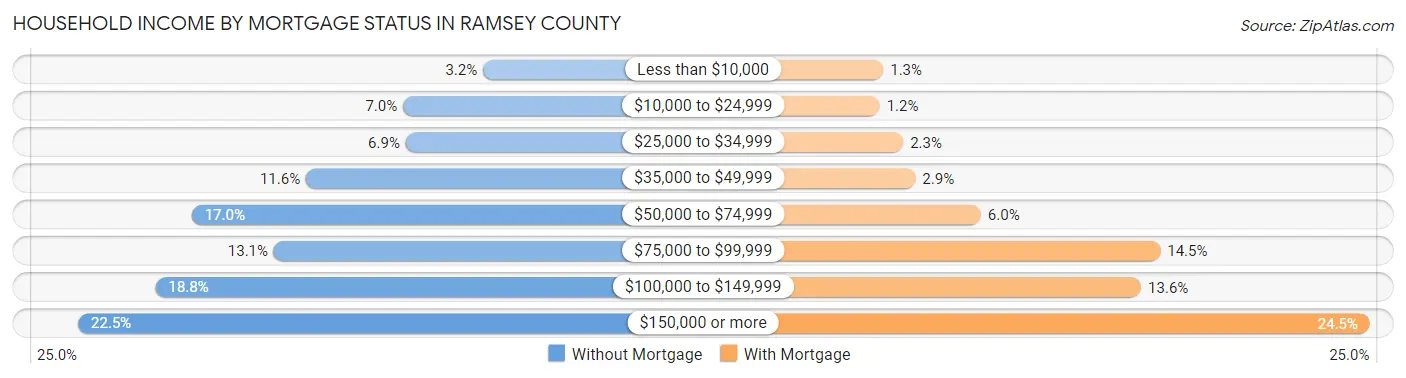
| Household Income | Without Mortgage | With Mortgage |
| Less than $10,000 | 1,456 (3.2%) | 1,143 (1.3%) |
| $10,000 to $24,999 | 3,209 (7.0%) | 995 (1.1%) |
| $25,000 to $34,999 | 3,150 (6.9%) | 1,965 (2.3%) |
| $35,000 to $49,999 | 5,330 (11.6%) | 2,461 (2.9%) |
| $50,000 to $74,999 | 7,835 (17.0%) | 5,163 (6.0%) |
| $75,000 to $99,999 | 6,034 (13.1%) | 12,543 (14.5%) |
| $100,000 to $149,999 | 8,630 (18.8%) | 11,754 (13.6%) |
| $150,000 or more | 10,323 (22.5%) | 21,172 (24.5%) |
| Total | 45,967 (100.0%) | 86,448 (100.0%) |
Property Value to Household Income Ratio in Ramsey County
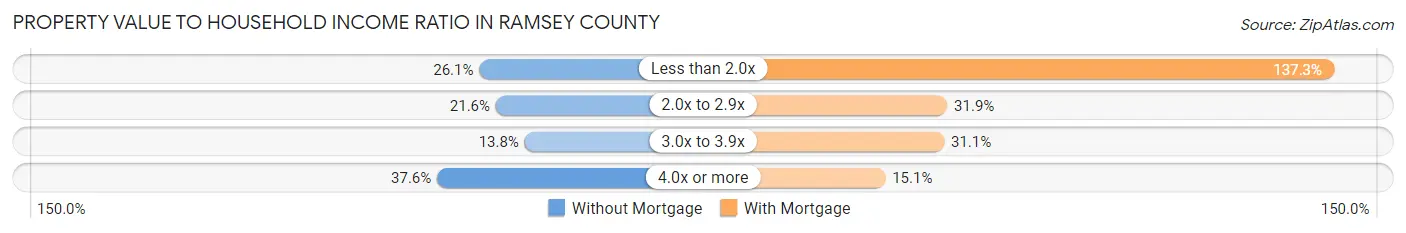
| Value-to-Income Ratio | Without Mortgage | With Mortgage |
| Less than 2.0x | 12,016 (26.1%) | 118,670 (137.3%) |
| 2.0x to 2.9x | 9,939 (21.6%) | 27,601 (31.9%) |
| 3.0x to 3.9x | 6,324 (13.8%) | 26,871 (31.1%) |
| 4.0x or more | 17,296 (37.6%) | 13,032 (15.1%) |
| Total | 45,967 (100.0%) | 86,448 (100.0%) |
Real Estate Taxes by Mortgage Status in Ramsey County
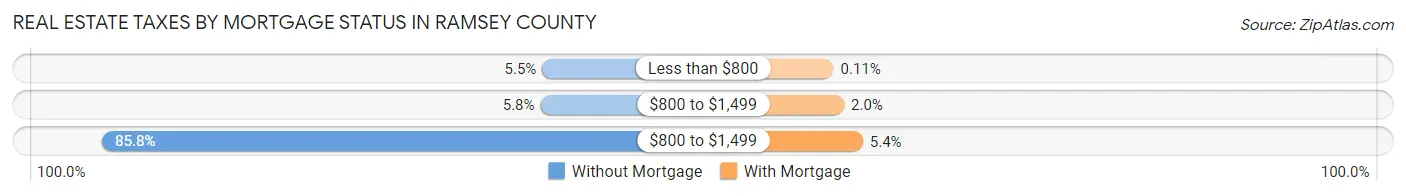
| Property Taxes | Without Mortgage | With Mortgage |
| Less than $800 | 2,511 (5.5%) | 95 (0.1%) |
| $800 to $1,499 | 2,665 (5.8%) | 1,742 (2.0%) |
| $800 to $1,499 | 39,452 (85.8%) | 4,699 (5.4%) |
| Total | 45,967 (100.0%) | 86,448 (100.0%) |
Health & Disability in Ramsey County
Health Insurance Coverage by Age in Ramsey County
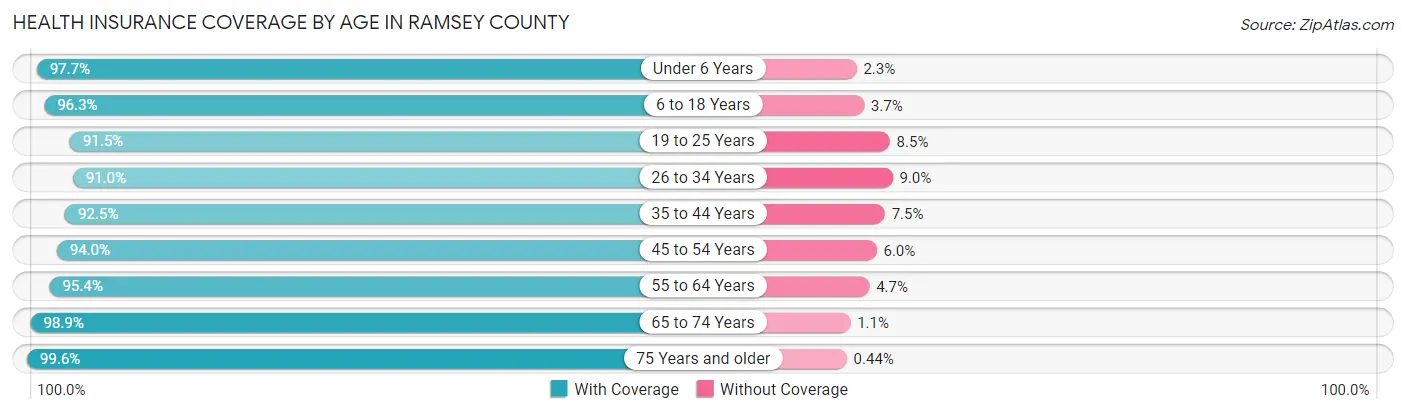
| Age Bracket | With Coverage | Without Coverage |
| Under 6 Years | 42,193 (97.7%) | 981 (2.3%) |
| 6 to 18 Years | 87,495 (96.3%) | 3,324 (3.7%) |
| 19 to 25 Years | 48,408 (91.5%) | 4,473 (8.5%) |
| 26 to 34 Years | 73,431 (91.0%) | 7,250 (9.0%) |
| 35 to 44 Years | 66,284 (92.5%) | 5,404 (7.5%) |
| 45 to 54 Years | 55,707 (94.0%) | 3,562 (6.0%) |
| 55 to 64 Years | 62,009 (95.4%) | 3,021 (4.6%) |
| 65 to 74 Years | 47,588 (98.9%) | 530 (1.1%) |
| 75 Years and older | 31,114 (99.6%) | 138 (0.4%) |
| Total | 514,229 (94.7%) | 28,683 (5.3%) |
Health Insurance Coverage by Citizenship Status in Ramsey County
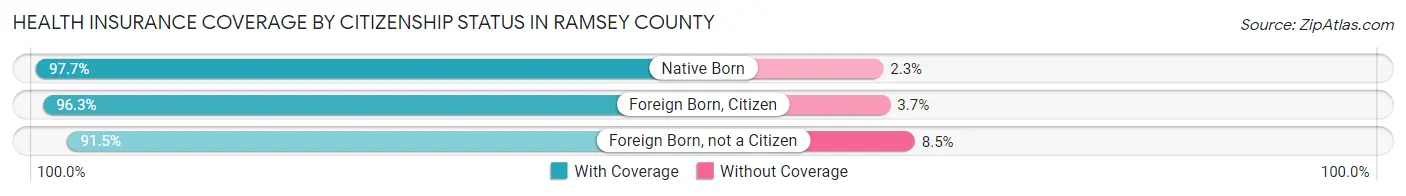
| Citizenship Status | With Coverage | Without Coverage |
| Native Born | 42,193 (97.7%) | 981 (2.3%) |
| Foreign Born, Citizen | 87,495 (96.3%) | 3,324 (3.7%) |
| Foreign Born, not a Citizen | 48,408 (91.5%) | 4,473 (8.5%) |
Health Insurance Coverage by Household Income in Ramsey County
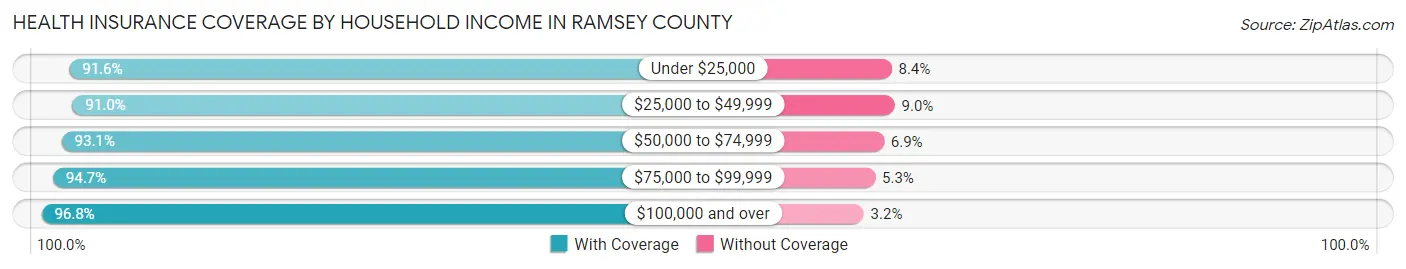
| Household Income | With Coverage | Without Coverage |
| Under $25,000 | 45,149 (91.6%) | 4,129 (8.4%) |
| $25,000 to $49,999 | 72,202 (91.0%) | 7,107 (9.0%) |
| $50,000 to $74,999 | 73,787 (93.1%) | 5,504 (6.9%) |
| $75,000 to $99,999 | 62,617 (94.7%) | 3,507 (5.3%) |
| $100,000 and over | 249,061 (96.8%) | 8,125 (3.2%) |
Public vs Private Health Insurance Coverage by Age in Ramsey County
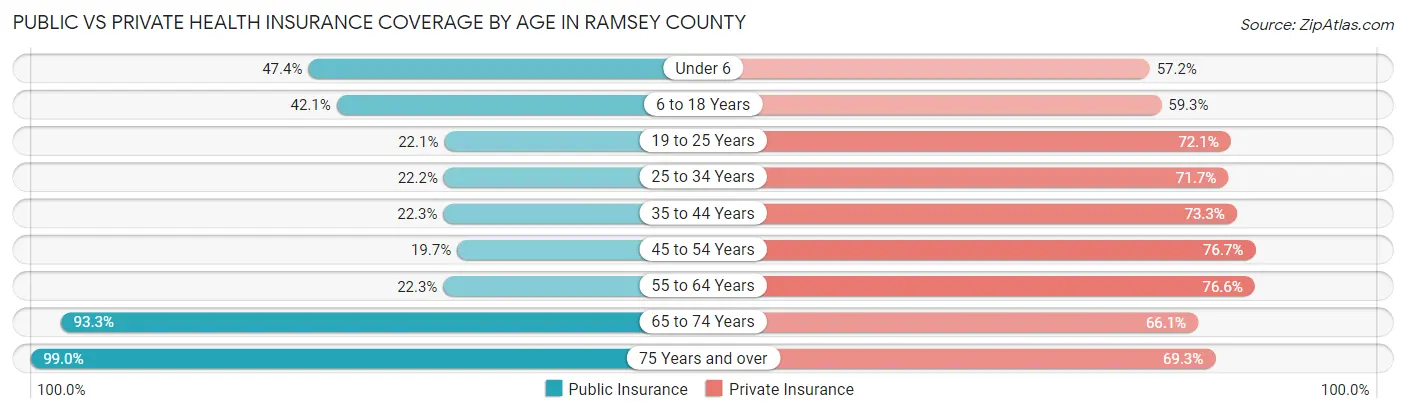
| Age Bracket | Public Insurance | Private Insurance |
| Under 6 | 20,441 (47.3%) | 24,672 (57.2%) |
| 6 to 18 Years | 38,238 (42.1%) | 53,857 (59.3%) |
| 19 to 25 Years | 11,692 (22.1%) | 38,149 (72.1%) |
| 25 to 34 Years | 17,914 (22.2%) | 57,829 (71.7%) |
| 35 to 44 Years | 15,982 (22.3%) | 52,542 (73.3%) |
| 45 to 54 Years | 11,700 (19.7%) | 45,469 (76.7%) |
| 55 to 64 Years | 14,504 (22.3%) | 49,832 (76.6%) |
| 65 to 74 Years | 44,894 (93.3%) | 31,808 (66.1%) |
| 75 Years and over | 30,924 (99.0%) | 21,655 (69.3%) |
| Total | 206,289 (38.0%) | 375,813 (69.2%) |
Disability Status by Sex by Age in Ramsey County
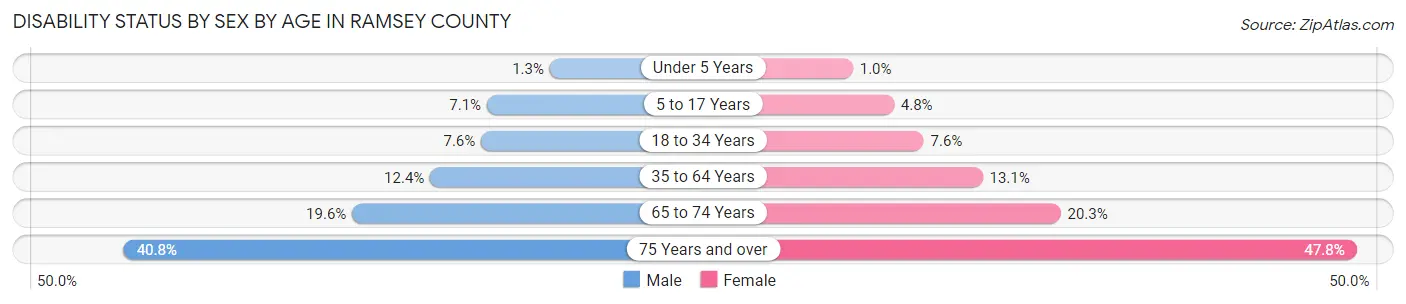
| Age Bracket | Male | Female |
| Under 5 Years | 230 (1.3%) | 178 (1.0%) |
| 5 to 17 Years | 3,293 (7.1%) | 2,139 (4.8%) |
| 18 to 34 Years | 5,360 (7.6%) | 5,378 (7.6%) |
| 35 to 64 Years | 12,050 (12.4%) | 12,856 (13.1%) |
| 65 to 74 Years | 4,337 (19.6%) | 5,276 (20.3%) |
| 75 Years and over | 5,052 (40.8%) | 9,014 (47.8%) |
Disability Class by Sex by Age in Ramsey County
Disability Class: Hearing Difficulty
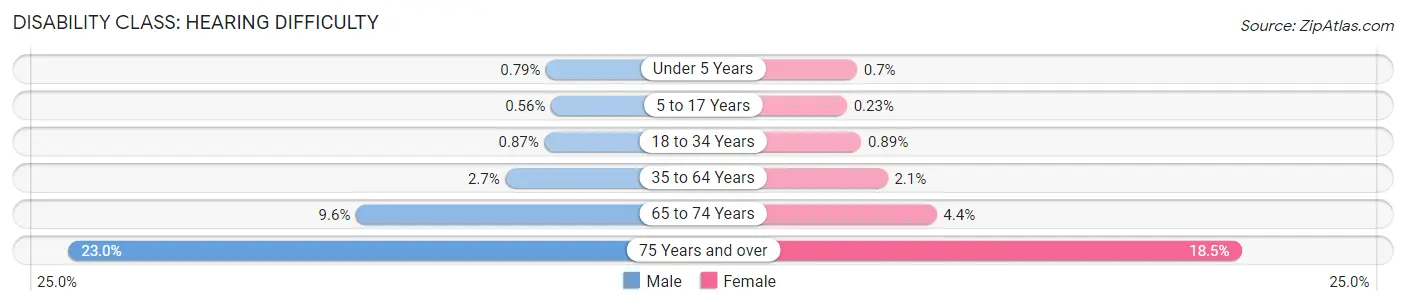
| Age Bracket | Male | Female |
| Under 5 Years | 144 (0.8%) | 122 (0.7%) |
| 5 to 17 Years | 260 (0.6%) | 100 (0.2%) |
| 18 to 34 Years | 610 (0.9%) | 633 (0.9%) |
| 35 to 64 Years | 2,610 (2.7%) | 2,086 (2.1%) |
| 65 to 74 Years | 2,127 (9.6%) | 1,140 (4.4%) |
| 75 Years and over | 2,844 (23.0%) | 3,498 (18.5%) |
Disability Class: Vision Difficulty
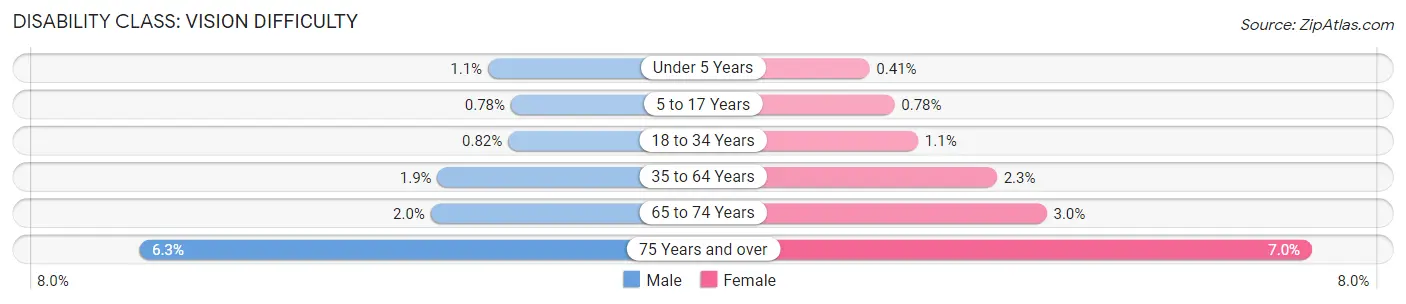
| Age Bracket | Male | Female |
| Under 5 Years | 204 (1.1%) | 71 (0.4%) |
| 5 to 17 Years | 364 (0.8%) | 344 (0.8%) |
| 18 to 34 Years | 575 (0.8%) | 803 (1.1%) |
| 35 to 64 Years | 1,823 (1.9%) | 2,263 (2.3%) |
| 65 to 74 Years | 435 (2.0%) | 790 (3.0%) |
| 75 Years and over | 780 (6.3%) | 1,317 (7.0%) |
Disability Class: Cognitive Difficulty
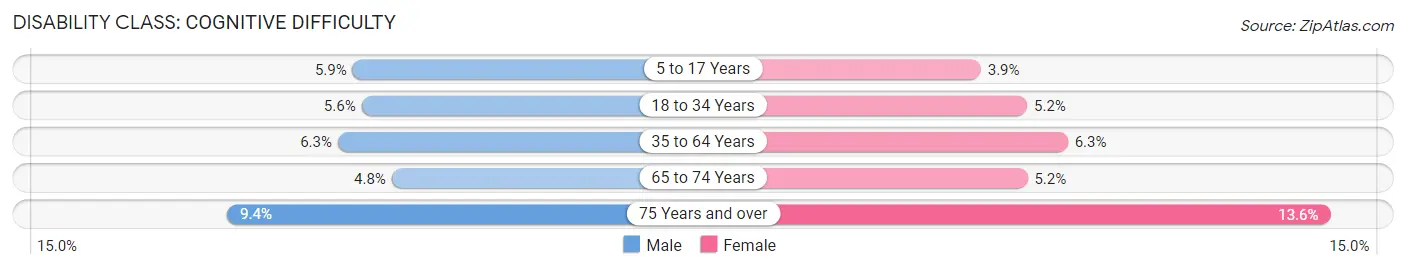
| Age Bracket | Male | Female |
| 5 to 17 Years | 2,725 (5.9%) | 1,713 (3.9%) |
| 18 to 34 Years | 3,948 (5.6%) | 3,658 (5.2%) |
| 35 to 64 Years | 6,122 (6.3%) | 6,189 (6.3%) |
| 65 to 74 Years | 1,057 (4.8%) | 1,344 (5.2%) |
| 75 Years and over | 1,159 (9.4%) | 2,567 (13.6%) |
Disability Class: Ambulatory Difficulty
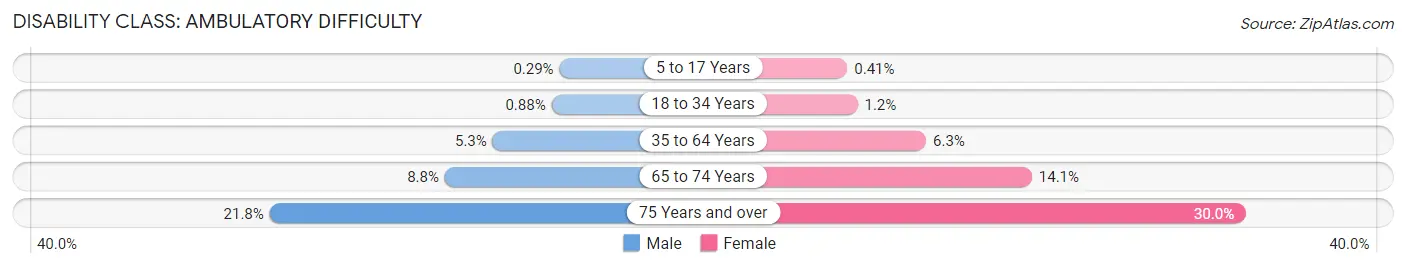
| Age Bracket | Male | Female |
| 5 to 17 Years | 136 (0.3%) | 181 (0.4%) |
| 18 to 34 Years | 618 (0.9%) | 827 (1.2%) |
| 35 to 64 Years | 5,117 (5.2%) | 6,162 (6.3%) |
| 65 to 74 Years | 1,948 (8.8%) | 3,668 (14.1%) |
| 75 Years and over | 2,701 (21.8%) | 5,663 (30.0%) |
Disability Class: Self-Care Difficulty
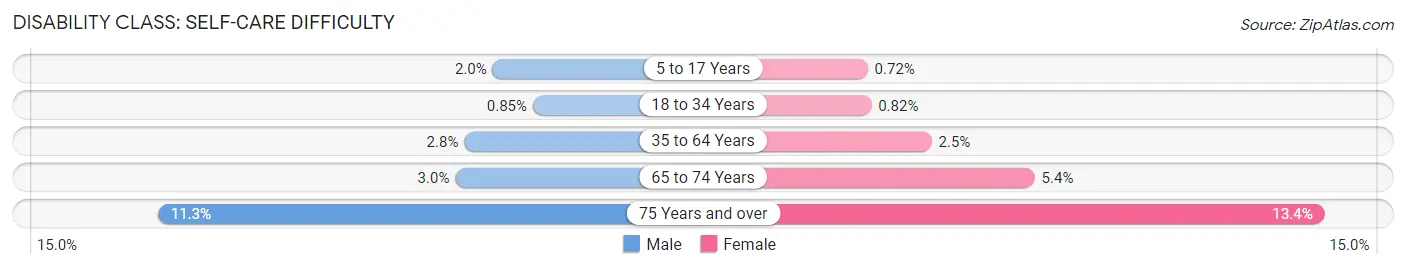
| Age Bracket | Male | Female |
| 5 to 17 Years | 915 (2.0%) | 318 (0.7%) |
| 18 to 34 Years | 594 (0.9%) | 579 (0.8%) |
| 35 to 64 Years | 2,690 (2.8%) | 2,463 (2.5%) |
| 65 to 74 Years | 667 (3.0%) | 1,395 (5.4%) |
| 75 Years and over | 1,398 (11.3%) | 2,537 (13.4%) |
Technology Access in Ramsey County
Computing Device Access in Ramsey County
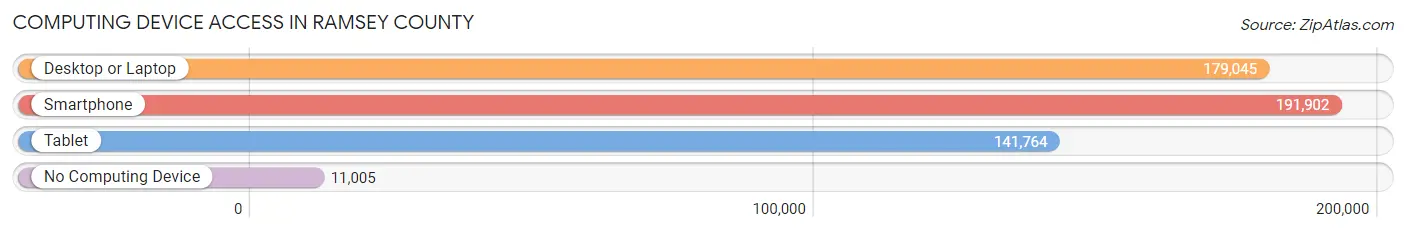
| Device Type | # Households | % Households |
| Desktop or Laptop | 179,045 | 82.5% |
| Smartphone | 191,902 | 88.4% |
| Tablet | 141,764 | 65.3% |
| No Computing Device | 11,005 | 5.1% |
| Total | 216,969 | 100.0% |
Internet Access in Ramsey County
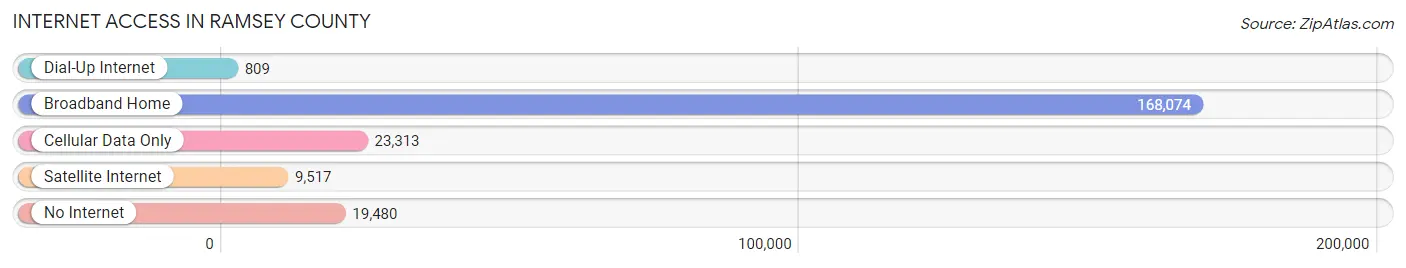
| Internet Type | # Households | % Households |
| Dial-Up Internet | 809 | 0.4% |
| Broadband Home | 168,074 | 77.5% |
| Cellular Data Only | 23,313 | 10.7% |
| Satellite Internet | 9,517 | 4.4% |
| No Internet | 19,480 | 9.0% |
| Total | 216,969 | 100.0% |
Ramsey County Summary
Ramsey County, Minnesota is located in the east-central part of the state and is part of the Twin Cities metropolitan area. It is the second most populous county in Minnesota, with a population of 535,717 as of the 2019 census. The county seat is St. Paul, the state capital.
Geography
Ramsey County is bordered by Anoka County to the north, Washington County to the east, Dakota County to the south, and Hennepin County to the west. The county covers an area of 517 square miles, of which 498 square miles is land and 19 square miles is water. The county is located in the Mississippi River Valley, with the Mississippi River forming the western border. The county is also home to several lakes, including White Bear Lake, Lake Phalen, and Lake Owasso.
The county is divided into several townships, including White Bear, Maplewood, North St. Paul, Roseville, Falcon Heights, Lauderdale, and St. Paul. The county is also home to several cities, including St. Paul, Maplewood, North St. Paul, Roseville, Falcon Heights, Lauderdale, and White Bear Lake.
History
Ramsey County was established in 1849 and named after Alexander Ramsey, the first governor of Minnesota. The county was originally part of the Minnesota Territory, and was one of the original nine counties established in the state.
The county was initially populated by Native American tribes, including the Dakota, Ojibwe, and Ho-Chunk. The first European settlers arrived in the area in the early 1800s, and the county was officially organized in 1849.
The county was initially an agricultural area, with the majority of the population living in rural areas. However, the county began to experience rapid growth in the late 19th and early 20th centuries, as the Twin Cities metropolitan area began to expand.
Economy
Ramsey County is home to a diverse economy, with a variety of industries represented. The county is home to several major employers, including 3M, Ecolab, and Xcel Energy. The county is also home to several major healthcare providers, including HealthPartners, Allina Health, and the University of Minnesota Medical Center.
The county is also home to several major educational institutions, including the University of Minnesota, Macalester College, and St. Catherine University. The county is also home to several major cultural institutions, including the Minnesota History Center, the Science Museum of Minnesota, and the Minnesota Children's Museum.
Demographics
As of the 2019 census, Ramsey County had a population of 535,717. The population was spread out, with 24.3% under the age of 18, 10.2% from 18 to 24, 33.2% from 25 to 44, 22.2% from 45 to 64, and 10.1% who were 65 years of age or older. The median age was 35.3 years.
The racial makeup of the county was 79.2% White, 11.2% Black or African American, 4.2% Asian, 0.5% Native American, 0.1% Pacific Islander, 2.7% from other races, and 2.1% from two or more races. Hispanic or Latino of any race were 6.3% of the population.
The median income for a household in the county was $63,945, and the median income for a family was $77,837. The per capita income for the county was $33,945. About 8.2% of families and 11.7% of the population were below the poverty line, including 16.2% of those under age 18 and 6.2% of those age 65 or over.
Common Questions
What is the Total Population of Ramsey County?
Total Population of Ramsey County is 547,202.
What is the Total Male Population of Ramsey County?
Total Male Population of Ramsey County is 269,113.
What is the Total Female Population of Ramsey County?
Total Female Population of Ramsey County is 278,089.
What is the Ratio of Males per 100 Females in Ramsey County?
There are 96.77 Males per 100 Females in Ramsey County.
What is the Ratio of Females per 100 Males in Ramsey County?
There are 103.34 Females per 100 Males in Ramsey County.
What is the Median Population Age in Ramsey County?
Median Population Age in Ramsey County is 35.7 Years.
What is the Average Family Size in Ramsey County
Average Family Size in Ramsey County is 3.2 People.
What is the Average Household Size in Ramsey County
Average Household Size in Ramsey County is 2.5 People.
What is Per Capita Income in Ramsey County?
Per Capita income in Ramsey County is $43,203.
What is the Median Family Income in Ramsey County?
Median Family Income in Ramsey County is $103,235.
What is the Median Household income in Ramsey County?
Median Household Income in Ramsey County is $78,108.
What is Income or Wage Gap in Ramsey County?
Income or Wage Gap in Ramsey County is 17.8%.
Women in Ramsey County earn 82.2 cents for every dollar earned by a man.
What is Family Income Deficit in Ramsey County?
Family Income Deficit in Ramsey County is $11,968.
Families that are below poverty line in Ramsey County earn $11,968 less on average than the poverty threshold level.
What is Inequality or Gini Index in Ramsey County?
Inequality or Gini Index in Ramsey County is 0.46.
How Large is the Labor Force in Ramsey County?
There are 297,326 People in the Labor Forcein in Ramsey County.
What is the Percentage of People in the Labor Force in Ramsey County?
68.5% of People are in the Labor Force in Ramsey County.
What is the Unemployment Rate in Ramsey County?
Unemployment Rate in Ramsey County is 4.7%.