Otter Tail County, MN
Otter Tail County Map
Otter Tail County Overview
60,072
TOTAL POPULATION
30,382
MALE POPULATION
29,690
FEMALE POPULATION
102.33
MALES / 100 FEMALES
97.72
FEMALES / 100 MALES
46.1
MEDIAN AGE
2.9
AVG FAMILY SIZE
2.4
AVG HOUSEHOLD SIZE
$37,202
PER CAPITA INCOME
$87,557
AVG FAMILY INCOME
$67,990
AVG HOUSEHOLD INCOME
34.4%
WAGE / INCOME GAP [ % ]
65.6¢/ $1
WAGE / INCOME GAP [ $ ]
$11,371
FAMILY INCOME DEFICIT
0.43
INEQUALITY / GINI INDEX
29,834
LABOR FORCE [ PEOPLE ]
61.5%
PERCENT IN LABOR FORCE
5.3%
UNEMPLOYMENT RATE
Race in Otter Tail County
The most populous races in Otter Tail County are White / Caucasian (55,494 | 92.4%), Two or more Races (2,320 | 3.9%), and Hispanic or Latino (2,244 | 3.7%).
| Race | # Population | % Population |
| Asian | 301 | 0.5% |
| Black / African American | 642 | 1.1% |
| Hawaiian / Pacific | 30 | 0.1% |
| Hispanic or Latino | 2,244 | 3.7% |
| Native / Alaskan | 148 | 0.3% |
| White / Caucasian | 55,494 | 92.4% |
| Two or more Races | 2,320 | 3.9% |
| Some other Race | 1,137 | 1.9% |
| Total | 60,072 | 100.0% |
Ancestry in Otter Tail County
The most populous ancestries reported in Otter Tail County are German (23,034 | 38.3%), Norwegian (15,484 | 25.8%), Swedish (4,831 | 8.0%), Irish (4,745 | 7.9%), and English (2,911 | 4.9%), together accounting for 84.9% of all Otter Tail County residents.
| Ancestry | # Population | % Population |
| African | 12 | 0.0% |
| American | 1,981 | 3.3% |
| Arab | 110 | 0.2% |
| Armenian | 6 | 0.0% |
| Austrian | 35 | 0.1% |
| Bangladeshi | 10 | 0.0% |
| Belgian | 106 | 0.2% |
| Bhutanese | 82 | 0.1% |
| Blackfeet | 5 | 0.0% |
| Brazilian | 3 | 0.0% |
| British | 222 | 0.4% |
| Burmese | 61 | 0.1% |
| Cajun | 2 | 0.0% |
| Canadian | 43 | 0.1% |
| Celtic | 1 | 0.0% |
| Central American | 99 | 0.2% |
| Central American Indian | 15 | 0.0% |
| Cherokee | 37 | 0.1% |
| Chippewa | 292 | 0.5% |
| Choctaw | 2 | 0.0% |
| Colombian | 13 | 0.0% |
| Comanche | 3 | 0.0% |
| Croatian | 40 | 0.1% |
| Cuban | 19 | 0.0% |
| Czech | 579 | 1.0% |
| Czechoslovakian | 37 | 0.1% |
| Danish | 743 | 1.2% |
| Dutch | 941 | 1.6% |
| Eastern European | 90 | 0.2% |
| Ecuadorian | 39 | 0.1% |
| Egyptian | 10 | 0.0% |
| English | 2,911 | 4.9% |
| Ethiopian | 5 | 0.0% |
| European | 565 | 0.9% |
| Fijian | 48 | 0.1% |
| Filipino | 12 | 0.0% |
| Finnish | 2,155 | 3.6% |
| French | 1,499 | 2.5% |
| French American Indian | 2 | 0.0% |
| French Canadian | 285 | 0.5% |
| German | 23,034 | 38.3% |
| German Russian | 24 | 0.0% |
| Greek | 38 | 0.1% |
| Guamanian / Chamorro | 6 | 0.0% |
| Guatemalan | 73 | 0.1% |
| Honduran | 6 | 0.0% |
| Hungarian | 46 | 0.1% |
| Icelander | 61 | 0.1% |
| Indian (Asian) | 118 | 0.2% |
| Iranian | 5 | 0.0% |
| Iraqi | 2 | 0.0% |
| Irish | 4,745 | 7.9% |
| Italian | 630 | 1.1% |
| Jamaican | 28 | 0.1% |
| Japanese | 14 | 0.0% |
| Kenyan | 7 | 0.0% |
| Korean | 208 | 0.4% |
| Latvian | 7 | 0.0% |
| Lebanese | 85 | 0.1% |
| Liberian | 4 | 0.0% |
| Luxembourger | 16 | 0.0% |
| Menominee | 20 | 0.0% |
| Mexican | 1,562 | 2.6% |
| Mexican American Indian | 27 | 0.0% |
| Moroccan | 7 | 0.0% |
| Navajo | 3 | 0.0% |
| Nicaraguan | 15 | 0.0% |
| Northern European | 42 | 0.1% |
| Norwegian | 15,484 | 25.8% |
| Pakistani | 4 | 0.0% |
| Pennsylvania German | 56 | 0.1% |
| Polish | 2,039 | 3.4% |
| Portuguese | 37 | 0.1% |
| Puerto Rican | 72 | 0.1% |
| Romanian | 11 | 0.0% |
| Russian | 534 | 0.9% |
| Salvadoran | 5 | 0.0% |
| Samoan | 16 | 0.0% |
| Scandinavian | 1,161 | 1.9% |
| Scotch-Irish | 250 | 0.4% |
| Scottish | 593 | 1.0% |
| Serbian | 40 | 0.1% |
| Sierra Leonean | 2 | 0.0% |
| Sioux | 182 | 0.3% |
| Slavic | 10 | 0.0% |
| Slovak | 35 | 0.1% |
| Slovene | 29 | 0.1% |
| Somali | 203 | 0.3% |
| South African | 21 | 0.0% |
| South American | 52 | 0.1% |
| Spaniard | 12 | 0.0% |
| Spanish | 148 | 0.3% |
| Spanish American | 3 | 0.0% |
| Sri Lankan | 40 | 0.1% |
| Subsaharan African | 260 | 0.4% |
| Swedish | 4,831 | 8.0% |
| Swiss | 100 | 0.2% |
| Syrian | 2 | 0.0% |
| Thai | 86 | 0.1% |
| Turkish | 3 | 0.0% |
| Ukrainian | 27 | 0.0% |
| Welsh | 128 | 0.2% |
| West Indian | 62 | 0.1% |
| Yugoslavian | 65 | 0.1% | View All 104 Rows |
Immigrants in Otter Tail County
The most numerous immigrant groups reported in Otter Tail County came from Latin America (787 | 1.3%), Central America (740 | 1.2%), Mexico (693 | 1.1%), Europe (235 | 0.4%), and Asia (230 | 0.4%), together accounting for 4.5% of all Otter Tail County residents.
| Immigration Origin | # Population | % Population |
| Africa | 199 | 0.3% |
| Asia | 230 | 0.4% |
| Austria | 2 | 0.0% |
| Belgium | 2 | 0.0% |
| Belize | 4 | 0.0% |
| Bosnia and Herzegovina | 65 | 0.1% |
| Brazil | 6 | 0.0% |
| Cambodia | 3 | 0.0% |
| Canada | 47 | 0.1% |
| Caribbean | 30 | 0.1% |
| Central America | 740 | 1.2% |
| China | 10 | 0.0% |
| Colombia | 3 | 0.0% |
| Czechoslovakia | 5 | 0.0% |
| Eastern Africa | 180 | 0.3% |
| Eastern Asia | 86 | 0.1% |
| Eastern Europe | 75 | 0.1% |
| Ecuador | 7 | 0.0% |
| El Salvador | 5 | 0.0% |
| England | 28 | 0.1% |
| Ethiopia | 35 | 0.1% |
| Europe | 235 | 0.4% |
| France | 3 | 0.0% |
| Germany | 49 | 0.1% |
| Guatemala | 32 | 0.1% |
| Honduras | 1 | 0.0% |
| India | 34 | 0.1% |
| Iran | 4 | 0.0% |
| Japan | 15 | 0.0% |
| Kazakhstan | 5 | 0.0% |
| Kenya | 7 | 0.0% |
| Korea | 61 | 0.1% |
| Latin America | 787 | 1.3% |
| Latvia | 1 | 0.0% |
| Mexico | 693 | 1.1% |
| Netherlands | 10 | 0.0% |
| Nicaragua | 5 | 0.0% |
| Northern Europe | 54 | 0.1% |
| Oceania | 14 | 0.0% |
| Philippines | 40 | 0.1% |
| Poland | 2 | 0.0% |
| Russia | 2 | 0.0% |
| Scotland | 3 | 0.0% |
| Somalia | 131 | 0.2% |
| South Africa | 19 | 0.0% |
| South America | 17 | 0.0% |
| South Central Asia | 65 | 0.1% |
| South Eastern Asia | 79 | 0.1% |
| Southern Europe | 7 | 0.0% |
| Spain | 7 | 0.0% |
| Sweden | 5 | 0.0% |
| Switzerland | 33 | 0.1% |
| Thailand | 3 | 0.0% |
| Trinidad and Tobago | 28 | 0.1% |
| Uzbekistan | 22 | 0.0% |
| Vietnam | 33 | 0.1% |
| Western Europe | 99 | 0.2% | View All 57 Rows |
Sex and Age in Otter Tail County
Sex and Age in Otter Tail County
The most populous age groups in Otter Tail County are 60 to 64 Years (2,507 | 8.3%) for men and 60 to 64 Years (2,512 | 8.5%) for women.
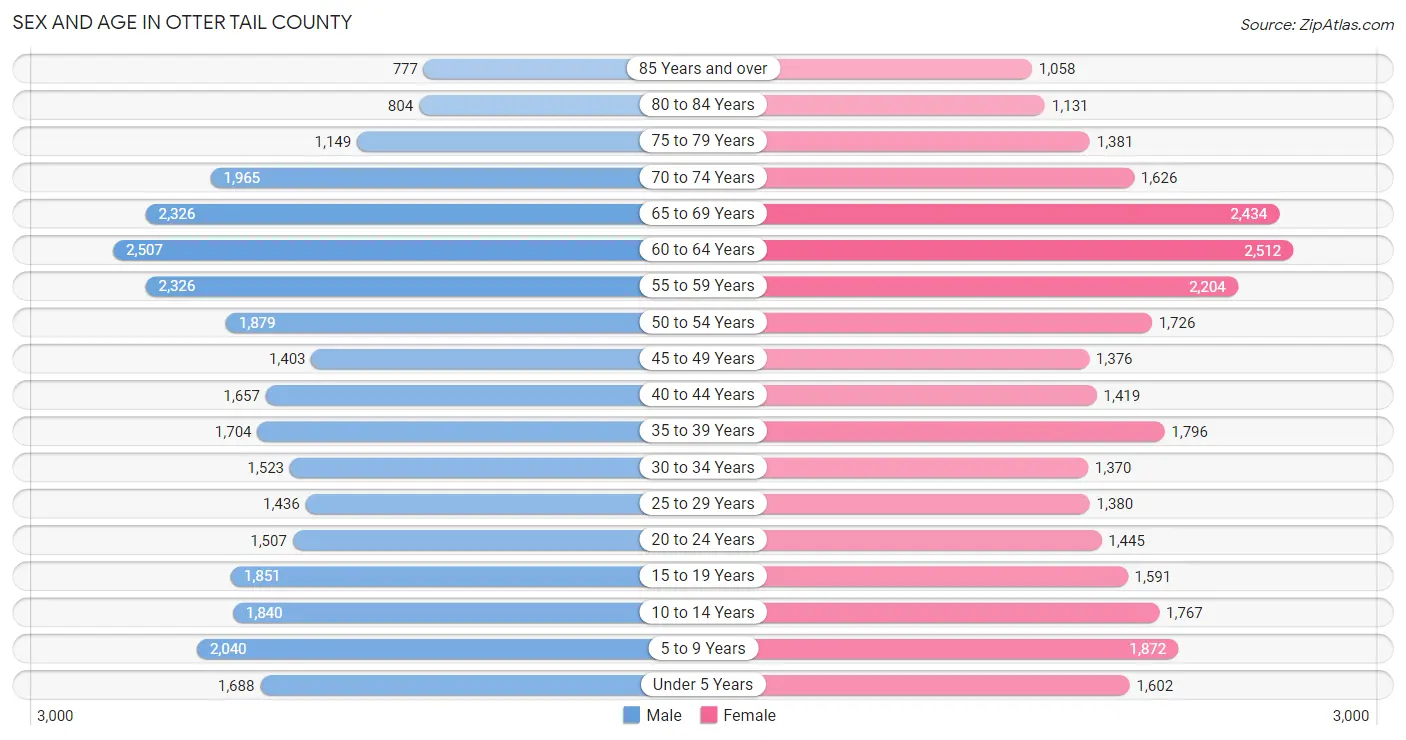
| Age Bracket | Male | Female |
| Under 5 Years | 1,688 (5.6%) | 1,602 (5.4%) |
| 5 to 9 Years | 2,040 (6.7%) | 1,872 (6.3%) |
| 10 to 14 Years | 1,840 (6.1%) | 1,767 (5.9%) |
| 15 to 19 Years | 1,851 (6.1%) | 1,591 (5.4%) |
| 20 to 24 Years | 1,507 (5.0%) | 1,445 (4.9%) |
| 25 to 29 Years | 1,436 (4.7%) | 1,380 (4.6%) |
| 30 to 34 Years | 1,523 (5.0%) | 1,370 (4.6%) |
| 35 to 39 Years | 1,704 (5.6%) | 1,796 (6.0%) |
| 40 to 44 Years | 1,657 (5.4%) | 1,419 (4.8%) |
| 45 to 49 Years | 1,403 (4.6%) | 1,376 (4.6%) |
| 50 to 54 Years | 1,879 (6.2%) | 1,726 (5.8%) |
| 55 to 59 Years | 2,326 (7.7%) | 2,204 (7.4%) |
| 60 to 64 Years | 2,507 (8.3%) | 2,512 (8.5%) |
| 65 to 69 Years | 2,326 (7.7%) | 2,434 (8.2%) |
| 70 to 74 Years | 1,965 (6.5%) | 1,626 (5.5%) |
| 75 to 79 Years | 1,149 (3.8%) | 1,381 (4.6%) |
| 80 to 84 Years | 804 (2.6%) | 1,131 (3.8%) |
| 85 Years and over | 777 (2.6%) | 1,058 (3.6%) |
| Total | 30,382 (100.0%) | 29,690 (100.0%) |
Families and Households in Otter Tail County
Median Family Size in Otter Tail County
The median family size in Otter Tail County is 2.93 persons per family, with single male/father families (976 | 6.0%) accounting for the largest median family size of 3 persons per family. On the other hand, single female/mother families (1,688 | 10.4%) represent the smallest median family size with 2.91 persons per family.
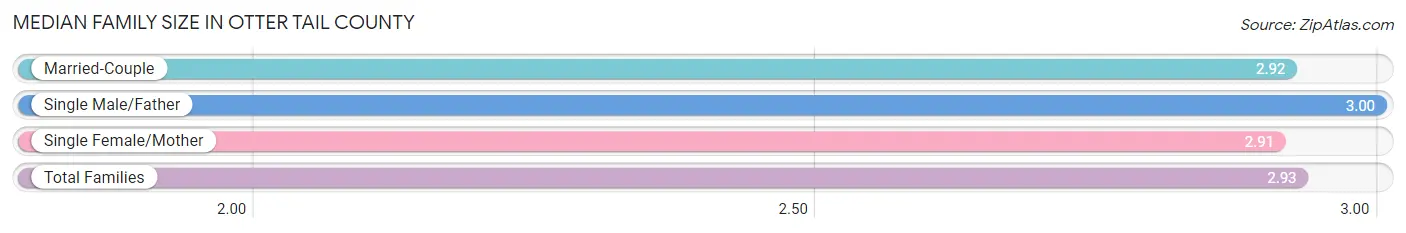
| Family Type | # Families | Family Size |
| Married-Couple | 13,628 (83.7%) | 2.92 |
| Single Male/Father | 976 (6.0%) | 3.00 |
| Single Female/Mother | 1,688 (10.4%) | 2.91 |
| Total Families | 16,292 (100.0%) | 2.93 |
Median Household Size in Otter Tail County
The median household size in Otter Tail County is 2.36 persons per household, with single male/father households (976 | 3.9%) accounting for the largest median household size of 3.34 persons per household. non-family households (8,618 | 34.6%) represent the smallest median household size with 1.18 persons per household.
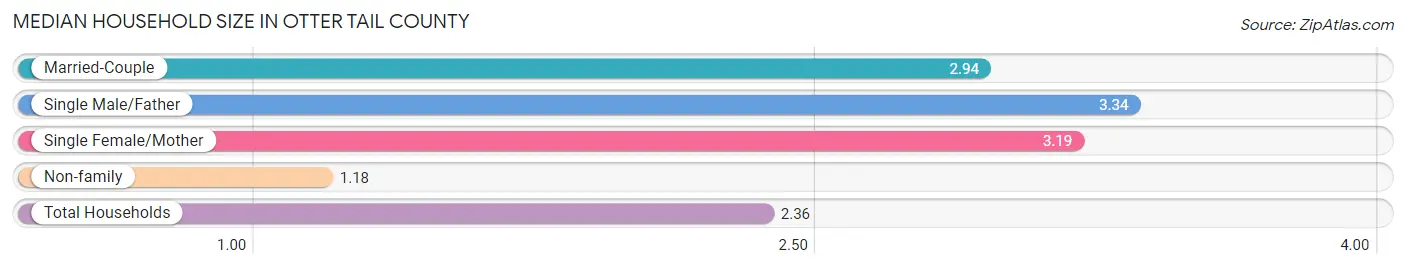
| Household Type | # Households | Household Size |
| Married-Couple | 13,628 (54.7%) | 2.94 |
| Single Male/Father | 976 (3.9%) | 3.34 |
| Single Female/Mother | 1,688 (6.8%) | 3.19 |
| Non-family | 8,618 (34.6%) | 1.18 |
| Total Households | 24,910 (100.0%) | 2.36 |
Household Size by Marriage Status in Otter Tail County
Out of a total of 24,910 households in Otter Tail County, 16,292 (65.4%) are family households, while 8,618 (34.6%) are nonfamily households. The most numerous type of family households are 2-person households, comprising 9,191, and the most common type of nonfamily households are 1-person households, comprising 7,359.
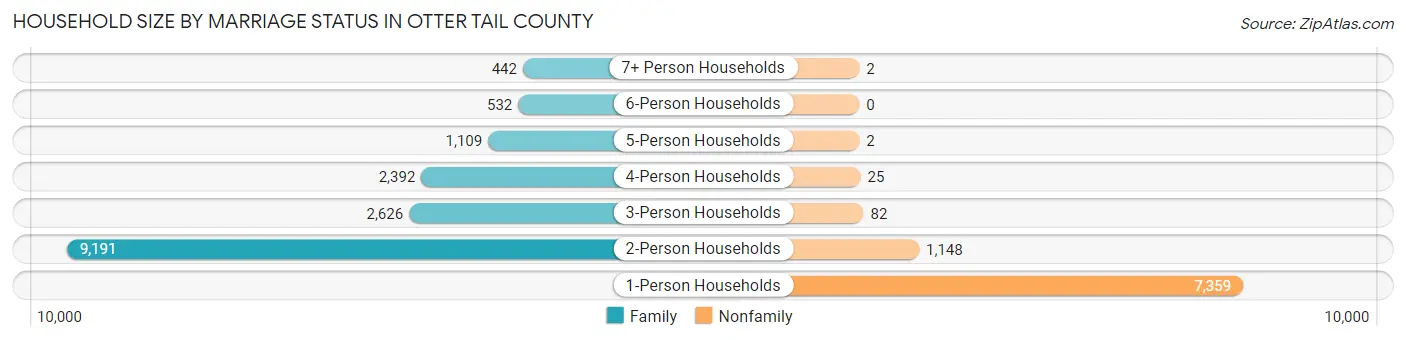
| Household Size | Family Households | Nonfamily Households |
| 1-Person Households | - | 7,359 (29.5%) |
| 2-Person Households | 9,191 (36.9%) | 1,148 (4.6%) |
| 3-Person Households | 2,626 (10.5%) | 82 (0.3%) |
| 4-Person Households | 2,392 (9.6%) | 25 (0.1%) |
| 5-Person Households | 1,109 (4.4%) | 2 (0.0%) |
| 6-Person Households | 532 (2.1%) | 0 (0.0%) |
| 7+ Person Households | 442 (1.8%) | 2 (0.0%) |
| Total | 16,292 (65.4%) | 8,618 (34.6%) |
Female Fertility in Otter Tail County
Fertility by Age in Otter Tail County
Average fertility rate in Otter Tail County is 68.0 births per 1,000 women. Women in the age bracket of 20 to 34 years have the highest fertility rate with 124.0 births per 1,000 women. Women in the age bracket of 20 to 34 years acount for 72.2% of all women with births.
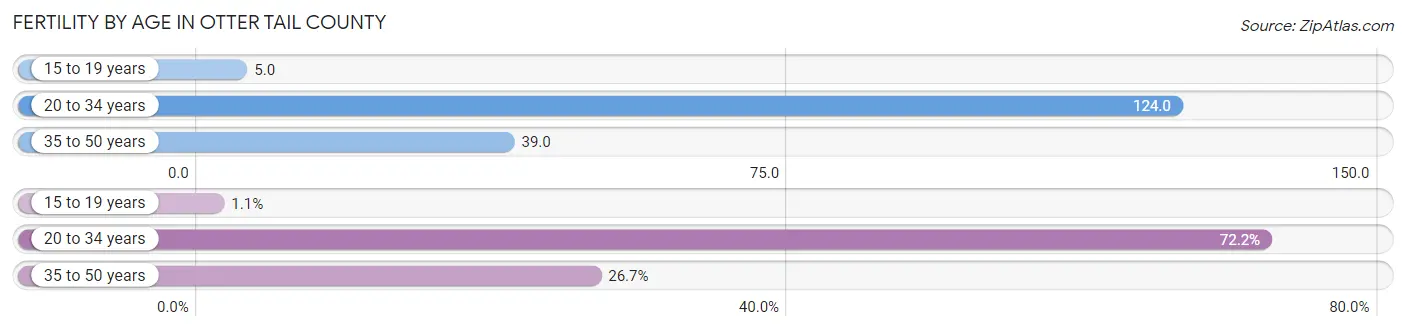
| Age Bracket | Women with Births | Births / 1,000 Women |
| 15 to 19 years | 8 (1.1%) | 5.0 |
| 20 to 34 years | 522 (72.2%) | 124.0 |
| 35 to 50 years | 193 (26.7%) | 39.0 |
| Total | 723 (100.0%) | 68.0 |
Fertility by Age by Marriage Status in Otter Tail County
76.8% of women with births (723) in Otter Tail County are married. The highest percentage of unmarried women with births falls into 15 to 19 years age bracket with 100.0% of them unmarried at the time of birth, while the lowest percentage of unmarried women with births belong to 35 to 50 years age bracket with 16.1% of them unmarried.
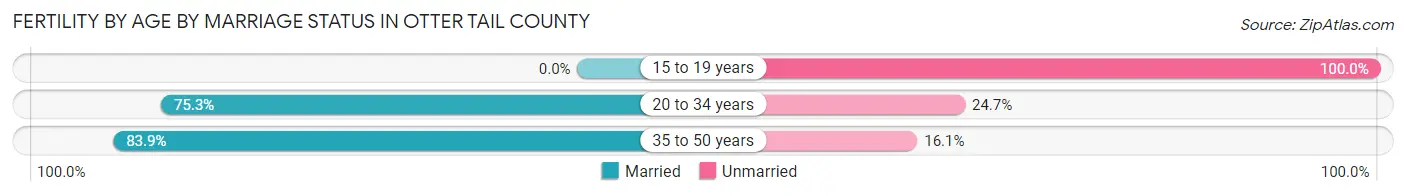
| Age Bracket | Married | Unmarried |
| 15 to 19 years | 0 (0.0%) | 8 (100.0%) |
| 20 to 34 years | 393 (75.3%) | 129 (24.7%) |
| 35 to 50 years | 162 (83.9%) | 31 (16.1%) |
| Total | 555 (76.8%) | 168 (23.2%) |
Fertility by Education in Otter Tail County
Average fertility rate in Otter Tail County is 68.0 births per 1,000 women. Women with the education attainment of graduate degree have the highest fertility rate of 128.0 births per 1,000 women, while women with the education attainment of less than high school have the lowest fertility at 18.0 births per 1,000 women. Women with the education attainment of college or associate's degree represent 49.6% of all women with births.
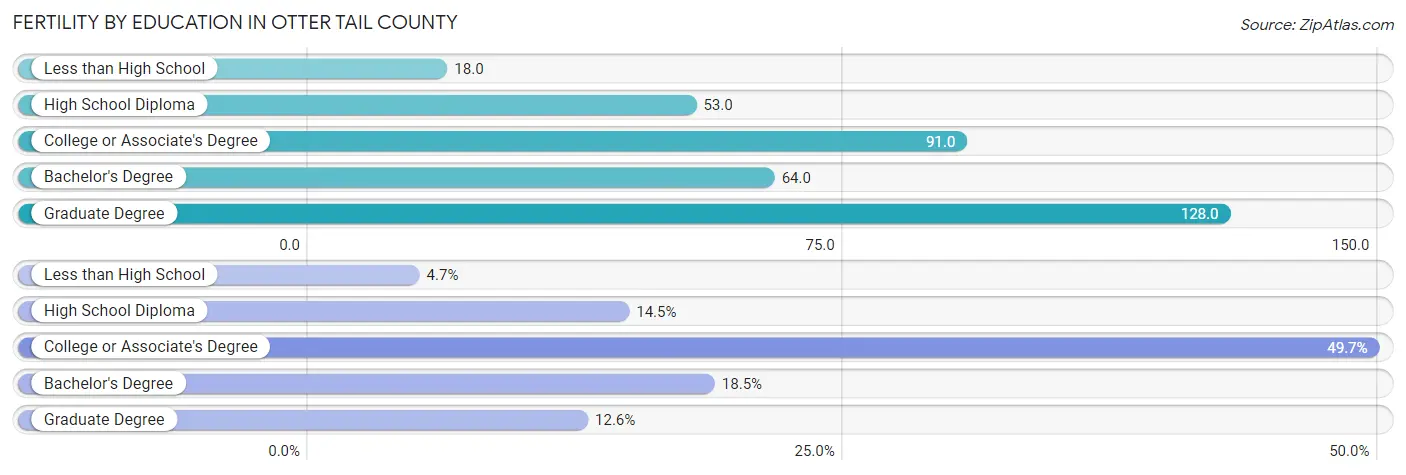
| Educational Attainment | Women with Births | Births / 1,000 Women |
| Less than High School | 34 (4.7%) | 18.0 |
| High School Diploma | 105 (14.5%) | 53.0 |
| College or Associate's Degree | 359 (49.6%) | 91.0 |
| Bachelor's Degree | 134 (18.5%) | 64.0 |
| Graduate Degree | 91 (12.6%) | 128.0 |
| Total | 723 (100.0%) | 68.0 |
Fertility by Education by Marriage Status in Otter Tail County
23.2% of women with births in Otter Tail County are unmarried. Women with the educational attainment of graduate degree are most likely to be married with 100.0% of them married at childbirth, while women with the educational attainment of high school diploma are least likely to be married with 59.1% of them unmarried at childbirth.
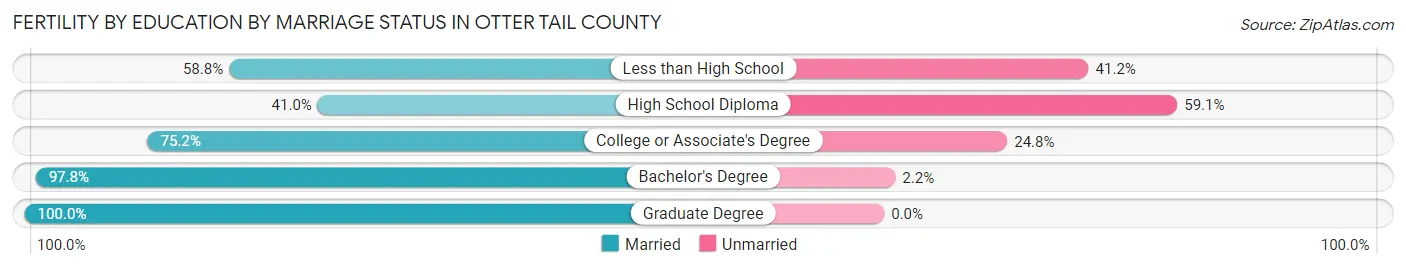
| Educational Attainment | Married | Unmarried |
| Less than High School | 20 (58.8%) | 14 (41.2%) |
| High School Diploma | 43 (40.9%) | 62 (59.1%) |
| College or Associate's Degree | 270 (75.2%) | 89 (24.8%) |
| Bachelor's Degree | 131 (97.8%) | 3 (2.2%) |
| Graduate Degree | 91 (100.0%) | 0 (0.0%) |
| Total | 555 (76.8%) | 168 (23.2%) |
Income in Otter Tail County
Income Overview in Otter Tail County
Per Capita Income in Otter Tail County is $37,202, while median incomes of families and households are $87,557 and $67,990 respectively.
| Characteristic | Number | Measure |
| Per Capita Income | 60,072 | $37,202 |
| Median Family Income | 16,292 | $87,557 |
| Mean Family Income | 16,292 | $105,297 |
| Median Household Income | 24,910 | $67,990 |
| Mean Household Income | 24,910 | $86,947 |
| Income Deficit | 16,292 | $11,371 |
| Wage / Income Gap (%) | 60,072 | 34.44% |
| Wage / Income Gap ($) | 60,072 | 65.56¢ per $1 |
| Gini / Inequality Index | 60,072 | 0.43 |
Earnings by Sex in Otter Tail County
Average Earnings in Otter Tail County are $40,446, $48,577 for men and $31,846 for women, a difference of 34.4%.
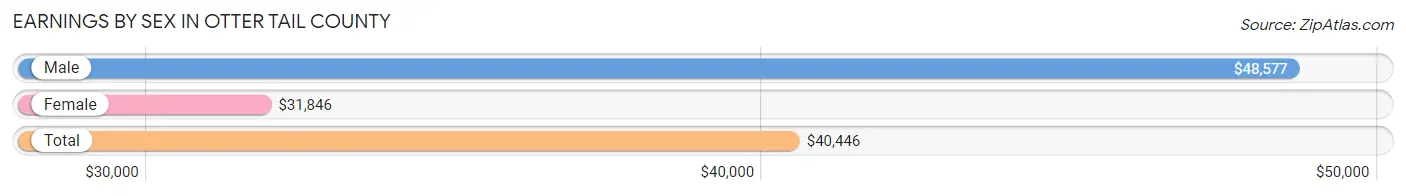
| Sex | Number | Average Earnings |
| Male | 17,105 (53.7%) | $48,577 |
| Female | 14,717 (46.3%) | $31,846 |
| Total | 31,822 (100.0%) | $40,446 |
Earnings by Sex by Income Bracket in Otter Tail County
The most common earnings brackets in Otter Tail County are $100,000+ for men (2,148 | 12.6%) and $30,000 to $34,999 for women (1,111 | 7.5%).
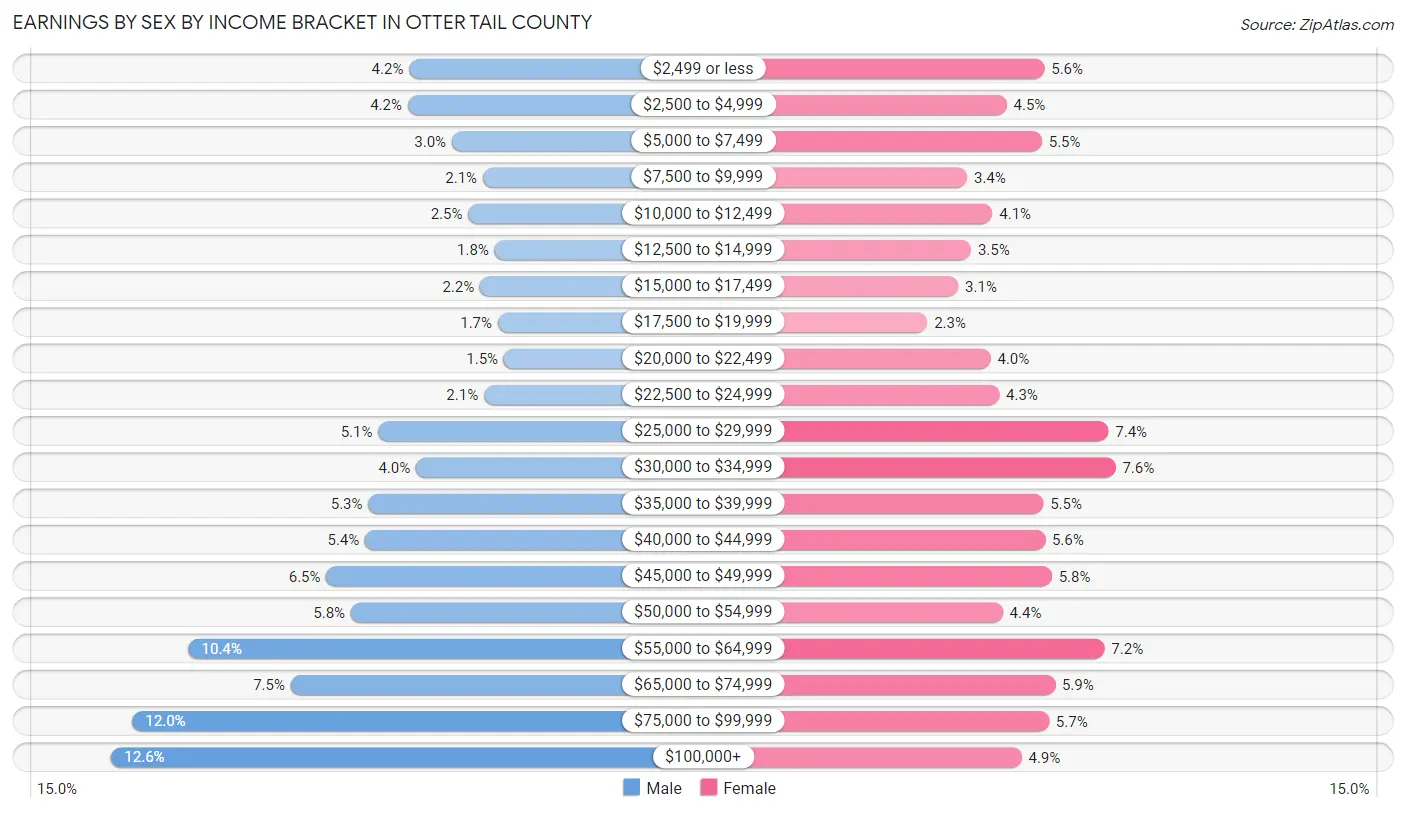
| Income | Male | Female |
| $2,499 or less | 717 (4.2%) | 817 (5.6%) |
| $2,500 to $4,999 | 723 (4.2%) | 661 (4.5%) |
| $5,000 to $7,499 | 512 (3.0%) | 806 (5.5%) |
| $7,500 to $9,999 | 363 (2.1%) | 498 (3.4%) |
| $10,000 to $12,499 | 433 (2.5%) | 602 (4.1%) |
| $12,500 to $14,999 | 306 (1.8%) | 514 (3.5%) |
| $15,000 to $17,499 | 376 (2.2%) | 460 (3.1%) |
| $17,500 to $19,999 | 290 (1.7%) | 332 (2.3%) |
| $20,000 to $22,499 | 262 (1.5%) | 594 (4.0%) |
| $22,500 to $24,999 | 358 (2.1%) | 630 (4.3%) |
| $25,000 to $29,999 | 866 (5.1%) | 1,082 (7.3%) |
| $30,000 to $34,999 | 685 (4.0%) | 1,111 (7.5%) |
| $35,000 to $39,999 | 913 (5.3%) | 812 (5.5%) |
| $40,000 to $44,999 | 929 (5.4%) | 820 (5.6%) |
| $45,000 to $49,999 | 1,115 (6.5%) | 848 (5.8%) |
| $50,000 to $54,999 | 998 (5.8%) | 644 (4.4%) |
| $55,000 to $64,999 | 1,777 (10.4%) | 1,066 (7.2%) |
| $65,000 to $74,999 | 1,286 (7.5%) | 861 (5.9%) |
| $75,000 to $99,999 | 2,048 (12.0%) | 836 (5.7%) |
| $100,000+ | 2,148 (12.6%) | 723 (4.9%) |
| Total | 17,105 (100.0%) | 14,717 (100.0%) |
Earnings by Sex by Educational Attainment in Otter Tail County
Average earnings in Otter Tail County are $53,354 for men and $35,540 for women, a difference of 33.4%. Men with an educational attainment of graduate degree enjoy the highest average annual earnings of $75,280, while those with less than high school education earn the least with $38,103. Women with an educational attainment of graduate degree earn the most with the average annual earnings of $68,854, while those with high school diploma education have the smallest earnings of $24,330.
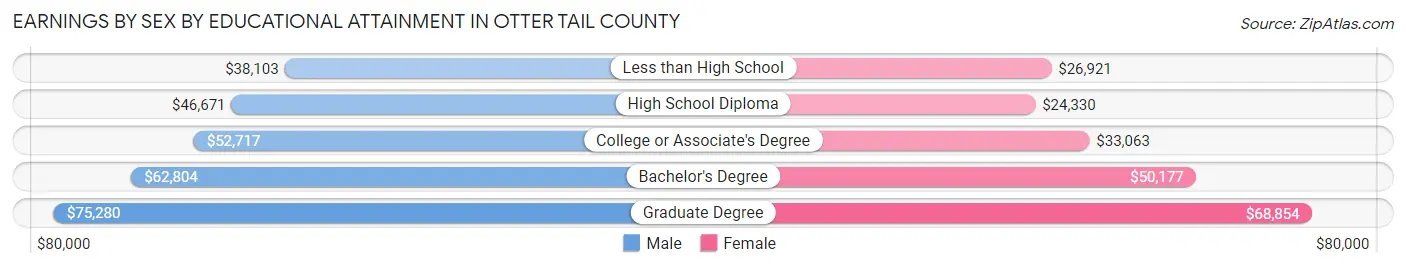
| Educational Attainment | Male Income | Female Income |
| Less than High School | $38,103 | $26,921 |
| High School Diploma | $46,671 | $24,330 |
| College or Associate's Degree | $52,717 | $33,063 |
| Bachelor's Degree | $62,804 | $50,177 |
| Graduate Degree | $75,280 | $68,854 |
| Total | $53,354 | $35,540 |
Family Income in Otter Tail County
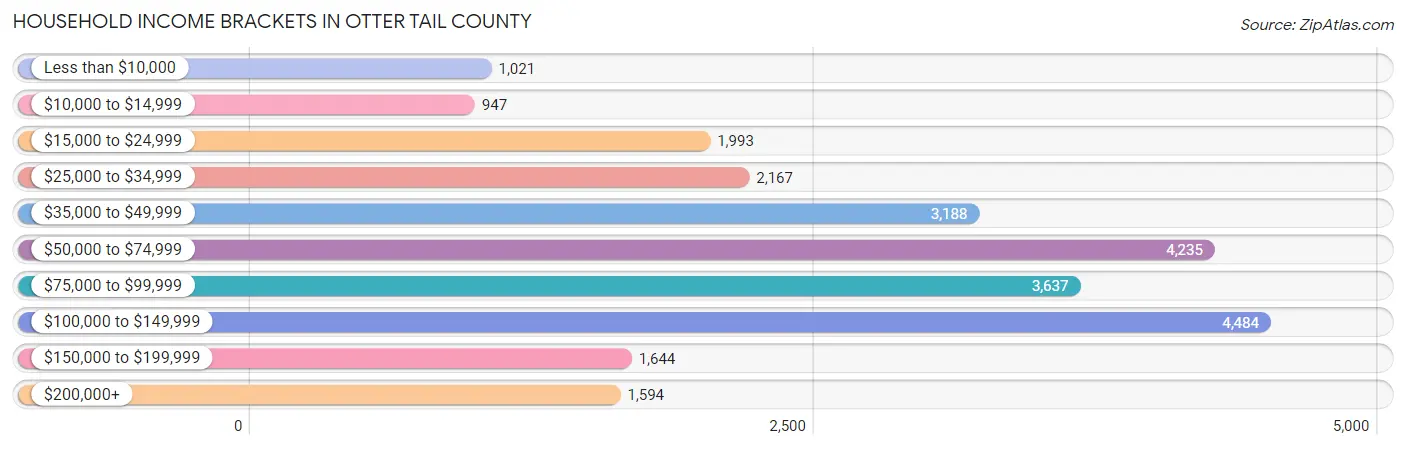
Family Income Brackets in Otter Tail County
According to the Otter Tail County family income data, there are 3,861 families falling into the $100,000 to $149,999 income range, which is the most common income bracket and makes up 23.7% of all families. Conversely, the $10,000 to $14,999 income bracket is the least frequent group with only 163 families (1.0%) belonging to this category.
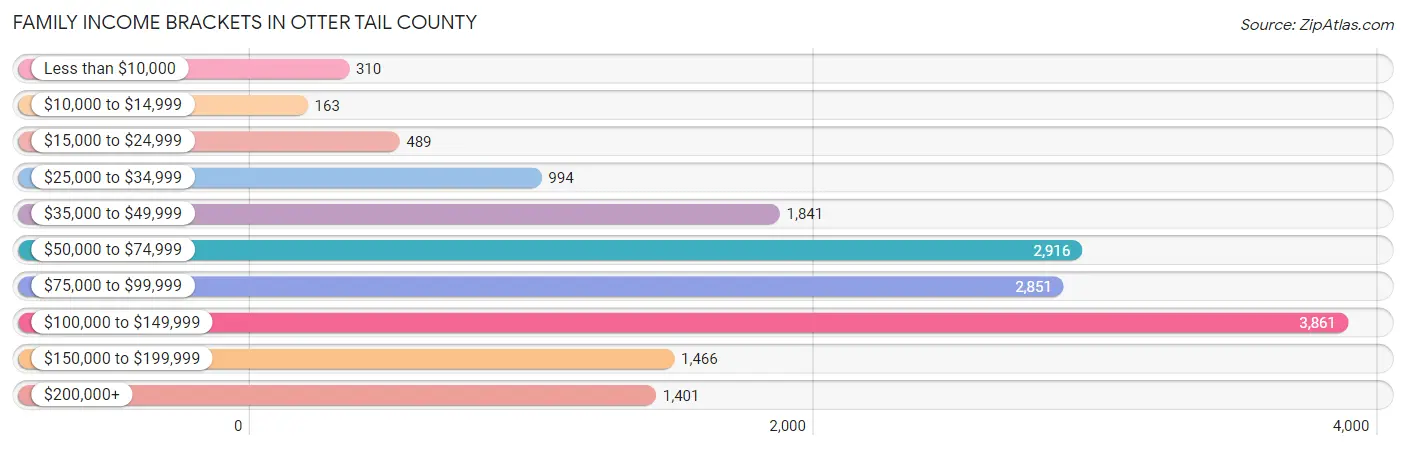
| Income Bracket | # Families | % Families |
| Less than $10,000 | 310 | 1.9% |
| $10,000 to $14,999 | 163 | 1.0% |
| $15,000 to $24,999 | 489 | 3.0% |
| $25,000 to $34,999 | 994 | 6.1% |
| $35,000 to $49,999 | 1,841 | 11.3% |
| $50,000 to $74,999 | 2,916 | 17.9% |
| $75,000 to $99,999 | 2,851 | 17.5% |
| $100,000 to $149,999 | 3,861 | 23.7% |
| $150,000 to $199,999 | 1,466 | 9.0% |
| $200,000+ | 1,401 | 8.6% |
Family Income by Famaliy Size in Otter Tail County
5-person families (998 | 6.1%) account for the highest median family income in Otter Tail County with $113,229 per family, while 2-person families (9,499 | 58.3%) have the highest median income of $39,517 per family member.
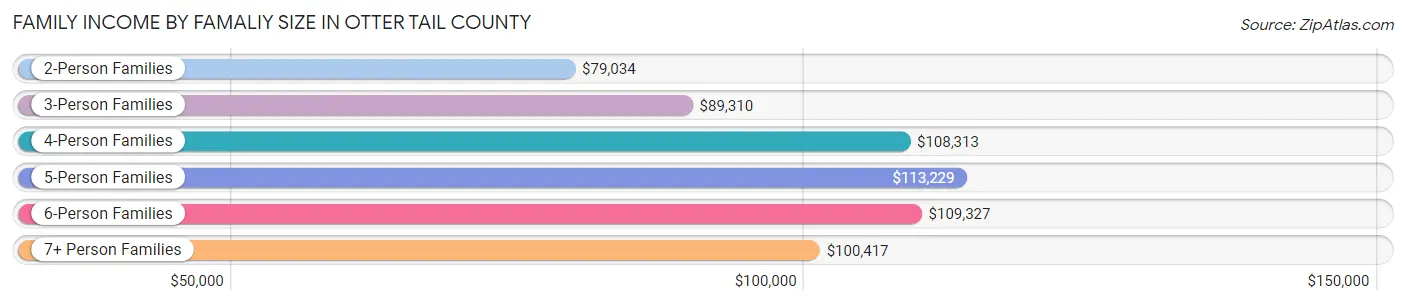
| Income Bracket | # Families | Median Income |
| 2-Person Families | 9,499 (58.3%) | $79,034 |
| 3-Person Families | 2,584 (15.9%) | $89,310 |
| 4-Person Families | 2,347 (14.4%) | $108,313 |
| 5-Person Families | 998 (6.1%) | $113,229 |
| 6-Person Families | 437 (2.7%) | $109,327 |
| 7+ Person Families | 427 (2.6%) | $100,417 |
| Total | 16,292 (100.0%) | $87,557 |
Family Income by Number of Earners in Otter Tail County
The median family income in Otter Tail County is $87,557, with families comprising 3+ earners (1,591) having the highest median family income of $142,102, while families with no earners (3,165) have the lowest median family income of $56,449, accounting for 9.8% and 19.4% of families, respectively.
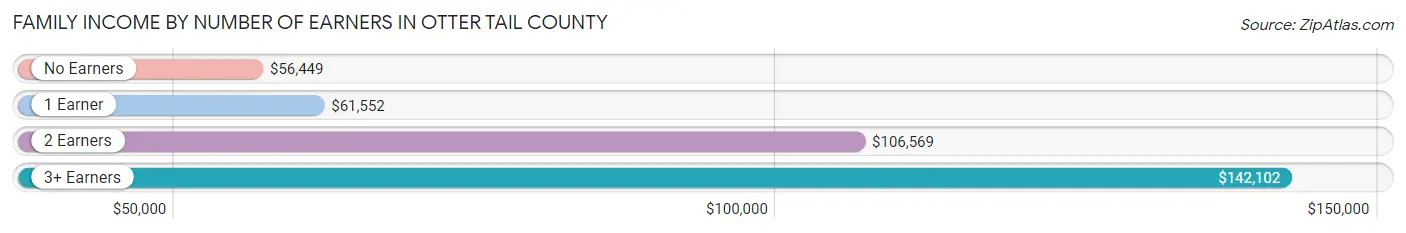
| Number of Earners | # Families | Median Income |
| No Earners | 3,165 (19.4%) | $56,449 |
| 1 Earner | 4,230 (26.0%) | $61,552 |
| 2 Earners | 7,306 (44.8%) | $106,569 |
| 3+ Earners | 1,591 (9.8%) | $142,102 |
| Total | 16,292 (100.0%) | $87,557 |
Household Income in Otter Tail County
Household Income Brackets in Otter Tail County
With 4,484 households falling in the category, the $100,000 to $149,999 income range is the most frequent in Otter Tail County, accounting for 18.0% of all households. In contrast, only 947 households (3.8%) fall into the $10,000 to $14,999 income bracket, making it the least populous group.
| Income Bracket | # Households | % Households |
| Less than $10,000 | 1,021 | 4.1% |
| $10,000 to $14,999 | 947 | 3.8% |
| $15,000 to $24,999 | 1,993 | 8.0% |
| $25,000 to $34,999 | 2,167 | 8.7% |
| $35,000 to $49,999 | 3,188 | 12.8% |
| $50,000 to $74,999 | 4,235 | 17.0% |
| $75,000 to $99,999 | 3,637 | 14.6% |
| $100,000 to $149,999 | 4,484 | 18.0% |
| $150,000 to $199,999 | 1,644 | 6.6% |
| $200,000+ | 1,594 | 6.4% |
Household Income by Householder Age in Otter Tail County
The median household income in Otter Tail County is $67,990, with the highest median household income of $84,213 found in the 25 to 44 years age bracket for the primary householder. A total of 6,140 households (24.6%) fall into this category. Meanwhile, the 15 to 24 years age bracket for the primary householder has the lowest median household income of $41,955, with 888 households (3.6%) in this group.
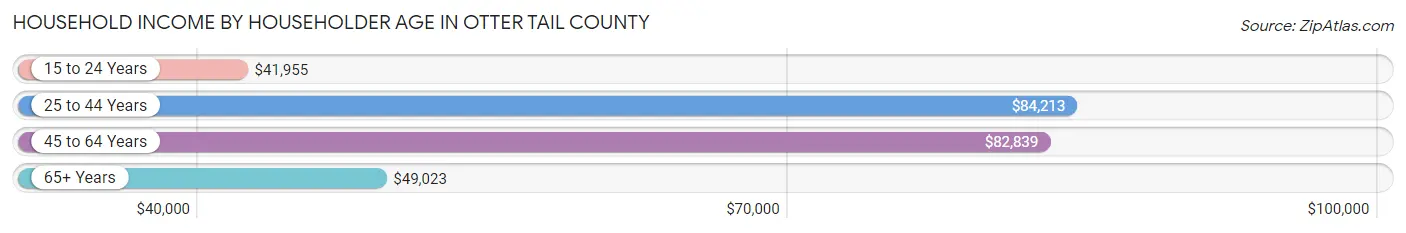
| Income Bracket | # Households | Median Income |
| 15 to 24 Years | 888 (3.6%) | $41,955 |
| 25 to 44 Years | 6,140 (24.6%) | $84,213 |
| 45 to 64 Years | 9,012 (36.2%) | $82,839 |
| 65+ Years | 8,870 (35.6%) | $49,023 |
| Total | 24,910 (100.0%) | $67,990 |
Poverty in Otter Tail County
Income Below Poverty by Sex and Age in Otter Tail County
With 8.1% poverty level for males and 9.2% for females among the residents of Otter Tail County, 12 to 14 year old males and 18 to 24 year old females are the most vulnerable to poverty, with 166 males (15.4%) and 350 females (18.4%) in their respective age groups living below the poverty level.
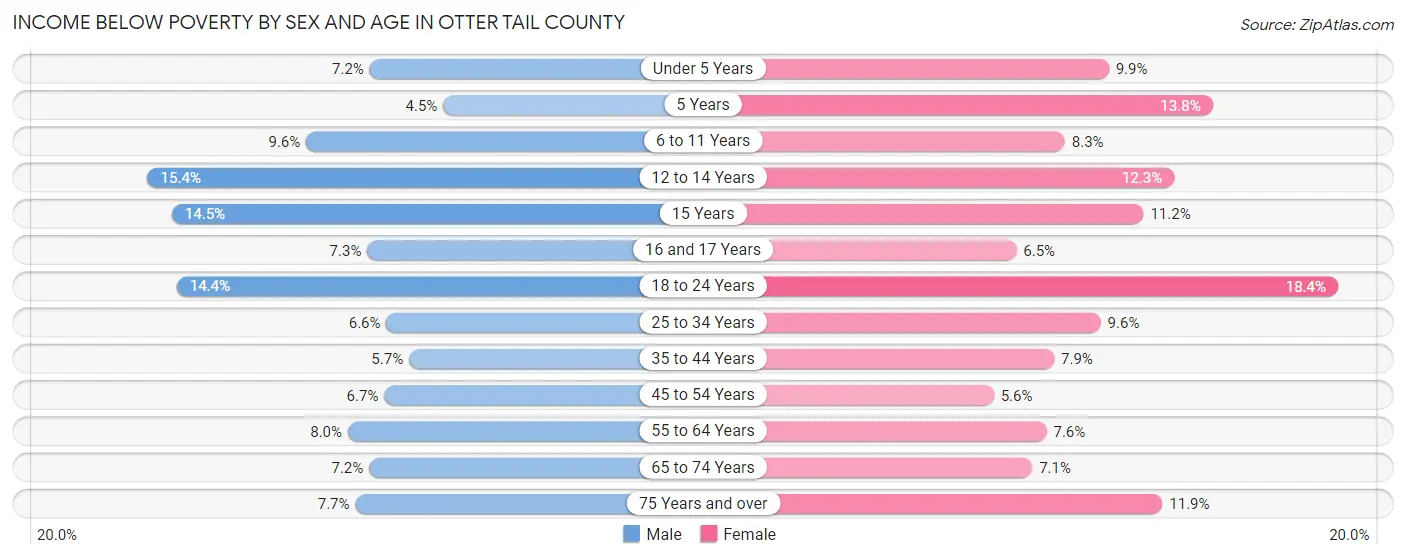
| Age Bracket | Male | Female |
| Under 5 Years | 119 (7.2%) | 155 (9.9%) |
| 5 Years | 17 (4.5%) | 64 (13.8%) |
| 6 to 11 Years | 226 (9.6%) | 167 (8.3%) |
| 12 to 14 Years | 166 (15.4%) | 136 (12.3%) |
| 15 Years | 52 (14.5%) | 44 (11.2%) |
| 16 and 17 Years | 57 (7.3%) | 43 (6.5%) |
| 18 to 24 Years | 304 (14.3%) | 350 (18.4%) |
| 25 to 34 Years | 194 (6.6%) | 264 (9.6%) |
| 35 to 44 Years | 191 (5.7%) | 253 (7.9%) |
| 45 to 54 Years | 218 (6.7%) | 175 (5.6%) |
| 55 to 64 Years | 386 (8.0%) | 357 (7.6%) |
| 65 to 74 Years | 303 (7.2%) | 283 (7.1%) |
| 75 Years and over | 199 (7.7%) | 387 (11.9%) |
| Total | 2,432 (8.1%) | 2,678 (9.2%) |
Income Above Poverty by Sex and Age in Otter Tail County
According to the poverty statistics in Otter Tail County, males aged 5 years and females aged 45 to 54 years are the age groups that are most secure financially, with 95.5% of males and 94.4% of females in these age groups living above the poverty line.
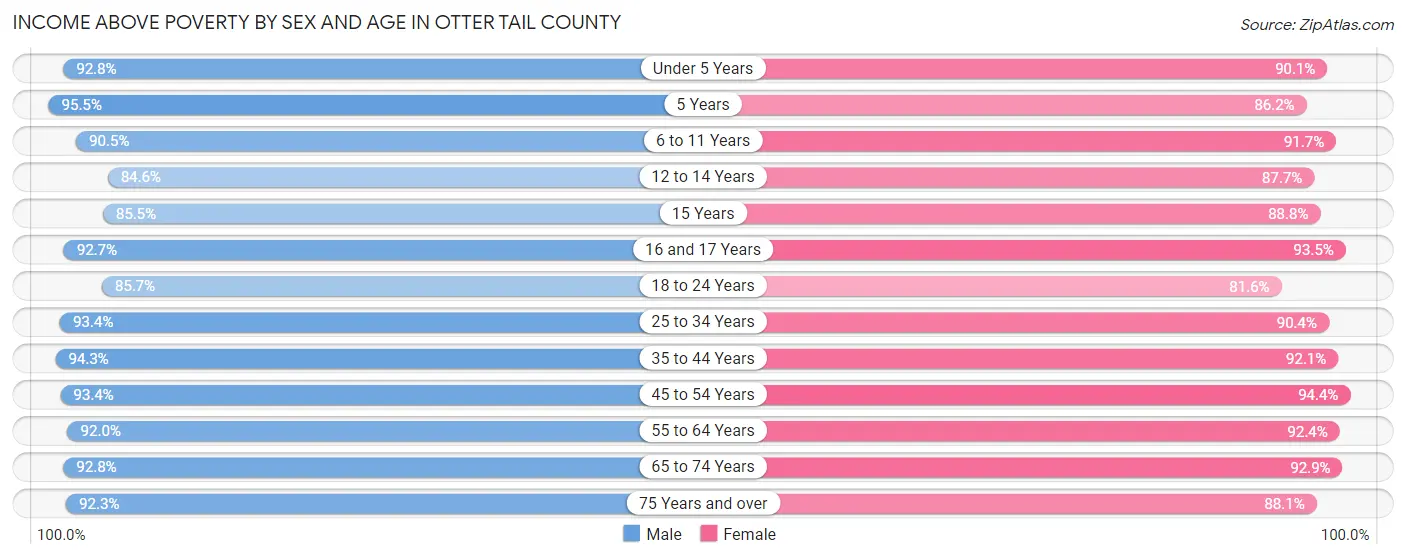
| Age Bracket | Male | Female |
| Under 5 Years | 1,537 (92.8%) | 1,409 (90.1%) |
| 5 Years | 364 (95.5%) | 401 (86.2%) |
| 6 to 11 Years | 2,141 (90.4%) | 1,849 (91.7%) |
| 12 to 14 Years | 910 (84.6%) | 967 (87.7%) |
| 15 Years | 306 (85.5%) | 349 (88.8%) |
| 16 and 17 Years | 726 (92.7%) | 621 (93.5%) |
| 18 to 24 Years | 1,814 (85.7%) | 1,551 (81.6%) |
| 25 to 34 Years | 2,760 (93.4%) | 2,482 (90.4%) |
| 35 to 44 Years | 3,145 (94.3%) | 2,959 (92.1%) |
| 45 to 54 Years | 3,059 (93.3%) | 2,927 (94.4%) |
| 55 to 64 Years | 4,441 (92.0%) | 4,340 (92.4%) |
| 65 to 74 Years | 3,897 (92.8%) | 3,717 (92.9%) |
| 75 Years and over | 2,378 (92.3%) | 2,864 (88.1%) |
| Total | 27,478 (91.9%) | 26,436 (90.8%) |
Income Below Poverty Among Married-Couple Families in Otter Tail County
The poverty statistics for married-couple families in Otter Tail County show that 2.4% or 330 of the total 13,628 families live below the poverty line. Families with 5 or more children have the highest poverty rate of 14.7%, comprising of 36 families. On the other hand, families with 1 or 2 children have the lowest poverty rate of 1.2%, which includes 37 families.
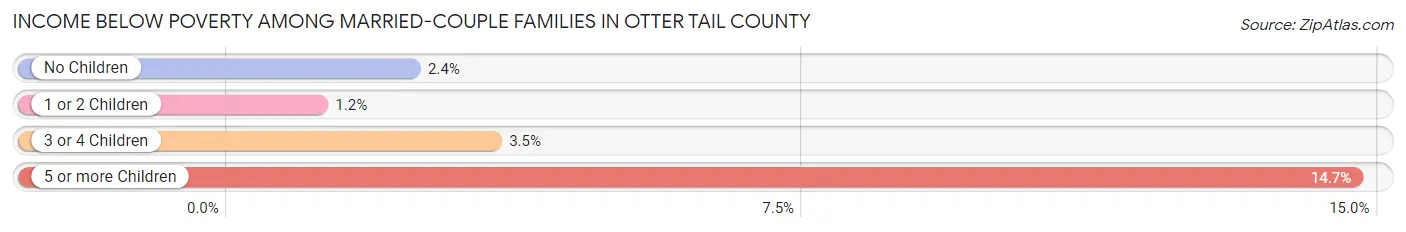
| Children | Above Poverty | Below Poverty |
| No Children | 8,898 (97.6%) | 218 (2.4%) |
| 1 or 2 Children | 3,100 (98.8%) | 37 (1.2%) |
| 3 or 4 Children | 1,091 (96.6%) | 39 (3.5%) |
| 5 or more Children | 209 (85.3%) | 36 (14.7%) |
| Total | 13,298 (97.6%) | 330 (2.4%) |
Income Below Poverty Among Single-Parent Households in Otter Tail County
According to the poverty data in Otter Tail County, 7.6% or 74 single-father households and 22.0% or 371 single-mother households are living below the poverty line. Among single-father households, those with 1 or 2 children have the highest poverty rate, with 35 households (8.8%) experiencing poverty. Likewise, among single-mother households, those with 5 or more children have the highest poverty rate, with 51 households (96.2%) falling below the poverty line.
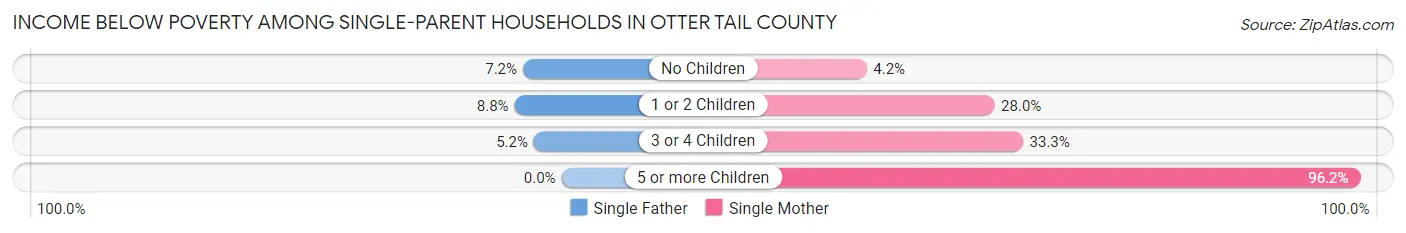
| Children | Single Father | Single Mother |
| No Children | 34 (7.2%) | 26 (4.2%) |
| 1 or 2 Children | 35 (8.8%) | 243 (28.0%) |
| 3 or 4 Children | 5 (5.1%) | 51 (33.3%) |
| 5 or more Children | 0 (0.0%) | 51 (96.2%) |
| Total | 74 (7.6%) | 371 (22.0%) |
Income Below Poverty Among Married-Couple vs Single-Parent Households in Otter Tail County
The poverty data for Otter Tail County shows that 330 of the married-couple family households (2.4%) and 445 of the single-parent households (16.7%) are living below the poverty level. Within the married-couple family households, those with 5 or more children have the highest poverty rate, with 36 households (14.7%) falling below the poverty line. Among the single-parent households, those with 5 or more children have the highest poverty rate, with 51 household (85.0%) living below poverty.
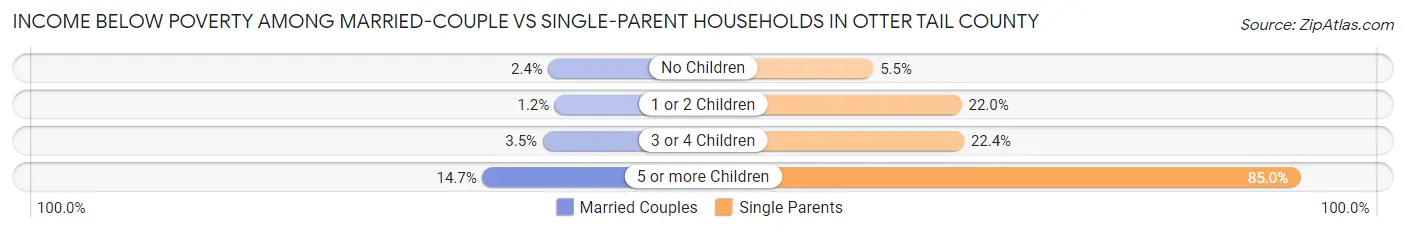
| Children | Married-Couple Families | Single-Parent Households |
| No Children | 218 (2.4%) | 60 (5.5%) |
| 1 or 2 Children | 37 (1.2%) | 278 (22.0%) |
| 3 or 4 Children | 39 (3.5%) | 56 (22.4%) |
| 5 or more Children | 36 (14.7%) | 51 (85.0%) |
| Total | 330 (2.4%) | 445 (16.7%) |
Employment Characteristics in Otter Tail County
Employment by Class of Employer in Otter Tail County
Among the 27,776 employed individuals in Otter Tail County, private company employees (17,264 | 62.2%), not-for-profit organizations (2,816 | 10.1%), and local government employees (2,392 | 8.6%) make up the most common classes of employment.
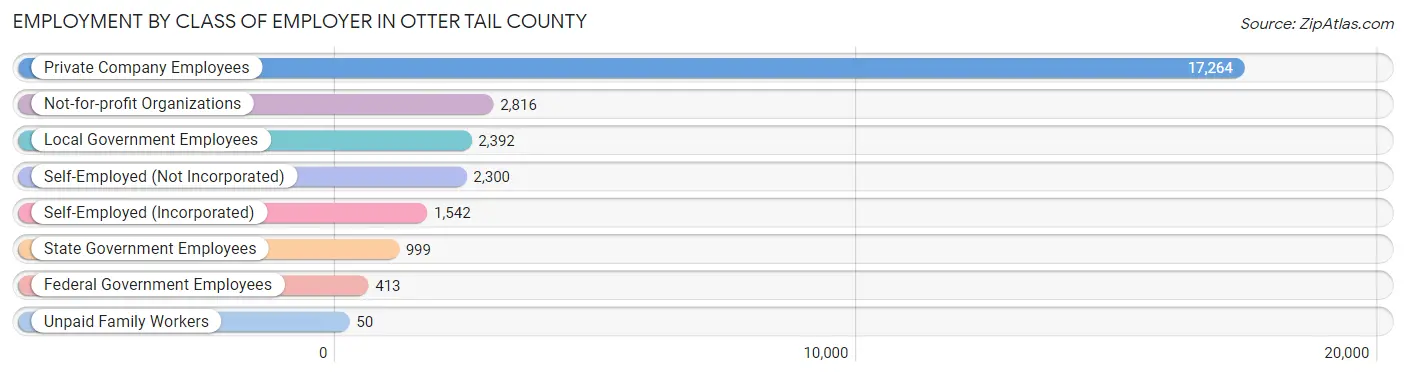
| Employer Class | # Employees | % Employees |
| Private Company Employees | 17,264 | 62.2% |
| Self-Employed (Incorporated) | 1,542 | 5.6% |
| Self-Employed (Not Incorporated) | 2,300 | 8.3% |
| Not-for-profit Organizations | 2,816 | 10.1% |
| Local Government Employees | 2,392 | 8.6% |
| State Government Employees | 999 | 3.6% |
| Federal Government Employees | 413 | 1.5% |
| Unpaid Family Workers | 50 | 0.2% |
| Total | 27,776 | 100.0% |
Employment Status by Age in Otter Tail County
According to the labor force statistics for Otter Tail County, out of the total population over 16 years of age (48,511), 61.5% or 29,834 individuals are in the labor force, with 5.3% or 1,581 of them unemployed. The age group with the highest labor force participation rate is 25 to 29 years, with 90.5% or 2,548 individuals in the labor force. Within the labor force, the 20 to 24 years age range has the highest percentage of unemployed individuals, with 11.4% or 291 of them being unemployed.
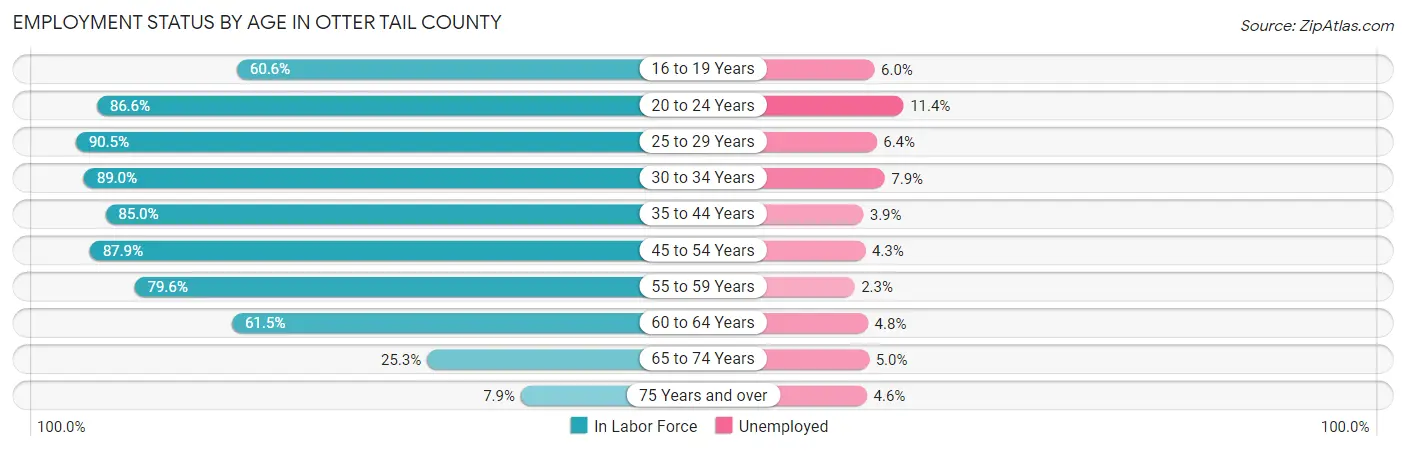
| Age Bracket | In Labor Force | Unemployed |
| 16 to 19 Years | 1,630 (60.6%) | 98 (6.0%) |
| 20 to 24 Years | 2,556 (86.6%) | 291 (11.4%) |
| 25 to 29 Years | 2,548 (90.5%) | 163 (6.4%) |
| 30 to 34 Years | 2,575 (89.0%) | 203 (7.9%) |
| 35 to 44 Years | 5,590 (85.0%) | 218 (3.9%) |
| 45 to 54 Years | 5,612 (87.9%) | 241 (4.3%) |
| 55 to 59 Years | 3,606 (79.6%) | 83 (2.3%) |
| 60 to 64 Years | 3,087 (61.5%) | 148 (4.8%) |
| 65 to 74 Years | 2,113 (25.3%) | 106 (5.0%) |
| 75 Years and over | 498 (7.9%) | 23 (4.6%) |
| Total | 29,834 (61.5%) | 1,581 (5.3%) |
Employment Status by Educational Attainment in Otter Tail County
According to labor force statistics for Otter Tail County, 81.6% of individuals (23,026) out of the total population between 25 and 64 years of age (28,218) are in the labor force, with 4.6% or 1,059 of them being unemployed. The group with the highest labor force participation rate are those with the educational attainment of bachelor's degree or higher, with 87.1% or 6,671 individuals in the labor force. Within the labor force, individuals with less than high school education have the highest percentage of unemployment, with 11.9% or 156 of them being unemployed.
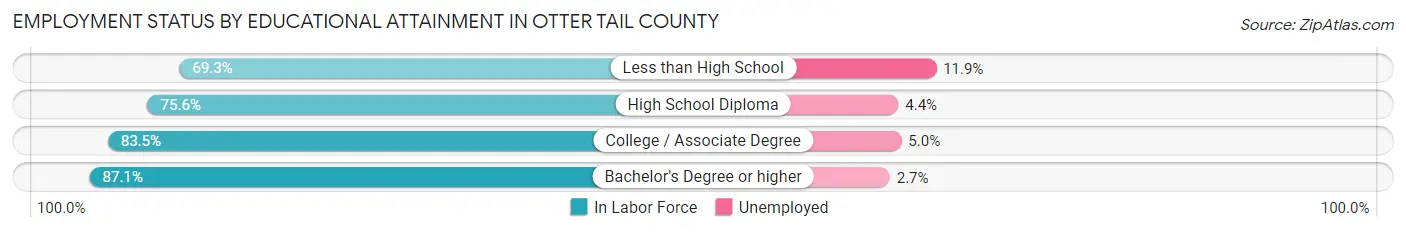
| Educational Attainment | In Labor Force | Unemployed |
| Less than High School | 1,313 (69.3%) | 226 (11.9%) |
| High School Diploma | 5,263 (75.6%) | 306 (4.4%) |
| College / Associate Degree | 9,771 (83.5%) | 585 (5.0%) |
| Bachelor's Degree or higher | 6,671 (87.1%) | 207 (2.7%) |
| Total | 23,026 (81.6%) | 1,298 (4.6%) |
Employment Occupations by Sex in Otter Tail County
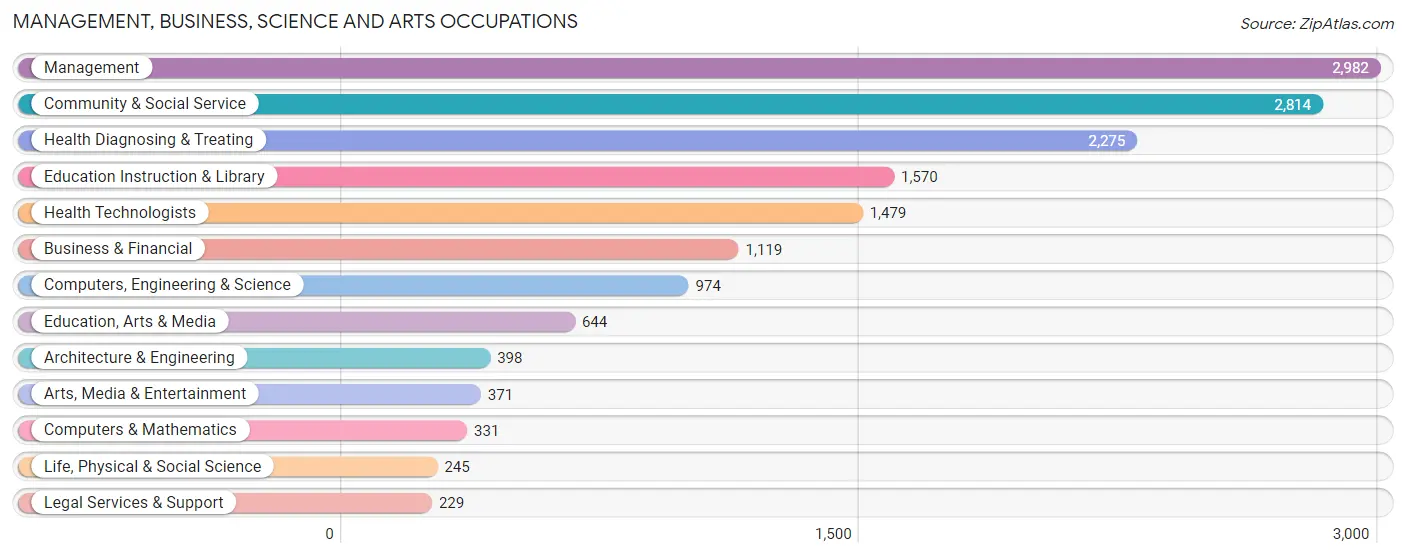
Management, Business, Science and Arts Occupations
The most common Management, Business, Science and Arts occupations in Otter Tail County are Management (2,982 | 10.6%), Community & Social Service (2,814 | 10.0%), Health Diagnosing & Treating (2,275 | 8.1%), Education Instruction & Library (1,570 | 5.6%), and Health Technologists (1,479 | 5.2%).
Management, Business, Science and Arts Occupations by Sex
Within the Management, Business, Science and Arts occupations in Otter Tail County, the most male-oriented occupations are Architecture & Engineering (93.5%), Computers, Engineering & Science (77.0%), and Computers & Mathematics (70.7%), while the most female-oriented occupations are Education Instruction & Library (78.5%), Health Diagnosing & Treating (78.3%), and Health Technologists (76.8%).
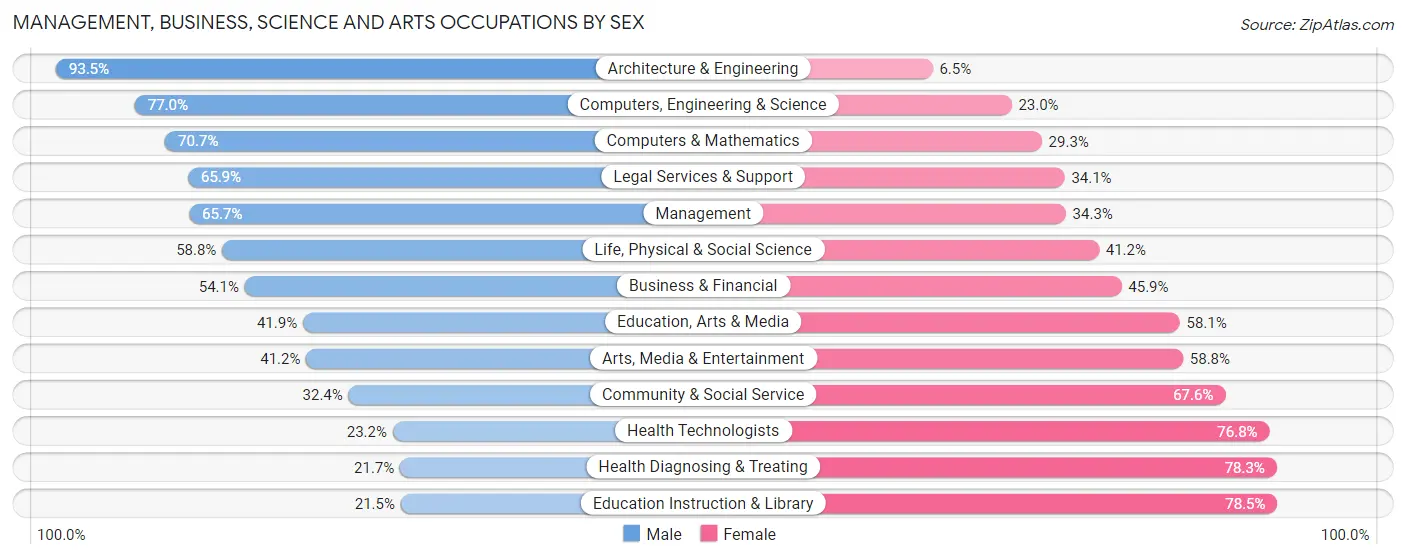
| Occupation | Male | Female |
| Management | 1,959 (65.7%) | 1,023 (34.3%) |
| Business & Financial | 605 (54.1%) | 514 (45.9%) |
| Computers, Engineering & Science | 750 (77.0%) | 224 (23.0%) |
| Computers & Mathematics | 234 (70.7%) | 97 (29.3%) |
| Architecture & Engineering | 372 (93.5%) | 26 (6.5%) |
| Life, Physical & Social Science | 144 (58.8%) | 101 (41.2%) |
| Community & Social Service | 912 (32.4%) | 1,902 (67.6%) |
| Education, Arts & Media | 270 (41.9%) | 374 (58.1%) |
| Legal Services & Support | 151 (65.9%) | 78 (34.1%) |
| Education Instruction & Library | 338 (21.5%) | 1,232 (78.5%) |
| Arts, Media & Entertainment | 153 (41.2%) | 218 (58.8%) |
| Health Diagnosing & Treating | 493 (21.7%) | 1,782 (78.3%) |
| Health Technologists | 343 (23.2%) | 1,136 (76.8%) |
| Total (Category) | 4,719 (46.4%) | 5,445 (53.6%) |
| Total (Overall) | 15,058 (53.4%) | 13,150 (46.6%) |
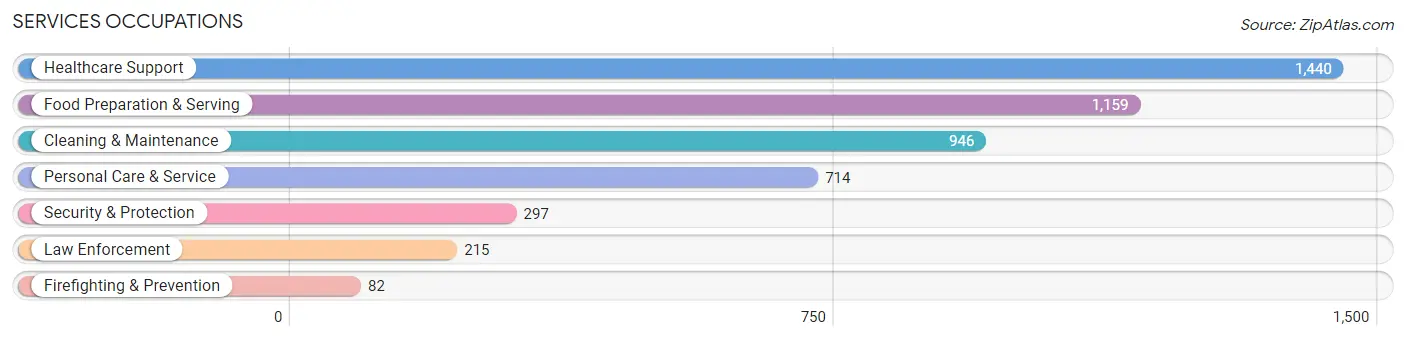
Services Occupations
The most common Services occupations in Otter Tail County are Healthcare Support (1,440 | 5.1%), Food Preparation & Serving (1,159 | 4.1%), Cleaning & Maintenance (946 | 3.4%), Personal Care & Service (714 | 2.5%), and Security & Protection (297 | 1.1%).
Services Occupations by Sex
Within the Services occupations in Otter Tail County, the most male-oriented occupations are Law Enforcement (76.3%), Security & Protection (66.0%), and Cleaning & Maintenance (64.1%), while the most female-oriented occupations are Healthcare Support (87.2%), Personal Care & Service (73.5%), and Food Preparation & Serving (64.5%).
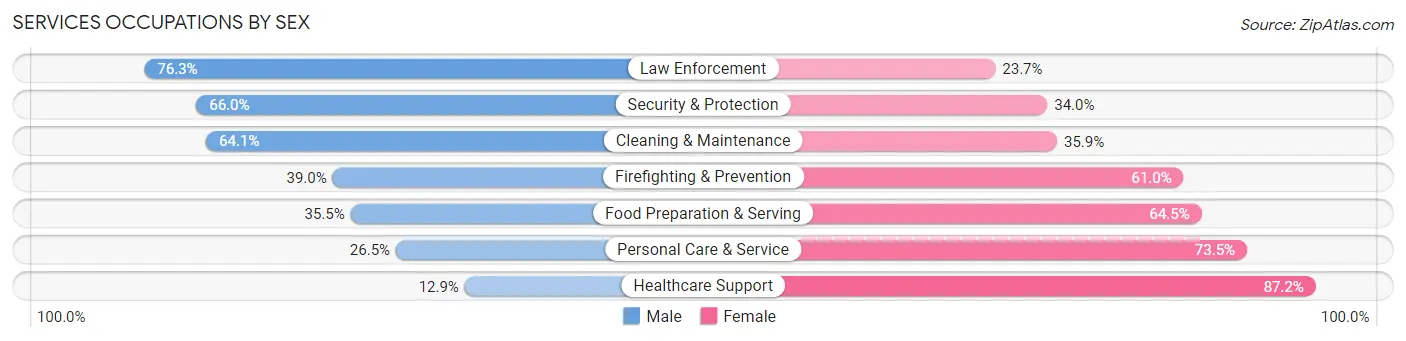
| Occupation | Male | Female |
| Healthcare Support | 185 (12.9%) | 1,255 (87.2%) |
| Security & Protection | 196 (66.0%) | 101 (34.0%) |
| Firefighting & Prevention | 32 (39.0%) | 50 (61.0%) |
| Law Enforcement | 164 (76.3%) | 51 (23.7%) |
| Food Preparation & Serving | 411 (35.5%) | 748 (64.5%) |
| Cleaning & Maintenance | 606 (64.1%) | 340 (35.9%) |
| Personal Care & Service | 189 (26.5%) | 525 (73.5%) |
| Total (Category) | 1,587 (34.8%) | 2,969 (65.2%) |
| Total (Overall) | 15,058 (53.4%) | 13,150 (46.6%) |
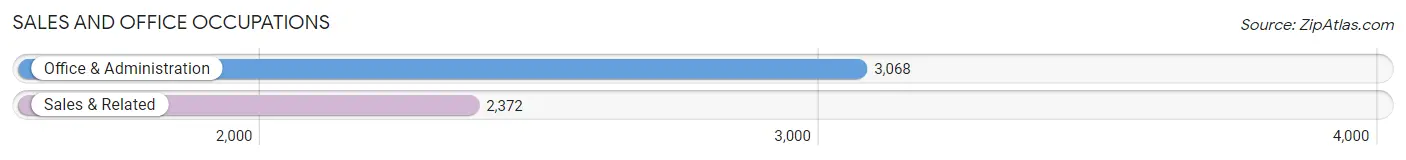
Sales and Office Occupations
The most common Sales and Office occupations in Otter Tail County are Office & Administration (3,068 | 10.9%), and Sales & Related (2,372 | 8.4%).
Sales and Office Occupations by Sex
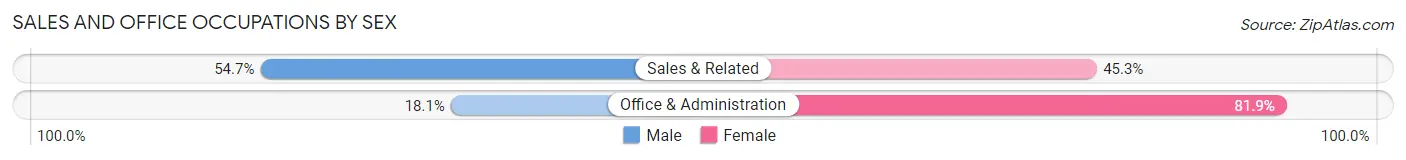
| Occupation | Male | Female |
| Sales & Related | 1,297 (54.7%) | 1,075 (45.3%) |
| Office & Administration | 554 (18.1%) | 2,514 (81.9%) |
| Total (Category) | 1,851 (34.0%) | 3,589 (66.0%) |
| Total (Overall) | 15,058 (53.4%) | 13,150 (46.6%) |
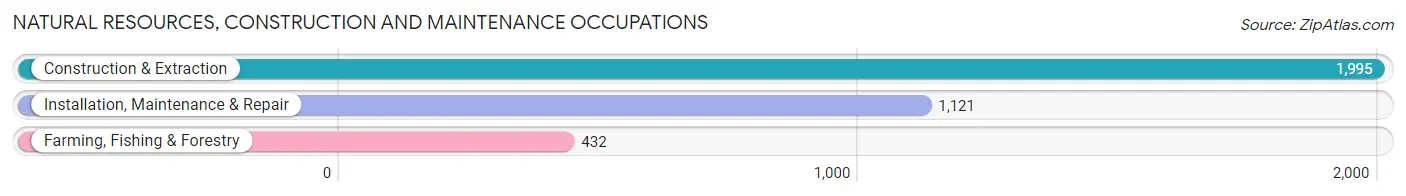
Natural Resources, Construction and Maintenance Occupations
The most common Natural Resources, Construction and Maintenance occupations in Otter Tail County are Construction & Extraction (1,995 | 7.1%), Installation, Maintenance & Repair (1,121 | 4.0%), and Farming, Fishing & Forestry (432 | 1.5%).
Natural Resources, Construction and Maintenance Occupations by Sex
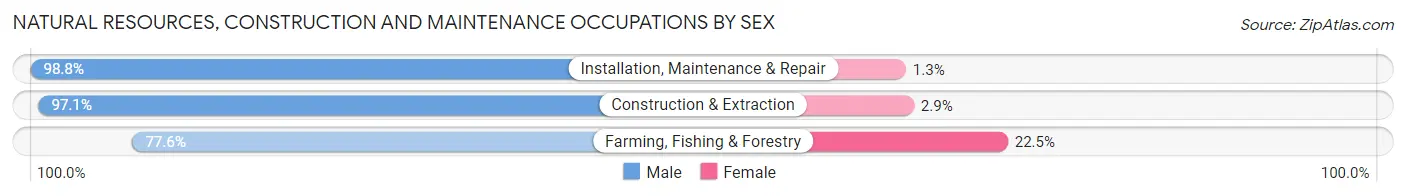
| Occupation | Male | Female |
| Farming, Fishing & Forestry | 335 (77.5%) | 97 (22.5%) |
| Construction & Extraction | 1,937 (97.1%) | 58 (2.9%) |
| Installation, Maintenance & Repair | 1,107 (98.8%) | 14 (1.3%) |
| Total (Category) | 3,379 (95.2%) | 169 (4.8%) |
| Total (Overall) | 15,058 (53.4%) | 13,150 (46.6%) |
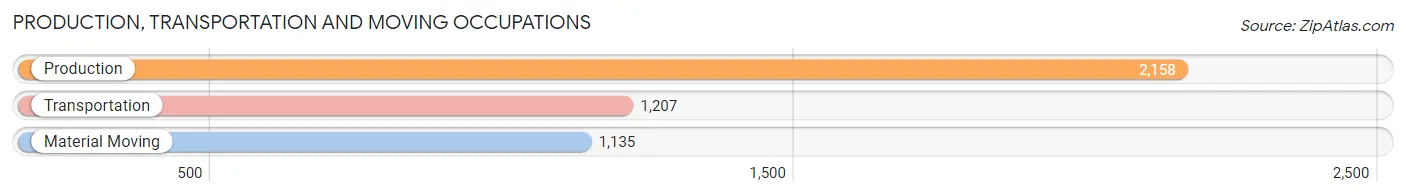
Production, Transportation and Moving Occupations
The most common Production, Transportation and Moving occupations in Otter Tail County are Production (2,158 | 7.6%), Transportation (1,207 | 4.3%), and Material Moving (1,135 | 4.0%).
Production, Transportation and Moving Occupations by Sex
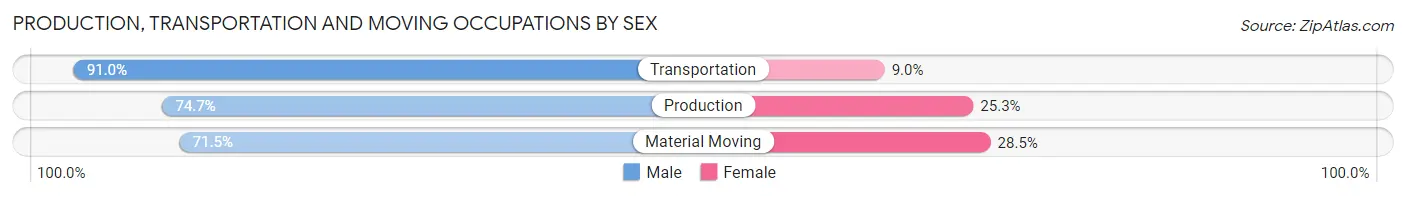
| Occupation | Male | Female |
| Production | 1,612 (74.7%) | 546 (25.3%) |
| Transportation | 1,098 (91.0%) | 109 (9.0%) |
| Material Moving | 812 (71.5%) | 323 (28.5%) |
| Total (Category) | 3,522 (78.3%) | 978 (21.7%) |
| Total (Overall) | 15,058 (53.4%) | 13,150 (46.6%) |
Employment Industries by Sex in Otter Tail County
Employment Industries in Otter Tail County
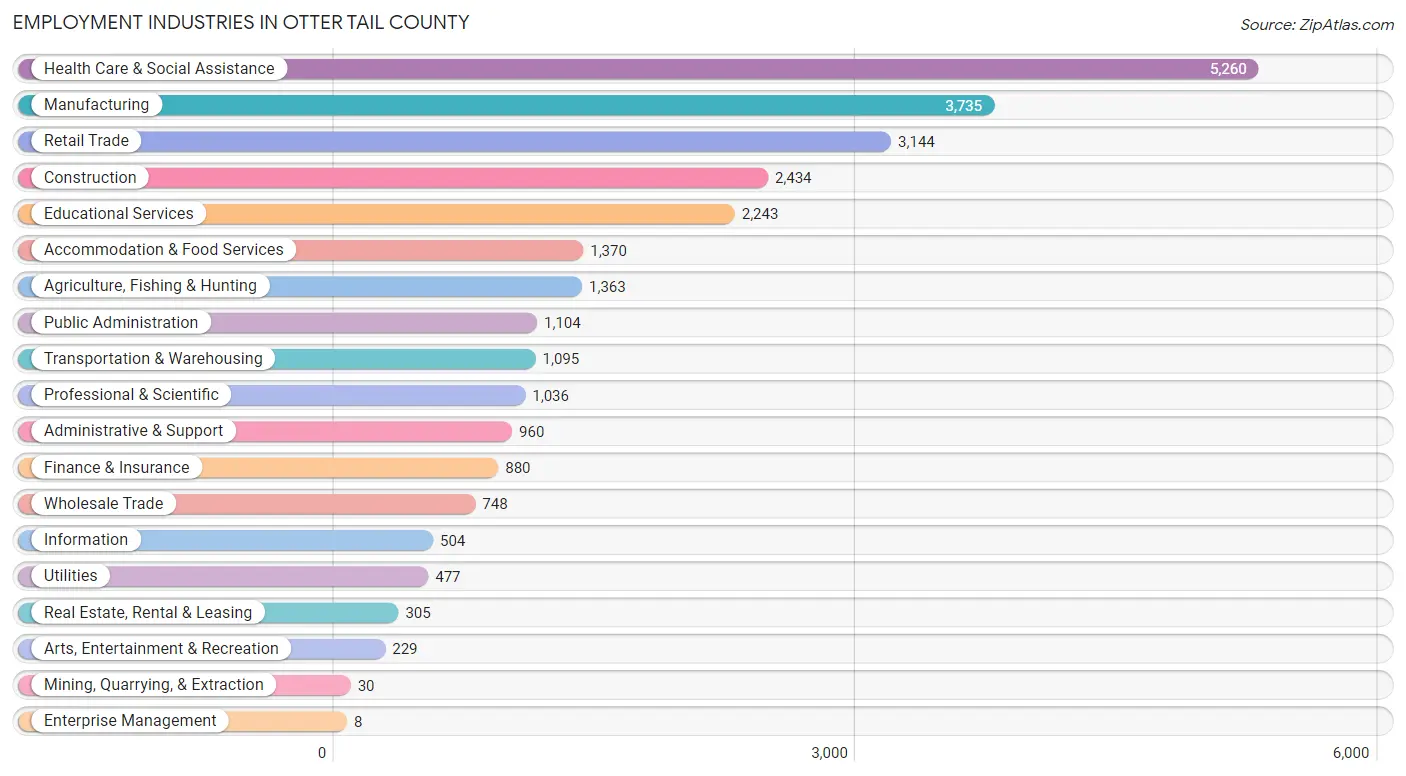
The major employment industries in Otter Tail County include Health Care & Social Assistance (5,260 | 18.6%), Manufacturing (3,735 | 13.2%), Retail Trade (3,144 | 11.2%), Construction (2,434 | 8.6%), and Educational Services (2,243 | 8.0%).
Employment Industries by Sex in Otter Tail County
The Otter Tail County industries that see more men than women are Mining, Quarrying, & Extraction (100.0%), Construction (90.8%), and Wholesale Trade (80.3%), whereas the industries that tend to have a higher number of women are Enterprise Management (100.0%), Health Care & Social Assistance (81.2%), and Educational Services (67.4%).
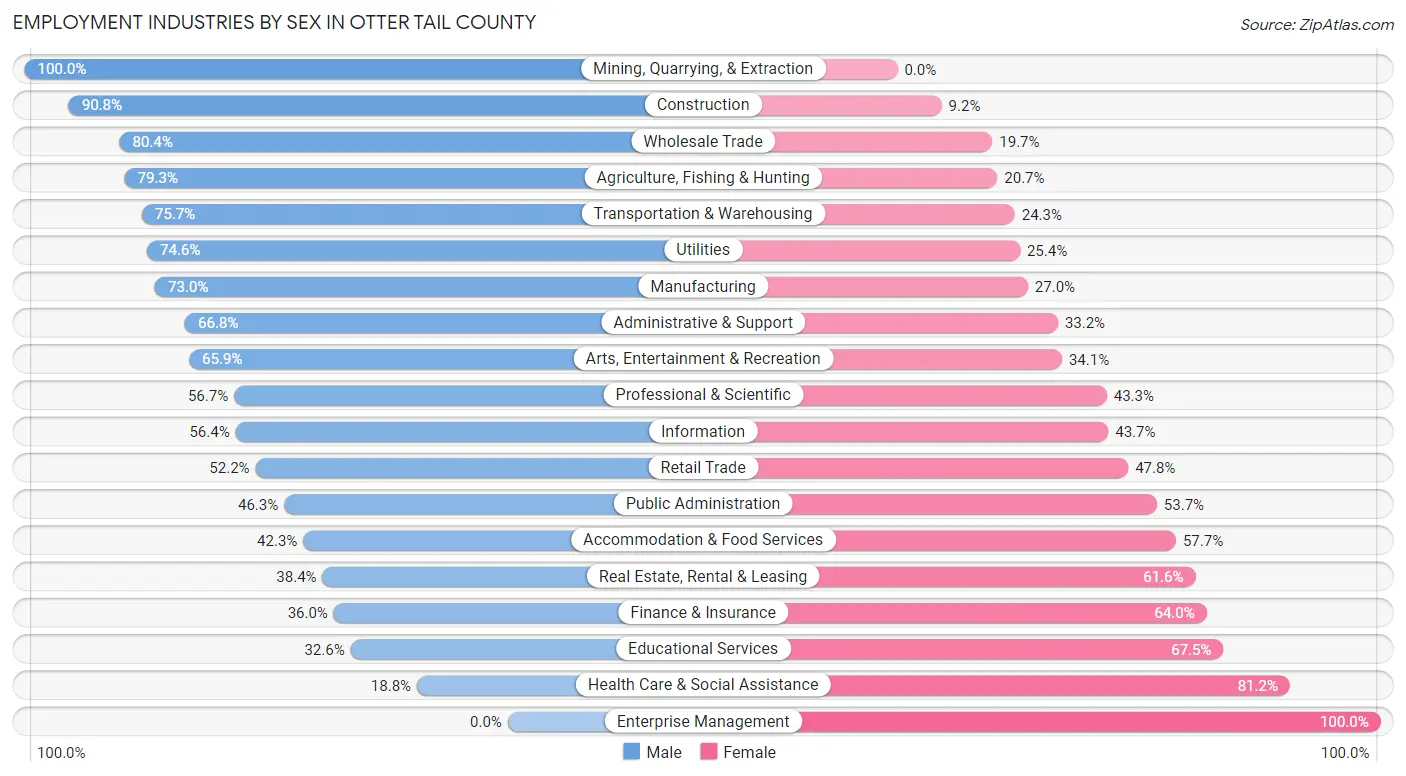
| Industry | Male | Female |
| Agriculture, Fishing & Hunting | 1,081 (79.3%) | 282 (20.7%) |
| Mining, Quarrying, & Extraction | 30 (100.0%) | 0 (0.0%) |
| Construction | 2,211 (90.8%) | 223 (9.2%) |
| Manufacturing | 2,726 (73.0%) | 1,009 (27.0%) |
| Wholesale Trade | 601 (80.3%) | 147 (19.7%) |
| Retail Trade | 1,642 (52.2%) | 1,502 (47.8%) |
| Transportation & Warehousing | 829 (75.7%) | 266 (24.3%) |
| Utilities | 356 (74.6%) | 121 (25.4%) |
| Information | 284 (56.4%) | 220 (43.6%) |
| Finance & Insurance | 317 (36.0%) | 563 (64.0%) |
| Real Estate, Rental & Leasing | 117 (38.4%) | 188 (61.6%) |
| Professional & Scientific | 587 (56.7%) | 449 (43.3%) |
| Enterprise Management | 0 (0.0%) | 8 (100.0%) |
| Administrative & Support | 641 (66.8%) | 319 (33.2%) |
| Educational Services | 730 (32.6%) | 1,513 (67.4%) |
| Health Care & Social Assistance | 989 (18.8%) | 4,271 (81.2%) |
| Arts, Entertainment & Recreation | 151 (65.9%) | 78 (34.1%) |
| Accommodation & Food Services | 580 (42.3%) | 790 (57.7%) |
| Public Administration | 511 (46.3%) | 593 (53.7%) |
| Total | 15,058 (53.4%) | 13,150 (46.6%) |
Education in Otter Tail County
School Enrollment in Otter Tail County
The most common levels of schooling among the 12,010 students in Otter Tail County are elementary school (2,905 | 24.2%), middle school (2,836 | 23.6%), and high school (2,836 | 23.6%).
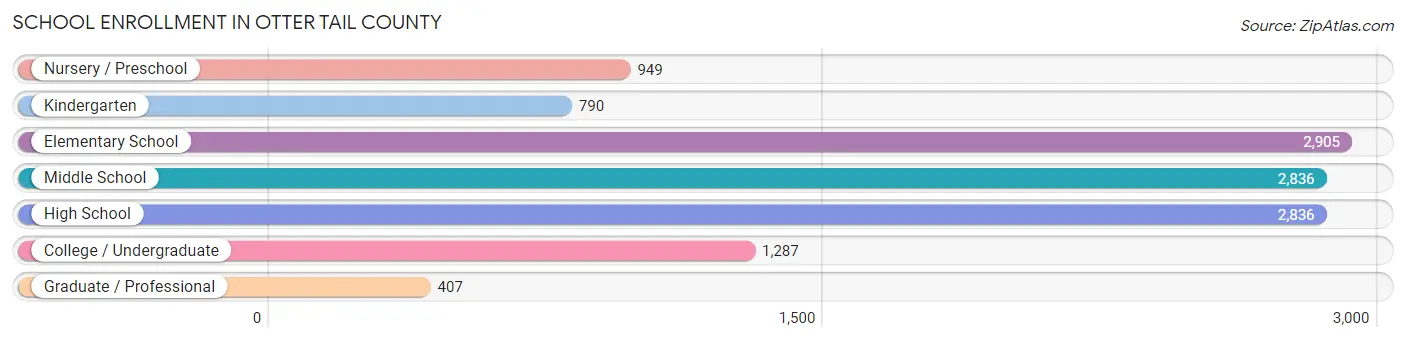
| School Level | # Students | % Students |
| Nursery / Preschool | 949 | 7.9% |
| Kindergarten | 790 | 6.6% |
| Elementary School | 2,905 | 24.2% |
| Middle School | 2,836 | 23.6% |
| High School | 2,836 | 23.6% |
| College / Undergraduate | 1,287 | 10.7% |
| Graduate / Professional | 407 | 3.4% |
| Total | 12,010 | 100.0% |
School Enrollment by Age by Funding Source in Otter Tail County
Out of a total of 12,010 students who are enrolled in schools in Otter Tail County, 1,681 (14.0%) attend a private institution, while the remaining 10,329 (86.0%) are enrolled in public schools. The age group of 3 to 4 year olds has the highest likelihood of being enrolled in private schools, with 140 (26.9% in the age bracket) enrolled. Conversely, the age group of 25 to 34 year olds has the lowest likelihood of being enrolled in a private school, with 253 (96.2% in the age bracket) attending a public institution.
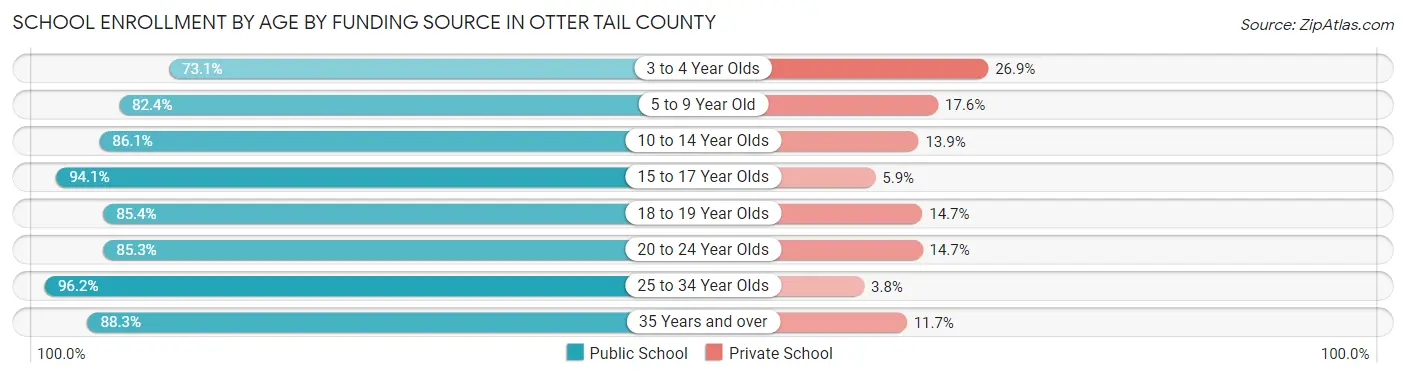
| Age Bracket | Public School | Private School |
| 3 to 4 Year Olds | 380 (73.1%) | 140 (26.9%) |
| 5 to 9 Year Old | 3,064 (82.4%) | 654 (17.6%) |
| 10 to 14 Year Olds | 2,957 (86.1%) | 479 (13.9%) |
| 15 to 17 Year Olds | 1,995 (94.1%) | 125 (5.9%) |
| 18 to 19 Year Olds | 699 (85.4%) | 120 (14.6%) |
| 20 to 24 Year Olds | 575 (85.3%) | 99 (14.7%) |
| 25 to 34 Year Olds | 253 (96.2%) | 10 (3.8%) |
| 35 Years and over | 406 (88.3%) | 54 (11.7%) |
| Total | 10,329 (86.0%) | 1,681 (14.0%) |
Educational Attainment by Field of Study in Otter Tail County
Education (2,896 | 23.2%), business (1,922 | 15.4%), science & technology (1,800 | 14.4%), arts & humanities (1,092 | 8.8%), and bio, nature & agricultural (907 | 7.3%) are the most common fields of study among 12,460 individuals in Otter Tail County who have obtained a bachelor's degree or higher.
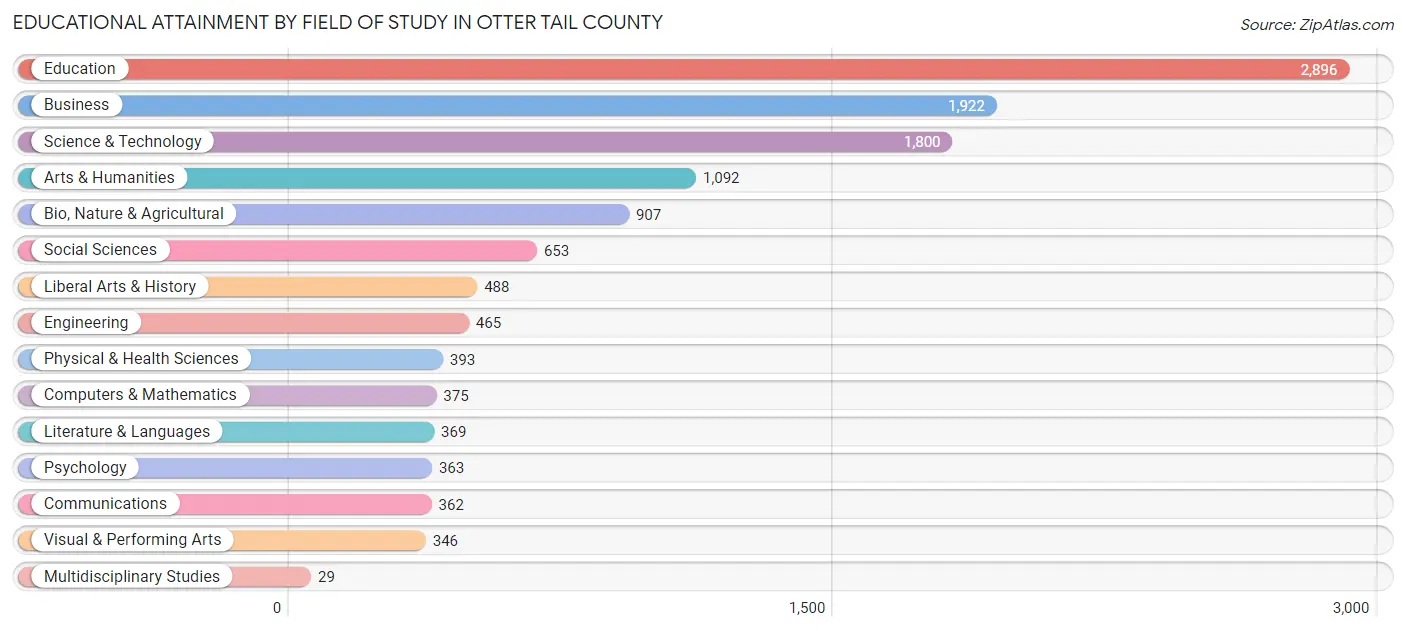
| Field of Study | # Graduates | % Graduates |
| Computers & Mathematics | 375 | 3.0% |
| Bio, Nature & Agricultural | 907 | 7.3% |
| Physical & Health Sciences | 393 | 3.2% |
| Psychology | 363 | 2.9% |
| Social Sciences | 653 | 5.2% |
| Engineering | 465 | 3.7% |
| Multidisciplinary Studies | 29 | 0.2% |
| Science & Technology | 1,800 | 14.4% |
| Business | 1,922 | 15.4% |
| Education | 2,896 | 23.2% |
| Literature & Languages | 369 | 3.0% |
| Liberal Arts & History | 488 | 3.9% |
| Visual & Performing Arts | 346 | 2.8% |
| Communications | 362 | 2.9% |
| Arts & Humanities | 1,092 | 8.8% |
| Total | 12,460 | 100.0% |
Transportation & Commute in Otter Tail County
Vehicle Availability by Sex in Otter Tail County
The most prevalent vehicle ownership categories in Otter Tail County are males with 2 vehicles (5,553, accounting for 37.4%) and females with 2 vehicles (4,749, making up 43.7%).
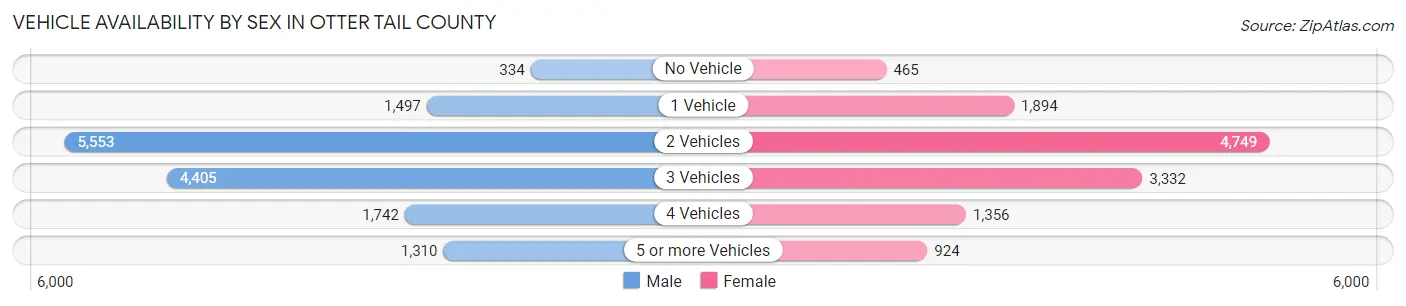
| Vehicles Available | Male | Female |
| No Vehicle | 334 (2.2%) | 465 (3.7%) |
| 1 Vehicle | 1,497 (10.1%) | 1,894 (14.9%) |
| 2 Vehicles | 5,553 (37.4%) | 4,749 (37.3%) |
| 3 Vehicles | 4,405 (29.7%) | 3,332 (26.2%) |
| 4 Vehicles | 1,742 (11.7%) | 1,356 (10.7%) |
| 5 or more Vehicles | 1,310 (8.8%) | 924 (7.3%) |
| Total | 14,841 (100.0%) | 12,720 (100.0%) |
Commute Time in Otter Tail County
The most frequently occuring commute durations in Otter Tail County are 5 to 9 minutes (4,780 commuters, 19.1%), 10 to 14 minutes (4,375 commuters, 17.5%), and 15 to 19 minutes (3,492 commuters, 14.0%).
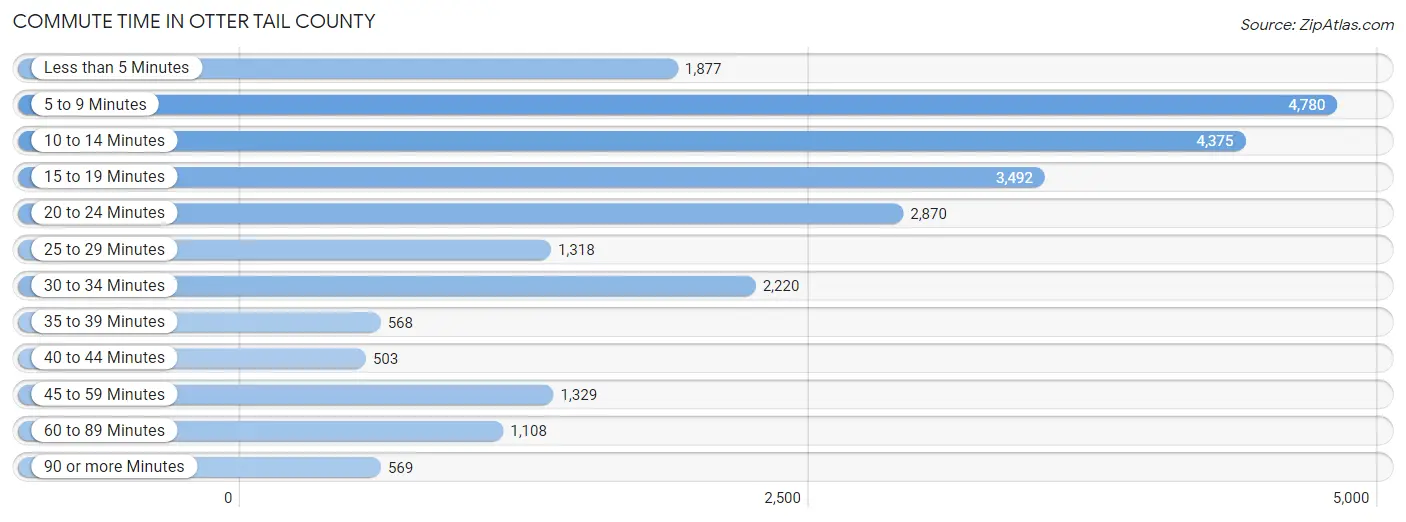
| Commute Time | # Commuters | % Commuters |
| Less than 5 Minutes | 1,877 | 7.5% |
| 5 to 9 Minutes | 4,780 | 19.1% |
| 10 to 14 Minutes | 4,375 | 17.5% |
| 15 to 19 Minutes | 3,492 | 14.0% |
| 20 to 24 Minutes | 2,870 | 11.5% |
| 25 to 29 Minutes | 1,318 | 5.3% |
| 30 to 34 Minutes | 2,220 | 8.9% |
| 35 to 39 Minutes | 568 | 2.3% |
| 40 to 44 Minutes | 503 | 2.0% |
| 45 to 59 Minutes | 1,329 | 5.3% |
| 60 to 89 Minutes | 1,108 | 4.4% |
| 90 or more Minutes | 569 | 2.3% |
Commute Time by Sex in Otter Tail County
The most common commute times in Otter Tail County are 10 to 14 minutes (2,302 commuters, 17.0%) for males and 5 to 9 minutes (2,479 commuters, 21.6%) for females.
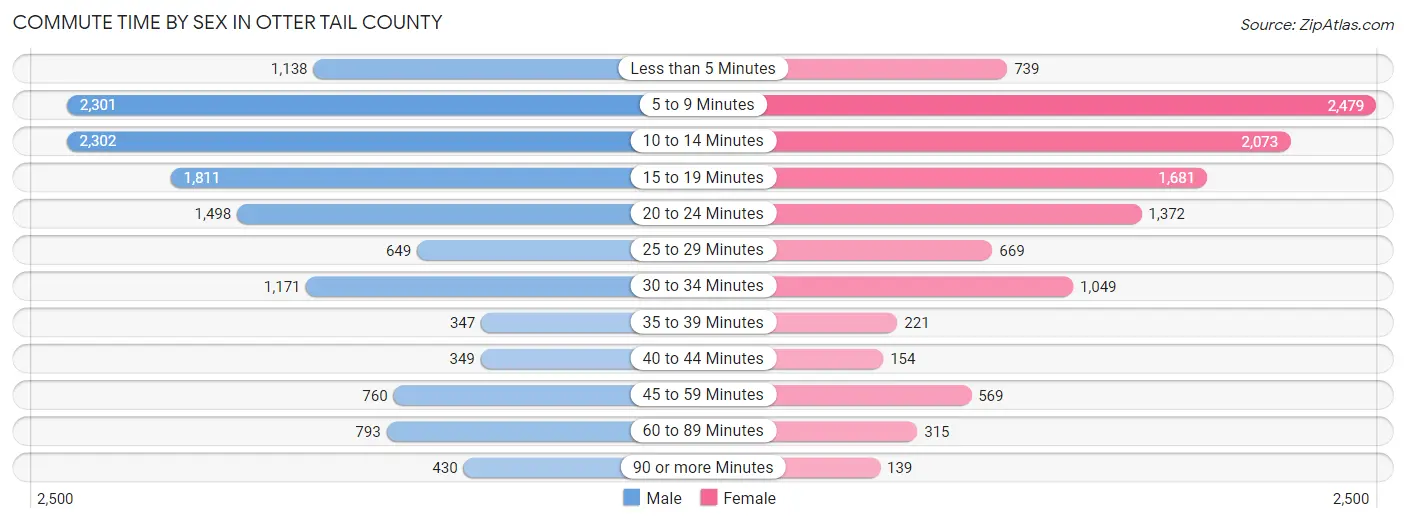
| Commute Time | Male | Female |
| Less than 5 Minutes | 1,138 (8.4%) | 739 (6.5%) |
| 5 to 9 Minutes | 2,301 (17.0%) | 2,479 (21.6%) |
| 10 to 14 Minutes | 2,302 (17.0%) | 2,073 (18.1%) |
| 15 to 19 Minutes | 1,811 (13.4%) | 1,681 (14.7%) |
| 20 to 24 Minutes | 1,498 (11.1%) | 1,372 (12.0%) |
| 25 to 29 Minutes | 649 (4.8%) | 669 (5.8%) |
| 30 to 34 Minutes | 1,171 (8.6%) | 1,049 (9.1%) |
| 35 to 39 Minutes | 347 (2.6%) | 221 (1.9%) |
| 40 to 44 Minutes | 349 (2.6%) | 154 (1.3%) |
| 45 to 59 Minutes | 760 (5.6%) | 569 (5.0%) |
| 60 to 89 Minutes | 793 (5.9%) | 315 (2.8%) |
| 90 or more Minutes | 430 (3.2%) | 139 (1.2%) |
Time of Departure to Work by Sex in Otter Tail County
The most frequent times of departure to work in Otter Tail County are 7:30 AM to 7:59 AM (1,951, 14.4%) for males and 7:30 AM to 7:59 AM (2,488, 21.7%) for females.
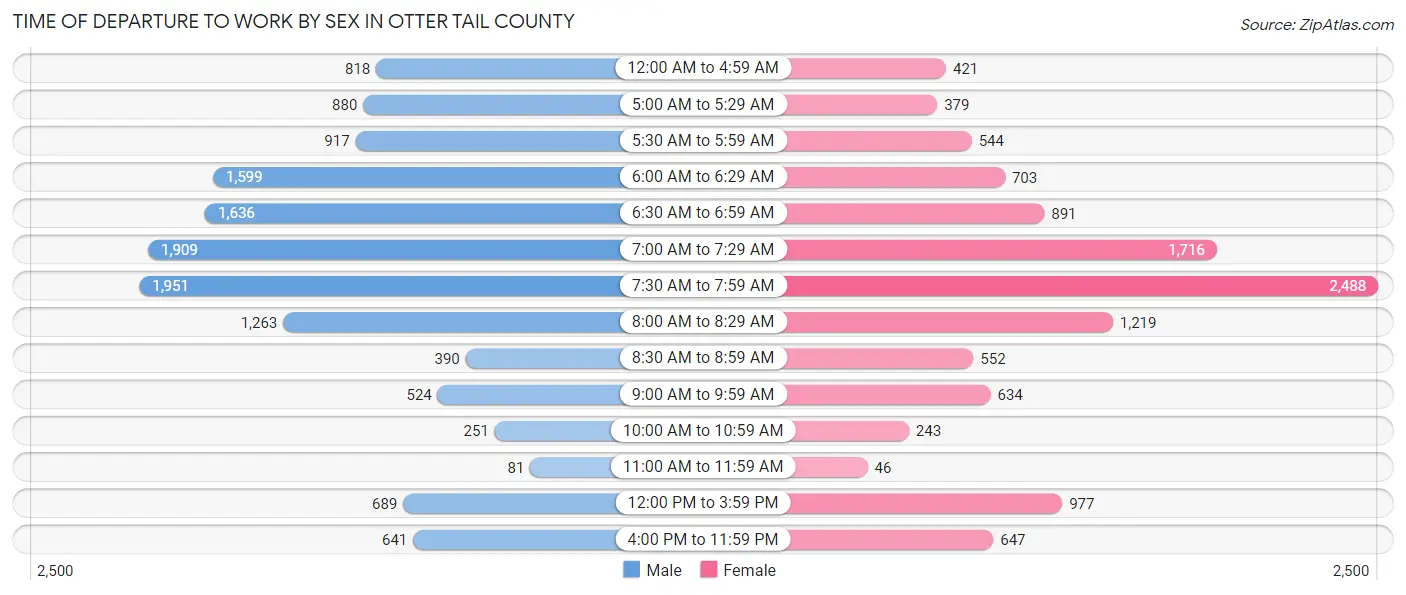
| Time of Departure | Male | Female |
| 12:00 AM to 4:59 AM | 818 (6.0%) | 421 (3.7%) |
| 5:00 AM to 5:29 AM | 880 (6.5%) | 379 (3.3%) |
| 5:30 AM to 5:59 AM | 917 (6.8%) | 544 (4.8%) |
| 6:00 AM to 6:29 AM | 1,599 (11.8%) | 703 (6.1%) |
| 6:30 AM to 6:59 AM | 1,636 (12.1%) | 891 (7.8%) |
| 7:00 AM to 7:29 AM | 1,909 (14.1%) | 1,716 (15.0%) |
| 7:30 AM to 7:59 AM | 1,951 (14.4%) | 2,488 (21.7%) |
| 8:00 AM to 8:29 AM | 1,263 (9.3%) | 1,219 (10.6%) |
| 8:30 AM to 8:59 AM | 390 (2.9%) | 552 (4.8%) |
| 9:00 AM to 9:59 AM | 524 (3.9%) | 634 (5.5%) |
| 10:00 AM to 10:59 AM | 251 (1.8%) | 243 (2.1%) |
| 11:00 AM to 11:59 AM | 81 (0.6%) | 46 (0.4%) |
| 12:00 PM to 3:59 PM | 689 (5.1%) | 977 (8.5%) |
| 4:00 PM to 11:59 PM | 641 (4.7%) | 647 (5.7%) |
| Total | 13,549 (100.0%) | 11,460 (100.0%) |
Housing Occupancy in Otter Tail County
Occupancy by Ownership in Otter Tail County
Of the total 24,910 dwellings in Otter Tail County, owner-occupied units account for 19,963 (80.1%), while renter-occupied units make up 4,947 (19.9%).
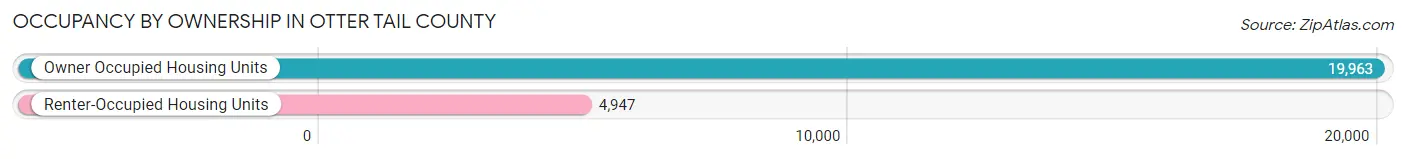
| Occupancy | # Housing Units | % Housing Units |
| Owner Occupied Housing Units | 19,963 | 80.1% |
| Renter-Occupied Housing Units | 4,947 | 19.9% |
| Total Occupied Housing Units | 24,910 | 100.0% |
Occupancy by Household Size in Otter Tail County
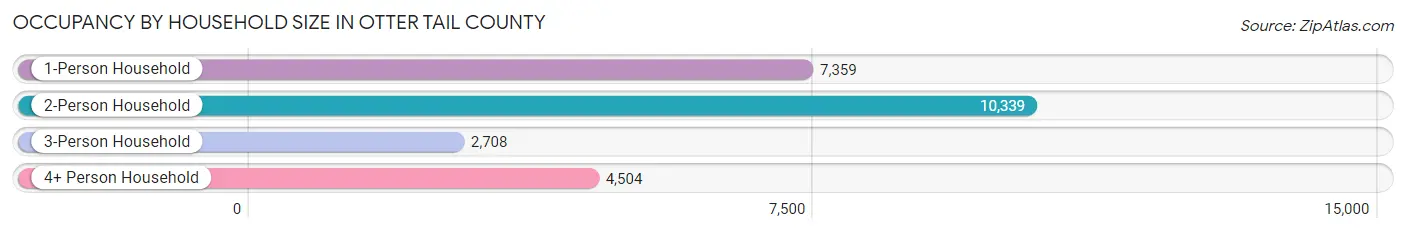
| Household Size | # Housing Units | % Housing Units |
| 1-Person Household | 7,359 | 29.5% |
| 2-Person Household | 10,339 | 41.5% |
| 3-Person Household | 2,708 | 10.9% |
| 4+ Person Household | 4,504 | 18.1% |
| Total Housing Units | 24,910 | 100.0% |
Occupancy by Ownership by Household Size in Otter Tail County
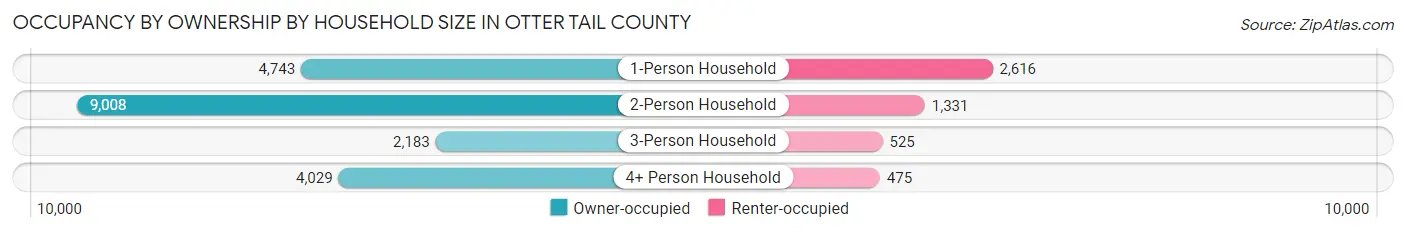
| Household Size | Owner-occupied | Renter-occupied |
| 1-Person Household | 4,743 (64.4%) | 2,616 (35.5%) |
| 2-Person Household | 9,008 (87.1%) | 1,331 (12.9%) |
| 3-Person Household | 2,183 (80.6%) | 525 (19.4%) |
| 4+ Person Household | 4,029 (89.4%) | 475 (10.5%) |
| Total Housing Units | 19,963 (80.1%) | 4,947 (19.9%) |
Occupancy by Educational Attainment in Otter Tail County
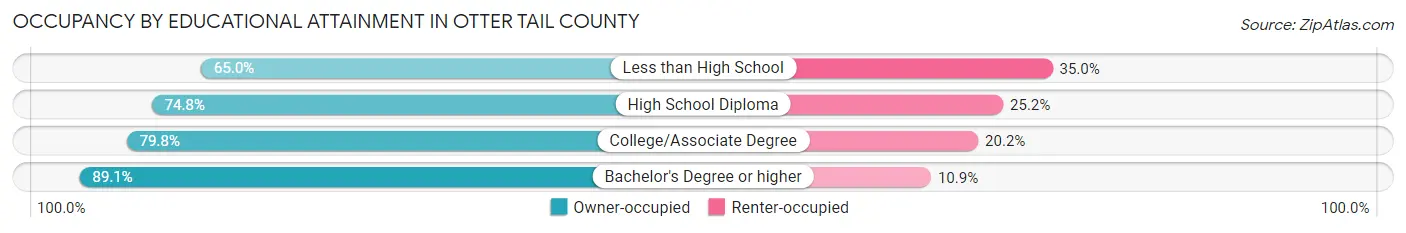
| Household Size | Owner-occupied | Renter-occupied |
| Less than High School | 1,001 (65.0%) | 538 (35.0%) |
| High School Diploma | 4,733 (74.8%) | 1,592 (25.2%) |
| College/Associate Degree | 8,233 (79.8%) | 2,086 (20.2%) |
| Bachelor's Degree or higher | 5,996 (89.1%) | 731 (10.9%) |
Occupancy by Age of Householder in Otter Tail County
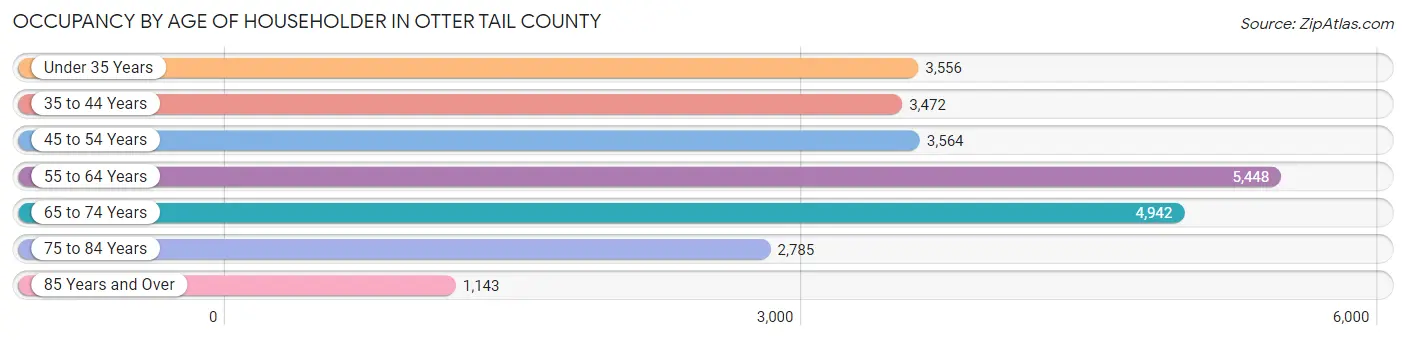
| Age Bracket | # Households | % Households |
| Under 35 Years | 3,556 | 14.3% |
| 35 to 44 Years | 3,472 | 13.9% |
| 45 to 54 Years | 3,564 | 14.3% |
| 55 to 64 Years | 5,448 | 21.9% |
| 65 to 74 Years | 4,942 | 19.8% |
| 75 to 84 Years | 2,785 | 11.2% |
| 85 Years and Over | 1,143 | 4.6% |
| Total | 24,910 | 100.0% |
Housing Finances in Otter Tail County
Median Income by Occupancy in Otter Tail County
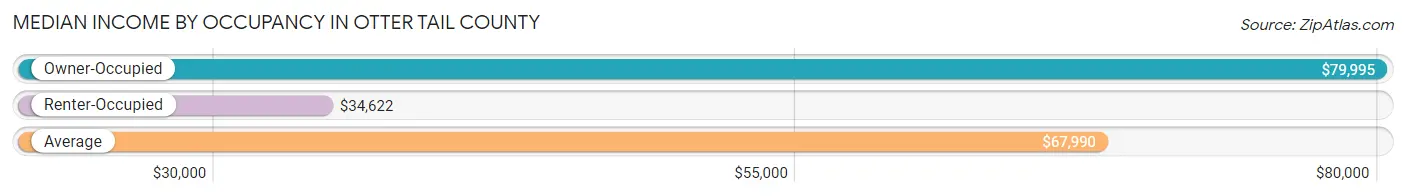
| Occupancy Type | # Households | Median Income |
| Owner-Occupied | 19,963 (80.1%) | $79,995 |
| Renter-Occupied | 4,947 (19.9%) | $34,622 |
| Average | 24,910 (100.0%) | $67,990 |
Occupancy by Householder Income Bracket in Otter Tail County
| Income Bracket | Owner-occupied | Renter-occupied |
| Less than $5,000 | 291 (1.5%) | 402 (8.1%) |
| $5,000 to $9,999 | 141 (0.7%) | 182 (3.7%) |
| $10,000 to $14,999 | 415 (2.1%) | 525 (10.6%) |
| $15,000 to $19,999 | 535 (2.7%) | 425 (8.6%) |
| $20,000 to $24,999 | 704 (3.5%) | 331 (6.7%) |
| $25,000 to $34,999 | 1,543 (7.7%) | 631 (12.8%) |
| $35,000 to $49,999 | 2,315 (11.6%) | 877 (17.7%) |
| $50,000 to $74,999 | 3,495 (17.5%) | 730 (14.8%) |
| $75,000 to $99,999 | 3,170 (15.9%) | 470 (9.5%) |
| $100,000 to $149,999 | 4,259 (21.3%) | 236 (4.8%) |
| $150,000 or more | 3,095 (15.5%) | 138 (2.8%) |
| Total | 19,963 (100.0%) | 4,947 (100.0%) |
Monthly Housing Cost Tiers in Otter Tail County
| Monthly Cost | Owner-occupied | Renter-occupied |
| Less than $300 | 1,006 (5.0%) | 279 (5.6%) |
| $300 to $499 | 2,954 (14.8%) | 716 (14.5%) |
| $500 to $799 | 4,029 (20.2%) | 1,330 (26.9%) |
| $800 to $999 | 2,272 (11.4%) | 843 (17.0%) |
| $1,000 to $1,499 | 4,054 (20.3%) | 1,078 (21.8%) |
| $1,500 to $1,999 | 2,578 (12.9%) | 95 (1.9%) |
| $2,000 to $2,499 | 1,607 (8.1%) | 49 (1.0%) |
| $2,500 to $2,999 | 696 (3.5%) | 3 (0.1%) |
| $3,000 or more | 767 (3.8%) | 14 (0.3%) |
| Total | 19,963 (100.0%) | 4,947 (100.0%) |
Physical Housing Characteristics in Otter Tail County
Housing Structures in Otter Tail County
| Structure Type | # Housing Units | % Housing Units |
| Single Unit, Detached | 19,592 | 78.6% |
| Single Unit, Attached | 898 | 3.6% |
| 2 Unit Apartments | 370 | 1.5% |
| 3 or 4 Unit Apartments | 396 | 1.6% |
| 5 to 9 Unit Apartments | 669 | 2.7% |
| 10 or more Apartments | 1,827 | 7.3% |
| Mobile Home / Other | 1,158 | 4.6% |
| Total | 24,910 | 100.0% |
Housing Structures by Occupancy in Otter Tail County
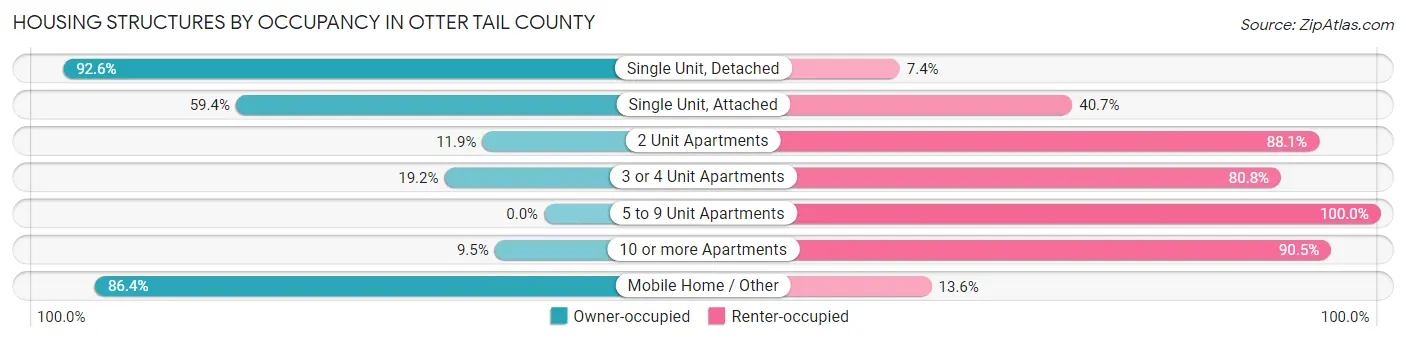
| Structure Type | Owner-occupied | Renter-occupied |
| Single Unit, Detached | 18,135 (92.6%) | 1,457 (7.4%) |
| Single Unit, Attached | 533 (59.4%) | 365 (40.6%) |
| 2 Unit Apartments | 44 (11.9%) | 326 (88.1%) |
| 3 or 4 Unit Apartments | 76 (19.2%) | 320 (80.8%) |
| 5 to 9 Unit Apartments | 0 (0.0%) | 669 (100.0%) |
| 10 or more Apartments | 174 (9.5%) | 1,653 (90.5%) |
| Mobile Home / Other | 1,001 (86.4%) | 157 (13.6%) |
| Total | 19,963 (80.1%) | 4,947 (19.9%) |
Housing Structures by Number of Rooms in Otter Tail County
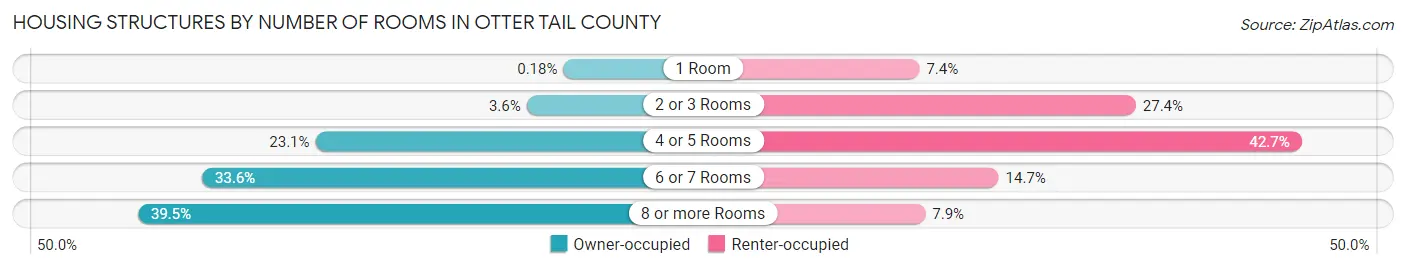
| Number of Rooms | Owner-occupied | Renter-occupied |
| 1 Room | 36 (0.2%) | 364 (7.4%) |
| 2 or 3 Rooms | 715 (3.6%) | 1,354 (27.4%) |
| 4 or 5 Rooms | 4,614 (23.1%) | 2,112 (42.7%) |
| 6 or 7 Rooms | 6,707 (33.6%) | 726 (14.7%) |
| 8 or more Rooms | 7,891 (39.5%) | 391 (7.9%) |
| Total | 19,963 (100.0%) | 4,947 (100.0%) |
Housing Structure by Heating Type in Otter Tail County
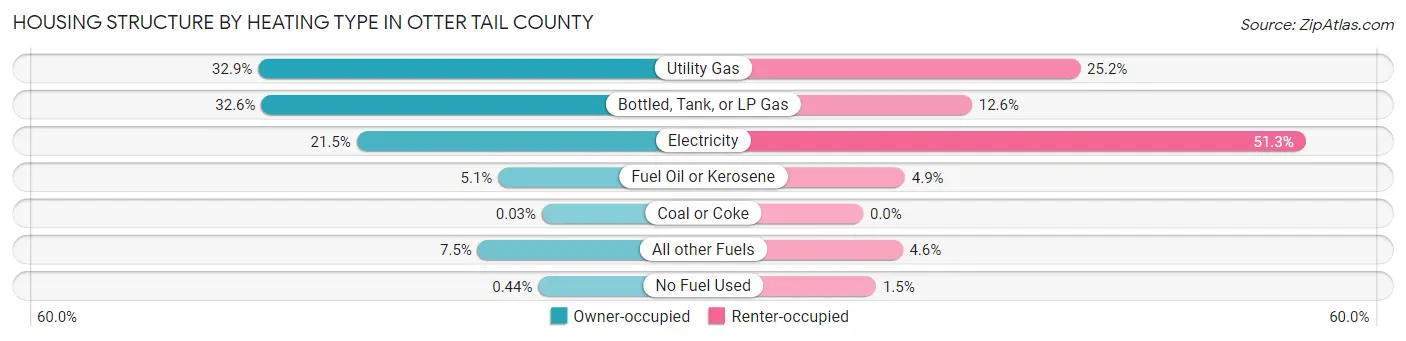
| Heating Type | Owner-occupied | Renter-occupied |
| Utility Gas | 6,571 (32.9%) | 1,245 (25.2%) |
| Bottled, Tank, or LP Gas | 6,498 (32.6%) | 624 (12.6%) |
| Electricity | 4,292 (21.5%) | 2,538 (51.3%) |
| Fuel Oil or Kerosene | 1,017 (5.1%) | 240 (4.9%) |
| Coal or Coke | 6 (0.0%) | 0 (0.0%) |
| All other Fuels | 1,492 (7.5%) | 226 (4.6%) |
| No Fuel Used | 87 (0.4%) | 74 (1.5%) |
| Total | 19,963 (100.0%) | 4,947 (100.0%) |
Household Vehicle Usage in Otter Tail County
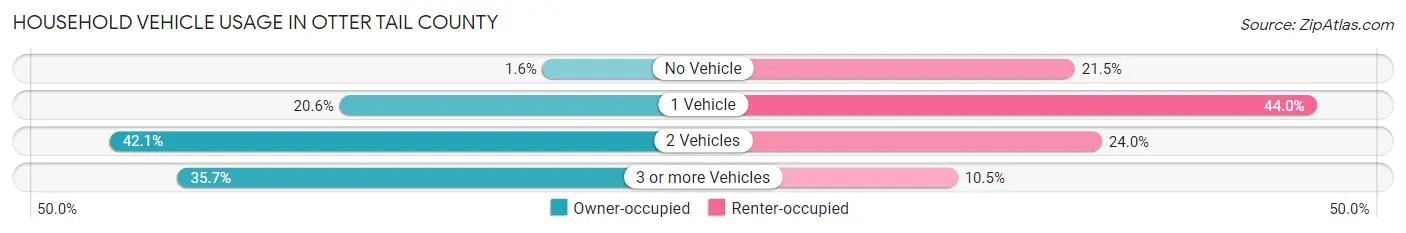
| Vehicles per Household | Owner-occupied | Renter-occupied |
| No Vehicle | 328 (1.6%) | 1,062 (21.5%) |
| 1 Vehicle | 4,111 (20.6%) | 2,177 (44.0%) |
| 2 Vehicles | 8,395 (42.0%) | 1,187 (24.0%) |
| 3 or more Vehicles | 7,129 (35.7%) | 521 (10.5%) |
| Total | 19,963 (100.0%) | 4,947 (100.0%) |
Real Estate & Mortgages in Otter Tail County
Real Estate and Mortgage Overview in Otter Tail County
| Characteristic | Without Mortgage | With Mortgage |
| Housing Units | 8,705 | 11,258 |
| Median Property Value | $227,500 | $238,900 |
| Median Household Income | $59,163 | $2,141 |
| Monthly Housing Costs | $534 | $744 |
| Real Estate Taxes | $1,908 | $125 |
Property Value by Mortgage Status in Otter Tail County
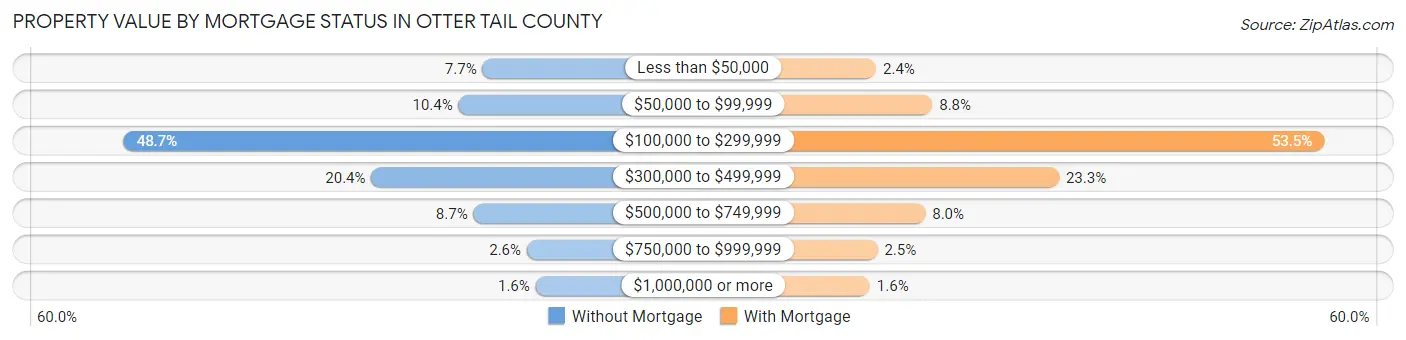
| Property Value | Without Mortgage | With Mortgage |
| Less than $50,000 | 668 (7.7%) | 265 (2.4%) |
| $50,000 to $99,999 | 906 (10.4%) | 987 (8.8%) |
| $100,000 to $299,999 | 4,236 (48.7%) | 6,026 (53.5%) |
| $300,000 to $499,999 | 1,773 (20.4%) | 2,617 (23.3%) |
| $500,000 to $749,999 | 757 (8.7%) | 897 (8.0%) |
| $750,000 to $999,999 | 226 (2.6%) | 281 (2.5%) |
| $1,000,000 or more | 139 (1.6%) | 185 (1.6%) |
| Total | 8,705 (100.0%) | 11,258 (100.0%) |
Household Income by Mortgage Status in Otter Tail County
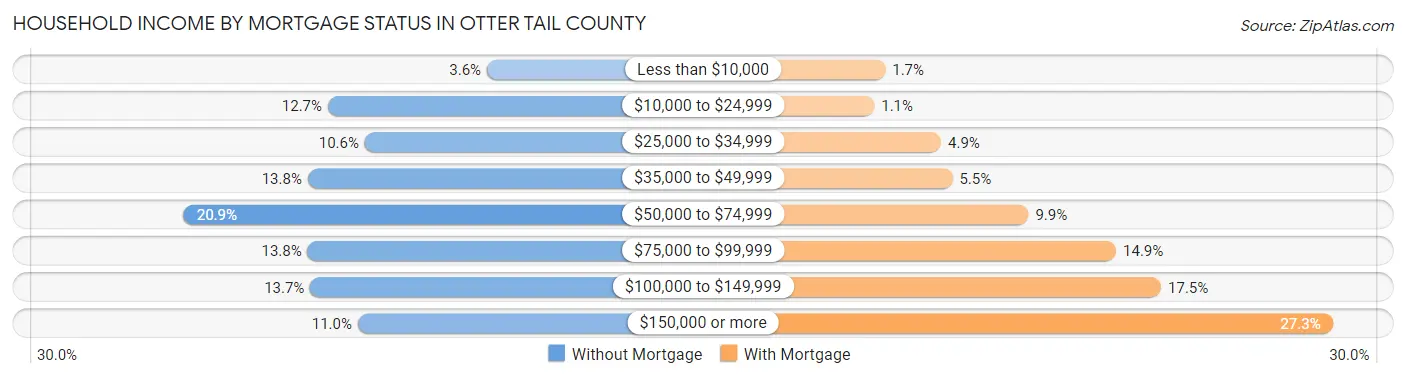
| Household Income | Without Mortgage | With Mortgage |
| Less than $10,000 | 312 (3.6%) | 191 (1.7%) |
| $10,000 to $24,999 | 1,103 (12.7%) | 120 (1.1%) |
| $25,000 to $34,999 | 919 (10.6%) | 551 (4.9%) |
| $35,000 to $49,999 | 1,203 (13.8%) | 624 (5.5%) |
| $50,000 to $74,999 | 1,819 (20.9%) | 1,112 (9.9%) |
| $75,000 to $99,999 | 1,204 (13.8%) | 1,676 (14.9%) |
| $100,000 to $149,999 | 1,191 (13.7%) | 1,966 (17.5%) |
| $150,000 or more | 954 (11.0%) | 3,068 (27.3%) |
| Total | 8,705 (100.0%) | 11,258 (100.0%) |
Property Value to Household Income Ratio in Otter Tail County
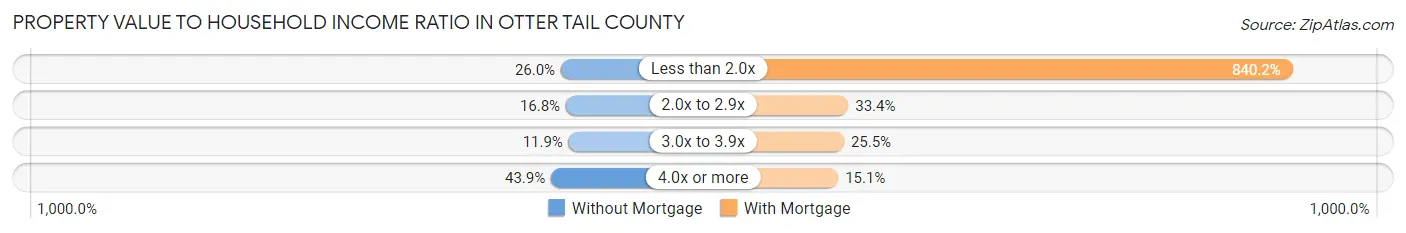
| Value-to-Income Ratio | Without Mortgage | With Mortgage |
| Less than 2.0x | 2,259 (26.0%) | 94,593 (840.2%) |
| 2.0x to 2.9x | 1,464 (16.8%) | 3,756 (33.4%) |
| 3.0x to 3.9x | 1,032 (11.9%) | 2,866 (25.5%) |
| 4.0x or more | 3,821 (43.9%) | 1,694 (15.0%) |
| Total | 8,705 (100.0%) | 11,258 (100.0%) |
Real Estate Taxes by Mortgage Status in Otter Tail County
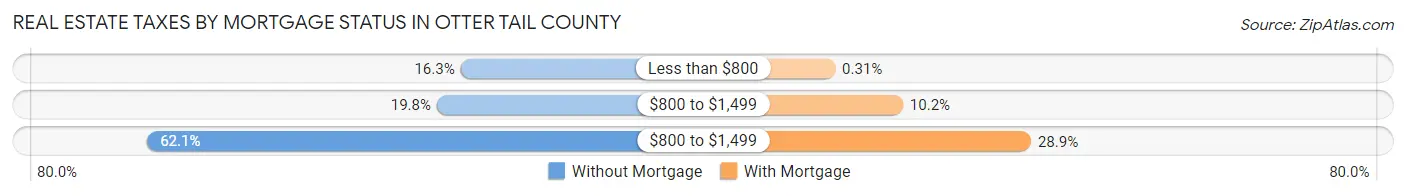
| Property Taxes | Without Mortgage | With Mortgage |
| Less than $800 | 1,420 (16.3%) | 35 (0.3%) |
| $800 to $1,499 | 1,721 (19.8%) | 1,149 (10.2%) |
| $800 to $1,499 | 5,404 (62.1%) | 3,256 (28.9%) |
| Total | 8,705 (100.0%) | 11,258 (100.0%) |
Health & Disability in Otter Tail County
Health Insurance Coverage by Age in Otter Tail County
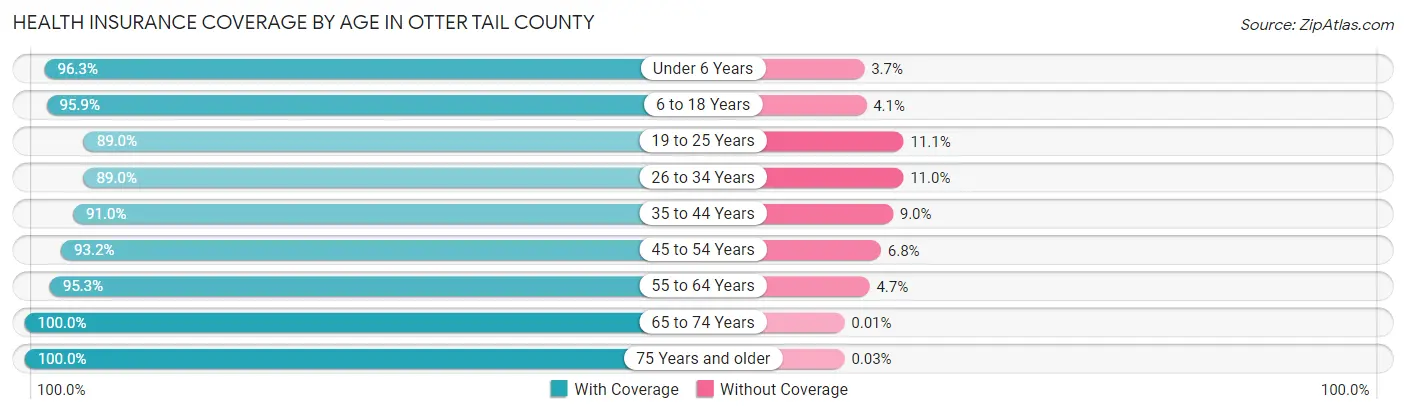
| Age Bracket | With Coverage | Without Coverage |
| Under 6 Years | 3,991 (96.3%) | 154 (3.7%) |
| 6 to 18 Years | 9,216 (95.9%) | 393 (4.1%) |
| 19 to 25 Years | 3,429 (88.9%) | 426 (11.1%) |
| 26 to 34 Years | 4,691 (89.0%) | 579 (11.0%) |
| 35 to 44 Years | 5,947 (91.0%) | 591 (9.0%) |
| 45 to 54 Years | 5,943 (93.2%) | 435 (6.8%) |
| 55 to 64 Years | 9,067 (95.3%) | 447 (4.7%) |
| 65 to 74 Years | 8,199 (100.0%) | 1 (0.0%) |
| 75 Years and older | 5,826 (100.0%) | 2 (0.0%) |
| Total | 56,309 (94.9%) | 3,028 (5.1%) |
Health Insurance Coverage by Citizenship Status in Otter Tail County
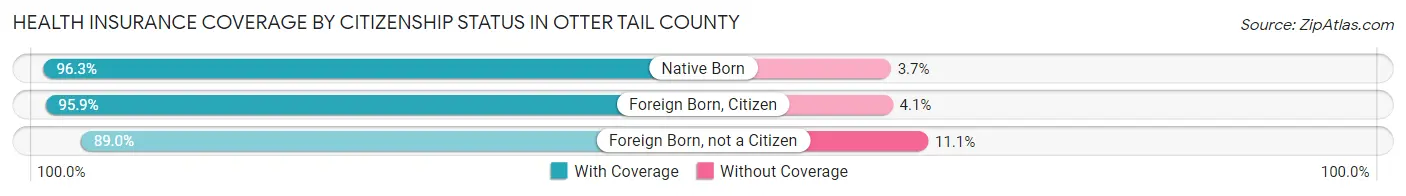
| Citizenship Status | With Coverage | Without Coverage |
| Native Born | 3,991 (96.3%) | 154 (3.7%) |
| Foreign Born, Citizen | 9,216 (95.9%) | 393 (4.1%) |
| Foreign Born, not a Citizen | 3,429 (88.9%) | 426 (11.1%) |
Health Insurance Coverage by Household Income in Otter Tail County
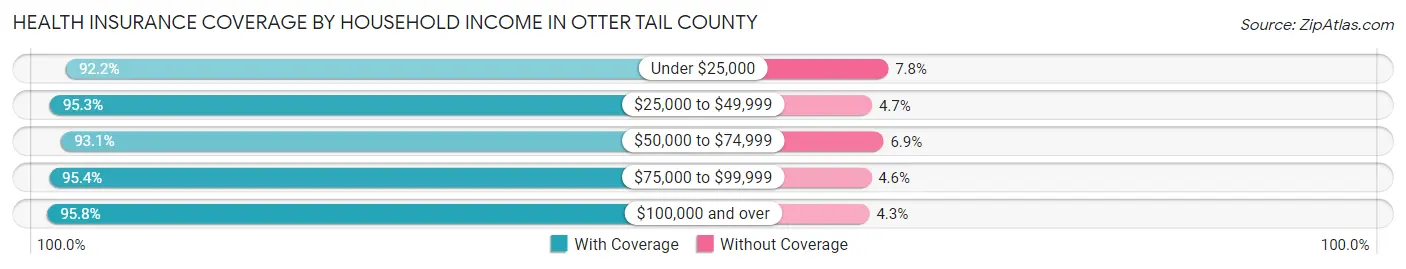
| Household Income | With Coverage | Without Coverage |
| Under $25,000 | 5,300 (92.2%) | 446 (7.8%) |
| $25,000 to $49,999 | 9,488 (95.3%) | 470 (4.7%) |
| $50,000 to $74,999 | 8,938 (93.1%) | 659 (6.9%) |
| $75,000 to $99,999 | 9,176 (95.4%) | 439 (4.6%) |
| $100,000 and over | 22,865 (95.8%) | 1,014 (4.3%) |
Public vs Private Health Insurance Coverage by Age in Otter Tail County
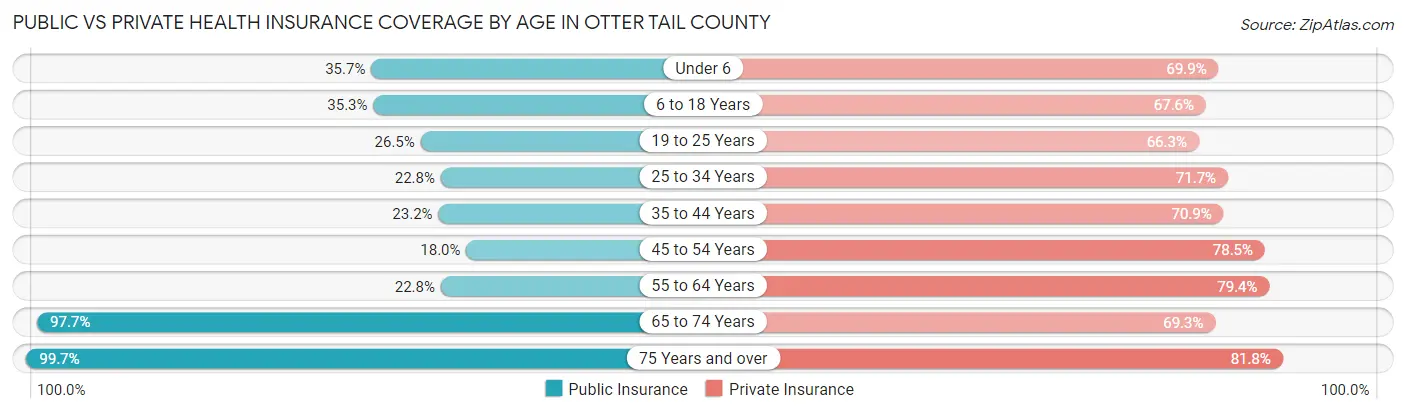
| Age Bracket | Public Insurance | Private Insurance |
| Under 6 | 1,478 (35.7%) | 2,898 (69.9%) |
| 6 to 18 Years | 3,389 (35.3%) | 6,493 (67.6%) |
| 19 to 25 Years | 1,021 (26.5%) | 2,554 (66.2%) |
| 25 to 34 Years | 1,199 (22.8%) | 3,777 (71.7%) |
| 35 to 44 Years | 1,516 (23.2%) | 4,633 (70.9%) |
| 45 to 54 Years | 1,148 (18.0%) | 5,008 (78.5%) |
| 55 to 64 Years | 2,164 (22.8%) | 7,550 (79.4%) |
| 65 to 74 Years | 8,010 (97.7%) | 5,684 (69.3%) |
| 75 Years and over | 5,809 (99.7%) | 4,769 (81.8%) |
| Total | 25,734 (43.4%) | 43,366 (73.1%) |
Disability Status by Sex by Age in Otter Tail County
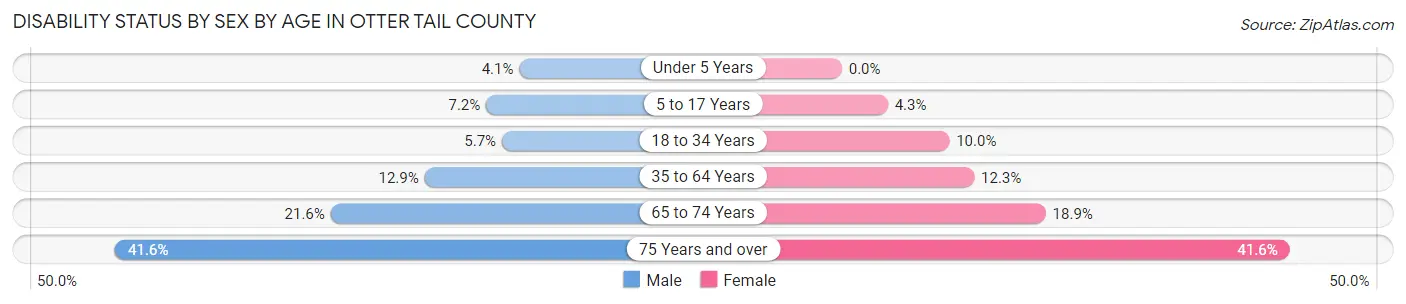
| Age Bracket | Male | Female |
| Under 5 Years | 69 (4.1%) | 0 (0.0%) |
| 5 to 17 Years | 360 (7.2%) | 200 (4.3%) |
| 18 to 34 Years | 294 (5.7%) | 470 (10.0%) |
| 35 to 64 Years | 1,471 (12.9%) | 1,352 (12.3%) |
| 65 to 74 Years | 907 (21.6%) | 757 (18.9%) |
| 75 Years and over | 1,072 (41.6%) | 1,351 (41.6%) |
Disability Class by Sex by Age in Otter Tail County
Disability Class: Hearing Difficulty
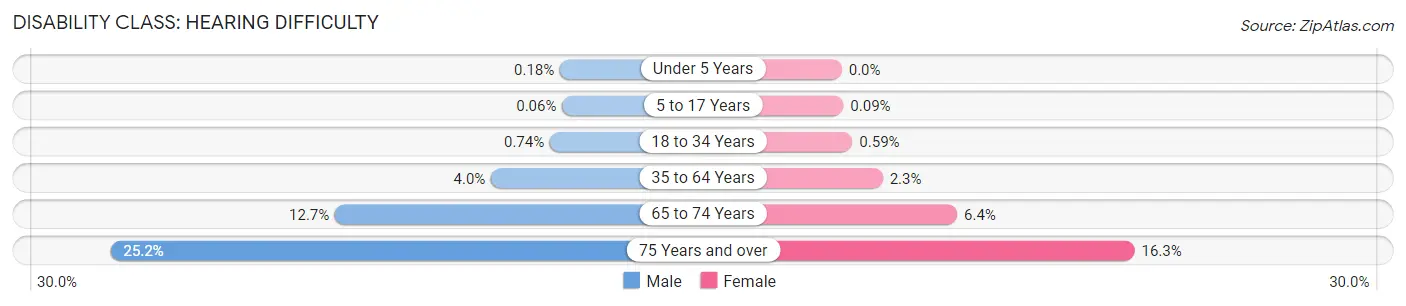
| Age Bracket | Male | Female |
| Under 5 Years | 3 (0.2%) | 0 (0.0%) |
| 5 to 17 Years | 3 (0.1%) | 4 (0.1%) |
| 18 to 34 Years | 38 (0.7%) | 28 (0.6%) |
| 35 to 64 Years | 459 (4.0%) | 251 (2.3%) |
| 65 to 74 Years | 534 (12.7%) | 257 (6.4%) |
| 75 Years and over | 650 (25.2%) | 530 (16.3%) |
Disability Class: Vision Difficulty
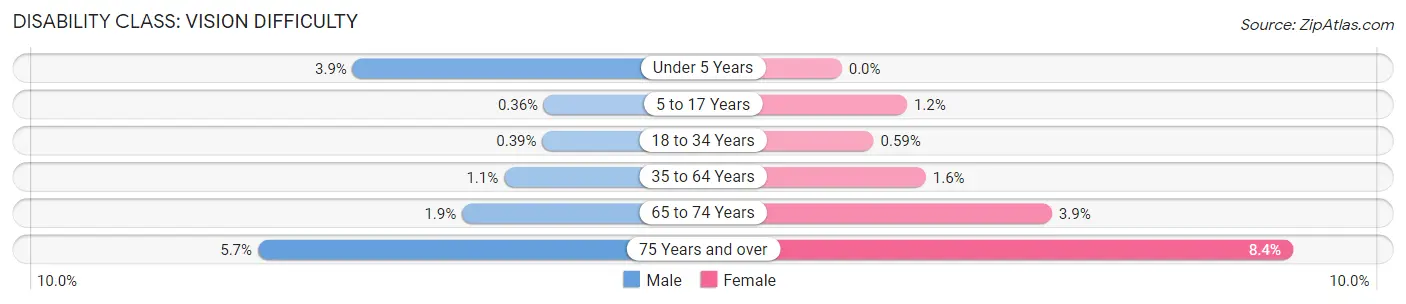
| Age Bracket | Male | Female |
| Under 5 Years | 66 (3.9%) | 0 (0.0%) |
| 5 to 17 Years | 18 (0.4%) | 57 (1.2%) |
| 18 to 34 Years | 20 (0.4%) | 28 (0.6%) |
| 35 to 64 Years | 126 (1.1%) | 172 (1.6%) |
| 65 to 74 Years | 79 (1.9%) | 156 (3.9%) |
| 75 Years and over | 146 (5.7%) | 272 (8.4%) |
Disability Class: Cognitive Difficulty
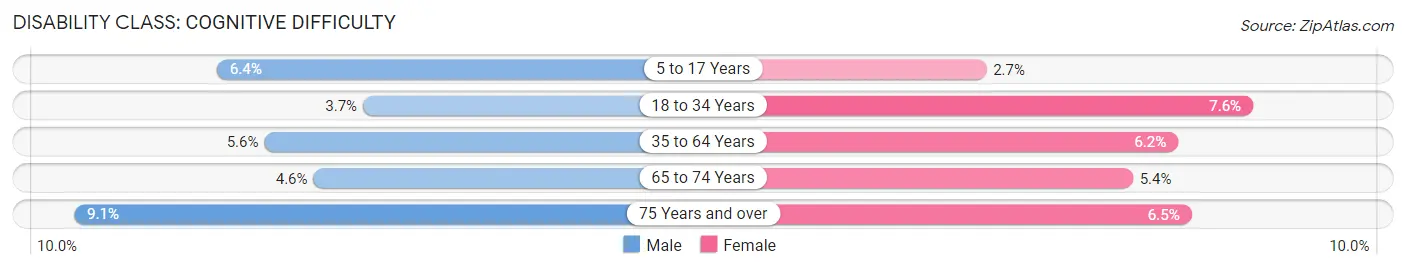
| Age Bracket | Male | Female |
| 5 to 17 Years | 323 (6.4%) | 126 (2.7%) |
| 18 to 34 Years | 192 (3.7%) | 360 (7.6%) |
| 35 to 64 Years | 634 (5.6%) | 687 (6.2%) |
| 65 to 74 Years | 195 (4.6%) | 216 (5.4%) |
| 75 Years and over | 234 (9.1%) | 211 (6.5%) |
Disability Class: Ambulatory Difficulty
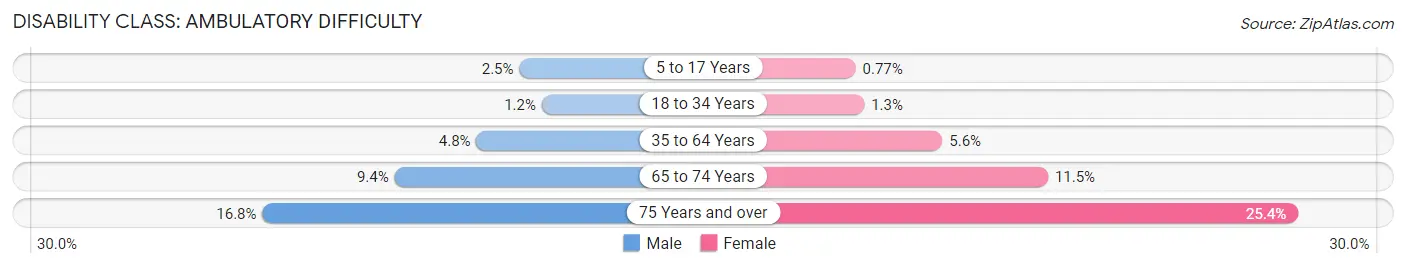
| Age Bracket | Male | Female |
| 5 to 17 Years | 123 (2.5%) | 36 (0.8%) |
| 18 to 34 Years | 62 (1.2%) | 59 (1.3%) |
| 35 to 64 Years | 553 (4.8%) | 616 (5.6%) |
| 65 to 74 Years | 395 (9.4%) | 459 (11.5%) |
| 75 Years and over | 432 (16.8%) | 826 (25.4%) |
Disability Class: Self-Care Difficulty
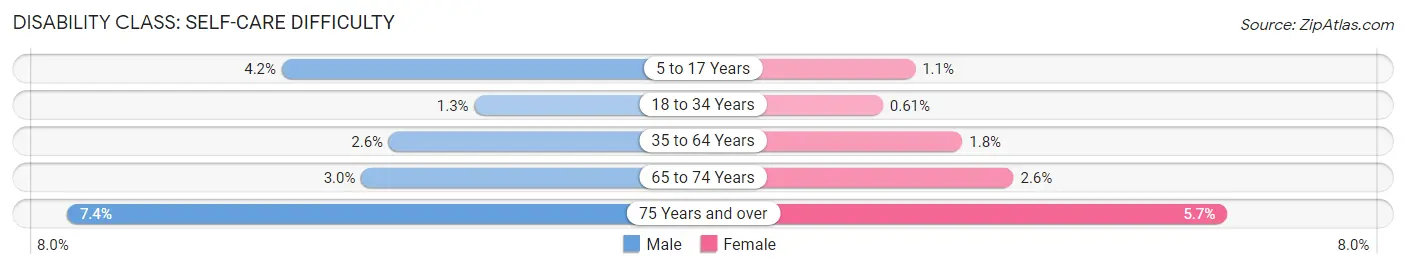
| Age Bracket | Male | Female |
| 5 to 17 Years | 210 (4.2%) | 51 (1.1%) |
| 18 to 34 Years | 68 (1.3%) | 29 (0.6%) |
| 35 to 64 Years | 296 (2.6%) | 197 (1.8%) |
| 65 to 74 Years | 126 (3.0%) | 102 (2.5%) |
| 75 Years and over | 190 (7.4%) | 186 (5.7%) |
Technology Access in Otter Tail County
Computing Device Access in Otter Tail County
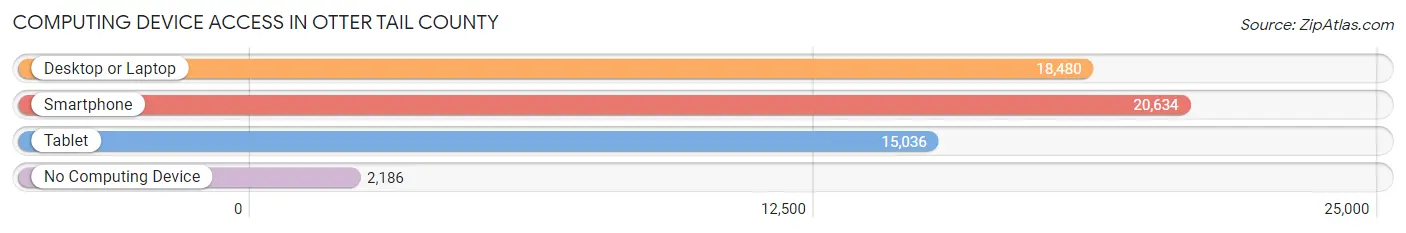
| Device Type | # Households | % Households |
| Desktop or Laptop | 18,480 | 74.2% |
| Smartphone | 20,634 | 82.8% |
| Tablet | 15,036 | 60.4% |
| No Computing Device | 2,186 | 8.8% |
| Total | 24,910 | 100.0% |
Internet Access in Otter Tail County
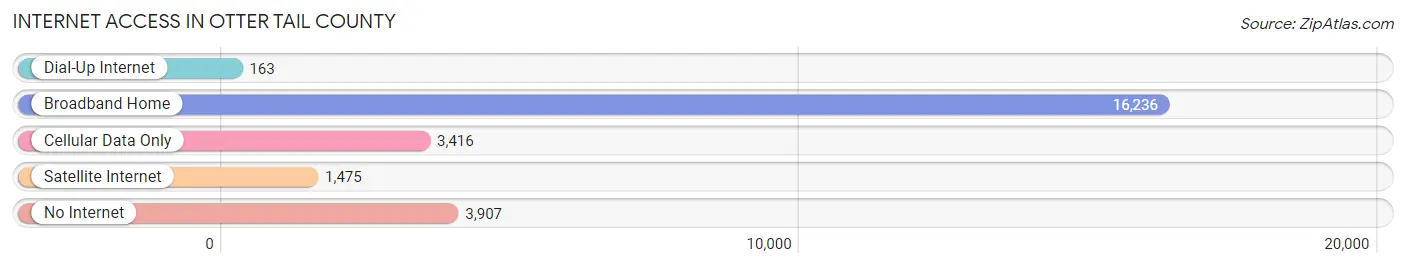
| Internet Type | # Households | % Households |
| Dial-Up Internet | 163 | 0.6% |
| Broadband Home | 16,236 | 65.2% |
| Cellular Data Only | 3,416 | 13.7% |
| Satellite Internet | 1,475 | 5.9% |
| No Internet | 3,907 | 15.7% |
| Total | 24,910 | 100.0% |
Otter Tail County Summary
Otter Tail County is located in the west-central region of Minnesota, and is part of the larger Minnesota Lakes Country region. The county is bordered by Becker County to the north, Wadena County to the east, Todd County to the south, and Wilkin County to the west. The county seat is Fergus Falls, and the largest city is Detroit Lakes. The county has a total area of 1,845 square miles, of which 1,717 square miles is land and 128 square miles is water.
History
Otter Tail County was established in 1858, and was named after the Otter Tail River, which was named by French explorers in the late 17th century. The county was originally inhabited by the Dakota and Ojibwe Native American tribes, and was later settled by European immigrants in the mid-19th century. The county was initially organized as a township in 1868, and was officially incorporated in 1872.
The county experienced rapid growth in the late 19th and early 20th centuries, due to the development of the railroad and the logging industry. The county was also home to several resorts, which attracted tourists from all over the country.
Geography
Otter Tail County is located in the west-central region of Minnesota, and is part of the larger Minnesota Lakes Country region. The county is bordered by Becker County to the north, Wadena County to the east, Todd County to the south, and Wilkin County to the west. The county has a total area of 1,845 square miles, of which 1,717 square miles is land and 128 square miles is water.
The county is home to numerous lakes, including Otter Tail Lake, Big Pine Lake, and Rush Lake. The county also contains several rivers, including the Otter Tail River, the Leaf River, and the Rush River. The county is mostly rural, with the majority of the population living in small towns and villages.
Economy
Otter Tail County has a diverse economy, with a mix of manufacturing, agriculture, tourism, and services. The county is home to several large employers, including Otter Tail Power Company, Otter Tail Corporation, and the Fergus Falls Regional Treatment Center.
Agriculture is an important part of the county's economy, with the majority of the land being used for farming. The county is home to several large farms, including the Otter Tail County Dairy Cooperative and the Otter Tail County Pork Producers.
Tourism is also an important part of the county's economy, with numerous resorts, campgrounds, and recreational areas. The county is home to several popular attractions, including the Otter Tail County Historical Museum, the Fergus Falls State Park, and the Otter Tail County Fair.
Demographics
As of the 2010 census, there were 57,303 people, 22,845 households, and 15,541 families living in the county. The population density was 33.4 people per square mile. The racial makeup of the county was 95.3% White, 0.7% African American, 0.5% Native American, 0.7% Asian, 0.1% Pacific Islander, 1.3% from other races, and 1.4% from two or more races. Hispanic or Latino of any race were 3.2% of the population.
The median income for a household in the county was $45,845, and the median income for a family was $54,945. The per capita income for the county was $22,945. About 8.3% of families and 11.7% of the population were below the poverty line, including 15.2% of those under age 18 and 8.2% of those age 65 or over.
Common Questions
What is the Total Population of Otter Tail County?
Total Population of Otter Tail County is 60,072.
What is the Total Male Population of Otter Tail County?
Total Male Population of Otter Tail County is 30,382.
What is the Total Female Population of Otter Tail County?
Total Female Population of Otter Tail County is 29,690.
What is the Ratio of Males per 100 Females in Otter Tail County?
There are 102.33 Males per 100 Females in Otter Tail County.
What is the Ratio of Females per 100 Males in Otter Tail County?
There are 97.72 Females per 100 Males in Otter Tail County.
What is the Median Population Age in Otter Tail County?
Median Population Age in Otter Tail County is 46.1 Years.
What is the Average Family Size in Otter Tail County
Average Family Size in Otter Tail County is 2.9 People.
What is the Average Household Size in Otter Tail County
Average Household Size in Otter Tail County is 2.4 People.
What is Per Capita Income in Otter Tail County?
Per Capita income in Otter Tail County is $37,202.
What is the Median Family Income in Otter Tail County?
Median Family Income in Otter Tail County is $87,557.
What is the Median Household income in Otter Tail County?
Median Household Income in Otter Tail County is $67,990.
What is Income or Wage Gap in Otter Tail County?
Income or Wage Gap in Otter Tail County is 34.4%.
Women in Otter Tail County earn 65.6 cents for every dollar earned by a man.
What is Family Income Deficit in Otter Tail County?
Family Income Deficit in Otter Tail County is $11,371.
Families that are below poverty line in Otter Tail County earn $11,371 less on average than the poverty threshold level.
What is Inequality or Gini Index in Otter Tail County?
Inequality or Gini Index in Otter Tail County is 0.43.
How Large is the Labor Force in Otter Tail County?
There are 29,834 People in the Labor Forcein in Otter Tail County.
What is the Percentage of People in the Labor Force in Otter Tail County?
61.5% of People are in the Labor Force in Otter Tail County.
What is the Unemployment Rate in Otter Tail County?
Unemployment Rate in Otter Tail County is 5.3%.