Olmsted County, MN
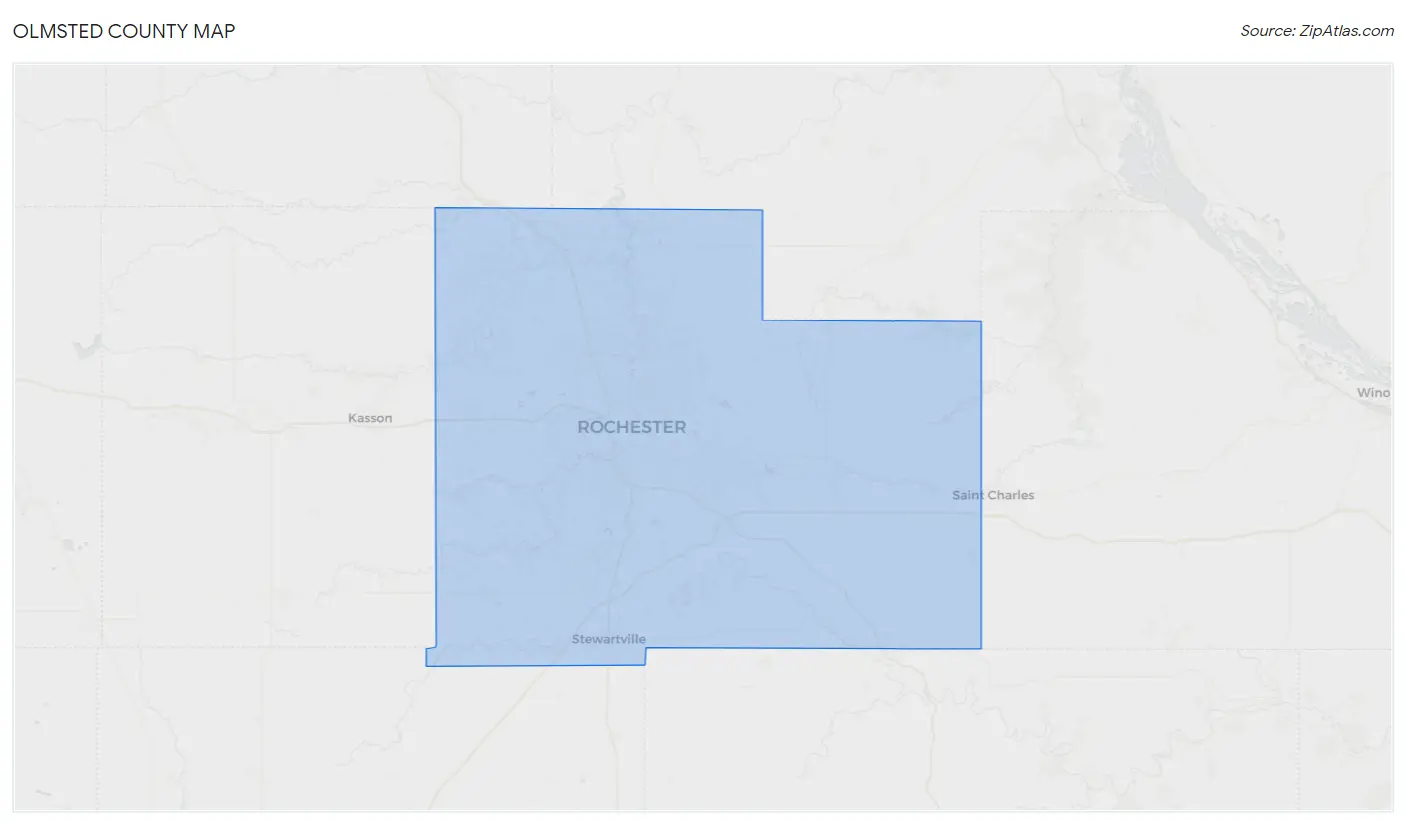
Olmsted County Map
Olmsted County Overview
162,307
TOTAL POPULATION
79,676
MALE POPULATION
82,631
FEMALE POPULATION
96.42
MALES / 100 FEMALES
103.71
FEMALES / 100 MALES
37.6
MEDIAN AGE
3.0
AVG FAMILY SIZE
2.4
AVG HOUSEHOLD SIZE
$49,799
PER CAPITA INCOME
$114,612
AVG FAMILY INCOME
$90,420
AVG HOUSEHOLD INCOME
15.8%
WAGE / INCOME GAP [ % ]
84.2¢/ $1
WAGE / INCOME GAP [ $ ]
$9,119
FAMILY INCOME DEFICIT
0.46
INEQUALITY / GINI INDEX
90,080
LABOR FORCE [ PEOPLE ]
70.7%
PERCENT IN LABOR FORCE
3.4%
UNEMPLOYMENT RATE
Olmsted County Area Codes
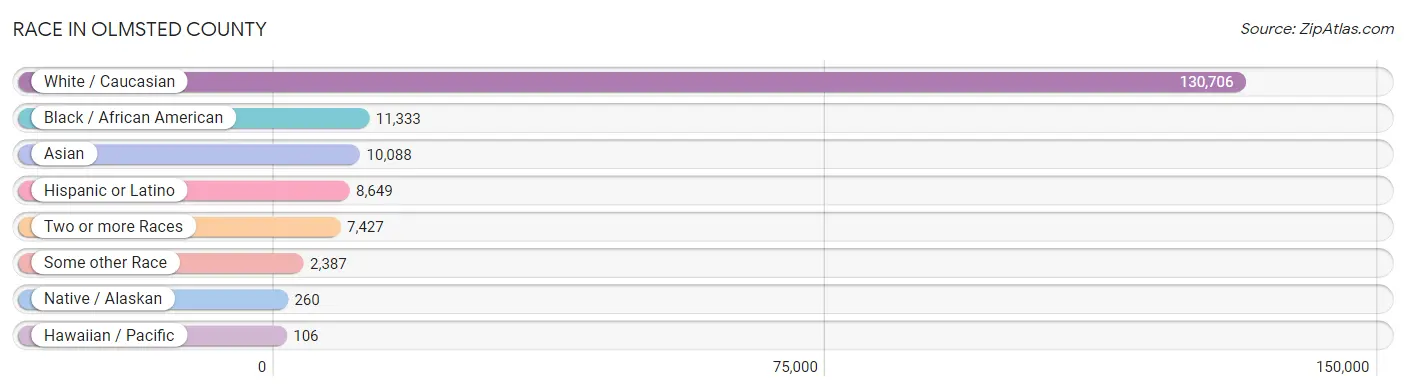
Race in Olmsted County
The most populous races in Olmsted County are White / Caucasian (130,706 | 80.5%), Black / African American (11,333 | 7.0%), and Asian (10,088 | 6.2%).
| Race | # Population | % Population |
| Asian | 10,088 | 6.2% |
| Black / African American | 11,333 | 7.0% |
| Hawaiian / Pacific | 106 | 0.1% |
| Hispanic or Latino | 8,649 | 5.3% |
| Native / Alaskan | 260 | 0.2% |
| White / Caucasian | 130,706 | 80.5% |
| Two or more Races | 7,427 | 4.6% |
| Some other Race | 2,387 | 1.5% |
| Total | 162,307 | 100.0% |
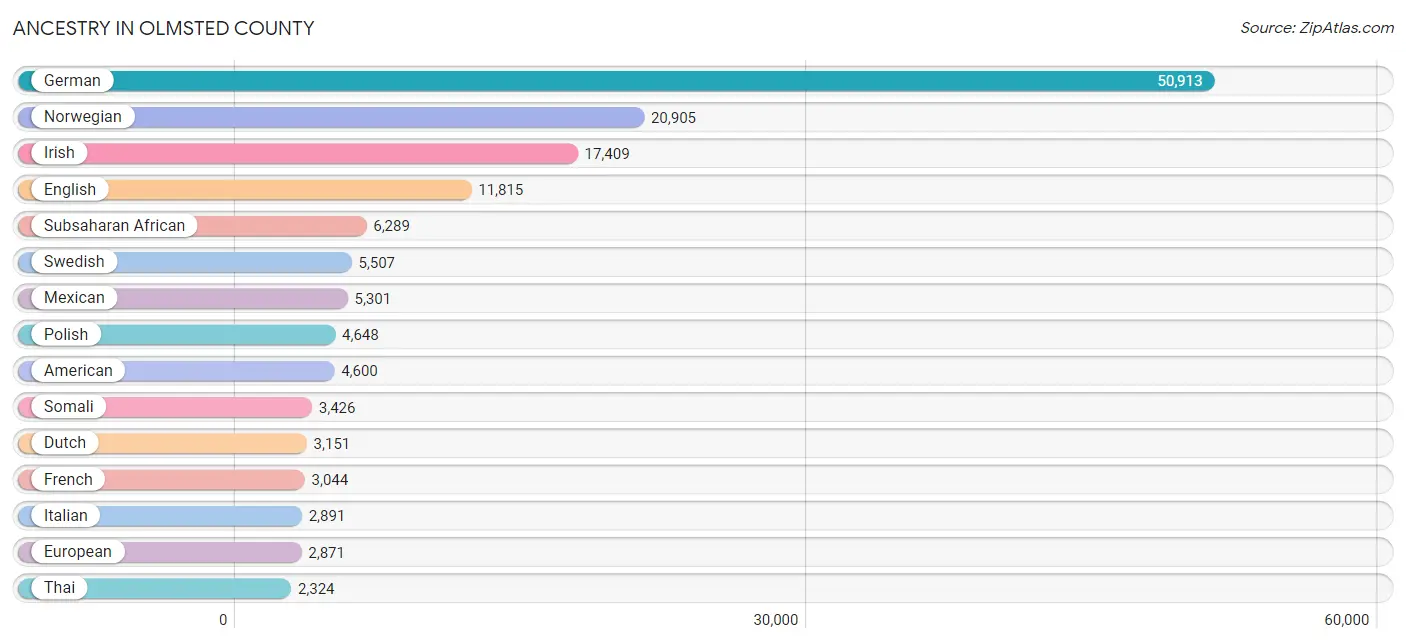
Ancestry in Olmsted County
The most populous ancestries reported in Olmsted County are German (50,913 | 31.4%), Norwegian (20,905 | 12.9%), Irish (17,409 | 10.7%), English (11,815 | 7.3%), and Subsaharan African (6,289 | 3.9%), together accounting for 66.1% of all Olmsted County residents.
| Ancestry | # Population | % Population |
| Afghan | 55 | 0.0% |
| African | 760 | 0.5% |
| Albanian | 14 | 0.0% |
| Alsatian | 9 | 0.0% |
| American | 4,600 | 2.8% |
| Arab | 1,816 | 1.1% |
| Argentinean | 19 | 0.0% |
| Armenian | 72 | 0.0% |
| Austrian | 221 | 0.1% |
| Bangladeshi | 392 | 0.2% |
| Belgian | 262 | 0.2% |
| Bermudan | 36 | 0.0% |
| Bhutanese | 395 | 0.2% |
| Brazilian | 137 | 0.1% |
| British | 580 | 0.4% |
| British West Indian | 8 | 0.0% |
| Bulgarian | 62 | 0.0% |
| Burmese | 474 | 0.3% |
| Canadian | 324 | 0.2% |
| Celtic | 35 | 0.0% |
| Central American | 355 | 0.2% |
| Central American Indian | 14 | 0.0% |
| Cherokee | 97 | 0.1% |
| Chickasaw | 2 | 0.0% |
| Chilean | 72 | 0.0% |
| Chippewa | 256 | 0.2% |
| Choctaw | 15 | 0.0% |
| Colombian | 426 | 0.3% |
| Costa Rican | 26 | 0.0% |
| Cree | 5 | 0.0% |
| Croatian | 289 | 0.2% |
| Crow | 7 | 0.0% |
| Cuban | 217 | 0.1% |
| Czech | 1,837 | 1.1% |
| Czechoslovakian | 268 | 0.2% |
| Danish | 1,759 | 1.1% |
| Delaware | 13 | 0.0% |
| Dominican | 15 | 0.0% |
| Dutch | 3,151 | 1.9% |
| Eastern European | 657 | 0.4% |
| Ecuadorian | 155 | 0.1% |
| Egyptian | 235 | 0.1% |
| English | 11,815 | 7.3% |
| Ethiopian | 734 | 0.4% |
| European | 2,871 | 1.8% |
| Filipino | 138 | 0.1% |
| Finnish | 996 | 0.6% |
| French | 3,044 | 1.9% |
| French Canadian | 1,013 | 0.6% |
| German | 50,913 | 31.4% |
| German Russian | 8 | 0.0% |
| Ghanaian | 81 | 0.1% |
| Greek | 192 | 0.1% |
| Guamanian / Chamorro | 63 | 0.0% |
| Guatemalan | 54 | 0.0% |
| Haitian | 26 | 0.0% |
| Honduran | 32 | 0.0% |
| Hungarian | 373 | 0.2% |
| Icelander | 51 | 0.0% |
| Indian (Asian) | 2,014 | 1.2% |
| Indonesian | 234 | 0.1% |
| Iranian | 211 | 0.1% |
| Iraqi | 165 | 0.1% |
| Irish | 17,409 | 10.7% |
| Italian | 2,891 | 1.8% |
| Jamaican | 2 | 0.0% |
| Japanese | 1,623 | 1.0% |
| Jordanian | 20 | 0.0% |
| Kenyan | 44 | 0.0% |
| Korean | 741 | 0.5% |
| Latvian | 61 | 0.0% |
| Lebanese | 220 | 0.1% |
| Liberian | 3 | 0.0% |
| Lithuanian | 233 | 0.1% |
| Luxembourger | 288 | 0.2% |
| Malaysian | 573 | 0.4% |
| Maltese | 47 | 0.0% |
| Mexican | 5,301 | 3.3% |
| Mexican American Indian | 22 | 0.0% |
| Mongolian | 22 | 0.0% |
| Moroccan | 796 | 0.5% |
| Native Hawaiian | 44 | 0.0% |
| Nicaraguan | 87 | 0.1% |
| Nigerian | 186 | 0.1% |
| Northern European | 493 | 0.3% |
| Norwegian | 20,905 | 12.9% |
| Pakistani | 229 | 0.1% |
| Palestinian | 19 | 0.0% |
| Paraguayan | 81 | 0.1% |
| Pennsylvania German | 51 | 0.0% |
| Peruvian | 160 | 0.1% |
| Polish | 4,648 | 2.9% |
| Portuguese | 55 | 0.0% |
| Puerto Rican | 639 | 0.4% |
| Romanian | 226 | 0.1% |
| Russian | 556 | 0.3% |
| Salvadoran | 156 | 0.1% |
| Samoan | 16 | 0.0% |
| Scandinavian | 2,182 | 1.3% |
| Scotch-Irish | 702 | 0.4% |
| Scottish | 2,119 | 1.3% |
| Serbian | 111 | 0.1% |
| Sioux | 30 | 0.0% |
| Slavic | 23 | 0.0% |
| Slovak | 177 | 0.1% |
| Slovene | 140 | 0.1% |
| Somali | 3,426 | 2.1% |
| South African | 39 | 0.0% |
| South American | 1,029 | 0.6% |
| Spaniard | 63 | 0.0% |
| Spanish | 147 | 0.1% |
| Sri Lankan | 1,957 | 1.2% |
| Subsaharan African | 6,289 | 3.9% |
| Sudanese | 904 | 0.6% |
| Swedish | 5,507 | 3.4% |
| Swiss | 908 | 0.6% |
| Syrian | 8 | 0.0% |
| Thai | 2,324 | 1.4% |
| Tlingit-Haida | 29 | 0.0% |
| Turkish | 107 | 0.1% |
| Ugandan | 59 | 0.0% |
| Ukrainian | 497 | 0.3% |
| Uruguayan | 42 | 0.0% |
| Venezuelan | 74 | 0.1% |
| Vietnamese | 150 | 0.1% |
| Welsh | 784 | 0.5% |
| West Indian | 15 | 0.0% |
| Yugoslavian | 596 | 0.4% | View All 128 Rows |
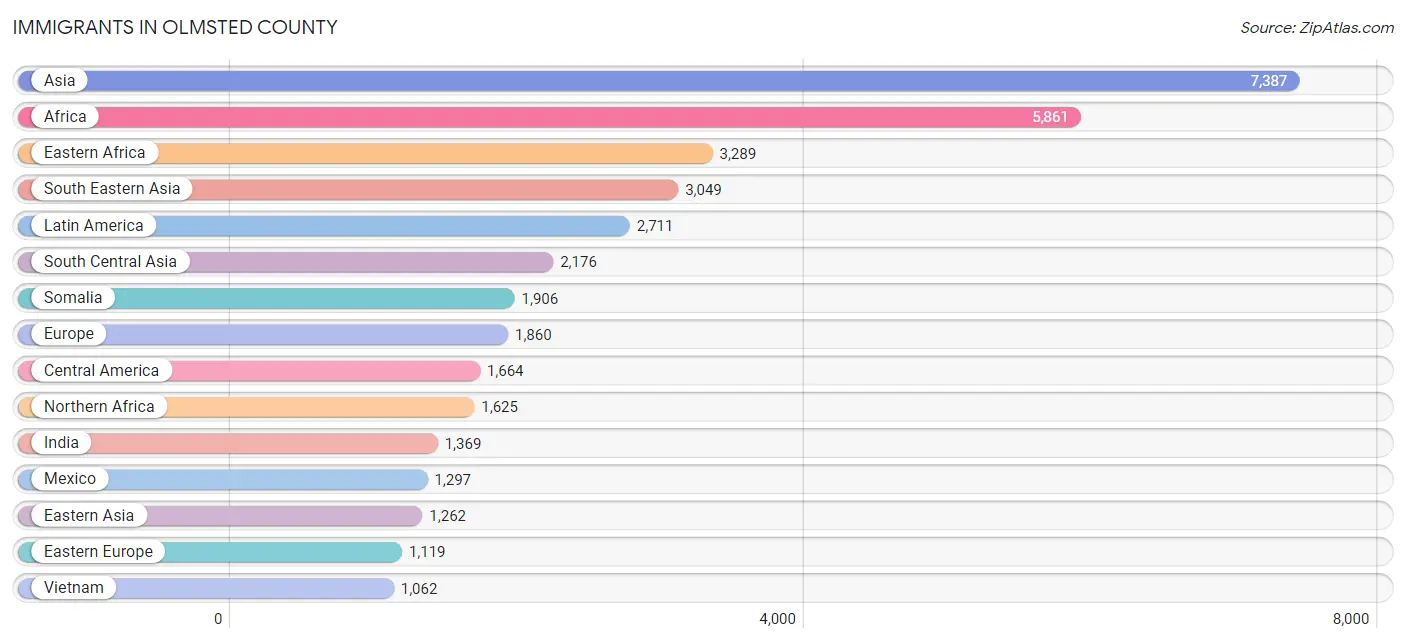
Immigrants in Olmsted County
The most numerous immigrant groups reported in Olmsted County came from Asia (7,387 | 4.5%), Africa (5,861 | 3.6%), Eastern Africa (3,289 | 2.0%), South Eastern Asia (3,049 | 1.9%), and Latin America (2,711 | 1.7%), together accounting for 13.7% of all Olmsted County residents.
| Immigration Origin | # Population | % Population |
| Afghanistan | 8 | 0.0% |
| Africa | 5,861 | 3.6% |
| Argentina | 26 | 0.0% |
| Asia | 7,387 | 4.5% |
| Australia | 45 | 0.0% |
| Austria | 4 | 0.0% |
| Bangladesh | 138 | 0.1% |
| Belarus | 41 | 0.0% |
| Bosnia and Herzegovina | 493 | 0.3% |
| Brazil | 111 | 0.1% |
| Bulgaria | 33 | 0.0% |
| Cambodia | 853 | 0.5% |
| Cameroon | 298 | 0.2% |
| Canada | 368 | 0.2% |
| Caribbean | 177 | 0.1% |
| Central America | 1,664 | 1.0% |
| Chile | 57 | 0.0% |
| China | 898 | 0.5% |
| Colombia | 290 | 0.2% |
| Congo | 94 | 0.1% |
| Croatia | 38 | 0.0% |
| Cuba | 33 | 0.0% |
| Czechoslovakia | 14 | 0.0% |
| Denmark | 10 | 0.0% |
| Eastern Africa | 3,289 | 2.0% |
| Eastern Asia | 1,262 | 0.8% |
| Eastern Europe | 1,119 | 0.7% |
| Ecuador | 81 | 0.1% |
| Egypt | 793 | 0.5% |
| El Salvador | 233 | 0.1% |
| England | 119 | 0.1% |
| Eritrea | 27 | 0.0% |
| Ethiopia | 650 | 0.4% |
| Europe | 1,860 | 1.1% |
| Fiji | 9 | 0.0% |
| France | 67 | 0.0% |
| Germany | 128 | 0.1% |
| Ghana | 135 | 0.1% |
| Greece | 51 | 0.0% |
| Guatemala | 59 | 0.0% |
| Guyana | 25 | 0.0% |
| Haiti | 26 | 0.0% |
| Honduras | 9 | 0.0% |
| Hong Kong | 11 | 0.0% |
| Hungary | 31 | 0.0% |
| India | 1,369 | 0.8% |
| Iran | 155 | 0.1% |
| Iraq | 84 | 0.1% |
| Ireland | 43 | 0.0% |
| Italy | 49 | 0.0% |
| Japan | 97 | 0.1% |
| Jordan | 15 | 0.0% |
| Kazakhstan | 19 | 0.0% |
| Kenya | 385 | 0.2% |
| Korea | 267 | 0.2% |
| Kuwait | 36 | 0.0% |
| Laos | 250 | 0.2% |
| Latin America | 2,711 | 1.7% |
| Lebanon | 64 | 0.0% |
| Liberia | 34 | 0.0% |
| Lithuania | 14 | 0.0% |
| Malaysia | 36 | 0.0% |
| Mexico | 1,297 | 0.8% |
| Middle Africa | 410 | 0.3% |
| Morocco | 347 | 0.2% |
| Nepal | 123 | 0.1% |
| Netherlands | 29 | 0.0% |
| Nicaragua | 22 | 0.0% |
| Nigeria | 284 | 0.2% |
| Northern Africa | 1,625 | 1.0% |
| Northern Europe | 320 | 0.2% |
| Oceania | 54 | 0.0% |
| Pakistan | 303 | 0.2% |
| Peru | 79 | 0.1% |
| Philippines | 351 | 0.2% |
| Poland | 107 | 0.1% |
| Romania | 93 | 0.1% |
| Russia | 109 | 0.1% |
| Saudi Arabia | 247 | 0.2% |
| Scotland | 27 | 0.0% |
| Serbia | 18 | 0.0% |
| Somalia | 1,906 | 1.2% |
| South Africa | 53 | 0.0% |
| South America | 870 | 0.5% |
| South Central Asia | 2,176 | 1.3% |
| South Eastern Asia | 3,049 | 1.9% |
| Southern Europe | 172 | 0.1% |
| Spain | 42 | 0.0% |
| Sri Lanka | 61 | 0.0% |
| Sudan | 469 | 0.3% |
| Switzerland | 21 | 0.0% |
| Syria | 55 | 0.0% |
| Taiwan | 149 | 0.1% |
| Thailand | 284 | 0.2% |
| Turkey | 116 | 0.1% |
| Uganda | 12 | 0.0% |
| Ukraine | 85 | 0.1% |
| Uruguay | 38 | 0.0% |
| Venezuela | 74 | 0.1% |
| Vietnam | 1,062 | 0.6% |
| Western Africa | 453 | 0.3% |
| Western Asia | 889 | 0.5% |
| Western Europe | 249 | 0.2% |
| Yemen | 193 | 0.1% |
| Zaire | 11 | 0.0% | View All 105 Rows |
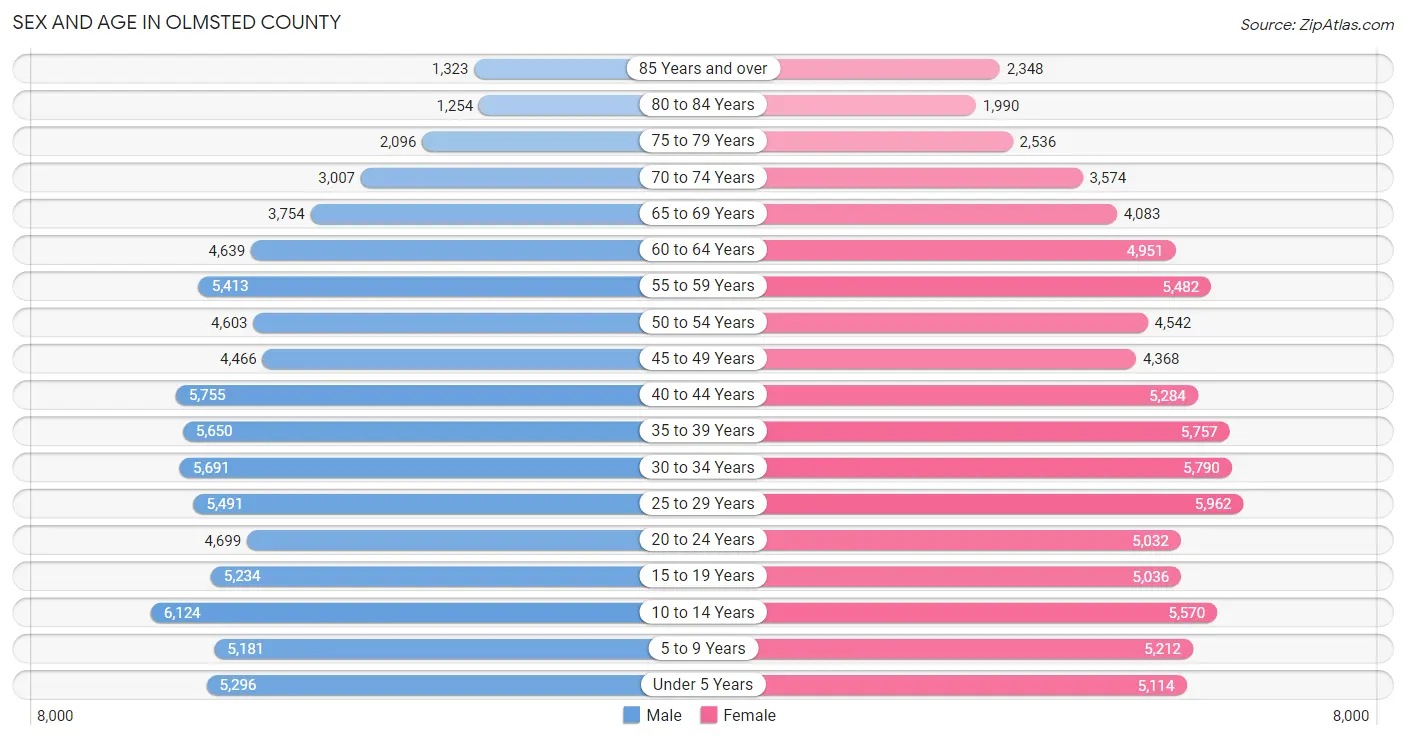
Sex and Age in Olmsted County
Sex and Age in Olmsted County
The most populous age groups in Olmsted County are 10 to 14 Years (6,124 | 7.7%) for men and 25 to 29 Years (5,962 | 7.2%) for women.
| Age Bracket | Male | Female |
| Under 5 Years | 5,296 (6.7%) | 5,114 (6.2%) |
| 5 to 9 Years | 5,181 (6.5%) | 5,212 (6.3%) |
| 10 to 14 Years | 6,124 (7.7%) | 5,570 (6.7%) |
| 15 to 19 Years | 5,234 (6.6%) | 5,036 (6.1%) |
| 20 to 24 Years | 4,699 (5.9%) | 5,032 (6.1%) |
| 25 to 29 Years | 5,491 (6.9%) | 5,962 (7.2%) |
| 30 to 34 Years | 5,691 (7.1%) | 5,790 (7.0%) |
| 35 to 39 Years | 5,650 (7.1%) | 5,757 (7.0%) |
| 40 to 44 Years | 5,755 (7.2%) | 5,284 (6.4%) |
| 45 to 49 Years | 4,466 (5.6%) | 4,368 (5.3%) |
| 50 to 54 Years | 4,603 (5.8%) | 4,542 (5.5%) |
| 55 to 59 Years | 5,413 (6.8%) | 5,482 (6.6%) |
| 60 to 64 Years | 4,639 (5.8%) | 4,951 (6.0%) |
| 65 to 69 Years | 3,754 (4.7%) | 4,083 (4.9%) |
| 70 to 74 Years | 3,007 (3.8%) | 3,574 (4.3%) |
| 75 to 79 Years | 2,096 (2.6%) | 2,536 (3.1%) |
| 80 to 84 Years | 1,254 (1.6%) | 1,990 (2.4%) |
| 85 Years and over | 1,323 (1.7%) | 2,348 (2.8%) |
| Total | 79,676 (100.0%) | 82,631 (100.0%) |
Families and Households in Olmsted County
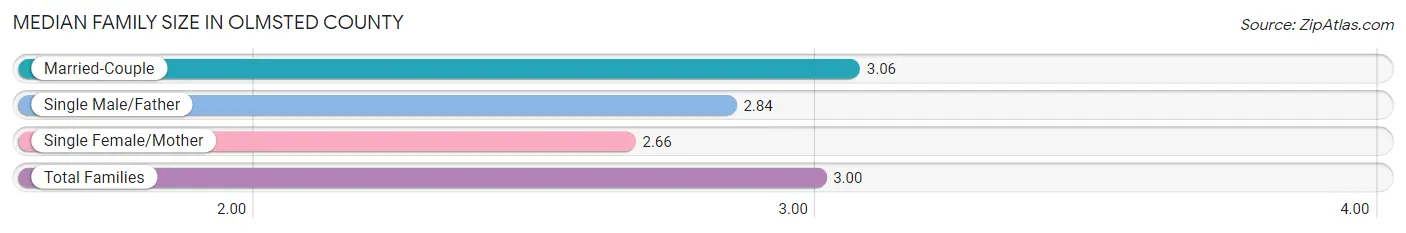
Median Family Size in Olmsted County
The median family size in Olmsted County is 3.00 persons per family, with married-couple families (33,835 | 81.6%) accounting for the largest median family size of 3.06 persons per family. On the other hand, single female/mother families (5,191 | 12.5%) represent the smallest median family size with 2.66 persons per family.
| Family Type | # Families | Family Size |
| Married-Couple | 33,835 (81.6%) | 3.06 |
| Single Male/Father | 2,459 (5.9%) | 2.84 |
| Single Female/Mother | 5,191 (12.5%) | 2.66 |
| Total Families | 41,485 (100.0%) | 3.00 |
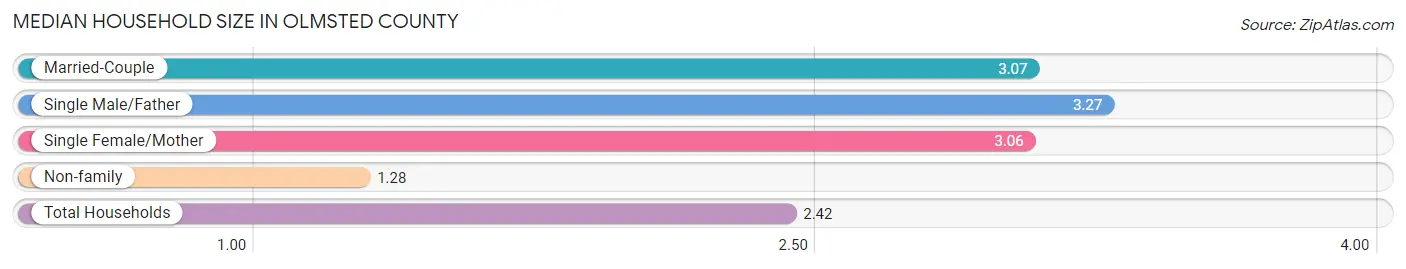
Median Household Size in Olmsted County
The median household size in Olmsted County is 2.42 persons per household, with single male/father households (2,459 | 3.7%) accounting for the largest median household size of 3.27 persons per household. non-family households (24,485 | 37.1%) represent the smallest median household size with 1.28 persons per household.
| Household Type | # Households | Household Size |
| Married-Couple | 33,835 (51.3%) | 3.07 |
| Single Male/Father | 2,459 (3.7%) | 3.27 |
| Single Female/Mother | 5,191 (7.9%) | 3.06 |
| Non-family | 24,485 (37.1%) | 1.28 |
| Total Households | 65,970 (100.0%) | 2.42 |
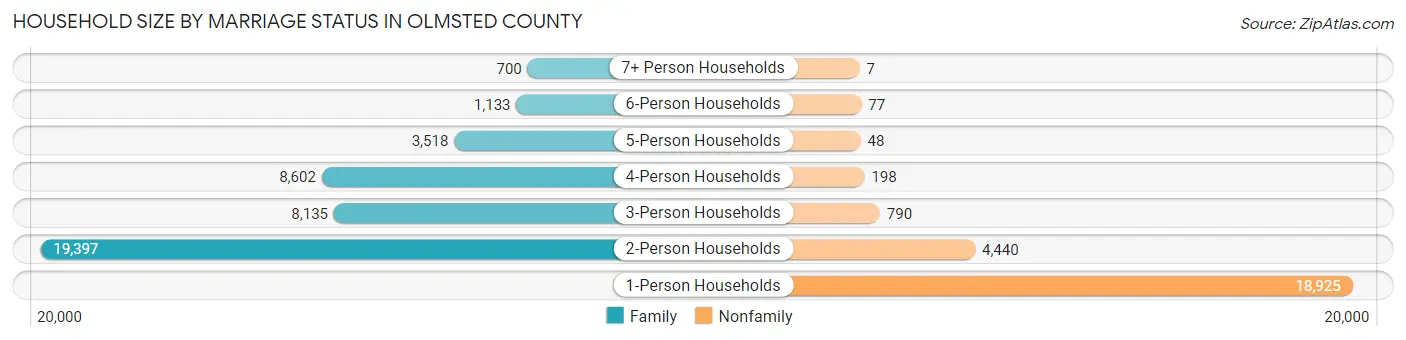
Household Size by Marriage Status in Olmsted County
Out of a total of 65,970 households in Olmsted County, 41,485 (62.9%) are family households, while 24,485 (37.1%) are nonfamily households. The most numerous type of family households are 2-person households, comprising 19,397, and the most common type of nonfamily households are 1-person households, comprising 18,925.
| Household Size | Family Households | Nonfamily Households |
| 1-Person Households | - | 18,925 (28.7%) |
| 2-Person Households | 19,397 (29.4%) | 4,440 (6.7%) |
| 3-Person Households | 8,135 (12.3%) | 790 (1.2%) |
| 4-Person Households | 8,602 (13.0%) | 198 (0.3%) |
| 5-Person Households | 3,518 (5.3%) | 48 (0.1%) |
| 6-Person Households | 1,133 (1.7%) | 77 (0.1%) |
| 7+ Person Households | 700 (1.1%) | 7 (0.0%) |
| Total | 41,485 (62.9%) | 24,485 (37.1%) |
Female Fertility in Olmsted County
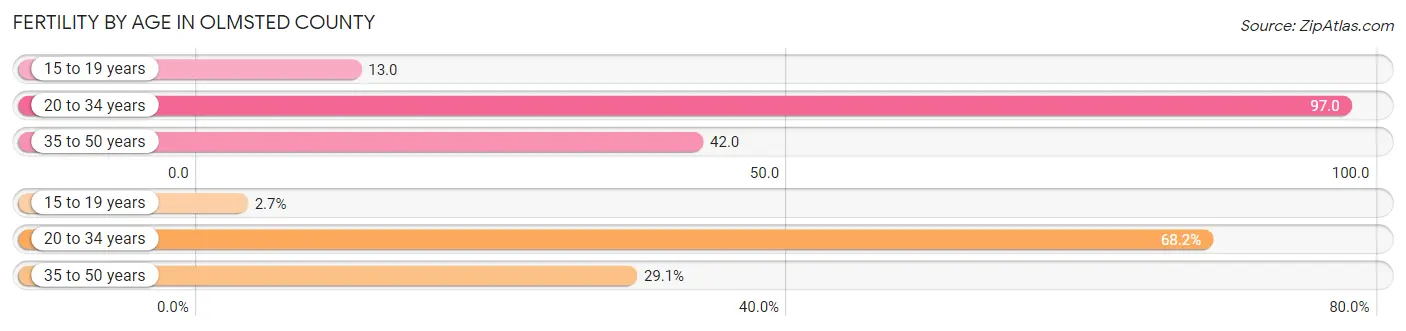
Fertility by Age in Olmsted County
Average fertility rate in Olmsted County is 62.0 births per 1,000 women. Women in the age bracket of 20 to 34 years have the highest fertility rate with 97.0 births per 1,000 women. Women in the age bracket of 20 to 34 years acount for 68.2% of all women with births.
| Age Bracket | Women with Births | Births / 1,000 Women |
| 15 to 19 years | 64 (2.7%) | 13.0 |
| 20 to 34 years | 1,624 (68.2%) | 97.0 |
| 35 to 50 years | 693 (29.1%) | 42.0 |
| Total | 2,381 (100.0%) | 62.0 |
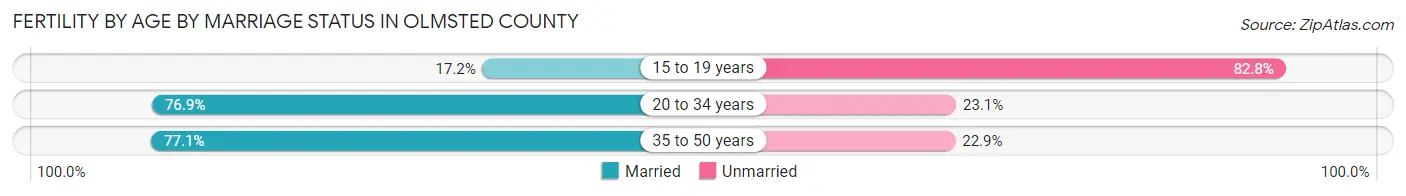
Fertility by Age by Marriage Status in Olmsted County
75.3% of women with births (2,381) in Olmsted County are married. The highest percentage of unmarried women with births falls into 15 to 19 years age bracket with 82.8% of them unmarried at the time of birth, while the lowest percentage of unmarried women with births belong to 35 to 50 years age bracket with 22.9% of them unmarried.
| Age Bracket | Married | Unmarried |
| 15 to 19 years | 11 (17.2%) | 53 (82.8%) |
| 20 to 34 years | 1,249 (76.9%) | 375 (23.1%) |
| 35 to 50 years | 534 (77.1%) | 159 (22.9%) |
| Total | 1,793 (75.3%) | 588 (24.7%) |
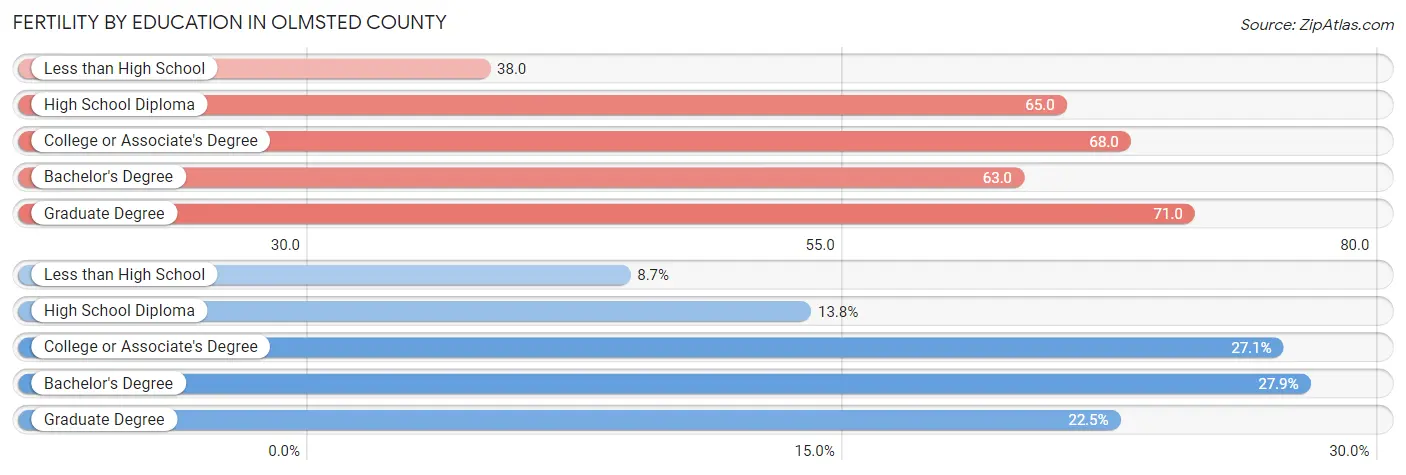
Fertility by Education in Olmsted County
Average fertility rate in Olmsted County is 62.0 births per 1,000 women. Women with the education attainment of graduate degree have the highest fertility rate of 71.0 births per 1,000 women, while women with the education attainment of less than high school have the lowest fertility at 38.0 births per 1,000 women. Women with the education attainment of bachelor's degree represent 27.9% of all women with births.
| Educational Attainment | Women with Births | Births / 1,000 Women |
| Less than High School | 208 (8.7%) | 38.0 |
| High School Diploma | 329 (13.8%) | 65.0 |
| College or Associate's Degree | 645 (27.1%) | 68.0 |
| Bachelor's Degree | 663 (27.9%) | 63.0 |
| Graduate Degree | 536 (22.5%) | 71.0 |
| Total | 2,381 (100.0%) | 62.0 |
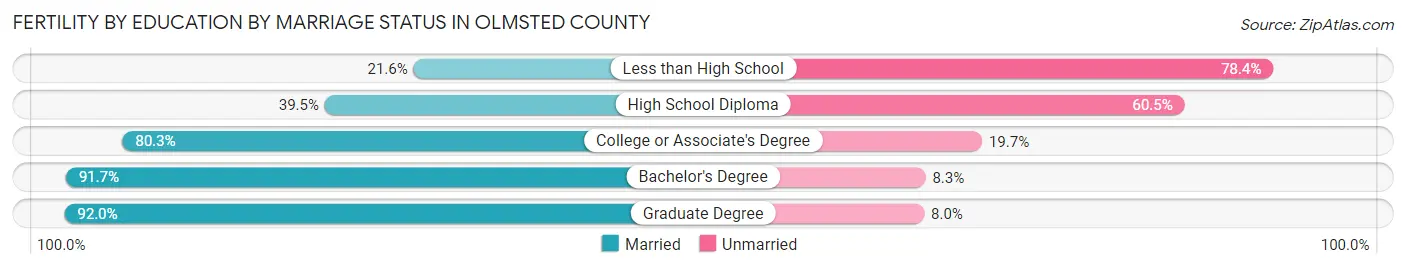
Fertility by Education by Marriage Status in Olmsted County
24.7% of women with births in Olmsted County are unmarried. Women with the educational attainment of graduate degree are most likely to be married with 92.0% of them married at childbirth, while women with the educational attainment of less than high school are least likely to be married with 78.4% of them unmarried at childbirth.
| Educational Attainment | Married | Unmarried |
| Less than High School | 45 (21.6%) | 163 (78.4%) |
| High School Diploma | 130 (39.5%) | 199 (60.5%) |
| College or Associate's Degree | 518 (80.3%) | 127 (19.7%) |
| Bachelor's Degree | 608 (91.7%) | 55 (8.3%) |
| Graduate Degree | 493 (92.0%) | 43 (8.0%) |
| Total | 1,793 (75.3%) | 588 (24.7%) |
Income in Olmsted County
Income Overview in Olmsted County
Per Capita Income in Olmsted County is $49,799, while median incomes of families and households are $114,612 and $90,420 respectively.
| Characteristic | Number | Measure |
| Per Capita Income | 162,307 | $49,799 |
| Median Family Income | 41,485 | $114,612 |
| Mean Family Income | 41,485 | $147,997 |
| Median Household Income | 65,970 | $90,420 |
| Mean Household Income | 65,970 | $122,239 |
| Income Deficit | 41,485 | $9,119 |
| Wage / Income Gap (%) | 162,307 | 15.76% |
| Wage / Income Gap ($) | 162,307 | 84.24¢ per $1 |
| Gini / Inequality Index | 162,307 | 0.46 |
Earnings by Sex in Olmsted County
Average Earnings in Olmsted County are $51,140, $55,675 for men and $46,898 for women, a difference of 15.8%.
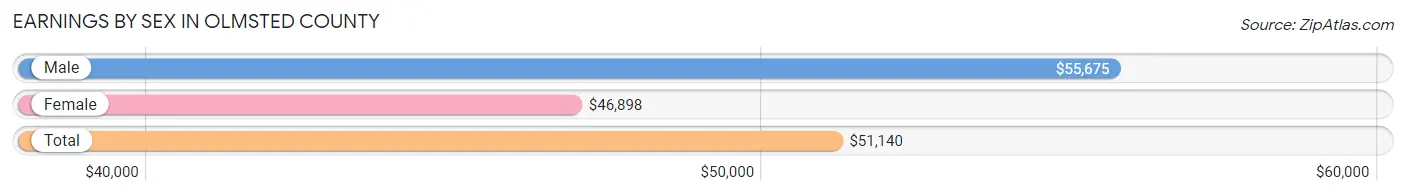
| Sex | Number | Average Earnings |
| Male | 48,153 (51.2%) | $55,675 |
| Female | 45,798 (48.7%) | $46,898 |
| Total | 93,951 (100.0%) | $51,140 |
Earnings by Sex by Income Bracket in Olmsted County
The most common earnings brackets in Olmsted County are $100,000+ for men (11,393 | 23.7%) and $75,000 to $99,999 for women (5,891 | 12.9%).
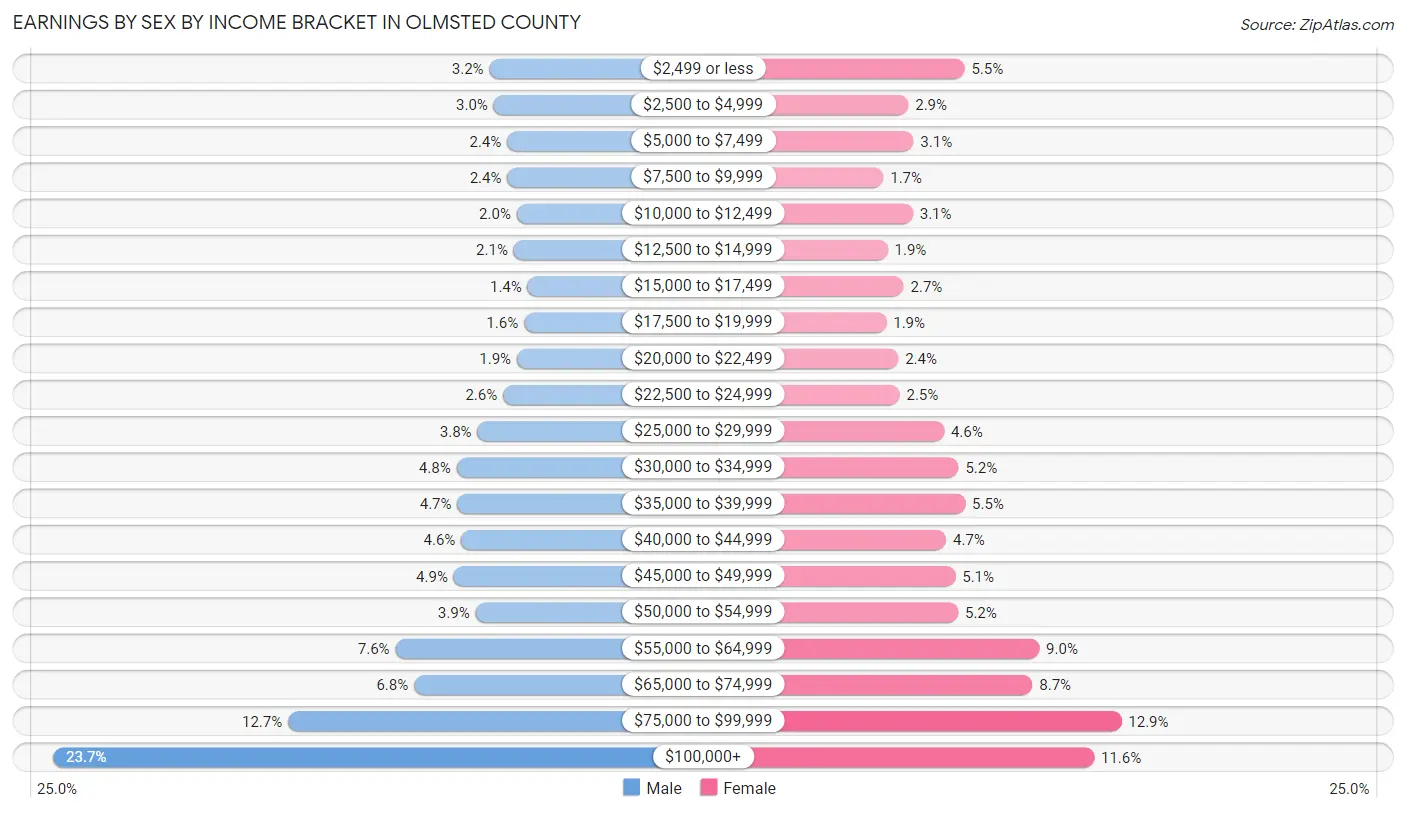
| Income | Male | Female |
| $2,499 or less | 1,554 (3.2%) | 2,523 (5.5%) |
| $2,500 to $4,999 | 1,457 (3.0%) | 1,321 (2.9%) |
| $5,000 to $7,499 | 1,158 (2.4%) | 1,430 (3.1%) |
| $7,500 to $9,999 | 1,151 (2.4%) | 784 (1.7%) |
| $10,000 to $12,499 | 939 (1.9%) | 1,416 (3.1%) |
| $12,500 to $14,999 | 1,006 (2.1%) | 874 (1.9%) |
| $15,000 to $17,499 | 692 (1.4%) | 1,218 (2.7%) |
| $17,500 to $19,999 | 777 (1.6%) | 845 (1.8%) |
| $20,000 to $22,499 | 934 (1.9%) | 1,102 (2.4%) |
| $22,500 to $24,999 | 1,245 (2.6%) | 1,129 (2.5%) |
| $25,000 to $29,999 | 1,827 (3.8%) | 2,084 (4.5%) |
| $30,000 to $34,999 | 2,299 (4.8%) | 2,396 (5.2%) |
| $35,000 to $39,999 | 2,276 (4.7%) | 2,536 (5.5%) |
| $40,000 to $44,999 | 2,191 (4.5%) | 2,128 (4.6%) |
| $45,000 to $49,999 | 2,358 (4.9%) | 2,328 (5.1%) |
| $50,000 to $54,999 | 1,867 (3.9%) | 2,385 (5.2%) |
| $55,000 to $64,999 | 3,674 (7.6%) | 4,126 (9.0%) |
| $65,000 to $74,999 | 3,257 (6.8%) | 3,979 (8.7%) |
| $75,000 to $99,999 | 6,098 (12.7%) | 5,891 (12.9%) |
| $100,000+ | 11,393 (23.7%) | 5,303 (11.6%) |
| Total | 48,153 (100.0%) | 45,798 (100.0%) |
Earnings by Sex by Educational Attainment in Olmsted County
Average earnings in Olmsted County are $64,846 for men and $53,383 for women, a difference of 17.7%. Men with an educational attainment of graduate degree enjoy the highest average annual earnings of $113,240, while those with less than high school education earn the least with $32,981. Women with an educational attainment of graduate degree earn the most with the average annual earnings of $77,360, while those with less than high school education have the smallest earnings of $26,632.
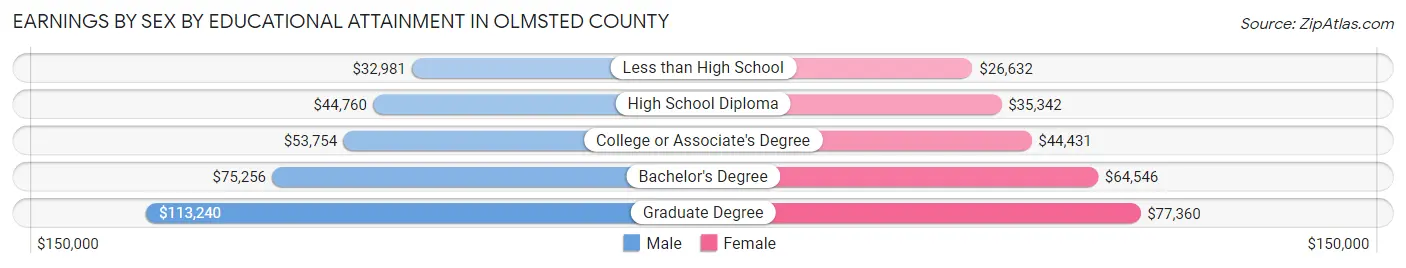
| Educational Attainment | Male Income | Female Income |
| Less than High School | $32,981 | $26,632 |
| High School Diploma | $44,760 | $35,342 |
| College or Associate's Degree | $53,754 | $44,431 |
| Bachelor's Degree | $75,256 | $64,546 |
| Graduate Degree | $113,240 | $77,360 |
| Total | $64,846 | $53,383 |
Family Income in Olmsted County
Family Income Brackets in Olmsted County
According to the Olmsted County family income data, there are 9,915 families falling into the $100,000 to $149,999 income range, which is the most common income bracket and makes up 23.9% of all families. Conversely, the $10,000 to $14,999 income bracket is the least frequent group with only 415 families (1.0%) belonging to this category.
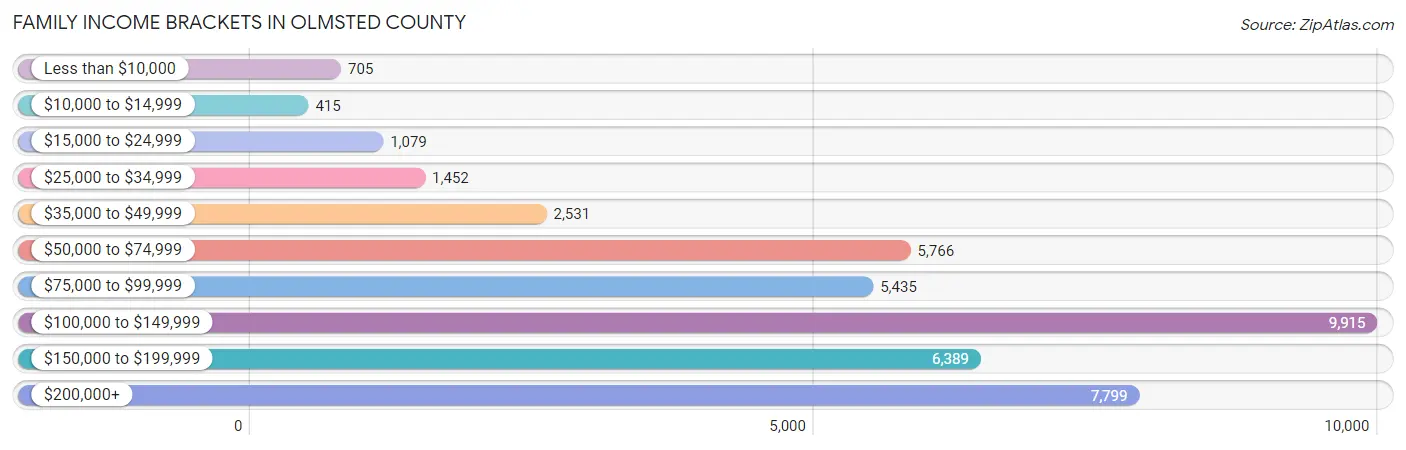
| Income Bracket | # Families | % Families |
| Less than $10,000 | 705 | 1.7% |
| $10,000 to $14,999 | 415 | 1.0% |
| $15,000 to $24,999 | 1,079 | 2.6% |
| $25,000 to $34,999 | 1,452 | 3.5% |
| $35,000 to $49,999 | 2,531 | 6.1% |
| $50,000 to $74,999 | 5,766 | 13.9% |
| $75,000 to $99,999 | 5,435 | 13.1% |
| $100,000 to $149,999 | 9,915 | 23.9% |
| $150,000 to $199,999 | 6,389 | 15.4% |
| $200,000+ | 7,799 | 18.8% |
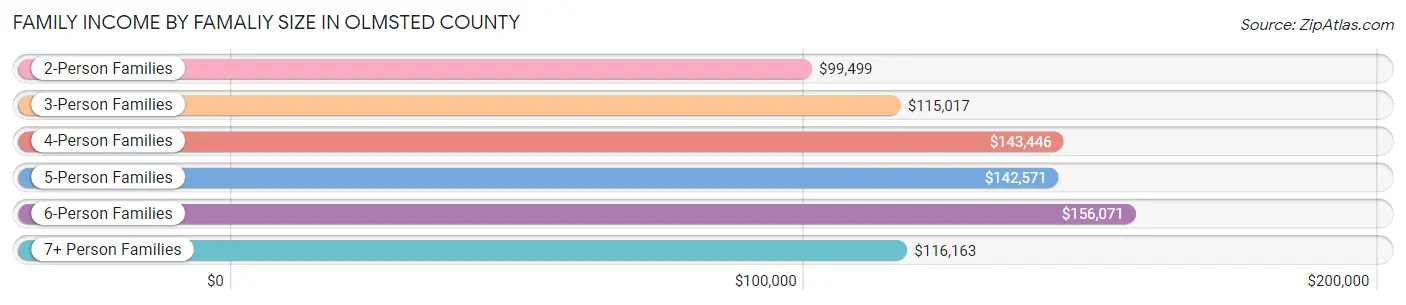
Family Income by Famaliy Size in Olmsted County
6-person families (1,026 | 2.5%) account for the highest median family income in Olmsted County with $156,071 per family, while 2-person families (20,665 | 49.8%) have the highest median income of $49,750 per family member.
| Income Bracket | # Families | Median Income |
| 2-Person Families | 20,665 (49.8%) | $99,499 |
| 3-Person Families | 8,282 (20.0%) | $115,017 |
| 4-Person Families | 7,719 (18.6%) | $143,446 |
| 5-Person Families | 3,176 (7.7%) | $142,571 |
| 6-Person Families | 1,026 (2.5%) | $156,071 |
| 7+ Person Families | 617 (1.5%) | $116,163 |
| Total | 41,485 (100.0%) | $114,612 |
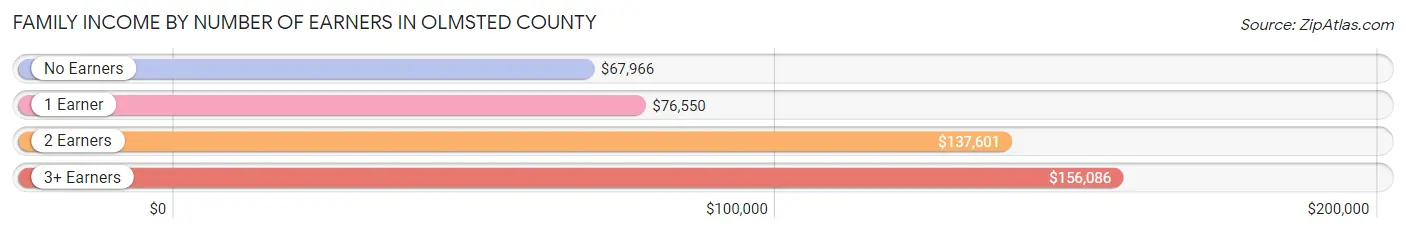
Family Income by Number of Earners in Olmsted County
The median family income in Olmsted County is $114,612, with families comprising 3+ earners (4,561) having the highest median family income of $156,086, while families with no earners (5,745) have the lowest median family income of $67,966, accounting for 11.0% and 13.9% of families, respectively.
| Number of Earners | # Families | Median Income |
| No Earners | 5,745 (13.9%) | $67,966 |
| 1 Earner | 10,337 (24.9%) | $76,550 |
| 2 Earners | 20,842 (50.2%) | $137,601 |
| 3+ Earners | 4,561 (11.0%) | $156,086 |
| Total | 41,485 (100.0%) | $114,612 |
Household Income in Olmsted County
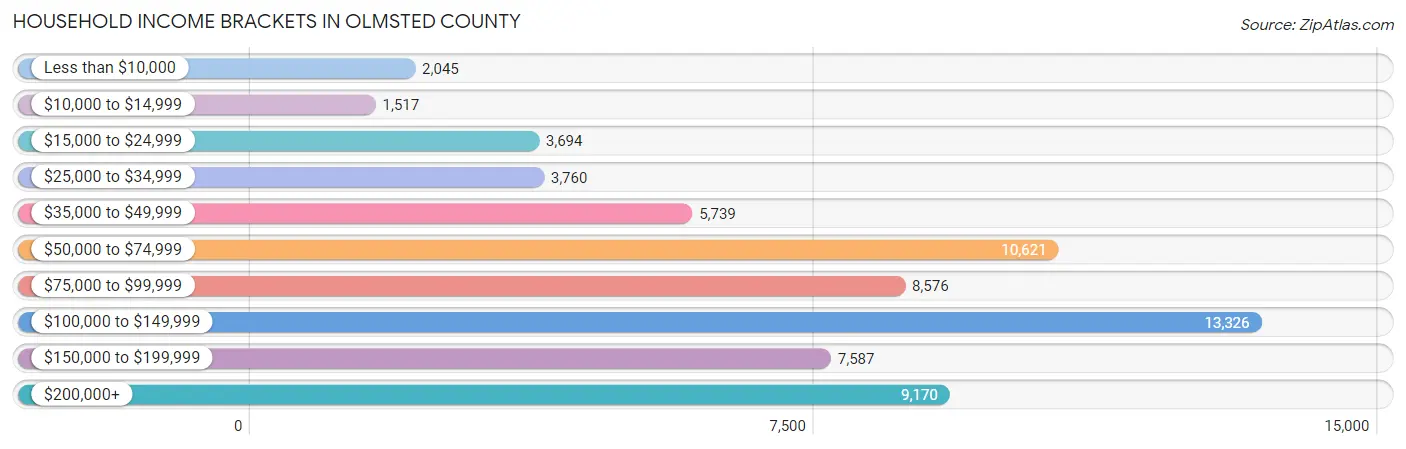
Household Income Brackets in Olmsted County
With 13,326 households falling in the category, the $100,000 to $149,999 income range is the most frequent in Olmsted County, accounting for 20.2% of all households. In contrast, only 1,517 households (2.3%) fall into the $10,000 to $14,999 income bracket, making it the least populous group.
| Income Bracket | # Households | % Households |
| Less than $10,000 | 2,045 | 3.1% |
| $10,000 to $14,999 | 1,517 | 2.3% |
| $15,000 to $24,999 | 3,694 | 5.6% |
| $25,000 to $34,999 | 3,760 | 5.7% |
| $35,000 to $49,999 | 5,739 | 8.7% |
| $50,000 to $74,999 | 10,621 | 16.1% |
| $75,000 to $99,999 | 8,576 | 13.0% |
| $100,000 to $149,999 | 13,326 | 20.2% |
| $150,000 to $199,999 | 7,587 | 11.5% |
| $200,000+ | 9,170 | 13.9% |
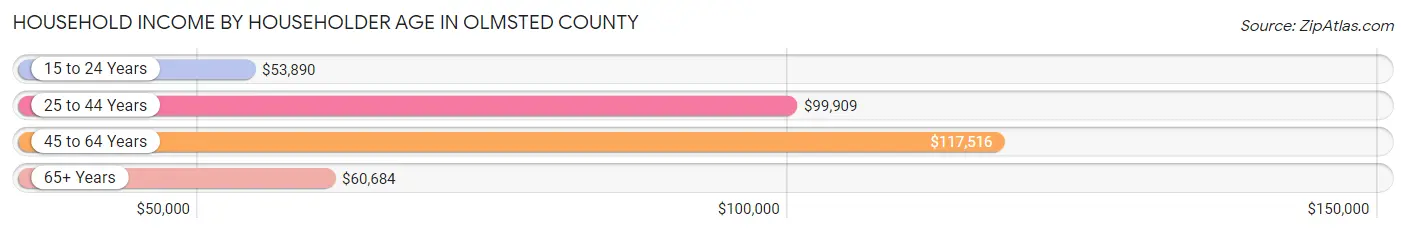
Household Income by Householder Age in Olmsted County
The median household income in Olmsted County is $90,420, with the highest median household income of $117,516 found in the 45 to 64 years age bracket for the primary householder. A total of 22,126 households (33.5%) fall into this category. Meanwhile, the 15 to 24 years age bracket for the primary householder has the lowest median household income of $53,890, with 3,728 households (5.7%) in this group.
| Income Bracket | # Households | Median Income |
| 15 to 24 Years | 3,728 (5.7%) | $53,890 |
| 25 to 44 Years | 24,219 (36.7%) | $99,909 |
| 45 to 64 Years | 22,126 (33.5%) | $117,516 |
| 65+ Years | 15,897 (24.1%) | $60,684 |
| Total | 65,970 (100.0%) | $90,420 |
Poverty in Olmsted County
Income Below Poverty by Sex and Age in Olmsted County
With 6.8% poverty level for males and 8.9% for females among the residents of Olmsted County, 18 to 24 year old males and 18 to 24 year old females are the most vulnerable to poverty, with 867 males (13.2%) and 1,535 females (22.7%) in their respective age groups living below the poverty level.
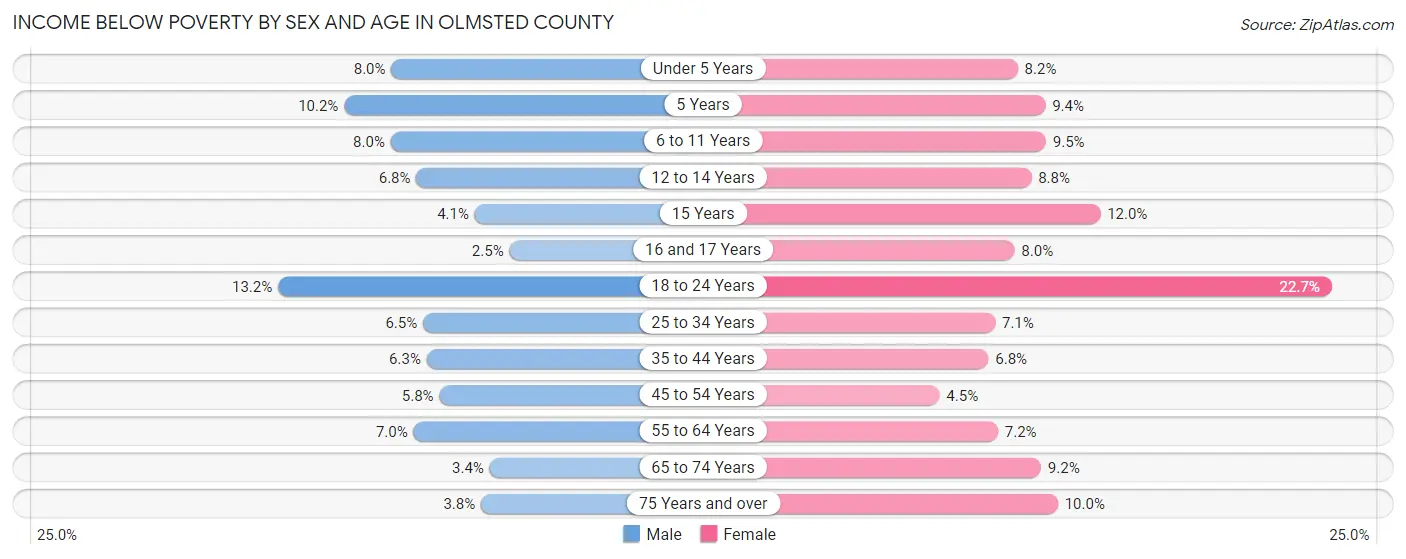
| Age Bracket | Male | Female |
| Under 5 Years | 422 (8.0%) | 410 (8.2%) |
| 5 Years | 109 (10.2%) | 71 (9.4%) |
| 6 to 11 Years | 512 (8.0%) | 634 (9.5%) |
| 12 to 14 Years | 236 (6.8%) | 245 (8.8%) |
| 15 Years | 53 (4.1%) | 133 (12.0%) |
| 16 and 17 Years | 52 (2.5%) | 176 (8.0%) |
| 18 to 24 Years | 867 (13.2%) | 1,535 (22.7%) |
| 25 to 34 Years | 723 (6.5%) | 836 (7.1%) |
| 35 to 44 Years | 705 (6.3%) | 751 (6.8%) |
| 45 to 54 Years | 511 (5.8%) | 403 (4.5%) |
| 55 to 64 Years | 690 (7.0%) | 754 (7.2%) |
| 65 to 74 Years | 224 (3.4%) | 702 (9.2%) |
| 75 Years and over | 170 (3.8%) | 627 (10.0%) |
| Total | 5,274 (6.8%) | 7,277 (8.9%) |
Income Above Poverty by Sex and Age in Olmsted County
According to the poverty statistics in Olmsted County, males aged 16 and 17 years and females aged 45 to 54 years are the age groups that are most secure financially, with 97.5% of males and 95.5% of females in these age groups living above the poverty line.
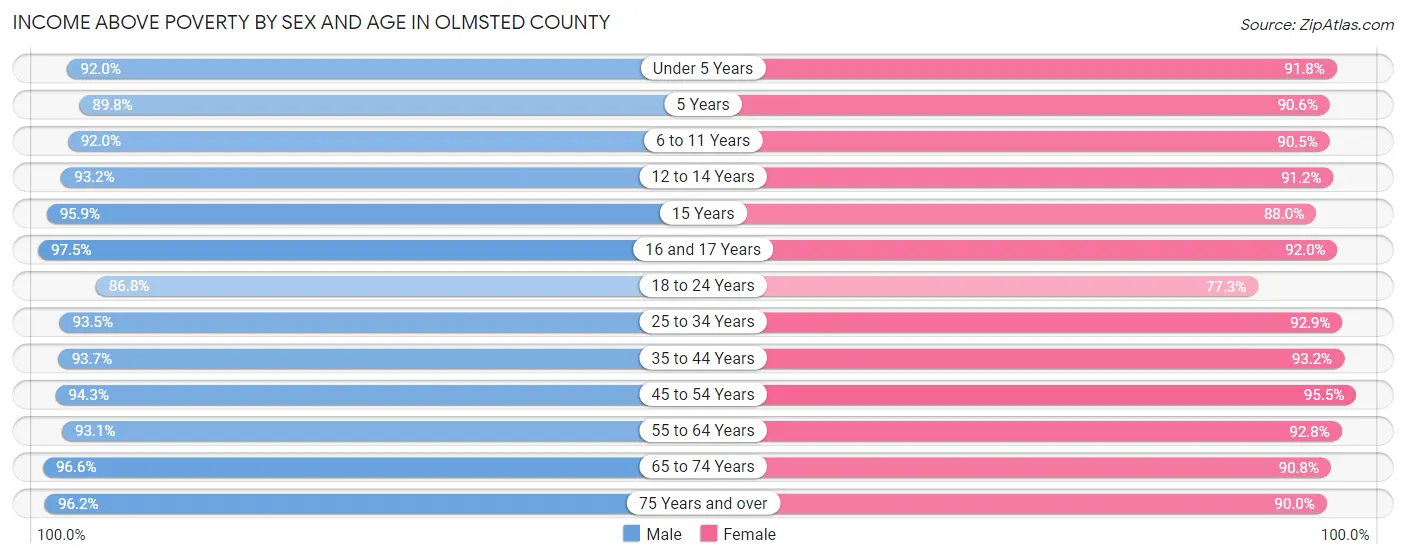
| Age Bracket | Male | Female |
| Under 5 Years | 4,866 (92.0%) | 4,613 (91.8%) |
| 5 Years | 963 (89.8%) | 681 (90.6%) |
| 6 to 11 Years | 5,884 (92.0%) | 6,058 (90.5%) |
| 12 to 14 Years | 3,222 (93.2%) | 2,542 (91.2%) |
| 15 Years | 1,236 (95.9%) | 976 (88.0%) |
| 16 and 17 Years | 2,027 (97.5%) | 2,021 (92.0%) |
| 18 to 24 Years | 5,681 (86.8%) | 5,217 (77.3%) |
| 25 to 34 Years | 10,381 (93.5%) | 10,915 (92.9%) |
| 35 to 44 Years | 10,413 (93.7%) | 10,290 (93.2%) |
| 45 to 54 Years | 8,369 (94.3%) | 8,495 (95.5%) |
| 55 to 64 Years | 9,232 (93.0%) | 9,658 (92.8%) |
| 65 to 74 Years | 6,332 (96.6%) | 6,892 (90.8%) |
| 75 Years and over | 4,286 (96.2%) | 5,630 (90.0%) |
| Total | 72,892 (93.2%) | 73,988 (91.0%) |
Income Below Poverty Among Married-Couple Families in Olmsted County
The poverty statistics for married-couple families in Olmsted County show that 2.2% or 737 of the total 33,835 families live below the poverty line. Families with 5 or more children have the highest poverty rate of 6.1%, comprising of 18 families. On the other hand, families with no children have the lowest poverty rate of 1.5%, which includes 293 families.
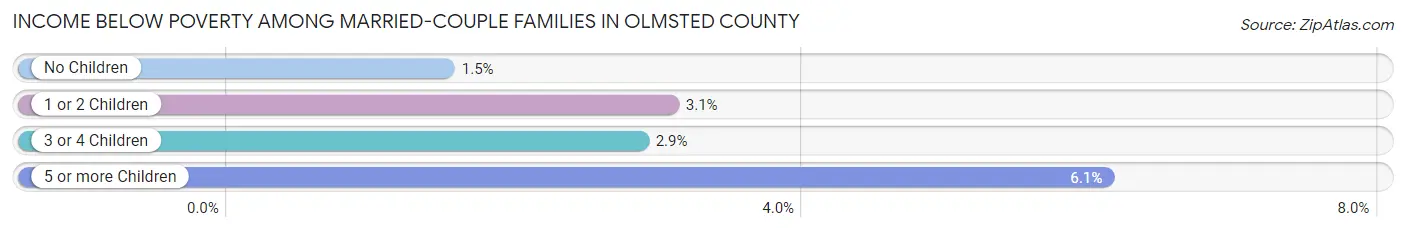
| Children | Above Poverty | Below Poverty |
| No Children | 19,168 (98.5%) | 293 (1.5%) |
| 1 or 2 Children | 10,761 (96.9%) | 341 (3.1%) |
| 3 or 4 Children | 2,892 (97.1%) | 85 (2.9%) |
| 5 or more Children | 277 (93.9%) | 18 (6.1%) |
| Total | 33,098 (97.8%) | 737 (2.2%) |
Income Below Poverty Among Single-Parent Households in Olmsted County
According to the poverty data in Olmsted County, 13.1% or 321 single-father households and 19.6% or 1,015 single-mother households are living below the poverty line. Among single-father households, those with 1 or 2 children have the highest poverty rate, with 298 households (21.1%) experiencing poverty. Likewise, among single-mother households, those with 3 or 4 children have the highest poverty rate, with 117 households (34.3%) falling below the poverty line.
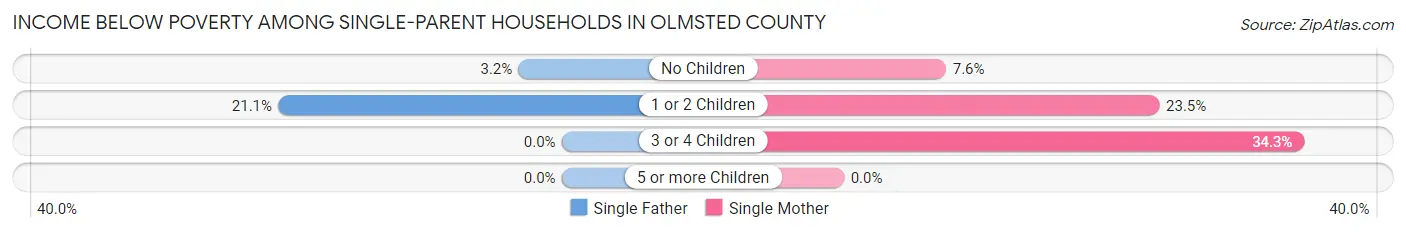
| Children | Single Father | Single Mother |
| No Children | 23 (3.2%) | 114 (7.6%) |
| 1 or 2 Children | 298 (21.1%) | 784 (23.5%) |
| 3 or 4 Children | 0 (0.0%) | 117 (34.3%) |
| 5 or more Children | 0 (0.0%) | 0 (0.0%) |
| Total | 321 (13.1%) | 1,015 (19.6%) |
Income Below Poverty Among Married-Couple vs Single-Parent Households in Olmsted County
The poverty data for Olmsted County shows that 737 of the married-couple family households (2.2%) and 1,336 of the single-parent households (17.5%) are living below the poverty level. Within the married-couple family households, those with 5 or more children have the highest poverty rate, with 18 households (6.1%) falling below the poverty line. Among the single-parent households, those with 1 or 2 children have the highest poverty rate, with 1,082 household (22.8%) living below poverty.
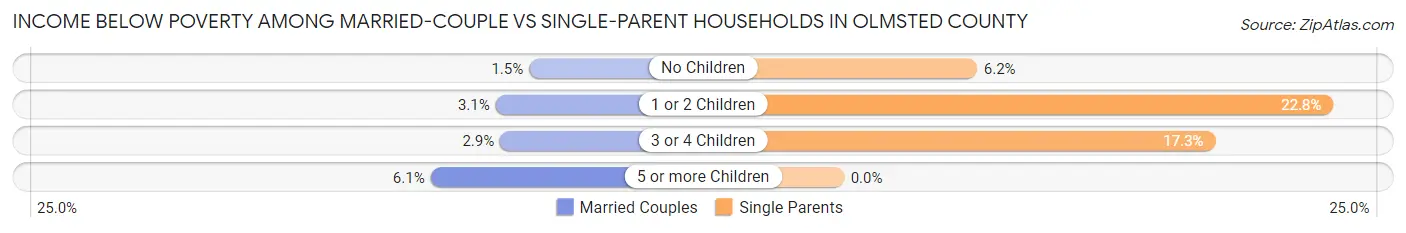
| Children | Married-Couple Families | Single-Parent Households |
| No Children | 293 (1.5%) | 137 (6.2%) |
| 1 or 2 Children | 341 (3.1%) | 1,082 (22.8%) |
| 3 or 4 Children | 85 (2.9%) | 117 (17.3%) |
| 5 or more Children | 18 (6.1%) | 0 (0.0%) |
| Total | 737 (2.2%) | 1,336 (17.5%) |
Employment Characteristics in Olmsted County
Employment by Class of Employer in Olmsted County
Among the 85,332 employed individuals in Olmsted County, private company employees (40,980 | 48.0%), not-for-profit organizations (28,960 | 33.9%), and local government employees (5,607 | 6.6%) make up the most common classes of employment.
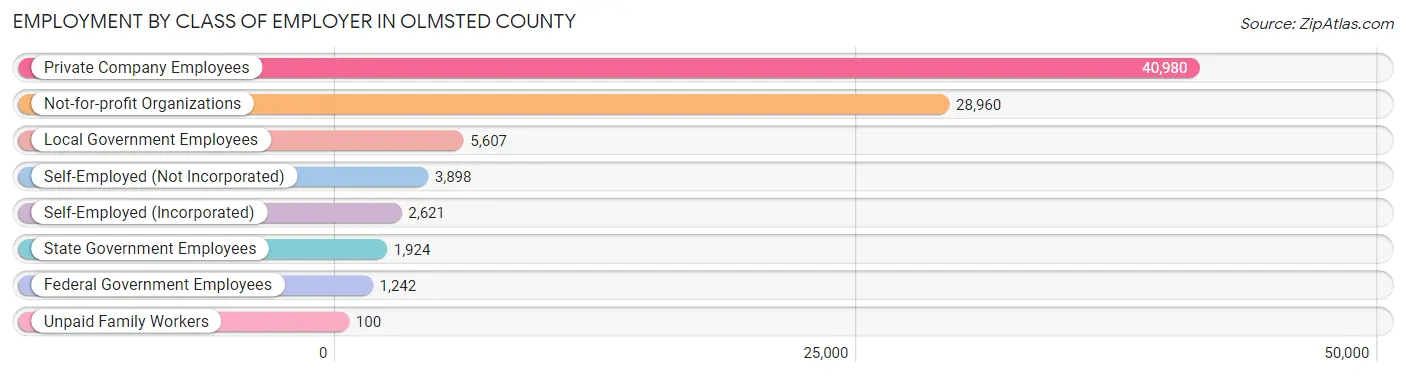
| Employer Class | # Employees | % Employees |
| Private Company Employees | 40,980 | 48.0% |
| Self-Employed (Incorporated) | 2,621 | 3.1% |
| Self-Employed (Not Incorporated) | 3,898 | 4.6% |
| Not-for-profit Organizations | 28,960 | 33.9% |
| Local Government Employees | 5,607 | 6.6% |
| State Government Employees | 1,924 | 2.2% |
| Federal Government Employees | 1,242 | 1.5% |
| Unpaid Family Workers | 100 | 0.1% |
| Total | 85,332 | 100.0% |
Employment Status by Age in Olmsted County
According to the labor force statistics for Olmsted County, out of the total population over 16 years of age (127,412), 70.7% or 90,080 individuals are in the labor force, with 3.4% or 3,063 of them unemployed. The age group with the highest labor force participation rate is 25 to 29 years, with 91.0% or 10,422 individuals in the labor force. Within the labor force, the 20 to 24 years age range has the highest percentage of unemployed individuals, with 8.2% or 701 of them being unemployed.
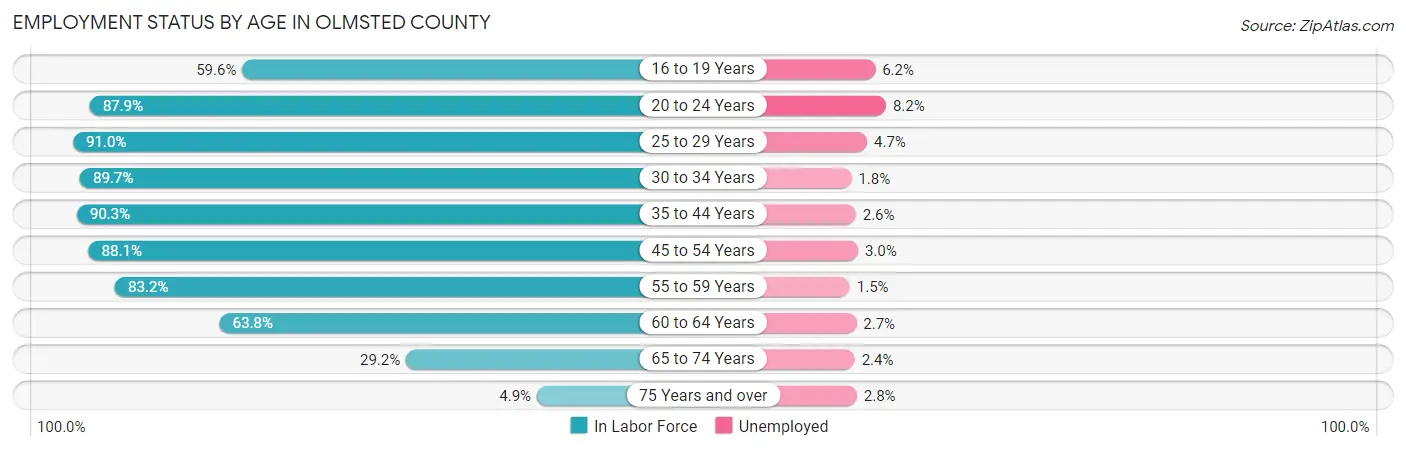
| Age Bracket | In Labor Force | Unemployed |
| 16 to 19 Years | 4,692 (59.6%) | 291 (6.2%) |
| 20 to 24 Years | 8,554 (87.9%) | 701 (8.2%) |
| 25 to 29 Years | 10,422 (91.0%) | 490 (4.7%) |
| 30 to 34 Years | 10,298 (89.7%) | 185 (1.8%) |
| 35 to 44 Years | 20,269 (90.3%) | 527 (2.6%) |
| 45 to 54 Years | 15,839 (88.1%) | 475 (3.0%) |
| 55 to 59 Years | 9,065 (83.2%) | 136 (1.5%) |
| 60 to 64 Years | 6,118 (63.8%) | 165 (2.7%) |
| 65 to 74 Years | 4,210 (29.2%) | 101 (2.4%) |
| 75 Years and over | 566 (4.9%) | 16 (2.8%) |
| Total | 90,080 (70.7%) | 3,063 (3.4%) |
Employment Status by Educational Attainment in Olmsted County
According to labor force statistics for Olmsted County, 85.9% of individuals (72,022) out of the total population between 25 and 64 years of age (83,844) are in the labor force, with 2.8% or 2,017 of them being unemployed. The group with the highest labor force participation rate are those with the educational attainment of bachelor's degree or higher, with 89.6% or 37,756 individuals in the labor force. Within the labor force, individuals with high school diploma education have the highest percentage of unemployment, with 4.6% or 524 of them being unemployed.
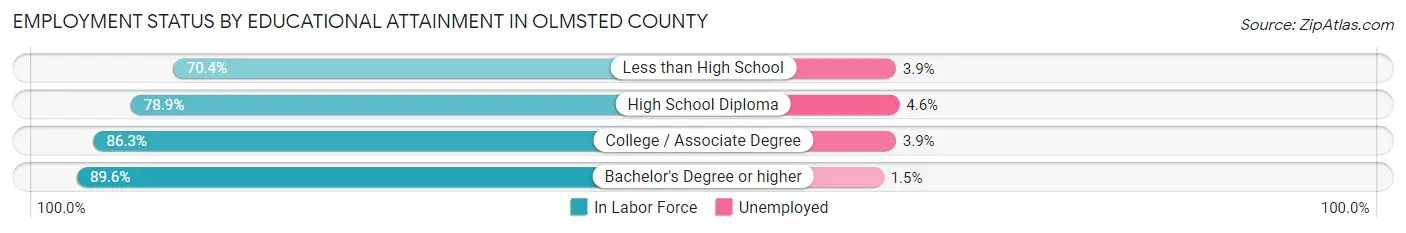
| Educational Attainment | In Labor Force | Unemployed |
| Less than High School | 2,846 (70.4%) | 158 (3.9%) |
| High School Diploma | 11,396 (78.9%) | 664 (4.6%) |
| College / Associate Degree | 20,039 (86.3%) | 906 (3.9%) |
| Bachelor's Degree or higher | 37,756 (89.6%) | 632 (1.5%) |
| Total | 72,022 (85.9%) | 2,348 (2.8%) |
Employment Occupations by Sex in Olmsted County
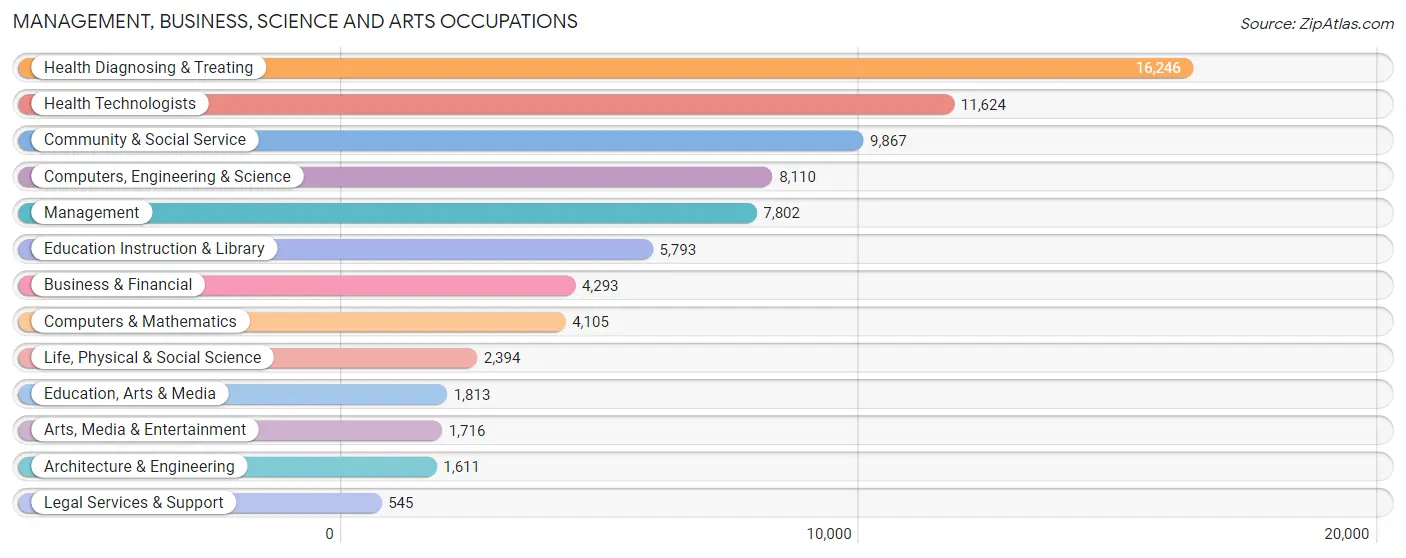
Management, Business, Science and Arts Occupations
The most common Management, Business, Science and Arts occupations in Olmsted County are Health Diagnosing & Treating (16,246 | 18.7%), Health Technologists (11,624 | 13.4%), Community & Social Service (9,867 | 11.4%), Computers, Engineering & Science (8,110 | 9.3%), and Management (7,802 | 9.0%).
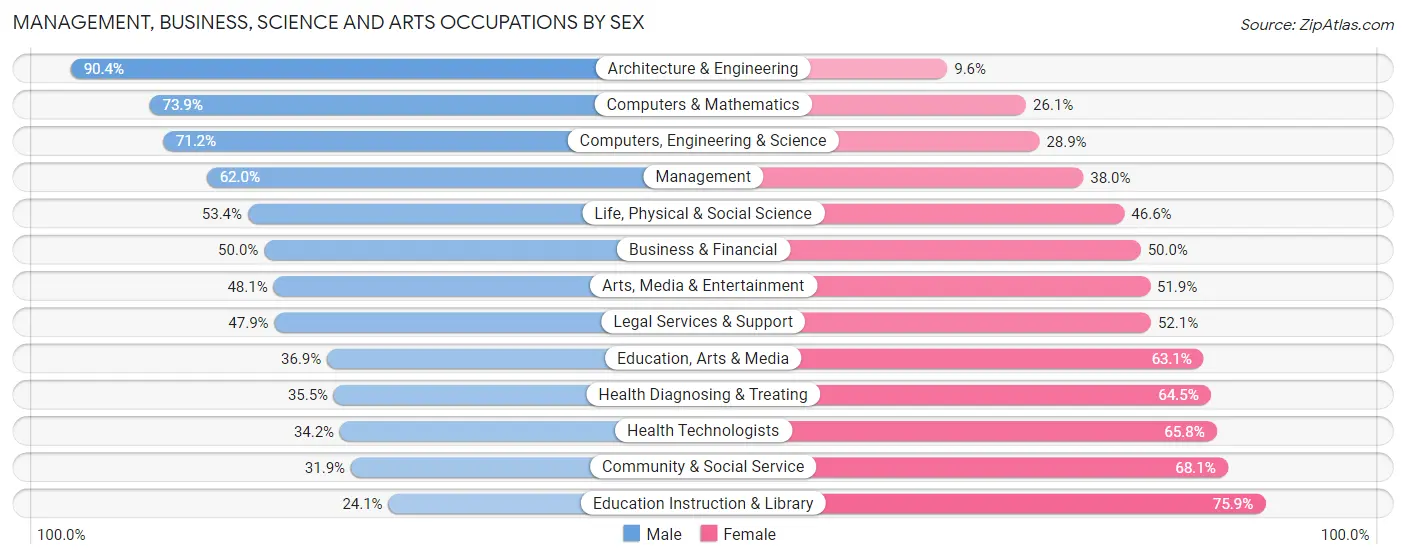
Management, Business, Science and Arts Occupations by Sex
Within the Management, Business, Science and Arts occupations in Olmsted County, the most male-oriented occupations are Architecture & Engineering (90.4%), Computers & Mathematics (73.9%), and Computers, Engineering & Science (71.2%), while the most female-oriented occupations are Education Instruction & Library (75.9%), Community & Social Service (68.1%), and Health Technologists (65.8%).
| Occupation | Male | Female |
| Management | 4,837 (62.0%) | 2,965 (38.0%) |
| Business & Financial | 2,148 (50.0%) | 2,145 (50.0%) |
| Computers, Engineering & Science | 5,770 (71.2%) | 2,340 (28.8%) |
| Computers & Mathematics | 3,035 (73.9%) | 1,070 (26.1%) |
| Architecture & Engineering | 1,456 (90.4%) | 155 (9.6%) |
| Life, Physical & Social Science | 1,279 (53.4%) | 1,115 (46.6%) |
| Community & Social Service | 3,151 (31.9%) | 6,716 (68.1%) |
| Education, Arts & Media | 669 (36.9%) | 1,144 (63.1%) |
| Legal Services & Support | 261 (47.9%) | 284 (52.1%) |
| Education Instruction & Library | 1,396 (24.1%) | 4,397 (75.9%) |
| Arts, Media & Entertainment | 825 (48.1%) | 891 (51.9%) |
| Health Diagnosing & Treating | 5,763 (35.5%) | 10,483 (64.5%) |
| Health Technologists | 3,978 (34.2%) | 7,646 (65.8%) |
| Total (Category) | 21,669 (46.8%) | 24,649 (53.2%) |
| Total (Overall) | 44,225 (50.9%) | 42,658 (49.1%) |
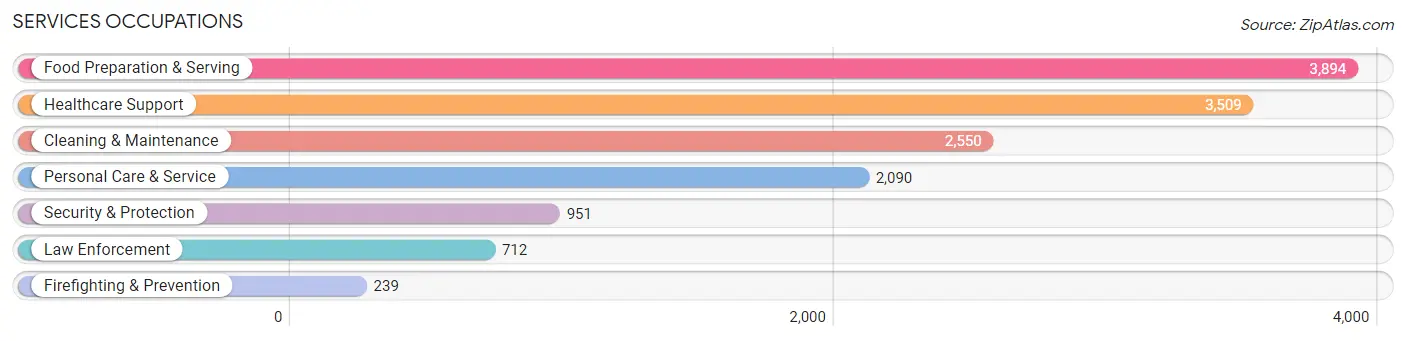
Services Occupations
The most common Services occupations in Olmsted County are Food Preparation & Serving (3,894 | 4.5%), Healthcare Support (3,509 | 4.0%), Cleaning & Maintenance (2,550 | 2.9%), Personal Care & Service (2,090 | 2.4%), and Security & Protection (951 | 1.1%).
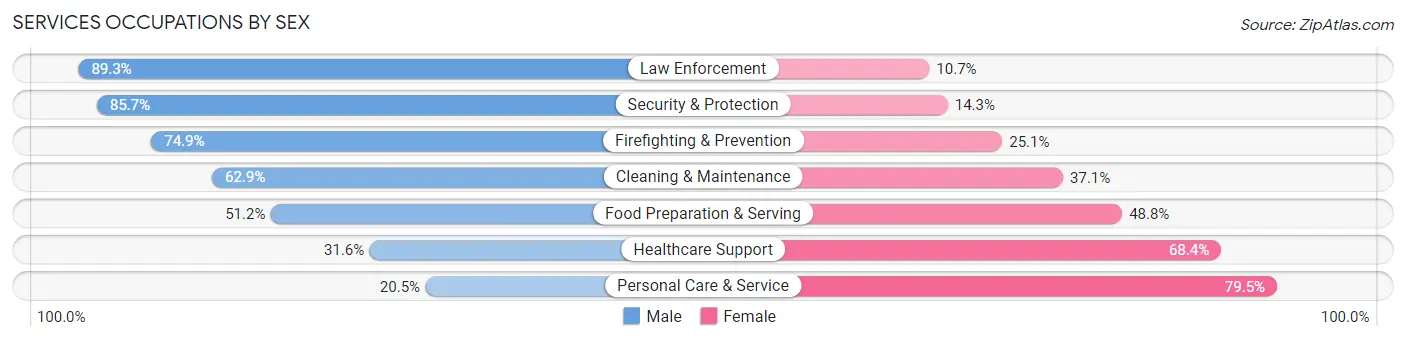
Services Occupations by Sex
Within the Services occupations in Olmsted County, the most male-oriented occupations are Law Enforcement (89.3%), Security & Protection (85.7%), and Firefighting & Prevention (74.9%), while the most female-oriented occupations are Personal Care & Service (79.5%), Healthcare Support (68.4%), and Food Preparation & Serving (48.8%).
| Occupation | Male | Female |
| Healthcare Support | 1,108 (31.6%) | 2,401 (68.4%) |
| Security & Protection | 815 (85.7%) | 136 (14.3%) |
| Firefighting & Prevention | 179 (74.9%) | 60 (25.1%) |
| Law Enforcement | 636 (89.3%) | 76 (10.7%) |
| Food Preparation & Serving | 1,992 (51.2%) | 1,902 (48.8%) |
| Cleaning & Maintenance | 1,603 (62.9%) | 947 (37.1%) |
| Personal Care & Service | 429 (20.5%) | 1,661 (79.5%) |
| Total (Category) | 5,947 (45.8%) | 7,047 (54.2%) |
| Total (Overall) | 44,225 (50.9%) | 42,658 (49.1%) |
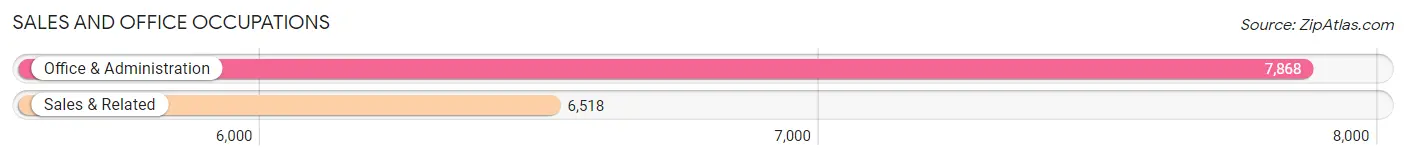
Sales and Office Occupations
The most common Sales and Office occupations in Olmsted County are Office & Administration (7,868 | 9.1%), and Sales & Related (6,518 | 7.5%).
Sales and Office Occupations by Sex
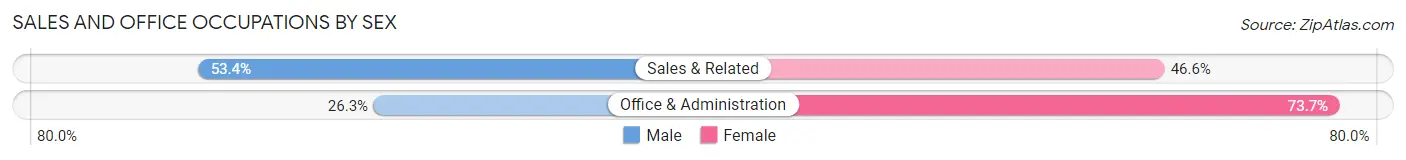
| Occupation | Male | Female |
| Sales & Related | 3,478 (53.4%) | 3,040 (46.6%) |
| Office & Administration | 2,066 (26.3%) | 5,802 (73.7%) |
| Total (Category) | 5,544 (38.5%) | 8,842 (61.5%) |
| Total (Overall) | 44,225 (50.9%) | 42,658 (49.1%) |
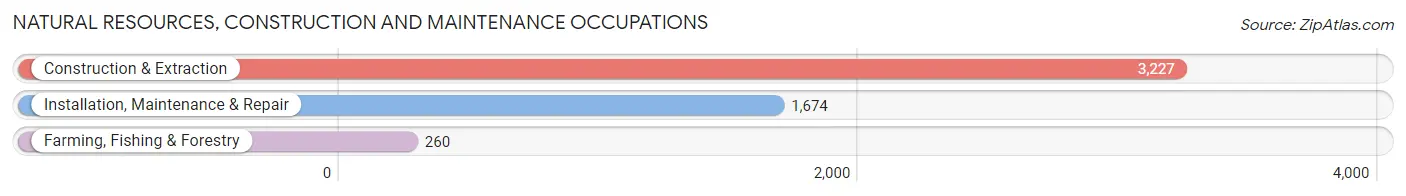
Natural Resources, Construction and Maintenance Occupations
The most common Natural Resources, Construction and Maintenance occupations in Olmsted County are Construction & Extraction (3,227 | 3.7%), Installation, Maintenance & Repair (1,674 | 1.9%), and Farming, Fishing & Forestry (260 | 0.3%).
Natural Resources, Construction and Maintenance Occupations by Sex
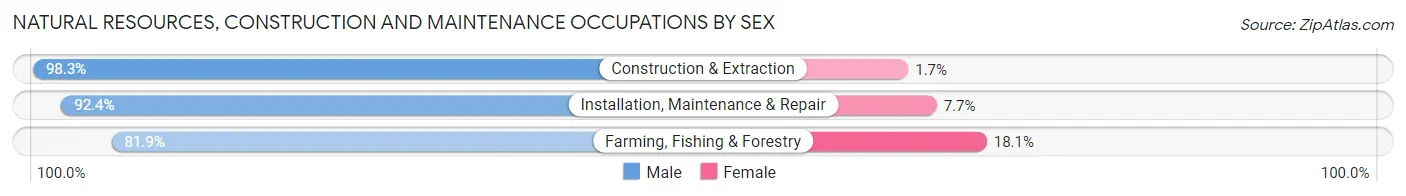
| Occupation | Male | Female |
| Farming, Fishing & Forestry | 213 (81.9%) | 47 (18.1%) |
| Construction & Extraction | 3,171 (98.3%) | 56 (1.7%) |
| Installation, Maintenance & Repair | 1,546 (92.3%) | 128 (7.6%) |
| Total (Category) | 4,930 (95.5%) | 231 (4.5%) |
| Total (Overall) | 44,225 (50.9%) | 42,658 (49.1%) |
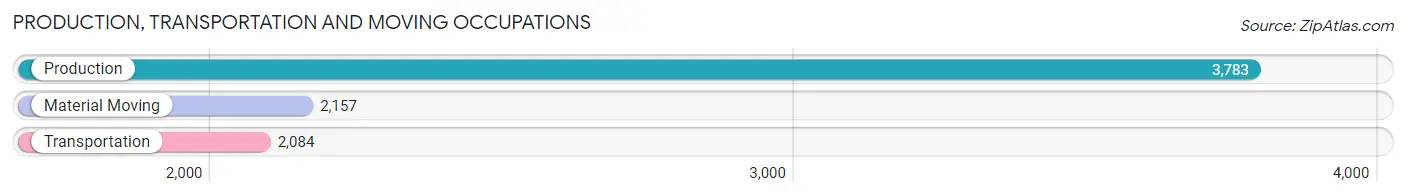
Production, Transportation and Moving Occupations
The most common Production, Transportation and Moving occupations in Olmsted County are Production (3,783 | 4.3%), Material Moving (2,157 | 2.5%), and Transportation (2,084 | 2.4%).
Production, Transportation and Moving Occupations by Sex
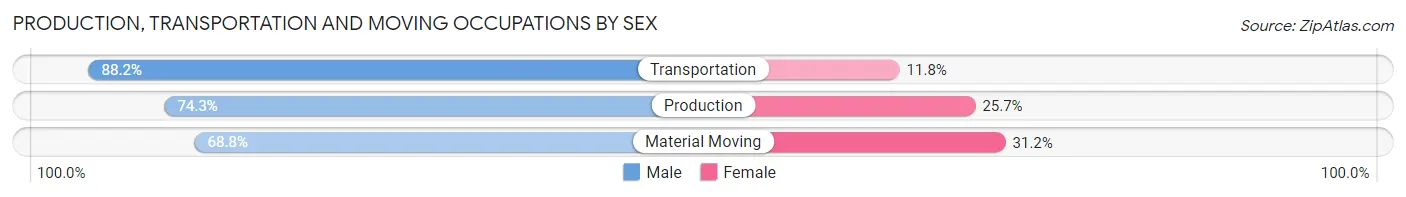
| Occupation | Male | Female |
| Production | 2,812 (74.3%) | 971 (25.7%) |
| Transportation | 1,839 (88.2%) | 245 (11.8%) |
| Material Moving | 1,484 (68.8%) | 673 (31.2%) |
| Total (Category) | 6,135 (76.5%) | 1,889 (23.5%) |
| Total (Overall) | 44,225 (50.9%) | 42,658 (49.1%) |
Employment Industries by Sex in Olmsted County
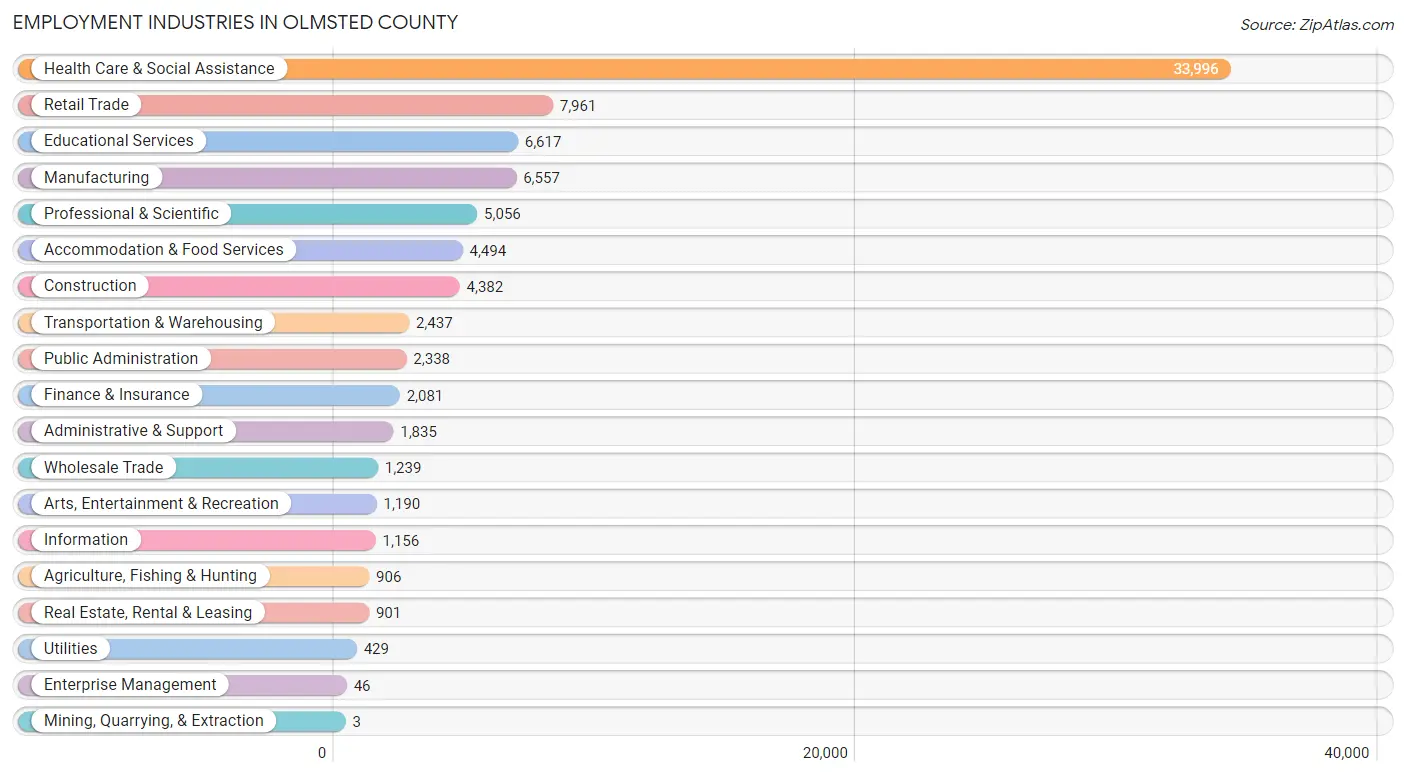
Employment Industries in Olmsted County
The major employment industries in Olmsted County include Health Care & Social Assistance (33,996 | 39.1%), Retail Trade (7,961 | 9.2%), Educational Services (6,617 | 7.6%), Manufacturing (6,557 | 7.5%), and Professional & Scientific (5,056 | 5.8%).
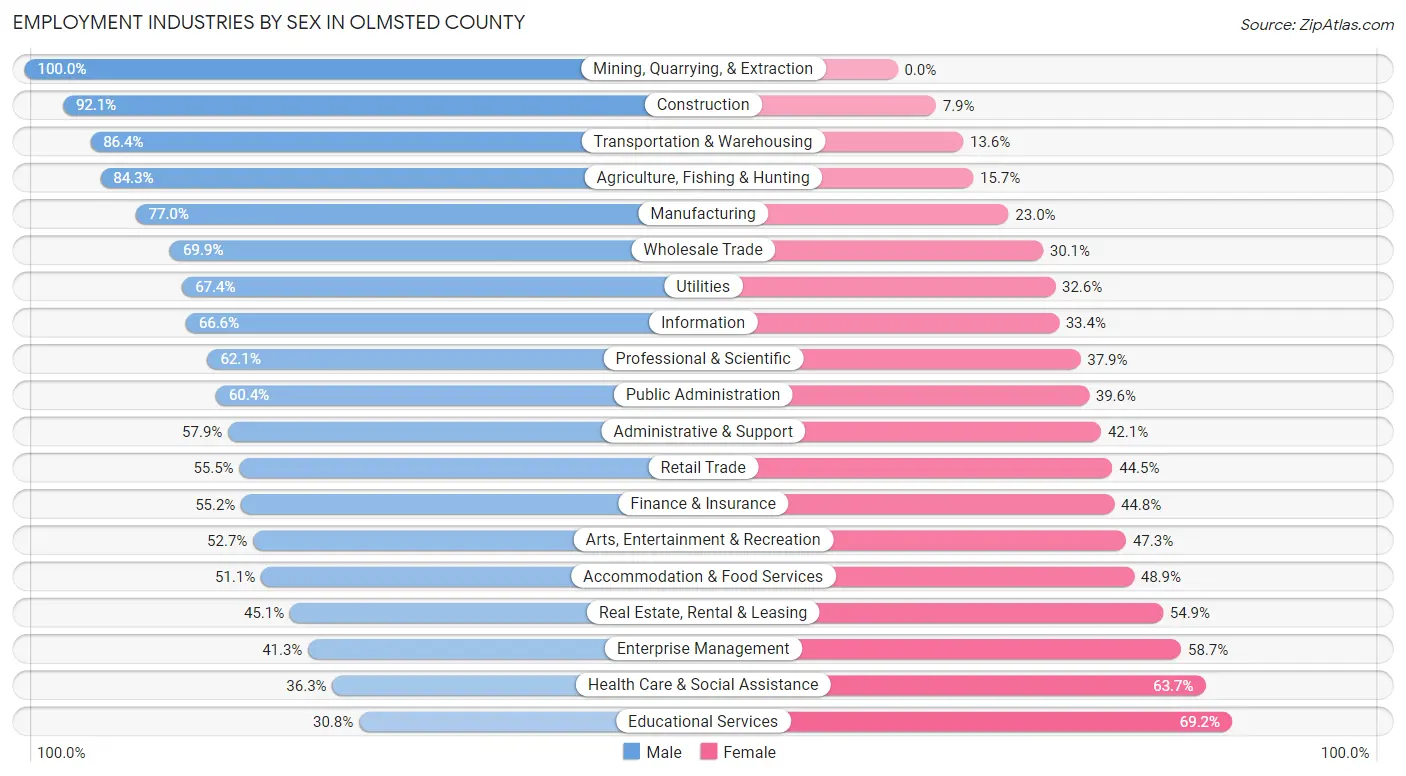
Employment Industries by Sex in Olmsted County
The Olmsted County industries that see more men than women are Mining, Quarrying, & Extraction (100.0%), Construction (92.1%), and Transportation & Warehousing (86.4%), whereas the industries that tend to have a higher number of women are Educational Services (69.2%), Health Care & Social Assistance (63.7%), and Enterprise Management (58.7%).
| Industry | Male | Female |
| Agriculture, Fishing & Hunting | 764 (84.3%) | 142 (15.7%) |
| Mining, Quarrying, & Extraction | 3 (100.0%) | 0 (0.0%) |
| Construction | 4,034 (92.1%) | 348 (7.9%) |
| Manufacturing | 5,051 (77.0%) | 1,506 (23.0%) |
| Wholesale Trade | 866 (69.9%) | 373 (30.1%) |
| Retail Trade | 4,421 (55.5%) | 3,540 (44.5%) |
| Transportation & Warehousing | 2,106 (86.4%) | 331 (13.6%) |
| Utilities | 289 (67.4%) | 140 (32.6%) |
| Information | 770 (66.6%) | 386 (33.4%) |
| Finance & Insurance | 1,148 (55.2%) | 933 (44.8%) |
| Real Estate, Rental & Leasing | 406 (45.1%) | 495 (54.9%) |
| Professional & Scientific | 3,142 (62.1%) | 1,914 (37.9%) |
| Enterprise Management | 19 (41.3%) | 27 (58.7%) |
| Administrative & Support | 1,062 (57.9%) | 773 (42.1%) |
| Educational Services | 2,037 (30.8%) | 4,580 (69.2%) |
| Health Care & Social Assistance | 12,336 (36.3%) | 21,660 (63.7%) |
| Arts, Entertainment & Recreation | 627 (52.7%) | 563 (47.3%) |
| Accommodation & Food Services | 2,295 (51.1%) | 2,199 (48.9%) |
| Public Administration | 1,412 (60.4%) | 926 (39.6%) |
| Total | 44,225 (50.9%) | 42,658 (49.1%) |
Education in Olmsted County
School Enrollment in Olmsted County
The most common levels of schooling among the 41,172 students in Olmsted County are middle school (10,160 | 24.7%), high school (8,729 | 21.2%), and elementary school (8,368 | 20.3%).
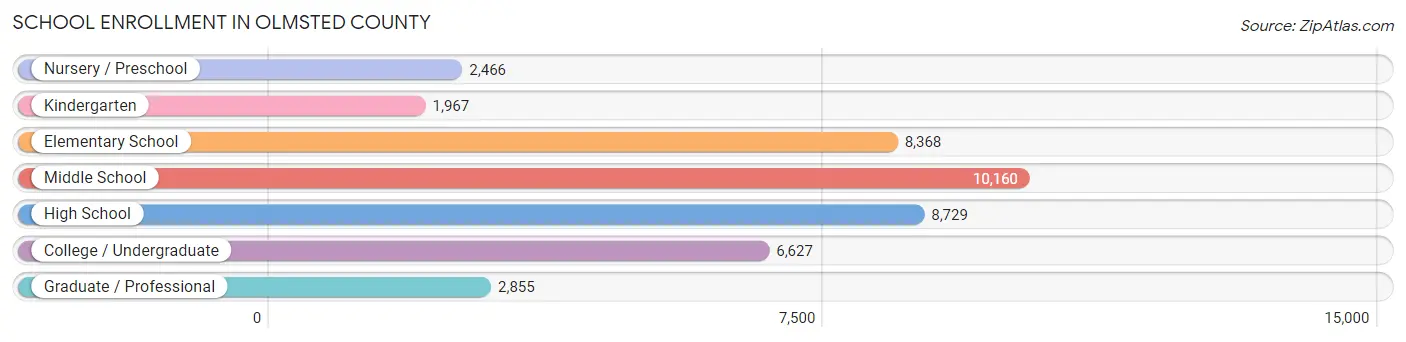
| School Level | # Students | % Students |
| Nursery / Preschool | 2,466 | 6.0% |
| Kindergarten | 1,967 | 4.8% |
| Elementary School | 8,368 | 20.3% |
| Middle School | 10,160 | 24.7% |
| High School | 8,729 | 21.2% |
| College / Undergraduate | 6,627 | 16.1% |
| Graduate / Professional | 2,855 | 6.9% |
| Total | 41,172 | 100.0% |
School Enrollment by Age by Funding Source in Olmsted County
Out of a total of 41,172 students who are enrolled in schools in Olmsted County, 6,752 (16.4%) attend a private institution, while the remaining 34,420 (83.6%) are enrolled in public schools. The age group of 3 to 4 year olds has the highest likelihood of being enrolled in private schools, with 825 (44.0% in the age bracket) enrolled. Conversely, the age group of 18 to 19 year olds has the lowest likelihood of being enrolled in a private school, with 2,355 (96.7% in the age bracket) attending a public institution.
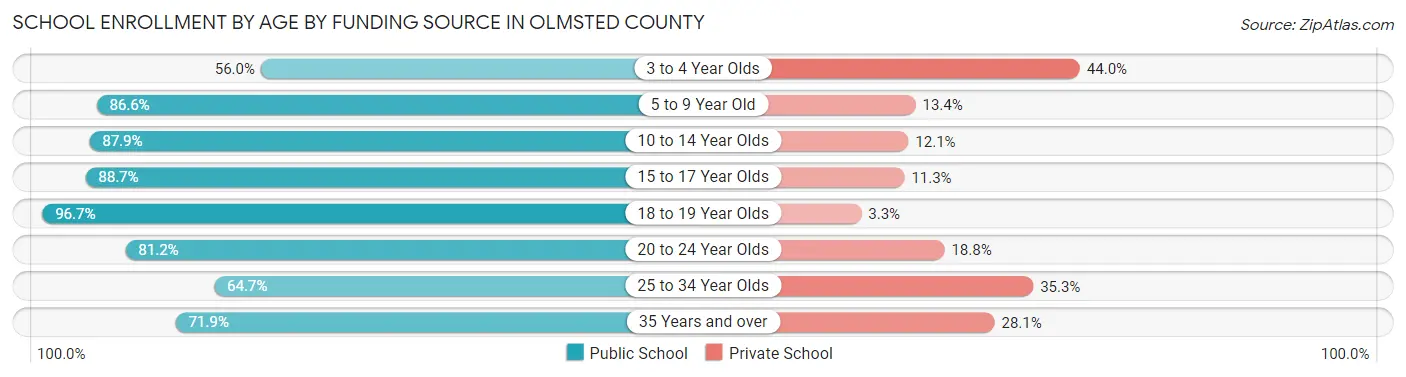
| Age Bracket | Public School | Private School |
| 3 to 4 Year Olds | 1,050 (56.0%) | 825 (44.0%) |
| 5 to 9 Year Old | 8,579 (86.6%) | 1,326 (13.4%) |
| 10 to 14 Year Olds | 10,177 (87.9%) | 1,396 (12.1%) |
| 15 to 17 Year Olds | 5,696 (88.7%) | 727 (11.3%) |
| 18 to 19 Year Olds | 2,355 (96.7%) | 80 (3.3%) |
| 20 to 24 Year Olds | 2,941 (81.2%) | 680 (18.8%) |
| 25 to 34 Year Olds | 1,998 (64.7%) | 1,090 (35.3%) |
| 35 Years and over | 1,619 (71.9%) | 633 (28.1%) |
| Total | 34,420 (83.6%) | 6,752 (16.4%) |
Educational Attainment by Field of Study in Olmsted County
Science & technology (10,184 | 17.5%), bio, nature & agricultural (7,919 | 13.6%), education (6,980 | 12.0%), business (6,823 | 11.7%), and engineering (3,916 | 6.7%) are the most common fields of study among 58,117 individuals in Olmsted County who have obtained a bachelor's degree or higher.
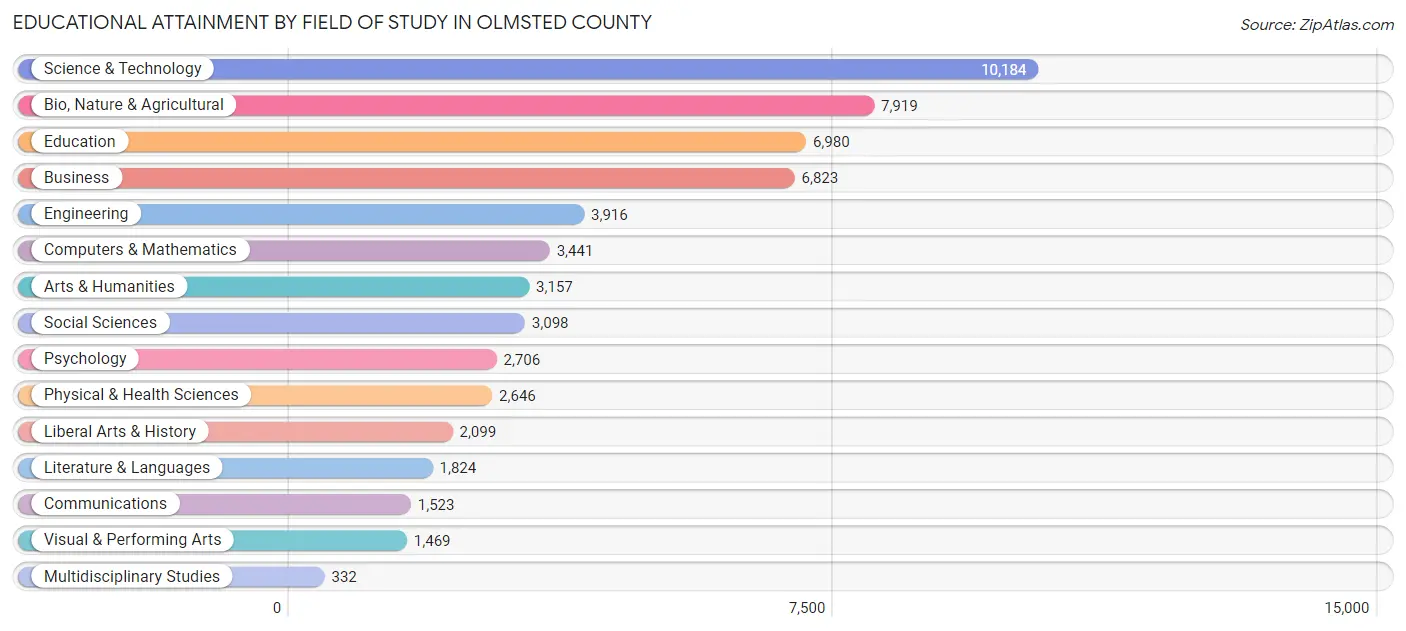
| Field of Study | # Graduates | % Graduates |
| Computers & Mathematics | 3,441 | 5.9% |
| Bio, Nature & Agricultural | 7,919 | 13.6% |
| Physical & Health Sciences | 2,646 | 4.5% |
| Psychology | 2,706 | 4.7% |
| Social Sciences | 3,098 | 5.3% |
| Engineering | 3,916 | 6.7% |
| Multidisciplinary Studies | 332 | 0.6% |
| Science & Technology | 10,184 | 17.5% |
| Business | 6,823 | 11.7% |
| Education | 6,980 | 12.0% |
| Literature & Languages | 1,824 | 3.1% |
| Liberal Arts & History | 2,099 | 3.6% |
| Visual & Performing Arts | 1,469 | 2.5% |
| Communications | 1,523 | 2.6% |
| Arts & Humanities | 3,157 | 5.4% |
| Total | 58,117 | 100.0% |
Transportation & Commute in Olmsted County
Vehicle Availability by Sex in Olmsted County
The most prevalent vehicle ownership categories in Olmsted County are males with 2 vehicles (20,550, accounting for 47.0%) and females with 2 vehicles (18,715, making up 49.8%).
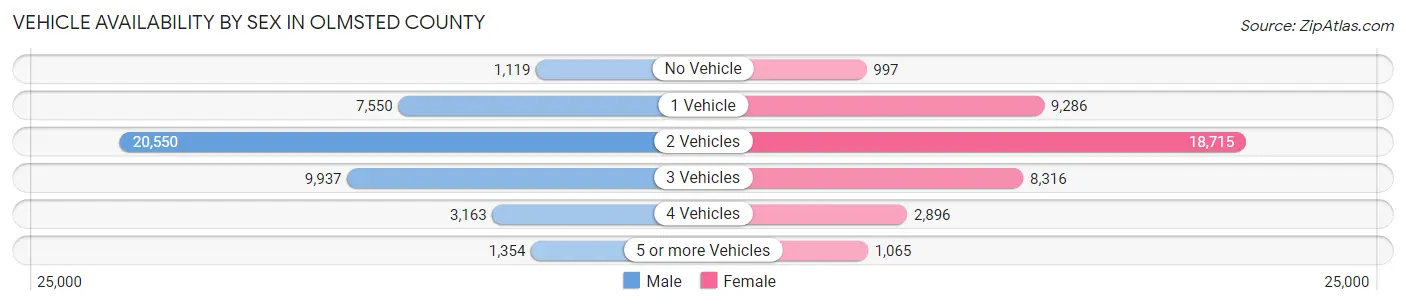
| Vehicles Available | Male | Female |
| No Vehicle | 1,119 (2.6%) | 997 (2.4%) |
| 1 Vehicle | 7,550 (17.3%) | 9,286 (22.5%) |
| 2 Vehicles | 20,550 (47.0%) | 18,715 (45.3%) |
| 3 Vehicles | 9,937 (22.8%) | 8,316 (20.2%) |
| 4 Vehicles | 3,163 (7.2%) | 2,896 (7.0%) |
| 5 or more Vehicles | 1,354 (3.1%) | 1,065 (2.6%) |
| Total | 43,673 (100.0%) | 41,275 (100.0%) |
Commute Time in Olmsted County
The most frequently occuring commute durations in Olmsted County are 15 to 19 minutes (20,061 commuters, 26.5%), 10 to 14 minutes (18,124 commuters, 23.9%), and 20 to 24 minutes (10,547 commuters, 13.9%).
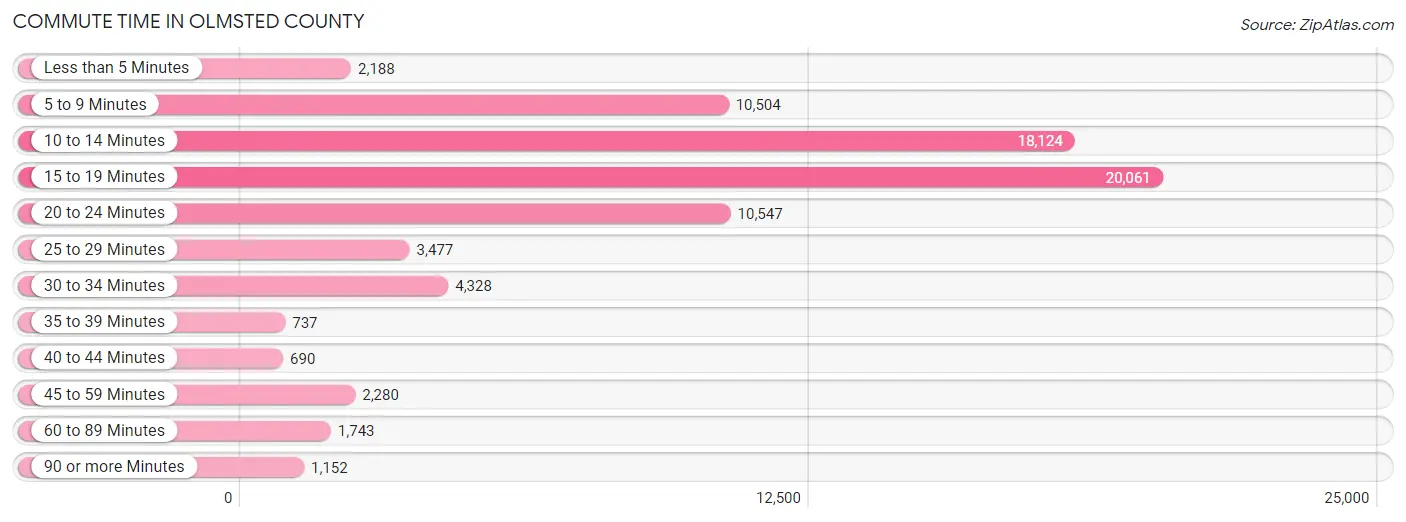
| Commute Time | # Commuters | % Commuters |
| Less than 5 Minutes | 2,188 | 2.9% |
| 5 to 9 Minutes | 10,504 | 13.9% |
| 10 to 14 Minutes | 18,124 | 23.9% |
| 15 to 19 Minutes | 20,061 | 26.5% |
| 20 to 24 Minutes | 10,547 | 13.9% |
| 25 to 29 Minutes | 3,477 | 4.6% |
| 30 to 34 Minutes | 4,328 | 5.7% |
| 35 to 39 Minutes | 737 | 1.0% |
| 40 to 44 Minutes | 690 | 0.9% |
| 45 to 59 Minutes | 2,280 | 3.0% |
| 60 to 89 Minutes | 1,743 | 2.3% |
| 90 or more Minutes | 1,152 | 1.5% |
Commute Time by Sex in Olmsted County
The most common commute times in Olmsted County are 15 to 19 minutes (9,890 commuters, 25.1%) for males and 15 to 19 minutes (10,171 commuters, 28.0%) for females.
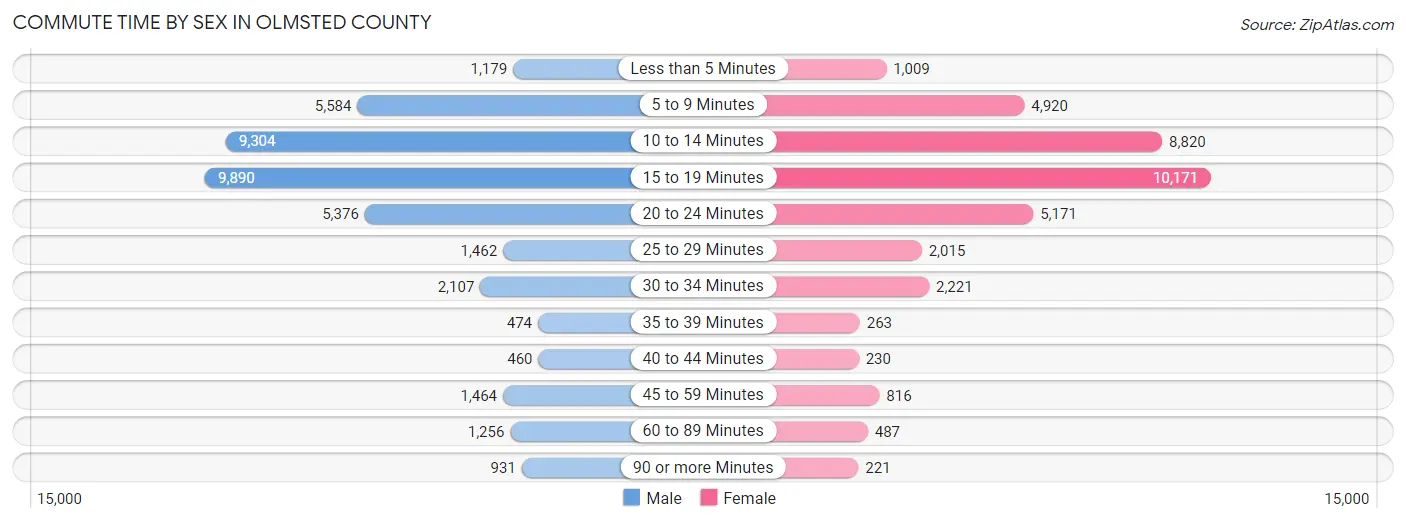
| Commute Time | Male | Female |
| Less than 5 Minutes | 1,179 (3.0%) | 1,009 (2.8%) |
| 5 to 9 Minutes | 5,584 (14.1%) | 4,920 (13.5%) |
| 10 to 14 Minutes | 9,304 (23.6%) | 8,820 (24.3%) |
| 15 to 19 Minutes | 9,890 (25.1%) | 10,171 (28.0%) |
| 20 to 24 Minutes | 5,376 (13.6%) | 5,171 (14.2%) |
| 25 to 29 Minutes | 1,462 (3.7%) | 2,015 (5.5%) |
| 30 to 34 Minutes | 2,107 (5.3%) | 2,221 (6.1%) |
| 35 to 39 Minutes | 474 (1.2%) | 263 (0.7%) |
| 40 to 44 Minutes | 460 (1.2%) | 230 (0.6%) |
| 45 to 59 Minutes | 1,464 (3.7%) | 816 (2.2%) |
| 60 to 89 Minutes | 1,256 (3.2%) | 487 (1.3%) |
| 90 or more Minutes | 931 (2.4%) | 221 (0.6%) |
Time of Departure to Work by Sex in Olmsted County
The most frequent times of departure to work in Olmsted County are 7:00 AM to 7:29 AM (6,412, 16.2%) for males and 7:00 AM to 7:29 AM (6,697, 18.4%) for females.
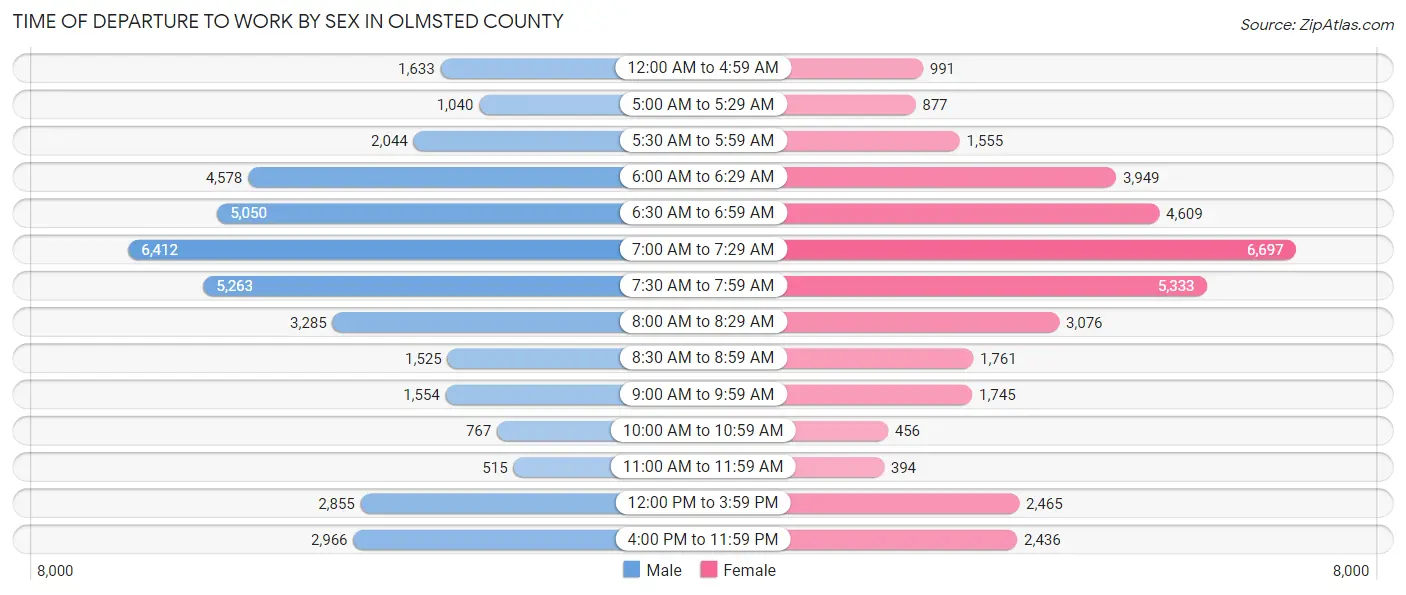
| Time of Departure | Male | Female |
| 12:00 AM to 4:59 AM | 1,633 (4.1%) | 991 (2.7%) |
| 5:00 AM to 5:29 AM | 1,040 (2.6%) | 877 (2.4%) |
| 5:30 AM to 5:59 AM | 2,044 (5.2%) | 1,555 (4.3%) |
| 6:00 AM to 6:29 AM | 4,578 (11.6%) | 3,949 (10.9%) |
| 6:30 AM to 6:59 AM | 5,050 (12.8%) | 4,609 (12.7%) |
| 7:00 AM to 7:29 AM | 6,412 (16.2%) | 6,697 (18.4%) |
| 7:30 AM to 7:59 AM | 5,263 (13.3%) | 5,333 (14.7%) |
| 8:00 AM to 8:29 AM | 3,285 (8.3%) | 3,076 (8.5%) |
| 8:30 AM to 8:59 AM | 1,525 (3.9%) | 1,761 (4.9%) |
| 9:00 AM to 9:59 AM | 1,554 (3.9%) | 1,745 (4.8%) |
| 10:00 AM to 10:59 AM | 767 (1.9%) | 456 (1.3%) |
| 11:00 AM to 11:59 AM | 515 (1.3%) | 394 (1.1%) |
| 12:00 PM to 3:59 PM | 2,855 (7.2%) | 2,465 (6.8%) |
| 4:00 PM to 11:59 PM | 2,966 (7.5%) | 2,436 (6.7%) |
| Total | 39,487 (100.0%) | 36,344 (100.0%) |
Housing Occupancy in Olmsted County
Occupancy by Ownership in Olmsted County
Of the total 65,970 dwellings in Olmsted County, owner-occupied units account for 46,702 (70.8%), while renter-occupied units make up 19,268 (29.2%).
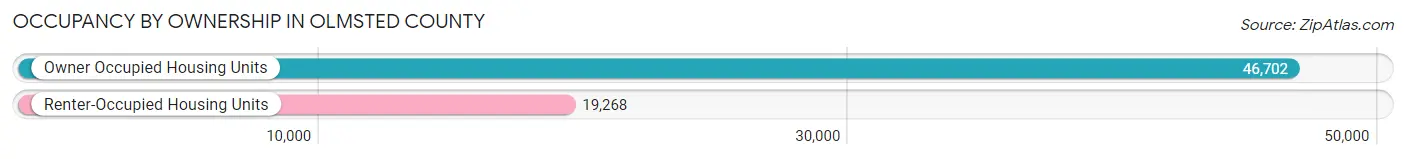
| Occupancy | # Housing Units | % Housing Units |
| Owner Occupied Housing Units | 46,702 | 70.8% |
| Renter-Occupied Housing Units | 19,268 | 29.2% |
| Total Occupied Housing Units | 65,970 | 100.0% |
Occupancy by Household Size in Olmsted County
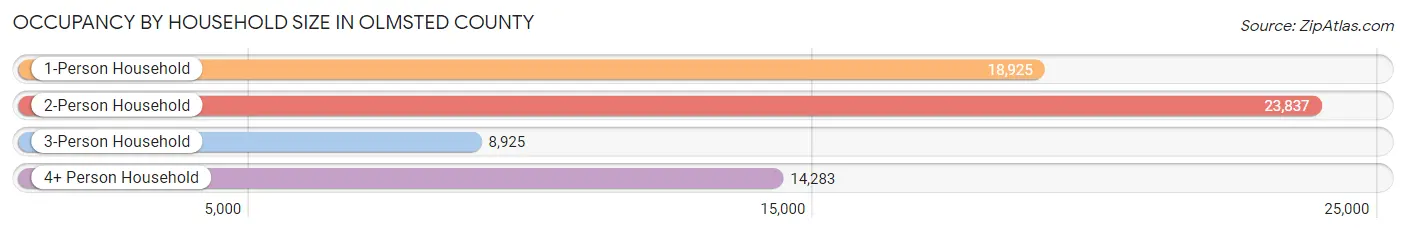
| Household Size | # Housing Units | % Housing Units |
| 1-Person Household | 18,925 | 28.7% |
| 2-Person Household | 23,837 | 36.1% |
| 3-Person Household | 8,925 | 13.5% |
| 4+ Person Household | 14,283 | 21.6% |
| Total Housing Units | 65,970 | 100.0% |
Occupancy by Ownership by Household Size in Olmsted County
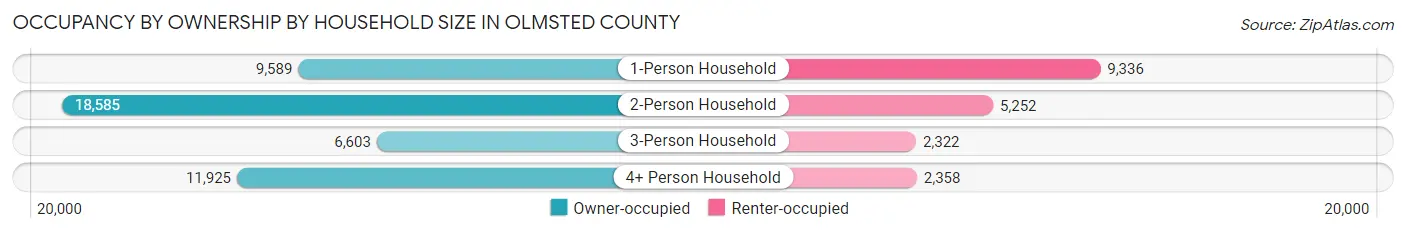
| Household Size | Owner-occupied | Renter-occupied |
| 1-Person Household | 9,589 (50.7%) | 9,336 (49.3%) |
| 2-Person Household | 18,585 (78.0%) | 5,252 (22.0%) |
| 3-Person Household | 6,603 (74.0%) | 2,322 (26.0%) |
| 4+ Person Household | 11,925 (83.5%) | 2,358 (16.5%) |
| Total Housing Units | 46,702 (70.8%) | 19,268 (29.2%) |
Occupancy by Educational Attainment in Olmsted County
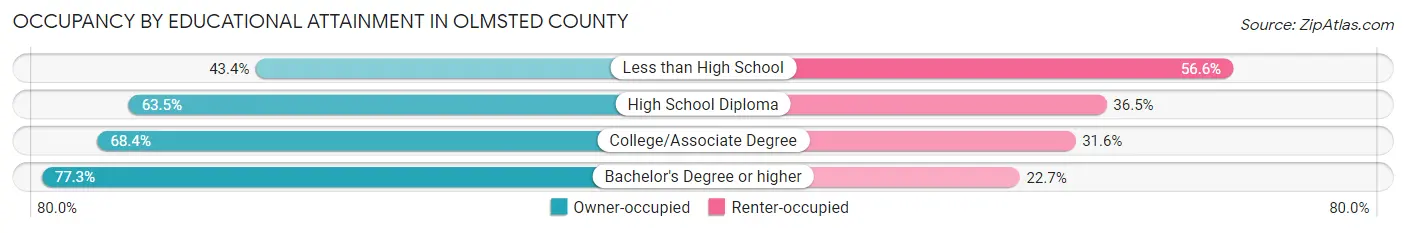
| Household Size | Owner-occupied | Renter-occupied |
| Less than High School | 1,251 (43.4%) | 1,630 (56.6%) |
| High School Diploma | 7,468 (63.5%) | 4,297 (36.5%) |
| College/Associate Degree | 12,964 (68.4%) | 5,980 (31.6%) |
| Bachelor's Degree or higher | 25,019 (77.3%) | 7,361 (22.7%) |
Occupancy by Age of Householder in Olmsted County
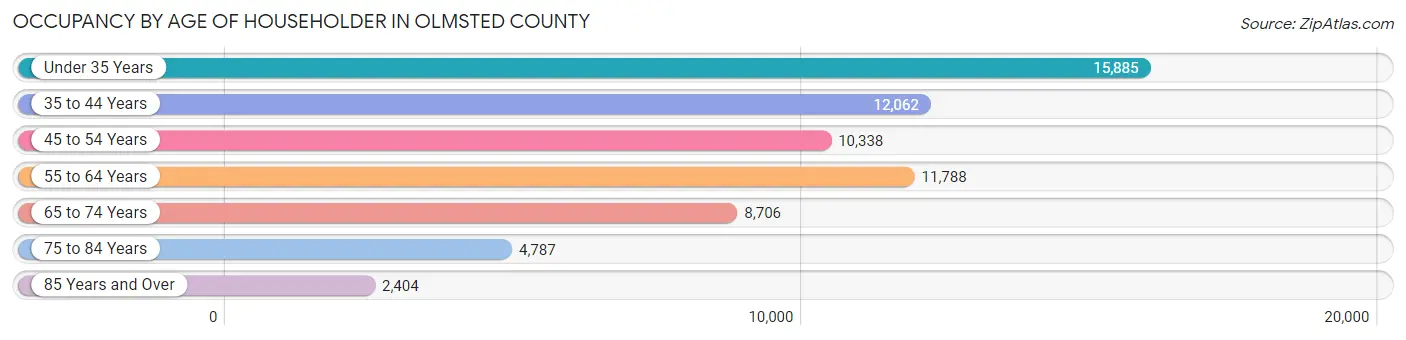
| Age Bracket | # Households | % Households |
| Under 35 Years | 15,885 | 24.1% |
| 35 to 44 Years | 12,062 | 18.3% |
| 45 to 54 Years | 10,338 | 15.7% |
| 55 to 64 Years | 11,788 | 17.9% |
| 65 to 74 Years | 8,706 | 13.2% |
| 75 to 84 Years | 4,787 | 7.3% |
| 85 Years and Over | 2,404 | 3.6% |
| Total | 65,970 | 100.0% |
Housing Finances in Olmsted County
Median Income by Occupancy in Olmsted County
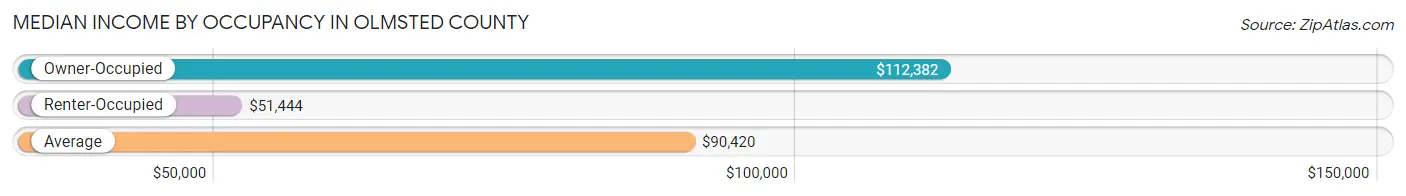
| Occupancy Type | # Households | Median Income |
| Owner-Occupied | 46,702 (70.8%) | $112,382 |
| Renter-Occupied | 19,268 (29.2%) | $51,444 |
| Average | 65,970 (100.0%) | $90,420 |
Occupancy by Householder Income Bracket in Olmsted County
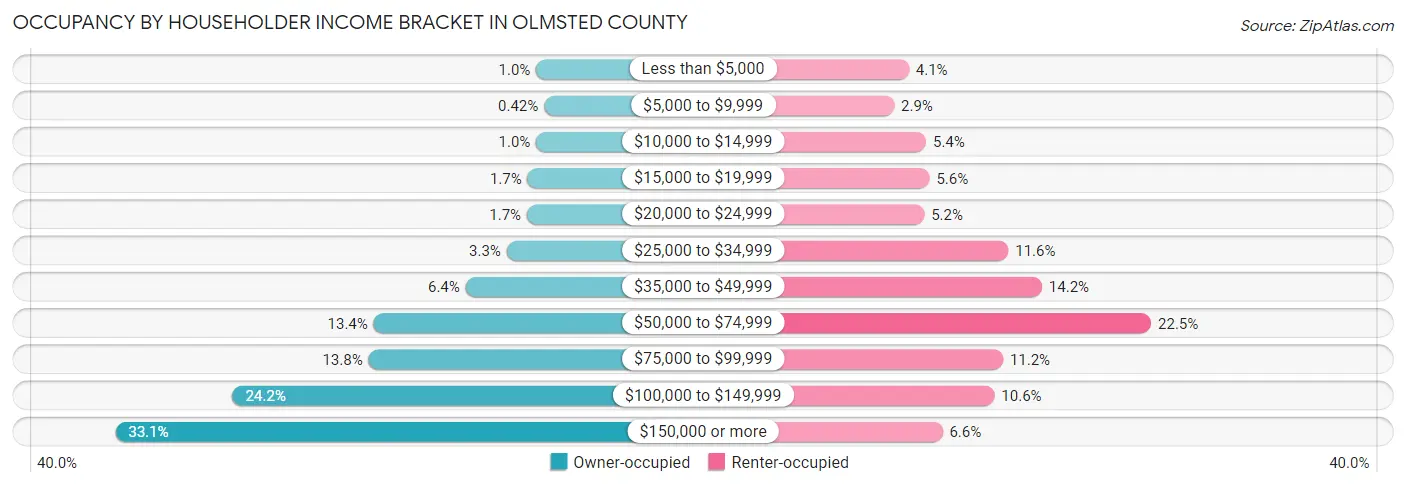
| Income Bracket | Owner-occupied | Renter-occupied |
| Less than $5,000 | 478 (1.0%) | 782 (4.1%) |
| $5,000 to $9,999 | 195 (0.4%) | 566 (2.9%) |
| $10,000 to $14,999 | 477 (1.0%) | 1,034 (5.4%) |
| $15,000 to $19,999 | 783 (1.7%) | 1,084 (5.6%) |
| $20,000 to $24,999 | 808 (1.7%) | 1,008 (5.2%) |
| $25,000 to $34,999 | 1,525 (3.3%) | 2,242 (11.6%) |
| $35,000 to $49,999 | 2,991 (6.4%) | 2,736 (14.2%) |
| $50,000 to $74,999 | 6,265 (13.4%) | 4,340 (22.5%) |
| $75,000 to $99,999 | 6,444 (13.8%) | 2,163 (11.2%) |
| $100,000 to $149,999 | 11,283 (24.2%) | 2,038 (10.6%) |
| $150,000 or more | 15,453 (33.1%) | 1,275 (6.6%) |
| Total | 46,702 (100.0%) | 19,268 (100.0%) |
Monthly Housing Cost Tiers in Olmsted County
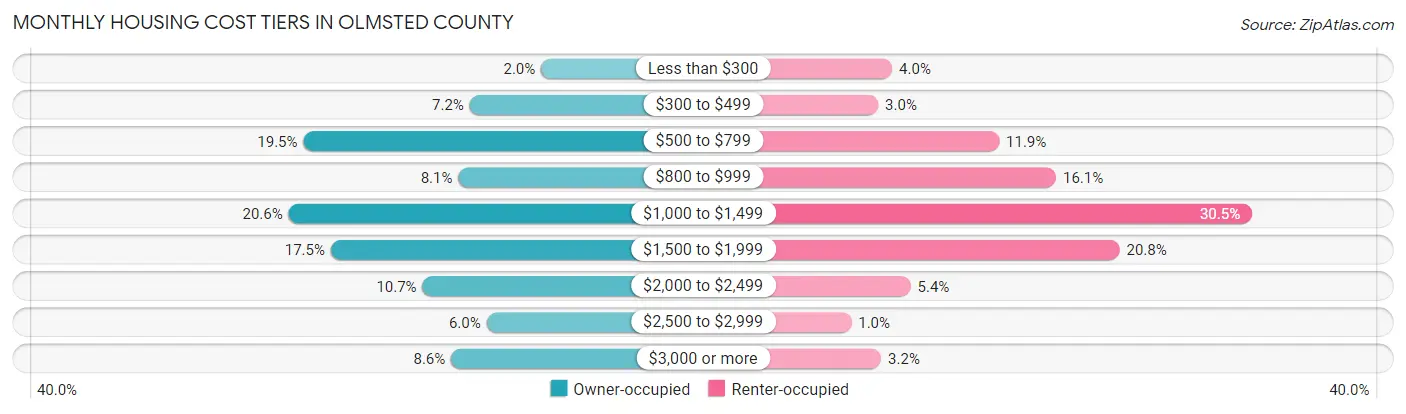
| Monthly Cost | Owner-occupied | Renter-occupied |
| Less than $300 | 915 (2.0%) | 776 (4.0%) |
| $300 to $499 | 3,374 (7.2%) | 579 (3.0%) |
| $500 to $799 | 9,092 (19.5%) | 2,294 (11.9%) |
| $800 to $999 | 3,766 (8.1%) | 3,103 (16.1%) |
| $1,000 to $1,499 | 9,602 (20.6%) | 5,882 (30.5%) |
| $1,500 to $1,999 | 8,150 (17.4%) | 4,004 (20.8%) |
| $2,000 to $2,499 | 4,998 (10.7%) | 1,038 (5.4%) |
| $2,500 to $2,999 | 2,791 (6.0%) | 197 (1.0%) |
| $3,000 or more | 4,014 (8.6%) | 620 (3.2%) |
| Total | 46,702 (100.0%) | 19,268 (100.0%) |
Physical Housing Characteristics in Olmsted County
Housing Structures in Olmsted County
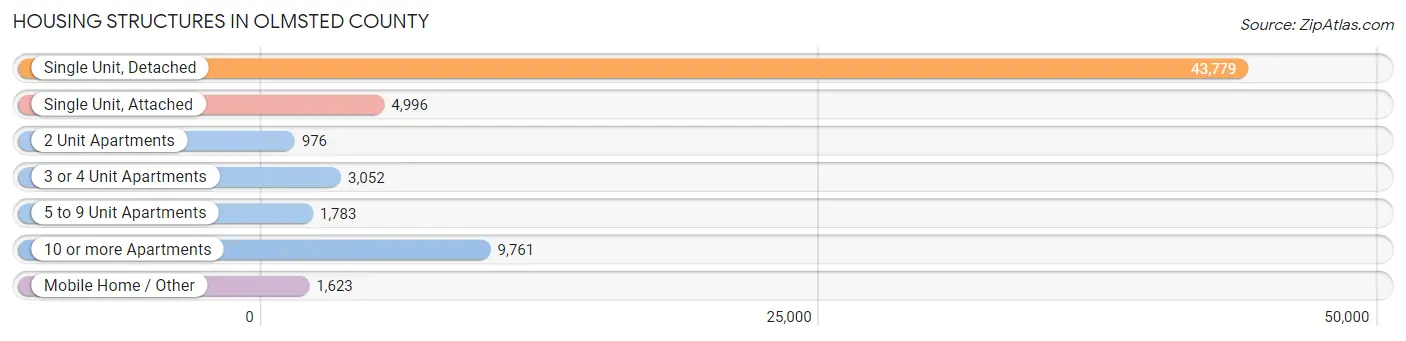
| Structure Type | # Housing Units | % Housing Units |
| Single Unit, Detached | 43,779 | 66.4% |
| Single Unit, Attached | 4,996 | 7.6% |
| 2 Unit Apartments | 976 | 1.5% |
| 3 or 4 Unit Apartments | 3,052 | 4.6% |
| 5 to 9 Unit Apartments | 1,783 | 2.7% |
| 10 or more Apartments | 9,761 | 14.8% |
| Mobile Home / Other | 1,623 | 2.5% |
| Total | 65,970 | 100.0% |
Housing Structures by Occupancy in Olmsted County
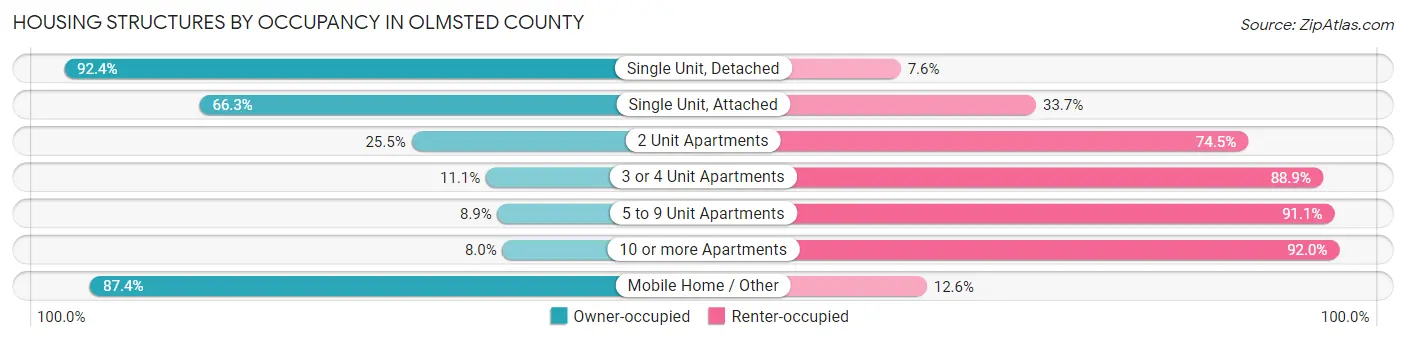
| Structure Type | Owner-occupied | Renter-occupied |
| Single Unit, Detached | 40,444 (92.4%) | 3,335 (7.6%) |
| Single Unit, Attached | 3,314 (66.3%) | 1,682 (33.7%) |
| 2 Unit Apartments | 249 (25.5%) | 727 (74.5%) |
| 3 or 4 Unit Apartments | 340 (11.1%) | 2,712 (88.9%) |
| 5 to 9 Unit Apartments | 159 (8.9%) | 1,624 (91.1%) |
| 10 or more Apartments | 778 (8.0%) | 8,983 (92.0%) |
| Mobile Home / Other | 1,418 (87.4%) | 205 (12.6%) |
| Total | 46,702 (70.8%) | 19,268 (29.2%) |
Housing Structures by Number of Rooms in Olmsted County
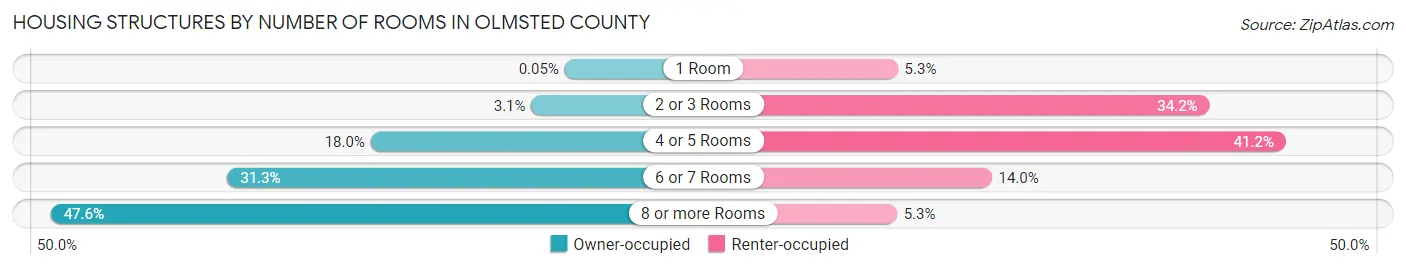
| Number of Rooms | Owner-occupied | Renter-occupied |
| 1 Room | 22 (0.1%) | 1,029 (5.3%) |
| 2 or 3 Rooms | 1,463 (3.1%) | 6,583 (34.2%) |
| 4 or 5 Rooms | 8,400 (18.0%) | 7,944 (41.2%) |
| 6 or 7 Rooms | 14,596 (31.2%) | 2,701 (14.0%) |
| 8 or more Rooms | 22,221 (47.6%) | 1,011 (5.2%) |
| Total | 46,702 (100.0%) | 19,268 (100.0%) |
Housing Structure by Heating Type in Olmsted County
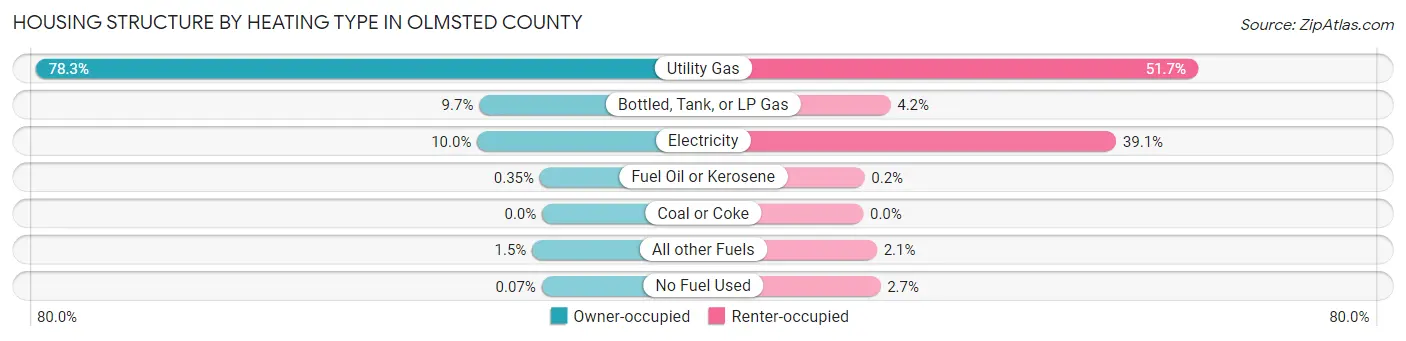
| Heating Type | Owner-occupied | Renter-occupied |
| Utility Gas | 36,567 (78.3%) | 9,970 (51.7%) |
| Bottled, Tank, or LP Gas | 4,538 (9.7%) | 811 (4.2%) |
| Electricity | 4,686 (10.0%) | 7,531 (39.1%) |
| Fuel Oil or Kerosene | 162 (0.4%) | 38 (0.2%) |
| Coal or Coke | 0 (0.0%) | 0 (0.0%) |
| All other Fuels | 716 (1.5%) | 407 (2.1%) |
| No Fuel Used | 33 (0.1%) | 511 (2.6%) |
| Total | 46,702 (100.0%) | 19,268 (100.0%) |
Household Vehicle Usage in Olmsted County
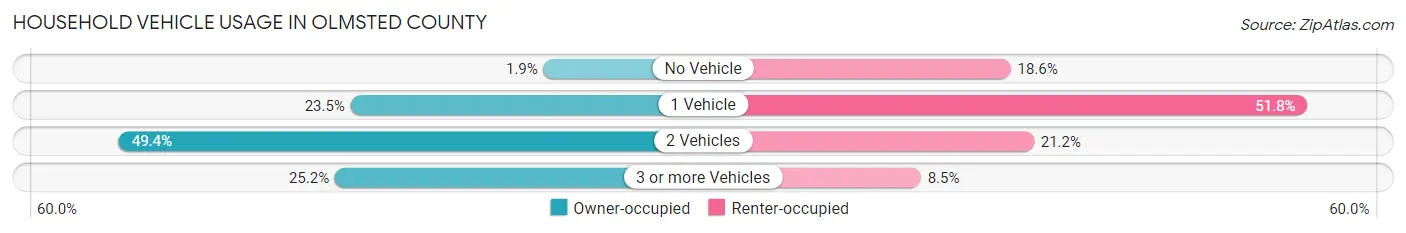
| Vehicles per Household | Owner-occupied | Renter-occupied |
| No Vehicle | 867 (1.9%) | 3,575 (18.5%) |
| 1 Vehicle | 10,963 (23.5%) | 9,980 (51.8%) |
| 2 Vehicles | 23,088 (49.4%) | 4,078 (21.2%) |
| 3 or more Vehicles | 11,784 (25.2%) | 1,635 (8.5%) |
| Total | 46,702 (100.0%) | 19,268 (100.0%) |
Real Estate & Mortgages in Olmsted County
Real Estate and Mortgage Overview in Olmsted County
| Characteristic | Without Mortgage | With Mortgage |
| Housing Units | 17,262 | 29,440 |
| Median Property Value | $271,600 | $293,600 |
| Median Household Income | $88,348 | $11,233 |
| Monthly Housing Costs | $654 | $3,971 |
| Real Estate Taxes | $2,992 | $623 |
Property Value by Mortgage Status in Olmsted County
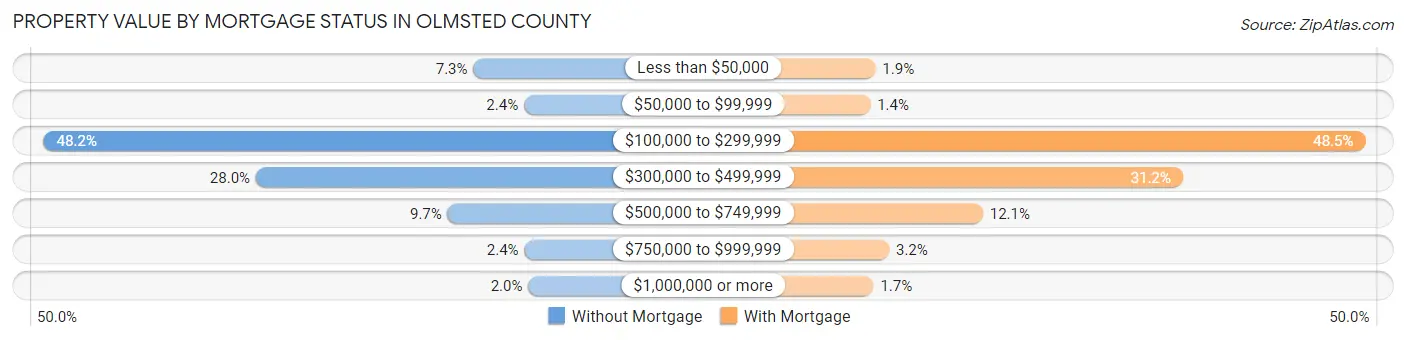
| Property Value | Without Mortgage | With Mortgage |
| Less than $50,000 | 1,253 (7.3%) | 555 (1.9%) |
| $50,000 to $99,999 | 421 (2.4%) | 412 (1.4%) |
| $100,000 to $299,999 | 8,318 (48.2%) | 14,289 (48.5%) |
| $300,000 to $499,999 | 4,829 (28.0%) | 9,175 (31.2%) |
| $500,000 to $749,999 | 1,676 (9.7%) | 3,567 (12.1%) |
| $750,000 to $999,999 | 415 (2.4%) | 938 (3.2%) |
| $1,000,000 or more | 350 (2.0%) | 504 (1.7%) |
| Total | 17,262 (100.0%) | 29,440 (100.0%) |
Household Income by Mortgage Status in Olmsted County
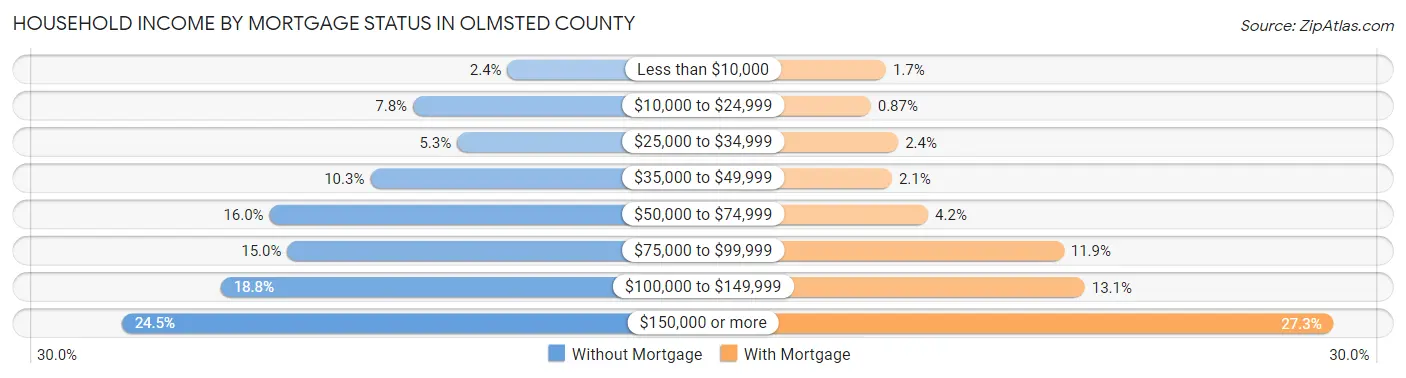
| Household Income | Without Mortgage | With Mortgage |
| Less than $10,000 | 416 (2.4%) | 513 (1.7%) |
| $10,000 to $24,999 | 1,349 (7.8%) | 257 (0.9%) |
| $25,000 to $34,999 | 914 (5.3%) | 719 (2.4%) |
| $35,000 to $49,999 | 1,770 (10.2%) | 611 (2.1%) |
| $50,000 to $74,999 | 2,763 (16.0%) | 1,221 (4.2%) |
| $75,000 to $99,999 | 2,587 (15.0%) | 3,502 (11.9%) |
| $100,000 to $149,999 | 3,243 (18.8%) | 3,857 (13.1%) |
| $150,000 or more | 4,220 (24.4%) | 8,040 (27.3%) |
| Total | 17,262 (100.0%) | 29,440 (100.0%) |
Property Value to Household Income Ratio in Olmsted County
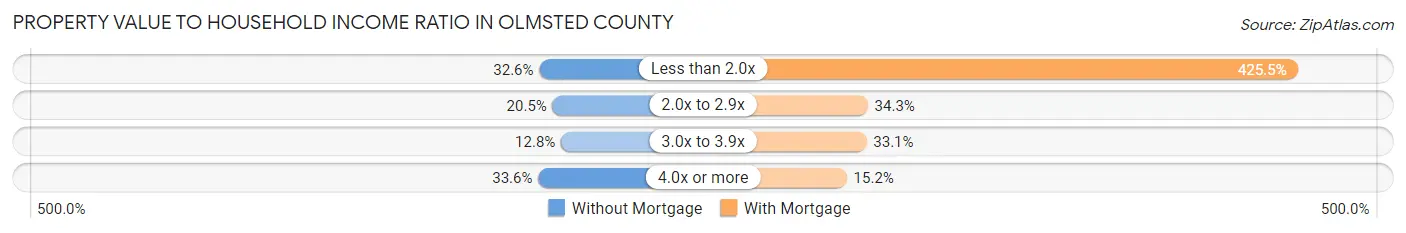
| Value-to-Income Ratio | Without Mortgage | With Mortgage |
| Less than 2.0x | 5,621 (32.6%) | 125,280 (425.5%) |
| 2.0x to 2.9x | 3,535 (20.5%) | 10,091 (34.3%) |
| 3.0x to 3.9x | 2,202 (12.8%) | 9,747 (33.1%) |
| 4.0x or more | 5,791 (33.6%) | 4,476 (15.2%) |
| Total | 17,262 (100.0%) | 29,440 (100.0%) |
Real Estate Taxes by Mortgage Status in Olmsted County

| Property Taxes | Without Mortgage | With Mortgage |
| Less than $800 | 1,416 (8.2%) | 54 (0.2%) |
| $800 to $1,499 | 1,417 (8.2%) | 947 (3.2%) |
| $800 to $1,499 | 14,030 (81.3%) | 2,294 (7.8%) |
| Total | 17,262 (100.0%) | 29,440 (100.0%) |
Health & Disability in Olmsted County
Health Insurance Coverage by Age in Olmsted County
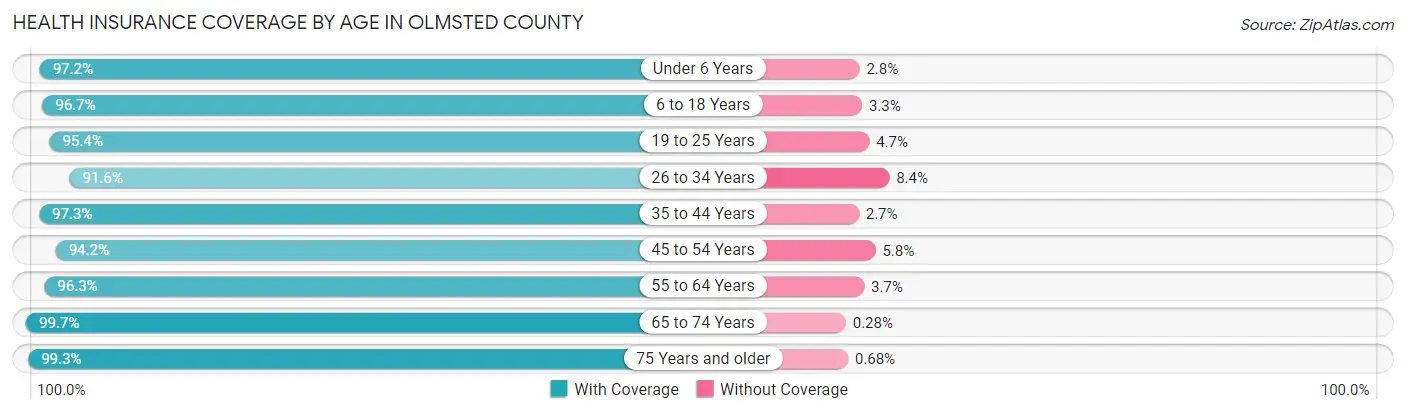
| Age Bracket | With Coverage | Without Coverage |
| Under 6 Years | 12,091 (97.2%) | 352 (2.8%) |
| 6 to 18 Years | 27,620 (96.7%) | 945 (3.3%) |
| 19 to 25 Years | 12,643 (95.4%) | 616 (4.6%) |
| 26 to 34 Years | 19,256 (91.6%) | 1,762 (8.4%) |
| 35 to 44 Years | 21,561 (97.3%) | 598 (2.7%) |
| 45 to 54 Years | 16,737 (94.2%) | 1,033 (5.8%) |
| 55 to 64 Years | 19,581 (96.3%) | 753 (3.7%) |
| 65 to 74 Years | 14,110 (99.7%) | 40 (0.3%) |
| 75 Years and older | 10,640 (99.3%) | 73 (0.7%) |
| Total | 154,239 (96.2%) | 6,172 (3.8%) |
Health Insurance Coverage by Citizenship Status in Olmsted County
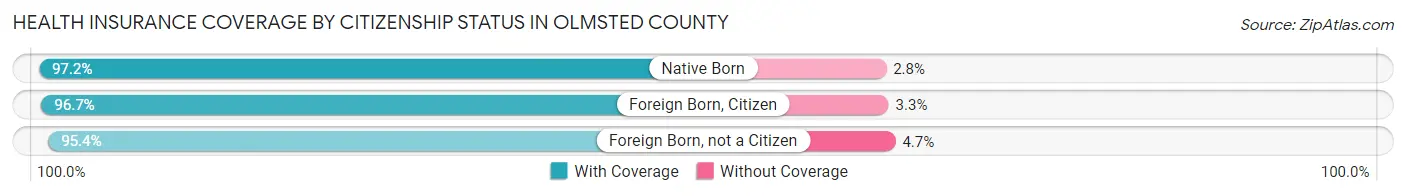
| Citizenship Status | With Coverage | Without Coverage |
| Native Born | 12,091 (97.2%) | 352 (2.8%) |
| Foreign Born, Citizen | 27,620 (96.7%) | 945 (3.3%) |
| Foreign Born, not a Citizen | 12,643 (95.4%) | 616 (4.6%) |
Health Insurance Coverage by Household Income in Olmsted County
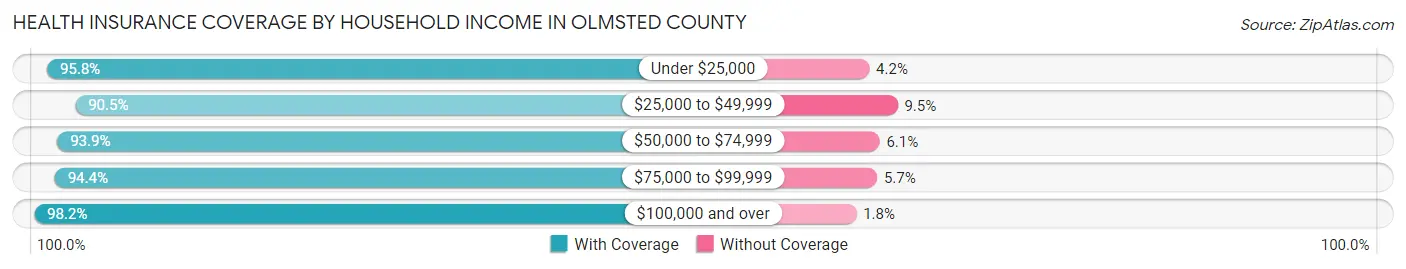
| Household Income | With Coverage | Without Coverage |
| Under $25,000 | 10,823 (95.8%) | 473 (4.2%) |
| $25,000 to $49,999 | 14,787 (90.5%) | 1,550 (9.5%) |
| $50,000 to $74,999 | 21,676 (93.9%) | 1,414 (6.1%) |
| $75,000 to $99,999 | 19,214 (94.4%) | 1,150 (5.7%) |
| $100,000 and over | 86,675 (98.2%) | 1,558 (1.8%) |
Public vs Private Health Insurance Coverage by Age in Olmsted County
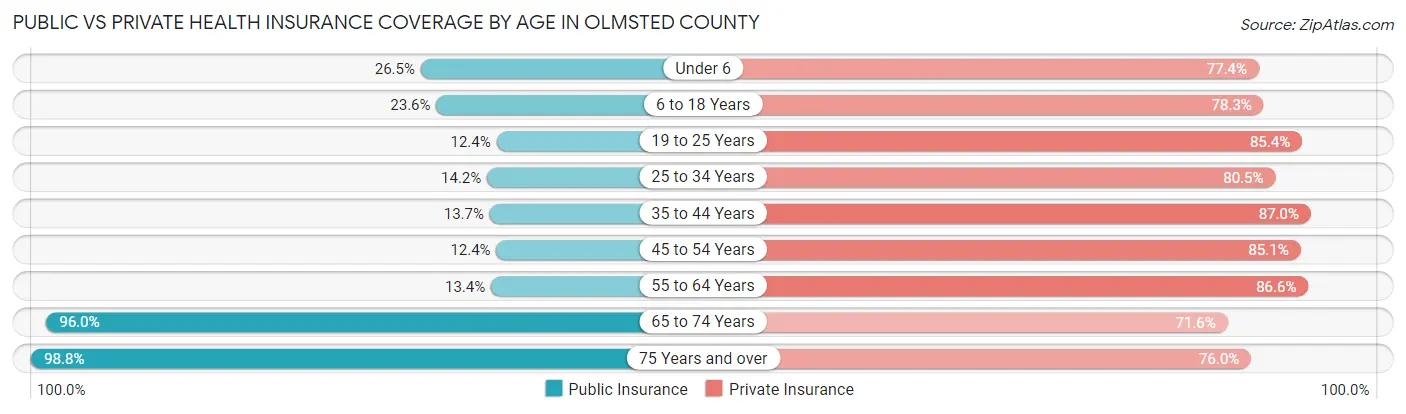
| Age Bracket | Public Insurance | Private Insurance |
| Under 6 | 3,293 (26.5%) | 9,632 (77.4%) |
| 6 to 18 Years | 6,733 (23.6%) | 22,366 (78.3%) |
| 19 to 25 Years | 1,644 (12.4%) | 11,324 (85.4%) |
| 25 to 34 Years | 2,975 (14.1%) | 16,910 (80.4%) |
| 35 to 44 Years | 3,026 (13.7%) | 19,287 (87.0%) |
| 45 to 54 Years | 2,207 (12.4%) | 15,127 (85.1%) |
| 55 to 64 Years | 2,729 (13.4%) | 17,603 (86.6%) |
| 65 to 74 Years | 13,580 (96.0%) | 10,132 (71.6%) |
| 75 Years and over | 10,584 (98.8%) | 8,140 (76.0%) |
| Total | 46,771 (29.2%) | 130,521 (81.4%) |
Disability Status by Sex by Age in Olmsted County
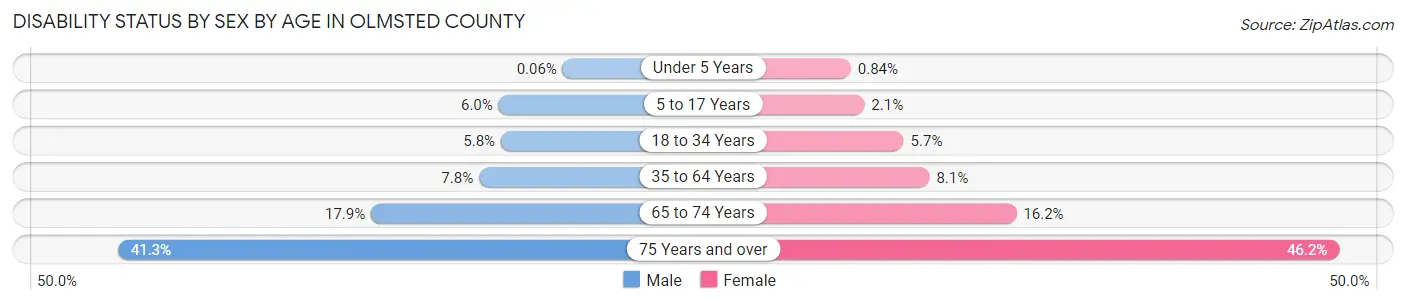
| Age Bracket | Male | Female |
| Under 5 Years | 3 (0.1%) | 43 (0.8%) |
| 5 to 17 Years | 882 (6.0%) | 295 (2.1%) |
| 18 to 34 Years | 1,020 (5.8%) | 1,063 (5.7%) |
| 35 to 64 Years | 2,342 (7.8%) | 2,472 (8.1%) |
| 65 to 74 Years | 1,170 (17.8%) | 1,231 (16.2%) |
| 75 Years and over | 1,842 (41.3%) | 2,888 (46.2%) |
Disability Class by Sex by Age in Olmsted County
Disability Class: Hearing Difficulty
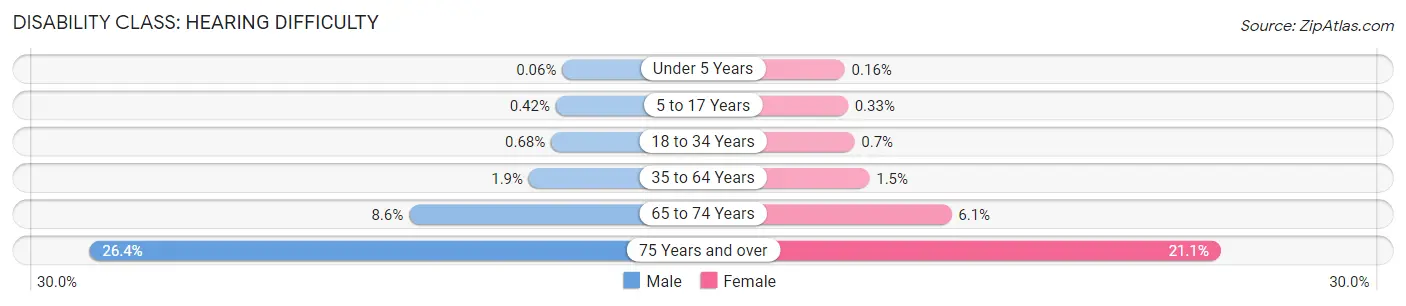
| Age Bracket | Male | Female |
| Under 5 Years | 3 (0.1%) | 8 (0.2%) |
| 5 to 17 Years | 61 (0.4%) | 46 (0.3%) |
| 18 to 34 Years | 120 (0.7%) | 130 (0.7%) |
| 35 to 64 Years | 573 (1.9%) | 464 (1.5%) |
| 65 to 74 Years | 563 (8.6%) | 463 (6.1%) |
| 75 Years and over | 1,176 (26.4%) | 1,320 (21.1%) |
Disability Class: Vision Difficulty
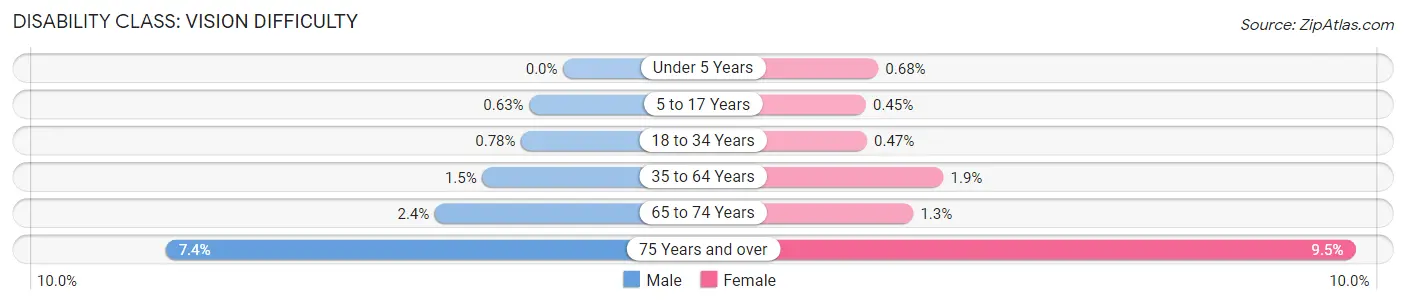
| Age Bracket | Male | Female |
| Under 5 Years | 0 (0.0%) | 35 (0.7%) |
| 5 to 17 Years | 92 (0.6%) | 63 (0.4%) |
| 18 to 34 Years | 137 (0.8%) | 87 (0.5%) |
| 35 to 64 Years | 450 (1.5%) | 574 (1.9%) |
| 65 to 74 Years | 156 (2.4%) | 101 (1.3%) |
| 75 Years and over | 329 (7.4%) | 596 (9.5%) |
Disability Class: Cognitive Difficulty
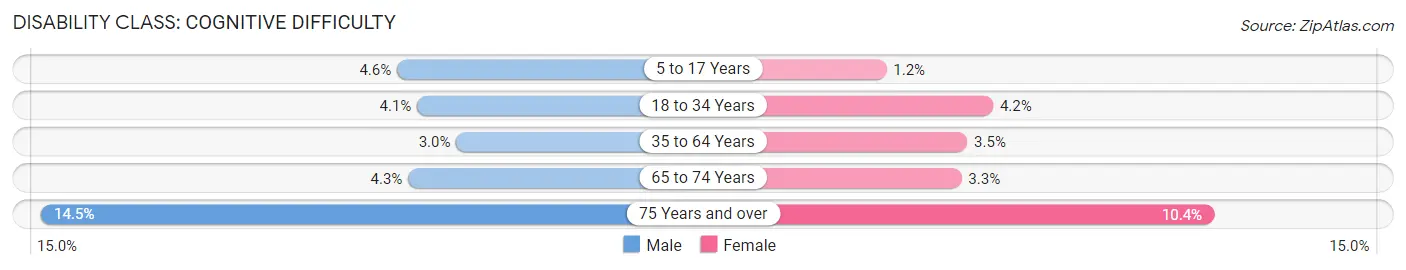
| Age Bracket | Male | Female |
| 5 to 17 Years | 679 (4.6%) | 175 (1.2%) |
| 18 to 34 Years | 718 (4.1%) | 779 (4.2%) |
| 35 to 64 Years | 890 (3.0%) | 1,060 (3.5%) |
| 65 to 74 Years | 283 (4.3%) | 253 (3.3%) |
| 75 Years and over | 648 (14.5%) | 648 (10.4%) |
Disability Class: Ambulatory Difficulty
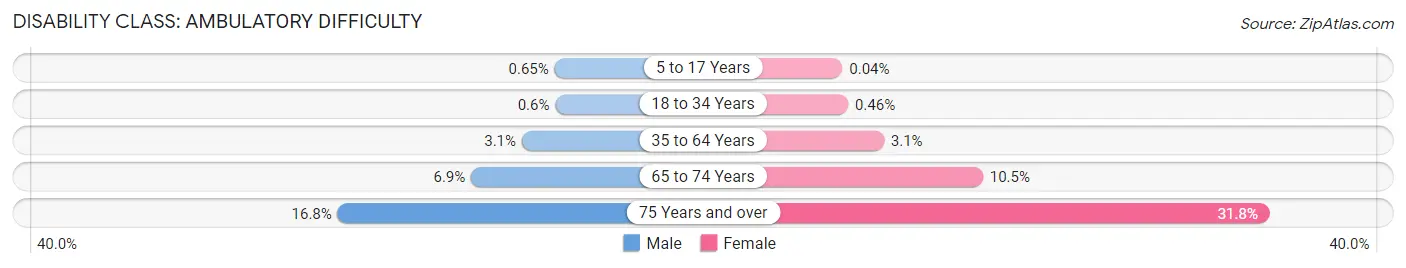
| Age Bracket | Male | Female |
| 5 to 17 Years | 96 (0.6%) | 6 (0.0%) |
| 18 to 34 Years | 105 (0.6%) | 86 (0.5%) |
| 35 to 64 Years | 921 (3.1%) | 946 (3.1%) |
| 65 to 74 Years | 449 (6.9%) | 795 (10.5%) |
| 75 Years and over | 747 (16.8%) | 1,988 (31.8%) |
Disability Class: Self-Care Difficulty
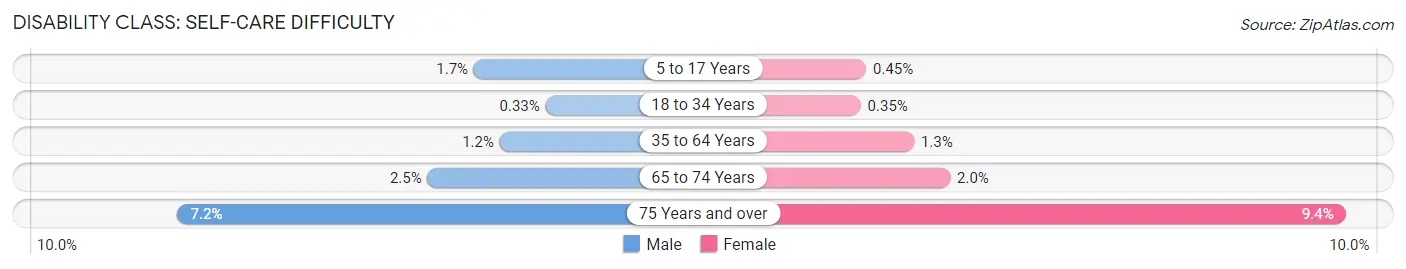
| Age Bracket | Male | Female |
| 5 to 17 Years | 244 (1.7%) | 64 (0.4%) |
| 18 to 34 Years | 58 (0.3%) | 65 (0.4%) |
| 35 to 64 Years | 353 (1.2%) | 407 (1.3%) |
| 65 to 74 Years | 165 (2.5%) | 153 (2.0%) |
| 75 Years and over | 319 (7.2%) | 585 (9.3%) |
Technology Access in Olmsted County
Computing Device Access in Olmsted County
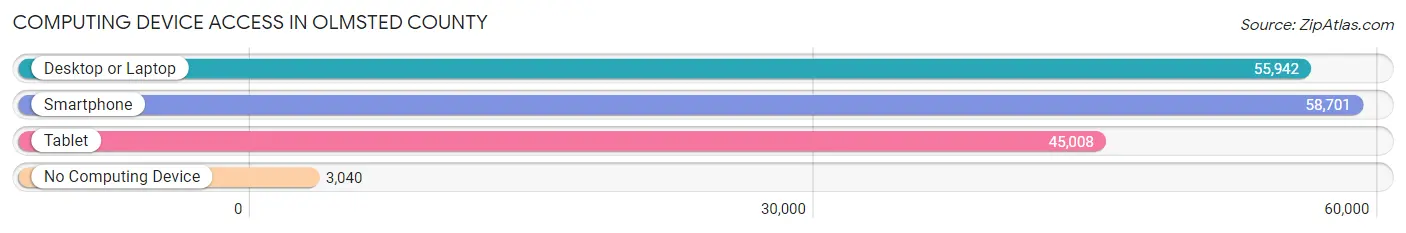
| Device Type | # Households | % Households |
| Desktop or Laptop | 55,942 | 84.8% |
| Smartphone | 58,701 | 89.0% |
| Tablet | 45,008 | 68.2% |
| No Computing Device | 3,040 | 4.6% |
| Total | 65,970 | 100.0% |
Internet Access in Olmsted County
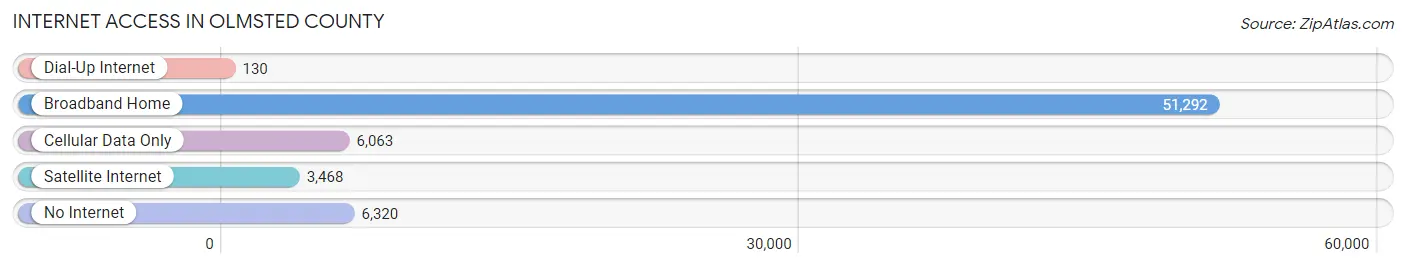
| Internet Type | # Households | % Households |
| Dial-Up Internet | 130 | 0.2% |
| Broadband Home | 51,292 | 77.7% |
| Cellular Data Only | 6,063 | 9.2% |
| Satellite Internet | 3,468 | 5.3% |
| No Internet | 6,320 | 9.6% |
| Total | 65,970 | 100.0% |
Olmsted County Summary
Olmsted County, Minnesota is located in the southeastern corner of the state and is part of the Rochester Metropolitan Statistical Area. It is bordered by Dodge County to the north, Wabasha County to the east, Fillmore County to the south, and Mower County to the west. The county seat is Rochester, which is also the largest city in the county. Olmsted County has a total area of 645 square miles, of which 637 square miles is land and 8 square miles is water.
History
Olmsted County was established in 1855 and was named after David Olmsted, a prominent early settler. The county was originally part of Wabasha County, but was split off in 1855. The first settlers arrived in the area in 1854, and the county was officially organized in 1855. The first county seat was located in Oronoco, but it was moved to Rochester in 1857.
The county was largely agricultural in its early years, with the main crops being wheat, oats, and corn. The county also had a thriving lumber industry, with several sawmills located in the area. The county also had a strong manufacturing sector, with several factories producing furniture, clothing, and other goods.
Geography
Olmsted County is located in the southeastern corner of Minnesota, and is part of the Rochester Metropolitan Statistical Area. It is bordered by Dodge County to the north, Wabasha County to the east, Fillmore County to the south, and Mower County to the west. The county has a total area of 645 square miles, of which 637 square miles is land and 8 square miles is water.
The county is mostly flat, with some rolling hills in the northern and western parts of the county. The Zumbro River runs through the county, and there are several lakes and ponds scattered throughout the area. The county is also home to several state parks, including Quarry Hill Nature Center, Whitewater State Park, and Beaver Creek Valley State Park.
Economy
Olmsted County has a diverse economy, with a mix of manufacturing, agriculture, and services. The county is home to several large employers, including the Mayo Clinic, IBM, and the University of Minnesota. The county also has a strong agricultural sector, with the main crops being corn, soybeans, and wheat.
The county also has a thriving tourism industry, with several attractions, including the Mayo Clinic, the University of Minnesota, and the Quarry Hill Nature Center. The county also has several wineries, breweries, and distilleries, as well as several golf courses.
Demographics
As of the 2010 census, Olmsted County had a population of 144,248. The population was spread out, with 24.3% under the age of 18, 11.2% from 18 to 24, 28.2% from 25 to 44, 22.7% from 45 to 64, and 13.6% who were 65 years of age or older. The median age was 36.4 years.
The racial makeup of the county was 87.2% White, 5.7% African American, 0.7% Native American, 2.7% Asian, 0.1% Pacific Islander, 1.7% from other races, and 2.0% from two or more races. Hispanic or Latino of any race were 4.3% of the population.
The median income for a household in the county was $60,945, and the median income for a family was $76,945. The per capita income for the county was $30,945. About 6.2% of families and 9.2% of the population were below the poverty line, including 11.2% of those under age 18 and 6.2% of those age 65 or over.
Common Questions
What is the Total Population of Olmsted County?
Total Population of Olmsted County is 162,307.
What is the Total Male Population of Olmsted County?
Total Male Population of Olmsted County is 79,676.
What is the Total Female Population of Olmsted County?
Total Female Population of Olmsted County is 82,631.
What is the Ratio of Males per 100 Females in Olmsted County?
There are 96.42 Males per 100 Females in Olmsted County.
What is the Ratio of Females per 100 Males in Olmsted County?
There are 103.71 Females per 100 Males in Olmsted County.
What is the Median Population Age in Olmsted County?
Median Population Age in Olmsted County is 37.6 Years.
What is the Average Family Size in Olmsted County
Average Family Size in Olmsted County is 3.0 People.
What is the Average Household Size in Olmsted County
Average Household Size in Olmsted County is 2.4 People.
What is Per Capita Income in Olmsted County?
Per Capita income in Olmsted County is $49,799.
What is the Median Family Income in Olmsted County?
Median Family Income in Olmsted County is $114,612.
What is the Median Household income in Olmsted County?
Median Household Income in Olmsted County is $90,420.
What is Income or Wage Gap in Olmsted County?
Income or Wage Gap in Olmsted County is 15.8%.
Women in Olmsted County earn 84.2 cents for every dollar earned by a man.
What is Family Income Deficit in Olmsted County?
Family Income Deficit in Olmsted County is $9,119.
Families that are below poverty line in Olmsted County earn $9,119 less on average than the poverty threshold level.
What is Inequality or Gini Index in Olmsted County?
Inequality or Gini Index in Olmsted County is 0.46.
How Large is the Labor Force in Olmsted County?
There are 90,080 People in the Labor Forcein in Olmsted County.
What is the Percentage of People in the Labor Force in Olmsted County?
70.7% of People are in the Labor Force in Olmsted County.
What is the Unemployment Rate in Olmsted County?
Unemployment Rate in Olmsted County is 3.4%.