McLeod County, MN
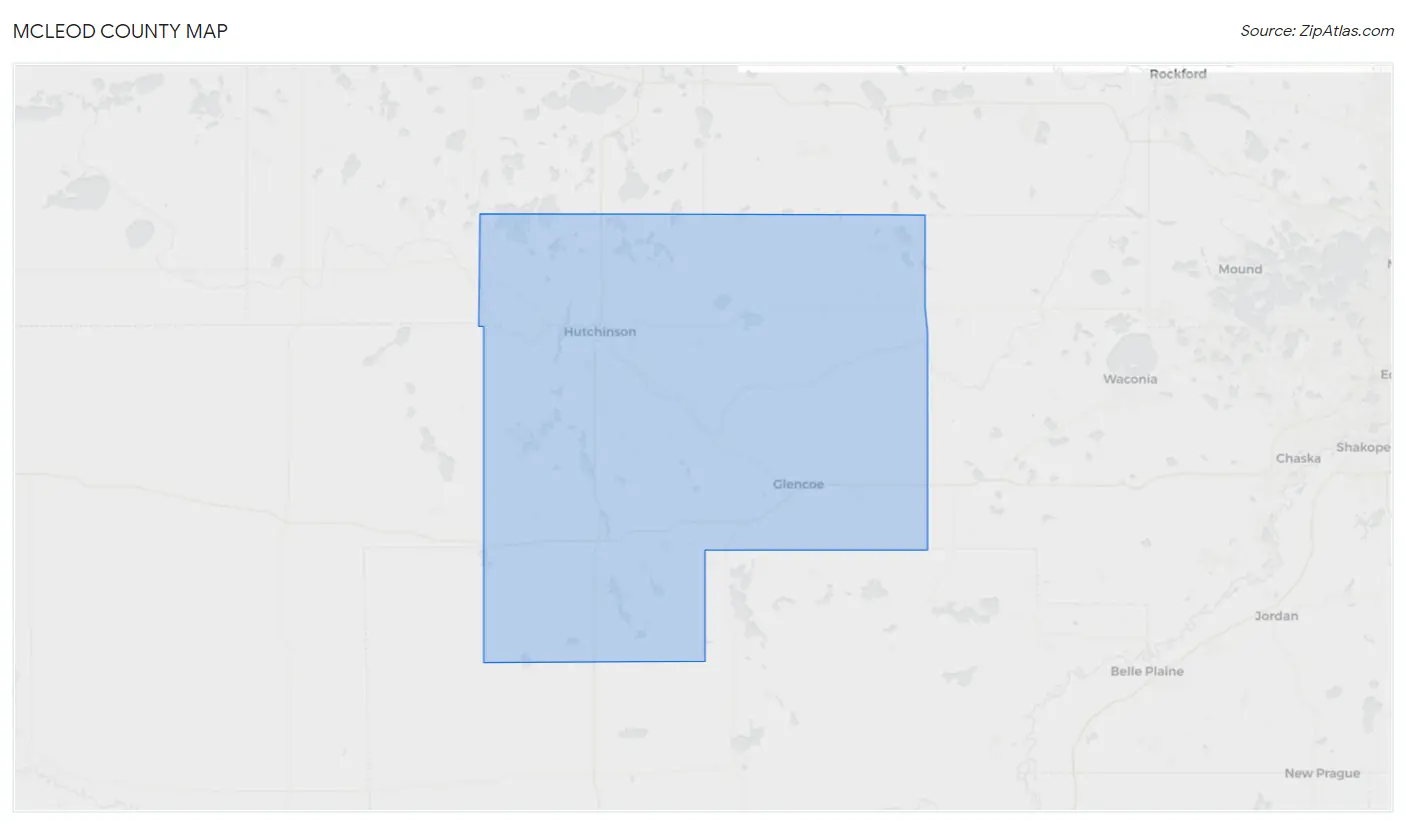
McLeod County Map
McLeod County Overview
36,727
TOTAL POPULATION
18,448
MALE POPULATION
18,279
FEMALE POPULATION
100.92
MALES / 100 FEMALES
99.08
FEMALES / 100 MALES
41.3
MEDIAN AGE
3.1
AVG FAMILY SIZE
2.4
AVG HOUSEHOLD SIZE
$39,361
PER CAPITA INCOME
$96,492
AVG FAMILY INCOME
$73,296
AVG HOUSEHOLD INCOME
28.8%
WAGE / INCOME GAP [ % ]
71.2¢/ $1
WAGE / INCOME GAP [ $ ]
0.42
INEQUALITY / GINI INDEX
19,780
LABOR FORCE [ PEOPLE ]
66.9%
PERCENT IN LABOR FORCE
3.2%
UNEMPLOYMENT RATE
McLeod County Area Codes
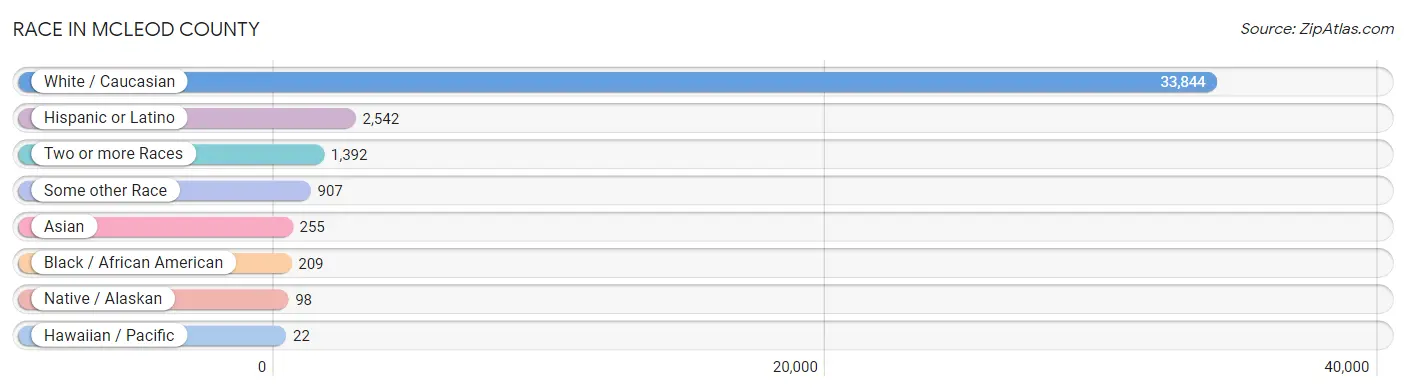
Race in McLeod County
The most populous races in McLeod County are White / Caucasian (33,844 | 92.1%), Hispanic or Latino (2,542 | 6.9%), and Two or more Races (1,392 | 3.8%).
| Race | # Population | % Population |
| Asian | 255 | 0.7% |
| Black / African American | 209 | 0.6% |
| Hawaiian / Pacific | 22 | 0.1% |
| Hispanic or Latino | 2,542 | 6.9% |
| Native / Alaskan | 98 | 0.3% |
| White / Caucasian | 33,844 | 92.1% |
| Two or more Races | 1,392 | 3.8% |
| Some other Race | 907 | 2.5% |
| Total | 36,727 | 100.0% |
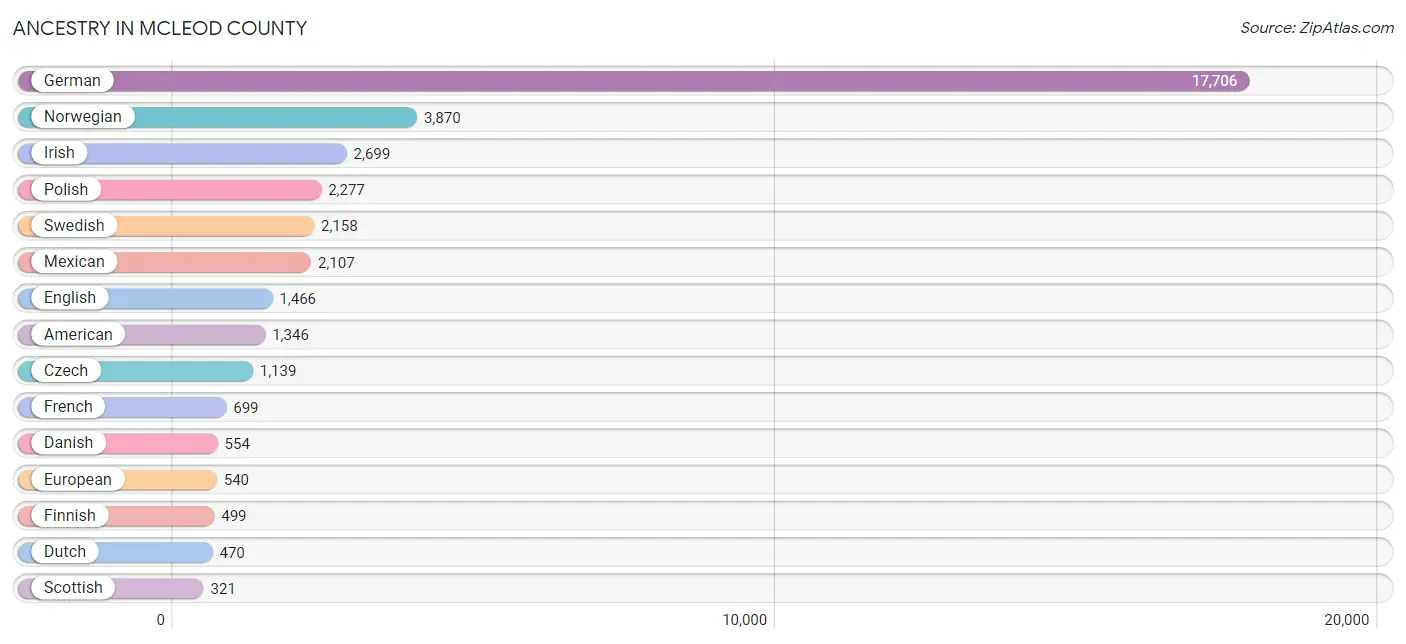
Ancestry in McLeod County
The most populous ancestries reported in McLeod County are German (17,706 | 48.2%), Norwegian (3,870 | 10.5%), Irish (2,699 | 7.3%), Polish (2,277 | 6.2%), and Swedish (2,158 | 5.9%), together accounting for 78.2% of all McLeod County residents.
| Ancestry | # Population | % Population |
| African | 10 | 0.0% |
| Alaskan Athabascan | 6 | 0.0% |
| American | 1,346 | 3.7% |
| Apache | 22 | 0.1% |
| Arab | 19 | 0.1% |
| Austrian | 47 | 0.1% |
| Belgian | 18 | 0.1% |
| Bhutanese | 31 | 0.1% |
| British | 68 | 0.2% |
| Burmese | 188 | 0.5% |
| Canadian | 16 | 0.0% |
| Central American | 18 | 0.1% |
| Cherokee | 30 | 0.1% |
| Chippewa | 34 | 0.1% |
| Colombian | 4 | 0.0% |
| Croatian | 9 | 0.0% |
| Cuban | 84 | 0.2% |
| Czech | 1,139 | 3.1% |
| Czechoslovakian | 155 | 0.4% |
| Danish | 554 | 1.5% |
| Dominican | 17 | 0.1% |
| Dutch | 470 | 1.3% |
| Dutch West Indian | 11 | 0.0% |
| Eastern European | 89 | 0.2% |
| Ecuadorian | 56 | 0.2% |
| English | 1,466 | 4.0% |
| European | 540 | 1.5% |
| Finnish | 499 | 1.4% |
| French | 699 | 1.9% |
| French Canadian | 127 | 0.4% |
| German | 17,706 | 48.2% |
| German Russian | 2 | 0.0% |
| Ghanaian | 26 | 0.1% |
| Greek | 48 | 0.1% |
| Guamanian / Chamorro | 9 | 0.0% |
| Haitian | 10 | 0.0% |
| Honduran | 18 | 0.1% |
| Hungarian | 30 | 0.1% |
| Icelander | 16 | 0.0% |
| Indian (Asian) | 124 | 0.3% |
| Indonesian | 1 | 0.0% |
| Inupiat | 3 | 0.0% |
| Iranian | 2 | 0.0% |
| Irish | 2,699 | 7.3% |
| Iroquois | 7 | 0.0% |
| Italian | 291 | 0.8% |
| Jamaican | 5 | 0.0% |
| Korean | 112 | 0.3% |
| Latvian | 12 | 0.0% |
| Lebanese | 19 | 0.1% |
| Luxembourger | 8 | 0.0% |
| Malaysian | 9 | 0.0% |
| Mexican | 2,107 | 5.7% |
| Mexican American Indian | 61 | 0.2% |
| Navajo | 4 | 0.0% |
| Nigerian | 76 | 0.2% |
| Northern European | 9 | 0.0% |
| Norwegian | 3,870 | 10.5% |
| Pakistani | 6 | 0.0% |
| Pennsylvania German | 2 | 0.0% |
| Polish | 2,277 | 6.2% |
| Portuguese | 4 | 0.0% |
| Puerto Rican | 56 | 0.2% |
| Romanian | 10 | 0.0% |
| Russian | 98 | 0.3% |
| Samoan | 5 | 0.0% |
| Scandinavian | 291 | 0.8% |
| Scotch-Irish | 144 | 0.4% |
| Scottish | 321 | 0.9% |
| Sioux | 33 | 0.1% |
| Slavic | 26 | 0.1% |
| Somali | 18 | 0.1% |
| South American | 60 | 0.2% |
| Spaniard | 5 | 0.0% |
| Spanish | 2 | 0.0% |
| Sri Lankan | 12 | 0.0% |
| Subsaharan African | 130 | 0.4% |
| Swedish | 2,158 | 5.9% |
| Swiss | 111 | 0.3% |
| Thai | 5 | 0.0% |
| Ukrainian | 34 | 0.1% |
| Welsh | 39 | 0.1% |
| Yugoslavian | 3 | 0.0% | View All 83 Rows |
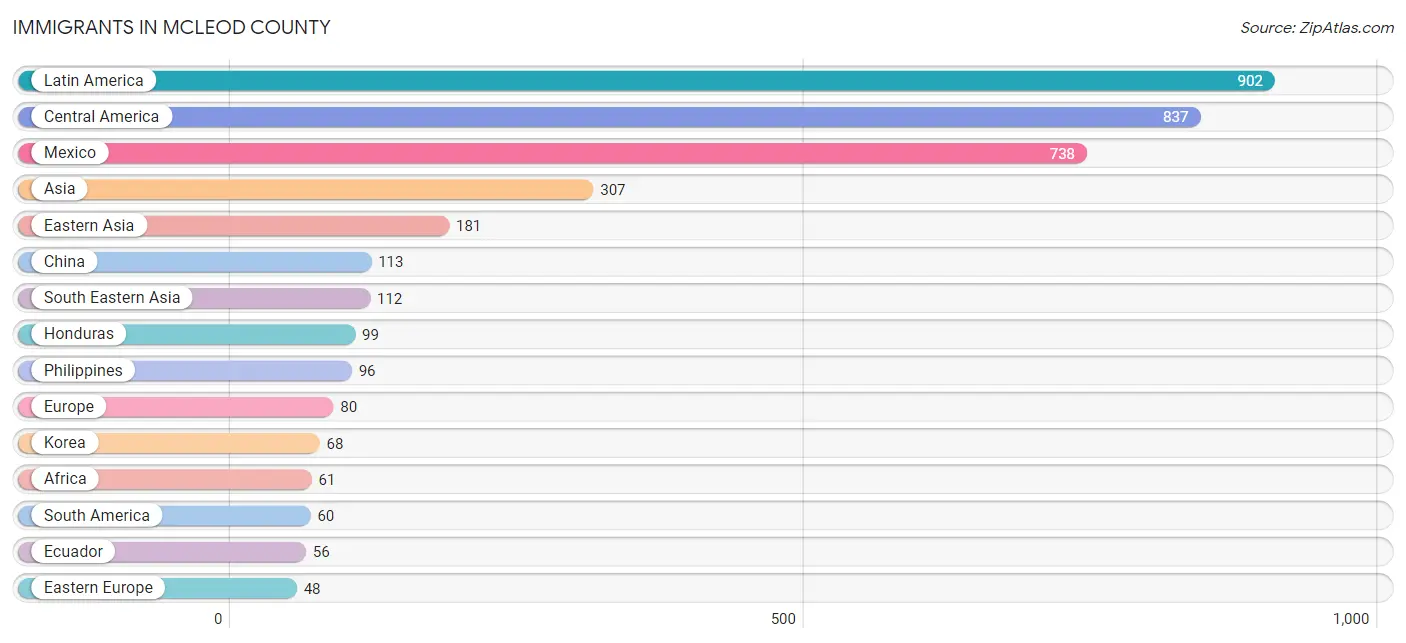
Immigrants in McLeod County
The most numerous immigrant groups reported in McLeod County came from Latin America (902 | 2.5%), Central America (837 | 2.3%), Mexico (738 | 2.0%), Asia (307 | 0.8%), and Eastern Asia (181 | 0.5%), together accounting for 8.1% of all McLeod County residents.
| Immigration Origin | # Population | % Population |
| Africa | 61 | 0.2% |
| Asia | 307 | 0.8% |
| Austria | 2 | 0.0% |
| Canada | 39 | 0.1% |
| Caribbean | 5 | 0.0% |
| Central America | 837 | 2.3% |
| China | 113 | 0.3% |
| Eastern Africa | 18 | 0.1% |
| Eastern Asia | 181 | 0.5% |
| Eastern Europe | 48 | 0.1% |
| Ecuador | 56 | 0.2% |
| England | 3 | 0.0% |
| Europe | 80 | 0.2% |
| Germany | 13 | 0.0% |
| Ghana | 26 | 0.1% |
| Honduras | 99 | 0.3% |
| India | 2 | 0.0% |
| Iran | 2 | 0.0% |
| Jamaica | 5 | 0.0% |
| Kazakhstan | 10 | 0.0% |
| Korea | 68 | 0.2% |
| Laos | 1 | 0.0% |
| Latin America | 902 | 2.5% |
| Mexico | 738 | 2.0% |
| Moldova | 3 | 0.0% |
| Nigeria | 17 | 0.1% |
| Northern Europe | 17 | 0.1% |
| Oceania | 4 | 0.0% |
| Philippines | 96 | 0.3% |
| Poland | 17 | 0.1% |
| Russia | 27 | 0.1% |
| Somalia | 18 | 0.1% |
| South America | 60 | 0.2% |
| South Central Asia | 14 | 0.0% |
| South Eastern Asia | 112 | 0.3% |
| Thailand | 3 | 0.0% |
| Ukraine | 1 | 0.0% |
| Venezuela | 4 | 0.0% |
| Vietnam | 12 | 0.0% |
| Western Africa | 43 | 0.1% |
| Western Europe | 15 | 0.0% | View All 41 Rows |
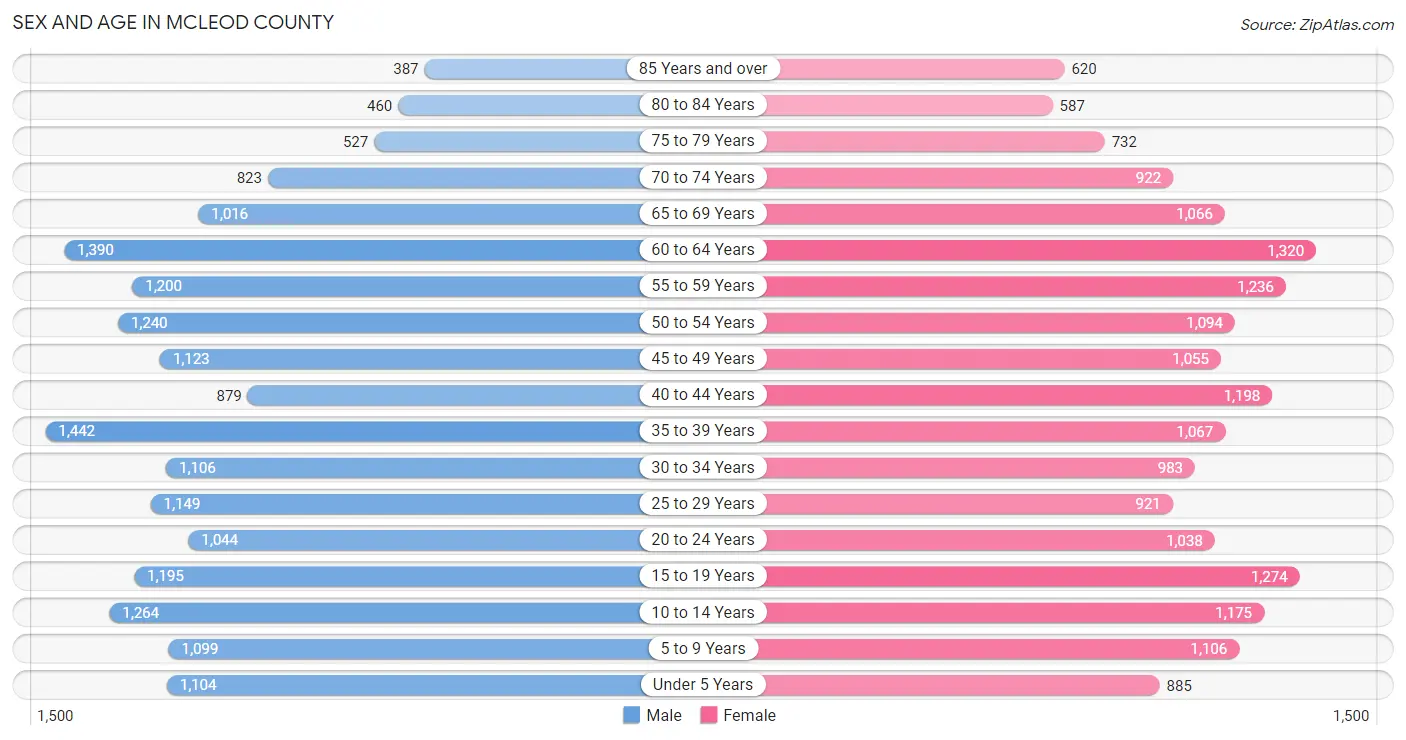
Sex and Age in McLeod County
Sex and Age in McLeod County
The most populous age groups in McLeod County are 35 to 39 Years (1,442 | 7.8%) for men and 60 to 64 Years (1,320 | 7.2%) for women.
| Age Bracket | Male | Female |
| Under 5 Years | 1,104 (6.0%) | 885 (4.8%) |
| 5 to 9 Years | 1,099 (6.0%) | 1,106 (6.0%) |
| 10 to 14 Years | 1,264 (6.9%) | 1,175 (6.4%) |
| 15 to 19 Years | 1,195 (6.5%) | 1,274 (7.0%) |
| 20 to 24 Years | 1,044 (5.7%) | 1,038 (5.7%) |
| 25 to 29 Years | 1,149 (6.2%) | 921 (5.0%) |
| 30 to 34 Years | 1,106 (6.0%) | 983 (5.4%) |
| 35 to 39 Years | 1,442 (7.8%) | 1,067 (5.8%) |
| 40 to 44 Years | 879 (4.8%) | 1,198 (6.6%) |
| 45 to 49 Years | 1,123 (6.1%) | 1,055 (5.8%) |
| 50 to 54 Years | 1,240 (6.7%) | 1,094 (6.0%) |
| 55 to 59 Years | 1,200 (6.5%) | 1,236 (6.8%) |
| 60 to 64 Years | 1,390 (7.5%) | 1,320 (7.2%) |
| 65 to 69 Years | 1,016 (5.5%) | 1,066 (5.8%) |
| 70 to 74 Years | 823 (4.5%) | 922 (5.0%) |
| 75 to 79 Years | 527 (2.9%) | 732 (4.0%) |
| 80 to 84 Years | 460 (2.5%) | 587 (3.2%) |
| 85 Years and over | 387 (2.1%) | 620 (3.4%) |
| Total | 18,448 (100.0%) | 18,279 (100.0%) |
Families and Households in McLeod County
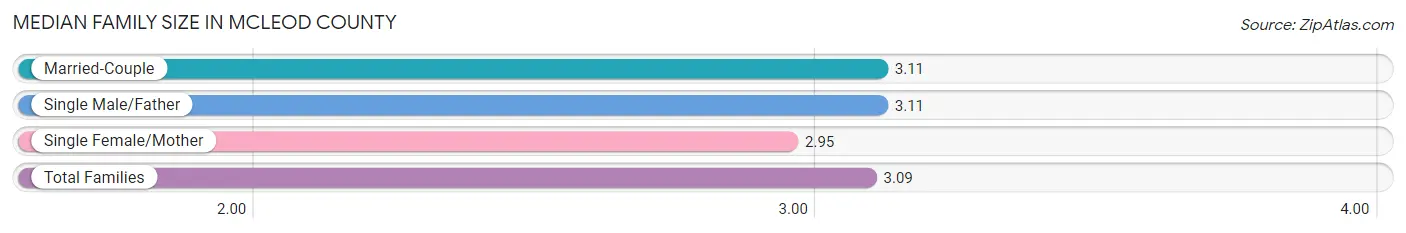
Median Family Size in McLeod County
The median family size in McLeod County is 3.09 persons per family, with married-couple families (7,761 | 82.5%) accounting for the largest median family size of 3.11 persons per family. On the other hand, single female/mother families (1,190 | 12.7%) represent the smallest median family size with 2.95 persons per family.
| Family Type | # Families | Family Size |
| Married-Couple | 7,761 (82.5%) | 3.11 |
| Single Male/Father | 457 (4.9%) | 3.11 |
| Single Female/Mother | 1,190 (12.7%) | 2.95 |
| Total Families | 9,408 (100.0%) | 3.09 |
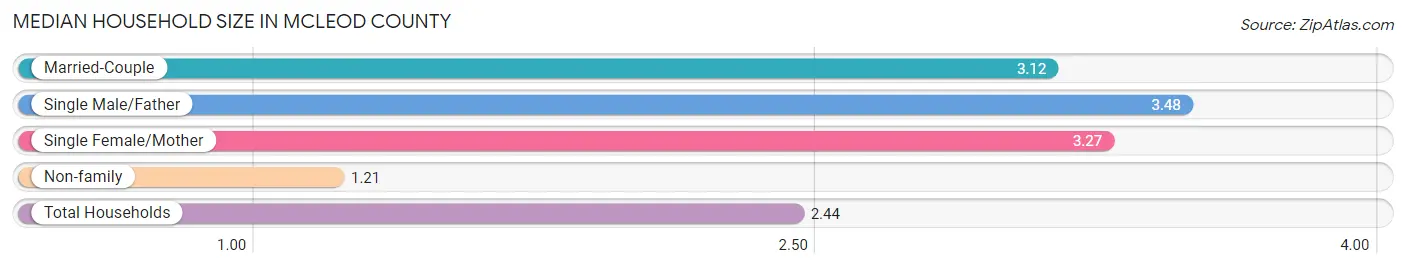
Median Household Size in McLeod County
The median household size in McLeod County is 2.44 persons per household, with single male/father households (457 | 3.1%) accounting for the largest median household size of 3.48 persons per household. non-family households (5,417 | 36.5%) represent the smallest median household size with 1.21 persons per household.
| Household Type | # Households | Household Size |
| Married-Couple | 7,761 (52.3%) | 3.12 |
| Single Male/Father | 457 (3.1%) | 3.48 |
| Single Female/Mother | 1,190 (8.0%) | 3.27 |
| Non-family | 5,417 (36.5%) | 1.21 |
| Total Households | 14,825 (100.0%) | 2.44 |
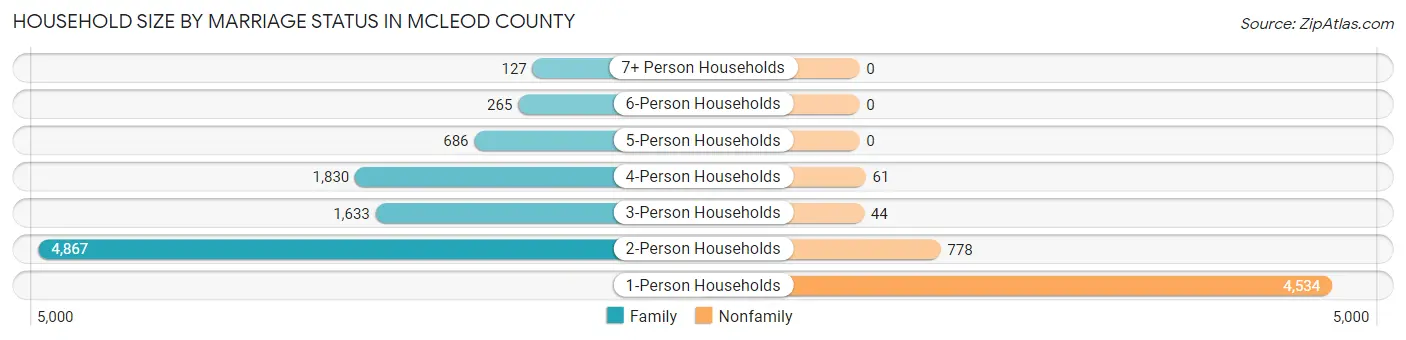
Household Size by Marriage Status in McLeod County
Out of a total of 14,825 households in McLeod County, 9,408 (63.5%) are family households, while 5,417 (36.5%) are nonfamily households. The most numerous type of family households are 2-person households, comprising 4,867, and the most common type of nonfamily households are 1-person households, comprising 4,534.
| Household Size | Family Households | Nonfamily Households |
| 1-Person Households | - | 4,534 (30.6%) |
| 2-Person Households | 4,867 (32.8%) | 778 (5.2%) |
| 3-Person Households | 1,633 (11.0%) | 44 (0.3%) |
| 4-Person Households | 1,830 (12.3%) | 61 (0.4%) |
| 5-Person Households | 686 (4.6%) | 0 (0.0%) |
| 6-Person Households | 265 (1.8%) | 0 (0.0%) |
| 7+ Person Households | 127 (0.9%) | 0 (0.0%) |
| Total | 9,408 (63.5%) | 5,417 (36.5%) |
Female Fertility in McLeod County
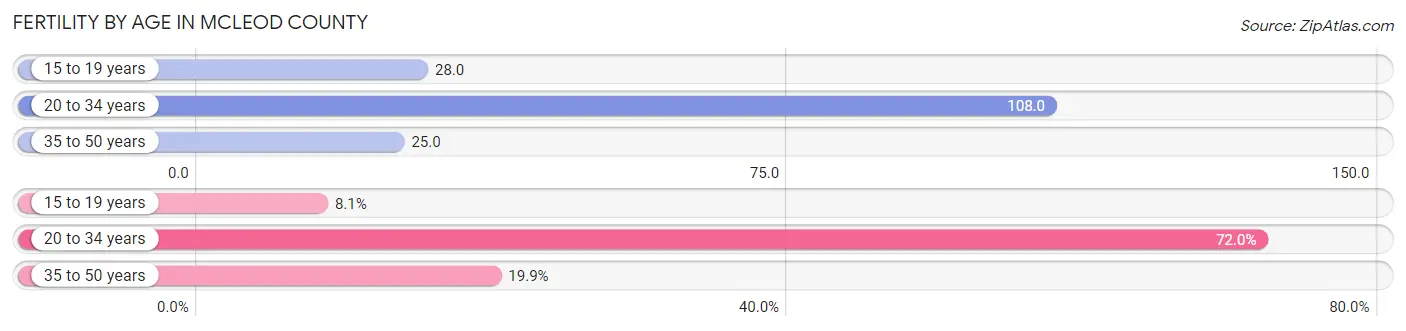
Fertility by Age in McLeod County
Average fertility rate in McLeod County is 57.0 births per 1,000 women. Women in the age bracket of 20 to 34 years have the highest fertility rate with 108.0 births per 1,000 women. Women in the age bracket of 20 to 34 years acount for 72.0% of all women with births.
| Age Bracket | Women with Births | Births / 1,000 Women |
| 15 to 19 years | 36 (8.1%) | 28.0 |
| 20 to 34 years | 318 (72.0%) | 108.0 |
| 35 to 50 years | 88 (19.9%) | 25.0 |
| Total | 442 (100.0%) | 57.0 |
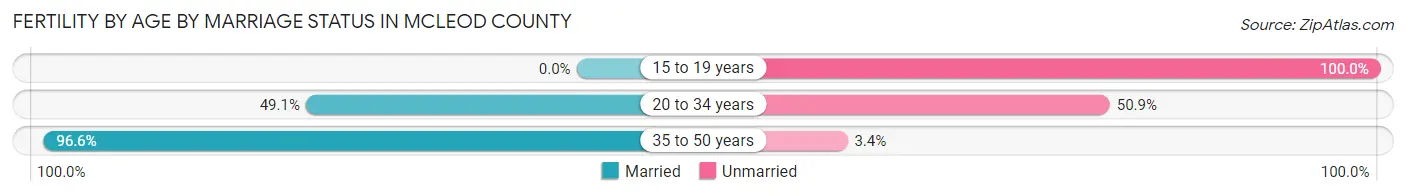
Fertility by Age by Marriage Status in McLeod County
54.5% of women with births (442) in McLeod County are married. The highest percentage of unmarried women with births falls into 15 to 19 years age bracket with 100.0% of them unmarried at the time of birth, while the lowest percentage of unmarried women with births belong to 35 to 50 years age bracket with 3.4% of them unmarried.
| Age Bracket | Married | Unmarried |
| 15 to 19 years | 0 (0.0%) | 36 (100.0%) |
| 20 to 34 years | 156 (49.1%) | 162 (50.9%) |
| 35 to 50 years | 85 (96.6%) | 3 (3.4%) |
| Total | 241 (54.5%) | 201 (45.5%) |
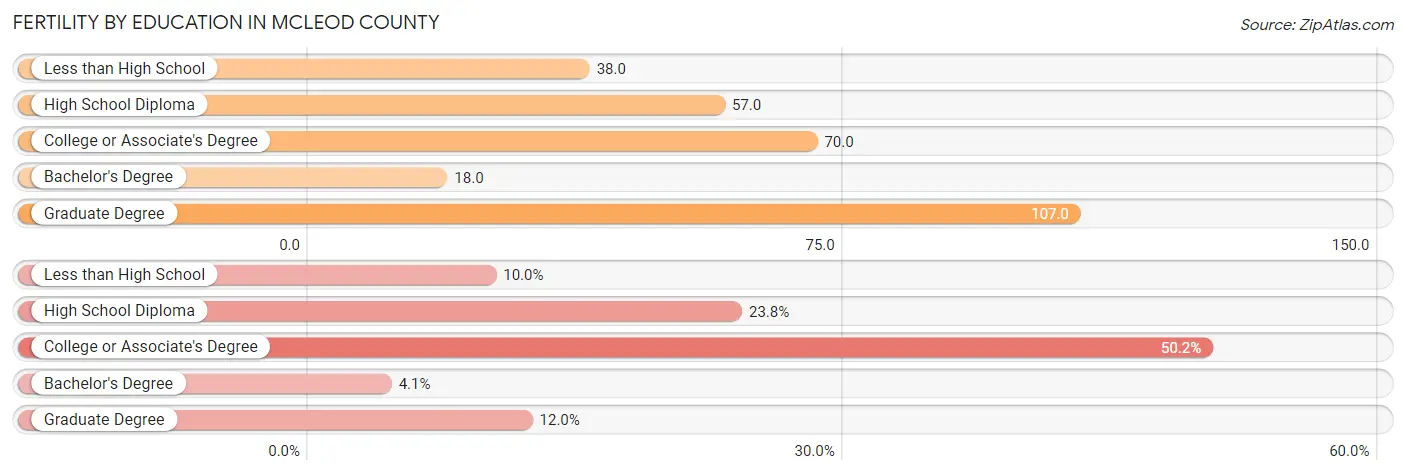
Fertility by Education in McLeod County
Average fertility rate in McLeod County is 57.0 births per 1,000 women. Women with the education attainment of graduate degree have the highest fertility rate of 107.0 births per 1,000 women, while women with the education attainment of bachelor's degree have the lowest fertility at 18.0 births per 1,000 women. Women with the education attainment of college or associate's degree represent 50.2% of all women with births.
| Educational Attainment | Women with Births | Births / 1,000 Women |
| Less than High School | 44 (10.0%) | 38.0 |
| High School Diploma | 105 (23.8%) | 57.0 |
| College or Associate's Degree | 222 (50.2%) | 70.0 |
| Bachelor's Degree | 18 (4.1%) | 18.0 |
| Graduate Degree | 53 (12.0%) | 107.0 |
| Total | 442 (100.0%) | 57.0 |
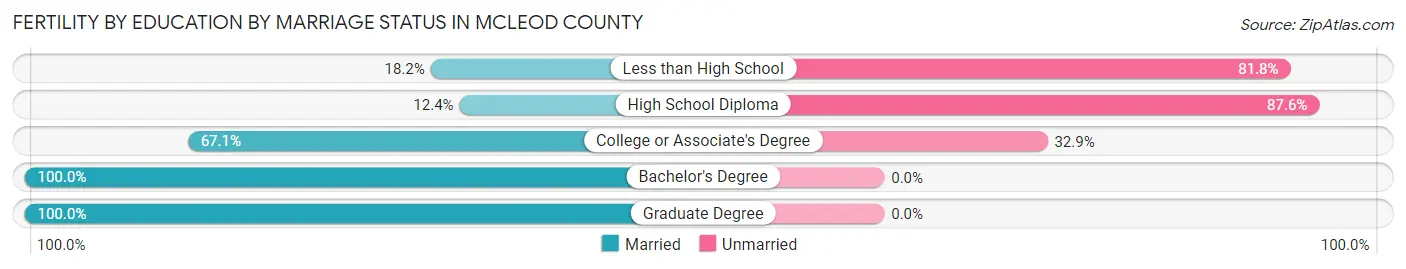
Fertility by Education by Marriage Status in McLeod County
45.5% of women with births in McLeod County are unmarried. Women with the educational attainment of bachelor's degree are most likely to be married with 100.0% of them married at childbirth, while women with the educational attainment of high school diploma are least likely to be married with 87.6% of them unmarried at childbirth.
| Educational Attainment | Married | Unmarried |
| Less than High School | 8 (18.2%) | 36 (81.8%) |
| High School Diploma | 13 (12.4%) | 92 (87.6%) |
| College or Associate's Degree | 149 (67.1%) | 73 (32.9%) |
| Bachelor's Degree | 18 (100.0%) | 0 (0.0%) |
| Graduate Degree | 53 (100.0%) | 0 (0.0%) |
| Total | 241 (54.5%) | 201 (45.5%) |
Income in McLeod County
Income Overview in McLeod County
Per Capita Income in McLeod County is $39,361, while median incomes of families and households are $96,492 and $73,296 respectively.
| Characteristic | Number | Measure |
| Per Capita Income | 36,727 | $39,361 |
| Median Family Income | 9,408 | $96,492 |
| Mean Family Income | 9,408 | $115,503 |
| Median Household Income | 14,825 | $73,296 |
| Mean Household Income | 14,825 | $93,548 |
| Income Deficit | 9,408 | $0 |
| Wage / Income Gap (%) | 36,727 | 28.81% |
| Wage / Income Gap ($) | 36,727 | 71.19¢ per $1 |
| Gini / Inequality Index | 36,727 | 0.42 |
Earnings by Sex in McLeod County
Average Earnings in McLeod County are $44,020, $52,292 for men and $37,229 for women, a difference of 28.8%.
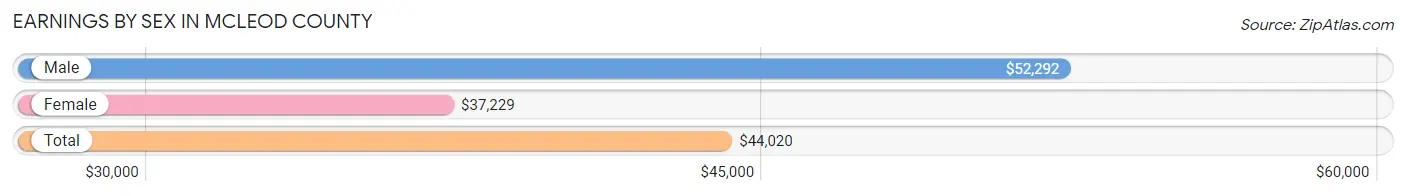
| Sex | Number | Average Earnings |
| Male | 10,963 (53.4%) | $52,292 |
| Female | 9,578 (46.6%) | $37,229 |
| Total | 20,541 (100.0%) | $44,020 |
Earnings by Sex by Income Bracket in McLeod County
The most common earnings brackets in McLeod County are $75,000 to $99,999 for men (1,492 | 13.6%) and $55,000 to $64,999 for women (856 | 8.9%).
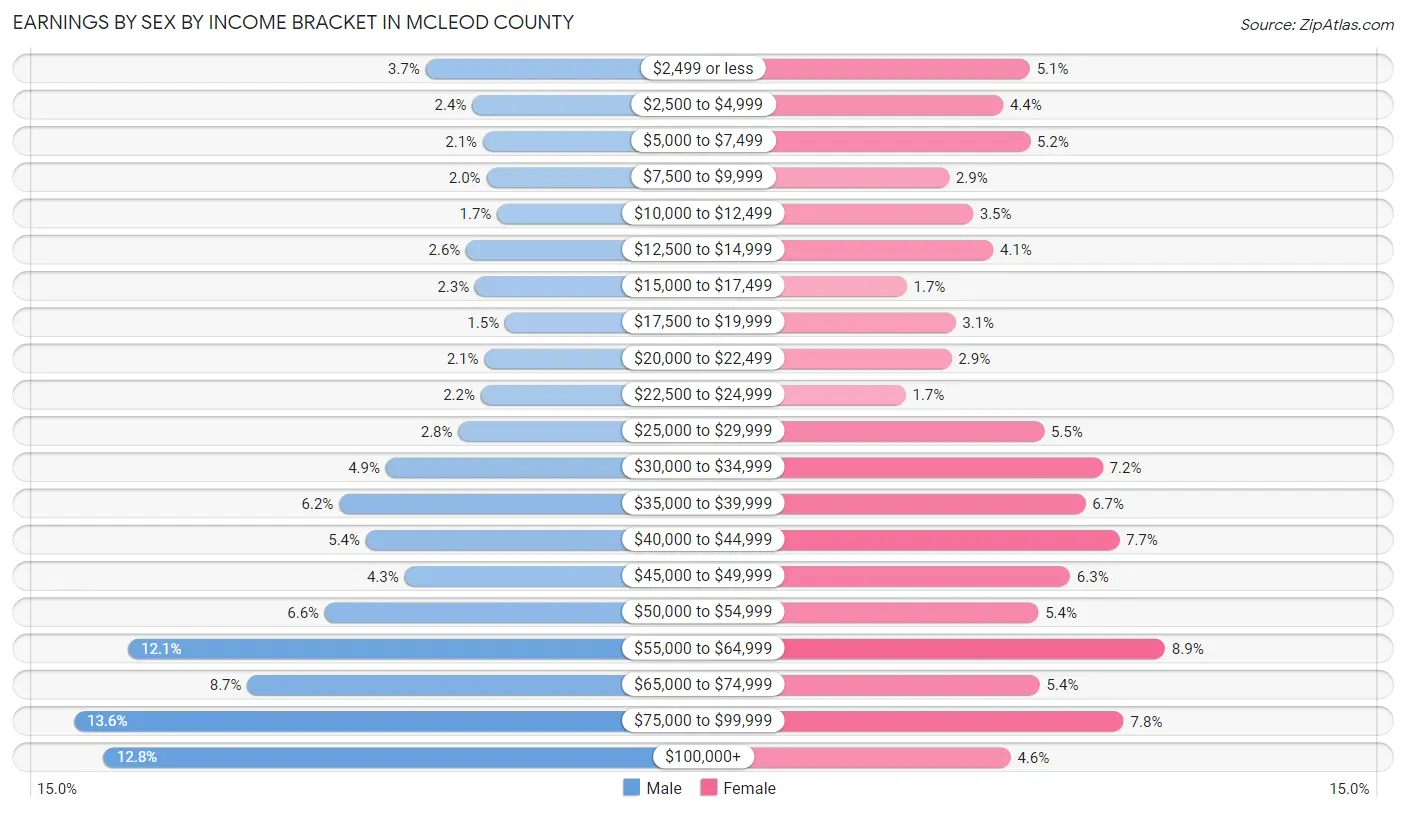
| Income | Male | Female |
| $2,499 or less | 409 (3.7%) | 492 (5.1%) |
| $2,500 to $4,999 | 265 (2.4%) | 420 (4.4%) |
| $5,000 to $7,499 | 232 (2.1%) | 493 (5.1%) |
| $7,500 to $9,999 | 221 (2.0%) | 275 (2.9%) |
| $10,000 to $12,499 | 189 (1.7%) | 339 (3.5%) |
| $12,500 to $14,999 | 284 (2.6%) | 394 (4.1%) |
| $15,000 to $17,499 | 256 (2.3%) | 161 (1.7%) |
| $17,500 to $19,999 | 164 (1.5%) | 292 (3.0%) |
| $20,000 to $22,499 | 228 (2.1%) | 282 (2.9%) |
| $22,500 to $24,999 | 239 (2.2%) | 158 (1.7%) |
| $25,000 to $29,999 | 308 (2.8%) | 531 (5.5%) |
| $30,000 to $34,999 | 532 (4.9%) | 689 (7.2%) |
| $35,000 to $39,999 | 675 (6.2%) | 642 (6.7%) |
| $40,000 to $44,999 | 593 (5.4%) | 733 (7.6%) |
| $45,000 to $49,999 | 474 (4.3%) | 601 (6.3%) |
| $50,000 to $54,999 | 719 (6.6%) | 515 (5.4%) |
| $55,000 to $64,999 | 1,325 (12.1%) | 856 (8.9%) |
| $65,000 to $74,999 | 958 (8.7%) | 519 (5.4%) |
| $75,000 to $99,999 | 1,492 (13.6%) | 745 (7.8%) |
| $100,000+ | 1,400 (12.8%) | 441 (4.6%) |
| Total | 10,963 (100.0%) | 9,578 (100.0%) |
Earnings by Sex by Educational Attainment in McLeod County
Average earnings in McLeod County are $57,581 for men and $41,720 for women, a difference of 27.6%. Men with an educational attainment of graduate degree enjoy the highest average annual earnings of $82,417, while those with less than high school education earn the least with $38,702. Women with an educational attainment of graduate degree earn the most with the average annual earnings of $69,318, while those with high school diploma education have the smallest earnings of $35,029.
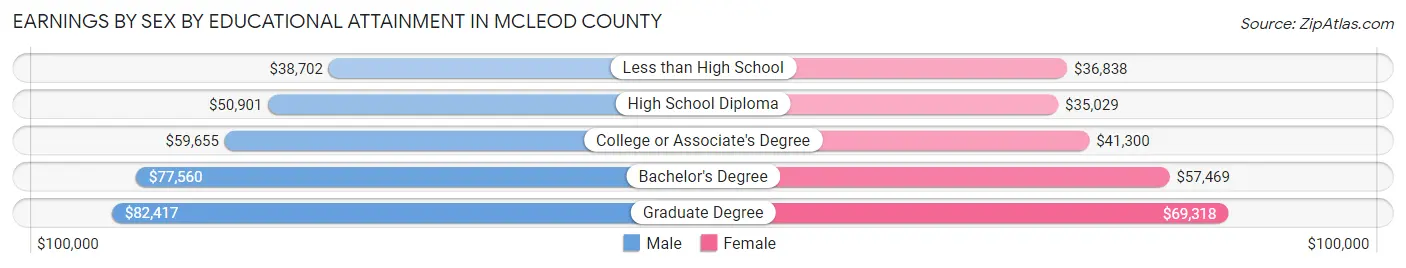
| Educational Attainment | Male Income | Female Income |
| Less than High School | $38,702 | $36,838 |
| High School Diploma | $50,901 | $35,029 |
| College or Associate's Degree | $59,655 | $41,300 |
| Bachelor's Degree | $77,560 | $57,469 |
| Graduate Degree | $82,417 | $69,318 |
| Total | $57,581 | $41,720 |
Family Income in McLeod County
Family Income Brackets in McLeod County
According to the McLeod County family income data, there are 2,540 families falling into the $100,000 to $149,999 income range, which is the most common income bracket and makes up 27.0% of all families. Conversely, the $10,000 to $14,999 income bracket is the least frequent group with only 141 families (1.5%) belonging to this category.
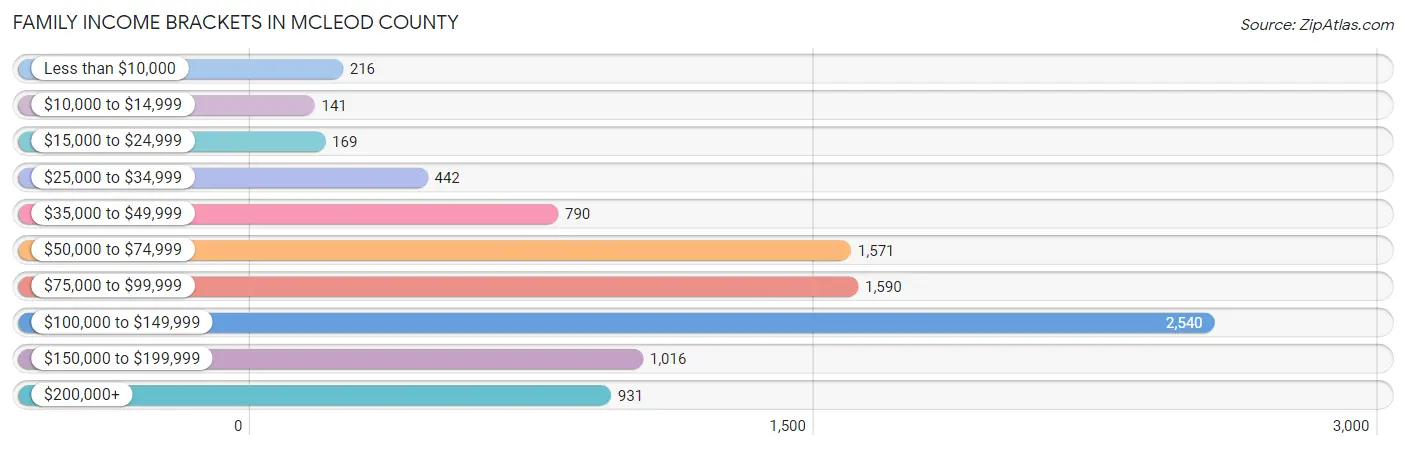
| Income Bracket | # Families | % Families |
| Less than $10,000 | 216 | 2.3% |
| $10,000 to $14,999 | 141 | 1.5% |
| $15,000 to $24,999 | 169 | 1.8% |
| $25,000 to $34,999 | 442 | 4.7% |
| $35,000 to $49,999 | 790 | 8.4% |
| $50,000 to $74,999 | 1,571 | 16.7% |
| $75,000 to $99,999 | 1,590 | 16.9% |
| $100,000 to $149,999 | 2,540 | 27.0% |
| $150,000 to $199,999 | 1,016 | 10.8% |
| $200,000+ | 931 | 9.9% |
Family Income by Famaliy Size in McLeod County
5-person families (624 | 6.6%) account for the highest median family income in McLeod County with $121,667 per family, while 2-person families (5,128 | 54.5%) have the highest median income of $41,924 per family member.
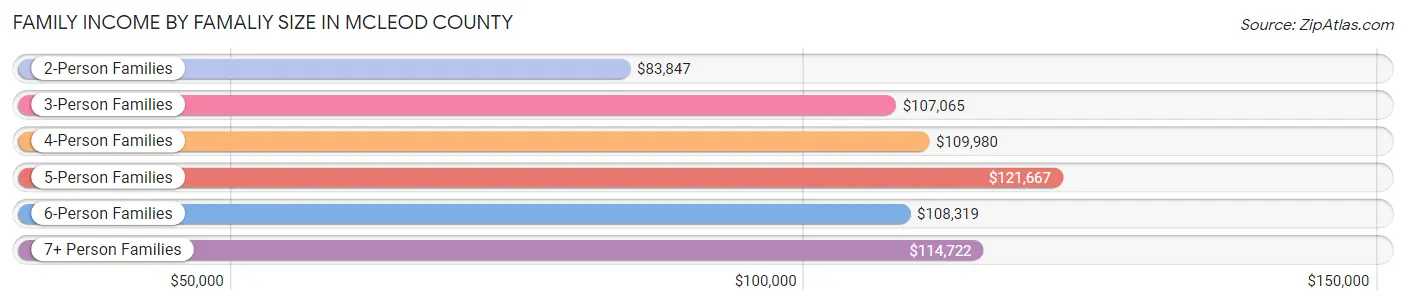
| Income Bracket | # Families | Median Income |
| 2-Person Families | 5,128 (54.5%) | $83,847 |
| 3-Person Families | 1,528 (16.2%) | $107,065 |
| 4-Person Families | 1,765 (18.8%) | $109,980 |
| 5-Person Families | 624 (6.6%) | $121,667 |
| 6-Person Families | 249 (2.6%) | $108,319 |
| 7+ Person Families | 114 (1.2%) | $114,722 |
| Total | 9,408 (100.0%) | $96,492 |
Family Income by Number of Earners in McLeod County
The median family income in McLeod County is $96,492, with families comprising 3+ earners (1,255) having the highest median family income of $150,104, while families with no earners (1,476) have the lowest median family income of $61,716, accounting for 13.3% and 15.7% of families, respectively.
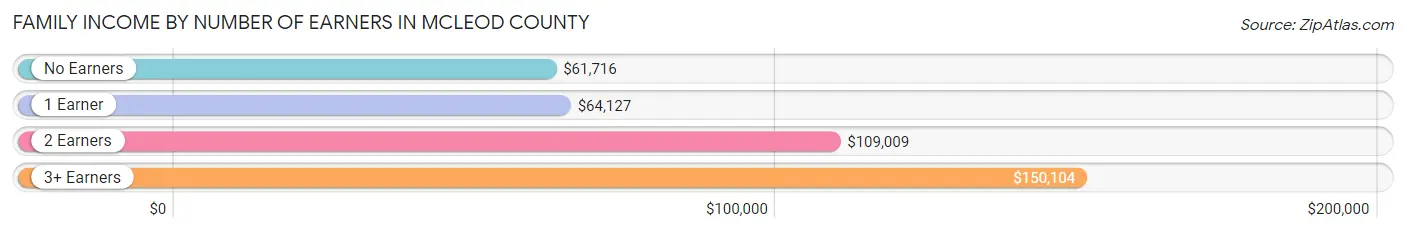
| Number of Earners | # Families | Median Income |
| No Earners | 1,476 (15.7%) | $61,716 |
| 1 Earner | 2,368 (25.2%) | $64,127 |
| 2 Earners | 4,309 (45.8%) | $109,009 |
| 3+ Earners | 1,255 (13.3%) | $150,104 |
| Total | 9,408 (100.0%) | $96,492 |
Household Income in McLeod County
Household Income Brackets in McLeod County
With 2,935 households falling in the category, the $50,000 to $74,999 income range is the most frequent in McLeod County, accounting for 19.8% of all households. In contrast, only 460 households (3.1%) fall into the $10,000 to $14,999 income bracket, making it the least populous group.
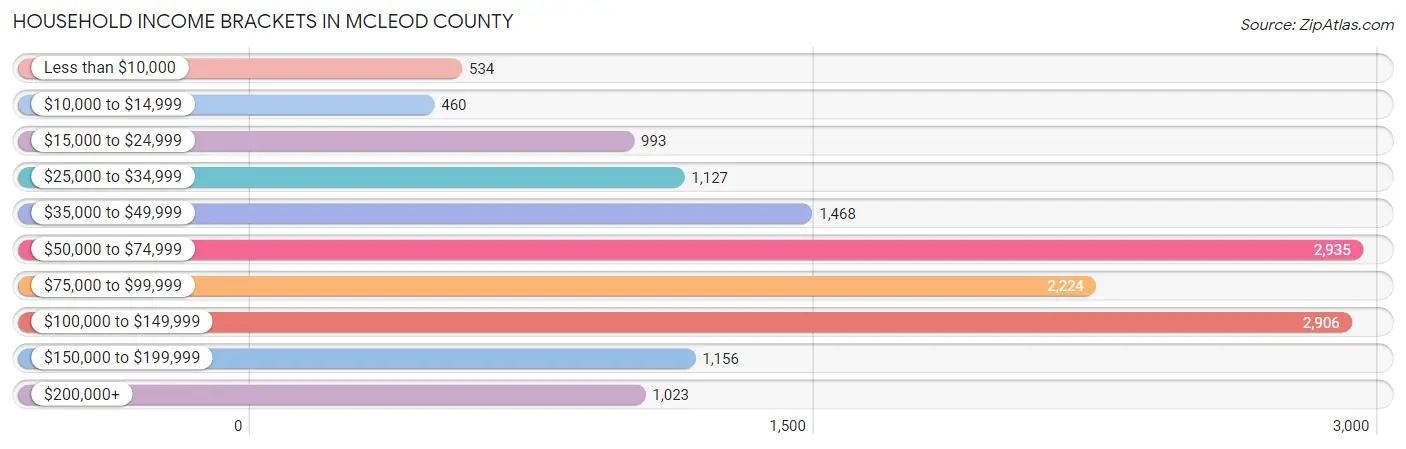
| Income Bracket | # Households | % Households |
| Less than $10,000 | 534 | 3.6% |
| $10,000 to $14,999 | 460 | 3.1% |
| $15,000 to $24,999 | 993 | 6.7% |
| $25,000 to $34,999 | 1,127 | 7.6% |
| $35,000 to $49,999 | 1,468 | 9.9% |
| $50,000 to $74,999 | 2,935 | 19.8% |
| $75,000 to $99,999 | 2,224 | 15.0% |
| $100,000 to $149,999 | 2,906 | 19.6% |
| $150,000 to $199,999 | 1,156 | 7.8% |
| $200,000+ | 1,023 | 6.9% |
Household Income by Householder Age in McLeod County
The median household income in McLeod County is $73,296, with the highest median household income of $93,750 found in the 45 to 64 years age bracket for the primary householder. A total of 5,634 households (38.0%) fall into this category. Meanwhile, the 15 to 24 years age bracket for the primary householder has the lowest median household income of $44,974, with 633 households (4.3%) in this group.
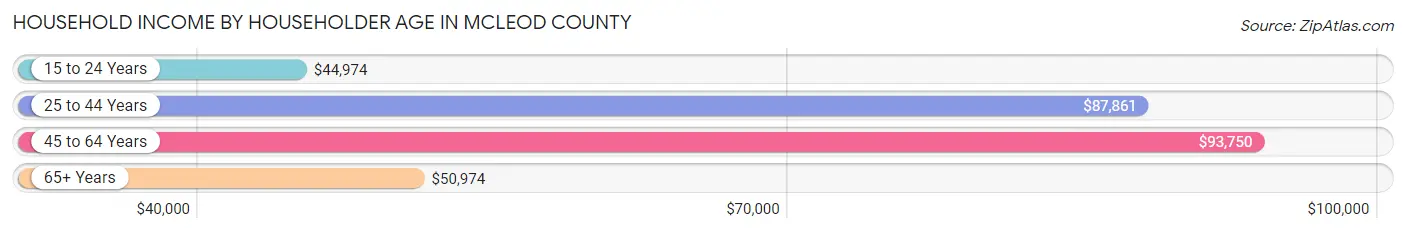
| Income Bracket | # Households | Median Income |
| 15 to 24 Years | 633 (4.3%) | $44,974 |
| 25 to 44 Years | 4,129 (27.9%) | $87,861 |
| 45 to 64 Years | 5,634 (38.0%) | $93,750 |
| 65+ Years | 4,429 (29.9%) | $50,974 |
| Total | 14,825 (100.0%) | $73,296 |
Poverty in McLeod County
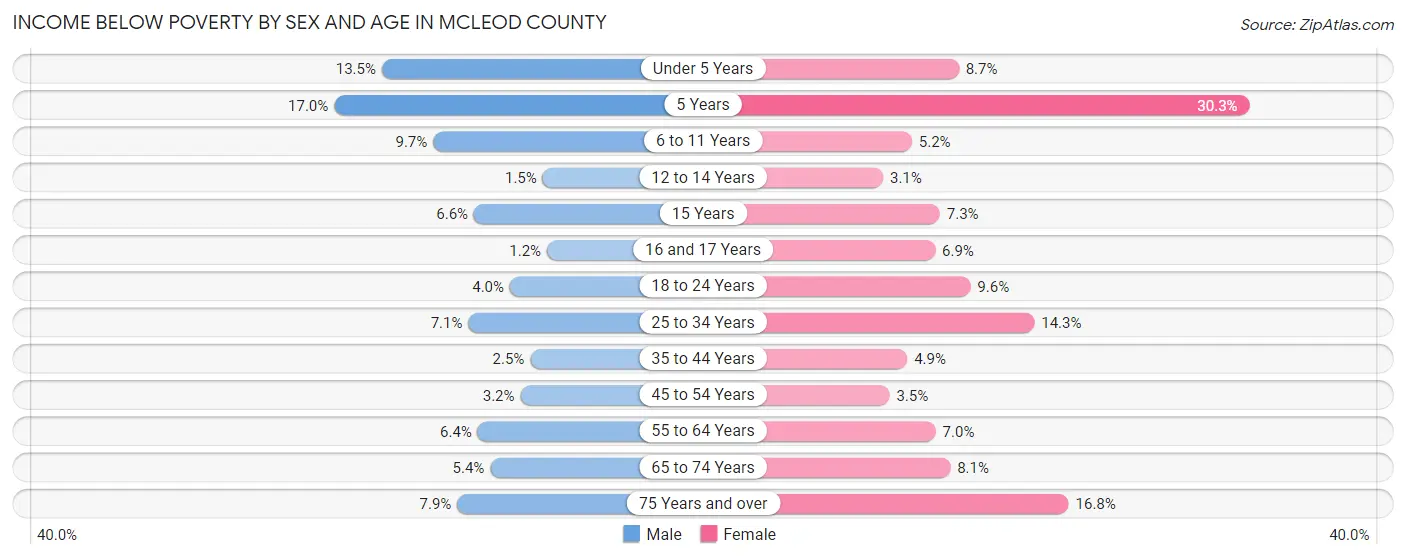
Income Below Poverty by Sex and Age in McLeod County
With 5.8% poverty level for males and 8.5% for females among the residents of McLeod County, 5 year old males and 5 year old females are the most vulnerable to poverty, with 32 males (17.0%) and 69 females (30.3%) in their respective age groups living below the poverty level.
| Age Bracket | Male | Female |
| Under 5 Years | 148 (13.5%) | 75 (8.7%) |
| 5 Years | 32 (17.0%) | 69 (30.3%) |
| 6 to 11 Years | 133 (9.7%) | 69 (5.2%) |
| 12 to 14 Years | 12 (1.5%) | 22 (3.1%) |
| 15 Years | 15 (6.6%) | 22 (7.3%) |
| 16 and 17 Years | 7 (1.2%) | 32 (6.9%) |
| 18 to 24 Years | 57 (4.0%) | 147 (9.6%) |
| 25 to 34 Years | 159 (7.1%) | 272 (14.3%) |
| 35 to 44 Years | 57 (2.5%) | 110 (4.9%) |
| 45 to 54 Years | 75 (3.2%) | 76 (3.5%) |
| 55 to 64 Years | 164 (6.4%) | 178 (7.0%) |
| 65 to 74 Years | 98 (5.4%) | 160 (8.1%) |
| 75 Years and over | 101 (7.9%) | 297 (16.8%) |
| Total | 1,058 (5.8%) | 1,529 (8.5%) |
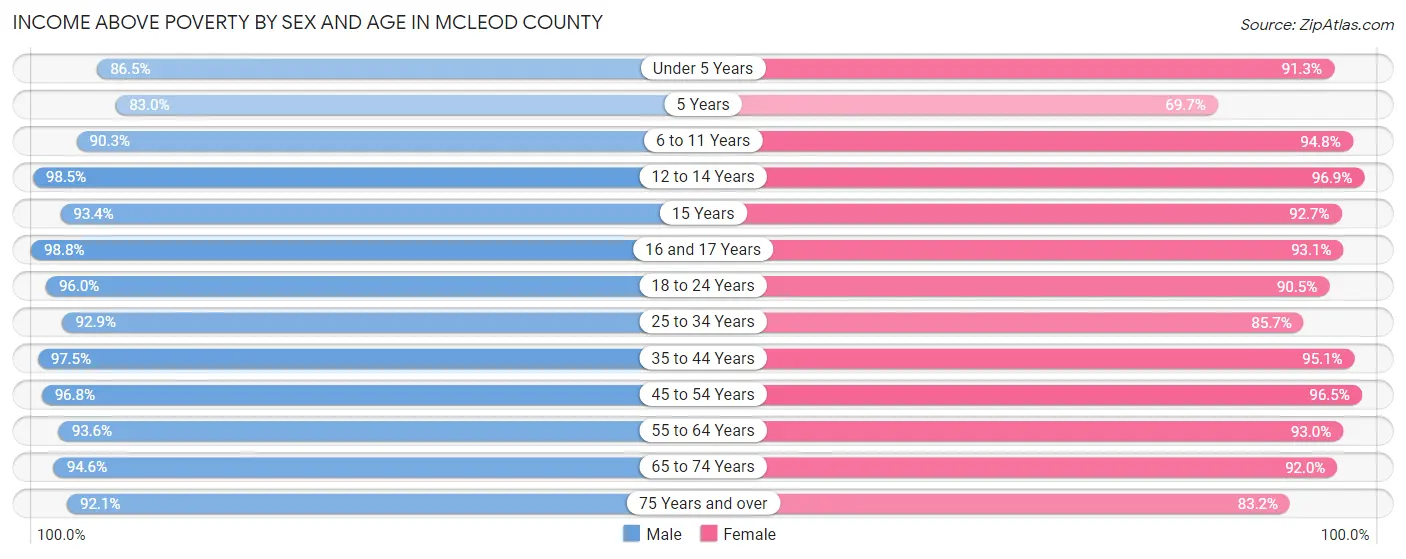
Income Above Poverty by Sex and Age in McLeod County
According to the poverty statistics in McLeod County, males aged 16 and 17 years and females aged 12 to 14 years are the age groups that are most secure financially, with 98.8% of males and 96.9% of females in these age groups living above the poverty line.
| Age Bracket | Male | Female |
| Under 5 Years | 950 (86.5%) | 789 (91.3%) |
| 5 Years | 156 (83.0%) | 159 (69.7%) |
| 6 to 11 Years | 1,243 (90.3%) | 1,258 (94.8%) |
| 12 to 14 Years | 767 (98.5%) | 696 (96.9%) |
| 15 Years | 211 (93.4%) | 280 (92.7%) |
| 16 and 17 Years | 568 (98.8%) | 430 (93.1%) |
| 18 to 24 Years | 1,379 (96.0%) | 1,393 (90.4%) |
| 25 to 34 Years | 2,092 (92.9%) | 1,632 (85.7%) |
| 35 to 44 Years | 2,263 (97.5%) | 2,155 (95.1%) |
| 45 to 54 Years | 2,279 (96.8%) | 2,068 (96.5%) |
| 55 to 64 Years | 2,416 (93.6%) | 2,374 (93.0%) |
| 65 to 74 Years | 1,706 (94.6%) | 1,828 (91.9%) |
| 75 Years and over | 1,180 (92.1%) | 1,467 (83.2%) |
| Total | 17,210 (94.2%) | 16,529 (91.5%) |
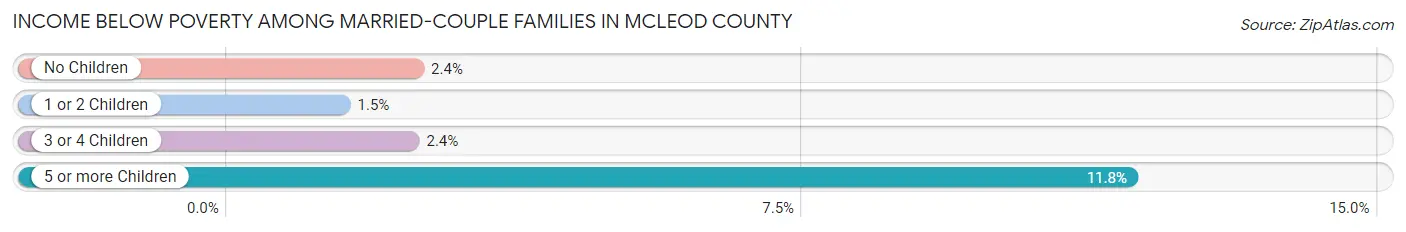
Income Below Poverty Among Married-Couple Families in McLeod County
The poverty statistics for married-couple families in McLeod County show that 2.3% or 178 of the total 7,761 families live below the poverty line. Families with 5 or more children have the highest poverty rate of 11.8%, comprising of 12 families. On the other hand, families with 1 or 2 children have the lowest poverty rate of 1.5%, which includes 30 families.
| Children | Above Poverty | Below Poverty |
| No Children | 4,866 (97.6%) | 121 (2.4%) |
| 1 or 2 Children | 2,010 (98.5%) | 30 (1.5%) |
| 3 or 4 Children | 617 (97.6%) | 15 (2.4%) |
| 5 or more Children | 90 (88.2%) | 12 (11.8%) |
| Total | 7,583 (97.7%) | 178 (2.3%) |
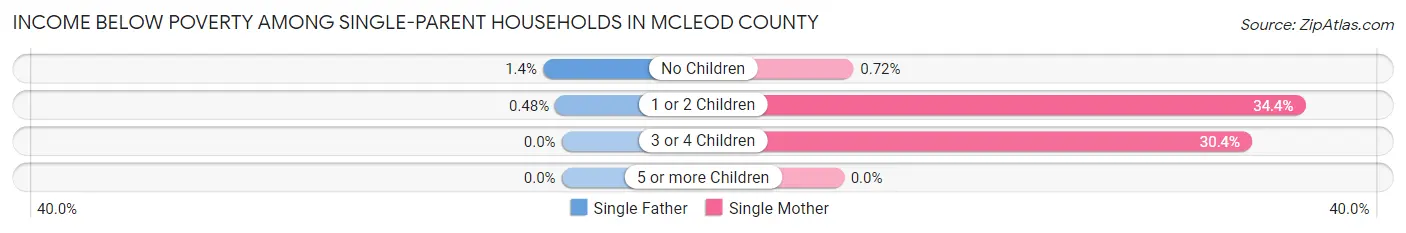
Income Below Poverty Among Single-Parent Households in McLeod County
According to the poverty data in McLeod County, 0.9% or 4 single-father households and 22.0% or 262 single-mother households are living below the poverty line. Among single-father households, those with no children have the highest poverty rate, with 3 households (1.4%) experiencing poverty. Likewise, among single-mother households, those with 1 or 2 children have the highest poverty rate, with 207 households (34.4%) falling below the poverty line.
| Children | Single Father | Single Mother |
| No Children | 3 (1.4%) | 3 (0.7%) |
| 1 or 2 Children | 1 (0.5%) | 207 (34.4%) |
| 3 or 4 Children | 0 (0.0%) | 52 (30.4%) |
| 5 or more Children | 0 (0.0%) | 0 (0.0%) |
| Total | 4 (0.9%) | 262 (22.0%) |
Income Below Poverty Among Married-Couple vs Single-Parent Households in McLeod County
The poverty data for McLeod County shows that 178 of the married-couple family households (2.3%) and 266 of the single-parent households (16.2%) are living below the poverty level. Within the married-couple family households, those with 5 or more children have the highest poverty rate, with 12 households (11.8%) falling below the poverty line. Among the single-parent households, those with 1 or 2 children have the highest poverty rate, with 208 household (25.7%) living below poverty.
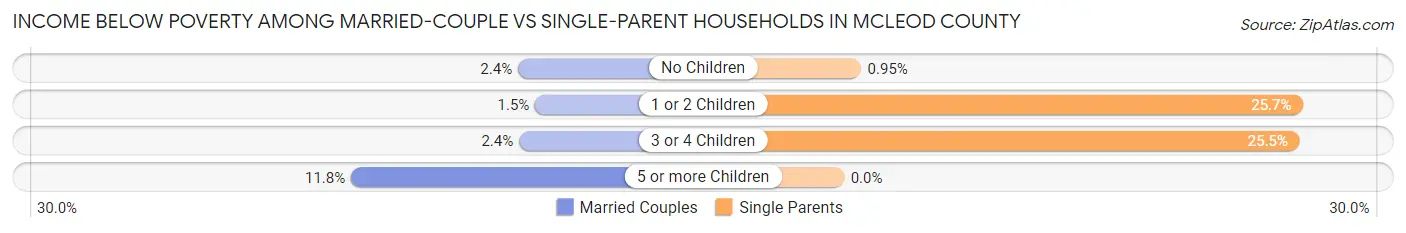
| Children | Married-Couple Families | Single-Parent Households |
| No Children | 121 (2.4%) | 6 (0.9%) |
| 1 or 2 Children | 30 (1.5%) | 208 (25.7%) |
| 3 or 4 Children | 15 (2.4%) | 52 (25.5%) |
| 5 or more Children | 12 (11.8%) | 0 (0.0%) |
| Total | 178 (2.3%) | 266 (16.2%) |
Employment Characteristics in McLeod County
Employment by Class of Employer in McLeod County
Among the 18,781 employed individuals in McLeod County, private company employees (13,752 | 73.2%), not-for-profit organizations (1,474 | 7.9%), and local government employees (1,278 | 6.8%) make up the most common classes of employment.
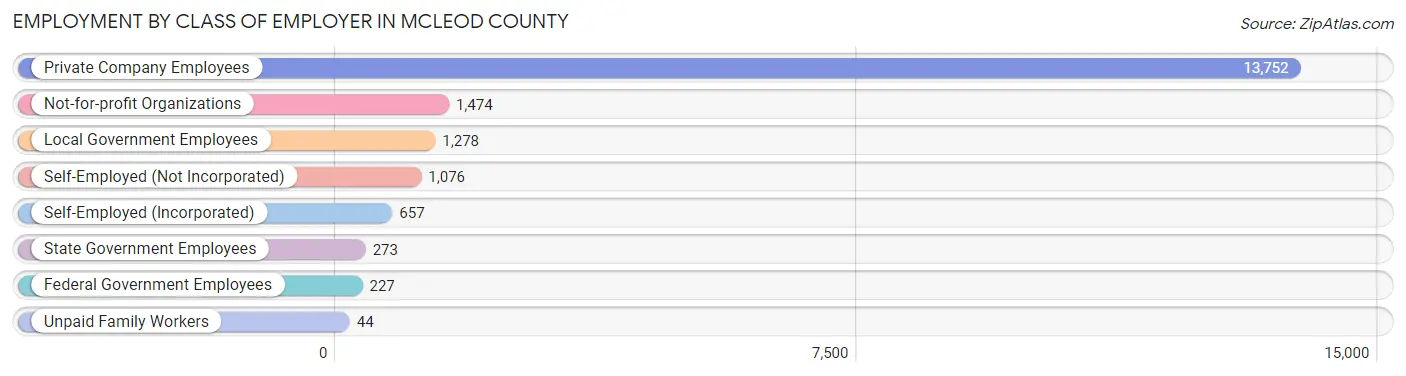
| Employer Class | # Employees | % Employees |
| Private Company Employees | 13,752 | 73.2% |
| Self-Employed (Incorporated) | 657 | 3.5% |
| Self-Employed (Not Incorporated) | 1,076 | 5.7% |
| Not-for-profit Organizations | 1,474 | 7.9% |
| Local Government Employees | 1,278 | 6.8% |
| State Government Employees | 273 | 1.5% |
| Federal Government Employees | 227 | 1.2% |
| Unpaid Family Workers | 44 | 0.2% |
| Total | 18,781 | 100.0% |
Employment Status by Age in McLeod County
According to the labor force statistics for McLeod County, out of the total population over 16 years of age (29,566), 66.9% or 19,780 individuals are in the labor force, with 3.2% or 633 of them unemployed. The age group with the highest labor force participation rate is 35 to 44 years, with 93.3% or 4,279 individuals in the labor force. Within the labor force, the 65 to 74 years age range has the highest percentage of unemployed individuals, with 11.3% or 124 of them being unemployed.
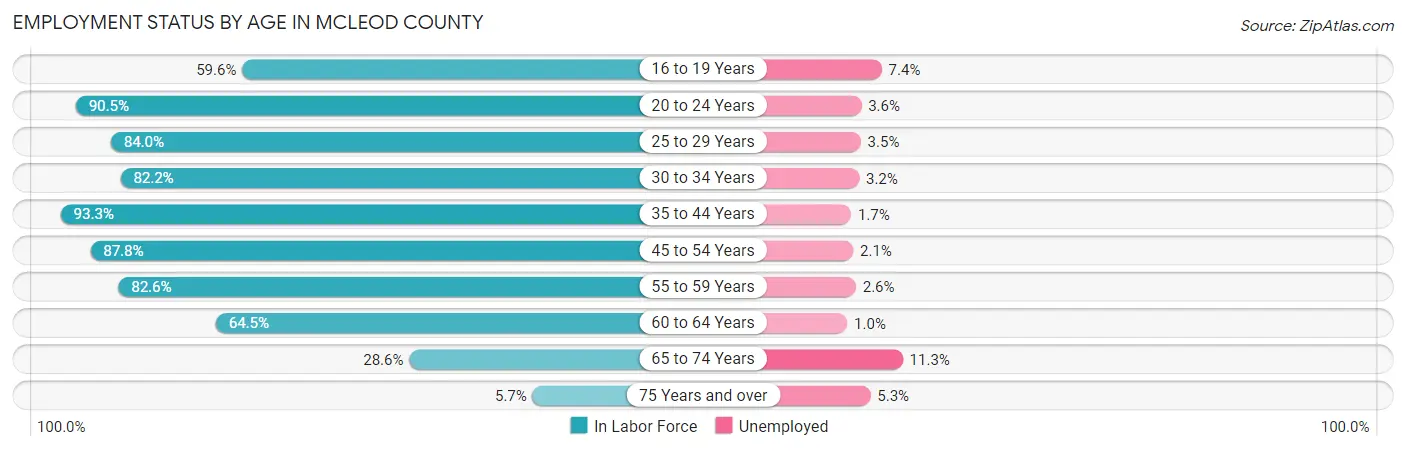
| Age Bracket | In Labor Force | Unemployed |
| 16 to 19 Years | 1,157 (59.6%) | 86 (7.4%) |
| 20 to 24 Years | 1,884 (90.5%) | 68 (3.6%) |
| 25 to 29 Years | 1,739 (84.0%) | 61 (3.5%) |
| 30 to 34 Years | 1,717 (82.2%) | 55 (3.2%) |
| 35 to 44 Years | 4,279 (93.3%) | 73 (1.7%) |
| 45 to 54 Years | 3,962 (87.8%) | 83 (2.1%) |
| 55 to 59 Years | 2,012 (82.6%) | 52 (2.6%) |
| 60 to 64 Years | 1,748 (64.5%) | 17 (1.0%) |
| 65 to 74 Years | 1,095 (28.6%) | 124 (11.3%) |
| 75 Years and over | 189 (5.7%) | 10 (5.3%) |
| Total | 19,780 (66.9%) | 633 (3.2%) |
Employment Status by Educational Attainment in McLeod County
According to labor force statistics for McLeod County, 84.0% of individuals (15,459) out of the total population between 25 and 64 years of age (18,403) are in the labor force, with 2.2% or 340 of them being unemployed. The group with the highest labor force participation rate are those with the educational attainment of bachelor's degree or higher, with 87.7% or 3,254 individuals in the labor force. Within the labor force, individuals with less than high school education have the highest percentage of unemployment, with 4.9% or 38 of them being unemployed.
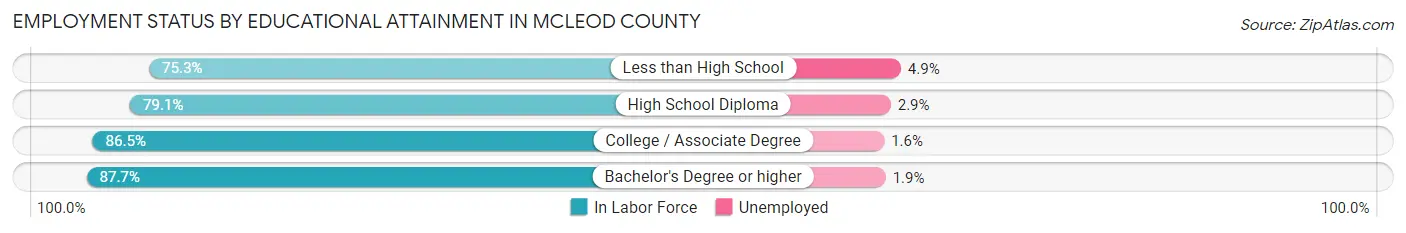
| Educational Attainment | In Labor Force | Unemployed |
| Less than High School | 775 (75.3%) | 50 (4.9%) |
| High School Diploma | 4,184 (79.1%) | 153 (2.9%) |
| College / Associate Degree | 7,244 (86.5%) | 134 (1.6%) |
| Bachelor's Degree or higher | 3,254 (87.7%) | 70 (1.9%) |
| Total | 15,459 (84.0%) | 405 (2.2%) |
Employment Occupations by Sex in McLeod County
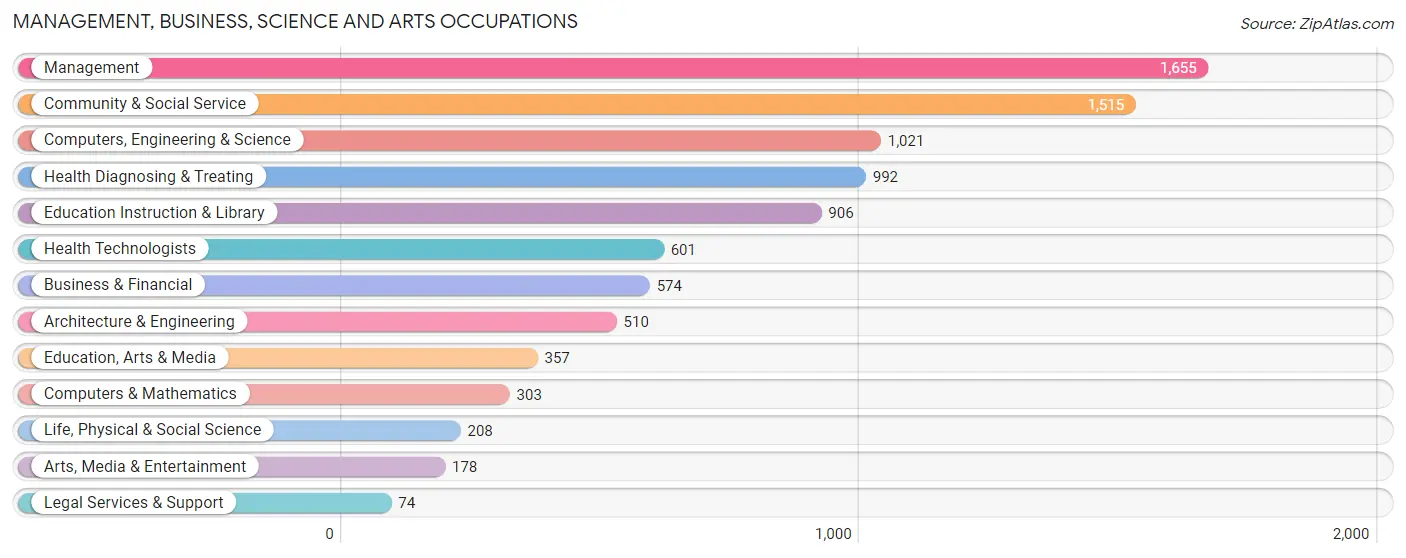
Management, Business, Science and Arts Occupations
The most common Management, Business, Science and Arts occupations in McLeod County are Management (1,655 | 8.6%), Community & Social Service (1,515 | 7.9%), Computers, Engineering & Science (1,021 | 5.3%), Health Diagnosing & Treating (992 | 5.2%), and Education Instruction & Library (906 | 4.7%).
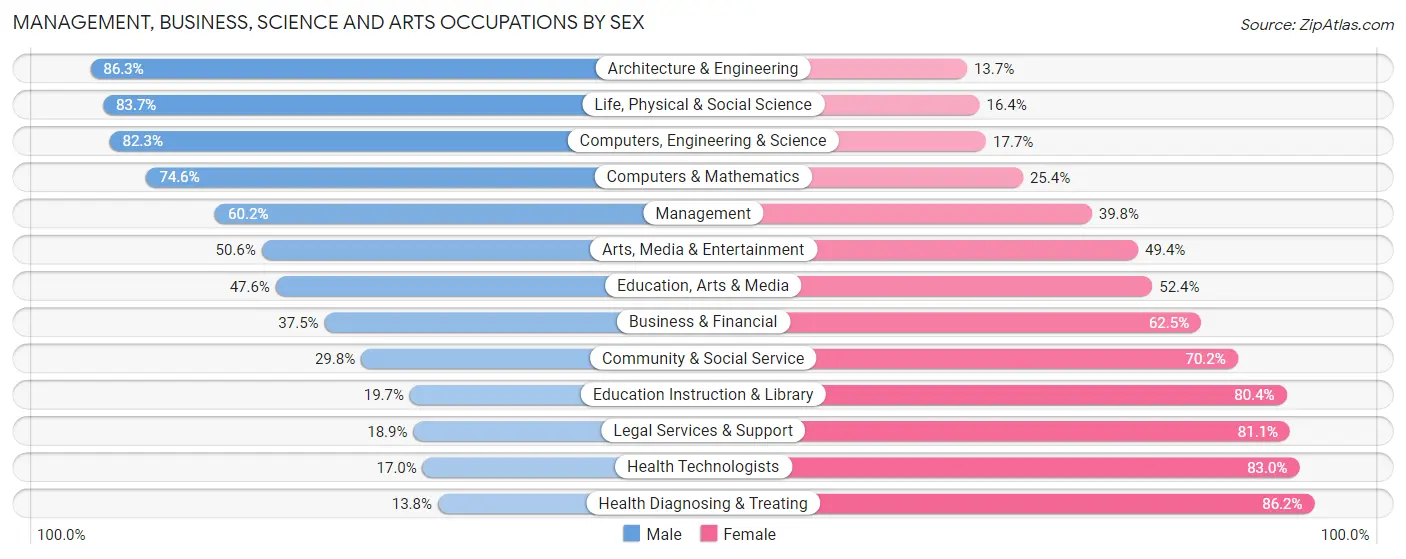
Management, Business, Science and Arts Occupations by Sex
Within the Management, Business, Science and Arts occupations in McLeod County, the most male-oriented occupations are Architecture & Engineering (86.3%), Life, Physical & Social Science (83.7%), and Computers, Engineering & Science (82.3%), while the most female-oriented occupations are Health Diagnosing & Treating (86.2%), Health Technologists (83.0%), and Legal Services & Support (81.1%).
| Occupation | Male | Female |
| Management | 997 (60.2%) | 658 (39.8%) |
| Business & Financial | 215 (37.5%) | 359 (62.5%) |
| Computers, Engineering & Science | 840 (82.3%) | 181 (17.7%) |
| Computers & Mathematics | 226 (74.6%) | 77 (25.4%) |
| Architecture & Engineering | 440 (86.3%) | 70 (13.7%) |
| Life, Physical & Social Science | 174 (83.7%) | 34 (16.4%) |
| Community & Social Service | 452 (29.8%) | 1,063 (70.2%) |
| Education, Arts & Media | 170 (47.6%) | 187 (52.4%) |
| Legal Services & Support | 14 (18.9%) | 60 (81.1%) |
| Education Instruction & Library | 178 (19.7%) | 728 (80.3%) |
| Arts, Media & Entertainment | 90 (50.6%) | 88 (49.4%) |
| Health Diagnosing & Treating | 137 (13.8%) | 855 (86.2%) |
| Health Technologists | 102 (17.0%) | 499 (83.0%) |
| Total (Category) | 2,641 (45.9%) | 3,116 (54.1%) |
| Total (Overall) | 10,225 (53.4%) | 8,919 (46.6%) |
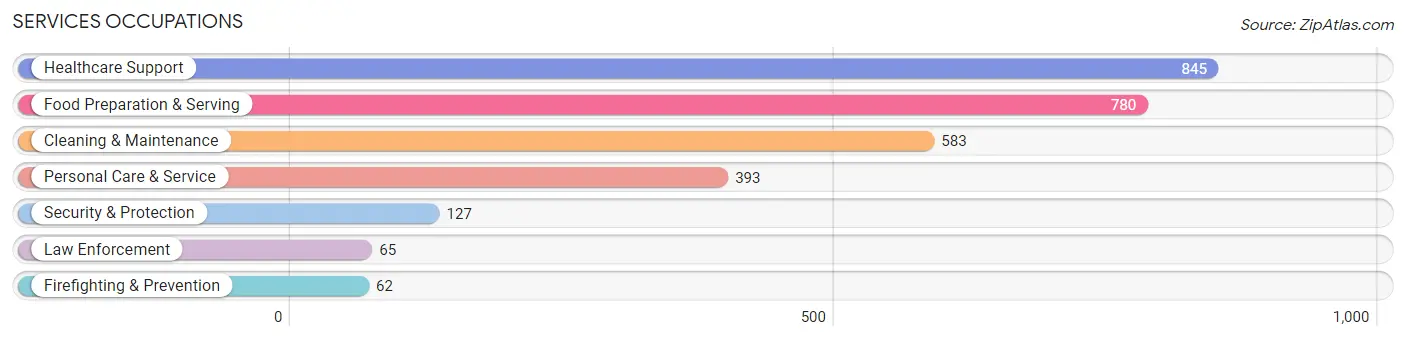
Services Occupations
The most common Services occupations in McLeod County are Healthcare Support (845 | 4.4%), Food Preparation & Serving (780 | 4.1%), Cleaning & Maintenance (583 | 3.0%), Personal Care & Service (393 | 2.1%), and Security & Protection (127 | 0.7%).
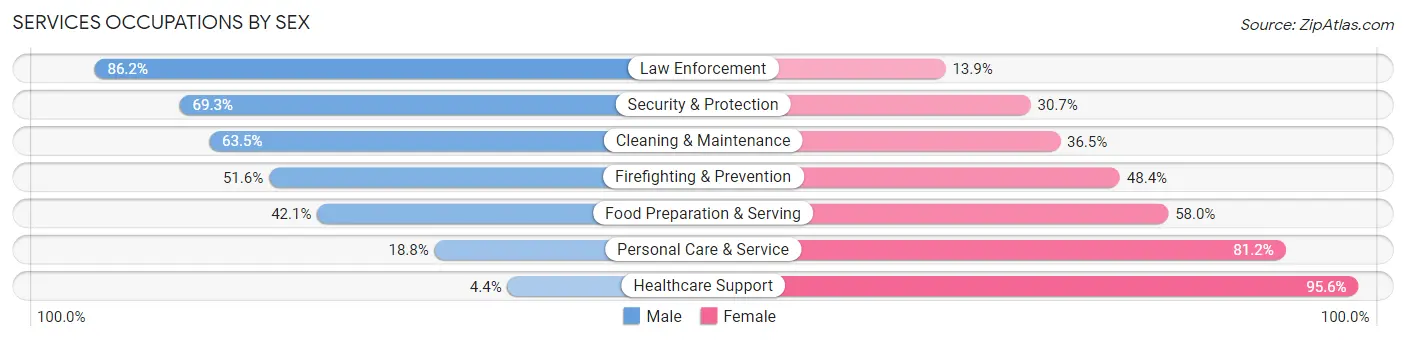
Services Occupations by Sex
Within the Services occupations in McLeod County, the most male-oriented occupations are Law Enforcement (86.2%), Security & Protection (69.3%), and Cleaning & Maintenance (63.5%), while the most female-oriented occupations are Healthcare Support (95.6%), Personal Care & Service (81.2%), and Food Preparation & Serving (58.0%).
| Occupation | Male | Female |
| Healthcare Support | 37 (4.4%) | 808 (95.6%) |
| Security & Protection | 88 (69.3%) | 39 (30.7%) |
| Firefighting & Prevention | 32 (51.6%) | 30 (48.4%) |
| Law Enforcement | 56 (86.2%) | 9 (13.9%) |
| Food Preparation & Serving | 328 (42.0%) | 452 (58.0%) |
| Cleaning & Maintenance | 370 (63.5%) | 213 (36.5%) |
| Personal Care & Service | 74 (18.8%) | 319 (81.2%) |
| Total (Category) | 897 (32.9%) | 1,831 (67.1%) |
| Total (Overall) | 10,225 (53.4%) | 8,919 (46.6%) |
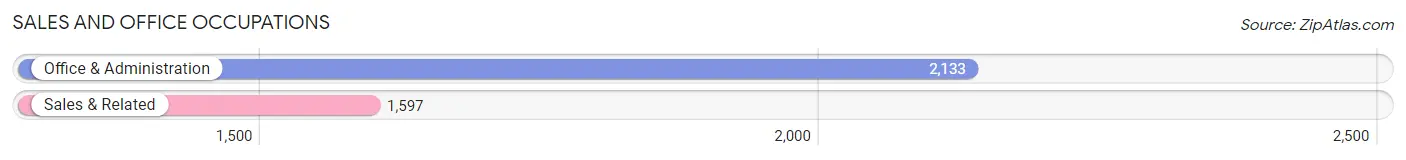
Sales and Office Occupations
The most common Sales and Office occupations in McLeod County are Office & Administration (2,133 | 11.1%), and Sales & Related (1,597 | 8.3%).
Sales and Office Occupations by Sex
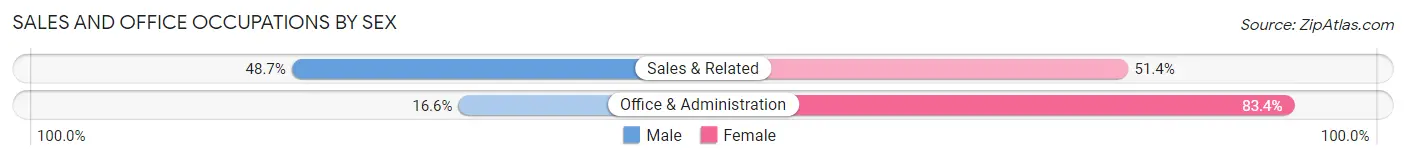
| Occupation | Male | Female |
| Sales & Related | 777 (48.6%) | 820 (51.3%) |
| Office & Administration | 354 (16.6%) | 1,779 (83.4%) |
| Total (Category) | 1,131 (30.3%) | 2,599 (69.7%) |
| Total (Overall) | 10,225 (53.4%) | 8,919 (46.6%) |
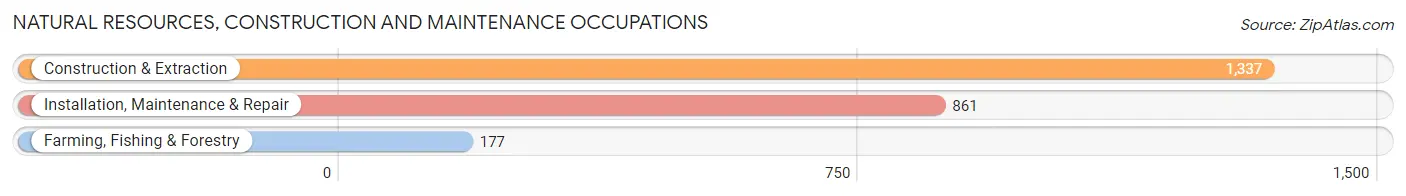
Natural Resources, Construction and Maintenance Occupations
The most common Natural Resources, Construction and Maintenance occupations in McLeod County are Construction & Extraction (1,337 | 7.0%), Installation, Maintenance & Repair (861 | 4.5%), and Farming, Fishing & Forestry (177 | 0.9%).
Natural Resources, Construction and Maintenance Occupations by Sex
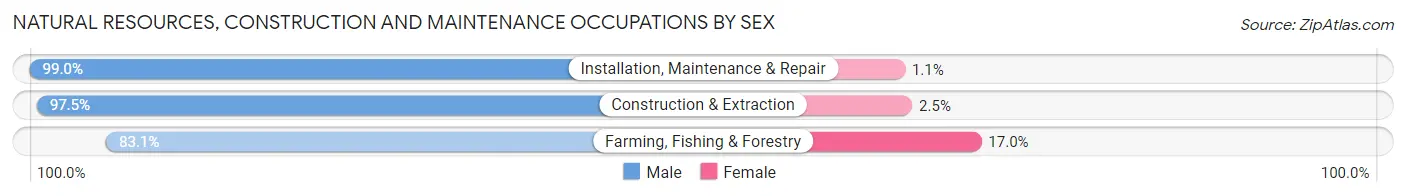
| Occupation | Male | Female |
| Farming, Fishing & Forestry | 147 (83.1%) | 30 (17.0%) |
| Construction & Extraction | 1,303 (97.5%) | 34 (2.5%) |
| Installation, Maintenance & Repair | 852 (99.0%) | 9 (1.1%) |
| Total (Category) | 2,302 (96.9%) | 73 (3.1%) |
| Total (Overall) | 10,225 (53.4%) | 8,919 (46.6%) |
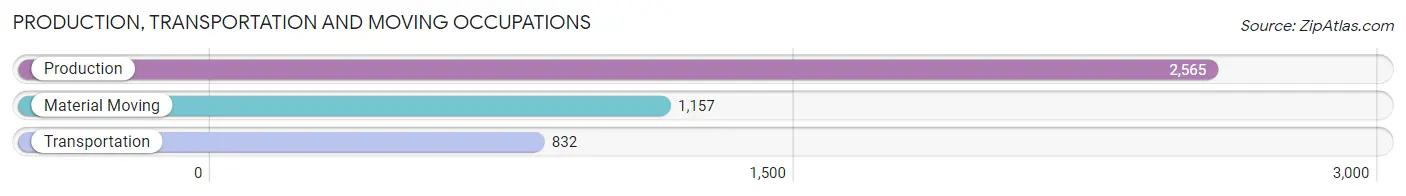
Production, Transportation and Moving Occupations
The most common Production, Transportation and Moving occupations in McLeod County are Production (2,565 | 13.4%), Material Moving (1,157 | 6.0%), and Transportation (832 | 4.3%).
Production, Transportation and Moving Occupations by Sex
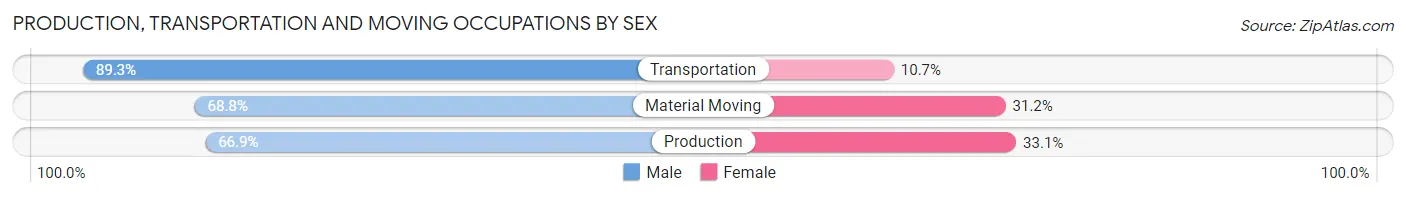
| Occupation | Male | Female |
| Production | 1,715 (66.9%) | 850 (33.1%) |
| Transportation | 743 (89.3%) | 89 (10.7%) |
| Material Moving | 796 (68.8%) | 361 (31.2%) |
| Total (Category) | 3,254 (71.5%) | 1,300 (28.5%) |
| Total (Overall) | 10,225 (53.4%) | 8,919 (46.6%) |
Employment Industries by Sex in McLeod County
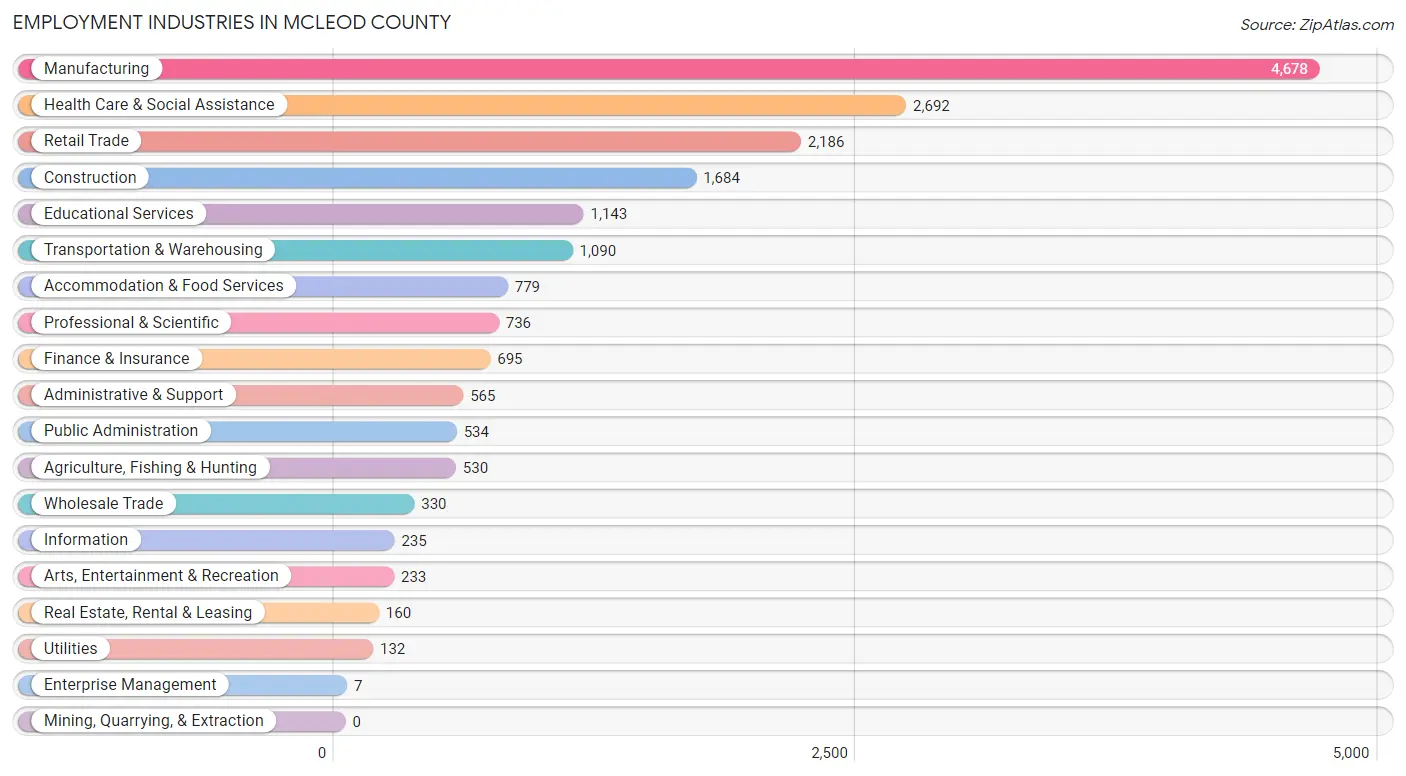
Employment Industries in McLeod County
The major employment industries in McLeod County include Manufacturing (4,678 | 24.4%), Health Care & Social Assistance (2,692 | 14.1%), Retail Trade (2,186 | 11.4%), Construction (1,684 | 8.8%), and Educational Services (1,143 | 6.0%).
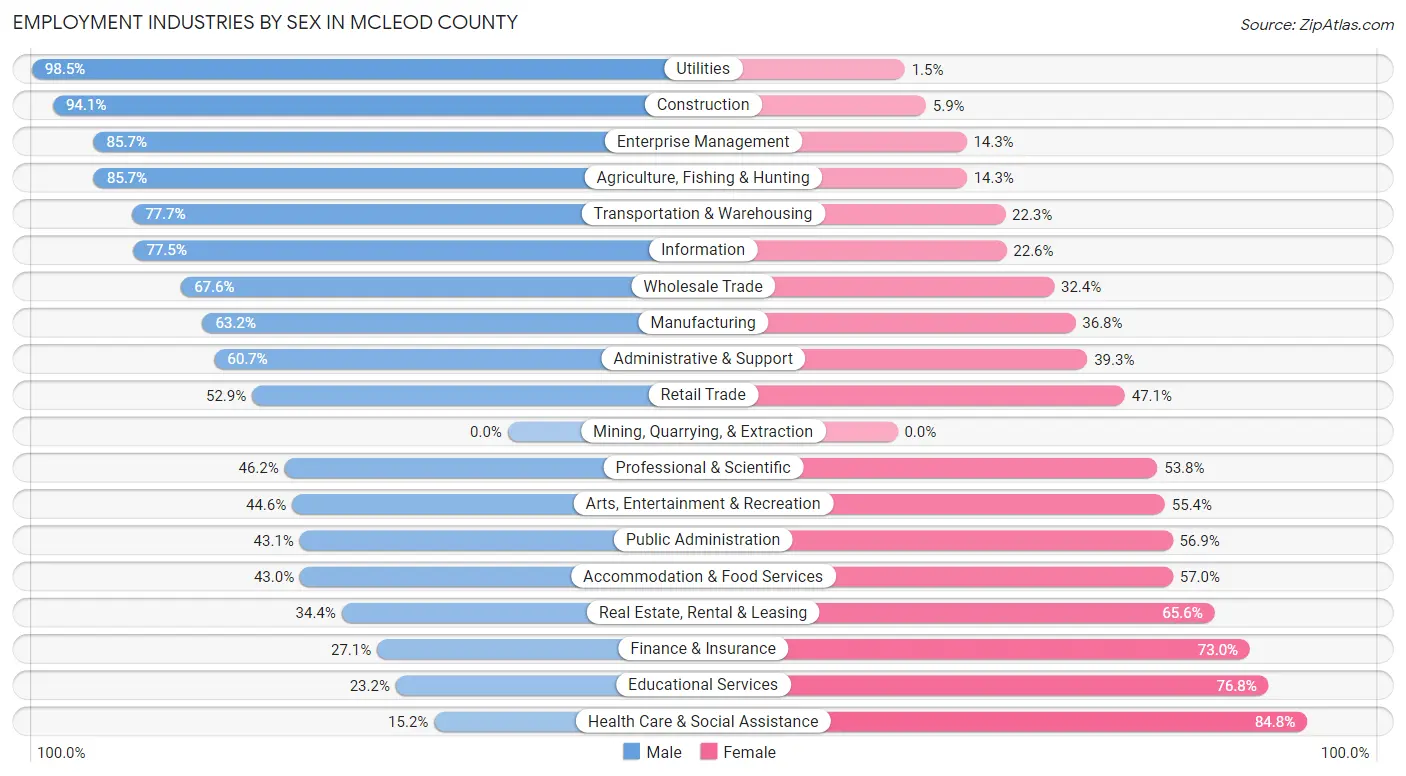
Employment Industries by Sex in McLeod County
The McLeod County industries that see more men than women are Utilities (98.5%), Construction (94.1%), and Enterprise Management (85.7%), whereas the industries that tend to have a higher number of women are Health Care & Social Assistance (84.8%), Educational Services (76.8%), and Finance & Insurance (73.0%).
| Industry | Male | Female |
| Agriculture, Fishing & Hunting | 454 (85.7%) | 76 (14.3%) |
| Mining, Quarrying, & Extraction | 0 (0.0%) | 0 (0.0%) |
| Construction | 1,585 (94.1%) | 99 (5.9%) |
| Manufacturing | 2,955 (63.2%) | 1,723 (36.8%) |
| Wholesale Trade | 223 (67.6%) | 107 (32.4%) |
| Retail Trade | 1,157 (52.9%) | 1,029 (47.1%) |
| Transportation & Warehousing | 847 (77.7%) | 243 (22.3%) |
| Utilities | 130 (98.5%) | 2 (1.5%) |
| Information | 182 (77.4%) | 53 (22.6%) |
| Finance & Insurance | 188 (27.1%) | 507 (73.0%) |
| Real Estate, Rental & Leasing | 55 (34.4%) | 105 (65.6%) |
| Professional & Scientific | 340 (46.2%) | 396 (53.8%) |
| Enterprise Management | 6 (85.7%) | 1 (14.3%) |
| Administrative & Support | 343 (60.7%) | 222 (39.3%) |
| Educational Services | 265 (23.2%) | 878 (76.8%) |
| Health Care & Social Assistance | 410 (15.2%) | 2,282 (84.8%) |
| Arts, Entertainment & Recreation | 104 (44.6%) | 129 (55.4%) |
| Accommodation & Food Services | 335 (43.0%) | 444 (57.0%) |
| Public Administration | 230 (43.1%) | 304 (56.9%) |
| Total | 10,225 (53.4%) | 8,919 (46.6%) |
Education in McLeod County
School Enrollment in McLeod County
The most common levels of schooling among the 8,347 students in McLeod County are high school (2,259 | 27.1%), middle school (2,001 | 24.0%), and elementary school (1,726 | 20.7%).
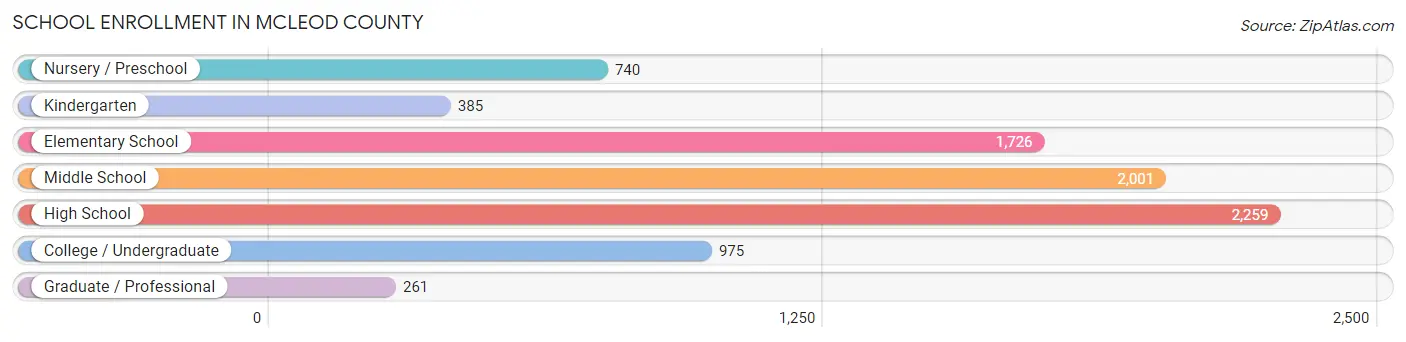
| School Level | # Students | % Students |
| Nursery / Preschool | 740 | 8.9% |
| Kindergarten | 385 | 4.6% |
| Elementary School | 1,726 | 20.7% |
| Middle School | 2,001 | 24.0% |
| High School | 2,259 | 27.1% |
| College / Undergraduate | 975 | 11.7% |
| Graduate / Professional | 261 | 3.1% |
| Total | 8,347 | 100.0% |
School Enrollment by Age by Funding Source in McLeod County
Out of a total of 8,347 students who are enrolled in schools in McLeod County, 1,177 (14.1%) attend a private institution, while the remaining 7,170 (85.9%) are enrolled in public schools. The age group of 3 to 4 year olds has the highest likelihood of being enrolled in private schools, with 136 (30.7% in the age bracket) enrolled. Conversely, the age group of 15 to 17 year olds has the lowest likelihood of being enrolled in a private school, with 1,475 (94.6% in the age bracket) attending a public institution.
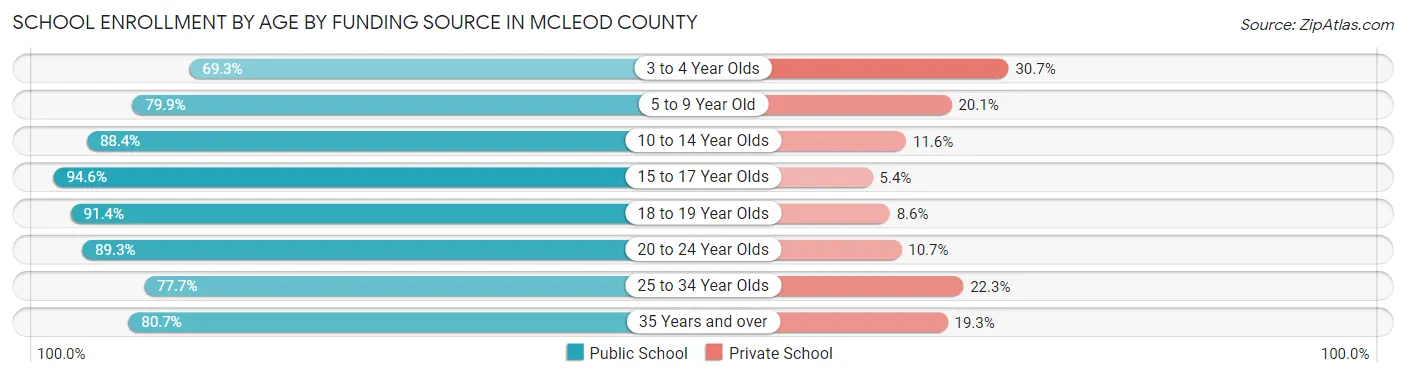
| Age Bracket | Public School | Private School |
| 3 to 4 Year Olds | 307 (69.3%) | 136 (30.7%) |
| 5 to 9 Year Old | 1,723 (79.9%) | 433 (20.1%) |
| 10 to 14 Year Olds | 2,153 (88.4%) | 283 (11.6%) |
| 15 to 17 Year Olds | 1,475 (94.6%) | 84 (5.4%) |
| 18 to 19 Year Olds | 554 (91.4%) | 52 (8.6%) |
| 20 to 24 Year Olds | 441 (89.3%) | 53 (10.7%) |
| 25 to 34 Year Olds | 178 (77.7%) | 51 (22.3%) |
| 35 Years and over | 342 (80.7%) | 82 (19.3%) |
| Total | 7,170 (85.9%) | 1,177 (14.1%) |
Educational Attainment by Field of Study in McLeod County
Education (1,022 | 19.1%), business (812 | 15.2%), science & technology (639 | 11.9%), bio, nature & agricultural (449 | 8.4%), and engineering (441 | 8.2%) are the most common fields of study among 5,352 individuals in McLeod County who have obtained a bachelor's degree or higher.
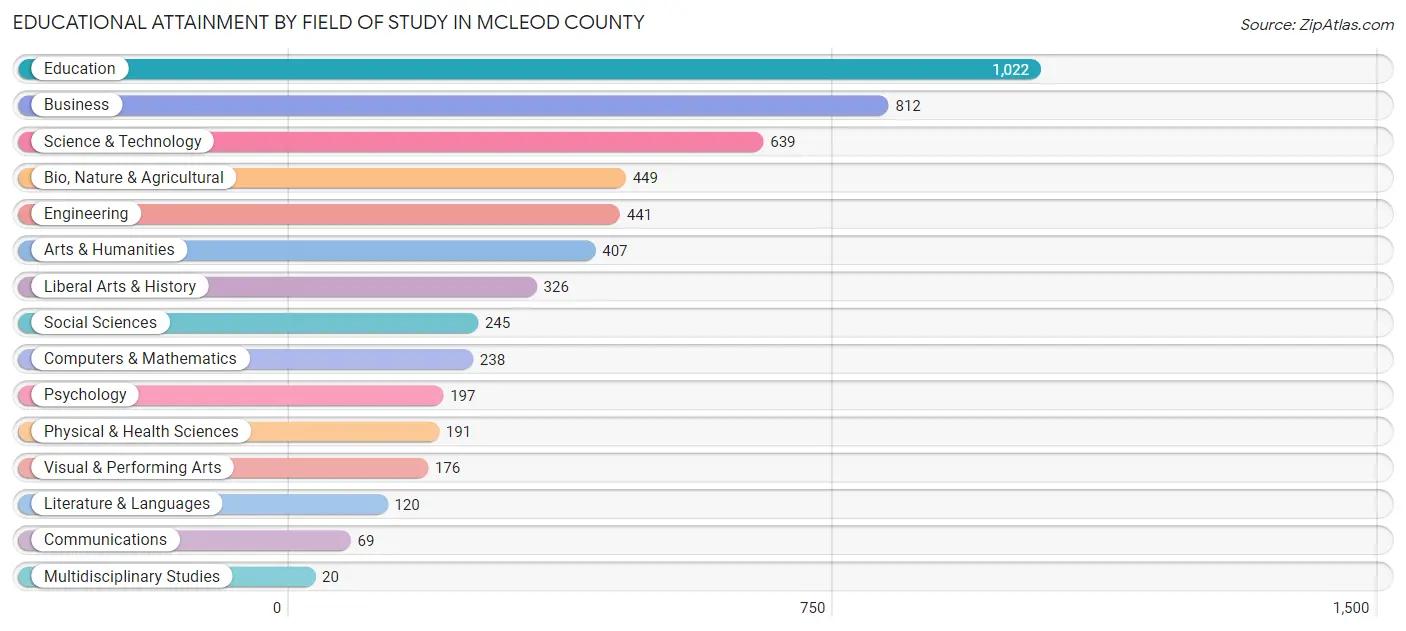
| Field of Study | # Graduates | % Graduates |
| Computers & Mathematics | 238 | 4.4% |
| Bio, Nature & Agricultural | 449 | 8.4% |
| Physical & Health Sciences | 191 | 3.6% |
| Psychology | 197 | 3.7% |
| Social Sciences | 245 | 4.6% |
| Engineering | 441 | 8.2% |
| Multidisciplinary Studies | 20 | 0.4% |
| Science & Technology | 639 | 11.9% |
| Business | 812 | 15.2% |
| Education | 1,022 | 19.1% |
| Literature & Languages | 120 | 2.2% |
| Liberal Arts & History | 326 | 6.1% |
| Visual & Performing Arts | 176 | 3.3% |
| Communications | 69 | 1.3% |
| Arts & Humanities | 407 | 7.6% |
| Total | 5,352 | 100.0% |
Transportation & Commute in McLeod County
Vehicle Availability by Sex in McLeod County
The most prevalent vehicle ownership categories in McLeod County are males with 2 vehicles (4,150, accounting for 41.3%) and females with 2 vehicles (3,376, making up 47.9%).
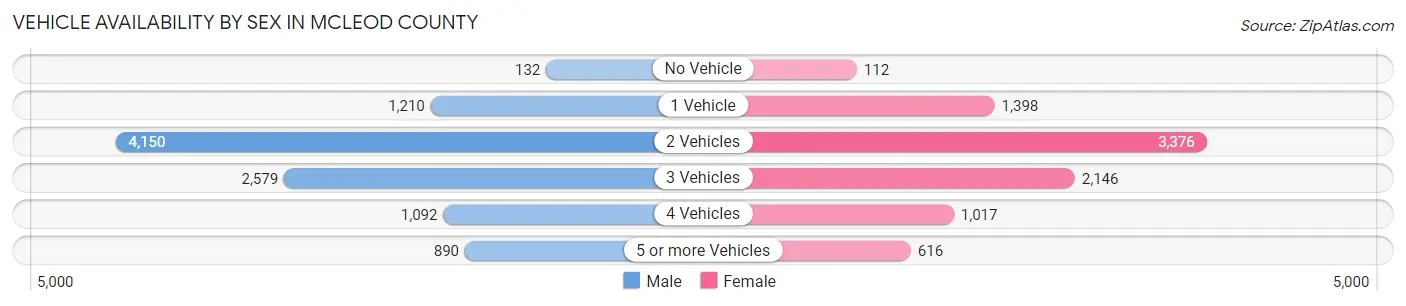
| Vehicles Available | Male | Female |
| No Vehicle | 132 (1.3%) | 112 (1.3%) |
| 1 Vehicle | 1,210 (12.0%) | 1,398 (16.1%) |
| 2 Vehicles | 4,150 (41.3%) | 3,376 (39.0%) |
| 3 Vehicles | 2,579 (25.7%) | 2,146 (24.8%) |
| 4 Vehicles | 1,092 (10.9%) | 1,017 (11.7%) |
| 5 or more Vehicles | 890 (8.8%) | 616 (7.1%) |
| Total | 10,053 (100.0%) | 8,665 (100.0%) |
Commute Time in McLeod County
The most frequently occuring commute durations in McLeod County are 5 to 9 minutes (3,971 commuters, 22.7%), 10 to 14 minutes (2,518 commuters, 14.4%), and 15 to 19 minutes (2,049 commuters, 11.7%).
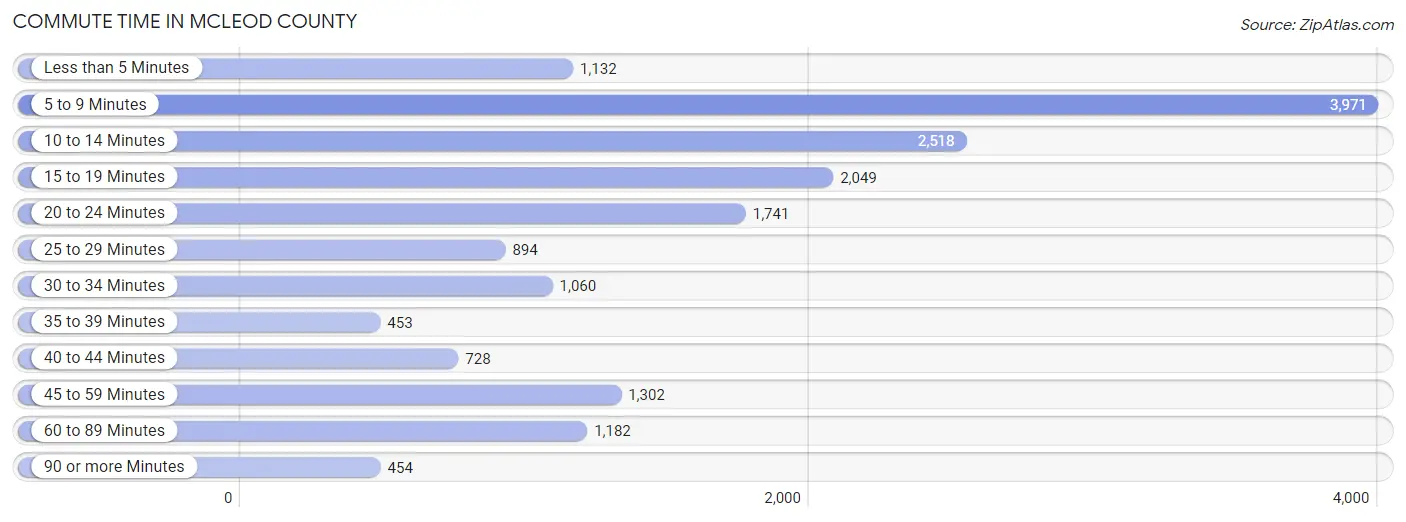
| Commute Time | # Commuters | % Commuters |
| Less than 5 Minutes | 1,132 | 6.5% |
| 5 to 9 Minutes | 3,971 | 22.7% |
| 10 to 14 Minutes | 2,518 | 14.4% |
| 15 to 19 Minutes | 2,049 | 11.7% |
| 20 to 24 Minutes | 1,741 | 10.0% |
| 25 to 29 Minutes | 894 | 5.1% |
| 30 to 34 Minutes | 1,060 | 6.1% |
| 35 to 39 Minutes | 453 | 2.6% |
| 40 to 44 Minutes | 728 | 4.2% |
| 45 to 59 Minutes | 1,302 | 7.4% |
| 60 to 89 Minutes | 1,182 | 6.8% |
| 90 or more Minutes | 454 | 2.6% |
Commute Time by Sex in McLeod County
The most common commute times in McLeod County are 5 to 9 minutes (1,833 commuters, 19.5%) for males and 5 to 9 minutes (2,138 commuters, 26.5%) for females.
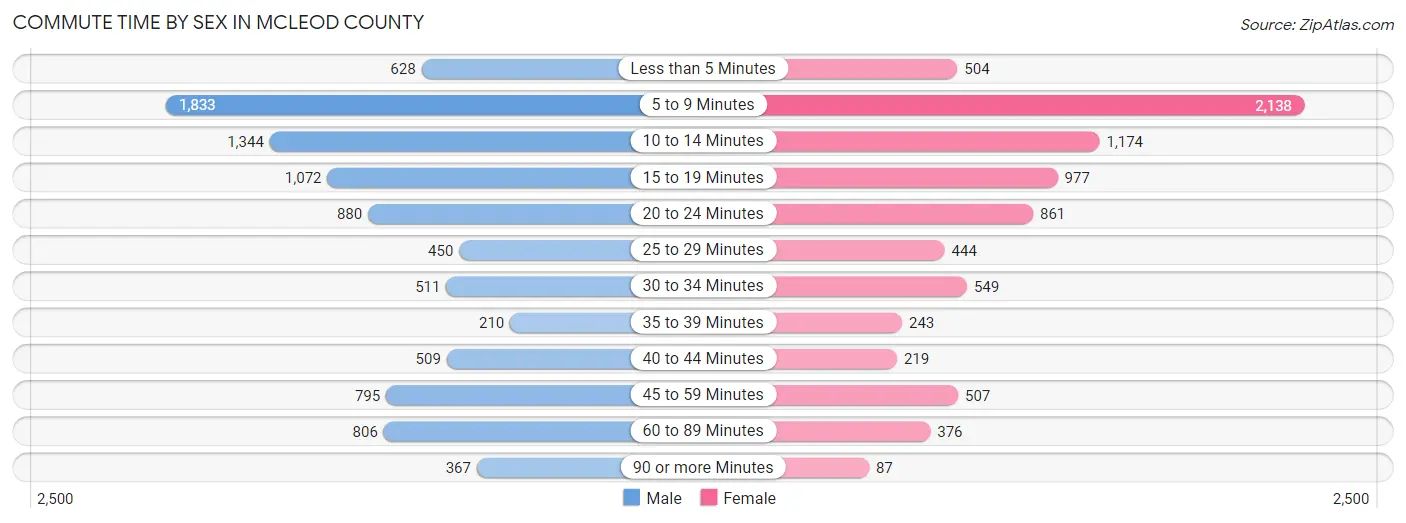
| Commute Time | Male | Female |
| Less than 5 Minutes | 628 (6.7%) | 504 (6.2%) |
| 5 to 9 Minutes | 1,833 (19.5%) | 2,138 (26.5%) |
| 10 to 14 Minutes | 1,344 (14.3%) | 1,174 (14.5%) |
| 15 to 19 Minutes | 1,072 (11.4%) | 977 (12.1%) |
| 20 to 24 Minutes | 880 (9.4%) | 861 (10.7%) |
| 25 to 29 Minutes | 450 (4.8%) | 444 (5.5%) |
| 30 to 34 Minutes | 511 (5.4%) | 549 (6.8%) |
| 35 to 39 Minutes | 210 (2.2%) | 243 (3.0%) |
| 40 to 44 Minutes | 509 (5.4%) | 219 (2.7%) |
| 45 to 59 Minutes | 795 (8.5%) | 507 (6.3%) |
| 60 to 89 Minutes | 806 (8.6%) | 376 (4.6%) |
| 90 or more Minutes | 367 (3.9%) | 87 (1.1%) |
Time of Departure to Work by Sex in McLeod County
The most frequent times of departure to work in McLeod County are 7:00 AM to 7:29 AM (1,231, 13.1%) for males and 7:30 AM to 7:59 AM (1,312, 16.2%) for females.
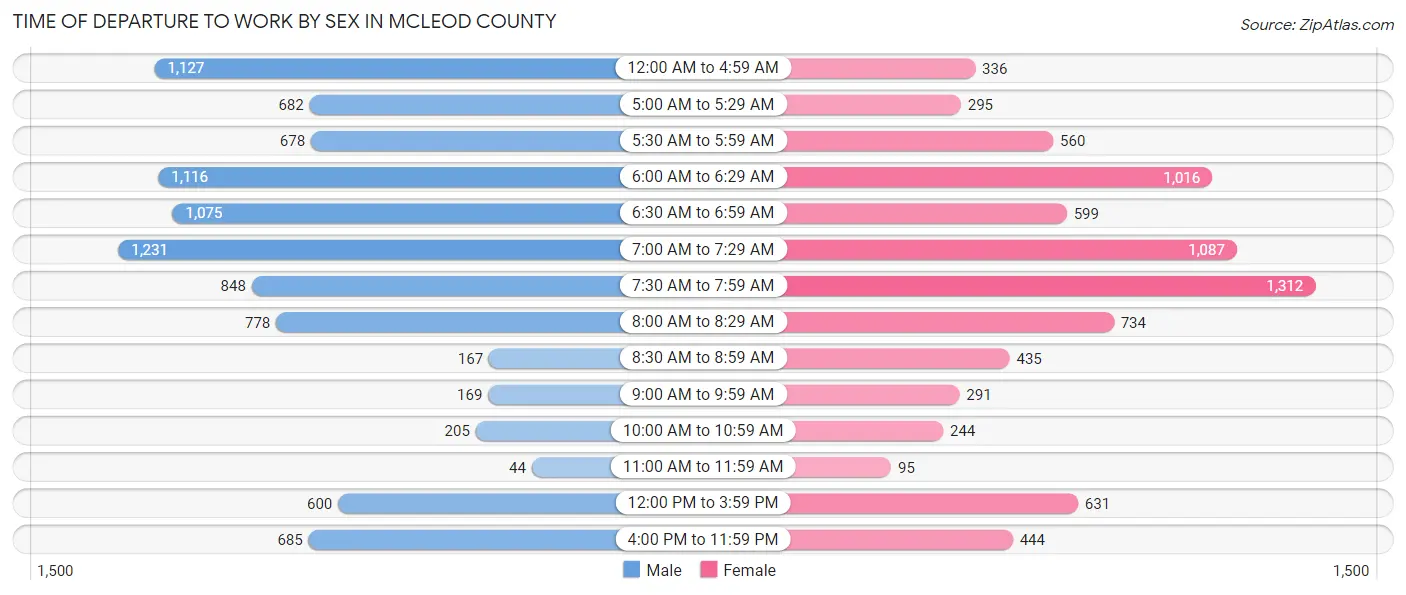
| Time of Departure | Male | Female |
| 12:00 AM to 4:59 AM | 1,127 (12.0%) | 336 (4.2%) |
| 5:00 AM to 5:29 AM | 682 (7.2%) | 295 (3.6%) |
| 5:30 AM to 5:59 AM | 678 (7.2%) | 560 (6.9%) |
| 6:00 AM to 6:29 AM | 1,116 (11.9%) | 1,016 (12.6%) |
| 6:30 AM to 6:59 AM | 1,075 (11.4%) | 599 (7.4%) |
| 7:00 AM to 7:29 AM | 1,231 (13.1%) | 1,087 (13.5%) |
| 7:30 AM to 7:59 AM | 848 (9.0%) | 1,312 (16.2%) |
| 8:00 AM to 8:29 AM | 778 (8.3%) | 734 (9.1%) |
| 8:30 AM to 8:59 AM | 167 (1.8%) | 435 (5.4%) |
| 9:00 AM to 9:59 AM | 169 (1.8%) | 291 (3.6%) |
| 10:00 AM to 10:59 AM | 205 (2.2%) | 244 (3.0%) |
| 11:00 AM to 11:59 AM | 44 (0.5%) | 95 (1.2%) |
| 12:00 PM to 3:59 PM | 600 (6.4%) | 631 (7.8%) |
| 4:00 PM to 11:59 PM | 685 (7.3%) | 444 (5.5%) |
| Total | 9,405 (100.0%) | 8,079 (100.0%) |
Housing Occupancy in McLeod County
Occupancy by Ownership in McLeod County
Of the total 14,825 dwellings in McLeod County, owner-occupied units account for 11,391 (76.8%), while renter-occupied units make up 3,434 (23.2%).
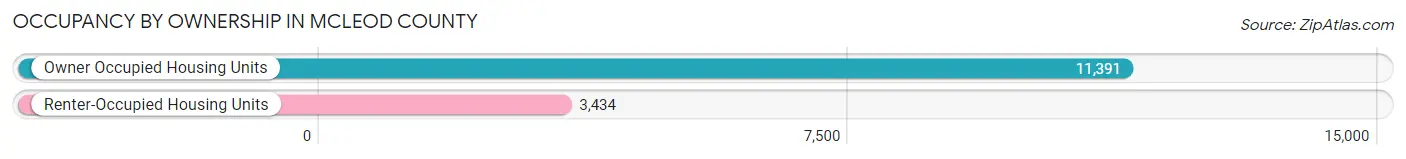
| Occupancy | # Housing Units | % Housing Units |
| Owner Occupied Housing Units | 11,391 | 76.8% |
| Renter-Occupied Housing Units | 3,434 | 23.2% |
| Total Occupied Housing Units | 14,825 | 100.0% |
Occupancy by Household Size in McLeod County
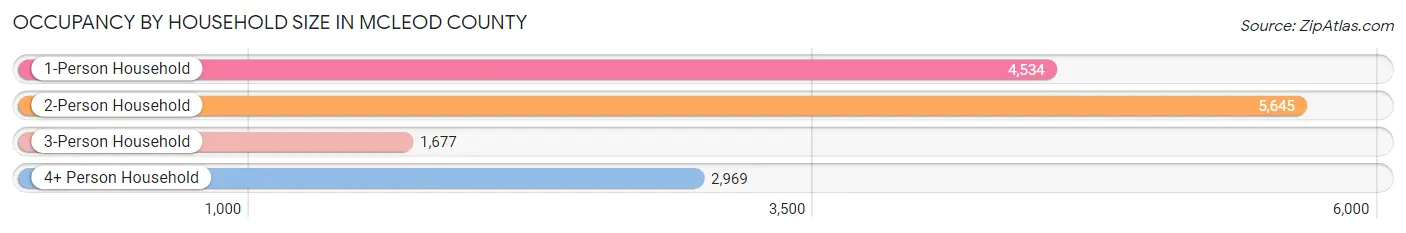
| Household Size | # Housing Units | % Housing Units |
| 1-Person Household | 4,534 | 30.6% |
| 2-Person Household | 5,645 | 38.1% |
| 3-Person Household | 1,677 | 11.3% |
| 4+ Person Household | 2,969 | 20.0% |
| Total Housing Units | 14,825 | 100.0% |
Occupancy by Ownership by Household Size in McLeod County
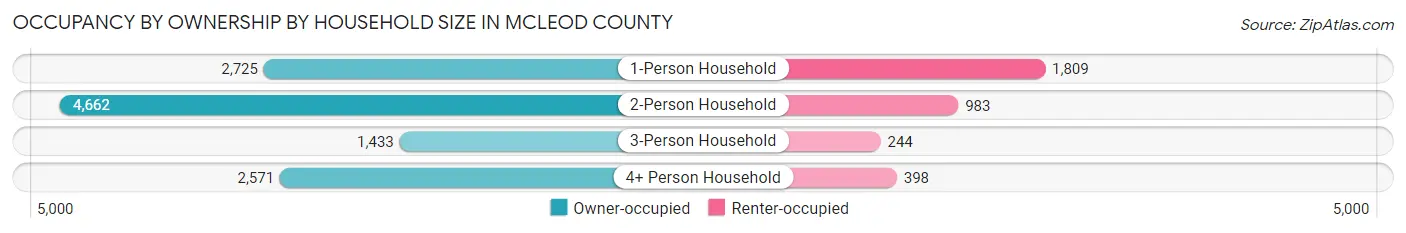
| Household Size | Owner-occupied | Renter-occupied |
| 1-Person Household | 2,725 (60.1%) | 1,809 (39.9%) |
| 2-Person Household | 4,662 (82.6%) | 983 (17.4%) |
| 3-Person Household | 1,433 (85.5%) | 244 (14.5%) |
| 4+ Person Household | 2,571 (86.6%) | 398 (13.4%) |
| Total Housing Units | 11,391 (76.8%) | 3,434 (23.2%) |
Occupancy by Educational Attainment in McLeod County
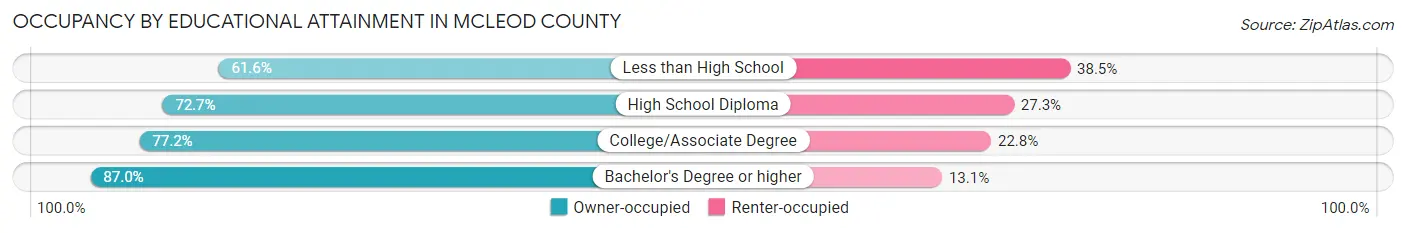
| Household Size | Owner-occupied | Renter-occupied |
| Less than High School | 477 (61.6%) | 298 (38.5%) |
| High School Diploma | 3,474 (72.7%) | 1,305 (27.3%) |
| College/Associate Degree | 4,934 (77.2%) | 1,455 (22.8%) |
| Bachelor's Degree or higher | 2,506 (87.0%) | 376 (13.1%) |
Occupancy by Age of Householder in McLeod County
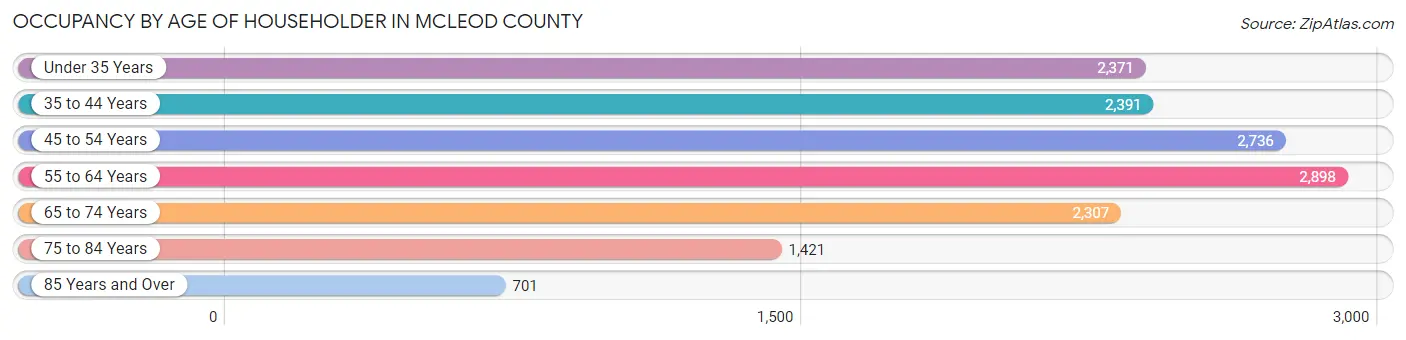
| Age Bracket | # Households | % Households |
| Under 35 Years | 2,371 | 16.0% |
| 35 to 44 Years | 2,391 | 16.1% |
| 45 to 54 Years | 2,736 | 18.5% |
| 55 to 64 Years | 2,898 | 19.6% |
| 65 to 74 Years | 2,307 | 15.6% |
| 75 to 84 Years | 1,421 | 9.6% |
| 85 Years and Over | 701 | 4.7% |
| Total | 14,825 | 100.0% |
Housing Finances in McLeod County
Median Income by Occupancy in McLeod County
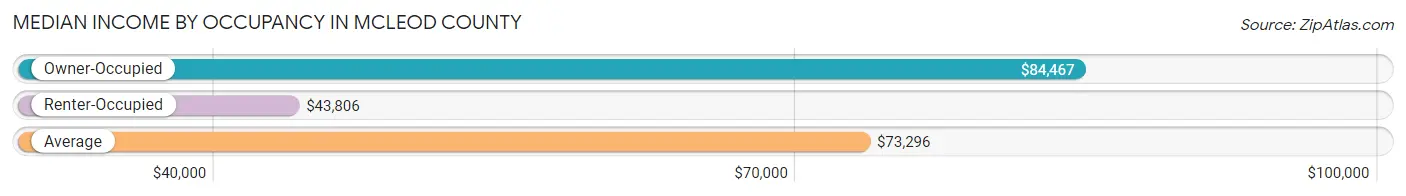
| Occupancy Type | # Households | Median Income |
| Owner-Occupied | 11,391 (76.8%) | $84,467 |
| Renter-Occupied | 3,434 (23.2%) | $43,806 |
| Average | 14,825 (100.0%) | $73,296 |
Occupancy by Householder Income Bracket in McLeod County
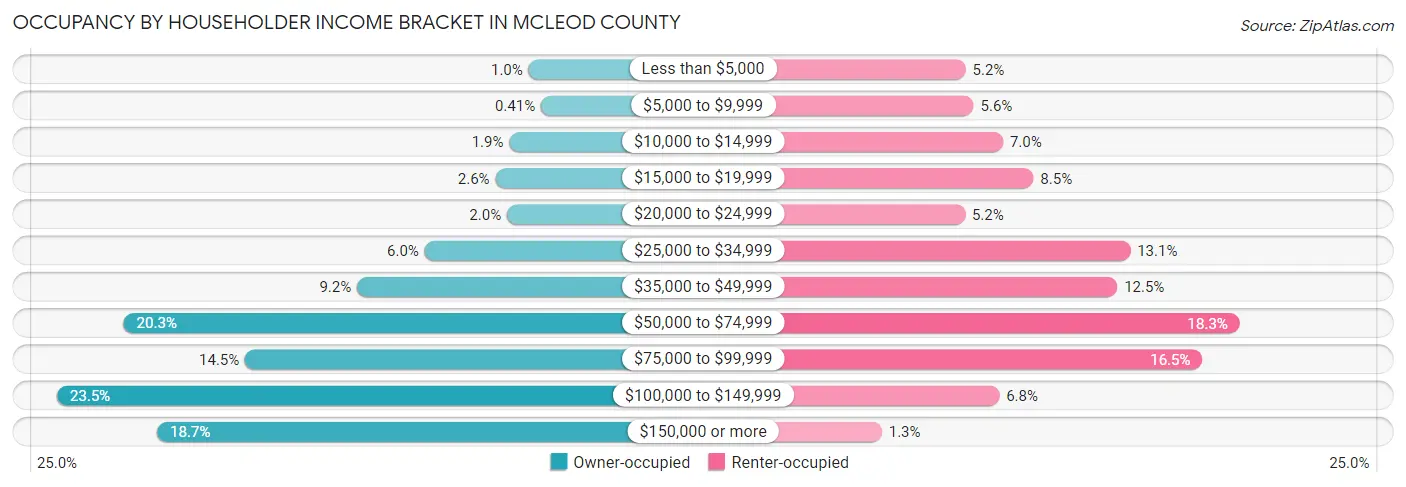
| Income Bracket | Owner-occupied | Renter-occupied |
| Less than $5,000 | 114 (1.0%) | 180 (5.2%) |
| $5,000 to $9,999 | 47 (0.4%) | 193 (5.6%) |
| $10,000 to $14,999 | 219 (1.9%) | 241 (7.0%) |
| $15,000 to $19,999 | 294 (2.6%) | 291 (8.5%) |
| $20,000 to $24,999 | 231 (2.0%) | 179 (5.2%) |
| $25,000 to $34,999 | 678 (5.9%) | 449 (13.1%) |
| $35,000 to $49,999 | 1,045 (9.2%) | 428 (12.5%) |
| $50,000 to $74,999 | 2,310 (20.3%) | 628 (18.3%) |
| $75,000 to $99,999 | 1,652 (14.5%) | 567 (16.5%) |
| $100,000 to $149,999 | 2,672 (23.5%) | 235 (6.8%) |
| $150,000 or more | 2,129 (18.7%) | 43 (1.3%) |
| Total | 11,391 (100.0%) | 3,434 (100.0%) |
Monthly Housing Cost Tiers in McLeod County
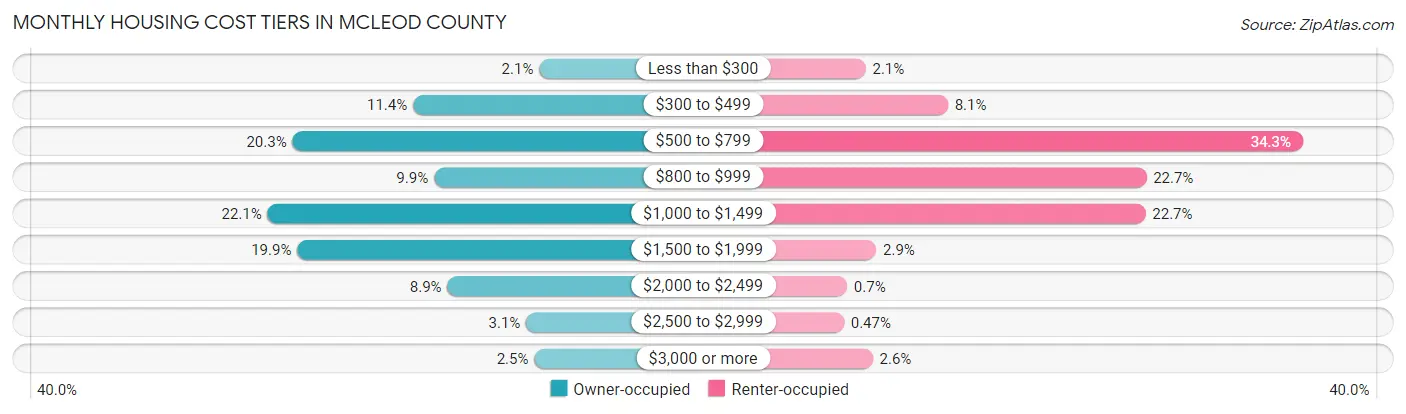
| Monthly Cost | Owner-occupied | Renter-occupied |
| Less than $300 | 239 (2.1%) | 71 (2.1%) |
| $300 to $499 | 1,297 (11.4%) | 279 (8.1%) |
| $500 to $799 | 2,309 (20.3%) | 1,177 (34.3%) |
| $800 to $999 | 1,122 (9.9%) | 781 (22.7%) |
| $1,000 to $1,499 | 2,518 (22.1%) | 779 (22.7%) |
| $1,500 to $1,999 | 2,269 (19.9%) | 98 (2.9%) |
| $2,000 to $2,499 | 1,009 (8.9%) | 24 (0.7%) |
| $2,500 to $2,999 | 348 (3.1%) | 16 (0.5%) |
| $3,000 or more | 280 (2.5%) | 89 (2.6%) |
| Total | 11,391 (100.0%) | 3,434 (100.0%) |
Physical Housing Characteristics in McLeod County
Housing Structures in McLeod County
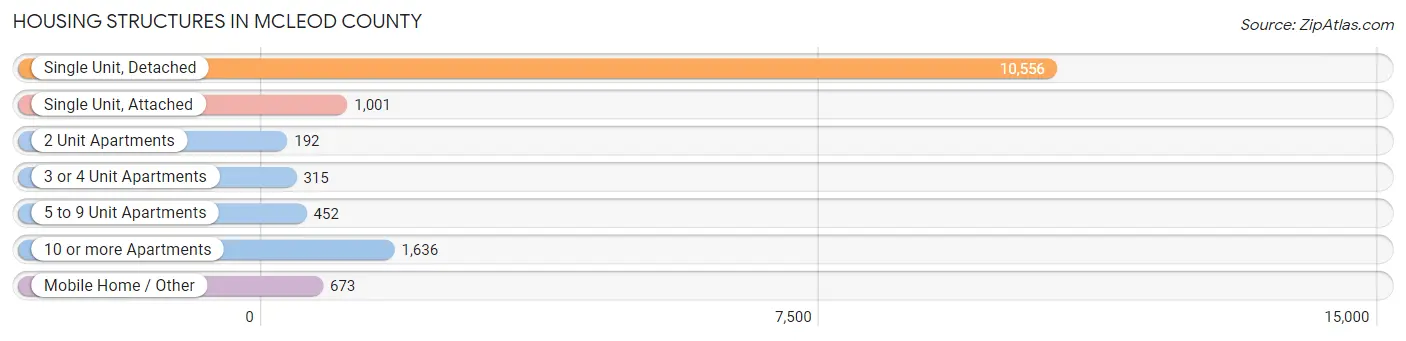
| Structure Type | # Housing Units | % Housing Units |
| Single Unit, Detached | 10,556 | 71.2% |
| Single Unit, Attached | 1,001 | 6.8% |
| 2 Unit Apartments | 192 | 1.3% |
| 3 or 4 Unit Apartments | 315 | 2.1% |
| 5 to 9 Unit Apartments | 452 | 3.0% |
| 10 or more Apartments | 1,636 | 11.0% |
| Mobile Home / Other | 673 | 4.5% |
| Total | 14,825 | 100.0% |
Housing Structures by Occupancy in McLeod County
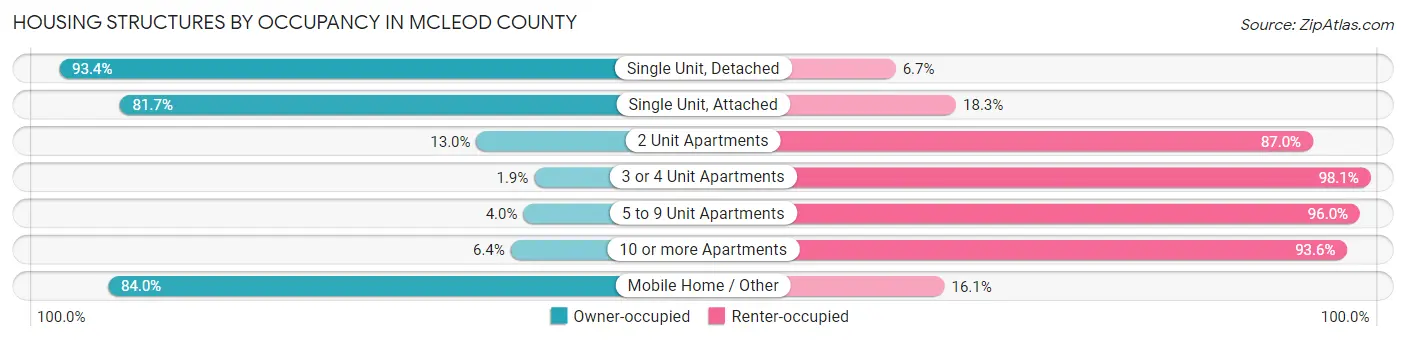
| Structure Type | Owner-occupied | Renter-occupied |
| Single Unit, Detached | 9,854 (93.3%) | 702 (6.7%) |
| Single Unit, Attached | 818 (81.7%) | 183 (18.3%) |
| 2 Unit Apartments | 25 (13.0%) | 167 (87.0%) |
| 3 or 4 Unit Apartments | 6 (1.9%) | 309 (98.1%) |
| 5 to 9 Unit Apartments | 18 (4.0%) | 434 (96.0%) |
| 10 or more Apartments | 105 (6.4%) | 1,531 (93.6%) |
| Mobile Home / Other | 565 (84.0%) | 108 (16.1%) |
| Total | 11,391 (76.8%) | 3,434 (23.2%) |
Housing Structures by Number of Rooms in McLeod County
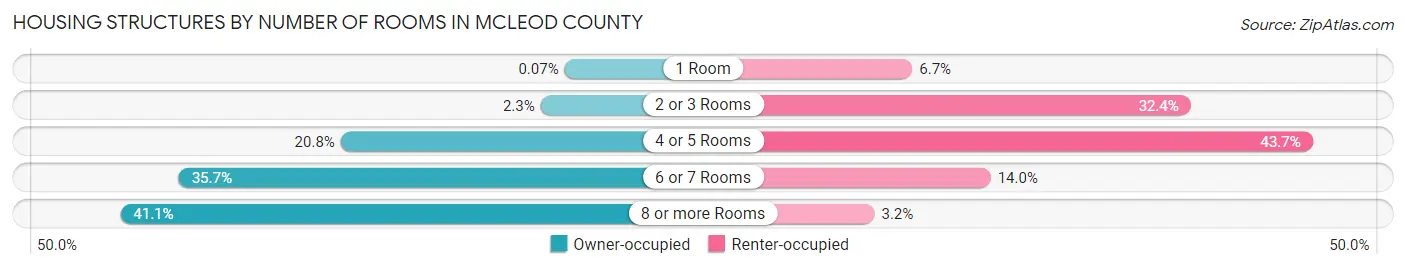
| Number of Rooms | Owner-occupied | Renter-occupied |
| 1 Room | 8 (0.1%) | 230 (6.7%) |
| 2 or 3 Rooms | 260 (2.3%) | 1,114 (32.4%) |
| 4 or 5 Rooms | 2,366 (20.8%) | 1,501 (43.7%) |
| 6 or 7 Rooms | 4,071 (35.7%) | 479 (14.0%) |
| 8 or more Rooms | 4,686 (41.1%) | 110 (3.2%) |
| Total | 11,391 (100.0%) | 3,434 (100.0%) |
Housing Structure by Heating Type in McLeod County
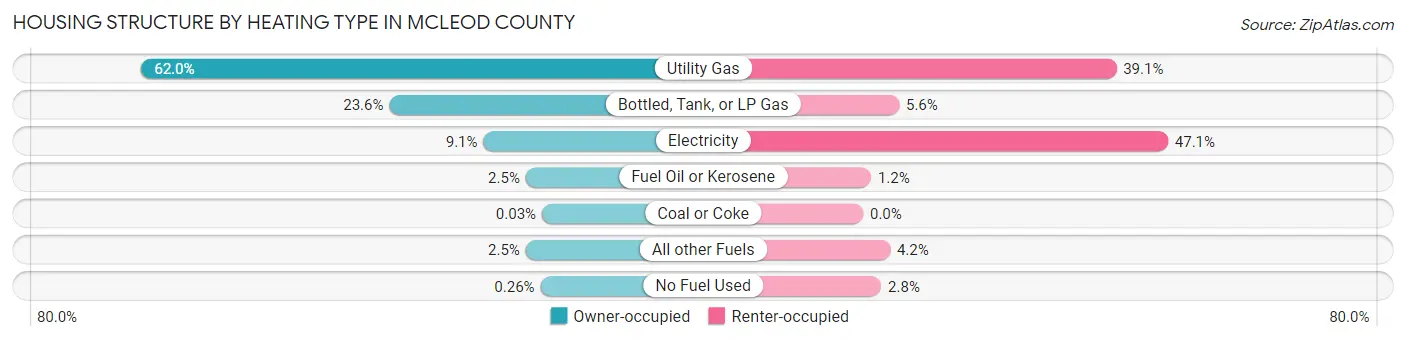
| Heating Type | Owner-occupied | Renter-occupied |
| Utility Gas | 7,057 (62.0%) | 1,344 (39.1%) |
| Bottled, Tank, or LP Gas | 2,690 (23.6%) | 191 (5.6%) |
| Electricity | 1,034 (9.1%) | 1,618 (47.1%) |
| Fuel Oil or Kerosene | 288 (2.5%) | 42 (1.2%) |
| Coal or Coke | 3 (0.0%) | 0 (0.0%) |
| All other Fuels | 289 (2.5%) | 143 (4.2%) |
| No Fuel Used | 30 (0.3%) | 96 (2.8%) |
| Total | 11,391 (100.0%) | 3,434 (100.0%) |
Household Vehicle Usage in McLeod County
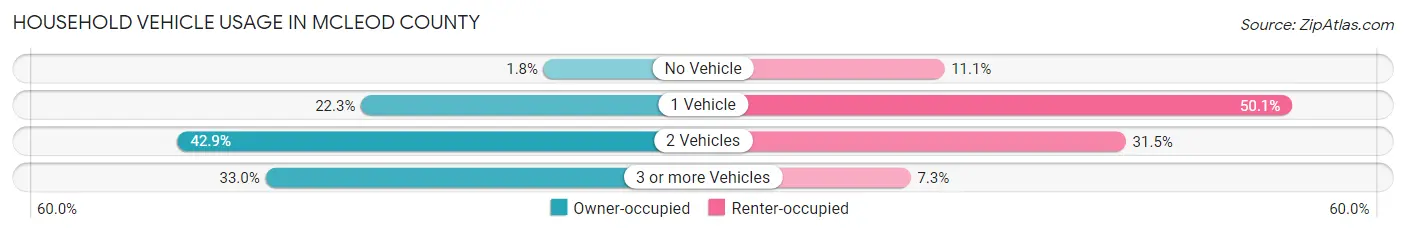
| Vehicles per Household | Owner-occupied | Renter-occupied |
| No Vehicle | 209 (1.8%) | 382 (11.1%) |
| 1 Vehicle | 2,539 (22.3%) | 1,720 (50.1%) |
| 2 Vehicles | 4,883 (42.9%) | 1,080 (31.5%) |
| 3 or more Vehicles | 3,760 (33.0%) | 252 (7.3%) |
| Total | 11,391 (100.0%) | 3,434 (100.0%) |
Real Estate & Mortgages in McLeod County
Real Estate and Mortgage Overview in McLeod County
| Characteristic | Without Mortgage | With Mortgage |
| Housing Units | 4,563 | 6,828 |
| Median Property Value | $203,900 | $220,900 |
| Median Household Income | $63,775 | $1,379 |
| Monthly Housing Costs | $594 | $280 |
| Real Estate Taxes | $2,467 | $32 |
Property Value by Mortgage Status in McLeod County
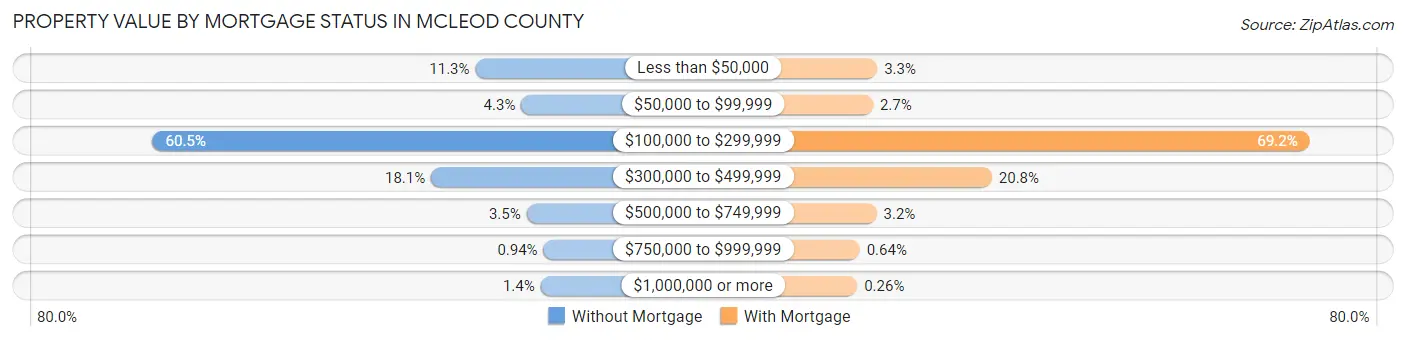
| Property Value | Without Mortgage | With Mortgage |
| Less than $50,000 | 516 (11.3%) | 225 (3.3%) |
| $50,000 to $99,999 | 197 (4.3%) | 181 (2.6%) |
| $100,000 to $299,999 | 2,760 (60.5%) | 4,723 (69.2%) |
| $300,000 to $499,999 | 824 (18.1%) | 1,418 (20.8%) |
| $500,000 to $749,999 | 160 (3.5%) | 219 (3.2%) |
| $750,000 to $999,999 | 43 (0.9%) | 44 (0.6%) |
| $1,000,000 or more | 63 (1.4%) | 18 (0.3%) |
| Total | 4,563 (100.0%) | 6,828 (100.0%) |
Household Income by Mortgage Status in McLeod County
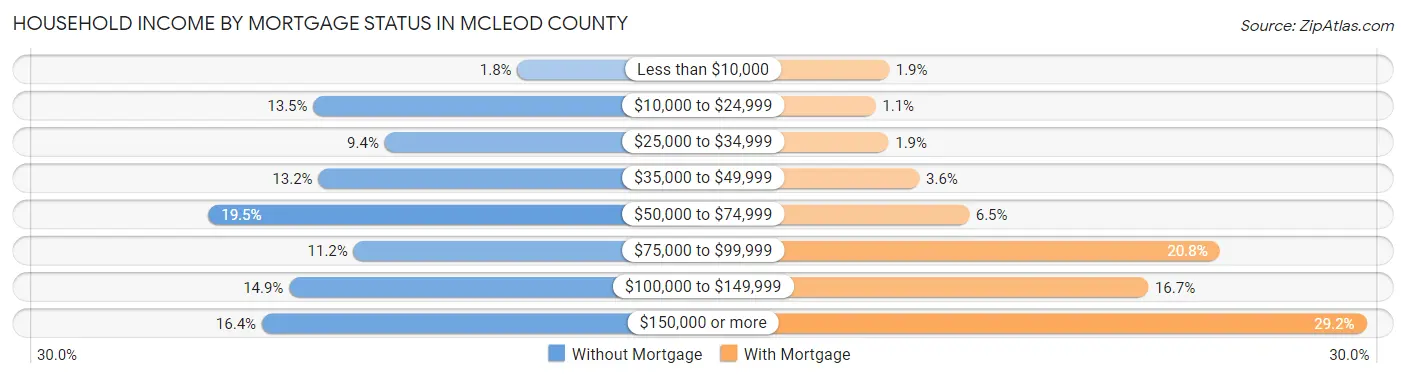
| Household Income | Without Mortgage | With Mortgage |
| Less than $10,000 | 84 (1.8%) | 130 (1.9%) |
| $10,000 to $24,999 | 616 (13.5%) | 77 (1.1%) |
| $25,000 to $34,999 | 430 (9.4%) | 128 (1.9%) |
| $35,000 to $49,999 | 603 (13.2%) | 248 (3.6%) |
| $50,000 to $74,999 | 890 (19.5%) | 442 (6.5%) |
| $75,000 to $99,999 | 511 (11.2%) | 1,420 (20.8%) |
| $100,000 to $149,999 | 679 (14.9%) | 1,141 (16.7%) |
| $150,000 or more | 750 (16.4%) | 1,993 (29.2%) |
| Total | 4,563 (100.0%) | 6,828 (100.0%) |
Property Value to Household Income Ratio in McLeod County
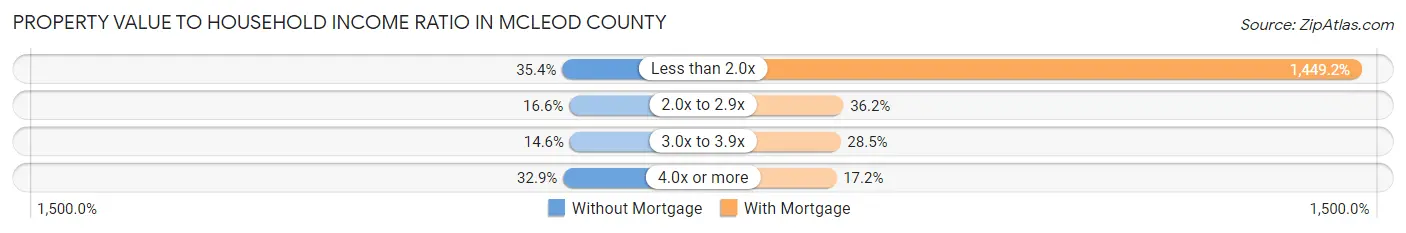
| Value-to-Income Ratio | Without Mortgage | With Mortgage |
| Less than 2.0x | 1,616 (35.4%) | 98,950 (1,449.2%) |
| 2.0x to 2.9x | 756 (16.6%) | 2,468 (36.1%) |
| 3.0x to 3.9x | 665 (14.6%) | 1,949 (28.5%) |
| 4.0x or more | 1,499 (32.9%) | 1,171 (17.2%) |
| Total | 4,563 (100.0%) | 6,828 (100.0%) |
Real Estate Taxes by Mortgage Status in McLeod County
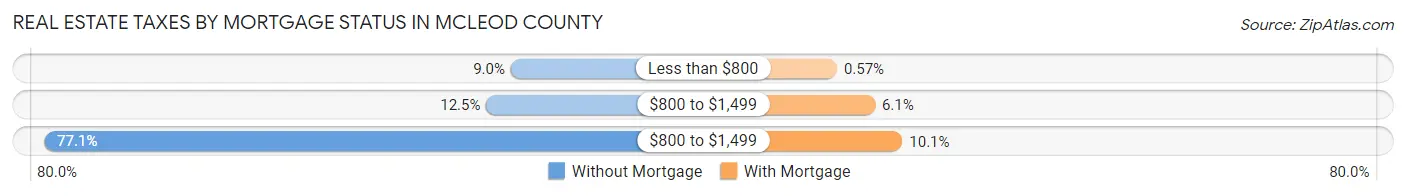
| Property Taxes | Without Mortgage | With Mortgage |
| Less than $800 | 409 (9.0%) | 39 (0.6%) |
| $800 to $1,499 | 572 (12.5%) | 418 (6.1%) |
| $800 to $1,499 | 3,520 (77.1%) | 692 (10.1%) |
| Total | 4,563 (100.0%) | 6,828 (100.0%) |
Health & Disability in McLeod County
Health Insurance Coverage by Age in McLeod County
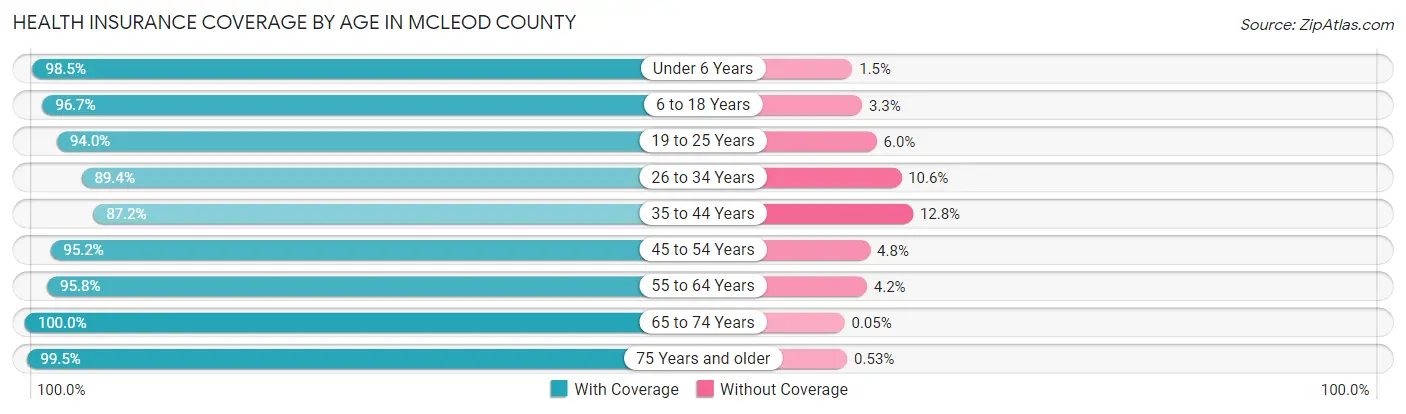
| Age Bracket | With Coverage | Without Coverage |
| Under 6 Years | 2,379 (98.5%) | 36 (1.5%) |
| 6 to 18 Years | 6,022 (96.7%) | 206 (3.3%) |
| 19 to 25 Years | 2,648 (94.0%) | 170 (6.0%) |
| 26 to 34 Years | 3,447 (89.4%) | 409 (10.6%) |
| 35 to 44 Years | 3,992 (87.2%) | 586 (12.8%) |
| 45 to 54 Years | 4,281 (95.2%) | 217 (4.8%) |
| 55 to 64 Years | 4,916 (95.8%) | 216 (4.2%) |
| 65 to 74 Years | 3,790 (100.0%) | 2 (0.1%) |
| 75 Years and older | 3,029 (99.5%) | 16 (0.5%) |
| Total | 34,504 (94.9%) | 1,858 (5.1%) |
Health Insurance Coverage by Citizenship Status in McLeod County
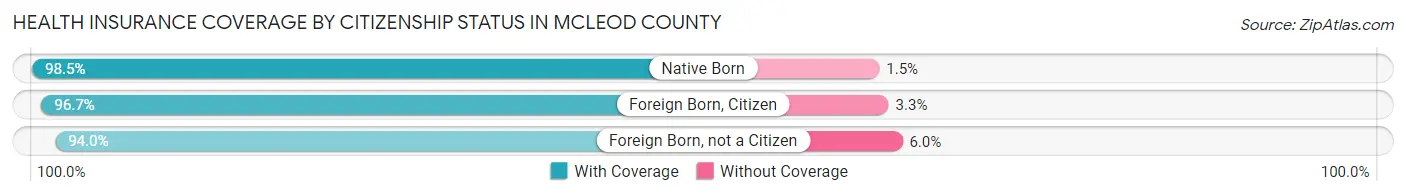
| Citizenship Status | With Coverage | Without Coverage |
| Native Born | 2,379 (98.5%) | 36 (1.5%) |
| Foreign Born, Citizen | 6,022 (96.7%) | 206 (3.3%) |
| Foreign Born, not a Citizen | 2,648 (94.0%) | 170 (6.0%) |
Health Insurance Coverage by Household Income in McLeod County
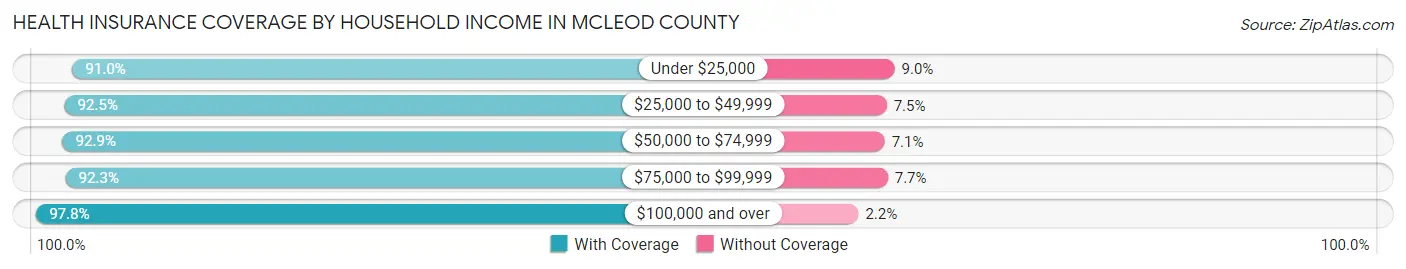
| Household Income | With Coverage | Without Coverage |
| Under $25,000 | 2,366 (91.0%) | 233 (9.0%) |
| $25,000 to $49,999 | 4,451 (92.5%) | 360 (7.5%) |
| $50,000 to $74,999 | 5,852 (92.9%) | 448 (7.1%) |
| $75,000 to $99,999 | 5,430 (92.3%) | 452 (7.7%) |
| $100,000 and over | 16,278 (97.8%) | 365 (2.2%) |
Public vs Private Health Insurance Coverage by Age in McLeod County
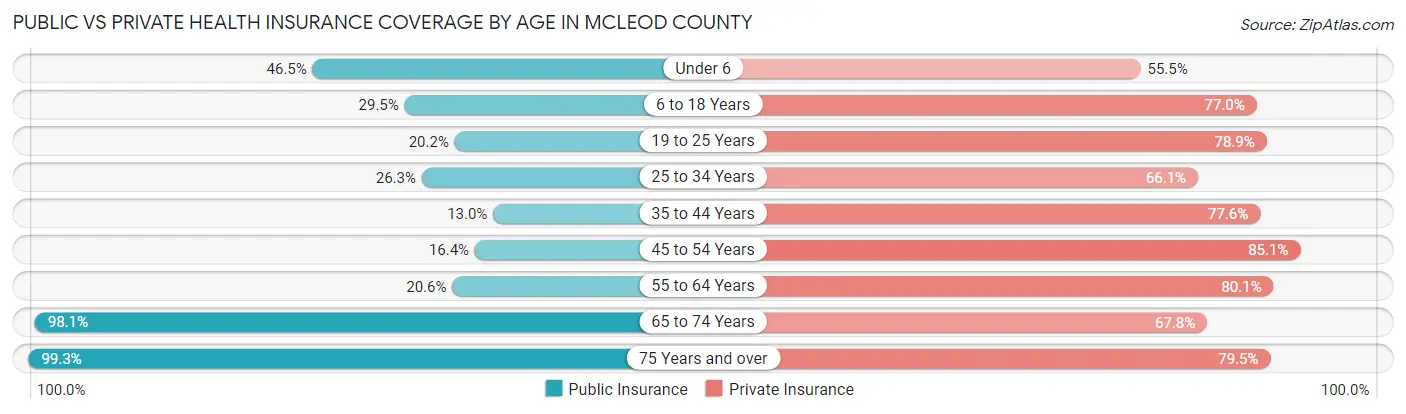
| Age Bracket | Public Insurance | Private Insurance |
| Under 6 | 1,124 (46.5%) | 1,339 (55.4%) |
| 6 to 18 Years | 1,835 (29.5%) | 4,795 (77.0%) |
| 19 to 25 Years | 568 (20.2%) | 2,222 (78.8%) |
| 25 to 34 Years | 1,013 (26.3%) | 2,549 (66.1%) |
| 35 to 44 Years | 596 (13.0%) | 3,554 (77.6%) |
| 45 to 54 Years | 738 (16.4%) | 3,827 (85.1%) |
| 55 to 64 Years | 1,058 (20.6%) | 4,112 (80.1%) |
| 65 to 74 Years | 3,720 (98.1%) | 2,571 (67.8%) |
| 75 Years and over | 3,023 (99.3%) | 2,422 (79.5%) |
| Total | 13,675 (37.6%) | 27,391 (75.3%) |
Disability Status by Sex by Age in McLeod County
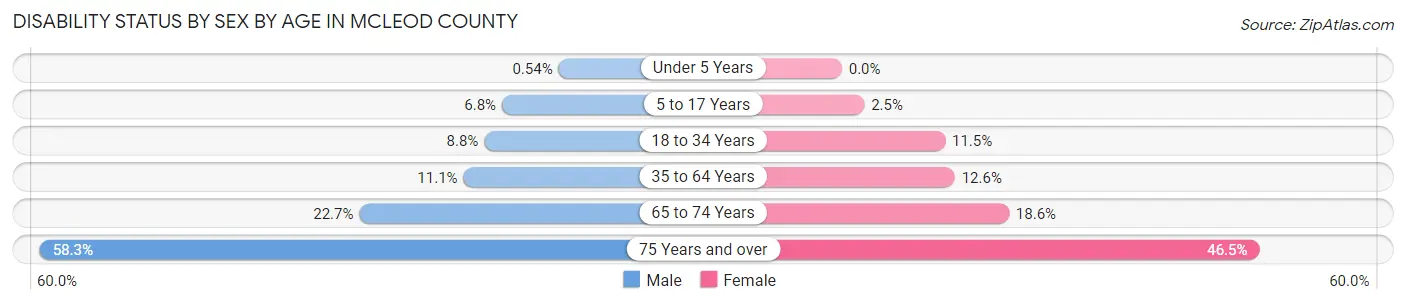
| Age Bracket | Male | Female |
| Under 5 Years | 6 (0.5%) | 0 (0.0%) |
| 5 to 17 Years | 216 (6.8%) | 76 (2.5%) |
| 18 to 34 Years | 325 (8.8%) | 396 (11.5%) |
| 35 to 64 Years | 807 (11.1%) | 875 (12.6%) |
| 65 to 74 Years | 410 (22.7%) | 370 (18.6%) |
| 75 Years and over | 747 (58.3%) | 820 (46.5%) |
Disability Class by Sex by Age in McLeod County
Disability Class: Hearing Difficulty
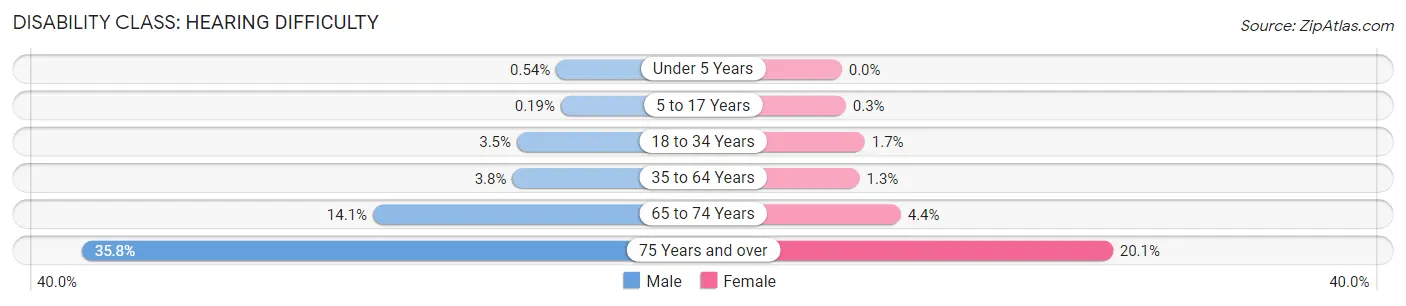
| Age Bracket | Male | Female |
| Under 5 Years | 6 (0.5%) | 0 (0.0%) |
| 5 to 17 Years | 6 (0.2%) | 9 (0.3%) |
| 18 to 34 Years | 127 (3.5%) | 59 (1.7%) |
| 35 to 64 Years | 275 (3.8%) | 92 (1.3%) |
| 65 to 74 Years | 255 (14.1%) | 87 (4.4%) |
| 75 Years and over | 458 (35.7%) | 355 (20.1%) |
Disability Class: Vision Difficulty
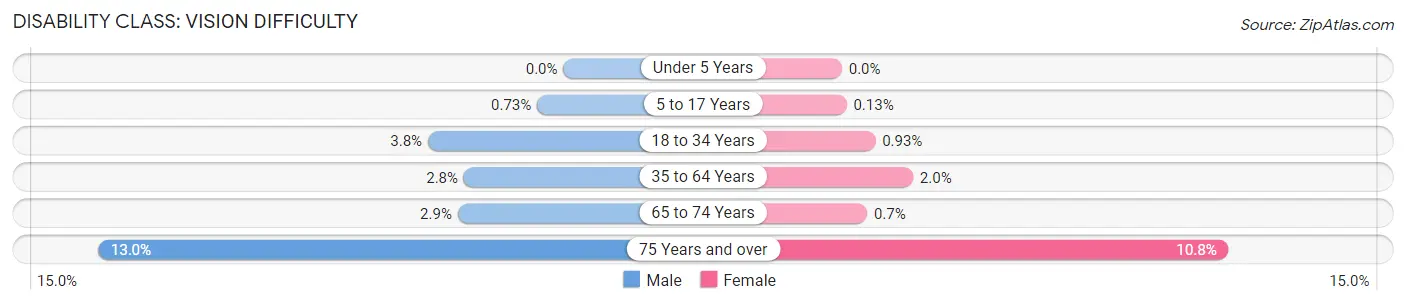
| Age Bracket | Male | Female |
| Under 5 Years | 0 (0.0%) | 0 (0.0%) |
| 5 to 17 Years | 23 (0.7%) | 4 (0.1%) |
| 18 to 34 Years | 139 (3.8%) | 32 (0.9%) |
| 35 to 64 Years | 201 (2.8%) | 138 (2.0%) |
| 65 to 74 Years | 53 (2.9%) | 14 (0.7%) |
| 75 Years and over | 166 (13.0%) | 190 (10.8%) |
Disability Class: Cognitive Difficulty
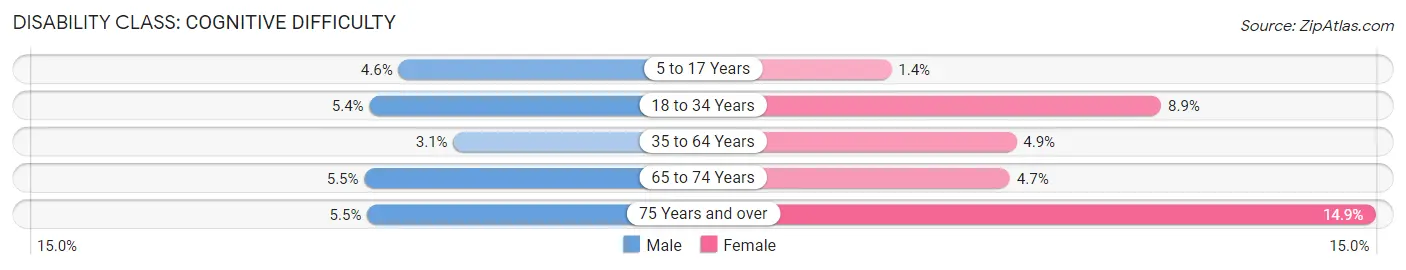
| Age Bracket | Male | Female |
| 5 to 17 Years | 145 (4.6%) | 42 (1.4%) |
| 18 to 34 Years | 199 (5.4%) | 306 (8.9%) |
| 35 to 64 Years | 222 (3.1%) | 338 (4.9%) |
| 65 to 74 Years | 100 (5.5%) | 93 (4.7%) |
| 75 Years and over | 70 (5.5%) | 262 (14.8%) |
Disability Class: Ambulatory Difficulty
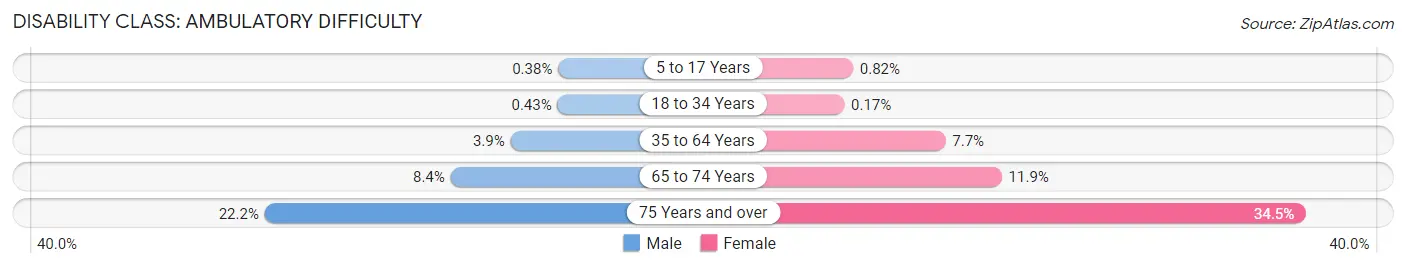
| Age Bracket | Male | Female |
| 5 to 17 Years | 12 (0.4%) | 25 (0.8%) |
| 18 to 34 Years | 16 (0.4%) | 6 (0.2%) |
| 35 to 64 Years | 284 (3.9%) | 535 (7.7%) |
| 65 to 74 Years | 151 (8.4%) | 236 (11.9%) |
| 75 Years and over | 284 (22.2%) | 608 (34.5%) |
Disability Class: Self-Care Difficulty
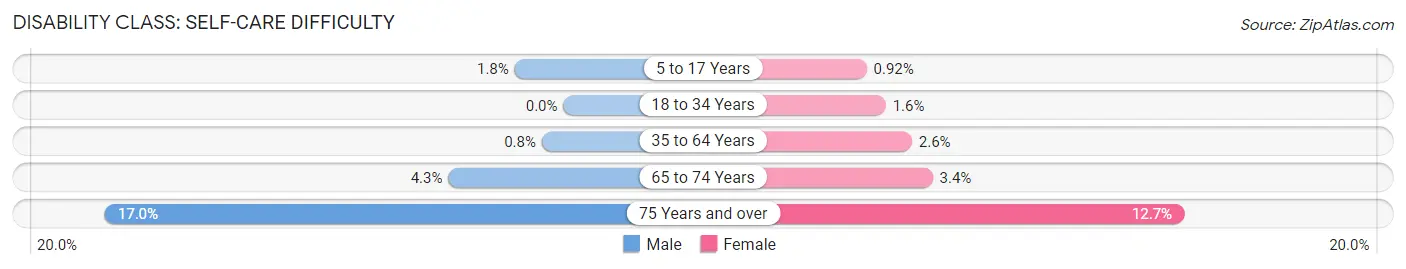
| Age Bracket | Male | Female |
| 5 to 17 Years | 57 (1.8%) | 28 (0.9%) |
| 18 to 34 Years | 0 (0.0%) | 56 (1.6%) |
| 35 to 64 Years | 58 (0.8%) | 181 (2.6%) |
| 65 to 74 Years | 77 (4.3%) | 67 (3.4%) |
| 75 Years and over | 218 (17.0%) | 224 (12.7%) |
Technology Access in McLeod County
Computing Device Access in McLeod County
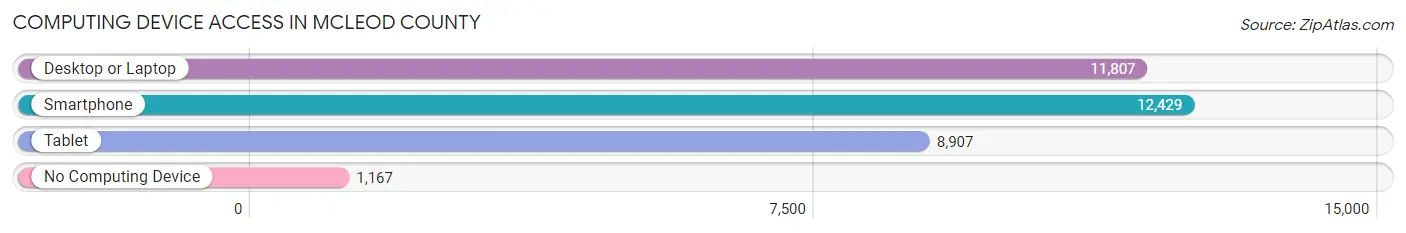
| Device Type | # Households | % Households |
| Desktop or Laptop | 11,807 | 79.6% |
| Smartphone | 12,429 | 83.8% |
| Tablet | 8,907 | 60.1% |
| No Computing Device | 1,167 | 7.9% |
| Total | 14,825 | 100.0% |
Internet Access in McLeod County
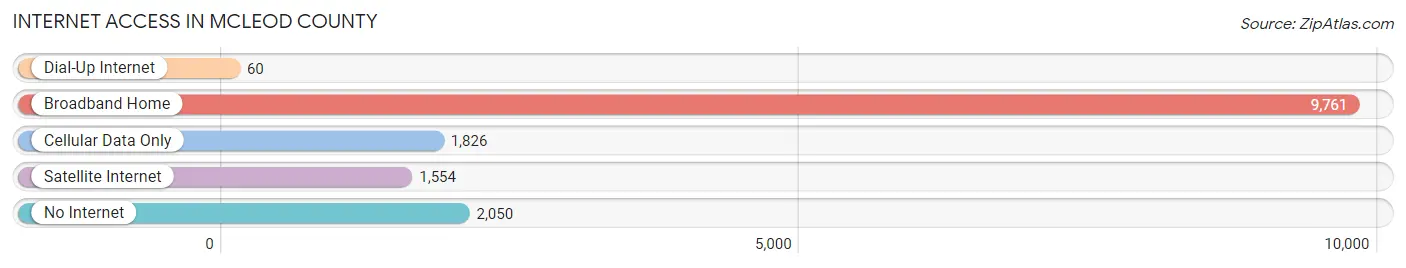
| Internet Type | # Households | % Households |
| Dial-Up Internet | 60 | 0.4% |
| Broadband Home | 9,761 | 65.8% |
| Cellular Data Only | 1,826 | 12.3% |
| Satellite Internet | 1,554 | 10.5% |
| No Internet | 2,050 | 13.8% |
| Total | 14,825 | 100.0% |
McLeod County Summary
Mcleod County is located in the state of Minnesota, in the United States of America. It is part of the Minneapolis-St. Paul metropolitan area and is bordered by Carver, Sibley, Meeker, and Wright counties. The county seat is Glencoe, and the county has a total area of 545 square miles. As of the 2010 census, the population was 36,651.
History
Mcleod County was established in 1856 and was named after Martin McLeod, a prominent early settler in the area. The county was originally part of the Dakota Territory, and was part of the Minnesota Territory when it was established in 1849. The first settlers in the area were mostly of German and Scandinavian descent, and the county was largely agricultural.
Geography
Mcleod County is located in the south-central part of Minnesota, and is bordered by Carver, Sibley, Meeker, and Wright counties. The county has a total area of 545 square miles, and is mostly flat with rolling hills. The county is drained by the Minnesota River, which flows through the county from east to west. The county is also home to several lakes, including Lake Marion, Lake Sarah, and Lake Washington.
Economy
Mcleod County has a diverse economy, with a mix of agriculture, manufacturing, and services. The county is home to several large employers, including the McLeod County Cooperative, the McLeod County Fairgrounds, and the McLeod County Historical Society. Agriculture is a major part of the county's economy, with corn, soybeans, and wheat being the main crops. Manufacturing is also a major part of the economy, with companies such as 3M, Cargill, and General Mills having a presence in the county.
Demographics
As of the 2010 census, the population of Mcleod County was 36,651. The population is mostly white (94.3%), with small percentages of African American (1.3%), Asian (1.2%), and Hispanic (2.2%) residents. The median household income in the county is $60,945, and the median home value is $179,400. The county has a low unemployment rate of 3.2%.
Conclusion
Mcleod County is a diverse and vibrant county in the state of Minnesota. It has a rich history, and a diverse economy that includes agriculture, manufacturing, and services. The county has a population of 36,651, and a median household income of $60,945. The county is home to several large employers, and has a low unemployment rate of 3.2%. Mcleod County is a great place to live, work, and raise a family.
Common Questions
What is the Total Population of McLeod County?
Total Population of McLeod County is 36,727.
What is the Total Male Population of McLeod County?
Total Male Population of McLeod County is 18,448.
What is the Total Female Population of McLeod County?
Total Female Population of McLeod County is 18,279.
What is the Ratio of Males per 100 Females in McLeod County?
There are 100.92 Males per 100 Females in McLeod County.
What is the Ratio of Females per 100 Males in McLeod County?
There are 99.08 Females per 100 Males in McLeod County.
What is the Median Population Age in McLeod County?
Median Population Age in McLeod County is 41.3 Years.
What is the Average Family Size in McLeod County
Average Family Size in McLeod County is 3.1 People.
What is the Average Household Size in McLeod County
Average Household Size in McLeod County is 2.4 People.
What is Per Capita Income in McLeod County?
Per Capita income in McLeod County is $39,361.
What is the Median Family Income in McLeod County?
Median Family Income in McLeod County is $96,492.
What is the Median Household income in McLeod County?
Median Household Income in McLeod County is $73,296.
What is Income or Wage Gap in McLeod County?
Income or Wage Gap in McLeod County is 28.8%.
Women in McLeod County earn 71.2 cents for every dollar earned by a man.
What is Inequality or Gini Index in McLeod County?
Inequality or Gini Index in McLeod County is 0.42.
How Large is the Labor Force in McLeod County?
There are 19,780 People in the Labor Forcein in McLeod County.
What is the Percentage of People in the Labor Force in McLeod County?
66.9% of People are in the Labor Force in McLeod County.
What is the Unemployment Rate in McLeod County?
Unemployment Rate in McLeod County is 3.2%.