Lyon County, MN
Lyon County Map

Lyon County Overview
25,352
TOTAL POPULATION
12,519
MALE POPULATION
12,833
FEMALE POPULATION
97.55
MALES / 100 FEMALES
102.51
FEMALES / 100 MALES
36.8
MEDIAN AGE
3.1
AVG FAMILY SIZE
2.5
AVG HOUSEHOLD SIZE
$35,256
PER CAPITA INCOME
$84,105
AVG FAMILY INCOME
$68,919
AVG HOUSEHOLD INCOME
28.0%
WAGE / INCOME GAP [ % ]
72.0¢/ $1
WAGE / INCOME GAP [ $ ]
$8,703
FAMILY INCOME DEFICIT
0.45
INEQUALITY / GINI INDEX
13,139
LABOR FORCE [ PEOPLE ]
67.2%
PERCENT IN LABOR FORCE
3.0%
UNEMPLOYMENT RATE
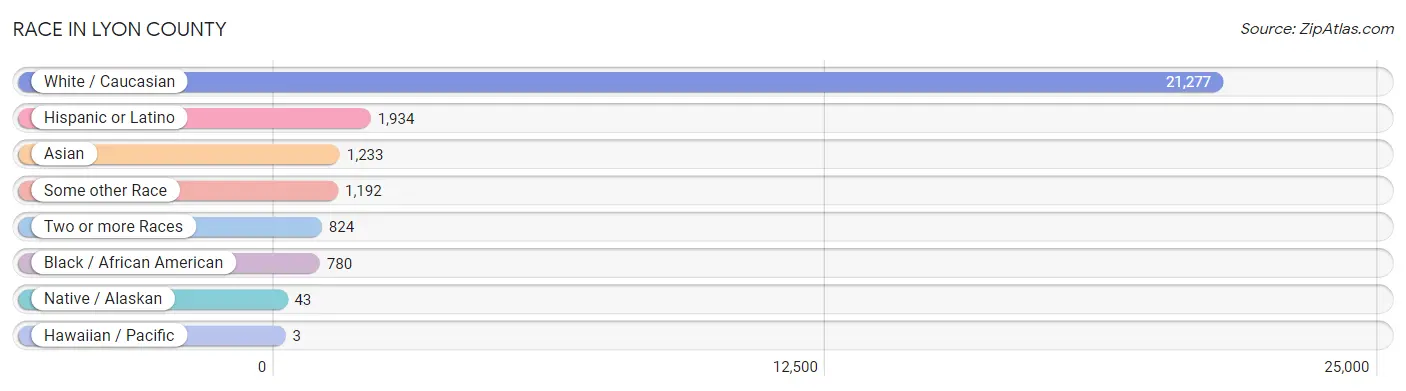
Race in Lyon County
The most populous races in Lyon County are White / Caucasian (21,277 | 83.9%), Hispanic or Latino (1,934 | 7.6%), and Asian (1,233 | 4.9%).
| Race | # Population | % Population |
| Asian | 1,233 | 4.9% |
| Black / African American | 780 | 3.1% |
| Hawaiian / Pacific | 3 | 0.0% |
| Hispanic or Latino | 1,934 | 7.6% |
| Native / Alaskan | 43 | 0.2% |
| White / Caucasian | 21,277 | 83.9% |
| Two or more Races | 824 | 3.3% |
| Some other Race | 1,192 | 4.7% |
| Total | 25,352 | 100.0% |
Ancestry in Lyon County
The most populous ancestries reported in Lyon County are German (8,883 | 35.0%), Norwegian (3,941 | 15.5%), Belgian (2,021 | 8.0%), Irish (1,524 | 6.0%), and Mexican (1,317 | 5.2%), together accounting for 69.8% of all Lyon County residents.

| Ancestry | # Population | % Population |
| African | 101 | 0.4% |
| American | 541 | 2.1% |
| Apache | 6 | 0.0% |
| Arab | 6 | 0.0% |
| Australian | 5 | 0.0% |
| Austrian | 34 | 0.1% |
| Bangladeshi | 497 | 2.0% |
| Belgian | 2,021 | 8.0% |
| Bhutanese | 1 | 0.0% |
| Blackfeet | 1 | 0.0% |
| British | 29 | 0.1% |
| Burmese | 55 | 0.2% |
| Canadian | 6 | 0.0% |
| Central American | 151 | 0.6% |
| Cherokee | 67 | 0.3% |
| Chilean | 3 | 0.0% |
| Chippewa | 54 | 0.2% |
| Croatian | 39 | 0.2% |
| Czech | 177 | 0.7% |
| Czechoslovakian | 25 | 0.1% |
| Danish | 695 | 2.7% |
| Dutch | 749 | 2.9% |
| Eastern European | 21 | 0.1% |
| English | 1,155 | 4.6% |
| Ethiopian | 3 | 0.0% |
| European | 228 | 0.9% |
| Filipino | 9 | 0.0% |
| Finnish | 42 | 0.2% |
| French | 1,126 | 4.4% |
| French American Indian | 30 | 0.1% |
| French Canadian | 116 | 0.5% |
| German | 8,883 | 35.0% |
| German Russian | 3 | 0.0% |
| Guatemalan | 16 | 0.1% |
| Haitian | 3 | 0.0% |
| Hungarian | 37 | 0.2% |
| Icelander | 47 | 0.2% |
| Indian (Asian) | 46 | 0.2% |
| Indonesian | 413 | 1.6% |
| Irish | 1,524 | 6.0% |
| Italian | 151 | 0.6% |
| Jamaican | 8 | 0.0% |
| Japanese | 4 | 0.0% |
| Kenyan | 8 | 0.0% |
| Kiowa | 1 | 0.0% |
| Korean | 30 | 0.1% |
| Lebanese | 6 | 0.0% |
| Liberian | 1 | 0.0% |
| Lithuanian | 16 | 0.1% |
| Luxembourger | 18 | 0.1% |
| Malaysian | 4 | 0.0% |
| Mexican | 1,317 | 5.2% |
| Navajo | 26 | 0.1% |
| New Zealander | 2 | 0.0% |
| Nigerian | 18 | 0.1% |
| Northern European | 4 | 0.0% |
| Norwegian | 3,941 | 15.5% |
| Pakistani | 160 | 0.6% |
| Peruvian | 7 | 0.0% |
| Polish | 749 | 2.9% |
| Portuguese | 1 | 0.0% |
| Puerto Rican | 148 | 0.6% |
| Russian | 79 | 0.3% |
| Salvadoran | 135 | 0.5% |
| Scandinavian | 254 | 1.0% |
| Scotch-Irish | 58 | 0.2% |
| Scottish | 161 | 0.6% |
| Serbian | 20 | 0.1% |
| Sioux | 6 | 0.0% |
| Slovak | 7 | 0.0% |
| Slovene | 2 | 0.0% |
| Somali | 143 | 0.6% |
| South American | 16 | 0.1% |
| South American Indian | 6 | 0.0% |
| Spanish | 6 | 0.0% |
| Sri Lankan | 20 | 0.1% |
| Subsaharan African | 247 | 1.0% |
| Swedish | 943 | 3.7% |
| Swiss | 28 | 0.1% |
| Thai | 116 | 0.5% |
| Ukrainian | 5 | 0.0% |
| Welsh | 91 | 0.4% |
| Yugoslavian | 1 | 0.0% | View All 83 Rows |
Immigrants in Lyon County
The most numerous immigrant groups reported in Lyon County came from Asia (642 | 2.5%), Latin America (637 | 2.5%), Central America (592 | 2.3%), South Eastern Asia (559 | 2.2%), and Africa (359 | 1.4%), together accounting for 11.0% of all Lyon County residents.

| Immigration Origin | # Population | % Population |
| Africa | 359 | 1.4% |
| Asia | 642 | 2.5% |
| Austria | 2 | 0.0% |
| Belgium | 2 | 0.0% |
| Brazil | 24 | 0.1% |
| Canada | 22 | 0.1% |
| Caribbean | 8 | 0.0% |
| Central America | 592 | 2.3% |
| China | 39 | 0.2% |
| Colombia | 6 | 0.0% |
| Eastern Africa | 83 | 0.3% |
| Eastern Asia | 69 | 0.3% |
| Eastern Europe | 8 | 0.0% |
| El Salvador | 48 | 0.2% |
| England | 14 | 0.1% |
| Ethiopia | 3 | 0.0% |
| Europe | 69 | 0.3% |
| France | 25 | 0.1% |
| Germany | 8 | 0.0% |
| Guatemala | 97 | 0.4% |
| Honduras | 272 | 1.1% |
| Hong Kong | 12 | 0.1% |
| India | 1 | 0.0% |
| Indonesia | 2 | 0.0% |
| Italy | 8 | 0.0% |
| Jamaica | 8 | 0.0% |
| Kenya | 43 | 0.2% |
| Korea | 30 | 0.1% |
| Laos | 115 | 0.4% |
| Latin America | 637 | 2.5% |
| Liberia | 1 | 0.0% |
| Lithuania | 5 | 0.0% |
| Mexico | 175 | 0.7% |
| Nigeria | 63 | 0.3% |
| Northern Africa | 6 | 0.0% |
| Northern Europe | 16 | 0.1% |
| Oceania | 6 | 0.0% |
| Pakistan | 13 | 0.1% |
| Peru | 7 | 0.0% |
| Philippines | 22 | 0.1% |
| Russia | 2 | 0.0% |
| Somalia | 37 | 0.2% |
| South America | 37 | 0.2% |
| South Central Asia | 14 | 0.1% |
| South Eastern Asia | 559 | 2.2% |
| Southern Europe | 8 | 0.0% |
| Sweden | 2 | 0.0% |
| Taiwan | 9 | 0.0% |
| Thailand | 198 | 0.8% |
| Vietnam | 2 | 0.0% |
| Western Africa | 64 | 0.3% |
| Western Europe | 37 | 0.2% | View All 52 Rows |
Sex and Age in Lyon County
Sex and Age in Lyon County
The most populous age groups in Lyon County are 10 to 14 Years (1,002 | 8.0%) for men and 10 to 14 Years (1,016 | 7.9%) for women.

| Age Bracket | Male | Female |
| Under 5 Years | 784 (6.3%) | 999 (7.8%) |
| 5 to 9 Years | 1,001 (8.0%) | 734 (5.7%) |
| 10 to 14 Years | 1,002 (8.0%) | 1,016 (7.9%) |
| 15 to 19 Years | 942 (7.5%) | 970 (7.6%) |
| 20 to 24 Years | 823 (6.6%) | 890 (6.9%) |
| 25 to 29 Years | 712 (5.7%) | 633 (4.9%) |
| 30 to 34 Years | 856 (6.8%) | 700 (5.4%) |
| 35 to 39 Years | 676 (5.4%) | 785 (6.1%) |
| 40 to 44 Years | 754 (6.0%) | 729 (5.7%) |
| 45 to 49 Years | 769 (6.1%) | 683 (5.3%) |
| 50 to 54 Years | 705 (5.6%) | 696 (5.4%) |
| 55 to 59 Years | 843 (6.7%) | 789 (6.1%) |
| 60 to 64 Years | 746 (6.0%) | 868 (6.8%) |
| 65 to 69 Years | 649 (5.2%) | 647 (5.0%) |
| 70 to 74 Years | 464 (3.7%) | 555 (4.3%) |
| 75 to 79 Years | 309 (2.5%) | 409 (3.2%) |
| 80 to 84 Years | 246 (2.0%) | 361 (2.8%) |
| 85 Years and over | 238 (1.9%) | 369 (2.9%) |
| Total | 12,519 (100.0%) | 12,833 (100.0%) |
Families and Households in Lyon County
Median Family Size in Lyon County
The median family size in Lyon County is 3.06 persons per family, with single male/father families (421 | 6.6%) accounting for the largest median family size of 3.17 persons per family. On the other hand, single female/mother families (1,007 | 15.9%) represent the smallest median family size with 2.64 persons per family.

| Family Type | # Families | Family Size |
| Married-Couple | 4,923 (77.5%) | 3.13 |
| Single Male/Father | 421 (6.6%) | 3.17 |
| Single Female/Mother | 1,007 (15.9%) | 2.64 |
| Total Families | 6,351 (100.0%) | 3.06 |
Median Household Size in Lyon County
The median household size in Lyon County is 2.45 persons per household, with single male/father households (421 | 4.2%) accounting for the largest median household size of 3.5 persons per household. non-family households (3,573 | 36.0%) represent the smallest median household size with 1.20 persons per household.

| Household Type | # Households | Household Size |
| Married-Couple | 4,923 (49.6%) | 3.16 |
| Single Male/Father | 421 (4.2%) | 3.50 |
| Single Female/Mother | 1,007 (10.2%) | 2.95 |
| Non-family | 3,573 (36.0%) | 1.20 |
| Total Households | 9,924 (100.0%) | 2.45 |
Household Size by Marriage Status in Lyon County
Out of a total of 9,924 households in Lyon County, 6,351 (64.0%) are family households, while 3,573 (36.0%) are nonfamily households. The most numerous type of family households are 2-person households, comprising 3,076, and the most common type of nonfamily households are 1-person households, comprising 3,042.

| Household Size | Family Households | Nonfamily Households |
| 1-Person Households | - | 3,042 (30.6%) |
| 2-Person Households | 3,076 (31.0%) | 438 (4.4%) |
| 3-Person Households | 1,114 (11.2%) | 36 (0.4%) |
| 4-Person Households | 1,159 (11.7%) | 34 (0.3%) |
| 5-Person Households | 635 (6.4%) | 10 (0.1%) |
| 6-Person Households | 219 (2.2%) | 12 (0.1%) |
| 7+ Person Households | 148 (1.5%) | 1 (0.0%) |
| Total | 6,351 (64.0%) | 3,573 (36.0%) |
Female Fertility in Lyon County
Fertility by Age in Lyon County
Average fertility rate in Lyon County is 57.0 births per 1,000 women. Women in the age bracket of 20 to 34 years have the highest fertility rate with 115.0 births per 1,000 women. Women in the age bracket of 20 to 34 years acount for 82.1% of all women with births.

| Age Bracket | Women with Births | Births / 1,000 Women |
| 15 to 19 years | 0 (0.0%) | 0.0 |
| 20 to 34 years | 256 (82.1%) | 115.0 |
| 35 to 50 years | 56 (17.9%) | 24.0 |
| Total | 312 (100.0%) | 57.0 |
Fertility by Age by Marriage Status in Lyon County
79.8% of women with births (312) in Lyon County are married. The highest percentage of unmarried women with births falls into 20 to 34 years age bracket with 24.2% of them unmarried at the time of birth, while the lowest percentage of unmarried women with births belong to 35 to 50 years age bracket with 1.8% of them unmarried.

| Age Bracket | Married | Unmarried |
| 15 to 19 years | 0 (0.0%) | 0 (0.0%) |
| 20 to 34 years | 194 (75.8%) | 62 (24.2%) |
| 35 to 50 years | 55 (98.2%) | 1 (1.8%) |
| Total | 249 (79.8%) | 63 (20.2%) |
Fertility by Education in Lyon County
Average fertility rate in Lyon County is 57.0 births per 1,000 women. Women with the education attainment of college or associate's degree have the highest fertility rate of 72.0 births per 1,000 women, while women with the education attainment of less than high school have the lowest fertility at 17.0 births per 1,000 women. Women with the education attainment of college or associate's degree represent 52.9% of all women with births.

| Educational Attainment | Women with Births | Births / 1,000 Women |
| Less than High School | 15 (4.8%) | 17.0 |
| High School Diploma | 28 (9.0%) | 44.0 |
| College or Associate's Degree | 165 (52.9%) | 72.0 |
| Bachelor's Degree | 81 (26.0%) | 67.0 |
| Graduate Degree | 23 (7.4%) | 47.0 |
| Total | 312 (100.0%) | 57.0 |
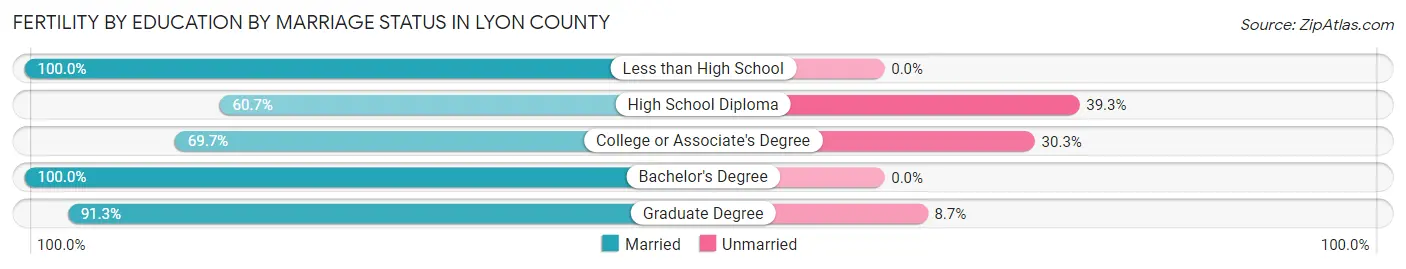
Fertility by Education by Marriage Status in Lyon County
20.2% of women with births in Lyon County are unmarried. Women with the educational attainment of less than high school are most likely to be married with 100.0% of them married at childbirth, while women with the educational attainment of high school diploma are least likely to be married with 39.3% of them unmarried at childbirth.
| Educational Attainment | Married | Unmarried |
| Less than High School | 15 (100.0%) | 0 (0.0%) |
| High School Diploma | 17 (60.7%) | 11 (39.3%) |
| College or Associate's Degree | 115 (69.7%) | 50 (30.3%) |
| Bachelor's Degree | 81 (100.0%) | 0 (0.0%) |
| Graduate Degree | 21 (91.3%) | 2 (8.7%) |
| Total | 249 (79.8%) | 63 (20.2%) |
Income in Lyon County
Income Overview in Lyon County
Per Capita Income in Lyon County is $35,256, while median incomes of families and households are $84,105 and $68,919 respectively.
| Characteristic | Number | Measure |
| Per Capita Income | 25,352 | $35,256 |
| Median Family Income | 6,351 | $84,105 |
| Mean Family Income | 6,351 | $107,627 |
| Median Household Income | 9,924 | $68,919 |
| Mean Household Income | 9,924 | $88,922 |
| Income Deficit | 6,351 | $8,703 |
| Wage / Income Gap (%) | 25,352 | 28.00% |
| Wage / Income Gap ($) | 25,352 | 72.00¢ per $1 |
| Gini / Inequality Index | 25,352 | 0.45 |
Earnings by Sex in Lyon County
Average Earnings in Lyon County are $39,644, $45,942 for men and $33,079 for women, a difference of 28.0%.

| Sex | Number | Average Earnings |
| Male | 7,376 (52.1%) | $45,942 |
| Female | 6,774 (47.9%) | $33,079 |
| Total | 14,150 (100.0%) | $39,644 |
Earnings by Sex by Income Bracket in Lyon County
The most common earnings brackets in Lyon County are $75,000 to $99,999 for men (920 | 12.5%) and $55,000 to $64,999 for women (617 | 9.1%).

| Income | Male | Female |
| $2,499 or less | 280 (3.8%) | 489 (7.2%) |
| $2,500 to $4,999 | 277 (3.8%) | 207 (3.1%) |
| $5,000 to $7,499 | 265 (3.6%) | 371 (5.5%) |
| $7,500 to $9,999 | 240 (3.3%) | 355 (5.2%) |
| $10,000 to $12,499 | 210 (2.9%) | 191 (2.8%) |
| $12,500 to $14,999 | 190 (2.6%) | 170 (2.5%) |
| $15,000 to $17,499 | 94 (1.3%) | 232 (3.4%) |
| $17,500 to $19,999 | 146 (2.0%) | 270 (4.0%) |
| $20,000 to $22,499 | 144 (1.9%) | 210 (3.1%) |
| $22,500 to $24,999 | 153 (2.1%) | 261 (3.8%) |
| $25,000 to $29,999 | 427 (5.8%) | 437 (6.5%) |
| $30,000 to $34,999 | 373 (5.1%) | 456 (6.7%) |
| $35,000 to $39,999 | 308 (4.2%) | 369 (5.4%) |
| $40,000 to $44,999 | 442 (6.0%) | 395 (5.8%) |
| $45,000 to $49,999 | 469 (6.4%) | 431 (6.4%) |
| $50,000 to $54,999 | 289 (3.9%) | 419 (6.2%) |
| $55,000 to $64,999 | 695 (9.4%) | 617 (9.1%) |
| $65,000 to $74,999 | 549 (7.4%) | 249 (3.7%) |
| $75,000 to $99,999 | 920 (12.5%) | 311 (4.6%) |
| $100,000+ | 905 (12.3%) | 334 (4.9%) |
| Total | 7,376 (100.0%) | 6,774 (100.0%) |
Earnings by Sex by Educational Attainment in Lyon County
Average earnings in Lyon County are $53,866 for men and $39,846 for women, a difference of 26.0%. Men with an educational attainment of graduate degree enjoy the highest average annual earnings of $94,844, while those with high school diploma education earn the least with $42,882. Women with an educational attainment of graduate degree earn the most with the average annual earnings of $58,243, while those with high school diploma education have the smallest earnings of $25,000.

| Educational Attainment | Male Income | Female Income |
| Less than High School | $45,230 | $0 |
| High School Diploma | $42,882 | $25,000 |
| College or Associate's Degree | $52,098 | $37,660 |
| Bachelor's Degree | $66,902 | $49,750 |
| Graduate Degree | $94,844 | $58,243 |
| Total | $53,866 | $39,846 |
Family Income in Lyon County
Family Income Brackets in Lyon County
According to the Lyon County family income data, there are 1,423 families falling into the $100,000 to $149,999 income range, which is the most common income bracket and makes up 22.4% of all families. Conversely, the $10,000 to $14,999 income bracket is the least frequent group with only 95 families (1.5%) belonging to this category.

| Income Bracket | # Families | % Families |
| Less than $10,000 | 267 | 4.2% |
| $10,000 to $14,999 | 95 | 1.5% |
| $15,000 to $24,999 | 235 | 3.7% |
| $25,000 to $34,999 | 337 | 5.3% |
| $35,000 to $49,999 | 680 | 10.7% |
| $50,000 to $74,999 | 1,213 | 19.1% |
| $75,000 to $99,999 | 921 | 14.5% |
| $100,000 to $149,999 | 1,423 | 22.4% |
| $150,000 to $199,999 | 654 | 10.3% |
| $200,000+ | 540 | 8.5% |
Family Income by Famaliy Size in Lyon County
4-person families (993 | 15.6%) account for the highest median family income in Lyon County with $125,881 per family, while 2-person families (3,250 | 51.2%) have the highest median income of $35,517 per family member.

| Income Bracket | # Families | Median Income |
| 2-Person Families | 3,250 (51.2%) | $71,034 |
| 3-Person Families | 1,213 (19.1%) | $78,346 |
| 4-Person Families | 993 (15.6%) | $125,881 |
| 5-Person Families | 573 (9.0%) | $107,398 |
| 6-Person Families | 177 (2.8%) | $100,469 |
| 7+ Person Families | 145 (2.3%) | $98,603 |
| Total | 6,351 (100.0%) | $84,105 |
Family Income by Number of Earners in Lyon County
The median family income in Lyon County is $84,105, with families comprising 3+ earners (792) having the highest median family income of $126,700, while families with no earners (768) have the lowest median family income of $48,839, accounting for 12.5% and 12.1% of families, respectively.

| Number of Earners | # Families | Median Income |
| No Earners | 768 (12.1%) | $48,839 |
| 1 Earner | 1,727 (27.2%) | $50,475 |
| 2 Earners | 3,064 (48.2%) | $106,629 |
| 3+ Earners | 792 (12.5%) | $126,700 |
| Total | 6,351 (100.0%) | $84,105 |
Household Income in Lyon County
Household Income Brackets in Lyon County
With 1,856 households falling in the category, the $50,000 to $74,999 income range is the most frequent in Lyon County, accounting for 18.7% of all households. In contrast, only 437 households (4.4%) fall into the $10,000 to $14,999 income bracket, making it the least populous group.

| Income Bracket | # Households | % Households |
| Less than $10,000 | 566 | 5.7% |
| $10,000 to $14,999 | 437 | 4.4% |
| $15,000 to $24,999 | 715 | 7.2% |
| $25,000 to $34,999 | 844 | 8.5% |
| $35,000 to $49,999 | 973 | 9.8% |
| $50,000 to $74,999 | 1,856 | 18.7% |
| $75,000 to $99,999 | 1,419 | 14.3% |
| $100,000 to $149,999 | 1,796 | 18.1% |
| $150,000 to $199,999 | 754 | 7.6% |
| $200,000+ | 566 | 5.7% |
Household Income by Householder Age in Lyon County
The median household income in Lyon County is $68,919, with the highest median household income of $90,976 found in the 45 to 64 years age bracket for the primary householder. A total of 3,375 households (34.0%) fall into this category. Meanwhile, the 15 to 24 years age bracket for the primary householder has the lowest median household income of $27,313, with 585 households (5.9%) in this group.

| Income Bracket | # Households | Median Income |
| 15 to 24 Years | 585 (5.9%) | $27,313 |
| 25 to 44 Years | 3,305 (33.3%) | $79,253 |
| 45 to 64 Years | 3,375 (34.0%) | $90,976 |
| 65+ Years | 2,659 (26.8%) | $47,212 |
| Total | 9,924 (100.0%) | $68,919 |
Poverty in Lyon County
Income Below Poverty by Sex and Age in Lyon County
With 8.9% poverty level for males and 15.8% for females among the residents of Lyon County, 18 to 24 year old males and 18 to 24 year old females are the most vulnerable to poverty, with 188 males (18.0%) and 344 females (36.4%) in their respective age groups living below the poverty level.

| Age Bracket | Male | Female |
| Under 5 Years | 46 (6.2%) | 266 (26.7%) |
| 5 Years | 15 (8.5%) | 7 (6.0%) |
| 6 to 11 Years | 80 (6.3%) | 158 (16.4%) |
| 12 to 14 Years | 14 (2.6%) | 19 (2.9%) |
| 15 Years | 6 (5.3%) | 15 (10.0%) |
| 16 and 17 Years | 63 (17.1%) | 105 (24.4%) |
| 18 to 24 Years | 188 (18.0%) | 344 (36.4%) |
| 25 to 34 Years | 173 (11.2%) | 128 (9.6%) |
| 35 to 44 Years | 39 (2.8%) | 250 (16.5%) |
| 45 to 54 Years | 170 (11.6%) | 146 (10.6%) |
| 55 to 64 Years | 161 (10.1%) | 75 (4.7%) |
| 65 to 74 Years | 75 (6.8%) | 242 (20.6%) |
| 75 Years and over | 51 (6.8%) | 181 (17.5%) |
| Total | 1,081 (8.9%) | 1,936 (15.8%) |
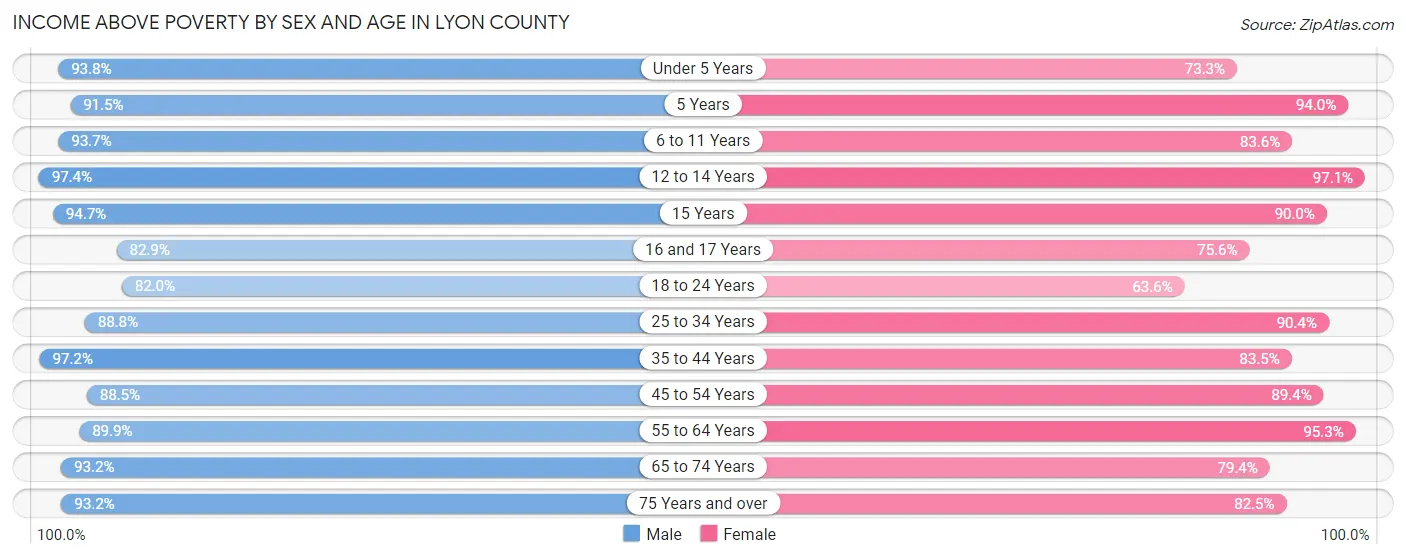
Income Above Poverty by Sex and Age in Lyon County
According to the poverty statistics in Lyon County, males aged 12 to 14 years and females aged 12 to 14 years are the age groups that are most secure financially, with 97.4% of males and 97.1% of females in these age groups living above the poverty line.
| Age Bracket | Male | Female |
| Under 5 Years | 690 (93.8%) | 731 (73.3%) |
| 5 Years | 162 (91.5%) | 109 (94.0%) |
| 6 to 11 Years | 1,198 (93.7%) | 803 (83.6%) |
| 12 to 14 Years | 517 (97.4%) | 634 (97.1%) |
| 15 Years | 108 (94.7%) | 135 (90.0%) |
| 16 and 17 Years | 306 (82.9%) | 326 (75.6%) |
| 18 to 24 Years | 854 (82.0%) | 601 (63.6%) |
| 25 to 34 Years | 1,375 (88.8%) | 1,203 (90.4%) |
| 35 to 44 Years | 1,362 (97.2%) | 1,263 (83.5%) |
| 45 to 54 Years | 1,302 (88.4%) | 1,232 (89.4%) |
| 55 to 64 Years | 1,426 (89.9%) | 1,536 (95.3%) |
| 65 to 74 Years | 1,030 (93.2%) | 933 (79.4%) |
| 75 Years and over | 695 (93.2%) | 853 (82.5%) |
| Total | 11,025 (91.1%) | 10,359 (84.3%) |
Income Below Poverty Among Married-Couple Families in Lyon County
The poverty statistics for married-couple families in Lyon County show that 4.1% or 202 of the total 4,923 families live below the poverty line. Families with 5 or more children have the highest poverty rate of 8.5%, comprising of 4 families. On the other hand, families with no children have the lowest poverty rate of 2.8%, which includes 81 families.

| Children | Above Poverty | Below Poverty |
| No Children | 2,804 (97.2%) | 81 (2.8%) |
| 1 or 2 Children | 1,265 (93.3%) | 91 (6.7%) |
| 3 or 4 Children | 609 (95.9%) | 26 (4.1%) |
| 5 or more Children | 43 (91.5%) | 4 (8.5%) |
| Total | 4,721 (95.9%) | 202 (4.1%) |
Income Below Poverty Among Single-Parent Households in Lyon County
According to the poverty data in Lyon County, 16.9% or 71 single-father households and 31.9% or 321 single-mother households are living below the poverty line. Among single-father households, those with 1 or 2 children have the highest poverty rate, with 38 households (23.7%) experiencing poverty. Likewise, among single-mother households, those with 5 or more children have the highest poverty rate, with 3 households (100.0%) falling below the poverty line.

| Children | Single Father | Single Mother |
| No Children | 33 (16.1%) | 75 (33.6%) |
| 1 or 2 Children | 38 (23.7%) | 224 (37.4%) |
| 3 or 4 Children | 0 (0.0%) | 19 (10.4%) |
| 5 or more Children | 0 (0.0%) | 3 (100.0%) |
| Total | 71 (16.9%) | 321 (31.9%) |
Income Below Poverty Among Married-Couple vs Single-Parent Households in Lyon County
The poverty data for Lyon County shows that 202 of the married-couple family households (4.1%) and 392 of the single-parent households (27.5%) are living below the poverty level. Within the married-couple family households, those with 5 or more children have the highest poverty rate, with 4 households (8.5%) falling below the poverty line. Among the single-parent households, those with 1 or 2 children have the highest poverty rate, with 262 household (34.5%) living below poverty.

| Children | Married-Couple Families | Single-Parent Households |
| No Children | 81 (2.8%) | 108 (25.2%) |
| 1 or 2 Children | 91 (6.7%) | 262 (34.5%) |
| 3 or 4 Children | 26 (4.1%) | 19 (8.6%) |
| 5 or more Children | 4 (8.5%) | 3 (15.8%) |
| Total | 202 (4.1%) | 392 (27.5%) |
Employment Characteristics in Lyon County
Employment by Class of Employer in Lyon County
Among the 12,595 employed individuals in Lyon County, private company employees (8,025 | 63.7%), not-for-profit organizations (1,319 | 10.5%), and self-employed (not incorporated) (996 | 7.9%) make up the most common classes of employment.

| Employer Class | # Employees | % Employees |
| Private Company Employees | 8,025 | 63.7% |
| Self-Employed (Incorporated) | 526 | 4.2% |
| Self-Employed (Not Incorporated) | 996 | 7.9% |
| Not-for-profit Organizations | 1,319 | 10.5% |
| Local Government Employees | 986 | 7.8% |
| State Government Employees | 595 | 4.7% |
| Federal Government Employees | 127 | 1.0% |
| Unpaid Family Workers | 21 | 0.2% |
| Total | 12,595 | 100.0% |
Employment Status by Age in Lyon County
According to the labor force statistics for Lyon County, out of the total population over 16 years of age (19,552), 67.2% or 13,139 individuals are in the labor force, with 3.0% or 394 of them unemployed. The age group with the highest labor force participation rate is 25 to 29 years, with 91.8% or 1,235 individuals in the labor force. Within the labor force, the 16 to 19 years age range has the highest percentage of unemployed individuals, with 7.1% or 58 of them being unemployed.

| Age Bracket | In Labor Force | Unemployed |
| 16 to 19 Years | 814 (49.4%) | 58 (7.1%) |
| 20 to 24 Years | 1,322 (77.2%) | 25 (1.9%) |
| 25 to 29 Years | 1,235 (91.8%) | 37 (3.0%) |
| 30 to 34 Years | 1,399 (89.9%) | 64 (4.6%) |
| 35 to 44 Years | 2,611 (88.7%) | 57 (2.2%) |
| 45 to 54 Years | 2,431 (85.2%) | 17 (0.7%) |
| 55 to 59 Years | 1,417 (86.8%) | 48 (3.4%) |
| 60 to 64 Years | 1,112 (68.9%) | 79 (7.1%) |
| 65 to 74 Years | 634 (27.4%) | 14 (2.2%) |
| 75 Years and over | 172 (8.9%) | 0 (0.0%) |
| Total | 13,139 (67.2%) | 394 (3.0%) |
Employment Status by Educational Attainment in Lyon County
According to labor force statistics for Lyon County, 85.4% of individuals (10,200) out of the total population between 25 and 64 years of age (11,944) are in the labor force, with 3.0% or 306 of them being unemployed. The group with the highest labor force participation rate are those with the educational attainment of bachelor's degree or higher, with 92.9% or 3,524 individuals in the labor force. Within the labor force, individuals with high school diploma education have the highest percentage of unemployment, with 4.2% or 81 of them being unemployed.

| Educational Attainment | In Labor Force | Unemployed |
| Less than High School | 493 (71.1%) | 18 (2.6%) |
| High School Diploma | 1,920 (75.2%) | 107 (4.2%) |
| College / Associate Degree | 4,267 (87.0%) | 132 (2.7%) |
| Bachelor's Degree or higher | 3,524 (92.9%) | 102 (2.7%) |
| Total | 10,200 (85.4%) | 358 (3.0%) |
Employment Occupations by Sex in Lyon County
Management, Business, Science and Arts Occupations
The most common Management, Business, Science and Arts occupations in Lyon County are Management (1,428 | 11.2%), Community & Social Service (1,252 | 9.8%), Education Instruction & Library (841 | 6.6%), Business & Financial (750 | 5.9%), and Health Diagnosing & Treating (715 | 5.6%).

Management, Business, Science and Arts Occupations by Sex
Within the Management, Business, Science and Arts occupations in Lyon County, the most male-oriented occupations are Computers & Mathematics (75.3%), Computers, Engineering & Science (74.2%), and Architecture & Engineering (74.0%), while the most female-oriented occupations are Health Technologists (91.6%), Health Diagnosing & Treating (88.5%), and Education, Arts & Media (82.9%).

| Occupation | Male | Female |
| Management | 1,034 (72.4%) | 394 (27.6%) |
| Business & Financial | 245 (32.7%) | 505 (67.3%) |
| Computers, Engineering & Science | 475 (74.2%) | 165 (25.8%) |
| Computers & Mathematics | 241 (75.3%) | 79 (24.7%) |
| Architecture & Engineering | 154 (74.0%) | 54 (26.0%) |
| Life, Physical & Social Science | 80 (71.4%) | 32 (28.6%) |
| Community & Social Service | 343 (27.4%) | 909 (72.6%) |
| Education, Arts & Media | 30 (17.1%) | 145 (82.9%) |
| Legal Services & Support | 31 (58.5%) | 22 (41.5%) |
| Education Instruction & Library | 164 (19.5%) | 677 (80.5%) |
| Arts, Media & Entertainment | 118 (64.5%) | 65 (35.5%) |
| Health Diagnosing & Treating | 82 (11.5%) | 633 (88.5%) |
| Health Technologists | 35 (8.4%) | 383 (91.6%) |
| Total (Category) | 2,179 (45.5%) | 2,606 (54.5%) |
| Total (Overall) | 6,617 (51.9%) | 6,130 (48.1%) |
Services Occupations
The most common Services occupations in Lyon County are Healthcare Support (635 | 5.0%), Cleaning & Maintenance (540 | 4.2%), Food Preparation & Serving (516 | 4.1%), Personal Care & Service (359 | 2.8%), and Security & Protection (129 | 1.0%).

Services Occupations by Sex
Within the Services occupations in Lyon County, the most male-oriented occupations are Firefighting & Prevention (97.2%), Security & Protection (89.9%), and Law Enforcement (87.1%), while the most female-oriented occupations are Personal Care & Service (89.4%), Food Preparation & Serving (77.3%), and Healthcare Support (70.7%).

| Occupation | Male | Female |
| Healthcare Support | 186 (29.3%) | 449 (70.7%) |
| Security & Protection | 116 (89.9%) | 13 (10.1%) |
| Firefighting & Prevention | 35 (97.2%) | 1 (2.8%) |
| Law Enforcement | 81 (87.1%) | 12 (12.9%) |
| Food Preparation & Serving | 117 (22.7%) | 399 (77.3%) |
| Cleaning & Maintenance | 328 (60.7%) | 212 (39.3%) |
| Personal Care & Service | 38 (10.6%) | 321 (89.4%) |
| Total (Category) | 785 (36.0%) | 1,394 (64.0%) |
| Total (Overall) | 6,617 (51.9%) | 6,130 (48.1%) |
Sales and Office Occupations
The most common Sales and Office occupations in Lyon County are Office & Administration (1,546 | 12.1%), and Sales & Related (1,020 | 8.0%).

Sales and Office Occupations by Sex

| Occupation | Male | Female |
| Sales & Related | 610 (59.8%) | 410 (40.2%) |
| Office & Administration | 423 (27.4%) | 1,123 (72.6%) |
| Total (Category) | 1,033 (40.3%) | 1,533 (59.7%) |
| Total (Overall) | 6,617 (51.9%) | 6,130 (48.1%) |
Natural Resources, Construction and Maintenance Occupations
The most common Natural Resources, Construction and Maintenance occupations in Lyon County are Construction & Extraction (643 | 5.0%), Installation, Maintenance & Repair (383 | 3.0%), and Farming, Fishing & Forestry (193 | 1.5%).

Natural Resources, Construction and Maintenance Occupations by Sex

| Occupation | Male | Female |
| Farming, Fishing & Forestry | 162 (83.9%) | 31 (16.1%) |
| Construction & Extraction | 623 (96.9%) | 20 (3.1%) |
| Installation, Maintenance & Repair | 377 (98.4%) | 6 (1.6%) |
| Total (Category) | 1,162 (95.3%) | 57 (4.7%) |
| Total (Overall) | 6,617 (51.9%) | 6,130 (48.1%) |
Production, Transportation and Moving Occupations
The most common Production, Transportation and Moving occupations in Lyon County are Production (996 | 7.8%), Transportation (501 | 3.9%), and Material Moving (501 | 3.9%).

Production, Transportation and Moving Occupations by Sex

| Occupation | Male | Female |
| Production | 605 (60.7%) | 391 (39.3%) |
| Transportation | 485 (96.8%) | 16 (3.2%) |
| Material Moving | 368 (73.5%) | 133 (26.6%) |
| Total (Category) | 1,458 (73.0%) | 540 (27.0%) |
| Total (Overall) | 6,617 (51.9%) | 6,130 (48.1%) |
Employment Industries by Sex in Lyon County
Employment Industries in Lyon County
The major employment industries in Lyon County include Health Care & Social Assistance (1,871 | 14.7%), Manufacturing (1,550 | 12.2%), Retail Trade (1,518 | 11.9%), Educational Services (1,311 | 10.3%), and Finance & Insurance (1,153 | 9.0%).

Employment Industries by Sex in Lyon County
The Lyon County industries that see more men than women are Mining, Quarrying, & Extraction (100.0%), Construction (92.2%), and Arts, Entertainment & Recreation (85.9%), whereas the industries that tend to have a higher number of women are Enterprise Management (93.2%), Health Care & Social Assistance (85.3%), and Educational Services (75.6%).

| Industry | Male | Female |
| Agriculture, Fishing & Hunting | 664 (72.0%) | 258 (28.0%) |
| Mining, Quarrying, & Extraction | 14 (100.0%) | 0 (0.0%) |
| Construction | 813 (92.2%) | 69 (7.8%) |
| Manufacturing | 1,105 (71.3%) | 445 (28.7%) |
| Wholesale Trade | 249 (73.9%) | 88 (26.1%) |
| Retail Trade | 897 (59.1%) | 621 (40.9%) |
| Transportation & Warehousing | 372 (84.6%) | 68 (15.4%) |
| Utilities | 67 (83.8%) | 13 (16.3%) |
| Information | 45 (53.6%) | 39 (46.4%) |
| Finance & Insurance | 476 (41.3%) | 677 (58.7%) |
| Real Estate, Rental & Leasing | 66 (57.4%) | 49 (42.6%) |
| Professional & Scientific | 137 (47.7%) | 150 (52.3%) |
| Enterprise Management | 4 (6.8%) | 55 (93.2%) |
| Administrative & Support | 173 (50.0%) | 173 (50.0%) |
| Educational Services | 320 (24.4%) | 991 (75.6%) |
| Health Care & Social Assistance | 276 (14.7%) | 1,595 (85.3%) |
| Arts, Entertainment & Recreation | 189 (85.9%) | 31 (14.1%) |
| Accommodation & Food Services | 216 (34.3%) | 414 (65.7%) |
| Public Administration | 253 (59.0%) | 176 (41.0%) |
| Total | 6,617 (51.9%) | 6,130 (48.1%) |
Education in Lyon County
School Enrollment in Lyon County
The most common levels of schooling among the 7,207 students in Lyon County are high school (1,769 | 24.5%), college / undergraduate (1,461 | 20.3%), and middle school (1,460 | 20.3%).

| School Level | # Students | % Students |
| Nursery / Preschool | 604 | 8.4% |
| Kindergarten | 311 | 4.3% |
| Elementary School | 1,442 | 20.0% |
| Middle School | 1,460 | 20.3% |
| High School | 1,769 | 24.5% |
| College / Undergraduate | 1,461 | 20.3% |
| Graduate / Professional | 160 | 2.2% |
| Total | 7,207 | 100.0% |
School Enrollment by Age by Funding Source in Lyon County
Out of a total of 7,207 students who are enrolled in schools in Lyon County, 807 (11.2%) attend a private institution, while the remaining 6,400 (88.8%) are enrolled in public schools. The age group of 3 to 4 year olds has the highest likelihood of being enrolled in private schools, with 159 (32.5% in the age bracket) enrolled. Conversely, the age group of 25 to 34 year olds has the lowest likelihood of being enrolled in a private school, with 258 (100.0% in the age bracket) attending a public institution.

| Age Bracket | Public School | Private School |
| 3 to 4 Year Olds | 331 (67.5%) | 159 (32.5%) |
| 5 to 9 Year Old | 1,398 (82.8%) | 291 (17.2%) |
| 10 to 14 Year Olds | 1,687 (85.5%) | 286 (14.5%) |
| 15 to 17 Year Olds | 1,047 (98.6%) | 15 (1.4%) |
| 18 to 19 Year Olds | 707 (95.8%) | 31 (4.2%) |
| 20 to 24 Year Olds | 824 (98.3%) | 14 (1.7%) |
| 25 to 34 Year Olds | 258 (100.0%) | 0 (0.0%) |
| 35 Years and over | 149 (93.7%) | 10 (6.3%) |
| Total | 6,400 (88.8%) | 807 (11.2%) |
Educational Attainment by Field of Study in Lyon County
Business (971 | 19.9%), education (956 | 19.6%), bio, nature & agricultural (529 | 10.8%), science & technology (402 | 8.2%), and arts & humanities (357 | 7.3%) are the most common fields of study among 4,876 individuals in Lyon County who have obtained a bachelor's degree or higher.

| Field of Study | # Graduates | % Graduates |
| Computers & Mathematics | 198 | 4.1% |
| Bio, Nature & Agricultural | 529 | 10.8% |
| Physical & Health Sciences | 136 | 2.8% |
| Psychology | 236 | 4.8% |
| Social Sciences | 194 | 4.0% |
| Engineering | 201 | 4.1% |
| Multidisciplinary Studies | 3 | 0.1% |
| Science & Technology | 402 | 8.2% |
| Business | 971 | 19.9% |
| Education | 956 | 19.6% |
| Literature & Languages | 221 | 4.5% |
| Liberal Arts & History | 109 | 2.2% |
| Visual & Performing Arts | 201 | 4.1% |
| Communications | 162 | 3.3% |
| Arts & Humanities | 357 | 7.3% |
| Total | 4,876 | 100.0% |
Transportation & Commute in Lyon County
Vehicle Availability by Sex in Lyon County
The most prevalent vehicle ownership categories in Lyon County are males with 2 vehicles (2,688, accounting for 41.7%) and females with 2 vehicles (2,283, making up 46.7%).

| Vehicles Available | Male | Female |
| No Vehicle | 50 (0.8%) | 166 (2.9%) |
| 1 Vehicle | 1,002 (15.5%) | 1,002 (17.4%) |
| 2 Vehicles | 2,688 (41.7%) | 2,283 (39.7%) |
| 3 Vehicles | 1,836 (28.5%) | 1,563 (27.2%) |
| 4 Vehicles | 514 (8.0%) | 472 (8.2%) |
| 5 or more Vehicles | 353 (5.5%) | 267 (4.6%) |
| Total | 6,443 (100.0%) | 5,753 (100.0%) |
Commute Time in Lyon County
The most frequently occuring commute durations in Lyon County are 5 to 9 minutes (3,614 commuters, 31.7%), 10 to 14 minutes (1,968 commuters, 17.2%), and 15 to 19 minutes (1,468 commuters, 12.9%).

| Commute Time | # Commuters | % Commuters |
| Less than 5 Minutes | 1,451 | 12.7% |
| 5 to 9 Minutes | 3,614 | 31.7% |
| 10 to 14 Minutes | 1,968 | 17.2% |
| 15 to 19 Minutes | 1,468 | 12.9% |
| 20 to 24 Minutes | 1,018 | 8.9% |
| 25 to 29 Minutes | 521 | 4.6% |
| 30 to 34 Minutes | 557 | 4.9% |
| 35 to 39 Minutes | 130 | 1.1% |
| 40 to 44 Minutes | 86 | 0.7% |
| 45 to 59 Minutes | 181 | 1.6% |
| 60 to 89 Minutes | 217 | 1.9% |
| 90 or more Minutes | 208 | 1.8% |
Commute Time by Sex in Lyon County
The most common commute times in Lyon County are 5 to 9 minutes (1,870 commuters, 31.3%) for males and 5 to 9 minutes (1,744 commuters, 32.1%) for females.

| Commute Time | Male | Female |
| Less than 5 Minutes | 687 (11.5%) | 764 (14.1%) |
| 5 to 9 Minutes | 1,870 (31.3%) | 1,744 (32.1%) |
| 10 to 14 Minutes | 1,069 (17.9%) | 899 (16.5%) |
| 15 to 19 Minutes | 823 (13.8%) | 645 (11.9%) |
| 20 to 24 Minutes | 481 (8.0%) | 537 (9.9%) |
| 25 to 29 Minutes | 279 (4.7%) | 242 (4.4%) |
| 30 to 34 Minutes | 275 (4.6%) | 282 (5.2%) |
| 35 to 39 Minutes | 44 (0.7%) | 86 (1.6%) |
| 40 to 44 Minutes | 27 (0.4%) | 59 (1.1%) |
| 45 to 59 Minutes | 147 (2.5%) | 34 (0.6%) |
| 60 to 89 Minutes | 143 (2.4%) | 74 (1.4%) |
| 90 or more Minutes | 137 (2.3%) | 71 (1.3%) |
Time of Departure to Work by Sex in Lyon County
The most frequent times of departure to work in Lyon County are 7:30 AM to 7:59 AM (1,084, 18.1%) for males and 7:30 AM to 7:59 AM (1,269, 23.3%) for females.

| Time of Departure | Male | Female |
| 12:00 AM to 4:59 AM | 249 (4.2%) | 99 (1.8%) |
| 5:00 AM to 5:29 AM | 194 (3.2%) | 83 (1.5%) |
| 5:30 AM to 5:59 AM | 222 (3.7%) | 160 (2.9%) |
| 6:00 AM to 6:29 AM | 579 (9.7%) | 192 (3.5%) |
| 6:30 AM to 6:59 AM | 868 (14.5%) | 402 (7.4%) |
| 7:00 AM to 7:29 AM | 1,036 (17.3%) | 1,197 (22.0%) |
| 7:30 AM to 7:59 AM | 1,084 (18.1%) | 1,269 (23.3%) |
| 8:00 AM to 8:29 AM | 649 (10.8%) | 487 (9.0%) |
| 8:30 AM to 8:59 AM | 141 (2.4%) | 318 (5.9%) |
| 9:00 AM to 9:59 AM | 167 (2.8%) | 153 (2.8%) |
| 10:00 AM to 10:59 AM | 82 (1.4%) | 144 (2.6%) |
| 11:00 AM to 11:59 AM | 86 (1.4%) | 71 (1.3%) |
| 12:00 PM to 3:59 PM | 305 (5.1%) | 336 (6.2%) |
| 4:00 PM to 11:59 PM | 320 (5.3%) | 526 (9.7%) |
| Total | 5,982 (100.0%) | 5,437 (100.0%) |
Housing Occupancy in Lyon County
Occupancy by Ownership in Lyon County
Of the total 9,924 dwellings in Lyon County, owner-occupied units account for 6,954 (70.1%), while renter-occupied units make up 2,970 (29.9%).

| Occupancy | # Housing Units | % Housing Units |
| Owner Occupied Housing Units | 6,954 | 70.1% |
| Renter-Occupied Housing Units | 2,970 | 29.9% |
| Total Occupied Housing Units | 9,924 | 100.0% |
Occupancy by Household Size in Lyon County

| Household Size | # Housing Units | % Housing Units |
| 1-Person Household | 3,042 | 30.6% |
| 2-Person Household | 3,514 | 35.4% |
| 3-Person Household | 1,150 | 11.6% |
| 4+ Person Household | 2,218 | 22.4% |
| Total Housing Units | 9,924 | 100.0% |
Occupancy by Ownership by Household Size in Lyon County

| Household Size | Owner-occupied | Renter-occupied |
| 1-Person Household | 1,692 (55.6%) | 1,350 (44.4%) |
| 2-Person Household | 2,665 (75.8%) | 849 (24.2%) |
| 3-Person Household | 880 (76.5%) | 270 (23.5%) |
| 4+ Person Household | 1,717 (77.4%) | 501 (22.6%) |
| Total Housing Units | 6,954 (70.1%) | 2,970 (29.9%) |
Occupancy by Educational Attainment in Lyon County

| Household Size | Owner-occupied | Renter-occupied |
| Less than High School | 304 (53.8%) | 261 (46.2%) |
| High School Diploma | 1,740 (67.6%) | 834 (32.4%) |
| College/Associate Degree | 2,677 (67.8%) | 1,270 (32.2%) |
| Bachelor's Degree or higher | 2,233 (78.7%) | 605 (21.3%) |
Occupancy by Age of Householder in Lyon County

| Age Bracket | # Households | % Households |
| Under 35 Years | 2,221 | 22.4% |
| 35 to 44 Years | 1,669 | 16.8% |
| 45 to 54 Years | 1,616 | 16.3% |
| 55 to 64 Years | 1,759 | 17.7% |
| 65 to 74 Years | 1,422 | 14.3% |
| 75 to 84 Years | 836 | 8.4% |
| 85 Years and Over | 401 | 4.0% |
| Total | 9,924 | 100.0% |
Housing Finances in Lyon County
Median Income by Occupancy in Lyon County

| Occupancy Type | # Households | Median Income |
| Owner-Occupied | 6,954 (70.1%) | $86,292 |
| Renter-Occupied | 2,970 (29.9%) | $34,214 |
| Average | 9,924 (100.0%) | $68,919 |
Occupancy by Householder Income Bracket in Lyon County

| Income Bracket | Owner-occupied | Renter-occupied |
| Less than $5,000 | 108 (1.5%) | 215 (7.2%) |
| $5,000 to $9,999 | 69 (1.0%) | 174 (5.9%) |
| $10,000 to $14,999 | 97 (1.4%) | 343 (11.6%) |
| $15,000 to $19,999 | 163 (2.3%) | 267 (9.0%) |
| $20,000 to $24,999 | 120 (1.7%) | 160 (5.4%) |
| $25,000 to $34,999 | 499 (7.2%) | 348 (11.7%) |
| $35,000 to $49,999 | 719 (10.3%) | 255 (8.6%) |
| $50,000 to $74,999 | 1,213 (17.4%) | 644 (21.7%) |
| $75,000 to $99,999 | 1,068 (15.4%) | 348 (11.7%) |
| $100,000 to $149,999 | 1,623 (23.3%) | 175 (5.9%) |
| $150,000 or more | 1,275 (18.3%) | 41 (1.4%) |
| Total | 6,954 (100.0%) | 2,970 (100.0%) |
Monthly Housing Cost Tiers in Lyon County

| Monthly Cost | Owner-occupied | Renter-occupied |
| Less than $300 | 235 (3.4%) | 223 (7.5%) |
| $300 to $499 | 1,141 (16.4%) | 252 (8.5%) |
| $500 to $799 | 1,719 (24.7%) | 1,117 (37.6%) |
| $800 to $999 | 803 (11.6%) | 480 (16.2%) |
| $1,000 to $1,499 | 1,556 (22.4%) | 510 (17.2%) |
| $1,500 to $1,999 | 859 (12.3%) | 159 (5.3%) |
| $2,000 to $2,499 | 415 (6.0%) | 53 (1.8%) |
| $2,500 to $2,999 | 149 (2.1%) | 11 (0.4%) |
| $3,000 or more | 77 (1.1%) | 26 (0.9%) |
| Total | 6,954 (100.0%) | 2,970 (100.0%) |
Physical Housing Characteristics in Lyon County
Housing Structures in Lyon County

| Structure Type | # Housing Units | % Housing Units |
| Single Unit, Detached | 7,336 | 73.9% |
| Single Unit, Attached | 259 | 2.6% |
| 2 Unit Apartments | 195 | 2.0% |
| 3 or 4 Unit Apartments | 531 | 5.3% |
| 5 to 9 Unit Apartments | 329 | 3.3% |
| 10 or more Apartments | 1,088 | 11.0% |
| Mobile Home / Other | 186 | 1.9% |
| Total | 9,924 | 100.0% |
Housing Structures by Occupancy in Lyon County

| Structure Type | Owner-occupied | Renter-occupied |
| Single Unit, Detached | 6,604 (90.0%) | 732 (10.0%) |
| Single Unit, Attached | 101 (39.0%) | 158 (61.0%) |
| 2 Unit Apartments | 23 (11.8%) | 172 (88.2%) |
| 3 or 4 Unit Apartments | 59 (11.1%) | 472 (88.9%) |
| 5 to 9 Unit Apartments | 3 (0.9%) | 326 (99.1%) |
| 10 or more Apartments | 22 (2.0%) | 1,066 (98.0%) |
| Mobile Home / Other | 142 (76.3%) | 44 (23.7%) |
| Total | 6,954 (70.1%) | 2,970 (29.9%) |
Housing Structures by Number of Rooms in Lyon County

| Number of Rooms | Owner-occupied | Renter-occupied |
| 1 Room | 5 (0.1%) | 39 (1.3%) |
| 2 or 3 Rooms | 120 (1.7%) | 982 (33.1%) |
| 4 or 5 Rooms | 1,130 (16.3%) | 1,137 (38.3%) |
| 6 or 7 Rooms | 2,382 (34.3%) | 414 (13.9%) |
| 8 or more Rooms | 3,317 (47.7%) | 398 (13.4%) |
| Total | 6,954 (100.0%) | 2,970 (100.0%) |
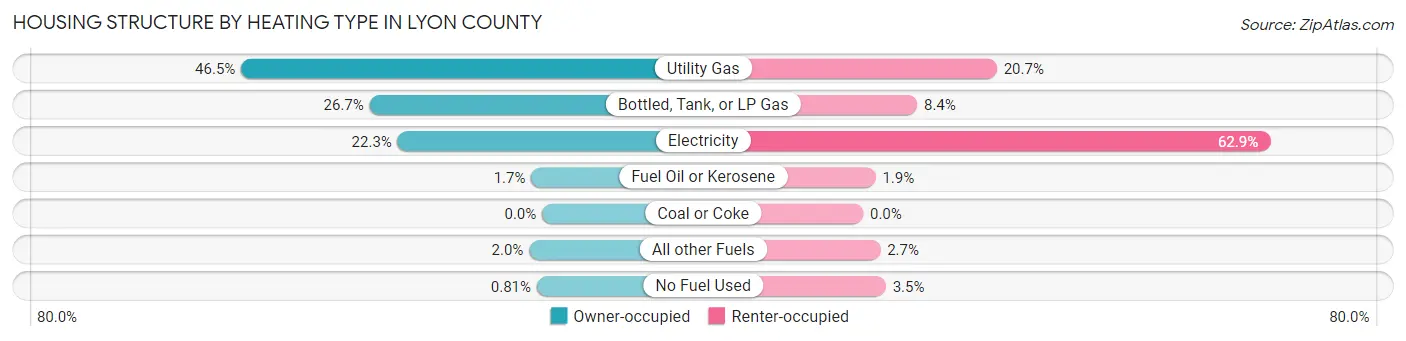
Housing Structure by Heating Type in Lyon County
| Heating Type | Owner-occupied | Renter-occupied |
| Utility Gas | 3,235 (46.5%) | 614 (20.7%) |
| Bottled, Tank, or LP Gas | 1,855 (26.7%) | 248 (8.4%) |
| Electricity | 1,553 (22.3%) | 1,868 (62.9%) |
| Fuel Oil or Kerosene | 116 (1.7%) | 57 (1.9%) |
| Coal or Coke | 0 (0.0%) | 0 (0.0%) |
| All other Fuels | 139 (2.0%) | 79 (2.7%) |
| No Fuel Used | 56 (0.8%) | 104 (3.5%) |
| Total | 6,954 (100.0%) | 2,970 (100.0%) |
Household Vehicle Usage in Lyon County

| Vehicles per Household | Owner-occupied | Renter-occupied |
| No Vehicle | 77 (1.1%) | 647 (21.8%) |
| 1 Vehicle | 1,592 (22.9%) | 1,513 (50.9%) |
| 2 Vehicles | 2,953 (42.5%) | 649 (21.8%) |
| 3 or more Vehicles | 2,332 (33.5%) | 161 (5.4%) |
| Total | 6,954 (100.0%) | 2,970 (100.0%) |
Real Estate & Mortgages in Lyon County
Real Estate and Mortgage Overview in Lyon County
| Characteristic | Without Mortgage | With Mortgage |
| Housing Units | 3,326 | 3,628 |
| Median Property Value | $160,900 | $196,100 |
| Median Household Income | $72,955 | $840 |
| Monthly Housing Costs | $552 | $75 |
| Real Estate Taxes | $1,712 | $70 |
Property Value by Mortgage Status in Lyon County

| Property Value | Without Mortgage | With Mortgage |
| Less than $50,000 | 354 (10.6%) | 150 (4.1%) |
| $50,000 to $99,999 | 458 (13.8%) | 471 (13.0%) |
| $100,000 to $299,999 | 1,954 (58.8%) | 2,398 (66.1%) |
| $300,000 to $499,999 | 420 (12.6%) | 496 (13.7%) |
| $500,000 to $749,999 | 80 (2.4%) | 93 (2.6%) |
| $750,000 to $999,999 | 33 (1.0%) | 8 (0.2%) |
| $1,000,000 or more | 27 (0.8%) | 12 (0.3%) |
| Total | 3,326 (100.0%) | 3,628 (100.0%) |
Household Income by Mortgage Status in Lyon County

| Household Income | Without Mortgage | With Mortgage |
| Less than $10,000 | 165 (5.0%) | 67 (1.8%) |
| $10,000 to $24,999 | 315 (9.5%) | 12 (0.3%) |
| $25,000 to $34,999 | 305 (9.2%) | 65 (1.8%) |
| $35,000 to $49,999 | 402 (12.1%) | 194 (5.3%) |
| $50,000 to $74,999 | 539 (16.2%) | 317 (8.7%) |
| $75,000 to $99,999 | 518 (15.6%) | 674 (18.6%) |
| $100,000 to $149,999 | 647 (19.5%) | 550 (15.2%) |
| $150,000 or more | 435 (13.1%) | 976 (26.9%) |
| Total | 3,326 (100.0%) | 3,628 (100.0%) |
Property Value to Household Income Ratio in Lyon County

| Value-to-Income Ratio | Without Mortgage | With Mortgage |
| Less than 2.0x | 1,401 (42.1%) | 100,088 (2,758.8%) |
| 2.0x to 2.9x | 636 (19.1%) | 1,965 (54.2%) |
| 3.0x to 3.9x | 519 (15.6%) | 849 (23.4%) |
| 4.0x or more | 747 (22.5%) | 362 (10.0%) |
| Total | 3,326 (100.0%) | 3,628 (100.0%) |
Real Estate Taxes by Mortgage Status in Lyon County

| Property Taxes | Without Mortgage | With Mortgage |
| Less than $800 | 549 (16.5%) | 0 (0.0%) |
| $800 to $1,499 | 838 (25.2%) | 434 (12.0%) |
| $800 to $1,499 | 1,817 (54.6%) | 940 (25.9%) |
| Total | 3,326 (100.0%) | 3,628 (100.0%) |
Health & Disability in Lyon County
Health Insurance Coverage by Age in Lyon County

| Age Bracket | With Coverage | Without Coverage |
| Under 6 Years | 1,985 (95.4%) | 95 (4.6%) |
| 6 to 18 Years | 4,634 (93.6%) | 317 (6.4%) |
| 19 to 25 Years | 2,096 (89.7%) | 240 (10.3%) |
| 26 to 34 Years | 2,341 (87.7%) | 327 (12.3%) |
| 35 to 44 Years | 2,650 (91.0%) | 263 (9.0%) |
| 45 to 54 Years | 2,720 (95.4%) | 130 (4.6%) |
| 55 to 64 Years | 2,977 (93.1%) | 221 (6.9%) |
| 65 to 74 Years | 2,277 (99.9%) | 3 (0.1%) |
| 75 Years and older | 1,775 (99.7%) | 5 (0.3%) |
| Total | 23,455 (93.6%) | 1,601 (6.4%) |
Health Insurance Coverage by Citizenship Status in Lyon County

| Citizenship Status | With Coverage | Without Coverage |
| Native Born | 1,985 (95.4%) | 95 (4.6%) |
| Foreign Born, Citizen | 4,634 (93.6%) | 317 (6.4%) |
| Foreign Born, not a Citizen | 2,096 (89.7%) | 240 (10.3%) |
Health Insurance Coverage by Household Income in Lyon County

| Household Income | With Coverage | Without Coverage |
| Under $25,000 | 2,078 (85.4%) | 356 (14.6%) |
| $25,000 to $49,999 | 3,287 (90.0%) | 366 (10.0%) |
| $50,000 to $74,999 | 4,467 (96.0%) | 184 (4.0%) |
| $75,000 to $99,999 | 3,349 (89.4%) | 397 (10.6%) |
| $100,000 and over | 9,534 (97.5%) | 247 (2.5%) |
Public vs Private Health Insurance Coverage by Age in Lyon County

| Age Bracket | Public Insurance | Private Insurance |
| Under 6 | 932 (44.8%) | 1,215 (58.4%) |
| 6 to 18 Years | 1,440 (29.1%) | 3,601 (72.7%) |
| 19 to 25 Years | 514 (22.0%) | 1,715 (73.4%) |
| 25 to 34 Years | 502 (18.8%) | 1,896 (71.1%) |
| 35 to 44 Years | 555 (19.1%) | 2,236 (76.8%) |
| 45 to 54 Years | 542 (19.0%) | 2,279 (80.0%) |
| 55 to 64 Years | 640 (20.0%) | 2,496 (78.0%) |
| 65 to 74 Years | 2,176 (95.4%) | 1,307 (57.3%) |
| 75 Years and over | 1,774 (99.7%) | 1,407 (79.0%) |
| Total | 9,075 (36.2%) | 18,152 (72.5%) |
Disability Status by Sex by Age in Lyon County

| Age Bracket | Male | Female |
| Under 5 Years | 13 (1.7%) | 0 (0.0%) |
| 5 to 17 Years | 112 (4.5%) | 146 (6.3%) |
| 18 to 34 Years | 196 (6.9%) | 145 (5.6%) |
| 35 to 64 Years | 527 (11.8%) | 574 (12.8%) |
| 65 to 74 Years | 223 (20.2%) | 341 (29.0%) |
| 75 Years and over | 378 (50.7%) | 399 (38.6%) |
Disability Class by Sex by Age in Lyon County
Disability Class: Hearing Difficulty

| Age Bracket | Male | Female |
| Under 5 Years | 13 (1.7%) | 0 (0.0%) |
| 5 to 17 Years | 0 (0.0%) | 77 (3.3%) |
| 18 to 34 Years | 11 (0.4%) | 5 (0.2%) |
| 35 to 64 Years | 165 (3.7%) | 95 (2.1%) |
| 65 to 74 Years | 116 (10.5%) | 50 (4.3%) |
| 75 Years and over | 180 (24.1%) | 118 (11.4%) |
Disability Class: Vision Difficulty

| Age Bracket | Male | Female |
| Under 5 Years | 0 (0.0%) | 0 (0.0%) |
| 5 to 17 Years | 7 (0.3%) | 16 (0.7%) |
| 18 to 34 Years | 61 (2.2%) | 4 (0.2%) |
| 35 to 64 Years | 55 (1.2%) | 166 (3.7%) |
| 65 to 74 Years | 22 (2.0%) | 36 (3.1%) |
| 75 Years and over | 60 (8.0%) | 32 (3.1%) |
Disability Class: Cognitive Difficulty

| Age Bracket | Male | Female |
| 5 to 17 Years | 88 (3.5%) | 50 (2.1%) |
| 18 to 34 Years | 123 (4.3%) | 91 (3.5%) |
| 35 to 64 Years | 252 (5.7%) | 191 (4.2%) |
| 65 to 74 Years | 56 (5.1%) | 90 (7.7%) |
| 75 Years and over | 55 (7.4%) | 70 (6.8%) |
Disability Class: Ambulatory Difficulty

| Age Bracket | Male | Female |
| 5 to 17 Years | 4 (0.2%) | 0 (0.0%) |
| 18 to 34 Years | 31 (1.1%) | 38 (1.5%) |
| 35 to 64 Years | 216 (4.8%) | 314 (7.0%) |
| 65 to 74 Years | 123 (11.1%) | 265 (22.6%) |
| 75 Years and over | 231 (31.0%) | 296 (28.6%) |
Disability Class: Self-Care Difficulty

| Age Bracket | Male | Female |
| 5 to 17 Years | 8 (0.3%) | 30 (1.3%) |
| 18 to 34 Years | 19 (0.7%) | 25 (1.0%) |
| 35 to 64 Years | 124 (2.8%) | 148 (3.3%) |
| 65 to 74 Years | 34 (3.1%) | 122 (10.4%) |
| 75 Years and over | 73 (9.8%) | 134 (13.0%) |
Technology Access in Lyon County
Computing Device Access in Lyon County

| Device Type | # Households | % Households |
| Desktop or Laptop | 7,868 | 79.3% |
| Smartphone | 8,570 | 86.4% |
| Tablet | 6,455 | 65.0% |
| No Computing Device | 607 | 6.1% |
| Total | 9,924 | 100.0% |
Internet Access in Lyon County

| Internet Type | # Households | % Households |
| Dial-Up Internet | 21 | 0.2% |
| Broadband Home | 6,720 | 67.7% |
| Cellular Data Only | 1,098 | 11.1% |
| Satellite Internet | 1,105 | 11.1% |
| No Internet | 1,129 | 11.4% |
| Total | 9,924 | 100.0% |
Lyon County Summary
Lyon County is located in the southwestern corner of Minnesota, and is bordered by Lincoln, Pipestone, Murray, Cottonwood, Redwood, and Yellow Medicine counties. The county seat is Marshall, and the county was named after General Nathaniel Lyon, who was killed in the Civil War. The county has a total area of 745 square miles, and a population of 25,857 as of the 2010 census.
Geography
Lyon County is located in the southwestern corner of Minnesota, and is bordered by Lincoln, Pipestone, Murray, Cottonwood, Redwood, and Yellow Medicine counties. The county has a total area of 745 square miles, and is mostly flat, with some rolling hills in the northern part of the county. The county is drained by the Redwood River, which flows through the county from north to south. The county is also home to several small lakes, including Lake Shetek, which is the largest lake in the county.
Climate
Lyon County has a humid continental climate, with cold winters and hot summers. The average annual temperature is around 45 degrees Fahrenheit, and the average annual precipitation is around 28 inches.
Demographics
As of the 2010 census, there were 25,857 people, 10,072 households, and 6,845 families residing in the county. The population density was 35 people per square mile. The racial makeup of the county was 94.3% White, 0.7% African American, 0.4% Native American, 0.4% Asian, 0.1% Pacific Islander, 2.7% from other races, and 1.4% from two or more races. Hispanic or Latino of any race were 5.2% of the population.
Economy
Lyon County is largely an agricultural county, with the majority of the population employed in farming and related industries. The county is also home to several manufacturing companies, including a large turkey processing plant. The county also has a growing tourism industry, with several lakes and parks in the area.
Education
Lyon County is served by several school districts, including Marshall Public Schools, Russell-Tyler-Ruthton Public Schools, and Tracy Area Public Schools. The county is also home to Southwest Minnesota State University, a public university located in Marshall.
Conclusion
Lyon County is a rural county located in the southwestern corner of Minnesota. The county is largely agricultural, with a growing tourism industry. The county is served by several school districts, and is home to Southwest Minnesota State University. The county has a population of 25,857 as of the 2010 census, and has a humid continental climate with cold winters and hot summers.
Common Questions
What is the Total Population of Lyon County?
Total Population of Lyon County is 25,352.
What is the Total Male Population of Lyon County?
Total Male Population of Lyon County is 12,519.
What is the Total Female Population of Lyon County?
Total Female Population of Lyon County is 12,833.
What is the Ratio of Males per 100 Females in Lyon County?
There are 97.55 Males per 100 Females in Lyon County.
What is the Ratio of Females per 100 Males in Lyon County?
There are 102.51 Females per 100 Males in Lyon County.
What is the Median Population Age in Lyon County?
Median Population Age in Lyon County is 36.8 Years.
What is the Average Family Size in Lyon County
Average Family Size in Lyon County is 3.1 People.
What is the Average Household Size in Lyon County
Average Household Size in Lyon County is 2.5 People.
What is Per Capita Income in Lyon County?
Per Capita income in Lyon County is $35,256.
What is the Median Family Income in Lyon County?
Median Family Income in Lyon County is $84,105.
What is the Median Household income in Lyon County?
Median Household Income in Lyon County is $68,919.
What is Income or Wage Gap in Lyon County?
Income or Wage Gap in Lyon County is 28.0%.
Women in Lyon County earn 72.0 cents for every dollar earned by a man.
What is Family Income Deficit in Lyon County?
Family Income Deficit in Lyon County is $8,703.
Families that are below poverty line in Lyon County earn $8,703 less on average than the poverty threshold level.
What is Inequality or Gini Index in Lyon County?
Inequality or Gini Index in Lyon County is 0.45.
How Large is the Labor Force in Lyon County?
There are 13,139 People in the Labor Forcein in Lyon County.
What is the Percentage of People in the Labor Force in Lyon County?
67.2% of People are in the Labor Force in Lyon County.
What is the Unemployment Rate in Lyon County?
Unemployment Rate in Lyon County is 3.0%.