Le Sueur County, MN
Le Sueur County Map

Le Sueur County Overview
28,795
TOTAL POPULATION
14,650
MALE POPULATION
14,145
FEMALE POPULATION
103.57
MALES / 100 FEMALES
96.55
FEMALES / 100 MALES
41.3
MEDIAN AGE
3.0
AVG FAMILY SIZE
2.5
AVG HOUSEHOLD SIZE
$41,400
PER CAPITA INCOME
$103,116
AVG FAMILY INCOME
$87,180
AVG HOUSEHOLD INCOME
35.6%
WAGE / INCOME GAP [ % ]
64.4¢/ $1
WAGE / INCOME GAP [ $ ]
$8,100
FAMILY INCOME DEFICIT
0.40
INEQUALITY / GINI INDEX
16,012
LABOR FORCE [ PEOPLE ]
70.0%
PERCENT IN LABOR FORCE
3.6%
UNEMPLOYMENT RATE
Le Sueur County Area Codes
Race in Le Sueur County
The most populous races in Le Sueur County are White / Caucasian (26,683 | 92.7%), Hispanic or Latino (1,916 | 6.7%), and Some other Race (844 | 2.9%).

| Race | # Population | % Population |
| Asian | 125 | 0.4% |
| Black / African American | 251 | 0.9% |
| Hawaiian / Pacific | 0 | 0.0% |
| Hispanic or Latino | 1,916 | 6.7% |
| Native / Alaskan | 126 | 0.4% |
| White / Caucasian | 26,683 | 92.7% |
| Two or more Races | 766 | 2.7% |
| Some other Race | 844 | 2.9% |
| Total | 28,795 | 100.0% |
Ancestry in Le Sueur County
The most populous ancestries reported in Le Sueur County are German (12,008 | 41.7%), Irish (3,606 | 12.5%), Czech (2,444 | 8.5%), Norwegian (2,224 | 7.7%), and Mexican (1,355 | 4.7%), together accounting for 75.1% of all Le Sueur County residents.

| Ancestry | # Population | % Population |
| American | 924 | 3.2% |
| Arab | 34 | 0.1% |
| Armenian | 4 | 0.0% |
| Austrian | 74 | 0.3% |
| Bangladeshi | 6 | 0.0% |
| Belgian | 29 | 0.1% |
| Bhutanese | 35 | 0.1% |
| Blackfeet | 22 | 0.1% |
| British | 113 | 0.4% |
| Burmese | 41 | 0.1% |
| Canadian | 6 | 0.0% |
| Celtic | 14 | 0.1% |
| Central American | 276 | 1.0% |
| Cherokee | 3 | 0.0% |
| Chippewa | 57 | 0.2% |
| Colombian | 45 | 0.2% |
| Croatian | 2 | 0.0% |
| Cuban | 6 | 0.0% |
| Czech | 2,444 | 8.5% |
| Czechoslovakian | 240 | 0.8% |
| Danish | 369 | 1.3% |
| Dominican | 59 | 0.2% |
| Dutch | 380 | 1.3% |
| Eastern European | 78 | 0.3% |
| Ecuadorian | 108 | 0.4% |
| English | 1,347 | 4.7% |
| European | 411 | 1.4% |
| Filipino | 5 | 0.0% |
| Finnish | 114 | 0.4% |
| French | 651 | 2.3% |
| French American Indian | 4 | 0.0% |
| French Canadian | 142 | 0.5% |
| German | 12,008 | 41.7% |
| German Russian | 36 | 0.1% |
| Greek | 14 | 0.1% |
| Guatemalan | 2 | 0.0% |
| Haitian | 16 | 0.1% |
| Honduran | 10 | 0.0% |
| Hungarian | 15 | 0.1% |
| Icelander | 15 | 0.1% |
| Indian (Asian) | 10 | 0.0% |
| Irish | 3,606 | 12.5% |
| Italian | 264 | 0.9% |
| Korean | 48 | 0.2% |
| Latvian | 5 | 0.0% |
| Lebanese | 34 | 0.1% |
| Lithuanian | 5 | 0.0% |
| Luxembourger | 29 | 0.1% |
| Malaysian | 9 | 0.0% |
| Mexican | 1,355 | 4.7% |
| Mexican American Indian | 11 | 0.0% |
| Native Hawaiian | 5 | 0.0% |
| Nicaraguan | 5 | 0.0% |
| Northern European | 44 | 0.2% |
| Norwegian | 2,224 | 7.7% |
| Pakistani | 8 | 0.0% |
| Pennsylvania German | 5 | 0.0% |
| Polish | 812 | 2.8% |
| Puerto Rican | 48 | 0.2% |
| Romanian | 5 | 0.0% |
| Russian | 41 | 0.1% |
| Salvadoran | 259 | 0.9% |
| Scandinavian | 228 | 0.8% |
| Scotch-Irish | 41 | 0.1% |
| Scottish | 157 | 0.5% |
| Serbian | 3 | 0.0% |
| Sioux | 41 | 0.1% |
| Slavic | 3 | 0.0% |
| Slovak | 9 | 0.0% |
| Slovene | 25 | 0.1% |
| Somali | 14 | 0.1% |
| South American | 153 | 0.5% |
| Spaniard | 12 | 0.0% |
| Spanish | 1 | 0.0% |
| Sri Lankan | 5 | 0.0% |
| Subsaharan African | 14 | 0.1% |
| Swedish | 1,275 | 4.4% |
| Swiss | 94 | 0.3% |
| Thai | 113 | 0.4% |
| Ukrainian | 56 | 0.2% |
| Welsh | 99 | 0.3% | View All 81 Rows |
Immigrants in Le Sueur County
The most numerous immigrant groups reported in Le Sueur County came from Latin America (556 | 1.9%), Central America (498 | 1.7%), Mexico (483 | 1.7%), Asia (113 | 0.4%), and Europe (83 | 0.3%), together accounting for 6.0% of all Le Sueur County residents.

| Immigration Origin | # Population | % Population |
| Africa | 22 | 0.1% |
| Asia | 113 | 0.4% |
| Canada | 40 | 0.1% |
| Caribbean | 3 | 0.0% |
| Central America | 498 | 1.7% |
| China | 2 | 0.0% |
| Colombia | 6 | 0.0% |
| Cuba | 3 | 0.0% |
| Czechoslovakia | 5 | 0.0% |
| Denmark | 44 | 0.2% |
| Eastern Africa | 14 | 0.1% |
| Eastern Asia | 36 | 0.1% |
| Eastern Europe | 23 | 0.1% |
| Ecuador | 49 | 0.2% |
| England | 6 | 0.0% |
| Europe | 83 | 0.3% |
| Germany | 10 | 0.0% |
| Honduras | 10 | 0.0% |
| India | 37 | 0.1% |
| Korea | 34 | 0.1% |
| Laos | 5 | 0.0% |
| Latin America | 556 | 1.9% |
| Malaysia | 2 | 0.0% |
| Mexico | 483 | 1.7% |
| Nicaragua | 5 | 0.0% |
| Nigeria | 8 | 0.0% |
| Northern Europe | 50 | 0.2% |
| Philippines | 30 | 0.1% |
| Romania | 2 | 0.0% |
| Somalia | 14 | 0.1% |
| South America | 55 | 0.2% |
| South Central Asia | 37 | 0.1% |
| South Eastern Asia | 40 | 0.1% |
| Ukraine | 16 | 0.1% |
| Vietnam | 3 | 0.0% |
| Western Africa | 8 | 0.0% |
| Western Europe | 10 | 0.0% | View All 37 Rows |
Sex and Age in Le Sueur County
Sex and Age in Le Sueur County
The most populous age groups in Le Sueur County are 10 to 14 Years (1,129 | 7.7%) for men and 55 to 59 Years (1,064 | 7.5%) for women.
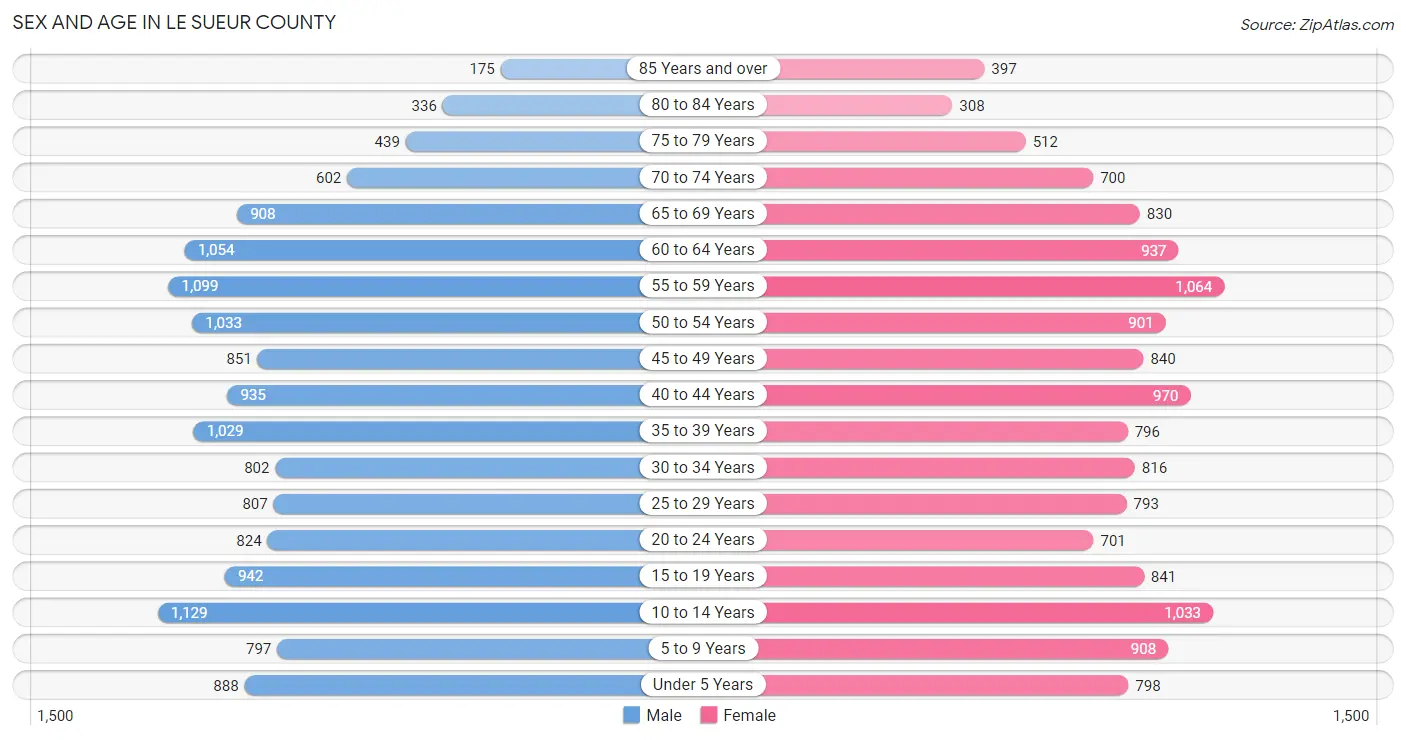
| Age Bracket | Male | Female |
| Under 5 Years | 888 (6.1%) | 798 (5.6%) |
| 5 to 9 Years | 797 (5.4%) | 908 (6.4%) |
| 10 to 14 Years | 1,129 (7.7%) | 1,033 (7.3%) |
| 15 to 19 Years | 942 (6.4%) | 841 (5.9%) |
| 20 to 24 Years | 824 (5.6%) | 701 (5.0%) |
| 25 to 29 Years | 807 (5.5%) | 793 (5.6%) |
| 30 to 34 Years | 802 (5.5%) | 816 (5.8%) |
| 35 to 39 Years | 1,029 (7.0%) | 796 (5.6%) |
| 40 to 44 Years | 935 (6.4%) | 970 (6.9%) |
| 45 to 49 Years | 851 (5.8%) | 840 (5.9%) |
| 50 to 54 Years | 1,033 (7.0%) | 901 (6.4%) |
| 55 to 59 Years | 1,099 (7.5%) | 1,064 (7.5%) |
| 60 to 64 Years | 1,054 (7.2%) | 937 (6.6%) |
| 65 to 69 Years | 908 (6.2%) | 830 (5.9%) |
| 70 to 74 Years | 602 (4.1%) | 700 (5.0%) |
| 75 to 79 Years | 439 (3.0%) | 512 (3.6%) |
| 80 to 84 Years | 336 (2.3%) | 308 (2.2%) |
| 85 Years and over | 175 (1.2%) | 397 (2.8%) |
| Total | 14,650 (100.0%) | 14,145 (100.0%) |
Families and Households in Le Sueur County
Median Family Size in Le Sueur County
The median family size in Le Sueur County is 2.95 persons per family, with married-couple families (6,401 | 79.9%) accounting for the largest median family size of 3.02 persons per family. On the other hand, single male/father families (636 | 7.9%) represent the smallest median family size with 2.44 persons per family.

| Family Type | # Families | Family Size |
| Married-Couple | 6,401 (79.9%) | 3.02 |
| Single Male/Father | 636 (7.9%) | 2.44 |
| Single Female/Mother | 975 (12.2%) | 2.85 |
| Total Families | 8,012 (100.0%) | 2.95 |
Median Household Size in Le Sueur County
The median household size in Le Sueur County is 2.50 persons per household, with single female/mother households (975 | 8.6%) accounting for the largest median household size of 3.18 persons per household. non-family households (3,328 | 29.3%) represent the smallest median household size with 1.21 persons per household.

| Household Type | # Households | Household Size |
| Married-Couple | 6,401 (56.5%) | 3.04 |
| Single Male/Father | 636 (5.6%) | 2.85 |
| Single Female/Mother | 975 (8.6%) | 3.18 |
| Non-family | 3,328 (29.3%) | 1.21 |
| Total Households | 11,340 (100.0%) | 2.50 |
Household Size by Marriage Status in Le Sueur County
Out of a total of 11,340 households in Le Sueur County, 8,012 (70.7%) are family households, while 3,328 (29.3%) are nonfamily households. The most numerous type of family households are 2-person households, comprising 3,685, and the most common type of nonfamily households are 1-person households, comprising 2,742.

| Household Size | Family Households | Nonfamily Households |
| 1-Person Households | - | 2,742 (24.2%) |
| 2-Person Households | 3,685 (32.5%) | 527 (4.6%) |
| 3-Person Households | 1,548 (13.7%) | 35 (0.3%) |
| 4-Person Households | 1,623 (14.3%) | 24 (0.2%) |
| 5-Person Households | 860 (7.6%) | 0 (0.0%) |
| 6-Person Households | 170 (1.5%) | 0 (0.0%) |
| 7+ Person Households | 126 (1.1%) | 0 (0.0%) |
| Total | 8,012 (70.7%) | 3,328 (29.3%) |
Female Fertility in Le Sueur County
Fertility by Age in Le Sueur County
Average fertility rate in Le Sueur County is 71.0 births per 1,000 women. Women in the age bracket of 20 to 34 years have the highest fertility rate with 123.0 births per 1,000 women. Women in the age bracket of 20 to 34 years acount for 67.9% of all women with births.

| Age Bracket | Women with Births | Births / 1,000 Women |
| 15 to 19 years | 15 (3.6%) | 18.0 |
| 20 to 34 years | 284 (67.9%) | 123.0 |
| 35 to 50 years | 119 (28.5%) | 43.0 |
| Total | 418 (100.0%) | 71.0 |
Fertility by Age by Marriage Status in Le Sueur County
67.0% of women with births (418) in Le Sueur County are married. The highest percentage of unmarried women with births falls into 15 to 19 years age bracket with 100.0% of them unmarried at the time of birth, while the lowest percentage of unmarried women with births belong to 20 to 34 years age bracket with 23.2% of them unmarried.

| Age Bracket | Married | Unmarried |
| 15 to 19 years | 0 (0.0%) | 15 (100.0%) |
| 20 to 34 years | 218 (76.8%) | 66 (23.2%) |
| 35 to 50 years | 62 (52.1%) | 57 (47.9%) |
| Total | 280 (67.0%) | 138 (33.0%) |
Fertility by Education in Le Sueur County
Average fertility rate in Le Sueur County is 71.0 births per 1,000 women. Women with the education attainment of high school diploma have the highest fertility rate of 91.0 births per 1,000 women, while women with the education attainment of less than high school have the lowest fertility at 16.0 births per 1,000 women. Women with the education attainment of college or associate's degree represent 37.3% of all women with births.

| Educational Attainment | Women with Births | Births / 1,000 Women |
| Less than High School | 14 (3.4%) | 16.0 |
| High School Diploma | 110 (26.3%) | 91.0 |
| College or Associate's Degree | 156 (37.3%) | 71.0 |
| Bachelor's Degree | 104 (24.9%) | 85.0 |
| Graduate Degree | 34 (8.1%) | 87.0 |
| Total | 418 (100.0%) | 71.0 |
Fertility by Education by Marriage Status in Le Sueur County
33.0% of women with births in Le Sueur County are unmarried. Women with the educational attainment of graduate degree are most likely to be married with 100.0% of them married at childbirth, while women with the educational attainment of less than high school are least likely to be married with 100.0% of them unmarried at childbirth.

| Educational Attainment | Married | Unmarried |
| Less than High School | 0 (0.0%) | 14 (100.0%) |
| High School Diploma | 32 (29.1%) | 78 (70.9%) |
| College or Associate's Degree | 118 (75.6%) | 38 (24.4%) |
| Bachelor's Degree | 96 (92.3%) | 8 (7.7%) |
| Graduate Degree | 34 (100.0%) | 0 (0.0%) |
| Total | 280 (67.0%) | 138 (33.0%) |
Income in Le Sueur County
Income Overview in Le Sueur County
Per Capita Income in Le Sueur County is $41,400, while median incomes of families and households are $103,116 and $87,180 respectively.
| Characteristic | Number | Measure |
| Per Capita Income | 28,795 | $41,400 |
| Median Family Income | 8,012 | $103,116 |
| Mean Family Income | 8,012 | $118,944 |
| Median Household Income | 11,340 | $87,180 |
| Mean Household Income | 11,340 | $103,386 |
| Income Deficit | 8,012 | $8,100 |
| Wage / Income Gap (%) | 28,795 | 35.62% |
| Wage / Income Gap ($) | 28,795 | 64.38¢ per $1 |
| Gini / Inequality Index | 28,795 | 0.40 |
Earnings by Sex in Le Sueur County
Average Earnings in Le Sueur County are $46,159, $56,383 for men and $36,298 for women, a difference of 35.6%.

| Sex | Number | Average Earnings |
| Male | 9,136 (53.4%) | $56,383 |
| Female | 7,958 (46.6%) | $36,298 |
| Total | 17,094 (100.0%) | $46,159 |
Earnings by Sex by Income Bracket in Le Sueur County
The most common earnings brackets in Le Sueur County are $75,000 to $99,999 for men (1,505 | 16.5%) and $75,000 to $99,999 for women (660 | 8.3%).

| Income | Male | Female |
| $2,499 or less | 381 (4.2%) | 313 (3.9%) |
| $2,500 to $4,999 | 275 (3.0%) | 349 (4.4%) |
| $5,000 to $7,499 | 316 (3.5%) | 343 (4.3%) |
| $7,500 to $9,999 | 91 (1.0%) | 243 (3.0%) |
| $10,000 to $12,499 | 125 (1.4%) | 337 (4.2%) |
| $12,500 to $14,999 | 92 (1.0%) | 246 (3.1%) |
| $15,000 to $17,499 | 142 (1.5%) | 200 (2.5%) |
| $17,500 to $19,999 | 131 (1.4%) | 217 (2.7%) |
| $20,000 to $22,499 | 146 (1.6%) | 223 (2.8%) |
| $22,500 to $24,999 | 157 (1.7%) | 188 (2.4%) |
| $25,000 to $29,999 | 358 (3.9%) | 657 (8.3%) |
| $30,000 to $34,999 | 294 (3.2%) | 541 (6.8%) |
| $35,000 to $39,999 | 365 (4.0%) | 550 (6.9%) |
| $40,000 to $44,999 | 570 (6.2%) | 391 (4.9%) |
| $45,000 to $49,999 | 595 (6.5%) | 452 (5.7%) |
| $50,000 to $54,999 | 348 (3.8%) | 480 (6.0%) |
| $55,000 to $64,999 | 1,184 (13.0%) | 657 (8.3%) |
| $65,000 to $74,999 | 793 (8.7%) | 439 (5.5%) |
| $75,000 to $99,999 | 1,505 (16.5%) | 660 (8.3%) |
| $100,000+ | 1,268 (13.9%) | 472 (5.9%) |
| Total | 9,136 (100.0%) | 7,958 (100.0%) |
Earnings by Sex by Educational Attainment in Le Sueur County
Average earnings in Le Sueur County are $60,822 for men and $40,343 for women, a difference of 33.7%. Men with an educational attainment of graduate degree enjoy the highest average annual earnings of $90,625, while those with less than high school education earn the least with $41,815. Women with an educational attainment of graduate degree earn the most with the average annual earnings of $75,096, while those with less than high school education have the smallest earnings of $28,942.

| Educational Attainment | Male Income | Female Income |
| Less than High School | $41,815 | $28,942 |
| High School Diploma | $55,893 | $30,839 |
| College or Associate's Degree | $64,531 | $39,572 |
| Bachelor's Degree | $80,216 | $57,269 |
| Graduate Degree | $90,625 | $75,096 |
| Total | $60,822 | $40,343 |
Family Income in Le Sueur County
Family Income Brackets in Le Sueur County
According to the Le Sueur County family income data, there are 2,283 families falling into the $100,000 to $149,999 income range, which is the most common income bracket and makes up 28.5% of all families. Conversely, the $10,000 to $14,999 income bracket is the least frequent group with only 64 families (0.8%) belonging to this category.

| Income Bracket | # Families | % Families |
| Less than $10,000 | 184 | 2.3% |
| $10,000 to $14,999 | 64 | 0.8% |
| $15,000 to $24,999 | 192 | 2.4% |
| $25,000 to $34,999 | 369 | 4.6% |
| $35,000 to $49,999 | 529 | 6.6% |
| $50,000 to $74,999 | 1,122 | 14.0% |
| $75,000 to $99,999 | 1,378 | 17.2% |
| $100,000 to $149,999 | 2,283 | 28.5% |
| $150,000 to $199,999 | 1,002 | 12.5% |
| $200,000+ | 889 | 11.1% |
Family Income by Famaliy Size in Le Sueur County
7+ person families (121 | 1.5%) account for the highest median family income in Le Sueur County with $165,136 per family, while 2-person families (3,935 | 49.1%) have the highest median income of $45,296 per family member.

| Income Bracket | # Families | Median Income |
| 2-Person Families | 3,935 (49.1%) | $90,591 |
| 3-Person Families | 1,622 (20.2%) | $95,217 |
| 4-Person Families | 1,367 (17.1%) | $132,276 |
| 5-Person Families | 845 (10.5%) | $114,792 |
| 6-Person Families | 122 (1.5%) | $108,472 |
| 7+ Person Families | 121 (1.5%) | $165,136 |
| Total | 8,012 (100.0%) | $103,116 |
Family Income by Number of Earners in Le Sueur County
The median family income in Le Sueur County is $103,116, with families comprising 3+ earners (1,296) having the highest median family income of $143,977, while families with 1 earner (2,000) have the lowest median family income of $55,445, accounting for 16.2% and 25.0% of families, respectively.

| Number of Earners | # Families | Median Income |
| No Earners | 1,019 (12.7%) | $62,390 |
| 1 Earner | 2,000 (25.0%) | $55,445 |
| 2 Earners | 3,697 (46.1%) | $119,072 |
| 3+ Earners | 1,296 (16.2%) | $143,977 |
| Total | 8,012 (100.0%) | $103,116 |
Household Income in Le Sueur County
Household Income Brackets in Le Sueur County
With 2,654 households falling in the category, the $100,000 to $149,999 income range is the most frequent in Le Sueur County, accounting for 23.4% of all households. In contrast, only 204 households (1.8%) fall into the $10,000 to $14,999 income bracket, making it the least populous group.

| Income Bracket | # Households | % Households |
| Less than $10,000 | 284 | 2.5% |
| $10,000 to $14,999 | 204 | 1.8% |
| $15,000 to $24,999 | 703 | 6.2% |
| $25,000 to $34,999 | 658 | 5.8% |
| $35,000 to $49,999 | 1,111 | 9.8% |
| $50,000 to $74,999 | 1,882 | 16.6% |
| $75,000 to $99,999 | 1,735 | 15.3% |
| $100,000 to $149,999 | 2,654 | 23.4% |
| $150,000 to $199,999 | 1,123 | 9.9% |
| $200,000+ | 987 | 8.7% |
Household Income by Householder Age in Le Sueur County
The median household income in Le Sueur County is $87,180, with the highest median household income of $103,651 found in the 45 to 64 years age bracket for the primary householder. A total of 4,269 households (37.7%) fall into this category. Meanwhile, the 15 to 24 years age bracket for the primary householder has the lowest median household income of $49,890, with 351 households (3.1%) in this group.

| Income Bracket | # Households | Median Income |
| 15 to 24 Years | 351 (3.1%) | $49,890 |
| 25 to 44 Years | 3,488 (30.8%) | $102,672 |
| 45 to 64 Years | 4,269 (37.7%) | $103,651 |
| 65+ Years | 3,232 (28.5%) | $57,537 |
| Total | 11,340 (100.0%) | $87,180 |
Poverty in Le Sueur County
Income Below Poverty by Sex and Age in Le Sueur County
With 5.9% poverty level for males and 9.0% for females among the residents of Le Sueur County, 12 to 14 year old males and 6 to 11 year old females are the most vulnerable to poverty, with 93 males (13.9%) and 188 females (17.3%) in their respective age groups living below the poverty level.

| Age Bracket | Male | Female |
| Under 5 Years | 63 (7.4%) | 96 (12.2%) |
| 5 Years | 0 (0.0%) | 9 (4.5%) |
| 6 to 11 Years | 46 (4.4%) | 188 (17.3%) |
| 12 to 14 Years | 93 (13.9%) | 73 (11.4%) |
| 15 Years | 1 (0.6%) | 2 (1.1%) |
| 16 and 17 Years | 52 (11.8%) | 8 (2.2%) |
| 18 to 24 Years | 67 (5.9%) | 104 (10.5%) |
| 25 to 34 Years | 77 (4.8%) | 211 (13.1%) |
| 35 to 44 Years | 129 (6.6%) | 159 (9.0%) |
| 45 to 54 Years | 102 (5.4%) | 117 (6.7%) |
| 55 to 64 Years | 101 (4.7%) | 95 (4.8%) |
| 65 to 74 Years | 63 (4.2%) | 78 (5.1%) |
| 75 Years and over | 65 (6.9%) | 124 (11.1%) |
| Total | 859 (5.9%) | 1,264 (9.0%) |
Income Above Poverty by Sex and Age in Le Sueur County
According to the poverty statistics in Le Sueur County, males aged 5 years and females aged 15 years are the age groups that are most secure financially, with 100.0% of males and 98.9% of females in these age groups living above the poverty line.

| Age Bracket | Male | Female |
| Under 5 Years | 783 (92.5%) | 691 (87.8%) |
| 5 Years | 170 (100.0%) | 191 (95.5%) |
| 6 to 11 Years | 987 (95.6%) | 896 (82.7%) |
| 12 to 14 Years | 575 (86.1%) | 565 (88.6%) |
| 15 Years | 177 (99.4%) | 187 (98.9%) |
| 16 and 17 Years | 390 (88.2%) | 353 (97.8%) |
| 18 to 24 Years | 1,072 (94.1%) | 888 (89.5%) |
| 25 to 34 Years | 1,532 (95.2%) | 1,398 (86.9%) |
| 35 to 44 Years | 1,835 (93.4%) | 1,607 (91.0%) |
| 45 to 54 Years | 1,773 (94.6%) | 1,624 (93.3%) |
| 55 to 64 Years | 2,047 (95.3%) | 1,906 (95.3%) |
| 65 to 74 Years | 1,431 (95.8%) | 1,444 (94.9%) |
| 75 Years and over | 876 (93.1%) | 992 (88.9%) |
| Total | 13,648 (94.1%) | 12,742 (91.0%) |
Income Below Poverty Among Married-Couple Families in Le Sueur County
The poverty statistics for married-couple families in Le Sueur County show that 1.8% or 117 of the total 6,401 families live below the poverty line. Families with no children have the highest poverty rate of 2.6%, comprising of 104 families. On the other hand, families with 5 or more children have the lowest poverty rate of 0.0%, which includes 0 families.

| Children | Above Poverty | Below Poverty |
| No Children | 3,867 (97.4%) | 104 (2.6%) |
| 1 or 2 Children | 1,666 (99.4%) | 10 (0.6%) |
| 3 or 4 Children | 689 (99.6%) | 3 (0.4%) |
| 5 or more Children | 62 (100.0%) | 0 (0.0%) |
| Total | 6,284 (98.2%) | 117 (1.8%) |
Income Below Poverty Among Single-Parent Households in Le Sueur County
According to the poverty data in Le Sueur County, 9.4% or 60 single-father households and 28.7% or 280 single-mother households are living below the poverty line. Among single-father households, those with 1 or 2 children have the highest poverty rate, with 33 households (10.6%) experiencing poverty. Likewise, among single-mother households, those with 5 or more children have the highest poverty rate, with 3 households (100.0%) falling below the poverty line.

| Children | Single Father | Single Mother |
| No Children | 22 (8.0%) | 6 (2.5%) |
| 1 or 2 Children | 33 (10.6%) | 193 (31.4%) |
| 3 or 4 Children | 5 (10.2%) | 78 (63.4%) |
| 5 or more Children | 0 (0.0%) | 3 (100.0%) |
| Total | 60 (9.4%) | 280 (28.7%) |
Income Below Poverty Among Married-Couple vs Single-Parent Households in Le Sueur County
The poverty data for Le Sueur County shows that 117 of the married-couple family households (1.8%) and 340 of the single-parent households (21.1%) are living below the poverty level. Within the married-couple family households, those with no children have the highest poverty rate, with 104 households (2.6%) falling below the poverty line. Among the single-parent households, those with 5 or more children have the highest poverty rate, with 3 household (100.0%) living below poverty.

| Children | Married-Couple Families | Single-Parent Households |
| No Children | 104 (2.6%) | 28 (5.5%) |
| 1 or 2 Children | 10 (0.6%) | 226 (24.4%) |
| 3 or 4 Children | 3 (0.4%) | 83 (48.3%) |
| 5 or more Children | 0 (0.0%) | 3 (100.0%) |
| Total | 117 (1.8%) | 340 (21.1%) |
Employment Characteristics in Le Sueur County
Employment by Class of Employer in Le Sueur County
Among the 15,133 employed individuals in Le Sueur County, private company employees (10,057 | 66.5%), local government employees (1,388 | 9.2%), and not-for-profit organizations (1,186 | 7.8%) make up the most common classes of employment.

| Employer Class | # Employees | % Employees |
| Private Company Employees | 10,057 | 66.5% |
| Self-Employed (Incorporated) | 752 | 5.0% |
| Self-Employed (Not Incorporated) | 1,116 | 7.4% |
| Not-for-profit Organizations | 1,186 | 7.8% |
| Local Government Employees | 1,388 | 9.2% |
| State Government Employees | 435 | 2.9% |
| Federal Government Employees | 160 | 1.1% |
| Unpaid Family Workers | 39 | 0.3% |
| Total | 15,133 | 100.0% |
Employment Status by Age in Le Sueur County
According to the labor force statistics for Le Sueur County, out of the total population over 16 years of age (22,875), 70.0% or 16,012 individuals are in the labor force, with 3.6% or 576 of them unemployed. The age group with the highest labor force participation rate is 30 to 34 years, with 94.1% or 1,523 individuals in the labor force. Within the labor force, the 16 to 19 years age range has the highest percentage of unemployed individuals, with 12.2% or 97 of them being unemployed.

| Age Bracket | In Labor Force | Unemployed |
| 16 to 19 Years | 796 (56.2%) | 97 (12.2%) |
| 20 to 24 Years | 1,319 (86.5%) | 115 (8.7%) |
| 25 to 29 Years | 1,496 (93.5%) | 51 (3.4%) |
| 30 to 34 Years | 1,523 (94.1%) | 37 (2.4%) |
| 35 to 44 Years | 3,342 (89.6%) | 80 (2.4%) |
| 45 to 54 Years | 3,288 (90.7%) | 99 (3.0%) |
| 55 to 59 Years | 1,797 (83.1%) | 49 (2.7%) |
| 60 to 64 Years | 1,495 (75.1%) | 28 (1.9%) |
| 65 to 74 Years | 760 (25.0%) | 15 (2.0%) |
| 75 Years and over | 204 (9.4%) | 8 (3.9%) |
| Total | 16,012 (70.0%) | 576 (3.6%) |
Employment Status by Educational Attainment in Le Sueur County
According to labor force statistics for Le Sueur County, 87.9% of individuals (12,945) out of the total population between 25 and 64 years of age (14,727) are in the labor force, with 2.6% or 337 of them being unemployed. The group with the highest labor force participation rate are those with the educational attainment of bachelor's degree or higher, with 91.1% or 3,468 individuals in the labor force. Within the labor force, individuals with less than high school education have the highest percentage of unemployment, with 4.0% or 25 of them being unemployed.

| Educational Attainment | In Labor Force | Unemployed |
| Less than High School | 623 (83.6%) | 30 (4.0%) |
| High School Diploma | 3,835 (84.5%) | 168 (3.7%) |
| College / Associate Degree | 5,010 (88.9%) | 141 (2.5%) |
| Bachelor's Degree or higher | 3,468 (91.1%) | 53 (1.4%) |
| Total | 12,945 (87.9%) | 383 (2.6%) |
Employment Occupations by Sex in Le Sueur County
Management, Business, Science and Arts Occupations
The most common Management, Business, Science and Arts occupations in Le Sueur County are Management (2,057 | 13.3%), Community & Social Service (1,373 | 8.9%), Health Diagnosing & Treating (893 | 5.8%), Education Instruction & Library (861 | 5.6%), and Health Technologists (584 | 3.8%).

Management, Business, Science and Arts Occupations by Sex
Within the Management, Business, Science and Arts occupations in Le Sueur County, the most male-oriented occupations are Architecture & Engineering (93.4%), Management (70.3%), and Computers, Engineering & Science (63.0%), while the most female-oriented occupations are Legal Services & Support (84.4%), Health Diagnosing & Treating (82.8%), and Life, Physical & Social Science (80.0%).

| Occupation | Male | Female |
| Management | 1,446 (70.3%) | 611 (29.7%) |
| Business & Financial | 231 (41.2%) | 330 (58.8%) |
| Computers, Engineering & Science | 360 (63.0%) | 211 (36.9%) |
| Computers & Mathematics | 133 (49.4%) | 136 (50.6%) |
| Architecture & Engineering | 212 (93.4%) | 15 (6.6%) |
| Life, Physical & Social Science | 15 (20.0%) | 60 (80.0%) |
| Community & Social Service | 333 (24.2%) | 1,040 (75.7%) |
| Education, Arts & Media | 95 (30.8%) | 213 (69.2%) |
| Legal Services & Support | 12 (15.6%) | 65 (84.4%) |
| Education Instruction & Library | 181 (21.0%) | 680 (79.0%) |
| Arts, Media & Entertainment | 45 (35.4%) | 82 (64.6%) |
| Health Diagnosing & Treating | 154 (17.2%) | 739 (82.8%) |
| Health Technologists | 119 (20.4%) | 465 (79.6%) |
| Total (Category) | 2,524 (46.3%) | 2,931 (53.7%) |
| Total (Overall) | 8,204 (53.2%) | 7,221 (46.8%) |
Services Occupations
The most common Services occupations in Le Sueur County are Food Preparation & Serving (784 | 5.1%), Cleaning & Maintenance (536 | 3.5%), Personal Care & Service (477 | 3.1%), Healthcare Support (443 | 2.9%), and Security & Protection (177 | 1.1%).

Services Occupations by Sex
Within the Services occupations in Le Sueur County, the most male-oriented occupations are Law Enforcement (78.8%), Cleaning & Maintenance (68.5%), and Security & Protection (63.8%), while the most female-oriented occupations are Healthcare Support (94.8%), Personal Care & Service (75.3%), and Food Preparation & Serving (72.5%).

| Occupation | Male | Female |
| Healthcare Support | 23 (5.2%) | 420 (94.8%) |
| Security & Protection | 113 (63.8%) | 64 (36.2%) |
| Firefighting & Prevention | 35 (44.9%) | 43 (55.1%) |
| Law Enforcement | 78 (78.8%) | 21 (21.2%) |
| Food Preparation & Serving | 216 (27.6%) | 568 (72.5%) |
| Cleaning & Maintenance | 367 (68.5%) | 169 (31.5%) |
| Personal Care & Service | 118 (24.7%) | 359 (75.3%) |
| Total (Category) | 837 (34.6%) | 1,580 (65.4%) |
| Total (Overall) | 8,204 (53.2%) | 7,221 (46.8%) |
Sales and Office Occupations
The most common Sales and Office occupations in Le Sueur County are Office & Administration (1,645 | 10.7%), and Sales & Related (1,098 | 7.1%).

Sales and Office Occupations by Sex

| Occupation | Male | Female |
| Sales & Related | 608 (55.4%) | 490 (44.6%) |
| Office & Administration | 286 (17.4%) | 1,359 (82.6%) |
| Total (Category) | 894 (32.6%) | 1,849 (67.4%) |
| Total (Overall) | 8,204 (53.2%) | 7,221 (46.8%) |
Natural Resources, Construction and Maintenance Occupations
The most common Natural Resources, Construction and Maintenance occupations in Le Sueur County are Construction & Extraction (1,056 | 6.9%), Installation, Maintenance & Repair (731 | 4.7%), and Farming, Fishing & Forestry (131 | 0.9%).

Natural Resources, Construction and Maintenance Occupations by Sex

| Occupation | Male | Female |
| Farming, Fishing & Forestry | 126 (96.2%) | 5 (3.8%) |
| Construction & Extraction | 1,039 (98.4%) | 17 (1.6%) |
| Installation, Maintenance & Repair | 699 (95.6%) | 32 (4.4%) |
| Total (Category) | 1,864 (97.2%) | 54 (2.8%) |
| Total (Overall) | 8,204 (53.2%) | 7,221 (46.8%) |
Production, Transportation and Moving Occupations
The most common Production, Transportation and Moving occupations in Le Sueur County are Production (1,521 | 9.9%), Material Moving (695 | 4.5%), and Transportation (676 | 4.4%).

Production, Transportation and Moving Occupations by Sex

| Occupation | Male | Female |
| Production | 1,075 (70.7%) | 446 (29.3%) |
| Transportation | 571 (84.5%) | 105 (15.5%) |
| Material Moving | 439 (63.2%) | 256 (36.8%) |
| Total (Category) | 2,085 (72.1%) | 807 (27.9%) |
| Total (Overall) | 8,204 (53.2%) | 7,221 (46.8%) |
Employment Industries by Sex in Le Sueur County
Employment Industries in Le Sueur County
The major employment industries in Le Sueur County include Manufacturing (3,147 | 20.4%), Health Care & Social Assistance (2,237 | 14.5%), Construction (1,486 | 9.6%), Retail Trade (1,381 | 8.9%), and Educational Services (1,247 | 8.1%).

Employment Industries by Sex in Le Sueur County
The Le Sueur County industries that see more men than women are Utilities (96.2%), Construction (91.5%), and Agriculture, Fishing & Hunting (87.7%), whereas the industries that tend to have a higher number of women are Health Care & Social Assistance (88.1%), Enterprise Management (80.0%), and Educational Services (75.4%).
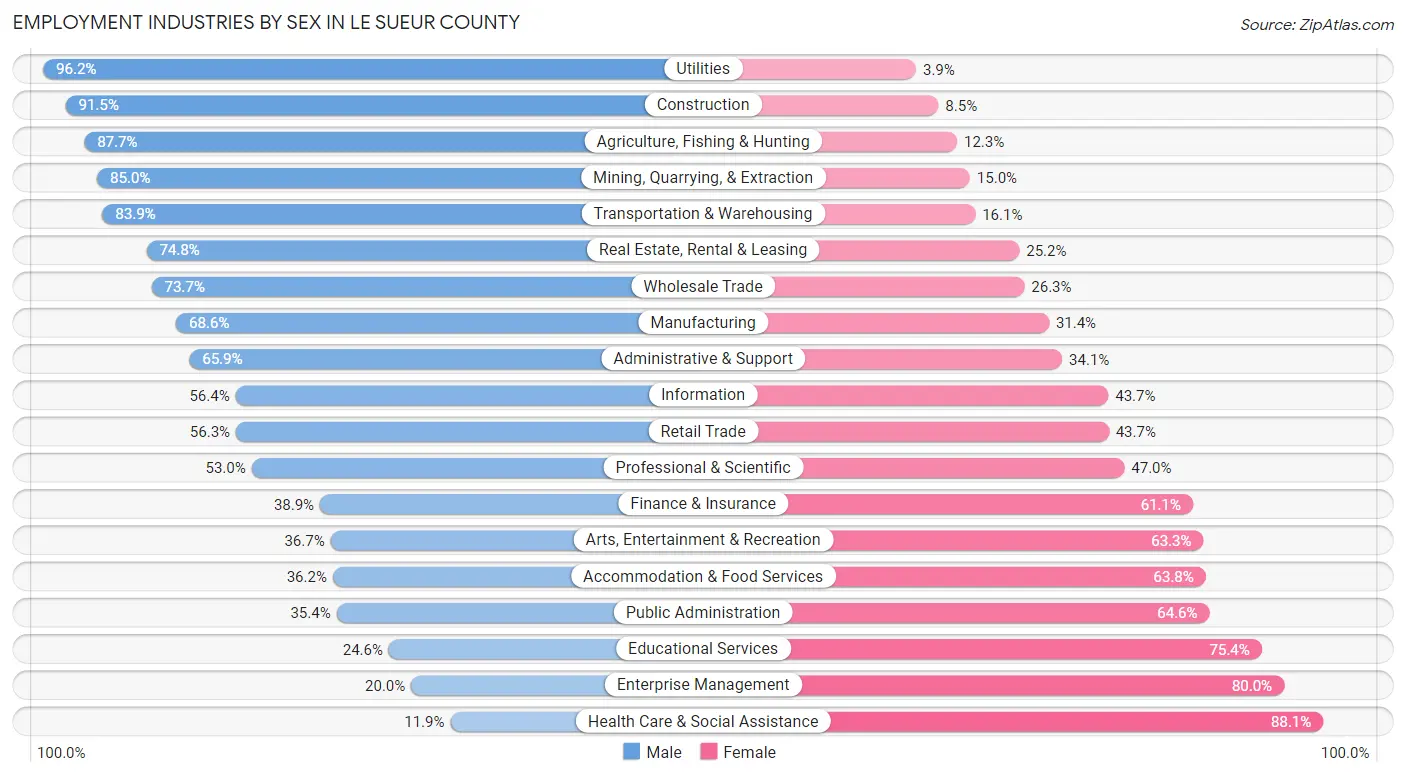
| Industry | Male | Female |
| Agriculture, Fishing & Hunting | 469 (87.7%) | 66 (12.3%) |
| Mining, Quarrying, & Extraction | 51 (85.0%) | 9 (15.0%) |
| Construction | 1,360 (91.5%) | 126 (8.5%) |
| Manufacturing | 2,160 (68.6%) | 987 (31.4%) |
| Wholesale Trade | 303 (73.7%) | 108 (26.3%) |
| Retail Trade | 777 (56.3%) | 604 (43.7%) |
| Transportation & Warehousing | 479 (83.9%) | 92 (16.1%) |
| Utilities | 50 (96.2%) | 2 (3.8%) |
| Information | 71 (56.4%) | 55 (43.6%) |
| Finance & Insurance | 185 (38.9%) | 291 (61.1%) |
| Real Estate, Rental & Leasing | 83 (74.8%) | 28 (25.2%) |
| Professional & Scientific | 360 (53.0%) | 319 (47.0%) |
| Enterprise Management | 2 (20.0%) | 8 (80.0%) |
| Administrative & Support | 344 (65.9%) | 178 (34.1%) |
| Educational Services | 307 (24.6%) | 940 (75.4%) |
| Health Care & Social Assistance | 266 (11.9%) | 1,971 (88.1%) |
| Arts, Entertainment & Recreation | 124 (36.7%) | 214 (63.3%) |
| Accommodation & Food Services | 247 (36.2%) | 435 (63.8%) |
| Public Administration | 258 (35.4%) | 470 (64.6%) |
| Total | 8,204 (53.2%) | 7,221 (46.8%) |
Education in Le Sueur County
School Enrollment in Le Sueur County
The most common levels of schooling among the 6,493 students in Le Sueur County are middle school (1,828 | 28.1%), high school (1,598 | 24.6%), and elementary school (1,311 | 20.2%).

| School Level | # Students | % Students |
| Nursery / Preschool | 434 | 6.7% |
| Kindergarten | 360 | 5.5% |
| Elementary School | 1,311 | 20.2% |
| Middle School | 1,828 | 28.1% |
| High School | 1,598 | 24.6% |
| College / Undergraduate | 770 | 11.9% |
| Graduate / Professional | 192 | 3.0% |
| Total | 6,493 | 100.0% |
School Enrollment by Age by Funding Source in Le Sueur County
Out of a total of 6,493 students who are enrolled in schools in Le Sueur County, 805 (12.4%) attend a private institution, while the remaining 5,688 (87.6%) are enrolled in public schools. The age group of 25 to 34 year olds has the highest likelihood of being enrolled in private schools, with 64 (32.2% in the age bracket) enrolled. Conversely, the age group of 15 to 17 year olds has the lowest likelihood of being enrolled in a private school, with 1,090 (95.3% in the age bracket) attending a public institution.

| Age Bracket | Public School | Private School |
| 3 to 4 Year Olds | 192 (83.1%) | 39 (16.9%) |
| 5 to 9 Year Old | 1,385 (82.9%) | 285 (17.1%) |
| 10 to 14 Year Olds | 1,921 (90.6%) | 199 (9.4%) |
| 15 to 17 Year Olds | 1,090 (95.3%) | 54 (4.7%) |
| 18 to 19 Year Olds | 401 (91.8%) | 36 (8.2%) |
| 20 to 24 Year Olds | 343 (85.5%) | 58 (14.5%) |
| 25 to 34 Year Olds | 135 (67.8%) | 64 (32.2%) |
| 35 Years and over | 221 (75.9%) | 70 (24.0%) |
| Total | 5,688 (87.6%) | 805 (12.4%) |
Educational Attainment by Field of Study in Le Sueur County
Business (1,023 | 19.1%), education (1,001 | 18.7%), science & technology (697 | 13.0%), bio, nature & agricultural (508 | 9.5%), and arts & humanities (403 | 7.5%) are the most common fields of study among 5,365 individuals in Le Sueur County who have obtained a bachelor's degree or higher.

| Field of Study | # Graduates | % Graduates |
| Computers & Mathematics | 247 | 4.6% |
| Bio, Nature & Agricultural | 508 | 9.5% |
| Physical & Health Sciences | 129 | 2.4% |
| Psychology | 195 | 3.6% |
| Social Sciences | 293 | 5.5% |
| Engineering | 260 | 4.9% |
| Multidisciplinary Studies | 39 | 0.7% |
| Science & Technology | 697 | 13.0% |
| Business | 1,023 | 19.1% |
| Education | 1,001 | 18.7% |
| Literature & Languages | 148 | 2.8% |
| Liberal Arts & History | 161 | 3.0% |
| Visual & Performing Arts | 68 | 1.3% |
| Communications | 193 | 3.6% |
| Arts & Humanities | 403 | 7.5% |
| Total | 5,365 | 100.0% |
Transportation & Commute in Le Sueur County
Vehicle Availability by Sex in Le Sueur County
The most prevalent vehicle ownership categories in Le Sueur County are males with 2 vehicles (2,899, accounting for 36.3%) and females with 2 vehicles (2,335, making up 41.1%).

| Vehicles Available | Male | Female |
| No Vehicle | 64 (0.8%) | 55 (0.8%) |
| 1 Vehicle | 615 (7.7%) | 897 (12.7%) |
| 2 Vehicles | 2,899 (36.3%) | 2,335 (33.1%) |
| 3 Vehicles | 2,388 (29.9%) | 2,011 (28.5%) |
| 4 Vehicles | 1,309 (16.4%) | 1,165 (16.5%) |
| 5 or more Vehicles | 721 (9.0%) | 587 (8.3%) |
| Total | 7,996 (100.0%) | 7,050 (100.0%) |
Commute Time in Le Sueur County
The most frequently occuring commute durations in Le Sueur County are 5 to 9 minutes (1,943 commuters, 14.0%), 20 to 24 minutes (1,856 commuters, 13.4%), and 10 to 14 minutes (1,564 commuters, 11.3%).
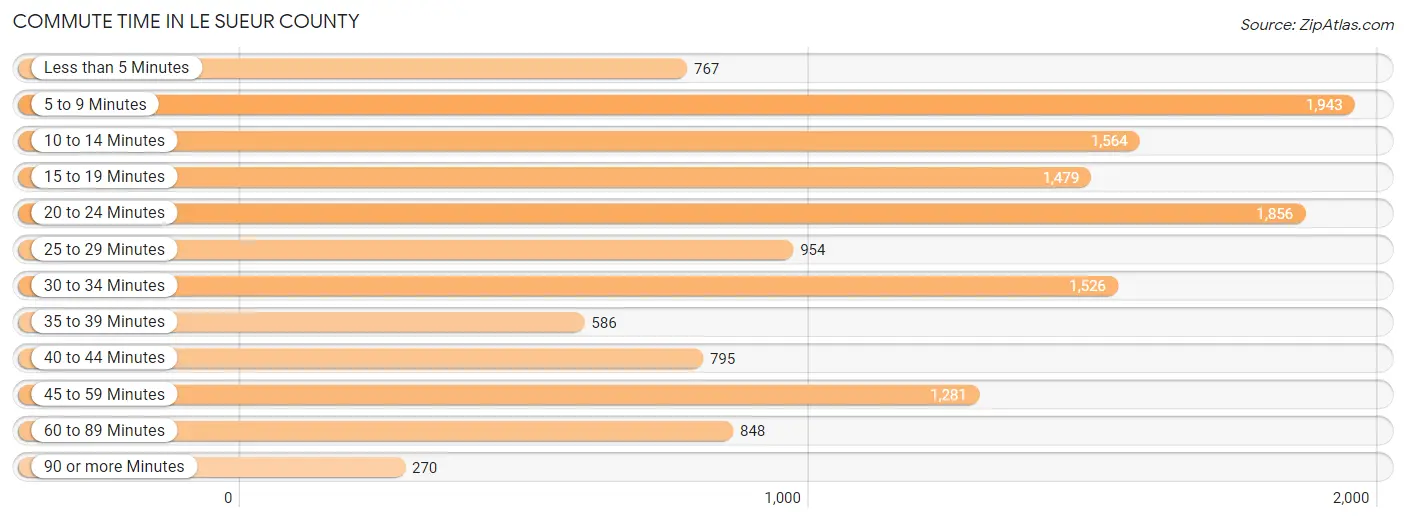
| Commute Time | # Commuters | % Commuters |
| Less than 5 Minutes | 767 | 5.5% |
| 5 to 9 Minutes | 1,943 | 14.0% |
| 10 to 14 Minutes | 1,564 | 11.3% |
| 15 to 19 Minutes | 1,479 | 10.7% |
| 20 to 24 Minutes | 1,856 | 13.4% |
| 25 to 29 Minutes | 954 | 6.9% |
| 30 to 34 Minutes | 1,526 | 11.0% |
| 35 to 39 Minutes | 586 | 4.2% |
| 40 to 44 Minutes | 795 | 5.7% |
| 45 to 59 Minutes | 1,281 | 9.2% |
| 60 to 89 Minutes | 848 | 6.1% |
| 90 or more Minutes | 270 | 1.9% |
Commute Time by Sex in Le Sueur County
The most common commute times in Le Sueur County are 5 to 9 minutes (1,069 commuters, 14.4%) for males and 20 to 24 minutes (981 commuters, 15.2%) for females.

| Commute Time | Male | Female |
| Less than 5 Minutes | 357 (4.8%) | 410 (6.4%) |
| 5 to 9 Minutes | 1,069 (14.4%) | 874 (13.5%) |
| 10 to 14 Minutes | 683 (9.2%) | 881 (13.7%) |
| 15 to 19 Minutes | 709 (9.6%) | 770 (11.9%) |
| 20 to 24 Minutes | 875 (11.8%) | 981 (15.2%) |
| 25 to 29 Minutes | 508 (6.9%) | 446 (6.9%) |
| 30 to 34 Minutes | 846 (11.4%) | 680 (10.5%) |
| 35 to 39 Minutes | 365 (4.9%) | 221 (3.4%) |
| 40 to 44 Minutes | 466 (6.3%) | 329 (5.1%) |
| 45 to 59 Minutes | 833 (11.2%) | 448 (6.9%) |
| 60 to 89 Minutes | 508 (6.9%) | 340 (5.3%) |
| 90 or more Minutes | 197 (2.7%) | 73 (1.1%) |
Time of Departure to Work by Sex in Le Sueur County
The most frequent times of departure to work in Le Sueur County are 6:30 AM to 6:59 AM (990, 13.4%) for males and 7:30 AM to 7:59 AM (1,373, 21.3%) for females.

| Time of Departure | Male | Female |
| 12:00 AM to 4:59 AM | 643 (8.7%) | 324 (5.0%) |
| 5:00 AM to 5:29 AM | 640 (8.6%) | 233 (3.6%) |
| 5:30 AM to 5:59 AM | 670 (9.0%) | 258 (4.0%) |
| 6:00 AM to 6:29 AM | 963 (13.0%) | 404 (6.3%) |
| 6:30 AM to 6:59 AM | 990 (13.4%) | 758 (11.7%) |
| 7:00 AM to 7:29 AM | 870 (11.7%) | 1,171 (18.1%) |
| 7:30 AM to 7:59 AM | 765 (10.3%) | 1,373 (21.3%) |
| 8:00 AM to 8:29 AM | 524 (7.1%) | 578 (9.0%) |
| 8:30 AM to 8:59 AM | 108 (1.5%) | 214 (3.3%) |
| 9:00 AM to 9:59 AM | 152 (2.1%) | 215 (3.3%) |
| 10:00 AM to 10:59 AM | 23 (0.3%) | 149 (2.3%) |
| 11:00 AM to 11:59 AM | 17 (0.2%) | 47 (0.7%) |
| 12:00 PM to 3:59 PM | 545 (7.3%) | 494 (7.7%) |
| 4:00 PM to 11:59 PM | 506 (6.8%) | 235 (3.6%) |
| Total | 7,416 (100.0%) | 6,453 (100.0%) |
Housing Occupancy in Le Sueur County
Occupancy by Ownership in Le Sueur County
Of the total 11,340 dwellings in Le Sueur County, owner-occupied units account for 9,228 (81.4%), while renter-occupied units make up 2,112 (18.6%).

| Occupancy | # Housing Units | % Housing Units |
| Owner Occupied Housing Units | 9,228 | 81.4% |
| Renter-Occupied Housing Units | 2,112 | 18.6% |
| Total Occupied Housing Units | 11,340 | 100.0% |
Occupancy by Household Size in Le Sueur County

| Household Size | # Housing Units | % Housing Units |
| 1-Person Household | 2,742 | 24.2% |
| 2-Person Household | 4,212 | 37.1% |
| 3-Person Household | 1,583 | 14.0% |
| 4+ Person Household | 2,803 | 24.7% |
| Total Housing Units | 11,340 | 100.0% |
Occupancy by Ownership by Household Size in Le Sueur County

| Household Size | Owner-occupied | Renter-occupied |
| 1-Person Household | 1,714 (62.5%) | 1,028 (37.5%) |
| 2-Person Household | 3,792 (90.0%) | 420 (10.0%) |
| 3-Person Household | 1,275 (80.5%) | 308 (19.5%) |
| 4+ Person Household | 2,447 (87.3%) | 356 (12.7%) |
| Total Housing Units | 9,228 (81.4%) | 2,112 (18.6%) |
Occupancy by Educational Attainment in Le Sueur County

| Household Size | Owner-occupied | Renter-occupied |
| Less than High School | 313 (62.7%) | 186 (37.3%) |
| High School Diploma | 2,604 (73.1%) | 959 (26.9%) |
| College/Associate Degree | 3,704 (82.7%) | 776 (17.3%) |
| Bachelor's Degree or higher | 2,607 (93.2%) | 191 (6.8%) |
Occupancy by Age of Householder in Le Sueur County

| Age Bracket | # Households | % Households |
| Under 35 Years | 1,889 | 16.7% |
| 35 to 44 Years | 1,950 | 17.2% |
| 45 to 54 Years | 1,953 | 17.2% |
| 55 to 64 Years | 2,316 | 20.4% |
| 65 to 74 Years | 1,806 | 15.9% |
| 75 to 84 Years | 1,026 | 9.0% |
| 85 Years and Over | 400 | 3.5% |
| Total | 11,340 | 100.0% |
Housing Finances in Le Sueur County
Median Income by Occupancy in Le Sueur County

| Occupancy Type | # Households | Median Income |
| Owner-Occupied | 9,228 (81.4%) | $98,101 |
| Renter-Occupied | 2,112 (18.6%) | $41,310 |
| Average | 11,340 (100.0%) | $87,180 |
Occupancy by Householder Income Bracket in Le Sueur County

| Income Bracket | Owner-occupied | Renter-occupied |
| Less than $5,000 | 98 (1.1%) | 41 (1.9%) |
| $5,000 to $9,999 | 39 (0.4%) | 106 (5.0%) |
| $10,000 to $14,999 | 123 (1.3%) | 78 (3.7%) |
| $15,000 to $19,999 | 136 (1.5%) | 178 (8.4%) |
| $20,000 to $24,999 | 196 (2.1%) | 196 (9.3%) |
| $25,000 to $34,999 | 398 (4.3%) | 262 (12.4%) |
| $35,000 to $49,999 | 662 (7.2%) | 448 (21.2%) |
| $50,000 to $74,999 | 1,512 (16.4%) | 367 (17.4%) |
| $75,000 to $99,999 | 1,570 (17.0%) | 166 (7.9%) |
| $100,000 to $149,999 | 2,503 (27.1%) | 147 (7.0%) |
| $150,000 or more | 1,991 (21.6%) | 123 (5.8%) |
| Total | 9,228 (100.0%) | 2,112 (100.0%) |
Monthly Housing Cost Tiers in Le Sueur County

| Monthly Cost | Owner-occupied | Renter-occupied |
| Less than $300 | 139 (1.5%) | 144 (6.8%) |
| $300 to $499 | 786 (8.5%) | 127 (6.0%) |
| $500 to $799 | 1,544 (16.7%) | 471 (22.3%) |
| $800 to $999 | 938 (10.2%) | 396 (18.8%) |
| $1,000 to $1,499 | 2,039 (22.1%) | 500 (23.7%) |
| $1,500 to $1,999 | 1,634 (17.7%) | 230 (10.9%) |
| $2,000 to $2,499 | 1,051 (11.4%) | 78 (3.7%) |
| $2,500 to $2,999 | 591 (6.4%) | 2 (0.1%) |
| $3,000 or more | 506 (5.5%) | 12 (0.6%) |
| Total | 9,228 (100.0%) | 2,112 (100.0%) |
Physical Housing Characteristics in Le Sueur County
Housing Structures in Le Sueur County

| Structure Type | # Housing Units | % Housing Units |
| Single Unit, Detached | 9,443 | 83.3% |
| Single Unit, Attached | 555 | 4.9% |
| 2 Unit Apartments | 237 | 2.1% |
| 3 or 4 Unit Apartments | 126 | 1.1% |
| 5 to 9 Unit Apartments | 123 | 1.1% |
| 10 or more Apartments | 707 | 6.2% |
| Mobile Home / Other | 149 | 1.3% |
| Total | 11,340 | 100.0% |
Housing Structures by Occupancy in Le Sueur County

| Structure Type | Owner-occupied | Renter-occupied |
| Single Unit, Detached | 8,605 (91.1%) | 838 (8.9%) |
| Single Unit, Attached | 421 (75.9%) | 134 (24.1%) |
| 2 Unit Apartments | 40 (16.9%) | 197 (83.1%) |
| 3 or 4 Unit Apartments | 6 (4.8%) | 120 (95.2%) |
| 5 to 9 Unit Apartments | 3 (2.4%) | 120 (97.6%) |
| 10 or more Apartments | 20 (2.8%) | 687 (97.2%) |
| Mobile Home / Other | 133 (89.3%) | 16 (10.7%) |
| Total | 9,228 (81.4%) | 2,112 (18.6%) |
Housing Structures by Number of Rooms in Le Sueur County

| Number of Rooms | Owner-occupied | Renter-occupied |
| 1 Room | 18 (0.2%) | 66 (3.1%) |
| 2 or 3 Rooms | 179 (1.9%) | 470 (22.3%) |
| 4 or 5 Rooms | 1,767 (19.2%) | 1,039 (49.2%) |
| 6 or 7 Rooms | 2,991 (32.4%) | 361 (17.1%) |
| 8 or more Rooms | 4,273 (46.3%) | 176 (8.3%) |
| Total | 9,228 (100.0%) | 2,112 (100.0%) |
Housing Structure by Heating Type in Le Sueur County

| Heating Type | Owner-occupied | Renter-occupied |
| Utility Gas | 6,316 (68.4%) | 1,163 (55.1%) |
| Bottled, Tank, or LP Gas | 1,841 (20.0%) | 181 (8.6%) |
| Electricity | 576 (6.2%) | 604 (28.6%) |
| Fuel Oil or Kerosene | 68 (0.7%) | 2 (0.1%) |
| Coal or Coke | 0 (0.0%) | 0 (0.0%) |
| All other Fuels | 401 (4.3%) | 110 (5.2%) |
| No Fuel Used | 26 (0.3%) | 52 (2.5%) |
| Total | 9,228 (100.0%) | 2,112 (100.0%) |
Household Vehicle Usage in Le Sueur County

| Vehicles per Household | Owner-occupied | Renter-occupied |
| No Vehicle | 103 (1.1%) | 217 (10.3%) |
| 1 Vehicle | 1,272 (13.8%) | 1,180 (55.9%) |
| 2 Vehicles | 3,787 (41.0%) | 410 (19.4%) |
| 3 or more Vehicles | 4,066 (44.1%) | 305 (14.4%) |
| Total | 9,228 (100.0%) | 2,112 (100.0%) |
Real Estate & Mortgages in Le Sueur County
Real Estate and Mortgage Overview in Le Sueur County
| Characteristic | Without Mortgage | With Mortgage |
| Housing Units | 3,203 | 6,025 |
| Median Property Value | $264,700 | $276,900 |
| Median Household Income | $78,116 | $1,529 |
| Monthly Housing Costs | $637 | $501 |
| Real Estate Taxes | $2,847 | $55 |
Property Value by Mortgage Status in Le Sueur County

| Property Value | Without Mortgage | With Mortgage |
| Less than $50,000 | 179 (5.6%) | 101 (1.7%) |
| $50,000 to $99,999 | 141 (4.4%) | 103 (1.7%) |
| $100,000 to $299,999 | 1,600 (49.9%) | 3,104 (51.5%) |
| $300,000 to $499,999 | 910 (28.4%) | 1,942 (32.2%) |
| $500,000 to $749,999 | 238 (7.4%) | 577 (9.6%) |
| $750,000 to $999,999 | 72 (2.2%) | 88 (1.5%) |
| $1,000,000 or more | 63 (2.0%) | 110 (1.8%) |
| Total | 3,203 (100.0%) | 6,025 (100.0%) |
Household Income by Mortgage Status in Le Sueur County

| Household Income | Without Mortgage | With Mortgage |
| Less than $10,000 | 109 (3.4%) | 95 (1.6%) |
| $10,000 to $24,999 | 288 (9.0%) | 28 (0.5%) |
| $25,000 to $34,999 | 223 (7.0%) | 167 (2.8%) |
| $35,000 to $49,999 | 327 (10.2%) | 175 (2.9%) |
| $50,000 to $74,999 | 578 (18.0%) | 335 (5.6%) |
| $75,000 to $99,999 | 504 (15.7%) | 934 (15.5%) |
| $100,000 to $149,999 | 712 (22.2%) | 1,066 (17.7%) |
| $150,000 or more | 462 (14.4%) | 1,791 (29.7%) |
| Total | 3,203 (100.0%) | 6,025 (100.0%) |
Property Value to Household Income Ratio in Le Sueur County

| Value-to-Income Ratio | Without Mortgage | With Mortgage |
| Less than 2.0x | 750 (23.4%) | 105,199 (1,746.0%) |
| 2.0x to 2.9x | 657 (20.5%) | 1,871 (31.0%) |
| 3.0x to 3.9x | 527 (16.5%) | 1,718 (28.5%) |
| 4.0x or more | 1,240 (38.7%) | 885 (14.7%) |
| Total | 3,203 (100.0%) | 6,025 (100.0%) |
Real Estate Taxes by Mortgage Status in Le Sueur County

| Property Taxes | Without Mortgage | With Mortgage |
| Less than $800 | 153 (4.8%) | 2 (0.0%) |
| $800 to $1,499 | 307 (9.6%) | 152 (2.5%) |
| $800 to $1,499 | 2,692 (84.1%) | 715 (11.9%) |
| Total | 3,203 (100.0%) | 6,025 (100.0%) |
Health & Disability in Le Sueur County
Health Insurance Coverage by Age in Le Sueur County

| Age Bracket | With Coverage | Without Coverage |
| Under 6 Years | 1,969 (95.0%) | 103 (5.0%) |
| 6 to 18 Years | 4,705 (93.7%) | 318 (6.3%) |
| 19 to 25 Years | 1,715 (89.7%) | 196 (10.3%) |
| 26 to 34 Years | 2,734 (89.7%) | 313 (10.3%) |
| 35 to 44 Years | 3,391 (91.0%) | 337 (9.0%) |
| 45 to 54 Years | 3,422 (94.6%) | 194 (5.4%) |
| 55 to 64 Years | 3,968 (95.6%) | 181 (4.4%) |
| 65 to 74 Years | 3,016 (100.0%) | 0 (0.0%) |
| 75 Years and older | 2,057 (100.0%) | 0 (0.0%) |
| Total | 26,977 (94.3%) | 1,642 (5.7%) |
Health Insurance Coverage by Citizenship Status in Le Sueur County
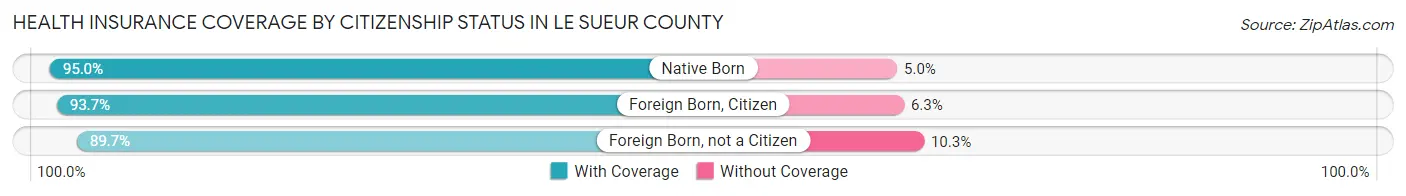
| Citizenship Status | With Coverage | Without Coverage |
| Native Born | 1,969 (95.0%) | 103 (5.0%) |
| Foreign Born, Citizen | 4,705 (93.7%) | 318 (6.3%) |
| Foreign Born, not a Citizen | 1,715 (89.7%) | 196 (10.3%) |
Health Insurance Coverage by Household Income in Le Sueur County

| Household Income | With Coverage | Without Coverage |
| Under $25,000 | 1,669 (90.8%) | 168 (9.1%) |
| $25,000 to $49,999 | 2,732 (83.0%) | 559 (17.0%) |
| $50,000 to $74,999 | 3,757 (92.4%) | 308 (7.6%) |
| $75,000 to $99,999 | 4,256 (97.0%) | 133 (3.0%) |
| $100,000 and over | 14,322 (97.1%) | 428 (2.9%) |
Public vs Private Health Insurance Coverage by Age in Le Sueur County

| Age Bracket | Public Insurance | Private Insurance |
| Under 6 | 600 (29.0%) | 1,516 (73.2%) |
| 6 to 18 Years | 1,290 (25.7%) | 3,834 (76.3%) |
| 19 to 25 Years | 372 (19.5%) | 1,356 (71.0%) |
| 25 to 34 Years | 484 (15.9%) | 2,379 (78.1%) |
| 35 to 44 Years | 669 (17.9%) | 2,858 (76.7%) |
| 45 to 54 Years | 375 (10.4%) | 3,172 (87.7%) |
| 55 to 64 Years | 659 (15.9%) | 3,485 (84.0%) |
| 65 to 74 Years | 2,922 (96.9%) | 1,944 (64.5%) |
| 75 Years and over | 2,057 (100.0%) | 1,574 (76.5%) |
| Total | 9,428 (32.9%) | 22,118 (77.3%) |
Disability Status by Sex by Age in Le Sueur County

| Age Bracket | Male | Female |
| Under 5 Years | 2 (0.2%) | 0 (0.0%) |
| 5 to 17 Years | 167 (6.6%) | 46 (1.8%) |
| 18 to 34 Years | 217 (8.0%) | 138 (5.3%) |
| 35 to 64 Years | 561 (9.4%) | 520 (9.4%) |
| 65 to 74 Years | 356 (23.8%) | 200 (13.1%) |
| 75 Years and over | 391 (41.5%) | 379 (34.0%) |
Disability Class by Sex by Age in Le Sueur County
Disability Class: Hearing Difficulty

| Age Bracket | Male | Female |
| Under 5 Years | 2 (0.2%) | 0 (0.0%) |
| 5 to 17 Years | 2 (0.1%) | 11 (0.4%) |
| 18 to 34 Years | 9 (0.3%) | 6 (0.2%) |
| 35 to 64 Years | 195 (3.3%) | 166 (3.0%) |
| 65 to 74 Years | 216 (14.5%) | 41 (2.7%) |
| 75 Years and over | 242 (25.7%) | 169 (15.1%) |
Disability Class: Vision Difficulty

| Age Bracket | Male | Female |
| Under 5 Years | 0 (0.0%) | 0 (0.0%) |
| 5 to 17 Years | 0 (0.0%) | 2 (0.1%) |
| 18 to 34 Years | 2 (0.1%) | 41 (1.6%) |
| 35 to 64 Years | 108 (1.8%) | 70 (1.3%) |
| 65 to 74 Years | 15 (1.0%) | 34 (2.2%) |
| 75 Years and over | 73 (7.8%) | 63 (5.7%) |
Disability Class: Cognitive Difficulty

| Age Bracket | Male | Female |
| 5 to 17 Years | 155 (6.1%) | 33 (1.3%) |
| 18 to 34 Years | 174 (6.4%) | 90 (3.5%) |
| 35 to 64 Years | 264 (4.4%) | 230 (4.2%) |
| 65 to 74 Years | 62 (4.2%) | 19 (1.3%) |
| 75 Years and over | 37 (3.9%) | 53 (4.8%) |
Disability Class: Ambulatory Difficulty

| Age Bracket | Male | Female |
| 5 to 17 Years | 0 (0.0%) | 2 (0.1%) |
| 18 to 34 Years | 12 (0.4%) | 13 (0.5%) |
| 35 to 64 Years | 259 (4.3%) | 208 (3.8%) |
| 65 to 74 Years | 102 (6.8%) | 131 (8.6%) |
| 75 Years and over | 158 (16.8%) | 256 (22.9%) |
Disability Class: Self-Care Difficulty

| Age Bracket | Male | Female |
| 5 to 17 Years | 5 (0.2%) | 4 (0.2%) |
| 18 to 34 Years | 4 (0.2%) | 25 (1.0%) |
| 35 to 64 Years | 90 (1.5%) | 128 (2.3%) |
| 65 to 74 Years | 18 (1.2%) | 22 (1.5%) |
| 75 Years and over | 61 (6.5%) | 40 (3.6%) |
Technology Access in Le Sueur County
Computing Device Access in Le Sueur County

| Device Type | # Households | % Households |
| Desktop or Laptop | 8,705 | 76.8% |
| Smartphone | 9,780 | 86.2% |
| Tablet | 7,247 | 63.9% |
| No Computing Device | 730 | 6.4% |
| Total | 11,340 | 100.0% |
Internet Access in Le Sueur County
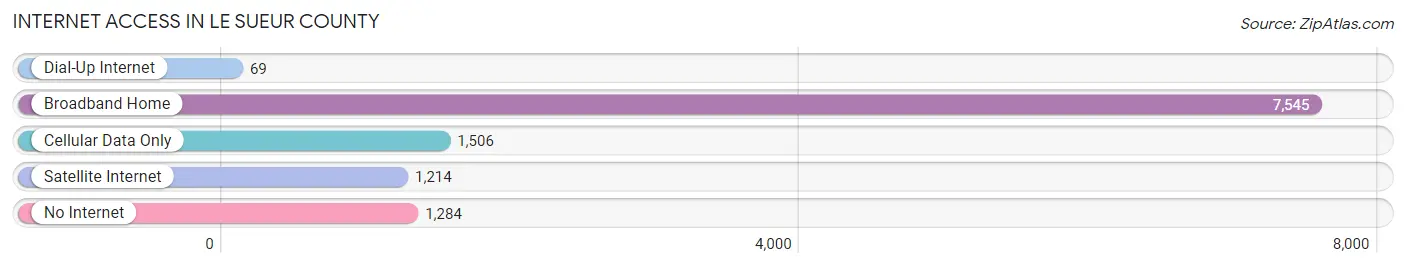
| Internet Type | # Households | % Households |
| Dial-Up Internet | 69 | 0.6% |
| Broadband Home | 7,545 | 66.5% |
| Cellular Data Only | 1,506 | 13.3% |
| Satellite Internet | 1,214 | 10.7% |
| No Internet | 1,284 | 11.3% |
| Total | 11,340 | 100.0% |
Le Sueur County Summary
Sueur County is located in the south-central part of Minnesota, and is part of the Mankato-North Mankato Metropolitan Statistical Area. The county was established in 1853 and is named after Pierre-Charles Le Sueur, a French explorer who explored the area in the late 1600s. The county seat is Le Center.
Geography
Sueur County covers an area of 576 square miles and is located in the south-central part of Minnesota. It is bordered by Rice County to the north, Blue Earth County to the east, Waseca County to the south, and Steele County to the west. The county is mostly flat, with some rolling hills in the northern part. The terrain is mostly prairie, with some wooded areas in the northern part. The county is drained by the Le Sueur River, which flows through the county from north to south.
The county has a humid continental climate, with cold winters and hot summers. The average annual temperature is 45°F, and the average annual precipitation is 30 inches.
Demographics
As of the 2010 census, there were 19,181 people, 7,541 households, and 5,092 families living in the county. The population density was 33 people per square mile. The racial makeup of the county was 97.3% White, 0.5% African American, 0.3% Native American, 0.4% Asian, 0.1% Pacific Islander, 0.5% from other races, and 0.9% from two or more races. Hispanic or Latino of any race were 1.6% of the population.
The median income for a household in the county was $50,945, and the median income for a family was $60,945. The per capita income for the county was $24,845. About 5.2% of families and 7.3% of the population were below the poverty line, including 9.2% of those under age 18 and 6.2% of those age 65 or over.
Economy
Sueur County’s economy is largely based on agriculture. The county is home to several large farms, and the main crops grown in the county are corn, soybeans, and wheat. The county also has a strong manufacturing sector, with several companies producing a variety of products, including automotive parts, medical equipment, and food products.
The county also has a strong tourism industry, with several attractions, including the Minnesota Valley National Wildlife Refuge, the Le Sueur County Historical Society Museum, and the Le Sueur County Fair.
History
Sueur County was established in 1853 and was named after Pierre-Charles Le Sueur, a French explorer who explored the area in the late 1600s. The county seat is Le Center.
The county was originally home to the Dakota Sioux, who were forcibly removed from the area in the late 1800s. The county was largely rural until the early 1900s, when the railroad was built through the area. This led to an influx of settlers, and the county’s population began to grow rapidly.
In the early 1900s, the county was home to several large farms, and the main crops grown in the county were corn, soybeans, and wheat. The county also had a strong manufacturing sector, with several companies producing a variety of products, including automotive parts, medical equipment, and food products.
The county has continued to grow and develop over the years, and today it is a vibrant and diverse community. The county is home to several large farms, and the main crops grown in the county are corn, soybeans, and wheat. The county also has a strong manufacturing sector, with several companies producing a variety of products, including automotive parts, medical equipment, and food products. The county also has a strong tourism industry, with several attractions, including the Minnesota Valley National Wildlife Refuge, the Le Sueur County Historical Society Museum, and the Le Sueur County Fair.
Common Questions
What is the Total Population of Le Sueur County?
Total Population of Le Sueur County is 28,795.
What is the Total Male Population of Le Sueur County?
Total Male Population of Le Sueur County is 14,650.
What is the Total Female Population of Le Sueur County?
Total Female Population of Le Sueur County is 14,145.
What is the Ratio of Males per 100 Females in Le Sueur County?
There are 103.57 Males per 100 Females in Le Sueur County.
What is the Ratio of Females per 100 Males in Le Sueur County?
There are 96.55 Females per 100 Males in Le Sueur County.
What is the Median Population Age in Le Sueur County?
Median Population Age in Le Sueur County is 41.3 Years.
What is the Average Family Size in Le Sueur County
Average Family Size in Le Sueur County is 3.0 People.
What is the Average Household Size in Le Sueur County
Average Household Size in Le Sueur County is 2.5 People.
What is Per Capita Income in Le Sueur County?
Per Capita income in Le Sueur County is $41,400.
What is the Median Family Income in Le Sueur County?
Median Family Income in Le Sueur County is $103,116.
What is the Median Household income in Le Sueur County?
Median Household Income in Le Sueur County is $87,180.
What is Income or Wage Gap in Le Sueur County?
Income or Wage Gap in Le Sueur County is 35.6%.
Women in Le Sueur County earn 64.4 cents for every dollar earned by a man.
What is Family Income Deficit in Le Sueur County?
Family Income Deficit in Le Sueur County is $8,100.
Families that are below poverty line in Le Sueur County earn $8,100 less on average than the poverty threshold level.
What is Inequality or Gini Index in Le Sueur County?
Inequality or Gini Index in Le Sueur County is 0.40.
How Large is the Labor Force in Le Sueur County?
There are 16,012 People in the Labor Forcein in Le Sueur County.
What is the Percentage of People in the Labor Force in Le Sueur County?
70.0% of People are in the Labor Force in Le Sueur County.
What is the Unemployment Rate in Le Sueur County?
Unemployment Rate in Le Sueur County is 3.6%.