Lac qui Parle County, MN
Lac qui Parle County Map

Lac qui Parle County Overview
6,736
TOTAL POPULATION
3,439
MALE POPULATION
3,297
FEMALE POPULATION
104.31
MALES / 100 FEMALES
95.87
FEMALES / 100 MALES
48.7
MEDIAN AGE
2.8
AVG FAMILY SIZE
2.3
AVG HOUSEHOLD SIZE
$37,520
PER CAPITA INCOME
$83,958
AVG FAMILY INCOME
$66,967
AVG HOUSEHOLD INCOME
41.8%
WAGE / INCOME GAP [ % ]
58.2¢/ $1
WAGE / INCOME GAP [ $ ]
$12,057
FAMILY INCOME DEFICIT
0.44
INEQUALITY / GINI INDEX
3,284
LABOR FORCE [ PEOPLE ]
59.4%
PERCENT IN LABOR FORCE
2.1%
UNEMPLOYMENT RATE
Lac qui Parle County Area Codes
Race in Lac qui Parle County
The most populous races in Lac qui Parle County are White / Caucasian (6,395 | 94.9%), Hispanic or Latino (176 | 2.6%), and Two or more Races (159 | 2.4%).

| Race | # Population | % Population |
| Asian | 47 | 0.7% |
| Black / African American | 36 | 0.5% |
| Hawaiian / Pacific | 0 | 0.0% |
| Hispanic or Latino | 176 | 2.6% |
| Native / Alaskan | 7 | 0.1% |
| White / Caucasian | 6,395 | 94.9% |
| Two or more Races | 159 | 2.4% |
| Some other Race | 92 | 1.4% |
| Total | 6,736 | 100.0% |
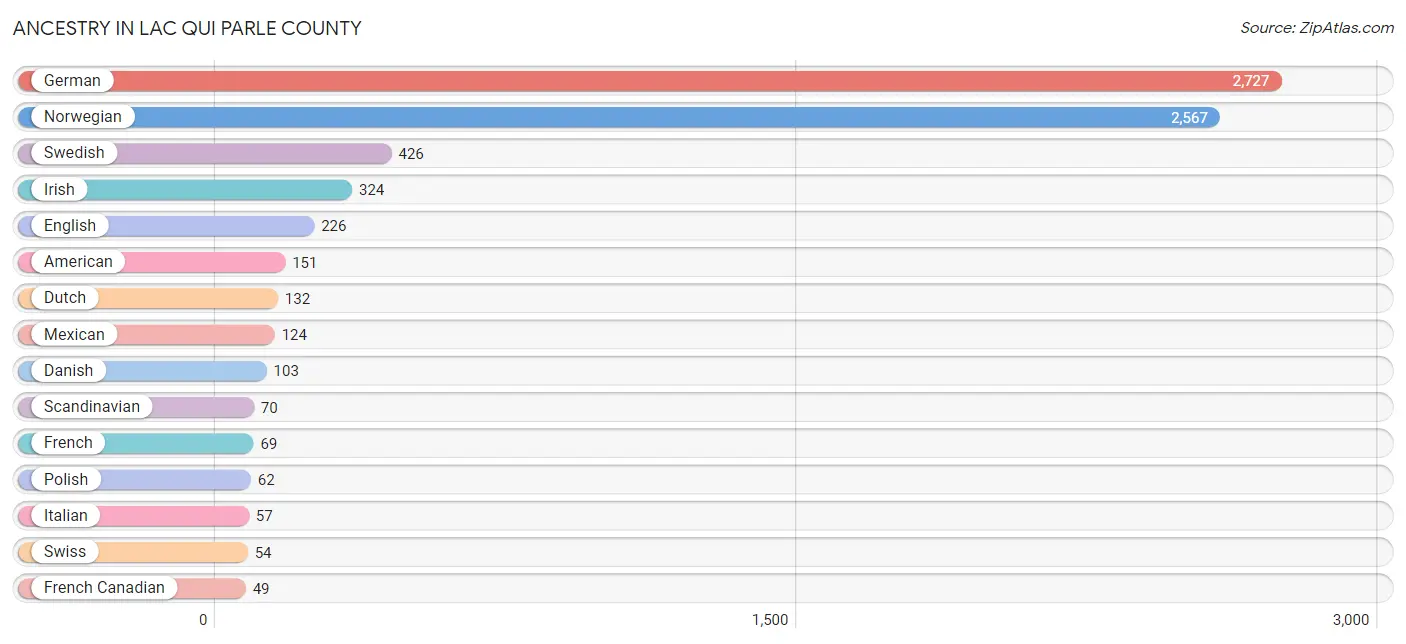
Ancestry in Lac qui Parle County
The most populous ancestries reported in Lac qui Parle County are German (2,727 | 40.5%), Norwegian (2,567 | 38.1%), Swedish (426 | 6.3%), Irish (324 | 4.8%), and English (226 | 3.4%), together accounting for 93.1% of all Lac qui Parle County residents.
| Ancestry | # Population | % Population |
| African | 1 | 0.0% |
| American | 151 | 2.2% |
| Arab | 3 | 0.0% |
| Austrian | 8 | 0.1% |
| Bangladeshi | 13 | 0.2% |
| Belgian | 37 | 0.5% |
| Bhutanese | 5 | 0.1% |
| British | 2 | 0.0% |
| Burmese | 24 | 0.4% |
| Canadian | 6 | 0.1% |
| Central American | 3 | 0.0% |
| Cherokee | 7 | 0.1% |
| Chilean | 1 | 0.0% |
| Chippewa | 13 | 0.2% |
| Colombian | 5 | 0.1% |
| Cree | 1 | 0.0% |
| Cuban | 2 | 0.0% |
| Czech | 38 | 0.6% |
| Czechoslovakian | 1 | 0.0% |
| Danish | 103 | 1.5% |
| Dutch | 132 | 2.0% |
| Eastern European | 5 | 0.1% |
| English | 226 | 3.4% |
| European | 26 | 0.4% |
| Finnish | 18 | 0.3% |
| French | 69 | 1.0% |
| French Canadian | 49 | 0.7% |
| German | 2,727 | 40.5% |
| Guamanian / Chamorro | 2 | 0.0% |
| Guatemalan | 2 | 0.0% |
| Haitian | 2 | 0.0% |
| Honduran | 1 | 0.0% |
| Hungarian | 10 | 0.2% |
| Icelander | 3 | 0.0% |
| Indian (Asian) | 2 | 0.0% |
| Irish | 324 | 4.8% |
| Italian | 57 | 0.9% |
| Korean | 16 | 0.2% |
| Lithuanian | 2 | 0.0% |
| Luxembourger | 1 | 0.0% |
| Mexican | 124 | 1.8% |
| Northern European | 8 | 0.1% |
| Norwegian | 2,567 | 38.1% |
| Pakistani | 12 | 0.2% |
| Polish | 62 | 0.9% |
| Portuguese | 7 | 0.1% |
| Puerto Rican | 14 | 0.2% |
| Russian | 35 | 0.5% |
| Scandinavian | 70 | 1.0% |
| Scotch-Irish | 28 | 0.4% |
| Scottish | 37 | 0.5% |
| Seminole | 12 | 0.2% |
| Sioux | 3 | 0.0% |
| Slovak | 5 | 0.1% |
| Somali | 1 | 0.0% |
| South African | 3 | 0.0% |
| South American | 6 | 0.1% |
| Spaniard | 6 | 0.1% |
| Spanish | 6 | 0.1% |
| Subsaharan African | 5 | 0.1% |
| Swedish | 426 | 6.3% |
| Swiss | 54 | 0.8% |
| Thai | 5 | 0.1% |
| Ukrainian | 4 | 0.1% |
| Welsh | 5 | 0.1% | View All 65 Rows |
Immigrants in Lac qui Parle County
The most numerous immigrant groups reported in Lac qui Parle County came from Asia (46 | 0.7%), Latin America (45 | 0.7%), Central America (38 | 0.6%), Mexico (36 | 0.5%), and South Eastern Asia (31 | 0.5%), together accounting for 2.9% of all Lac qui Parle County residents.

| Immigration Origin | # Population | % Population |
| Africa | 12 | 0.2% |
| Asia | 46 | 0.7% |
| Canada | 7 | 0.1% |
| Caribbean | 2 | 0.0% |
| Central America | 38 | 0.6% |
| Colombia | 5 | 0.1% |
| Czechoslovakia | 1 | 0.0% |
| Eastern Africa | 5 | 0.1% |
| Eastern Asia | 8 | 0.1% |
| Eastern Europe | 1 | 0.0% |
| Europe | 9 | 0.1% |
| Germany | 2 | 0.0% |
| Guatemala | 2 | 0.0% |
| Haiti | 2 | 0.0% |
| Kazakhstan | 7 | 0.1% |
| Kenya | 1 | 0.0% |
| Korea | 8 | 0.1% |
| Laos | 10 | 0.2% |
| Latin America | 45 | 0.7% |
| Mexico | 36 | 0.5% |
| Netherlands | 2 | 0.0% |
| Nigeria | 4 | 0.1% |
| Northern Europe | 2 | 0.0% |
| Philippines | 17 | 0.3% |
| Somalia | 1 | 0.0% |
| South Africa | 3 | 0.0% |
| South America | 5 | 0.1% |
| South Central Asia | 7 | 0.1% |
| South Eastern Asia | 31 | 0.5% |
| Southern Europe | 2 | 0.0% |
| Spain | 2 | 0.0% |
| Sweden | 2 | 0.0% |
| Thailand | 4 | 0.1% |
| Western Africa | 4 | 0.1% |
| Western Europe | 4 | 0.1% | View All 35 Rows |
Sex and Age in Lac qui Parle County
Sex and Age in Lac qui Parle County
The most populous age groups in Lac qui Parle County are 60 to 64 Years (325 | 9.5%) for men and 60 to 64 Years (268 | 8.1%) for women.

| Age Bracket | Male | Female |
| Under 5 Years | 195 (5.7%) | 144 (4.4%) |
| 5 to 9 Years | 237 (6.9%) | 190 (5.8%) |
| 10 to 14 Years | 207 (6.0%) | 174 (5.3%) |
| 15 to 19 Years | 209 (6.1%) | 168 (5.1%) |
| 20 to 24 Years | 146 (4.3%) | 172 (5.2%) |
| 25 to 29 Years | 150 (4.4%) | 139 (4.2%) |
| 30 to 34 Years | 131 (3.8%) | 135 (4.1%) |
| 35 to 39 Years | 219 (6.4%) | 198 (6.0%) |
| 40 to 44 Years | 146 (4.3%) | 175 (5.3%) |
| 45 to 49 Years | 174 (5.1%) | 159 (4.8%) |
| 50 to 54 Years | 210 (6.1%) | 164 (5.0%) |
| 55 to 59 Years | 222 (6.5%) | 248 (7.5%) |
| 60 to 64 Years | 325 (9.5%) | 268 (8.1%) |
| 65 to 69 Years | 317 (9.2%) | 255 (7.7%) |
| 70 to 74 Years | 166 (4.8%) | 202 (6.1%) |
| 75 to 79 Years | 135 (3.9%) | 194 (5.9%) |
| 80 to 84 Years | 154 (4.5%) | 131 (4.0%) |
| 85 Years and over | 96 (2.8%) | 181 (5.5%) |
| Total | 3,439 (100.0%) | 3,297 (100.0%) |
Families and Households in Lac qui Parle County
Median Family Size in Lac qui Parle County
The median family size in Lac qui Parle County is 2.83 persons per family, with single female/mother families (139 | 7.6%) accounting for the largest median family size of 3.28 persons per family. On the other hand, single male/father families (123 | 6.7%) represent the smallest median family size with 2.53 persons per family.

| Family Type | # Families | Family Size |
| Married-Couple | 1,566 (85.7%) | 2.81 |
| Single Male/Father | 123 (6.7%) | 2.53 |
| Single Female/Mother | 139 (7.6%) | 3.28 |
| Total Families | 1,828 (100.0%) | 2.83 |
Median Household Size in Lac qui Parle County
The median household size in Lac qui Parle County is 2.32 persons per household, with single female/mother households (139 | 4.9%) accounting for the largest median household size of 3.49 persons per household. non-family households (1,010 | 35.6%) represent the smallest median household size with 1.21 persons per household.

| Household Type | # Households | Household Size |
| Married-Couple | 1,566 (55.2%) | 2.85 |
| Single Male/Father | 123 (4.3%) | 3.33 |
| Single Female/Mother | 139 (4.9%) | 3.49 |
| Non-family | 1,010 (35.6%) | 1.21 |
| Total Households | 2,838 (100.0%) | 2.32 |
Household Size by Marriage Status in Lac qui Parle County
Out of a total of 2,838 households in Lac qui Parle County, 1,828 (64.4%) are family households, while 1,010 (35.6%) are nonfamily households. The most numerous type of family households are 2-person households, comprising 1,060, and the most common type of nonfamily households are 1-person households, comprising 864.

| Household Size | Family Households | Nonfamily Households |
| 1-Person Households | - | 864 (30.4%) |
| 2-Person Households | 1,060 (37.3%) | 136 (4.8%) |
| 3-Person Households | 317 (11.2%) | 1 (0.0%) |
| 4-Person Households | 238 (8.4%) | 5 (0.2%) |
| 5-Person Households | 160 (5.6%) | 4 (0.1%) |
| 6-Person Households | 42 (1.5%) | 0 (0.0%) |
| 7+ Person Households | 11 (0.4%) | 0 (0.0%) |
| Total | 1,828 (64.4%) | 1,010 (35.6%) |
Female Fertility in Lac qui Parle County
Fertility by Age in Lac qui Parle County
Average fertility rate in Lac qui Parle County is 51.0 births per 1,000 women. Women in the age bracket of 20 to 34 years have the highest fertility rate with 103.0 births per 1,000 women. Women in the age bracket of 20 to 34 years acount for 76.7% of all women with births.

| Age Bracket | Women with Births | Births / 1,000 Women |
| 15 to 19 years | 0 (0.0%) | 0.0 |
| 20 to 34 years | 46 (76.7%) | 103.0 |
| 35 to 50 years | 14 (23.3%) | 24.0 |
| Total | 60 (100.0%) | 51.0 |
Fertility by Age by Marriage Status in Lac qui Parle County
76.7% of women with births (60) in Lac qui Parle County are married. The highest percentage of unmarried women with births falls into 20 to 34 years age bracket with 28.3% of them unmarried at the time of birth, while the lowest percentage of unmarried women with births belong to 35 to 50 years age bracket with 7.1% of them unmarried.

| Age Bracket | Married | Unmarried |
| 15 to 19 years | 0 (0.0%) | 0 (0.0%) |
| 20 to 34 years | 33 (71.7%) | 13 (28.3%) |
| 35 to 50 years | 13 (92.9%) | 1 (7.1%) |
| Total | 46 (76.7%) | 14 (23.3%) |
Fertility by Education in Lac qui Parle County

| Educational Attainment | Women with Births | Births / 1,000 Women |
| Less than High School | 0 (0.0%) | 0.0 |
| High School Diploma | 6 (10.0%) | 29.0 |
| College or Associate's Degree | 34 (56.7%) | 79.0 |
| Bachelor's Degree | 11 (18.3%) | 39.0 |
| Graduate Degree | 9 (15.0%) | 145.0 |
| Total | 60 (100.0%) | 51.0 |
Fertility by Education by Marriage Status in Lac qui Parle County
23.3% of women with births in Lac qui Parle County are unmarried. Women with the educational attainment of bachelor's degree are most likely to be married with 100.0% of them married at childbirth, while women with the educational attainment of college or associate's degree are least likely to be married with 38.2% of them unmarried at childbirth.

| Educational Attainment | Married | Unmarried |
| Less than High School | 0 (0.0%) | 0 (0.0%) |
| High School Diploma | 5 (83.3%) | 1 (16.7%) |
| College or Associate's Degree | 21 (61.8%) | 13 (38.2%) |
| Bachelor's Degree | 11 (100.0%) | 0 (0.0%) |
| Graduate Degree | 9 (100.0%) | 0 (0.0%) |
| Total | 46 (76.7%) | 14 (23.3%) |
Income in Lac qui Parle County
Income Overview in Lac qui Parle County
Per Capita Income in Lac qui Parle County is $37,520, while median incomes of families and households are $83,958 and $66,967 respectively.
| Characteristic | Number | Measure |
| Per Capita Income | 6,736 | $37,520 |
| Median Family Income | 1,828 | $83,958 |
| Mean Family Income | 1,828 | $106,601 |
| Median Household Income | 2,838 | $66,967 |
| Mean Household Income | 2,838 | $86,770 |
| Income Deficit | 1,828 | $12,057 |
| Wage / Income Gap (%) | 6,736 | 41.78% |
| Wage / Income Gap ($) | 6,736 | 58.22¢ per $1 |
| Gini / Inequality Index | 6,736 | 0.44 |
Earnings by Sex in Lac qui Parle County
Average Earnings in Lac qui Parle County are $38,638, $47,410 for men and $27,601 for women, a difference of 41.8%.

| Sex | Number | Average Earnings |
| Male | 1,964 (54.1%) | $47,410 |
| Female | 1,665 (45.9%) | $27,601 |
| Total | 3,629 (100.0%) | $38,638 |
Earnings by Sex by Income Bracket in Lac qui Parle County
The most common earnings brackets in Lac qui Parle County are $100,000+ for men (228 | 11.6%) and $2,499 or less for women (165 | 9.9%).

| Income | Male | Female |
| $2,499 or less | 81 (4.1%) | 165 (9.9%) |
| $2,500 to $4,999 | 59 (3.0%) | 91 (5.5%) |
| $5,000 to $7,499 | 63 (3.2%) | 99 (5.9%) |
| $7,500 to $9,999 | 43 (2.2%) | 54 (3.2%) |
| $10,000 to $12,499 | 37 (1.9%) | 48 (2.9%) |
| $12,500 to $14,999 | 23 (1.2%) | 73 (4.4%) |
| $15,000 to $17,499 | 14 (0.7%) | 61 (3.7%) |
| $17,500 to $19,999 | 30 (1.5%) | 63 (3.8%) |
| $20,000 to $22,499 | 30 (1.5%) | 38 (2.3%) |
| $22,500 to $24,999 | 60 (3.0%) | 70 (4.2%) |
| $25,000 to $29,999 | 124 (6.3%) | 130 (7.8%) |
| $30,000 to $34,999 | 132 (6.7%) | 107 (6.4%) |
| $35,000 to $39,999 | 88 (4.5%) | 86 (5.2%) |
| $40,000 to $44,999 | 118 (6.0%) | 103 (6.2%) |
| $45,000 to $49,999 | 141 (7.2%) | 60 (3.6%) |
| $50,000 to $54,999 | 160 (8.2%) | 58 (3.5%) |
| $55,000 to $64,999 | 204 (10.4%) | 113 (6.8%) |
| $65,000 to $74,999 | 121 (6.2%) | 96 (5.8%) |
| $75,000 to $99,999 | 208 (10.6%) | 89 (5.3%) |
| $100,000+ | 228 (11.6%) | 61 (3.7%) |
| Total | 1,964 (100.0%) | 1,665 (100.0%) |
Earnings by Sex by Educational Attainment in Lac qui Parle County
Average earnings in Lac qui Parle County are $50,842 for men and $31,318 for women, a difference of 38.4%. Men with an educational attainment of bachelor's degree enjoy the highest average annual earnings of $72,125, while those with less than high school education earn the least with $32,143. Women with an educational attainment of graduate degree earn the most with the average annual earnings of $59,107, while those with high school diploma education have the smallest earnings of $17,465.

| Educational Attainment | Male Income | Female Income |
| Less than High School | $32,143 | $21,250 |
| High School Diploma | $46,917 | $17,465 |
| College or Associate's Degree | $49,333 | $33,300 |
| Bachelor's Degree | $72,125 | $42,500 |
| Graduate Degree | $69,792 | $59,107 |
| Total | $50,842 | $31,318 |
Family Income in Lac qui Parle County
Family Income Brackets in Lac qui Parle County
According to the Lac qui Parle County family income data, there are 389 families falling into the $100,000 to $149,999 income range, which is the most common income bracket and makes up 21.3% of all families. Conversely, the $10,000 to $14,999 income bracket is the least frequent group with only 18 families (1.0%) belonging to this category.

| Income Bracket | # Families | % Families |
| Less than $10,000 | 51 | 2.8% |
| $10,000 to $14,999 | 18 | 1.0% |
| $15,000 to $24,999 | 38 | 2.1% |
| $25,000 to $34,999 | 108 | 5.9% |
| $35,000 to $49,999 | 219 | 12.0% |
| $50,000 to $74,999 | 349 | 19.1% |
| $75,000 to $99,999 | 333 | 18.2% |
| $100,000 to $149,999 | 389 | 21.3% |
| $150,000 to $199,999 | 141 | 7.7% |
| $200,000+ | 179 | 9.8% |
Family Income by Famaliy Size in Lac qui Parle County
5-person families (147 | 8.0%) account for the highest median family income in Lac qui Parle County with $117,917 per family, while 2-person families (1,112 | 60.8%) have the highest median income of $37,448 per family member.

| Income Bracket | # Families | Median Income |
| 2-Person Families | 1,112 (60.8%) | $74,896 |
| 3-Person Families | 314 (17.2%) | $85,800 |
| 4-Person Families | 215 (11.8%) | $107,813 |
| 5-Person Families | 147 (8.0%) | $117,917 |
| 6-Person Families | 29 (1.6%) | $101,875 |
| 7+ Person Families | 11 (0.6%) | $0 |
| Total | 1,828 (100.0%) | $83,958 |
Family Income by Number of Earners in Lac qui Parle County
The median family income in Lac qui Parle County is $83,958, with families comprising 3+ earners (155) having the highest median family income of $121,806, while families with no earners (309) have the lowest median family income of $52,361, accounting for 8.5% and 16.9% of families, respectively.

| Number of Earners | # Families | Median Income |
| No Earners | 309 (16.9%) | $52,361 |
| 1 Earner | 548 (30.0%) | $61,765 |
| 2 Earners | 816 (44.6%) | $99,474 |
| 3+ Earners | 155 (8.5%) | $121,806 |
| Total | 1,828 (100.0%) | $83,958 |
Household Income in Lac qui Parle County
Household Income Brackets in Lac qui Parle County
With 562 households falling in the category, the $50,000 to $74,999 income range is the most frequent in Lac qui Parle County, accounting for 19.8% of all households. In contrast, only 114 households (4.0%) fall into the $10,000 to $14,999 income bracket, making it the least populous group.

| Income Bracket | # Households | % Households |
| Less than $10,000 | 116 | 4.1% |
| $10,000 to $14,999 | 114 | 4.0% |
| $15,000 to $24,999 | 238 | 8.4% |
| $25,000 to $34,999 | 224 | 7.9% |
| $35,000 to $49,999 | 343 | 12.1% |
| $50,000 to $74,999 | 562 | 19.8% |
| $75,000 to $99,999 | 434 | 15.3% |
| $100,000 to $149,999 | 454 | 16.0% |
| $150,000 to $199,999 | 159 | 5.6% |
| $200,000+ | 193 | 6.8% |
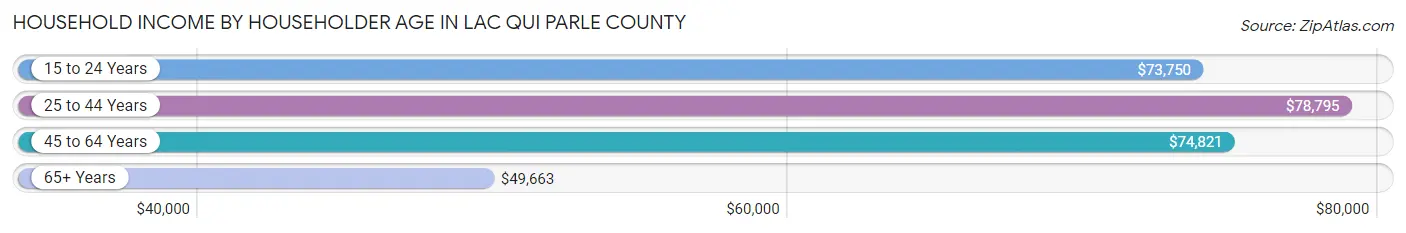
Household Income by Householder Age in Lac qui Parle County
The median household income in Lac qui Parle County is $66,967, with the highest median household income of $78,795 found in the 25 to 44 years age bracket for the primary householder. A total of 665 households (23.4%) fall into this category. Meanwhile, the 65+ years age bracket for the primary householder has the lowest median household income of $49,663, with 1,121 households (39.5%) in this group.
| Income Bracket | # Households | Median Income |
| 15 to 24 Years | 68 (2.4%) | $73,750 |
| 25 to 44 Years | 665 (23.4%) | $78,795 |
| 45 to 64 Years | 984 (34.7%) | $74,821 |
| 65+ Years | 1,121 (39.5%) | $49,663 |
| Total | 2,838 (100.0%) | $66,967 |
Poverty in Lac qui Parle County
Income Below Poverty by Sex and Age in Lac qui Parle County
With 6.6% poverty level for males and 10.9% for females among the residents of Lac qui Parle County, 6 to 11 year old males and 15 year old females are the most vulnerable to poverty, with 27 males (10.1%) and 16 females (55.2%) in their respective age groups living below the poverty level.

| Age Bracket | Male | Female |
| Under 5 Years | 17 (8.9%) | 21 (15.0%) |
| 5 Years | 0 (0.0%) | 0 (0.0%) |
| 6 to 11 Years | 27 (10.1%) | 9 (4.2%) |
| 12 to 14 Years | 9 (6.8%) | 4 (4.0%) |
| 15 Years | 2 (6.2%) | 16 (55.2%) |
| 16 and 17 Years | 9 (9.0%) | 27 (26.2%) |
| 18 to 24 Years | 12 (5.4%) | 39 (18.8%) |
| 25 to 34 Years | 15 (5.4%) | 36 (13.1%) |
| 35 to 44 Years | 12 (3.3%) | 44 (12.2%) |
| 45 to 54 Years | 22 (6.1%) | 23 (7.1%) |
| 55 to 64 Years | 47 (8.6%) | 54 (10.5%) |
| 65 to 74 Years | 32 (6.6%) | 27 (6.1%) |
| 75 Years and over | 16 (4.6%) | 50 (10.7%) |
| Total | 220 (6.6%) | 350 (10.9%) |
Income Above Poverty by Sex and Age in Lac qui Parle County
According to the poverty statistics in Lac qui Parle County, males aged 5 years and females aged 5 years are the age groups that are most secure financially, with 100.0% of males and 100.0% of females in these age groups living above the poverty line.

| Age Bracket | Male | Female |
| Under 5 Years | 173 (91.0%) | 119 (85.0%) |
| 5 Years | 29 (100.0%) | 41 (100.0%) |
| 6 to 11 Years | 240 (89.9%) | 204 (95.8%) |
| 12 to 14 Years | 123 (93.2%) | 96 (96.0%) |
| 15 Years | 30 (93.8%) | 13 (44.8%) |
| 16 and 17 Years | 91 (91.0%) | 76 (73.8%) |
| 18 to 24 Years | 211 (94.6%) | 169 (81.2%) |
| 25 to 34 Years | 263 (94.6%) | 238 (86.9%) |
| 35 to 44 Years | 350 (96.7%) | 317 (87.8%) |
| 45 to 54 Years | 339 (93.9%) | 300 (92.9%) |
| 55 to 64 Years | 500 (91.4%) | 462 (89.5%) |
| 65 to 74 Years | 451 (93.4%) | 417 (93.9%) |
| 75 Years and over | 331 (95.4%) | 418 (89.3%) |
| Total | 3,131 (93.4%) | 2,870 (89.1%) |
Income Below Poverty Among Married-Couple Families in Lac qui Parle County
The poverty statistics for married-couple families in Lac qui Parle County show that 1.5% or 24 of the total 1,566 families live below the poverty line. Families with 1 or 2 children have the highest poverty rate of 2.1%, comprising of 7 families. On the other hand, families with 5 or more children have the lowest poverty rate of 0.0%, which includes 0 families.

| Children | Above Poverty | Below Poverty |
| No Children | 1,049 (98.5%) | 16 (1.5%) |
| 1 or 2 Children | 333 (97.9%) | 7 (2.1%) |
| 3 or 4 Children | 153 (99.4%) | 1 (0.6%) |
| 5 or more Children | 7 (100.0%) | 0 (0.0%) |
| Total | 1,542 (98.5%) | 24 (1.5%) |
Income Below Poverty Among Single-Parent Households in Lac qui Parle County
According to the poverty data in Lac qui Parle County, 11.4% or 14 single-father households and 35.2% or 49 single-mother households are living below the poverty line. Among single-father households, those with 1 or 2 children have the highest poverty rate, with 14 households (17.1%) experiencing poverty. Likewise, among single-mother households, those with 3 or 4 children have the highest poverty rate, with 12 households (75.0%) falling below the poverty line.

| Children | Single Father | Single Mother |
| No Children | 0 (0.0%) | 5 (11.9%) |
| 1 or 2 Children | 14 (17.1%) | 32 (39.5%) |
| 3 or 4 Children | 0 (0.0%) | 12 (75.0%) |
| 5 or more Children | 0 (0.0%) | 0 (0.0%) |
| Total | 14 (11.4%) | 49 (35.2%) |
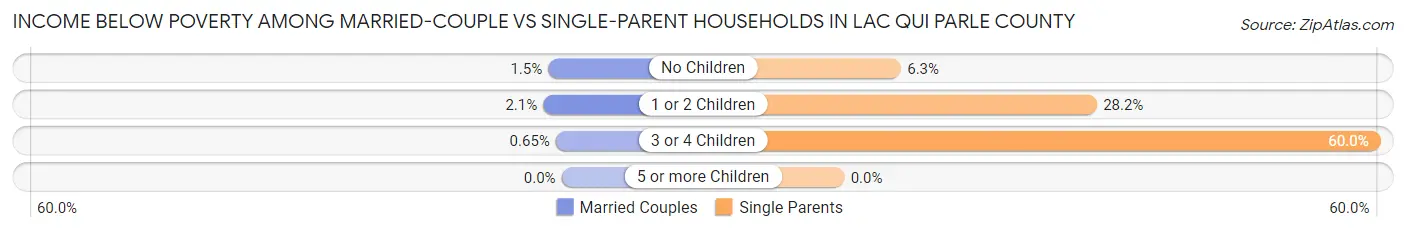
Income Below Poverty Among Married-Couple vs Single-Parent Households in Lac qui Parle County
The poverty data for Lac qui Parle County shows that 24 of the married-couple family households (1.5%) and 63 of the single-parent households (24.0%) are living below the poverty level. Within the married-couple family households, those with 1 or 2 children have the highest poverty rate, with 7 households (2.1%) falling below the poverty line. Among the single-parent households, those with 3 or 4 children have the highest poverty rate, with 12 household (60.0%) living below poverty.
| Children | Married-Couple Families | Single-Parent Households |
| No Children | 16 (1.5%) | 5 (6.3%) |
| 1 or 2 Children | 7 (2.1%) | 46 (28.2%) |
| 3 or 4 Children | 1 (0.6%) | 12 (60.0%) |
| 5 or more Children | 0 (0.0%) | 0 (0.0%) |
| Total | 24 (1.5%) | 63 (24.0%) |
Employment Characteristics in Lac qui Parle County
Employment by Class of Employer in Lac qui Parle County
Among the 3,142 employed individuals in Lac qui Parle County, private company employees (1,608 | 51.2%), self-employed (not incorporated) (541 | 17.2%), and local government employees (382 | 12.2%) make up the most common classes of employment.

| Employer Class | # Employees | % Employees |
| Private Company Employees | 1,608 | 51.2% |
| Self-Employed (Incorporated) | 125 | 4.0% |
| Self-Employed (Not Incorporated) | 541 | 17.2% |
| Not-for-profit Organizations | 373 | 11.9% |
| Local Government Employees | 382 | 12.2% |
| State Government Employees | 42 | 1.3% |
| Federal Government Employees | 48 | 1.5% |
| Unpaid Family Workers | 23 | 0.7% |
| Total | 3,142 | 100.0% |
Employment Status by Age in Lac qui Parle County
According to the labor force statistics for Lac qui Parle County, out of the total population over 16 years of age (5,528), 59.4% or 3,284 individuals are in the labor force, with 2.1% or 69 of them unemployed. The age group with the highest labor force participation rate is 30 to 34 years, with 93.6% or 249 individuals in the labor force. Within the labor force, the 16 to 19 years age range has the highest percentage of unemployed individuals, with 16.1% or 24 of them being unemployed.

| Age Bracket | In Labor Force | Unemployed |
| 16 to 19 Years | 149 (47.2%) | 24 (16.1%) |
| 20 to 24 Years | 277 (87.1%) | 2 (0.7%) |
| 25 to 29 Years | 248 (85.8%) | 0 (0.0%) |
| 30 to 34 Years | 249 (93.6%) | 6 (2.4%) |
| 35 to 44 Years | 627 (85.0%) | 12 (1.9%) |
| 45 to 54 Years | 561 (79.3%) | 14 (2.5%) |
| 55 to 59 Years | 371 (78.9%) | 2 (0.5%) |
| 60 to 64 Years | 396 (66.8%) | 6 (1.5%) |
| 65 to 74 Years | 329 (35.0%) | 0 (0.0%) |
| 75 Years and over | 76 (8.5%) | 4 (5.3%) |
| Total | 3,284 (59.4%) | 69 (2.1%) |
Employment Status by Educational Attainment in Lac qui Parle County
According to labor force statistics for Lac qui Parle County, 80.1% of individuals (2,453) out of the total population between 25 and 64 years of age (3,063) are in the labor force, with 1.6% or 39 of them being unemployed. The group with the highest labor force participation rate are those with the educational attainment of bachelor's degree or higher, with 86.6% or 607 individuals in the labor force. Within the labor force, individuals with less than high school education have the highest percentage of unemployment, with 2.9% or 3 of them being unemployed.

| Educational Attainment | In Labor Force | Unemployed |
| Less than High School | 102 (63.8%) | 5 (2.9%) |
| High School Diploma | 699 (72.4%) | 10 (1.0%) |
| College / Associate Degree | 1,044 (84.4%) | 28 (2.3%) |
| Bachelor's Degree or higher | 607 (86.6%) | 7 (1.0%) |
| Total | 2,453 (80.1%) | 49 (1.6%) |
Employment Occupations by Sex in Lac qui Parle County
Management, Business, Science and Arts Occupations
The most common Management, Business, Science and Arts occupations in Lac qui Parle County are Management (638 | 19.9%), Community & Social Service (296 | 9.2%), Health Diagnosing & Treating (278 | 8.7%), Education Instruction & Library (175 | 5.5%), and Health Technologists (147 | 4.6%).

Management, Business, Science and Arts Occupations by Sex
Within the Management, Business, Science and Arts occupations in Lac qui Parle County, the most male-oriented occupations are Architecture & Engineering (100.0%), Computers, Engineering & Science (71.6%), and Management (71.0%), while the most female-oriented occupations are Legal Services & Support (100.0%), Arts, Media & Entertainment (91.3%), and Education Instruction & Library (89.7%).

| Occupation | Male | Female |
| Management | 453 (71.0%) | 185 (29.0%) |
| Business & Financial | 46 (43.0%) | 61 (57.0%) |
| Computers, Engineering & Science | 58 (71.6%) | 23 (28.4%) |
| Computers & Mathematics | 13 (59.1%) | 9 (40.9%) |
| Architecture & Engineering | 24 (100.0%) | 0 (0.0%) |
| Life, Physical & Social Science | 21 (60.0%) | 14 (40.0%) |
| Community & Social Service | 43 (14.5%) | 253 (85.5%) |
| Education, Arts & Media | 23 (24.5%) | 71 (75.5%) |
| Legal Services & Support | 0 (0.0%) | 4 (100.0%) |
| Education Instruction & Library | 18 (10.3%) | 157 (89.7%) |
| Arts, Media & Entertainment | 2 (8.7%) | 21 (91.3%) |
| Health Diagnosing & Treating | 35 (12.6%) | 243 (87.4%) |
| Health Technologists | 32 (21.8%) | 115 (78.2%) |
| Total (Category) | 635 (45.4%) | 765 (54.6%) |
| Total (Overall) | 1,733 (54.1%) | 1,472 (45.9%) |
Services Occupations
The most common Services occupations in Lac qui Parle County are Healthcare Support (122 | 3.8%), Food Preparation & Serving (114 | 3.6%), Cleaning & Maintenance (100 | 3.1%), Personal Care & Service (68 | 2.1%), and Security & Protection (19 | 0.6%).

Services Occupations by Sex
Within the Services occupations in Lac qui Parle County, the most male-oriented occupations are Cleaning & Maintenance (67.0%), Law Enforcement (66.7%), and Security & Protection (63.2%), while the most female-oriented occupations are Healthcare Support (98.4%), Personal Care & Service (94.1%), and Food Preparation & Serving (83.3%).

| Occupation | Male | Female |
| Healthcare Support | 2 (1.6%) | 120 (98.4%) |
| Security & Protection | 12 (63.2%) | 7 (36.8%) |
| Firefighting & Prevention | 2 (50.0%) | 2 (50.0%) |
| Law Enforcement | 10 (66.7%) | 5 (33.3%) |
| Food Preparation & Serving | 19 (16.7%) | 95 (83.3%) |
| Cleaning & Maintenance | 67 (67.0%) | 33 (33.0%) |
| Personal Care & Service | 4 (5.9%) | 64 (94.1%) |
| Total (Category) | 104 (24.6%) | 319 (75.4%) |
| Total (Overall) | 1,733 (54.1%) | 1,472 (45.9%) |
Sales and Office Occupations
The most common Sales and Office occupations in Lac qui Parle County are Office & Administration (244 | 7.6%), and Sales & Related (215 | 6.7%).

Sales and Office Occupations by Sex

| Occupation | Male | Female |
| Sales & Related | 128 (59.5%) | 87 (40.5%) |
| Office & Administration | 34 (13.9%) | 210 (86.1%) |
| Total (Category) | 162 (35.3%) | 297 (64.7%) |
| Total (Overall) | 1,733 (54.1%) | 1,472 (45.9%) |
Natural Resources, Construction and Maintenance Occupations
The most common Natural Resources, Construction and Maintenance occupations in Lac qui Parle County are Construction & Extraction (193 | 6.0%), Installation, Maintenance & Repair (143 | 4.5%), and Farming, Fishing & Forestry (97 | 3.0%).

Natural Resources, Construction and Maintenance Occupations by Sex

| Occupation | Male | Female |
| Farming, Fishing & Forestry | 85 (87.6%) | 12 (12.4%) |
| Construction & Extraction | 191 (99.0%) | 2 (1.0%) |
| Installation, Maintenance & Repair | 143 (100.0%) | 0 (0.0%) |
| Total (Category) | 419 (96.8%) | 14 (3.2%) |
| Total (Overall) | 1,733 (54.1%) | 1,472 (45.9%) |
Production, Transportation and Moving Occupations
The most common Production, Transportation and Moving occupations in Lac qui Parle County are Production (220 | 6.9%), Transportation (180 | 5.6%), and Material Moving (90 | 2.8%).

Production, Transportation and Moving Occupations by Sex

| Occupation | Male | Female |
| Production | 171 (77.7%) | 49 (22.3%) |
| Transportation | 172 (95.6%) | 8 (4.4%) |
| Material Moving | 70 (77.8%) | 20 (22.2%) |
| Total (Category) | 413 (84.3%) | 77 (15.7%) |
| Total (Overall) | 1,733 (54.1%) | 1,472 (45.9%) |
Employment Industries by Sex in Lac qui Parle County
Employment Industries in Lac qui Parle County
The major employment industries in Lac qui Parle County include Health Care & Social Assistance (614 | 19.2%), Agriculture, Fishing & Hunting (501 | 15.6%), Manufacturing (358 | 11.2%), Retail Trade (289 | 9.0%), and Educational Services (240 | 7.5%).

Employment Industries by Sex in Lac qui Parle County
The Lac qui Parle County industries that see more men than women are Mining, Quarrying, & Extraction (100.0%), Enterprise Management (100.0%), and Construction (97.0%), whereas the industries that tend to have a higher number of women are Health Care & Social Assistance (87.8%), Accommodation & Food Services (82.1%), and Educational Services (78.7%).

| Industry | Male | Female |
| Agriculture, Fishing & Hunting | 438 (87.4%) | 63 (12.6%) |
| Mining, Quarrying, & Extraction | 6 (100.0%) | 0 (0.0%) |
| Construction | 224 (97.0%) | 7 (3.0%) |
| Manufacturing | 255 (71.2%) | 103 (28.8%) |
| Wholesale Trade | 104 (95.4%) | 5 (4.6%) |
| Retail Trade | 153 (52.9%) | 136 (47.1%) |
| Transportation & Warehousing | 100 (87.7%) | 14 (12.3%) |
| Utilities | 7 (70.0%) | 3 (30.0%) |
| Information | 14 (53.8%) | 12 (46.2%) |
| Finance & Insurance | 51 (33.6%) | 101 (66.4%) |
| Real Estate, Rental & Leasing | 8 (32.0%) | 17 (68.0%) |
| Professional & Scientific | 32 (46.4%) | 37 (53.6%) |
| Enterprise Management | 4 (100.0%) | 0 (0.0%) |
| Administrative & Support | 41 (73.2%) | 15 (26.8%) |
| Educational Services | 51 (21.2%) | 189 (78.7%) |
| Health Care & Social Assistance | 75 (12.2%) | 539 (87.8%) |
| Arts, Entertainment & Recreation | 8 (34.8%) | 15 (65.2%) |
| Accommodation & Food Services | 21 (17.9%) | 96 (82.1%) |
| Public Administration | 50 (45.1%) | 61 (54.9%) |
| Total | 1,733 (54.1%) | 1,472 (45.9%) |
Education in Lac qui Parle County
School Enrollment in Lac qui Parle County
The most common levels of schooling among the 1,276 students in Lac qui Parle County are high school (368 | 28.8%), elementary school (298 | 23.4%), and middle school (272 | 21.3%).

| School Level | # Students | % Students |
| Nursery / Preschool | 84 | 6.6% |
| Kindergarten | 96 | 7.5% |
| Elementary School | 298 | 23.4% |
| Middle School | 272 | 21.3% |
| High School | 368 | 28.8% |
| College / Undergraduate | 125 | 9.8% |
| Graduate / Professional | 33 | 2.6% |
| Total | 1,276 | 100.0% |
School Enrollment by Age by Funding Source in Lac qui Parle County
Out of a total of 1,276 students who are enrolled in schools in Lac qui Parle County, 102 (8.0%) attend a private institution, while the remaining 1,174 (92.0%) are enrolled in public schools. The age group of 35 years and over has the highest likelihood of being enrolled in private schools, with 14 (28.0% in the age bracket) enrolled. Conversely, the age group of 20 to 24 year olds has the lowest likelihood of being enrolled in a private school, with 58 (100.0% in the age bracket) attending a public institution.

| Age Bracket | Public School | Private School |
| 3 to 4 Year Olds | 41 (91.1%) | 4 (8.9%) |
| 5 to 9 Year Old | 389 (97.3%) | 11 (2.8%) |
| 10 to 14 Year Olds | 307 (85.8%) | 51 (14.2%) |
| 15 to 17 Year Olds | 253 (95.8%) | 11 (4.2%) |
| 18 to 19 Year Olds | 57 (93.4%) | 4 (6.6%) |
| 20 to 24 Year Olds | 58 (100.0%) | 0 (0.0%) |
| 25 to 34 Year Olds | 33 (82.5%) | 7 (17.5%) |
| 35 Years and over | 36 (72.0%) | 14 (28.0%) |
| Total | 1,174 (92.0%) | 102 (8.0%) |
Educational Attainment by Field of Study in Lac qui Parle County
Education (301 | 27.0%), bio, nature & agricultural (176 | 15.8%), business (145 | 13.0%), science & technology (126 | 11.3%), and arts & humanities (68 | 6.1%) are the most common fields of study among 1,116 individuals in Lac qui Parle County who have obtained a bachelor's degree or higher.

| Field of Study | # Graduates | % Graduates |
| Computers & Mathematics | 26 | 2.3% |
| Bio, Nature & Agricultural | 176 | 15.8% |
| Physical & Health Sciences | 42 | 3.8% |
| Psychology | 51 | 4.6% |
| Social Sciences | 51 | 4.6% |
| Engineering | 23 | 2.1% |
| Multidisciplinary Studies | 9 | 0.8% |
| Science & Technology | 126 | 11.3% |
| Business | 145 | 13.0% |
| Education | 301 | 27.0% |
| Literature & Languages | 25 | 2.2% |
| Liberal Arts & History | 27 | 2.4% |
| Visual & Performing Arts | 30 | 2.7% |
| Communications | 16 | 1.4% |
| Arts & Humanities | 68 | 6.1% |
| Total | 1,116 | 100.0% |
Transportation & Commute in Lac qui Parle County
Vehicle Availability by Sex in Lac qui Parle County
The most prevalent vehicle ownership categories in Lac qui Parle County are males with 2 vehicles (641, accounting for 37.5%) and females with 2 vehicles (538, making up 45.0%).

| Vehicles Available | Male | Female |
| No Vehicle | 8 (0.5%) | 26 (1.8%) |
| 1 Vehicle | 182 (10.6%) | 149 (10.5%) |
| 2 Vehicles | 641 (37.5%) | 538 (37.8%) |
| 3 Vehicles | 500 (29.2%) | 453 (31.8%) |
| 4 Vehicles | 214 (12.5%) | 163 (11.4%) |
| 5 or more Vehicles | 165 (9.7%) | 96 (6.7%) |
| Total | 1,710 (100.0%) | 1,425 (100.0%) |
Commute Time in Lac qui Parle County
The most frequently occuring commute durations in Lac qui Parle County are 5 to 9 minutes (641 commuters, 23.4%), less than 5 minutes (467 commuters, 17.1%), and 10 to 14 minutes (352 commuters, 12.9%).

| Commute Time | # Commuters | % Commuters |
| Less than 5 Minutes | 467 | 17.1% |
| 5 to 9 Minutes | 641 | 23.4% |
| 10 to 14 Minutes | 352 | 12.9% |
| 15 to 19 Minutes | 321 | 11.7% |
| 20 to 24 Minutes | 295 | 10.8% |
| 25 to 29 Minutes | 120 | 4.4% |
| 30 to 34 Minutes | 260 | 9.5% |
| 35 to 39 Minutes | 43 | 1.6% |
| 40 to 44 Minutes | 29 | 1.1% |
| 45 to 59 Minutes | 82 | 3.0% |
| 60 to 89 Minutes | 89 | 3.3% |
| 90 or more Minutes | 35 | 1.3% |
Commute Time by Sex in Lac qui Parle County
The most common commute times in Lac qui Parle County are 5 to 9 minutes (354 commuters, 24.6%) for males and 5 to 9 minutes (287 commuters, 22.1%) for females.

| Commute Time | Male | Female |
| Less than 5 Minutes | 262 (18.2%) | 205 (15.8%) |
| 5 to 9 Minutes | 354 (24.6%) | 287 (22.1%) |
| 10 to 14 Minutes | 180 (12.5%) | 172 (13.3%) |
| 15 to 19 Minutes | 164 (11.4%) | 157 (12.1%) |
| 20 to 24 Minutes | 119 (8.3%) | 176 (13.6%) |
| 25 to 29 Minutes | 62 (4.3%) | 58 (4.5%) |
| 30 to 34 Minutes | 129 (9.0%) | 131 (10.1%) |
| 35 to 39 Minutes | 20 (1.4%) | 23 (1.8%) |
| 40 to 44 Minutes | 15 (1.0%) | 14 (1.1%) |
| 45 to 59 Minutes | 59 (4.1%) | 23 (1.8%) |
| 60 to 89 Minutes | 52 (3.6%) | 37 (2.9%) |
| 90 or more Minutes | 21 (1.5%) | 14 (1.1%) |
Time of Departure to Work by Sex in Lac qui Parle County
The most frequent times of departure to work in Lac qui Parle County are 7:30 AM to 7:59 AM (260, 18.1%) for males and 7:30 AM to 7:59 AM (347, 26.8%) for females.

| Time of Departure | Male | Female |
| 12:00 AM to 4:59 AM | 66 (4.6%) | 43 (3.3%) |
| 5:00 AM to 5:29 AM | 157 (10.9%) | 36 (2.8%) |
| 5:30 AM to 5:59 AM | 85 (5.9%) | 38 (2.9%) |
| 6:00 AM to 6:29 AM | 102 (7.1%) | 35 (2.7%) |
| 6:30 AM to 6:59 AM | 175 (12.2%) | 108 (8.3%) |
| 7:00 AM to 7:29 AM | 206 (14.3%) | 179 (13.8%) |
| 7:30 AM to 7:59 AM | 260 (18.1%) | 347 (26.8%) |
| 8:00 AM to 8:29 AM | 185 (12.9%) | 252 (19.4%) |
| 8:30 AM to 8:59 AM | 34 (2.4%) | 61 (4.7%) |
| 9:00 AM to 9:59 AM | 52 (3.6%) | 54 (4.2%) |
| 10:00 AM to 10:59 AM | 16 (1.1%) | 13 (1.0%) |
| 11:00 AM to 11:59 AM | 14 (1.0%) | 9 (0.7%) |
| 12:00 PM to 3:59 PM | 40 (2.8%) | 52 (4.0%) |
| 4:00 PM to 11:59 PM | 45 (3.1%) | 70 (5.4%) |
| Total | 1,437 (100.0%) | 1,297 (100.0%) |
Housing Occupancy in Lac qui Parle County
Occupancy by Ownership in Lac qui Parle County
Of the total 2,838 dwellings in Lac qui Parle County, owner-occupied units account for 2,364 (83.3%), while renter-occupied units make up 474 (16.7%).

| Occupancy | # Housing Units | % Housing Units |
| Owner Occupied Housing Units | 2,364 | 83.3% |
| Renter-Occupied Housing Units | 474 | 16.7% |
| Total Occupied Housing Units | 2,838 | 100.0% |
Occupancy by Household Size in Lac qui Parle County

| Household Size | # Housing Units | % Housing Units |
| 1-Person Household | 864 | 30.4% |
| 2-Person Household | 1,196 | 42.1% |
| 3-Person Household | 318 | 11.2% |
| 4+ Person Household | 460 | 16.2% |
| Total Housing Units | 2,838 | 100.0% |
Occupancy by Ownership by Household Size in Lac qui Parle County

| Household Size | Owner-occupied | Renter-occupied |
| 1-Person Household | 633 (73.3%) | 231 (26.7%) |
| 2-Person Household | 1,044 (87.3%) | 152 (12.7%) |
| 3-Person Household | 266 (83.7%) | 52 (16.4%) |
| 4+ Person Household | 421 (91.5%) | 39 (8.5%) |
| Total Housing Units | 2,364 (83.3%) | 474 (16.7%) |
Occupancy by Educational Attainment in Lac qui Parle County

| Household Size | Owner-occupied | Renter-occupied |
| Less than High School | 128 (75.3%) | 42 (24.7%) |
| High School Diploma | 826 (85.2%) | 143 (14.8%) |
| College/Associate Degree | 840 (81.0%) | 197 (19.0%) |
| Bachelor's Degree or higher | 570 (86.1%) | 92 (13.9%) |
Occupancy by Age of Householder in Lac qui Parle County

| Age Bracket | # Households | % Households |
| Under 35 Years | 334 | 11.8% |
| 35 to 44 Years | 399 | 14.1% |
| 45 to 54 Years | 402 | 14.2% |
| 55 to 64 Years | 582 | 20.5% |
| 65 to 74 Years | 541 | 19.1% |
| 75 to 84 Years | 358 | 12.6% |
| 85 Years and Over | 222 | 7.8% |
| Total | 2,838 | 100.0% |
Housing Finances in Lac qui Parle County
Median Income by Occupancy in Lac qui Parle County

| Occupancy Type | # Households | Median Income |
| Owner-Occupied | 2,364 (83.3%) | $72,188 |
| Renter-Occupied | 474 (16.7%) | $37,895 |
| Average | 2,838 (100.0%) | $66,967 |
Occupancy by Householder Income Bracket in Lac qui Parle County

| Income Bracket | Owner-occupied | Renter-occupied |
| Less than $5,000 | 39 (1.7%) | 26 (5.5%) |
| $5,000 to $9,999 | 28 (1.2%) | 23 (4.9%) |
| $10,000 to $14,999 | 62 (2.6%) | 51 (10.8%) |
| $15,000 to $19,999 | 82 (3.5%) | 22 (4.6%) |
| $20,000 to $24,999 | 98 (4.2%) | 36 (7.6%) |
| $25,000 to $34,999 | 155 (6.6%) | 68 (14.3%) |
| $35,000 to $49,999 | 297 (12.6%) | 47 (9.9%) |
| $50,000 to $74,999 | 455 (19.3%) | 107 (22.6%) |
| $75,000 to $99,999 | 363 (15.4%) | 71 (15.0%) |
| $100,000 to $149,999 | 444 (18.8%) | 11 (2.3%) |
| $150,000 or more | 341 (14.4%) | 12 (2.5%) |
| Total | 2,364 (100.0%) | 474 (100.0%) |
Monthly Housing Cost Tiers in Lac qui Parle County

| Monthly Cost | Owner-occupied | Renter-occupied |
| Less than $300 | 196 (8.3%) | 22 (4.6%) |
| $300 to $499 | 605 (25.6%) | 58 (12.2%) |
| $500 to $799 | 542 (22.9%) | 108 (22.8%) |
| $800 to $999 | 299 (12.7%) | 78 (16.5%) |
| $1,000 to $1,499 | 353 (14.9%) | 77 (16.2%) |
| $1,500 to $1,999 | 160 (6.8%) | 3 (0.6%) |
| $2,000 to $2,499 | 122 (5.2%) | 2 (0.4%) |
| $2,500 to $2,999 | 55 (2.3%) | 0 (0.0%) |
| $3,000 or more | 32 (1.3%) | 0 (0.0%) |
| Total | 2,364 (100.0%) | 474 (100.0%) |
Physical Housing Characteristics in Lac qui Parle County
Housing Structures in Lac qui Parle County

| Structure Type | # Housing Units | % Housing Units |
| Single Unit, Detached | 2,578 | 90.8% |
| Single Unit, Attached | 20 | 0.7% |
| 2 Unit Apartments | 12 | 0.4% |
| 3 or 4 Unit Apartments | 22 | 0.8% |
| 5 to 9 Unit Apartments | 28 | 1.0% |
| 10 or more Apartments | 141 | 5.0% |
| Mobile Home / Other | 37 | 1.3% |
| Total | 2,838 | 100.0% |
Housing Structures by Occupancy in Lac qui Parle County

| Structure Type | Owner-occupied | Renter-occupied |
| Single Unit, Detached | 2,318 (89.9%) | 260 (10.1%) |
| Single Unit, Attached | 14 (70.0%) | 6 (30.0%) |
| 2 Unit Apartments | 1 (8.3%) | 11 (91.7%) |
| 3 or 4 Unit Apartments | 0 (0.0%) | 22 (100.0%) |
| 5 to 9 Unit Apartments | 0 (0.0%) | 28 (100.0%) |
| 10 or more Apartments | 0 (0.0%) | 141 (100.0%) |
| Mobile Home / Other | 31 (83.8%) | 6 (16.2%) |
| Total | 2,364 (83.3%) | 474 (16.7%) |
Housing Structures by Number of Rooms in Lac qui Parle County

| Number of Rooms | Owner-occupied | Renter-occupied |
| 1 Room | 12 (0.5%) | 17 (3.6%) |
| 2 or 3 Rooms | 19 (0.8%) | 109 (23.0%) |
| 4 or 5 Rooms | 451 (19.1%) | 137 (28.9%) |
| 6 or 7 Rooms | 885 (37.4%) | 113 (23.8%) |
| 8 or more Rooms | 997 (42.2%) | 98 (20.7%) |
| Total | 2,364 (100.0%) | 474 (100.0%) |
Housing Structure by Heating Type in Lac qui Parle County

| Heating Type | Owner-occupied | Renter-occupied |
| Utility Gas | 966 (40.9%) | 158 (33.3%) |
| Bottled, Tank, or LP Gas | 757 (32.0%) | 63 (13.3%) |
| Electricity | 518 (21.9%) | 212 (44.7%) |
| Fuel Oil or Kerosene | 38 (1.6%) | 9 (1.9%) |
| Coal or Coke | 0 (0.0%) | 0 (0.0%) |
| All other Fuels | 69 (2.9%) | 16 (3.4%) |
| No Fuel Used | 16 (0.7%) | 16 (3.4%) |
| Total | 2,364 (100.0%) | 474 (100.0%) |
Household Vehicle Usage in Lac qui Parle County

| Vehicles per Household | Owner-occupied | Renter-occupied |
| No Vehicle | 49 (2.1%) | 48 (10.1%) |
| 1 Vehicle | 452 (19.1%) | 239 (50.4%) |
| 2 Vehicles | 971 (41.1%) | 125 (26.4%) |
| 3 or more Vehicles | 892 (37.7%) | 62 (13.1%) |
| Total | 2,364 (100.0%) | 474 (100.0%) |
Real Estate & Mortgages in Lac qui Parle County
Real Estate and Mortgage Overview in Lac qui Parle County
| Characteristic | Without Mortgage | With Mortgage |
| Housing Units | 1,327 | 1,037 |
| Median Property Value | $113,200 | $147,700 |
| Median Household Income | $65,625 | $167 |
| Monthly Housing Costs | $461 | $32 |
| Real Estate Taxes | $1,173 | $18 |
Property Value by Mortgage Status in Lac qui Parle County

| Property Value | Without Mortgage | With Mortgage |
| Less than $50,000 | 319 (24.0%) | 128 (12.3%) |
| $50,000 to $99,999 | 258 (19.4%) | 226 (21.8%) |
| $100,000 to $299,999 | 563 (42.4%) | 483 (46.6%) |
| $300,000 to $499,999 | 114 (8.6%) | 130 (12.5%) |
| $500,000 to $749,999 | 28 (2.1%) | 42 (4.1%) |
| $750,000 to $999,999 | 33 (2.5%) | 5 (0.5%) |
| $1,000,000 or more | 12 (0.9%) | 23 (2.2%) |
| Total | 1,327 (100.0%) | 1,037 (100.0%) |
Household Income by Mortgage Status in Lac qui Parle County

| Household Income | Without Mortgage | With Mortgage |
| Less than $10,000 | 51 (3.8%) | 11 (1.1%) |
| $10,000 to $24,999 | 192 (14.5%) | 16 (1.5%) |
| $25,000 to $34,999 | 91 (6.9%) | 50 (4.8%) |
| $35,000 to $49,999 | 165 (12.4%) | 64 (6.2%) |
| $50,000 to $74,999 | 232 (17.5%) | 132 (12.7%) |
| $75,000 to $99,999 | 165 (12.4%) | 223 (21.5%) |
| $100,000 to $149,999 | 257 (19.4%) | 198 (19.1%) |
| $150,000 or more | 174 (13.1%) | 187 (18.0%) |
| Total | 1,327 (100.0%) | 1,037 (100.0%) |
Property Value to Household Income Ratio in Lac qui Parle County

| Value-to-Income Ratio | Without Mortgage | With Mortgage |
| Less than 2.0x | 747 (56.3%) | 79,129 (7,630.6%) |
| 2.0x to 2.9x | 184 (13.9%) | 605 (58.3%) |
| 3.0x to 3.9x | 59 (4.4%) | 156 (15.0%) |
| 4.0x or more | 320 (24.1%) | 92 (8.9%) |
| Total | 1,327 (100.0%) | 1,037 (100.0%) |
Real Estate Taxes by Mortgage Status in Lac qui Parle County

| Property Taxes | Without Mortgage | With Mortgage |
| Less than $800 | 446 (33.6%) | 4 (0.4%) |
| $800 to $1,499 | 384 (28.9%) | 264 (25.5%) |
| $800 to $1,499 | 476 (35.9%) | 337 (32.5%) |
| Total | 1,327 (100.0%) | 1,037 (100.0%) |
Health & Disability in Lac qui Parle County
Health Insurance Coverage by Age in Lac qui Parle County

| Age Bracket | With Coverage | Without Coverage |
| Under 6 Years | 414 (99.5%) | 2 (0.5%) |
| 6 to 18 Years | 1,051 (98.6%) | 15 (1.4%) |
| 19 to 25 Years | 384 (97.2%) | 11 (2.8%) |
| 26 to 34 Years | 467 (90.7%) | 48 (9.3%) |
| 35 to 44 Years | 664 (92.2%) | 56 (7.8%) |
| 45 to 54 Years | 656 (96.3%) | 25 (3.7%) |
| 55 to 64 Years | 1,026 (96.5%) | 37 (3.5%) |
| 65 to 74 Years | 925 (99.8%) | 2 (0.2%) |
| 75 Years and older | 812 (99.6%) | 3 (0.4%) |
| Total | 6,399 (97.0%) | 199 (3.0%) |
Health Insurance Coverage by Citizenship Status in Lac qui Parle County

| Citizenship Status | With Coverage | Without Coverage |
| Native Born | 414 (99.5%) | 2 (0.5%) |
| Foreign Born, Citizen | 1,051 (98.6%) | 15 (1.4%) |
| Foreign Born, not a Citizen | 384 (97.2%) | 11 (2.8%) |
Health Insurance Coverage by Household Income in Lac qui Parle County

| Household Income | With Coverage | Without Coverage |
| Under $25,000 | 650 (96.6%) | 23 (3.4%) |
| $25,000 to $49,999 | 987 (97.6%) | 24 (2.4%) |
| $50,000 to $74,999 | 1,161 (97.1%) | 35 (2.9%) |
| $75,000 to $99,999 | 1,148 (97.0%) | 36 (3.0%) |
| $100,000 and over | 2,428 (96.8%) | 81 (3.2%) |
Public vs Private Health Insurance Coverage by Age in Lac qui Parle County

| Age Bracket | Public Insurance | Private Insurance |
| Under 6 | 170 (40.9%) | 271 (65.1%) |
| 6 to 18 Years | 389 (36.5%) | 710 (66.6%) |
| 19 to 25 Years | 80 (20.3%) | 315 (79.7%) |
| 25 to 34 Years | 93 (18.1%) | 389 (75.5%) |
| 35 to 44 Years | 191 (26.5%) | 506 (70.3%) |
| 45 to 54 Years | 134 (19.7%) | 542 (79.6%) |
| 55 to 64 Years | 256 (24.1%) | 841 (79.1%) |
| 65 to 74 Years | 876 (94.5%) | 616 (66.4%) |
| 75 Years and over | 811 (99.5%) | 631 (77.4%) |
| Total | 3,000 (45.5%) | 4,821 (73.1%) |
Disability Status by Sex by Age in Lac qui Parle County

| Age Bracket | Male | Female |
| Under 5 Years | 8 (4.1%) | 0 (0.0%) |
| 5 to 17 Years | 41 (7.1%) | 28 (5.7%) |
| 18 to 34 Years | 28 (5.6%) | 38 (7.9%) |
| 35 to 64 Years | 145 (11.5%) | 138 (11.5%) |
| 65 to 74 Years | 146 (30.2%) | 69 (15.5%) |
| 75 Years and over | 186 (53.6%) | 225 (48.1%) |
Disability Class by Sex by Age in Lac qui Parle County
Disability Class: Hearing Difficulty

| Age Bracket | Male | Female |
| Under 5 Years | 0 (0.0%) | 0 (0.0%) |
| 5 to 17 Years | 3 (0.5%) | 16 (3.2%) |
| 18 to 34 Years | 0 (0.0%) | 0 (0.0%) |
| 35 to 64 Years | 33 (2.6%) | 12 (1.0%) |
| 65 to 74 Years | 81 (16.8%) | 23 (5.2%) |
| 75 Years and over | 124 (35.7%) | 71 (15.2%) |
Disability Class: Vision Difficulty

| Age Bracket | Male | Female |
| Under 5 Years | 8 (4.1%) | 0 (0.0%) |
| 5 to 17 Years | 2 (0.4%) | 12 (2.4%) |
| 18 to 34 Years | 0 (0.0%) | 3 (0.6%) |
| 35 to 64 Years | 14 (1.1%) | 35 (2.9%) |
| 65 to 74 Years | 14 (2.9%) | 3 (0.7%) |
| 75 Years and over | 29 (8.4%) | 43 (9.2%) |
Disability Class: Cognitive Difficulty

| Age Bracket | Male | Female |
| 5 to 17 Years | 37 (6.4%) | 15 (3.0%) |
| 18 to 34 Years | 28 (5.6%) | 26 (5.4%) |
| 35 to 64 Years | 65 (5.1%) | 48 (4.0%) |
| 65 to 74 Years | 36 (7.4%) | 21 (4.7%) |
| 75 Years and over | 32 (9.2%) | 24 (5.1%) |
Disability Class: Ambulatory Difficulty

| Age Bracket | Male | Female |
| 5 to 17 Years | 1 (0.2%) | 0 (0.0%) |
| 18 to 34 Years | 9 (1.8%) | 0 (0.0%) |
| 35 to 64 Years | 89 (7.0%) | 81 (6.8%) |
| 65 to 74 Years | 38 (7.9%) | 37 (8.3%) |
| 75 Years and over | 64 (18.4%) | 120 (25.6%) |
Disability Class: Self-Care Difficulty

| Age Bracket | Male | Female |
| 5 to 17 Years | 4 (0.7%) | 0 (0.0%) |
| 18 to 34 Years | 10 (2.0%) | 0 (0.0%) |
| 35 to 64 Years | 21 (1.7%) | 34 (2.8%) |
| 65 to 74 Years | 21 (4.3%) | 10 (2.2%) |
| 75 Years and over | 18 (5.2%) | 28 (6.0%) |
Technology Access in Lac qui Parle County
Computing Device Access in Lac qui Parle County

| Device Type | # Households | % Households |
| Desktop or Laptop | 2,123 | 74.8% |
| Smartphone | 2,225 | 78.4% |
| Tablet | 1,677 | 59.1% |
| No Computing Device | 349 | 12.3% |
| Total | 2,838 | 100.0% |
Internet Access in Lac qui Parle County

| Internet Type | # Households | % Households |
| Dial-Up Internet | 7 | 0.3% |
| Broadband Home | 1,976 | 69.6% |
| Cellular Data Only | 261 | 9.2% |
| Satellite Internet | 193 | 6.8% |
| No Internet | 455 | 16.0% |
| Total | 2,838 | 100.0% |
Lac qui Parle County Summary
Lac Qui Parle County is located in the southwestern corner of Minnesota, and is bordered by the states of South Dakota and Iowa. The county is named after the Lac Qui Parle River, which flows through the county and empties into the Minnesota River. The county seat is Madison, and the county has a population of 7,845 as of the 2020 census.
Geography
Lac Qui Parle County is located in the southwestern corner of Minnesota, and is bordered by the states of South Dakota and Iowa. The county is located in the Minnesota River Valley, and is part of the Upper Midwest region. The county is mostly rural, with rolling hills and prairies. The county is home to several lakes, including Lac Qui Parle Lake, Big Stone Lake, and Lake Traverse. The county is also home to the Lac Qui Parle State Wildlife Management Area, which is a popular destination for hunting, fishing, and other outdoor activities.
The county has a total area of 576 square miles, of which 571 square miles is land and 5 square miles is water. The county is home to several small towns, including Madison, Dawson, and Appleton.
History
Lac Qui Parle County was established in 1871, and was named after the Lac Qui Parle River, which flows through the county and empties into the Minnesota River. The county was originally inhabited by the Dakota Sioux, and was later settled by European immigrants. The county was originally part of the Dakota Territory, and was later annexed by Minnesota in 1858.
The county was initially an agricultural area, and was home to several small towns. The county was also home to several Native American tribes, including the Dakota Sioux, Ojibwe, and Winnebago. The county was also home to several fur trading posts, and was a popular destination for fur traders.
The county was also home to several military posts during the Indian Wars, including Fort Wadsworth and Fort Abercrombie. The county was also home to several stagecoach lines, and was a popular destination for travelers.
Economy
Lac Qui Parle County is primarily an agricultural area, and is home to several large farms. The county is also home to several small businesses, including restaurants, retail stores, and service providers. The county is also home to several manufacturing companies, including a dairy processing plant and a grain elevator.
The county is also home to several tourist attractions, including the Lac Qui Parle State Wildlife Management Area, the Lac Qui Parle County Historical Society Museum, and the Lac Qui Parle County Fair.
Demographics
As of the 2020 census, Lac Qui Parle County had a population of 7,845. The population is primarily white (94.3%), with small percentages of Native American (2.2%), African American (1.2%), and Asian (0.7%) populations. The median household income is $50,945, and the median home value is $133,400. The county has a poverty rate of 11.2%, and the unemployment rate is 3.2%.
Conclusion
Lac Qui Parle County is located in the southwestern corner of Minnesota, and is bordered by the states of South Dakota and Iowa. The county is named after the Lac Qui Parle River, which flows through the county and empties into the Minnesota River. The county is mostly rural, with rolling hills and prairies, and is home to several lakes and the Lac Qui Parle State Wildlife Management Area. The county has a population of 7,845 as of the 2020 census, and is primarily an agricultural area. The county is also home to several small businesses, manufacturing companies, and tourist attractions. The median household income is $50,945, and the median home value is $133,400.
Common Questions
What is the Total Population of Lac qui Parle County?
Total Population of Lac qui Parle County is 6,736.
What is the Total Male Population of Lac qui Parle County?
Total Male Population of Lac qui Parle County is 3,439.
What is the Total Female Population of Lac qui Parle County?
Total Female Population of Lac qui Parle County is 3,297.
What is the Ratio of Males per 100 Females in Lac qui Parle County?
There are 104.31 Males per 100 Females in Lac qui Parle County.
What is the Ratio of Females per 100 Males in Lac qui Parle County?
There are 95.87 Females per 100 Males in Lac qui Parle County.
What is the Median Population Age in Lac qui Parle County?
Median Population Age in Lac qui Parle County is 48.7 Years.
What is the Average Family Size in Lac qui Parle County
Average Family Size in Lac qui Parle County is 2.8 People.
What is the Average Household Size in Lac qui Parle County
Average Household Size in Lac qui Parle County is 2.3 People.
What is Per Capita Income in Lac qui Parle County?
Per Capita income in Lac qui Parle County is $37,520.
What is the Median Family Income in Lac qui Parle County?
Median Family Income in Lac qui Parle County is $83,958.
What is the Median Household income in Lac qui Parle County?
Median Household Income in Lac qui Parle County is $66,967.
What is Income or Wage Gap in Lac qui Parle County?
Income or Wage Gap in Lac qui Parle County is 41.8%.
Women in Lac qui Parle County earn 58.2 cents for every dollar earned by a man.
What is Family Income Deficit in Lac qui Parle County?
Family Income Deficit in Lac qui Parle County is $12,057.
Families that are below poverty line in Lac qui Parle County earn $12,057 less on average than the poverty threshold level.
What is Inequality or Gini Index in Lac qui Parle County?
Inequality or Gini Index in Lac qui Parle County is 0.44.
How Large is the Labor Force in Lac qui Parle County?
There are 3,284 People in the Labor Forcein in Lac qui Parle County.
What is the Percentage of People in the Labor Force in Lac qui Parle County?
59.4% of People are in the Labor Force in Lac qui Parle County.
What is the Unemployment Rate in Lac qui Parle County?
Unemployment Rate in Lac qui Parle County is 2.1%.