Koochiching County, MN
Koochiching County Map

Koochiching County Overview
12,072
TOTAL POPULATION
6,099
MALE POPULATION
5,973
FEMALE POPULATION
102.11
MALES / 100 FEMALES
97.93
FEMALES / 100 MALES
50.6
MEDIAN AGE
2.7
AVG FAMILY SIZE
2.0
AVG HOUSEHOLD SIZE
$36,515
PER CAPITA INCOME
$77,000
AVG FAMILY INCOME
$59,779
AVG HOUSEHOLD INCOME
37.8%
WAGE / INCOME GAP [ % ]
62.2¢/ $1
WAGE / INCOME GAP [ $ ]
$10,350
FAMILY INCOME DEFICIT
0.40
INEQUALITY / GINI INDEX
5,963
LABOR FORCE [ PEOPLE ]
58.4%
PERCENT IN LABOR FORCE
5.1%
UNEMPLOYMENT RATE
Koochiching County Area Codes
Race in Koochiching County
The most populous races in Koochiching County are White / Caucasian (11,032 | 91.4%), Two or more Races (581 | 4.8%), and Native / Alaskan (220 | 1.8%).

| Race | # Population | % Population |
| Asian | 83 | 0.7% |
| Black / African American | 91 | 0.7% |
| Hawaiian / Pacific | 0 | 0.0% |
| Hispanic or Latino | 168 | 1.4% |
| Native / Alaskan | 220 | 1.8% |
| White / Caucasian | 11,032 | 91.4% |
| Two or more Races | 581 | 4.8% |
| Some other Race | 65 | 0.5% |
| Total | 12,072 | 100.0% |
Ancestry in Koochiching County
The most populous ancestries reported in Koochiching County are German (2,851 | 23.6%), Norwegian (2,337 | 19.4%), Irish (1,304 | 10.8%), Swedish (1,126 | 9.3%), and English (805 | 6.7%), together accounting for 69.8% of all Koochiching County residents.

| Ancestry | # Population | % Population |
| African | 1 | 0.0% |
| Alaska Native | 12 | 0.1% |
| American | 445 | 3.7% |
| Apache | 16 | 0.1% |
| Armenian | 13 | 0.1% |
| Austrian | 8 | 0.1% |
| Bangladeshi | 34 | 0.3% |
| Basque | 12 | 0.1% |
| Bhutanese | 2 | 0.0% |
| British | 16 | 0.1% |
| Burmese | 22 | 0.2% |
| Cajun | 4 | 0.0% |
| Canadian | 71 | 0.6% |
| Central American | 6 | 0.1% |
| Cherokee | 16 | 0.1% |
| Chippewa | 226 | 1.9% |
| Choctaw | 6 | 0.1% |
| Cree | 3 | 0.0% |
| Croatian | 34 | 0.3% |
| Czech | 65 | 0.5% |
| Czechoslovakian | 17 | 0.1% |
| Danish | 130 | 1.1% |
| Dominican | 6 | 0.1% |
| Dutch | 160 | 1.3% |
| Eastern European | 18 | 0.2% |
| English | 805 | 6.7% |
| European | 217 | 1.8% |
| Finnish | 284 | 2.4% |
| French | 588 | 4.9% |
| French American Indian | 41 | 0.3% |
| French Canadian | 145 | 1.2% |
| German | 2,851 | 23.6% |
| Greek | 7 | 0.1% |
| Hungarian | 4 | 0.0% |
| Icelander | 2 | 0.0% |
| Irish | 1,304 | 10.8% |
| Italian | 296 | 2.5% |
| Japanese | 15 | 0.1% |
| Korean | 29 | 0.2% |
| Lithuanian | 2 | 0.0% |
| Luxembourger | 4 | 0.0% |
| Malaysian | 2 | 0.0% |
| Mexican | 105 | 0.9% |
| Northern European | 34 | 0.3% |
| Norwegian | 2,337 | 19.4% |
| Panamanian | 6 | 0.1% |
| Pennsylvania German | 5 | 0.0% |
| Peruvian | 3 | 0.0% |
| Polish | 368 | 3.0% |
| Puerto Rican | 12 | 0.1% |
| Romanian | 3 | 0.0% |
| Russian | 153 | 1.3% |
| Scandinavian | 341 | 2.8% |
| Scotch-Irish | 57 | 0.5% |
| Scottish | 75 | 0.6% |
| Sioux | 17 | 0.1% |
| Slavic | 29 | 0.2% |
| Slovak | 8 | 0.1% |
| Slovene | 21 | 0.2% |
| South American | 3 | 0.0% |
| Sri Lankan | 4 | 0.0% |
| Subsaharan African | 1 | 0.0% |
| Swedish | 1,126 | 9.3% |
| Swiss | 18 | 0.2% |
| Ukrainian | 295 | 2.4% |
| Welsh | 17 | 0.1% |
| Yaqui | 2 | 0.0% | View All 67 Rows |
Immigrants in Koochiching County
The most numerous immigrant groups reported in Koochiching County came from Canada (259 | 2.1%), Asia (58 | 0.5%), Europe (55 | 0.5%), Latin America (40 | 0.3%), and South Eastern Asia (36 | 0.3%), together accounting for 3.7% of all Koochiching County residents.

| Immigration Origin | # Population | % Population |
| Africa | 3 | 0.0% |
| Asia | 58 | 0.5% |
| Canada | 259 | 2.1% |
| Caribbean | 6 | 0.1% |
| Central America | 34 | 0.3% |
| Dominica | 3 | 0.0% |
| Dominican Republic | 3 | 0.0% |
| Eastern Asia | 22 | 0.2% |
| Eastern Europe | 23 | 0.2% |
| Europe | 55 | 0.5% |
| Germany | 25 | 0.2% |
| Japan | 2 | 0.0% |
| Korea | 20 | 0.2% |
| Laos | 1 | 0.0% |
| Latin America | 40 | 0.3% |
| Mexico | 28 | 0.2% |
| Netherlands | 1 | 0.0% |
| Northern Europe | 6 | 0.1% |
| Panama | 6 | 0.1% |
| Philippines | 19 | 0.2% |
| Russia | 17 | 0.1% |
| South Africa | 3 | 0.0% |
| South Eastern Asia | 36 | 0.3% |
| Thailand | 16 | 0.1% |
| Western Europe | 26 | 0.2% | View All 25 Rows |
Sex and Age in Koochiching County
Sex and Age in Koochiching County
The most populous age groups in Koochiching County are 65 to 69 Years (629 | 10.3%) for men and 65 to 69 Years (574 | 9.6%) for women.

| Age Bracket | Male | Female |
| Under 5 Years | 256 (4.2%) | 211 (3.5%) |
| 5 to 9 Years | 332 (5.4%) | 280 (4.7%) |
| 10 to 14 Years | 269 (4.4%) | 360 (6.0%) |
| 15 to 19 Years | 348 (5.7%) | 393 (6.6%) |
| 20 to 24 Years | 306 (5.0%) | 194 (3.3%) |
| 25 to 29 Years | 282 (4.6%) | 259 (4.3%) |
| 30 to 34 Years | 287 (4.7%) | 257 (4.3%) |
| 35 to 39 Years | 333 (5.5%) | 187 (3.1%) |
| 40 to 44 Years | 315 (5.2%) | 424 (7.1%) |
| 45 to 49 Years | 317 (5.2%) | 340 (5.7%) |
| 50 to 54 Years | 410 (6.7%) | 388 (6.5%) |
| 55 to 59 Years | 578 (9.5%) | 516 (8.6%) |
| 60 to 64 Years | 487 (8.0%) | 481 (8.1%) |
| 65 to 69 Years | 629 (10.3%) | 574 (9.6%) |
| 70 to 74 Years | 366 (6.0%) | 379 (6.4%) |
| 75 to 79 Years | 171 (2.8%) | 235 (3.9%) |
| 80 to 84 Years | 218 (3.6%) | 223 (3.7%) |
| 85 Years and over | 195 (3.2%) | 272 (4.5%) |
| Total | 6,099 (100.0%) | 5,973 (100.0%) |
Families and Households in Koochiching County
Median Family Size in Koochiching County
The median family size in Koochiching County is 2.66 persons per family, with single male/father families (296 | 9.2%) accounting for the largest median family size of 2.82 persons per family. On the other hand, married-couple families (2,373 | 73.5%) represent the smallest median family size with 2.63 persons per family.

| Family Type | # Families | Family Size |
| Married-Couple | 2,373 (73.5%) | 2.63 |
| Single Male/Father | 296 (9.2%) | 2.82 |
| Single Female/Mother | 561 (17.4%) | 2.70 |
| Total Families | 3,230 (100.0%) | 2.66 |
Median Household Size in Koochiching County
The median household size in Koochiching County is 2.05 persons per household, with single male/father households (296 | 5.2%) accounting for the largest median household size of 3.16 persons per household. non-family households (2,473 | 43.4%) represent the smallest median household size with 1.15 persons per household.

| Household Type | # Households | Household Size |
| Married-Couple | 2,373 (41.6%) | 2.64 |
| Single Male/Father | 296 (5.2%) | 3.16 |
| Single Female/Mother | 561 (9.8%) | 2.92 |
| Non-family | 2,473 (43.4%) | 1.15 |
| Total Households | 5,703 (100.0%) | 2.05 |
Household Size by Marriage Status in Koochiching County
Out of a total of 5,703 households in Koochiching County, 3,230 (56.6%) are family households, while 2,473 (43.4%) are nonfamily households. The most numerous type of family households are 2-person households, comprising 1,807, and the most common type of nonfamily households are 1-person households, comprising 2,078.

| Household Size | Family Households | Nonfamily Households |
| 1-Person Households | - | 2,078 (36.4%) |
| 2-Person Households | 1,807 (31.7%) | 389 (6.8%) |
| 3-Person Households | 610 (10.7%) | 0 (0.0%) |
| 4-Person Households | 540 (9.5%) | 6 (0.1%) |
| 5-Person Households | 235 (4.1%) | 0 (0.0%) |
| 6-Person Households | 34 (0.6%) | 0 (0.0%) |
| 7+ Person Households | 4 (0.1%) | 0 (0.0%) |
| Total | 3,230 (56.6%) | 2,473 (43.4%) |
Female Fertility in Koochiching County
Fertility by Age in Koochiching County
Average fertility rate in Koochiching County is 31.0 births per 1,000 women. Women in the age bracket of 20 to 34 years have the highest fertility rate with 80.0 births per 1,000 women. Women in the age bracket of 20 to 34 years acount for 87.7% of all women with births.

| Age Bracket | Women with Births | Births / 1,000 Women |
| 15 to 19 years | 0 (0.0%) | 0.0 |
| 20 to 34 years | 57 (87.7%) | 80.0 |
| 35 to 50 years | 8 (12.3%) | 8.0 |
| Total | 65 (100.0%) | 31.0 |
Fertility by Age by Marriage Status in Koochiching County
58.5% of women with births (65) in Koochiching County are married. The highest percentage of unmarried women with births falls into 20 to 34 years age bracket with 47.4% of them unmarried at the time of birth, while the lowest percentage of unmarried women with births belong to 35 to 50 years age bracket with 0.0% of them unmarried.

| Age Bracket | Married | Unmarried |
| 15 to 19 years | 0 (0.0%) | 0 (0.0%) |
| 20 to 34 years | 30 (52.6%) | 27 (47.4%) |
| 35 to 50 years | 8 (100.0%) | 0 (0.0%) |
| Total | 38 (58.5%) | 27 (41.5%) |
Fertility by Education in Koochiching County

| Educational Attainment | Women with Births | Births / 1,000 Women |
| Less than High School | 11 (16.9%) | 32.0 |
| High School Diploma | 9 (13.9%) | 32.0 |
| College or Associate's Degree | 28 (43.1%) | 25.0 |
| Bachelor's Degree | 17 (26.2%) | 54.0 |
| Graduate Degree | 0 (0.0%) | 0.0 |
| Total | 65 (100.0%) | 31.0 |
Fertility by Education by Marriage Status in Koochiching County
41.5% of women with births in Koochiching County are unmarried. Women with the educational attainment of bachelor's degree are most likely to be married with 100.0% of them married at childbirth, while women with the educational attainment of high school diploma are least likely to be married with 100.0% of them unmarried at childbirth.

| Educational Attainment | Married | Unmarried |
| Less than High School | 2 (18.2%) | 9 (81.8%) |
| High School Diploma | 0 (0.0%) | 9 (100.0%) |
| College or Associate's Degree | 19 (67.9%) | 9 (32.1%) |
| Bachelor's Degree | 17 (100.0%) | 0 (0.0%) |
| Graduate Degree | 0 (0.0%) | 0 (0.0%) |
| Total | 38 (58.5%) | 27 (41.5%) |
Income in Koochiching County
Income Overview in Koochiching County
Per Capita Income in Koochiching County is $36,515, while median incomes of families and households are $77,000 and $59,779 respectively.
| Characteristic | Number | Measure |
| Per Capita Income | 12,072 | $36,515 |
| Median Family Income | 3,230 | $77,000 |
| Mean Family Income | 3,230 | $92,761 |
| Median Household Income | 5,703 | $59,779 |
| Mean Household Income | 5,703 | $76,411 |
| Income Deficit | 3,230 | $10,350 |
| Wage / Income Gap (%) | 12,072 | 37.85% |
| Wage / Income Gap ($) | 12,072 | 62.15¢ per $1 |
| Gini / Inequality Index | 12,072 | 0.40 |
Earnings by Sex in Koochiching County
Average Earnings in Koochiching County are $39,517, $50,885 for men and $31,626 for women, a difference of 37.9%.

| Sex | Number | Average Earnings |
| Male | 3,328 (52.4%) | $50,885 |
| Female | 3,023 (47.6%) | $31,626 |
| Total | 6,351 (100.0%) | $39,517 |
Earnings by Sex by Income Bracket in Koochiching County
The most common earnings brackets in Koochiching County are $75,000 to $99,999 for men (422 | 12.7%) and $30,000 to $34,999 for women (300 | 9.9%).

| Income | Male | Female |
| $2,499 or less | 194 (5.8%) | 125 (4.1%) |
| $2,500 to $4,999 | 165 (5.0%) | 81 (2.7%) |
| $5,000 to $7,499 | 80 (2.4%) | 225 (7.4%) |
| $7,500 to $9,999 | 90 (2.7%) | 255 (8.4%) |
| $10,000 to $12,499 | 98 (2.9%) | 80 (2.6%) |
| $12,500 to $14,999 | 68 (2.0%) | 179 (5.9%) |
| $15,000 to $17,499 | 86 (2.6%) | 96 (3.2%) |
| $17,500 to $19,999 | 66 (2.0%) | 25 (0.8%) |
| $20,000 to $22,499 | 48 (1.4%) | 83 (2.8%) |
| $22,500 to $24,999 | 56 (1.7%) | 67 (2.2%) |
| $25,000 to $29,999 | 126 (3.8%) | 196 (6.5%) |
| $30,000 to $34,999 | 82 (2.5%) | 300 (9.9%) |
| $35,000 to $39,999 | 92 (2.8%) | 244 (8.1%) |
| $40,000 to $44,999 | 143 (4.3%) | 99 (3.3%) |
| $45,000 to $49,999 | 196 (5.9%) | 74 (2.5%) |
| $50,000 to $54,999 | 312 (9.4%) | 125 (4.1%) |
| $55,000 to $64,999 | 386 (11.6%) | 182 (6.0%) |
| $65,000 to $74,999 | 332 (10.0%) | 228 (7.5%) |
| $75,000 to $99,999 | 422 (12.7%) | 234 (7.7%) |
| $100,000+ | 286 (8.6%) | 125 (4.1%) |
| Total | 3,328 (100.0%) | 3,023 (100.0%) |
Earnings by Sex by Educational Attainment in Koochiching County
Average earnings in Koochiching County are $53,711 for men and $32,578 for women, a difference of 39.4%. Men with an educational attainment of graduate degree enjoy the highest average annual earnings of $100,833, while those with less than high school education earn the least with $20,446. Women with an educational attainment of graduate degree earn the most with the average annual earnings of $75,764, while those with less than high school education have the smallest earnings of $14,340.

| Educational Attainment | Male Income | Female Income |
| Less than High School | $20,446 | $14,340 |
| High School Diploma | $43,333 | $21,364 |
| College or Associate's Degree | $56,190 | $32,090 |
| Bachelor's Degree | $64,167 | $50,435 |
| Graduate Degree | $100,833 | $75,764 |
| Total | $53,711 | $32,578 |
Family Income in Koochiching County
Family Income Brackets in Koochiching County
According to the Koochiching County family income data, there are 766 families falling into the $100,000 to $149,999 income range, which is the most common income bracket and makes up 23.7% of all families. Conversely, the less than $10,000 income bracket is the least frequent group with only 68 families (2.1%) belonging to this category.
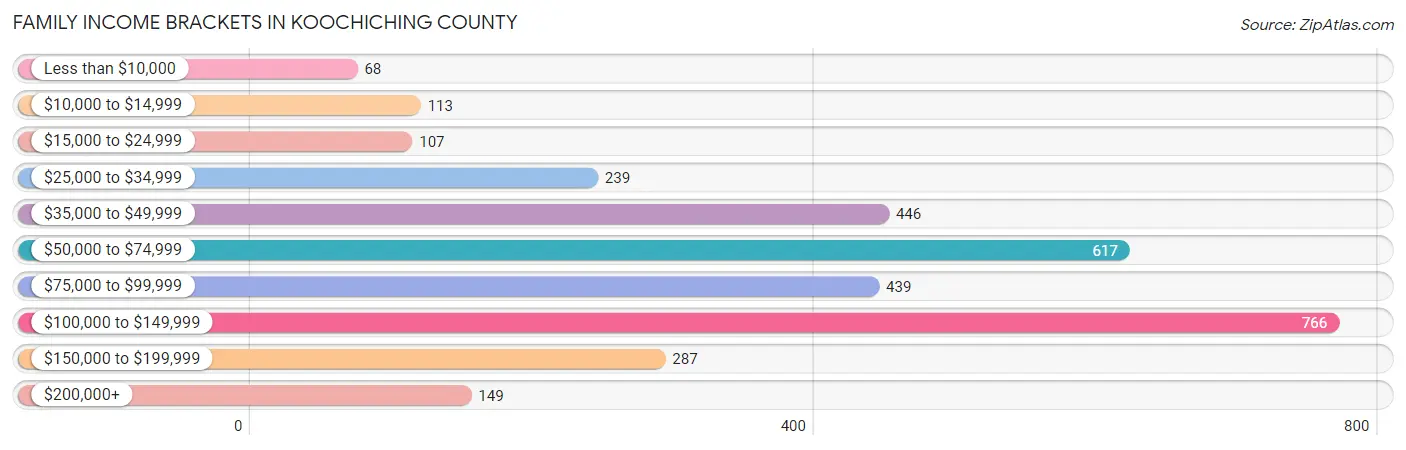
| Income Bracket | # Families | % Families |
| Less than $10,000 | 68 | 2.1% |
| $10,000 to $14,999 | 113 | 3.5% |
| $15,000 to $24,999 | 107 | 3.3% |
| $25,000 to $34,999 | 239 | 7.4% |
| $35,000 to $49,999 | 446 | 13.8% |
| $50,000 to $74,999 | 617 | 19.1% |
| $75,000 to $99,999 | 439 | 13.6% |
| $100,000 to $149,999 | 766 | 23.7% |
| $150,000 to $199,999 | 287 | 8.9% |
| $200,000+ | 149 | 4.6% |
Family Income by Famaliy Size in Koochiching County
3-person families (576 | 17.8%) account for the highest median family income in Koochiching County with $100,208 per family, while 2-person families (1,896 | 58.7%) have the highest median income of $34,881 per family member.

| Income Bracket | # Families | Median Income |
| 2-Person Families | 1,896 (58.7%) | $69,762 |
| 3-Person Families | 576 (17.8%) | $100,208 |
| 4-Person Families | 598 (18.5%) | $95,536 |
| 5-Person Families | 137 (4.2%) | $78,512 |
| 6-Person Families | 19 (0.6%) | $95,208 |
| 7+ Person Families | 4 (0.1%) | $0 |
| Total | 3,230 (100.0%) | $77,000 |
Family Income by Number of Earners in Koochiching County
The median family income in Koochiching County is $77,000, with families comprising 3+ earners (298) having the highest median family income of $130,750, while families with no earners (604) have the lowest median family income of $52,941, accounting for 9.2% and 18.7% of families, respectively.

| Number of Earners | # Families | Median Income |
| No Earners | 604 (18.7%) | $52,941 |
| 1 Earner | 1,123 (34.8%) | $52,969 |
| 2 Earners | 1,205 (37.3%) | $110,057 |
| 3+ Earners | 298 (9.2%) | $130,750 |
| Total | 3,230 (100.0%) | $77,000 |
Household Income in Koochiching County
Household Income Brackets in Koochiching County
With 1,135 households falling in the category, the $50,000 to $74,999 income range is the most frequent in Koochiching County, accounting for 19.9% of all households. In contrast, only 148 households (2.6%) fall into the $200,000+ income bracket, making it the least populous group.

| Income Bracket | # Households | % Households |
| Less than $10,000 | 200 | 3.5% |
| $10,000 to $14,999 | 342 | 6.0% |
| $15,000 to $24,999 | 416 | 7.3% |
| $25,000 to $34,999 | 451 | 7.9% |
| $35,000 to $49,999 | 827 | 14.5% |
| $50,000 to $74,999 | 1,135 | 19.9% |
| $75,000 to $99,999 | 855 | 15.0% |
| $100,000 to $149,999 | 981 | 17.2% |
| $150,000 to $199,999 | 342 | 6.0% |
| $200,000+ | 148 | 2.6% |
Household Income by Householder Age in Koochiching County
The median household income in Koochiching County is $59,779, with the highest median household income of $85,946 found in the 15 to 24 years age bracket for the primary householder. A total of 225 households (4.0%) fall into this category. Meanwhile, the 65+ years age bracket for the primary householder has the lowest median household income of $51,713, with 2,087 households (36.6%) in this group.

| Income Bracket | # Households | Median Income |
| 15 to 24 Years | 225 (4.0%) | $85,946 |
| 25 to 44 Years | 1,221 (21.4%) | $81,205 |
| 45 to 64 Years | 2,170 (38.1%) | $68,214 |
| 65+ Years | 2,087 (36.6%) | $51,713 |
| Total | 5,703 (100.0%) | $59,779 |
Poverty in Koochiching County
Income Below Poverty by Sex and Age in Koochiching County
With 10.4% poverty level for males and 13.1% for females among the residents of Koochiching County, 15 year old males and 18 to 24 year old females are the most vulnerable to poverty, with 53 males (59.6%) and 76 females (21.7%) in their respective age groups living below the poverty level.

| Age Bracket | Male | Female |
| Under 5 Years | 29 (11.3%) | 35 (16.6%) |
| 5 Years | 36 (45.6%) | 2 (9.1%) |
| 6 to 11 Years | 89 (26.2%) | 87 (21.6%) |
| 12 to 14 Years | 50 (27.6%) | 23 (12.5%) |
| 15 Years | 53 (59.6%) | 1 (1.5%) |
| 16 and 17 Years | 22 (17.5%) | 18 (12.2%) |
| 18 to 24 Years | 11 (2.8%) | 76 (21.7%) |
| 25 to 34 Years | 60 (10.8%) | 95 (18.4%) |
| 35 to 44 Years | 53 (8.3%) | 105 (17.4%) |
| 45 to 54 Years | 107 (14.7%) | 46 (6.3%) |
| 55 to 64 Years | 53 (5.0%) | 144 (14.5%) |
| 65 to 74 Years | 41 (4.2%) | 55 (5.9%) |
| 75 Years and over | 19 (3.4%) | 65 (10.7%) |
| Total | 623 (10.4%) | 752 (13.1%) |
Income Above Poverty by Sex and Age in Koochiching County
According to the poverty statistics in Koochiching County, males aged 18 to 24 years and females aged 15 years are the age groups that are most secure financially, with 97.2% of males and 98.5% of females in these age groups living above the poverty line.

| Age Bracket | Male | Female |
| Under 5 Years | 227 (88.7%) | 176 (83.4%) |
| 5 Years | 43 (54.4%) | 20 (90.9%) |
| 6 to 11 Years | 251 (73.8%) | 315 (78.4%) |
| 12 to 14 Years | 131 (72.4%) | 161 (87.5%) |
| 15 Years | 36 (40.5%) | 64 (98.5%) |
| 16 and 17 Years | 104 (82.5%) | 129 (87.8%) |
| 18 to 24 Years | 387 (97.2%) | 274 (78.3%) |
| 25 to 34 Years | 494 (89.2%) | 421 (81.6%) |
| 35 to 44 Years | 589 (91.7%) | 498 (82.6%) |
| 45 to 54 Years | 620 (85.3%) | 682 (93.7%) |
| 55 to 64 Years | 1,011 (95.0%) | 847 (85.5%) |
| 65 to 74 Years | 948 (95.9%) | 873 (94.1%) |
| 75 Years and over | 540 (96.6%) | 541 (89.3%) |
| Total | 5,381 (89.6%) | 5,001 (86.9%) |
Income Below Poverty Among Married-Couple Families in Koochiching County
The poverty statistics for married-couple families in Koochiching County show that 3.2% or 75 of the total 2,373 families live below the poverty line. Families with 5 or more children have the highest poverty rate of 100.0%, comprising of 2 families. On the other hand, families with 3 or 4 children have the lowest poverty rate of 0.0%, which includes 0 families.

| Children | Above Poverty | Below Poverty |
| No Children | 1,708 (97.7%) | 40 (2.3%) |
| 1 or 2 Children | 482 (93.6%) | 33 (6.4%) |
| 3 or 4 Children | 108 (100.0%) | 0 (0.0%) |
| 5 or more Children | 0 (0.0%) | 2 (100.0%) |
| Total | 2,298 (96.8%) | 75 (3.2%) |
Income Below Poverty Among Single-Parent Households in Koochiching County
According to the poverty data in Koochiching County, 7.8% or 23 single-father households and 28.9% or 162 single-mother households are living below the poverty line. Among single-father households, those with 1 or 2 children have the highest poverty rate, with 23 households (14.3%) experiencing poverty. Likewise, among single-mother households, those with 5 or more children have the highest poverty rate, with 2 households (100.0%) falling below the poverty line.

| Children | Single Father | Single Mother |
| No Children | 0 (0.0%) | 14 (8.7%) |
| 1 or 2 Children | 23 (14.3%) | 64 (21.4%) |
| 3 or 4 Children | 0 (0.0%) | 82 (82.0%) |
| 5 or more Children | 0 (0.0%) | 2 (100.0%) |
| Total | 23 (7.8%) | 162 (28.9%) |
Income Below Poverty Among Married-Couple vs Single-Parent Households in Koochiching County
The poverty data for Koochiching County shows that 75 of the married-couple family households (3.2%) and 185 of the single-parent households (21.6%) are living below the poverty level. Within the married-couple family households, those with 5 or more children have the highest poverty rate, with 2 households (100.0%) falling below the poverty line. Among the single-parent households, those with 5 or more children have the highest poverty rate, with 2 household (100.0%) living below poverty.

| Children | Married-Couple Families | Single-Parent Households |
| No Children | 40 (2.3%) | 14 (6.0%) |
| 1 or 2 Children | 33 (6.4%) | 87 (18.9%) |
| 3 or 4 Children | 0 (0.0%) | 82 (50.9%) |
| 5 or more Children | 2 (100.0%) | 2 (100.0%) |
| Total | 75 (3.2%) | 185 (21.6%) |
Employment Characteristics in Koochiching County
Employment by Class of Employer in Koochiching County
Among the 5,539 employed individuals in Koochiching County, private company employees (3,419 | 61.7%), local government employees (676 | 12.2%), and not-for-profit organizations (536 | 9.7%) make up the most common classes of employment.

| Employer Class | # Employees | % Employees |
| Private Company Employees | 3,419 | 61.7% |
| Self-Employed (Incorporated) | 273 | 4.9% |
| Self-Employed (Not Incorporated) | 285 | 5.1% |
| Not-for-profit Organizations | 536 | 9.7% |
| Local Government Employees | 676 | 12.2% |
| State Government Employees | 228 | 4.1% |
| Federal Government Employees | 109 | 2.0% |
| Unpaid Family Workers | 13 | 0.2% |
| Total | 5,539 | 100.0% |
Employment Status by Age in Koochiching County
According to the labor force statistics for Koochiching County, out of the total population over 16 years of age (10,210), 58.4% or 5,963 individuals are in the labor force, with 5.1% or 304 of them unemployed. The age group with the highest labor force participation rate is 35 to 44 years, with 93.3% or 1,175 individuals in the labor force. Within the labor force, the 16 to 19 years age range has the highest percentage of unemployed individuals, with 23.1% or 77 of them being unemployed.

| Age Bracket | In Labor Force | Unemployed |
| 16 to 19 Years | 333 (56.7%) | 77 (23.1%) |
| 20 to 24 Years | 459 (91.8%) | 4 (0.9%) |
| 25 to 29 Years | 475 (87.8%) | 36 (7.6%) |
| 30 to 34 Years | 490 (90.1%) | 40 (8.2%) |
| 35 to 44 Years | 1,175 (93.3%) | 56 (4.8%) |
| 45 to 54 Years | 1,261 (86.7%) | 55 (4.4%) |
| 55 to 59 Years | 775 (70.8%) | 11 (1.4%) |
| 60 to 64 Years | 509 (52.6%) | 8 (1.6%) |
| 65 to 74 Years | 469 (24.1%) | 15 (3.2%) |
| 75 Years and over | 14 (1.1%) | 0 (0.0%) |
| Total | 5,963 (58.4%) | 304 (5.1%) |
Employment Status by Educational Attainment in Koochiching County
According to labor force statistics for Koochiching County, 80.0% of individuals (4,689) out of the total population between 25 and 64 years of age (5,861) are in the labor force, with 4.4% or 206 of them being unemployed. The group with the highest labor force participation rate are those with the educational attainment of bachelor's degree or higher, with 90.9% or 884 individuals in the labor force. Within the labor force, individuals with less than high school education have the highest percentage of unemployment, with 7.3% or 13 of them being unemployed.

| Educational Attainment | In Labor Force | Unemployed |
| Less than High School | 178 (52.7%) | 25 (7.3%) |
| High School Diploma | 1,298 (71.3%) | 60 (3.3%) |
| College / Associate Degree | 2,326 (85.2%) | 167 (6.1%) |
| Bachelor's Degree or higher | 884 (90.9%) | 9 (0.9%) |
| Total | 4,689 (80.0%) | 258 (4.4%) |
Employment Occupations by Sex in Koochiching County
Management, Business, Science and Arts Occupations
The most common Management, Business, Science and Arts occupations in Koochiching County are Management (587 | 10.4%), Community & Social Service (436 | 7.7%), Health Diagnosing & Treating (275 | 4.9%), Education Instruction & Library (251 | 4.4%), and Computers, Engineering & Science (200 | 3.5%).

Management, Business, Science and Arts Occupations by Sex
Within the Management, Business, Science and Arts occupations in Koochiching County, the most male-oriented occupations are Architecture & Engineering (87.9%), Computers, Engineering & Science (67.5%), and Life, Physical & Social Science (49.2%), while the most female-oriented occupations are Business & Financial (83.5%), Legal Services & Support (82.4%), and Health Diagnosing & Treating (77.8%).

| Occupation | Male | Female |
| Management | 243 (41.4%) | 344 (58.6%) |
| Business & Financial | 30 (16.5%) | 152 (83.5%) |
| Computers, Engineering & Science | 135 (67.5%) | 65 (32.5%) |
| Computers & Mathematics | 15 (44.1%) | 19 (55.9%) |
| Architecture & Engineering | 87 (87.9%) | 12 (12.1%) |
| Life, Physical & Social Science | 33 (49.2%) | 34 (50.7%) |
| Community & Social Service | 131 (30.0%) | 305 (70.0%) |
| Education, Arts & Media | 33 (29.5%) | 79 (70.5%) |
| Legal Services & Support | 3 (17.6%) | 14 (82.4%) |
| Education Instruction & Library | 71 (28.3%) | 180 (71.7%) |
| Arts, Media & Entertainment | 24 (42.9%) | 32 (57.1%) |
| Health Diagnosing & Treating | 61 (22.2%) | 214 (77.8%) |
| Health Technologists | 51 (28.5%) | 128 (71.5%) |
| Total (Category) | 600 (35.7%) | 1,080 (64.3%) |
| Total (Overall) | 2,953 (52.2%) | 2,708 (47.8%) |
Services Occupations
The most common Services occupations in Koochiching County are Food Preparation & Serving (251 | 4.4%), Cleaning & Maintenance (227 | 4.0%), Security & Protection (210 | 3.7%), Healthcare Support (182 | 3.2%), and Law Enforcement (156 | 2.8%).

Services Occupations by Sex
Within the Services occupations in Koochiching County, the most male-oriented occupations are Law Enforcement (82.1%), Security & Protection (63.3%), and Cleaning & Maintenance (48.0%), while the most female-oriented occupations are Firefighting & Prevention (90.7%), Healthcare Support (85.7%), and Personal Care & Service (74.2%).

| Occupation | Male | Female |
| Healthcare Support | 26 (14.3%) | 156 (85.7%) |
| Security & Protection | 133 (63.3%) | 77 (36.7%) |
| Firefighting & Prevention | 5 (9.3%) | 49 (90.7%) |
| Law Enforcement | 128 (82.1%) | 28 (17.9%) |
| Food Preparation & Serving | 100 (39.8%) | 151 (60.2%) |
| Cleaning & Maintenance | 109 (48.0%) | 118 (52.0%) |
| Personal Care & Service | 8 (25.8%) | 23 (74.2%) |
| Total (Category) | 376 (41.7%) | 525 (58.3%) |
| Total (Overall) | 2,953 (52.2%) | 2,708 (47.8%) |
Sales and Office Occupations
The most common Sales and Office occupations in Koochiching County are Sales & Related (642 | 11.3%), and Office & Administration (606 | 10.7%).

Sales and Office Occupations by Sex

| Occupation | Male | Female |
| Sales & Related | 286 (44.6%) | 356 (55.4%) |
| Office & Administration | 109 (18.0%) | 497 (82.0%) |
| Total (Category) | 395 (31.7%) | 853 (68.3%) |
| Total (Overall) | 2,953 (52.2%) | 2,708 (47.8%) |
Natural Resources, Construction and Maintenance Occupations
The most common Natural Resources, Construction and Maintenance occupations in Koochiching County are Installation, Maintenance & Repair (392 | 6.9%), Construction & Extraction (353 | 6.2%), and Farming, Fishing & Forestry (77 | 1.4%).

Natural Resources, Construction and Maintenance Occupations by Sex

| Occupation | Male | Female |
| Farming, Fishing & Forestry | 77 (100.0%) | 0 (0.0%) |
| Construction & Extraction | 341 (96.6%) | 12 (3.4%) |
| Installation, Maintenance & Repair | 392 (100.0%) | 0 (0.0%) |
| Total (Category) | 810 (98.5%) | 12 (1.5%) |
| Total (Overall) | 2,953 (52.2%) | 2,708 (47.8%) |
Production, Transportation and Moving Occupations
The most common Production, Transportation and Moving occupations in Koochiching County are Material Moving (383 | 6.8%), Production (367 | 6.5%), and Transportation (260 | 4.6%).

Production, Transportation and Moving Occupations by Sex

| Occupation | Male | Female |
| Production | 243 (66.2%) | 124 (33.8%) |
| Transportation | 213 (81.9%) | 47 (18.1%) |
| Material Moving | 316 (82.5%) | 67 (17.5%) |
| Total (Category) | 772 (76.4%) | 238 (23.6%) |
| Total (Overall) | 2,953 (52.2%) | 2,708 (47.8%) |
Employment Industries by Sex in Koochiching County
Employment Industries in Koochiching County
The major employment industries in Koochiching County include Retail Trade (899 | 15.9%), Manufacturing (831 | 14.7%), Health Care & Social Assistance (727 | 12.8%), Educational Services (411 | 7.3%), and Construction (379 | 6.7%).

Employment Industries by Sex in Koochiching County
The Koochiching County industries that see more men than women are Agriculture, Fishing & Hunting (92.7%), Transportation & Warehousing (88.2%), and Utilities (86.4%), whereas the industries that tend to have a higher number of women are Finance & Insurance (93.7%), Health Care & Social Assistance (90.1%), and Information (76.5%).

| Industry | Male | Female |
| Agriculture, Fishing & Hunting | 152 (92.7%) | 12 (7.3%) |
| Mining, Quarrying, & Extraction | 0 (0.0%) | 0 (0.0%) |
| Construction | 307 (81.0%) | 72 (19.0%) |
| Manufacturing | 631 (75.9%) | 200 (24.1%) |
| Wholesale Trade | 48 (76.2%) | 15 (23.8%) |
| Retail Trade | 500 (55.6%) | 399 (44.4%) |
| Transportation & Warehousing | 308 (88.2%) | 41 (11.7%) |
| Utilities | 19 (86.4%) | 3 (13.6%) |
| Information | 43 (23.5%) | 140 (76.5%) |
| Finance & Insurance | 14 (6.3%) | 208 (93.7%) |
| Real Estate, Rental & Leasing | 22 (59.5%) | 15 (40.5%) |
| Professional & Scientific | 90 (42.6%) | 121 (57.4%) |
| Enterprise Management | 0 (0.0%) | 0 (0.0%) |
| Administrative & Support | 53 (44.2%) | 67 (55.8%) |
| Educational Services | 149 (36.2%) | 262 (63.7%) |
| Health Care & Social Assistance | 72 (9.9%) | 655 (90.1%) |
| Arts, Entertainment & Recreation | 47 (40.2%) | 70 (59.8%) |
| Accommodation & Food Services | 161 (42.9%) | 214 (57.1%) |
| Public Administration | 171 (57.8%) | 125 (42.2%) |
| Total | 2,953 (52.2%) | 2,708 (47.8%) |
Education in Koochiching County
School Enrollment in Koochiching County
The most common levels of schooling among the 2,404 students in Koochiching County are high school (557 | 23.2%), elementary school (538 | 22.4%), and middle school (518 | 21.5%).

| School Level | # Students | % Students |
| Nursery / Preschool | 241 | 10.0% |
| Kindergarten | 51 | 2.1% |
| Elementary School | 538 | 22.4% |
| Middle School | 518 | 21.5% |
| High School | 557 | 23.2% |
| College / Undergraduate | 417 | 17.3% |
| Graduate / Professional | 82 | 3.4% |
| Total | 2,404 | 100.0% |
School Enrollment by Age by Funding Source in Koochiching County
Out of a total of 2,404 students who are enrolled in schools in Koochiching County, 183 (7.6%) attend a private institution, while the remaining 2,221 (92.4%) are enrolled in public schools. The age group of 3 to 4 year olds has the highest likelihood of being enrolled in private schools, with 51 (29.6% in the age bracket) enrolled. Conversely, the age group of 10 to 14 year olds has the lowest likelihood of being enrolled in a private school, with 616 (99.2% in the age bracket) attending a public institution.

| Age Bracket | Public School | Private School |
| 3 to 4 Year Olds | 121 (70.4%) | 51 (29.6%) |
| 5 to 9 Year Old | 522 (87.7%) | 73 (12.3%) |
| 10 to 14 Year Olds | 616 (99.2%) | 5 (0.8%) |
| 15 to 17 Year Olds | 423 (98.4%) | 7 (1.6%) |
| 18 to 19 Year Olds | 226 (86.6%) | 35 (13.4%) |
| 20 to 24 Year Olds | 125 (96.9%) | 4 (3.1%) |
| 25 to 34 Year Olds | 80 (98.8%) | 1 (1.2%) |
| 35 Years and over | 109 (94.8%) | 6 (5.2%) |
| Total | 2,221 (92.4%) | 183 (7.6%) |
Educational Attainment by Field of Study in Koochiching County
Education (385 | 22.6%), business (239 | 14.0%), science & technology (233 | 13.7%), arts & humanities (232 | 13.6%), and bio, nature & agricultural (167 | 9.8%) are the most common fields of study among 1,702 individuals in Koochiching County who have obtained a bachelor's degree or higher.

| Field of Study | # Graduates | % Graduates |
| Computers & Mathematics | 36 | 2.1% |
| Bio, Nature & Agricultural | 167 | 9.8% |
| Physical & Health Sciences | 26 | 1.5% |
| Psychology | 74 | 4.3% |
| Social Sciences | 80 | 4.7% |
| Engineering | 35 | 2.1% |
| Multidisciplinary Studies | 4 | 0.2% |
| Science & Technology | 233 | 13.7% |
| Business | 239 | 14.0% |
| Education | 385 | 22.6% |
| Literature & Languages | 48 | 2.8% |
| Liberal Arts & History | 49 | 2.9% |
| Visual & Performing Arts | 43 | 2.5% |
| Communications | 51 | 3.0% |
| Arts & Humanities | 232 | 13.6% |
| Total | 1,702 | 100.0% |
Transportation & Commute in Koochiching County
Vehicle Availability by Sex in Koochiching County
The most prevalent vehicle ownership categories in Koochiching County are males with 2 vehicles (1,203, accounting for 42.2%) and females with 2 vehicles (1,049, making up 45.6%).

| Vehicles Available | Male | Female |
| No Vehicle | 32 (1.1%) | 25 (0.9%) |
| 1 Vehicle | 325 (11.4%) | 494 (18.7%) |
| 2 Vehicles | 1,203 (42.2%) | 1,049 (39.8%) |
| 3 Vehicles | 760 (26.7%) | 719 (27.3%) |
| 4 Vehicles | 299 (10.5%) | 217 (8.2%) |
| 5 or more Vehicles | 232 (8.1%) | 135 (5.1%) |
| Total | 2,851 (100.0%) | 2,639 (100.0%) |
Commute Time in Koochiching County
The most frequently occuring commute durations in Koochiching County are 5 to 9 minutes (1,800 commuters, 35.7%), 10 to 14 minutes (971 commuters, 19.3%), and less than 5 minutes (504 commuters, 10.0%).

| Commute Time | # Commuters | % Commuters |
| Less than 5 Minutes | 504 | 10.0% |
| 5 to 9 Minutes | 1,800 | 35.7% |
| 10 to 14 Minutes | 971 | 19.3% |
| 15 to 19 Minutes | 470 | 9.3% |
| 20 to 24 Minutes | 296 | 5.9% |
| 25 to 29 Minutes | 226 | 4.5% |
| 30 to 34 Minutes | 198 | 3.9% |
| 35 to 39 Minutes | 36 | 0.7% |
| 40 to 44 Minutes | 41 | 0.8% |
| 45 to 59 Minutes | 175 | 3.5% |
| 60 to 89 Minutes | 219 | 4.3% |
| 90 or more Minutes | 102 | 2.0% |
Commute Time by Sex in Koochiching County
The most common commute times in Koochiching County are 5 to 9 minutes (933 commuters, 34.8%) for males and 5 to 9 minutes (867 commuters, 36.7%) for females.

| Commute Time | Male | Female |
| Less than 5 Minutes | 272 (10.2%) | 232 (9.8%) |
| 5 to 9 Minutes | 933 (34.8%) | 867 (36.7%) |
| 10 to 14 Minutes | 488 (18.2%) | 483 (20.5%) |
| 15 to 19 Minutes | 246 (9.2%) | 224 (9.5%) |
| 20 to 24 Minutes | 178 (6.7%) | 118 (5.0%) |
| 25 to 29 Minutes | 98 (3.7%) | 128 (5.4%) |
| 30 to 34 Minutes | 128 (4.8%) | 70 (3.0%) |
| 35 to 39 Minutes | 17 (0.6%) | 19 (0.8%) |
| 40 to 44 Minutes | 24 (0.9%) | 17 (0.7%) |
| 45 to 59 Minutes | 103 (3.8%) | 72 (3.0%) |
| 60 to 89 Minutes | 122 (4.6%) | 97 (4.1%) |
| 90 or more Minutes | 68 (2.5%) | 34 (1.4%) |
Time of Departure to Work by Sex in Koochiching County
The most frequent times of departure to work in Koochiching County are 7:30 AM to 7:59 AM (375, 14.0%) for males and 7:30 AM to 7:59 AM (564, 23.9%) for females.

| Time of Departure | Male | Female |
| 12:00 AM to 4:59 AM | 229 (8.6%) | 48 (2.0%) |
| 5:00 AM to 5:29 AM | 173 (6.5%) | 86 (3.6%) |
| 5:30 AM to 5:59 AM | 351 (13.1%) | 101 (4.3%) |
| 6:00 AM to 6:29 AM | 307 (11.5%) | 90 (3.8%) |
| 6:30 AM to 6:59 AM | 338 (12.6%) | 152 (6.4%) |
| 7:00 AM to 7:29 AM | 260 (9.7%) | 145 (6.1%) |
| 7:30 AM to 7:59 AM | 375 (14.0%) | 564 (23.9%) |
| 8:00 AM to 8:29 AM | 133 (5.0%) | 251 (10.6%) |
| 8:30 AM to 8:59 AM | 102 (3.8%) | 113 (4.8%) |
| 9:00 AM to 9:59 AM | 40 (1.5%) | 279 (11.8%) |
| 10:00 AM to 10:59 AM | 45 (1.7%) | 72 (3.0%) |
| 11:00 AM to 11:59 AM | 10 (0.4%) | 39 (1.7%) |
| 12:00 PM to 3:59 PM | 94 (3.5%) | 228 (9.7%) |
| 4:00 PM to 11:59 PM | 220 (8.2%) | 193 (8.2%) |
| Total | 2,677 (100.0%) | 2,361 (100.0%) |
Housing Occupancy in Koochiching County
Occupancy by Ownership in Koochiching County
Of the total 5,703 dwellings in Koochiching County, owner-occupied units account for 4,601 (80.7%), while renter-occupied units make up 1,102 (19.3%).

| Occupancy | # Housing Units | % Housing Units |
| Owner Occupied Housing Units | 4,601 | 80.7% |
| Renter-Occupied Housing Units | 1,102 | 19.3% |
| Total Occupied Housing Units | 5,703 | 100.0% |
Occupancy by Household Size in Koochiching County

| Household Size | # Housing Units | % Housing Units |
| 1-Person Household | 2,078 | 36.4% |
| 2-Person Household | 2,196 | 38.5% |
| 3-Person Household | 610 | 10.7% |
| 4+ Person Household | 819 | 14.4% |
| Total Housing Units | 5,703 | 100.0% |
Occupancy by Ownership by Household Size in Koochiching County

| Household Size | Owner-occupied | Renter-occupied |
| 1-Person Household | 1,462 (70.4%) | 616 (29.6%) |
| 2-Person Household | 1,920 (87.4%) | 276 (12.6%) |
| 3-Person Household | 497 (81.5%) | 113 (18.5%) |
| 4+ Person Household | 722 (88.2%) | 97 (11.8%) |
| Total Housing Units | 4,601 (80.7%) | 1,102 (19.3%) |
Occupancy by Educational Attainment in Koochiching County

| Household Size | Owner-occupied | Renter-occupied |
| Less than High School | 151 (38.0%) | 246 (62.0%) |
| High School Diploma | 1,369 (84.1%) | 258 (15.9%) |
| College/Associate Degree | 2,289 (83.5%) | 451 (16.5%) |
| Bachelor's Degree or higher | 792 (84.4%) | 147 (15.7%) |
Occupancy by Age of Householder in Koochiching County

| Age Bracket | # Households | % Households |
| Under 35 Years | 802 | 14.1% |
| 35 to 44 Years | 644 | 11.3% |
| 45 to 54 Years | 886 | 15.5% |
| 55 to 64 Years | 1,284 | 22.5% |
| 65 to 74 Years | 1,220 | 21.4% |
| 75 to 84 Years | 579 | 10.2% |
| 85 Years and Over | 288 | 5.1% |
| Total | 5,703 | 100.0% |
Housing Finances in Koochiching County
Median Income by Occupancy in Koochiching County

| Occupancy Type | # Households | Median Income |
| Owner-Occupied | 4,601 (80.7%) | $70,330 |
| Renter-Occupied | 1,102 (19.3%) | $32,117 |
| Average | 5,703 (100.0%) | $59,779 |
Occupancy by Householder Income Bracket in Koochiching County

| Income Bracket | Owner-occupied | Renter-occupied |
| Less than $5,000 | 57 (1.2%) | 45 (4.1%) |
| $5,000 to $9,999 | 60 (1.3%) | 40 (3.6%) |
| $10,000 to $14,999 | 173 (3.8%) | 167 (15.1%) |
| $15,000 to $19,999 | 144 (3.1%) | 131 (11.9%) |
| $20,000 to $24,999 | 112 (2.4%) | 32 (2.9%) |
| $25,000 to $34,999 | 235 (5.1%) | 218 (19.8%) |
| $35,000 to $49,999 | 720 (15.7%) | 109 (9.9%) |
| $50,000 to $74,999 | 941 (20.4%) | 192 (17.4%) |
| $75,000 to $99,999 | 744 (16.2%) | 112 (10.2%) |
| $100,000 to $149,999 | 941 (20.4%) | 39 (3.5%) |
| $150,000 or more | 474 (10.3%) | 17 (1.5%) |
| Total | 4,601 (100.0%) | 1,102 (100.0%) |
Monthly Housing Cost Tiers in Koochiching County

| Monthly Cost | Owner-occupied | Renter-occupied |
| Less than $300 | 432 (9.4%) | 68 (6.2%) |
| $300 to $499 | 1,040 (22.6%) | 275 (24.9%) |
| $500 to $799 | 1,032 (22.4%) | 270 (24.5%) |
| $800 to $999 | 561 (12.2%) | 281 (25.5%) |
| $1,000 to $1,499 | 961 (20.9%) | 32 (2.9%) |
| $1,500 to $1,999 | 341 (7.4%) | 5 (0.4%) |
| $2,000 to $2,499 | 134 (2.9%) | 103 (9.3%) |
| $2,500 to $2,999 | 26 (0.6%) | 5 (0.4%) |
| $3,000 or more | 74 (1.6%) | 0 (0.0%) |
| Total | 4,601 (100.0%) | 1,102 (100.0%) |
Physical Housing Characteristics in Koochiching County
Housing Structures in Koochiching County

| Structure Type | # Housing Units | % Housing Units |
| Single Unit, Detached | 4,616 | 80.9% |
| Single Unit, Attached | 66 | 1.2% |
| 2 Unit Apartments | 52 | 0.9% |
| 3 or 4 Unit Apartments | 47 | 0.8% |
| 5 to 9 Unit Apartments | 93 | 1.6% |
| 10 or more Apartments | 436 | 7.6% |
| Mobile Home / Other | 393 | 6.9% |
| Total | 5,703 | 100.0% |
Housing Structures by Occupancy in Koochiching County

| Structure Type | Owner-occupied | Renter-occupied |
| Single Unit, Detached | 4,231 (91.7%) | 385 (8.3%) |
| Single Unit, Attached | 60 (90.9%) | 6 (9.1%) |
| 2 Unit Apartments | 8 (15.4%) | 44 (84.6%) |
| 3 or 4 Unit Apartments | 8 (17.0%) | 39 (83.0%) |
| 5 to 9 Unit Apartments | 24 (25.8%) | 69 (74.2%) |
| 10 or more Apartments | 0 (0.0%) | 436 (100.0%) |
| Mobile Home / Other | 270 (68.7%) | 123 (31.3%) |
| Total | 4,601 (80.7%) | 1,102 (19.3%) |
Housing Structures by Number of Rooms in Koochiching County

| Number of Rooms | Owner-occupied | Renter-occupied |
| 1 Room | 17 (0.4%) | 4 (0.4%) |
| 2 or 3 Rooms | 186 (4.0%) | 405 (36.7%) |
| 4 or 5 Rooms | 1,428 (31.0%) | 423 (38.4%) |
| 6 or 7 Rooms | 1,682 (36.6%) | 166 (15.1%) |
| 8 or more Rooms | 1,288 (28.0%) | 104 (9.4%) |
| Total | 4,601 (100.0%) | 1,102 (100.0%) |
Housing Structure by Heating Type in Koochiching County

| Heating Type | Owner-occupied | Renter-occupied |
| Utility Gas | 2,179 (47.4%) | 690 (62.6%) |
| Bottled, Tank, or LP Gas | 1,215 (26.4%) | 105 (9.5%) |
| Electricity | 597 (13.0%) | 239 (21.7%) |
| Fuel Oil or Kerosene | 156 (3.4%) | 3 (0.3%) |
| Coal or Coke | 0 (0.0%) | 0 (0.0%) |
| All other Fuels | 454 (9.9%) | 54 (4.9%) |
| No Fuel Used | 0 (0.0%) | 11 (1.0%) |
| Total | 4,601 (100.0%) | 1,102 (100.0%) |
Household Vehicle Usage in Koochiching County

| Vehicles per Household | Owner-occupied | Renter-occupied |
| No Vehicle | 124 (2.7%) | 270 (24.5%) |
| 1 Vehicle | 1,015 (22.1%) | 575 (52.2%) |
| 2 Vehicles | 2,041 (44.4%) | 164 (14.9%) |
| 3 or more Vehicles | 1,421 (30.9%) | 93 (8.4%) |
| Total | 4,601 (100.0%) | 1,102 (100.0%) |
Real Estate & Mortgages in Koochiching County
Real Estate and Mortgage Overview in Koochiching County
| Characteristic | Without Mortgage | With Mortgage |
| Housing Units | 2,155 | 2,446 |
| Median Property Value | $114,500 | $147,300 |
| Median Household Income | $53,656 | $306 |
| Monthly Housing Costs | $427 | $74 |
| Real Estate Taxes | $911 | $11 |
Property Value by Mortgage Status in Koochiching County

| Property Value | Without Mortgage | With Mortgage |
| Less than $50,000 | 424 (19.7%) | 245 (10.0%) |
| $50,000 to $99,999 | 510 (23.7%) | 398 (16.3%) |
| $100,000 to $299,999 | 978 (45.4%) | 1,456 (59.5%) |
| $300,000 to $499,999 | 188 (8.7%) | 279 (11.4%) |
| $500,000 to $749,999 | 35 (1.6%) | 14 (0.6%) |
| $750,000 to $999,999 | 16 (0.7%) | 52 (2.1%) |
| $1,000,000 or more | 4 (0.2%) | 2 (0.1%) |
| Total | 2,155 (100.0%) | 2,446 (100.0%) |
Household Income by Mortgage Status in Koochiching County

| Household Income | Without Mortgage | With Mortgage |
| Less than $10,000 | 65 (3.0%) | 21 (0.9%) |
| $10,000 to $24,999 | 308 (14.3%) | 52 (2.1%) |
| $25,000 to $34,999 | 151 (7.0%) | 121 (5.0%) |
| $35,000 to $49,999 | 457 (21.2%) | 84 (3.4%) |
| $50,000 to $74,999 | 439 (20.4%) | 263 (10.7%) |
| $75,000 to $99,999 | 283 (13.1%) | 502 (20.5%) |
| $100,000 to $149,999 | 284 (13.2%) | 461 (18.9%) |
| $150,000 or more | 168 (7.8%) | 657 (26.9%) |
| Total | 2,155 (100.0%) | 2,446 (100.0%) |
Property Value to Household Income Ratio in Koochiching County

| Value-to-Income Ratio | Without Mortgage | With Mortgage |
| Less than 2.0x | 1,069 (49.6%) | 86,842 (3,550.4%) |
| 2.0x to 2.9x | 378 (17.5%) | 1,399 (57.2%) |
| 3.0x to 3.9x | 228 (10.6%) | 418 (17.1%) |
| 4.0x or more | 474 (22.0%) | 281 (11.5%) |
| Total | 2,155 (100.0%) | 2,446 (100.0%) |
Real Estate Taxes by Mortgage Status in Koochiching County

| Property Taxes | Without Mortgage | With Mortgage |
| Less than $800 | 869 (40.3%) | 21 (0.9%) |
| $800 to $1,499 | 743 (34.5%) | 669 (27.4%) |
| $800 to $1,499 | 507 (23.5%) | 1,007 (41.2%) |
| Total | 2,155 (100.0%) | 2,446 (100.0%) |
Health & Disability in Koochiching County
Health Insurance Coverage by Age in Koochiching County

| Age Bracket | With Coverage | Without Coverage |
| Under 6 Years | 554 (97.5%) | 14 (2.5%) |
| 6 to 18 Years | 1,515 (89.4%) | 179 (10.6%) |
| 19 to 25 Years | 650 (87.8%) | 90 (12.2%) |
| 26 to 34 Years | 917 (90.5%) | 96 (9.5%) |
| 35 to 44 Years | 1,203 (96.6%) | 42 (3.4%) |
| 45 to 54 Years | 1,360 (93.5%) | 95 (6.5%) |
| 55 to 64 Years | 1,861 (90.6%) | 194 (9.4%) |
| 65 to 74 Years | 1,917 (100.0%) | 0 (0.0%) |
| 75 Years and older | 1,165 (100.0%) | 0 (0.0%) |
| Total | 11,142 (94.0%) | 710 (6.0%) |
Health Insurance Coverage by Citizenship Status in Koochiching County

| Citizenship Status | With Coverage | Without Coverage |
| Native Born | 554 (97.5%) | 14 (2.5%) |
| Foreign Born, Citizen | 1,515 (89.4%) | 179 (10.6%) |
| Foreign Born, not a Citizen | 650 (87.8%) | 90 (12.2%) |
Health Insurance Coverage by Household Income in Koochiching County

| Household Income | With Coverage | Without Coverage |
| Under $25,000 | 1,307 (93.6%) | 89 (6.4%) |
| $25,000 to $49,999 | 1,975 (91.9%) | 175 (8.1%) |
| $50,000 to $74,999 | 2,103 (95.1%) | 108 (4.9%) |
| $75,000 to $99,999 | 1,907 (89.6%) | 222 (10.4%) |
| $100,000 and over | 3,707 (97.2%) | 107 (2.8%) |
Public vs Private Health Insurance Coverage by Age in Koochiching County

| Age Bracket | Public Insurance | Private Insurance |
| Under 6 | 205 (36.1%) | 386 (68.0%) |
| 6 to 18 Years | 721 (42.6%) | 921 (54.4%) |
| 19 to 25 Years | 114 (15.4%) | 536 (72.4%) |
| 25 to 34 Years | 373 (36.8%) | 551 (54.4%) |
| 35 to 44 Years | 226 (18.1%) | 1,004 (80.6%) |
| 45 to 54 Years | 350 (24.0%) | 1,066 (73.3%) |
| 55 to 64 Years | 550 (26.8%) | 1,471 (71.6%) |
| 65 to 74 Years | 1,908 (99.5%) | 1,331 (69.4%) |
| 75 Years and over | 1,165 (100.0%) | 914 (78.4%) |
| Total | 5,612 (47.3%) | 8,180 (69.0%) |
Disability Status by Sex by Age in Koochiching County

| Age Bracket | Male | Female |
| Under 5 Years | 22 (8.6%) | 0 (0.0%) |
| 5 to 17 Years | 51 (6.2%) | 49 (5.8%) |
| 18 to 34 Years | 97 (9.8%) | 140 (15.7%) |
| 35 to 64 Years | 350 (14.4%) | 439 (18.9%) |
| 65 to 74 Years | 221 (22.4%) | 213 (23.0%) |
| 75 Years and over | 288 (51.5%) | 376 (62.1%) |
Disability Class by Sex by Age in Koochiching County
Disability Class: Hearing Difficulty

| Age Bracket | Male | Female |
| Under 5 Years | 22 (8.6%) | 0 (0.0%) |
| 5 to 17 Years | 0 (0.0%) | 30 (3.5%) |
| 18 to 34 Years | 5 (0.5%) | 14 (1.6%) |
| 35 to 64 Years | 121 (5.0%) | 70 (3.0%) |
| 65 to 74 Years | 140 (14.2%) | 63 (6.8%) |
| 75 Years and over | 228 (40.8%) | 167 (27.6%) |
Disability Class: Vision Difficulty

| Age Bracket | Male | Female |
| Under 5 Years | 22 (8.6%) | 0 (0.0%) |
| 5 to 17 Years | 0 (0.0%) | 9 (1.1%) |
| 18 to 34 Years | 21 (2.1%) | 72 (8.1%) |
| 35 to 64 Years | 50 (2.1%) | 51 (2.2%) |
| 65 to 74 Years | 14 (1.4%) | 15 (1.6%) |
| 75 Years and over | 111 (19.9%) | 69 (11.4%) |
Disability Class: Cognitive Difficulty

| Age Bracket | Male | Female |
| 5 to 17 Years | 51 (6.2%) | 19 (2.2%) |
| 18 to 34 Years | 91 (9.2%) | 90 (10.1%) |
| 35 to 64 Years | 187 (7.7%) | 210 (9.0%) |
| 65 to 74 Years | 40 (4.0%) | 30 (3.2%) |
| 75 Years and over | 25 (4.5%) | 50 (8.3%) |
Disability Class: Ambulatory Difficulty

| Age Bracket | Male | Female |
| 5 to 17 Years | 0 (0.0%) | 9 (1.1%) |
| 18 to 34 Years | 0 (0.0%) | 25 (2.8%) |
| 35 to 64 Years | 176 (7.2%) | 291 (12.5%) |
| 65 to 74 Years | 62 (6.3%) | 147 (15.8%) |
| 75 Years and over | 152 (27.2%) | 211 (34.8%) |
Disability Class: Self-Care Difficulty

| Age Bracket | Male | Female |
| 5 to 17 Years | 50 (6.1%) | 17 (2.0%) |
| 18 to 34 Years | 0 (0.0%) | 25 (2.8%) |
| 35 to 64 Years | 107 (4.4%) | 63 (2.7%) |
| 65 to 74 Years | 18 (1.8%) | 12 (1.3%) |
| 75 Years and over | 52 (9.3%) | 46 (7.6%) |
Technology Access in Koochiching County
Computing Device Access in Koochiching County

| Device Type | # Households | % Households |
| Desktop or Laptop | 4,114 | 72.1% |
| Smartphone | 4,450 | 78.0% |
| Tablet | 3,238 | 56.8% |
| No Computing Device | 570 | 10.0% |
| Total | 5,703 | 100.0% |
Internet Access in Koochiching County

| Internet Type | # Households | % Households |
| Dial-Up Internet | 10 | 0.2% |
| Broadband Home | 3,925 | 68.8% |
| Cellular Data Only | 660 | 11.6% |
| Satellite Internet | 318 | 5.6% |
| No Internet | 854 | 15.0% |
| Total | 5,703 | 100.0% |
Koochiching County Summary
Koochiching County is located in the northernmost part of Minnesota, along the Canadian border. It is bordered by Lake of the Woods County to the west, Beltrami County to the south, and the Canadian provinces of Manitoba and Ontario to the north and east, respectively. The county seat is International Falls, and the county has a total area of 1,845 square miles.
History
Koochiching County was established in 1906, and was named after the Ojibwe word for “place of the pines.” The county was originally part of St. Louis County, and was created from parts of Beltrami and Itasca counties. The county was originally inhabited by the Ojibwe people, and the first European settlers arrived in the area in the late 1800s.
The county was initially a logging and fur trading center, and the first sawmill was built in International Falls in 1894. The area was also home to several mining operations, including iron ore, copper, and silver. The county was also home to several hydroelectric power plants, which provided electricity to the region.
Geography
Koochiching County is located in the northernmost part of Minnesota, along the Canadian border. It is bordered by Lake of the Woods County to the west, Beltrami County to the south, and the Canadian provinces of Manitoba and Ontario to the north and east, respectively. The county has a total area of 1,845 square miles, and is mostly covered by forests and wetlands. The county is home to several lakes, including Rainy Lake, Kabetogama Lake, and Namakan Lake.
The county is home to several state parks, including Voyageurs National Park, which is located on the border with Canada. The park is home to several species of wildlife, including moose, wolves, and bald eagles. The county is also home to several state forests, including the Koochiching State Forest and the Chippewa National Forest.
Economy
Koochiching County’s economy is largely based on tourism, forestry, and mining. The county is home to several tourist attractions, including Voyageurs National Park, which attracts visitors from all over the world. The county is also home to several logging and timber companies, which provide jobs to many of the county’s residents. The county is also home to several mining operations, including iron ore, copper, and silver.
The county is also home to several manufacturing companies, including paper mills and food processing plants. The county is also home to several retail stores, restaurants, and other businesses. The county is also home to several government offices, including the Koochiching County Courthouse and the Koochiching County Sheriff’s Office.
Demographics
As of the 2010 census, Koochiching County had a population of 13,311. The population was spread out, with 48.2% male and 51.8% female. The median age was 44.7 years. The racial makeup of the county was 94.2% White, 0.7% African American, 0.7% Native American, 0.3% Asian, 0.1% Pacific Islander, 2.3% from other races, and 1.9% from two or more races. Hispanic or Latino of any race were 4.2% of the population.
The median income for a household in the county was $41,945, and the median income for a family was $50,945. The per capita income for the county was $21,945. About 11.2% of families and 14.2% of the population were below the poverty line, including 19.2% of those under age 18 and 8.2% of those age 65 or over.
Common Questions
What is the Total Population of Koochiching County?
Total Population of Koochiching County is 12,072.
What is the Total Male Population of Koochiching County?
Total Male Population of Koochiching County is 6,099.
What is the Total Female Population of Koochiching County?
Total Female Population of Koochiching County is 5,973.
What is the Ratio of Males per 100 Females in Koochiching County?
There are 102.11 Males per 100 Females in Koochiching County.
What is the Ratio of Females per 100 Males in Koochiching County?
There are 97.93 Females per 100 Males in Koochiching County.
What is the Median Population Age in Koochiching County?
Median Population Age in Koochiching County is 50.6 Years.
What is the Average Family Size in Koochiching County
Average Family Size in Koochiching County is 2.7 People.
What is the Average Household Size in Koochiching County
Average Household Size in Koochiching County is 2.0 People.
What is Per Capita Income in Koochiching County?
Per Capita income in Koochiching County is $36,515.
What is the Median Family Income in Koochiching County?
Median Family Income in Koochiching County is $77,000.
What is the Median Household income in Koochiching County?
Median Household Income in Koochiching County is $59,779.
What is Income or Wage Gap in Koochiching County?
Income or Wage Gap in Koochiching County is 37.8%.
Women in Koochiching County earn 62.2 cents for every dollar earned by a man.
What is Family Income Deficit in Koochiching County?
Family Income Deficit in Koochiching County is $10,350.
Families that are below poverty line in Koochiching County earn $10,350 less on average than the poverty threshold level.
What is Inequality or Gini Index in Koochiching County?
Inequality or Gini Index in Koochiching County is 0.40.
How Large is the Labor Force in Koochiching County?
There are 5,963 People in the Labor Forcein in Koochiching County.
What is the Percentage of People in the Labor Force in Koochiching County?
58.4% of People are in the Labor Force in Koochiching County.
What is the Unemployment Rate in Koochiching County?
Unemployment Rate in Koochiching County is 5.1%.