Kandiyohi County, MN
Kandiyohi County Map
Kandiyohi County Overview
43,686
TOTAL POPULATION
22,189
MALE POPULATION
21,497
FEMALE POPULATION
103.22
MALES / 100 FEMALES
96.88
FEMALES / 100 MALES
40.0
MEDIAN AGE
3.0
AVG FAMILY SIZE
2.5
AVG HOUSEHOLD SIZE
$35,814
PER CAPITA INCOME
$89,539
AVG FAMILY INCOME
$73,285
AVG HOUSEHOLD INCOME
30.5%
WAGE / INCOME GAP [ % ]
69.5¢/ $1
WAGE / INCOME GAP [ $ ]
$11,325
FAMILY INCOME DEFICIT
0.42
INEQUALITY / GINI INDEX
23,106
LABOR FORCE [ PEOPLE ]
67.4%
PERCENT IN LABOR FORCE
3.8%
UNEMPLOYMENT RATE
Kandiyohi County Area Codes
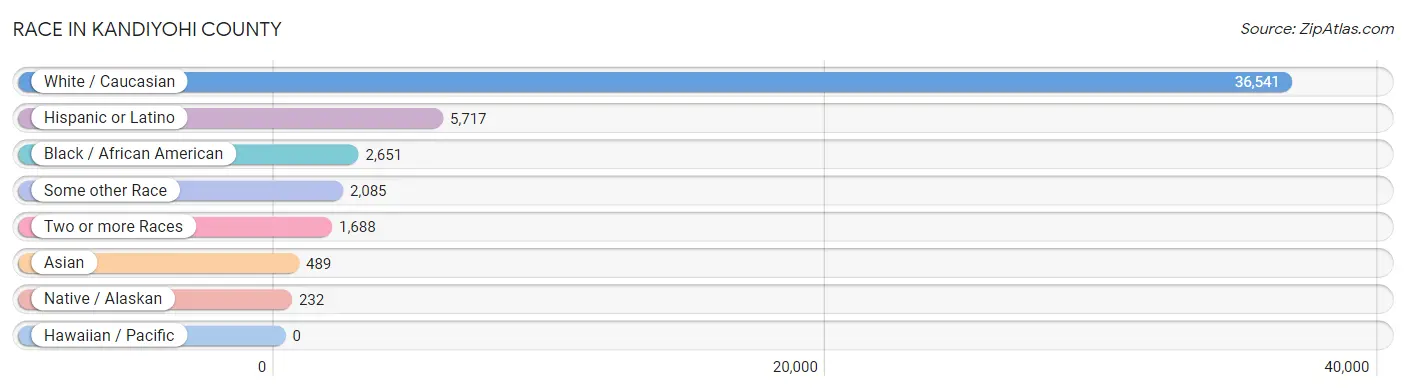
Race in Kandiyohi County
The most populous races in Kandiyohi County are White / Caucasian (36,541 | 83.6%), Hispanic or Latino (5,717 | 13.1%), and Black / African American (2,651 | 6.1%).
| Race | # Population | % Population |
| Asian | 489 | 1.1% |
| Black / African American | 2,651 | 6.1% |
| Hawaiian / Pacific | 0 | 0.0% |
| Hispanic or Latino | 5,717 | 13.1% |
| Native / Alaskan | 232 | 0.5% |
| White / Caucasian | 36,541 | 83.6% |
| Two or more Races | 1,688 | 3.9% |
| Some other Race | 2,085 | 4.8% |
| Total | 43,686 | 100.0% |
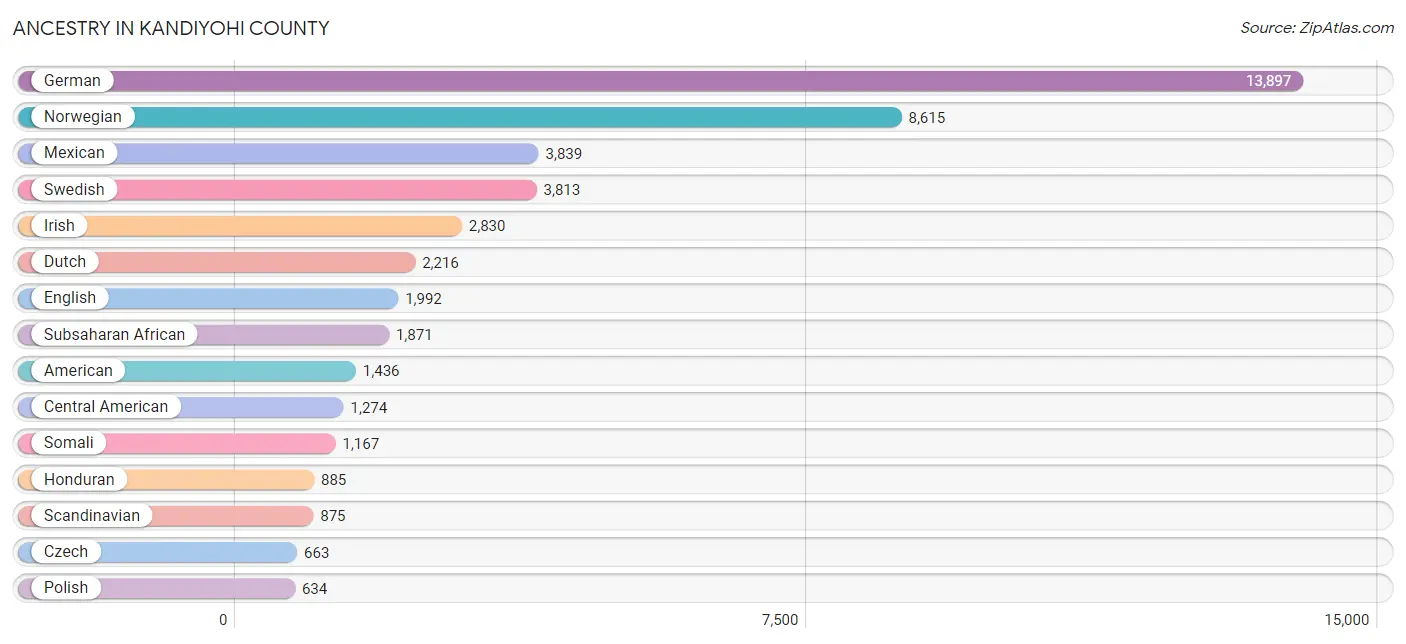
Ancestry in Kandiyohi County
The most populous ancestries reported in Kandiyohi County are German (13,897 | 31.8%), Norwegian (8,615 | 19.7%), Mexican (3,839 | 8.8%), Swedish (3,813 | 8.7%), and Irish (2,830 | 6.5%), together accounting for 75.5% of all Kandiyohi County residents.
| Ancestry | # Population | % Population |
| African | 481 | 1.1% |
| American | 1,436 | 3.3% |
| Apache | 21 | 0.1% |
| Arab | 11 | 0.0% |
| Arapaho | 2 | 0.0% |
| Austrian | 91 | 0.2% |
| Bangladeshi | 10 | 0.0% |
| Belgian | 82 | 0.2% |
| Bhutanese | 4 | 0.0% |
| Blackfeet | 1 | 0.0% |
| Brazilian | 14 | 0.0% |
| British | 76 | 0.2% |
| Bulgarian | 8 | 0.0% |
| Burmese | 122 | 0.3% |
| Canadian | 1 | 0.0% |
| Central American | 1,274 | 2.9% |
| Central American Indian | 95 | 0.2% |
| Cherokee | 22 | 0.1% |
| Chickasaw | 15 | 0.0% |
| Chilean | 8 | 0.0% |
| Chippewa | 163 | 0.4% |
| Colombian | 51 | 0.1% |
| Creek | 15 | 0.0% |
| Croatian | 6 | 0.0% |
| Cuban | 20 | 0.1% |
| Czech | 663 | 1.5% |
| Czechoslovakian | 61 | 0.1% |
| Danish | 277 | 0.6% |
| Dominican | 15 | 0.0% |
| Dutch | 2,216 | 5.1% |
| Dutch West Indian | 5 | 0.0% |
| Eastern European | 20 | 0.1% |
| Ecuadorian | 248 | 0.6% |
| English | 1,992 | 4.6% |
| Ethiopian | 44 | 0.1% |
| European | 565 | 1.3% |
| Filipino | 42 | 0.1% |
| Finnish | 225 | 0.5% |
| French | 573 | 1.3% |
| French Canadian | 170 | 0.4% |
| German | 13,897 | 31.8% |
| German Russian | 3 | 0.0% |
| Greek | 22 | 0.1% |
| Guatemalan | 333 | 0.8% |
| Haitian | 44 | 0.1% |
| Honduran | 885 | 2.0% |
| Hungarian | 46 | 0.1% |
| Icelander | 24 | 0.1% |
| Indian (Asian) | 7 | 0.0% |
| Indonesian | 316 | 0.7% |
| Inupiat | 9 | 0.0% |
| Irish | 2,830 | 6.5% |
| Italian | 339 | 0.8% |
| Japanese | 4 | 0.0% |
| Kenyan | 247 | 0.6% |
| Korean | 47 | 0.1% |
| Laotian | 50 | 0.1% |
| Latvian | 2 | 0.0% |
| Lebanese | 8 | 0.0% |
| Liberian | 4 | 0.0% |
| Lithuanian | 21 | 0.1% |
| Luxembourger | 20 | 0.1% |
| Malaysian | 22 | 0.1% |
| Maltese | 4 | 0.0% |
| Mexican | 3,839 | 8.8% |
| Mexican American Indian | 6 | 0.0% |
| Moroccan | 3 | 0.0% |
| Nicaraguan | 28 | 0.1% |
| Northern European | 146 | 0.3% |
| Norwegian | 8,615 | 19.7% |
| Pakistani | 4 | 0.0% |
| Peruvian | 19 | 0.0% |
| Polish | 634 | 1.5% |
| Portuguese | 7 | 0.0% |
| Puerto Rican | 64 | 0.2% |
| Russian | 83 | 0.2% |
| Salvadoran | 28 | 0.1% |
| Scandinavian | 875 | 2.0% |
| Scotch-Irish | 89 | 0.2% |
| Scottish | 268 | 0.6% |
| Serbian | 2 | 0.0% |
| Sioux | 19 | 0.0% |
| Slavic | 3 | 0.0% |
| Slovak | 21 | 0.1% |
| Slovene | 1 | 0.0% |
| Somali | 1,167 | 2.7% |
| South American | 326 | 0.7% |
| South American Indian | 32 | 0.1% |
| Spaniard | 13 | 0.0% |
| Spanish | 20 | 0.1% |
| Sri Lankan | 20 | 0.1% |
| Subsaharan African | 1,871 | 4.3% |
| Swedish | 3,813 | 8.7% |
| Swiss | 107 | 0.2% |
| Thai | 1 | 0.0% |
| Ukrainian | 106 | 0.2% |
| Welsh | 221 | 0.5% | View All 97 Rows |
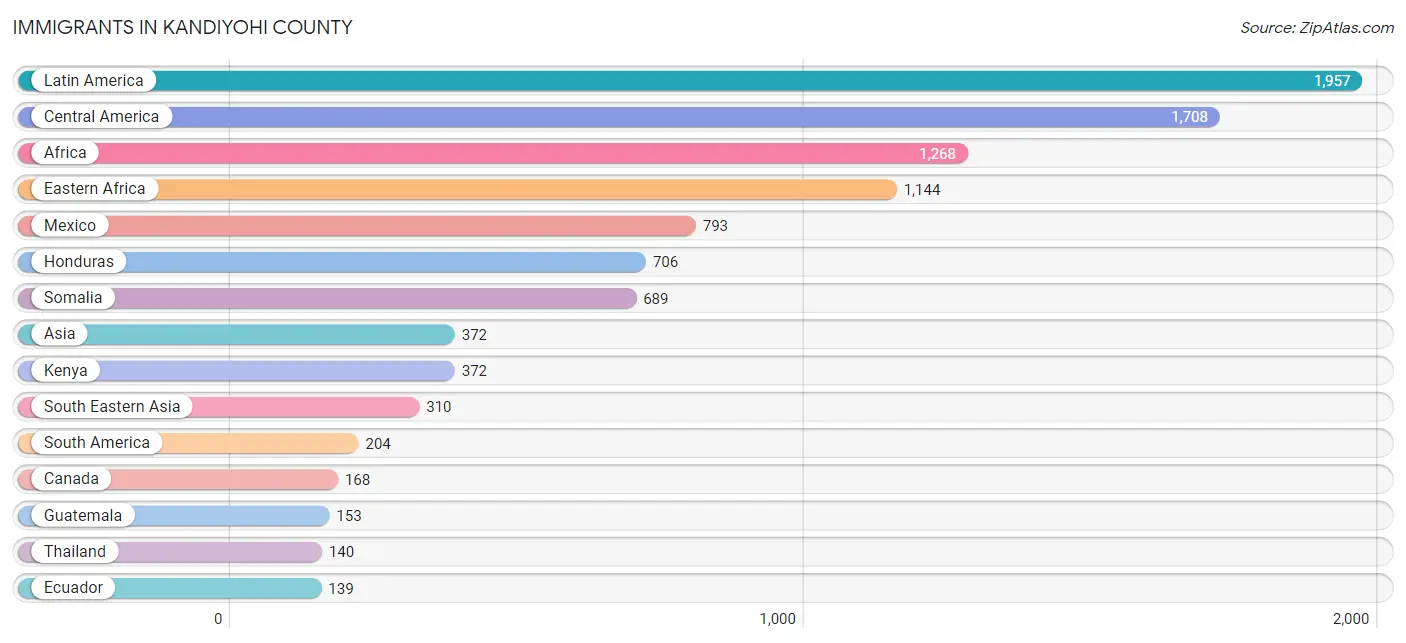
Immigrants in Kandiyohi County
The most numerous immigrant groups reported in Kandiyohi County came from Latin America (1,957 | 4.5%), Central America (1,708 | 3.9%), Africa (1,268 | 2.9%), Eastern Africa (1,144 | 2.6%), and Mexico (793 | 1.8%), together accounting for 15.7% of all Kandiyohi County residents.
| Immigration Origin | # Population | % Population |
| Africa | 1,268 | 2.9% |
| Asia | 372 | 0.9% |
| Australia | 8 | 0.0% |
| Austria | 4 | 0.0% |
| Brazil | 12 | 0.0% |
| Canada | 168 | 0.4% |
| Caribbean | 45 | 0.1% |
| Central America | 1,708 | 3.9% |
| Chile | 8 | 0.0% |
| Colombia | 26 | 0.1% |
| Eastern Africa | 1,144 | 2.6% |
| Eastern Asia | 54 | 0.1% |
| Eastern Europe | 95 | 0.2% |
| Ecuador | 139 | 0.3% |
| El Salvador | 28 | 0.1% |
| England | 3 | 0.0% |
| Ethiopia | 55 | 0.1% |
| Europe | 138 | 0.3% |
| Germany | 12 | 0.0% |
| Greece | 5 | 0.0% |
| Guatemala | 153 | 0.4% |
| Haiti | 37 | 0.1% |
| Honduras | 706 | 1.6% |
| India | 1 | 0.0% |
| Japan | 4 | 0.0% |
| Kenya | 372 | 0.9% |
| Korea | 50 | 0.1% |
| Laos | 22 | 0.1% |
| Latin America | 1,957 | 4.5% |
| Liberia | 4 | 0.0% |
| Lithuania | 3 | 0.0% |
| Mexico | 793 | 1.8% |
| Middle Africa | 3 | 0.0% |
| Nepal | 7 | 0.0% |
| Netherlands | 13 | 0.0% |
| Nicaragua | 28 | 0.1% |
| Nigeria | 13 | 0.0% |
| Northern Europe | 9 | 0.0% |
| Oceania | 10 | 0.0% |
| Peru | 19 | 0.0% |
| Philippines | 8 | 0.0% |
| Poland | 9 | 0.0% |
| Russia | 9 | 0.0% |
| Serbia | 2 | 0.0% |
| Sierra Leone | 27 | 0.1% |
| Somalia | 689 | 1.6% |
| South Africa | 53 | 0.1% |
| South America | 204 | 0.5% |
| South Central Asia | 8 | 0.0% |
| South Eastern Asia | 310 | 0.7% |
| Southern Europe | 5 | 0.0% |
| Thailand | 140 | 0.3% |
| Ukraine | 72 | 0.2% |
| Vietnam | 5 | 0.0% |
| Western Africa | 44 | 0.1% |
| Western Europe | 29 | 0.1% | View All 56 Rows |
Sex and Age in Kandiyohi County
Sex and Age in Kandiyohi County
The most populous age groups in Kandiyohi County are 20 to 24 Years (1,579 | 7.1%) for men and 60 to 64 Years (1,643 | 7.6%) for women.
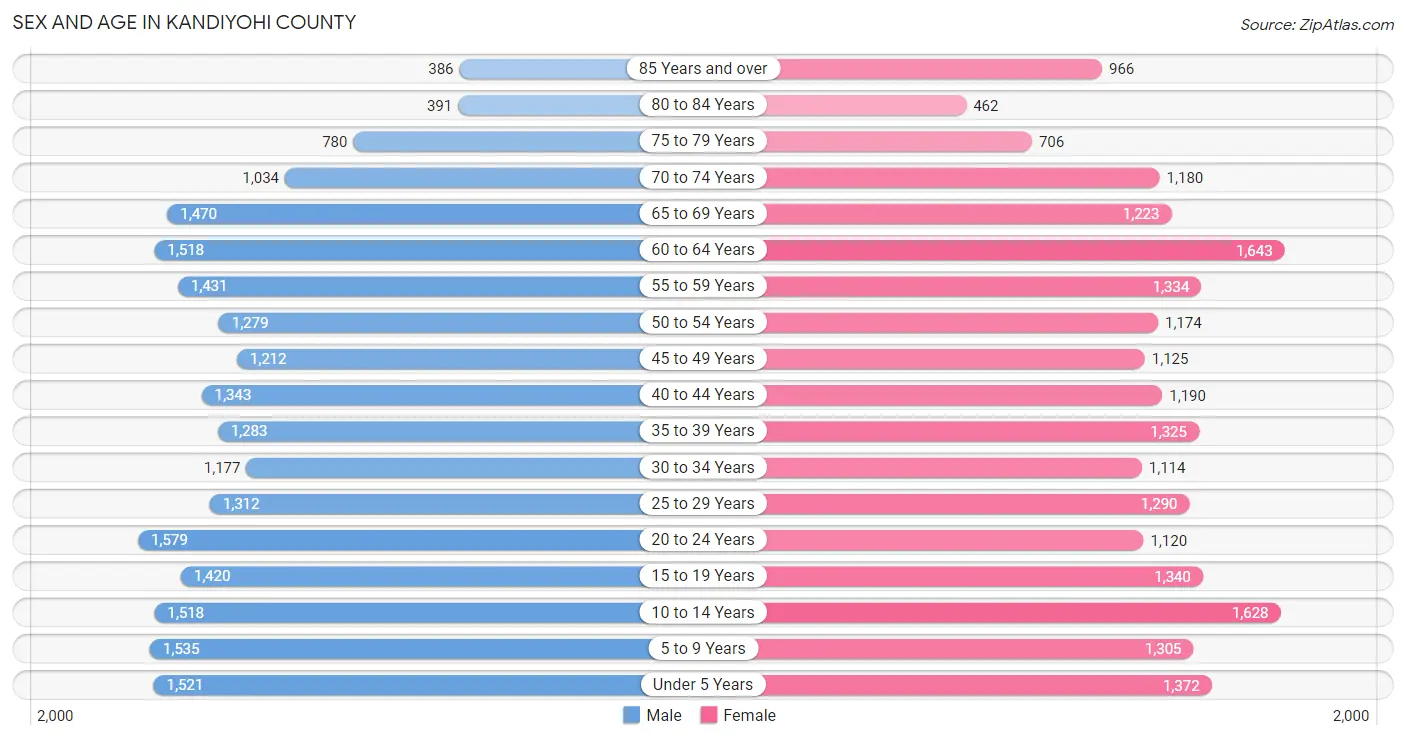
| Age Bracket | Male | Female |
| Under 5 Years | 1,521 (6.9%) | 1,372 (6.4%) |
| 5 to 9 Years | 1,535 (6.9%) | 1,305 (6.1%) |
| 10 to 14 Years | 1,518 (6.8%) | 1,628 (7.6%) |
| 15 to 19 Years | 1,420 (6.4%) | 1,340 (6.2%) |
| 20 to 24 Years | 1,579 (7.1%) | 1,120 (5.2%) |
| 25 to 29 Years | 1,312 (5.9%) | 1,290 (6.0%) |
| 30 to 34 Years | 1,177 (5.3%) | 1,114 (5.2%) |
| 35 to 39 Years | 1,283 (5.8%) | 1,325 (6.2%) |
| 40 to 44 Years | 1,343 (6.0%) | 1,190 (5.5%) |
| 45 to 49 Years | 1,212 (5.5%) | 1,125 (5.2%) |
| 50 to 54 Years | 1,279 (5.8%) | 1,174 (5.5%) |
| 55 to 59 Years | 1,431 (6.5%) | 1,334 (6.2%) |
| 60 to 64 Years | 1,518 (6.8%) | 1,643 (7.6%) |
| 65 to 69 Years | 1,470 (6.6%) | 1,223 (5.7%) |
| 70 to 74 Years | 1,034 (4.7%) | 1,180 (5.5%) |
| 75 to 79 Years | 780 (3.5%) | 706 (3.3%) |
| 80 to 84 Years | 391 (1.8%) | 462 (2.1%) |
| 85 Years and over | 386 (1.7%) | 966 (4.5%) |
| Total | 22,189 (100.0%) | 21,497 (100.0%) |
Families and Households in Kandiyohi County
Median Family Size in Kandiyohi County
The median family size in Kandiyohi County is 2.97 persons per family, with single female/mother families (1,511 | 13.1%) accounting for the largest median family size of 3.03 persons per family. On the other hand, single male/father families (796 | 6.9%) represent the smallest median family size with 2.57 persons per family.
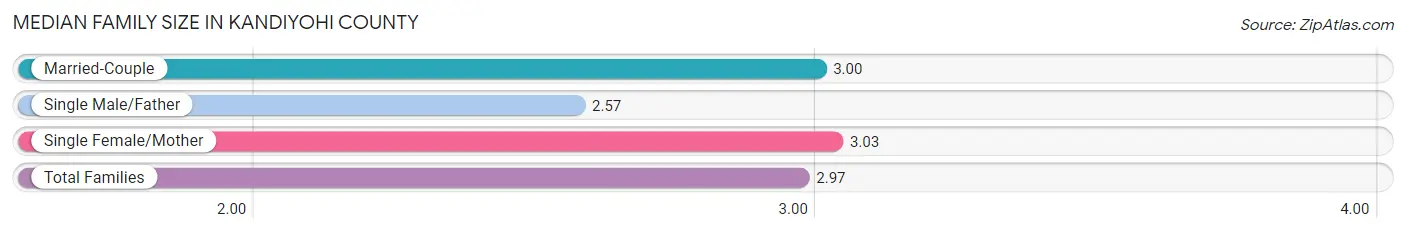
| Family Type | # Families | Family Size |
| Married-Couple | 9,242 (80.0%) | 3.00 |
| Single Male/Father | 796 (6.9%) | 2.57 |
| Single Female/Mother | 1,511 (13.1%) | 3.03 |
| Total Families | 11,549 (100.0%) | 2.97 |
Median Household Size in Kandiyohi County
The median household size in Kandiyohi County is 2.48 persons per household, with single female/mother households (1,511 | 8.8%) accounting for the largest median household size of 3.36 persons per household. non-family households (5,579 | 32.6%) represent the smallest median household size with 1.25 persons per household.
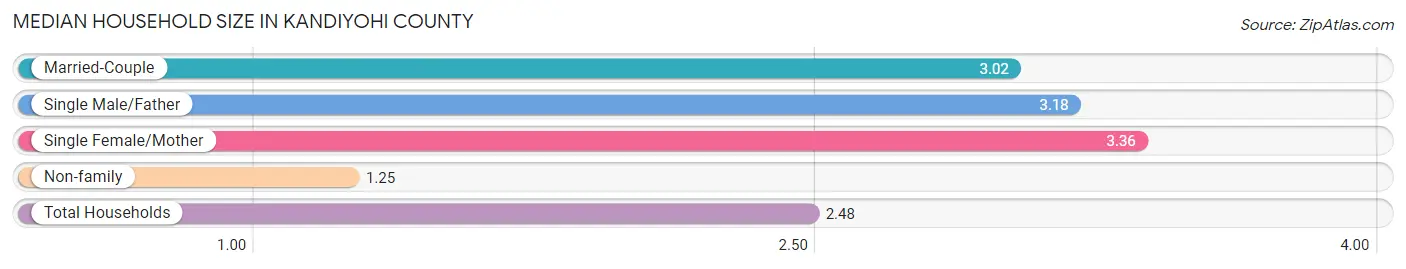
| Household Type | # Households | Household Size |
| Married-Couple | 9,242 (54.0%) | 3.02 |
| Single Male/Father | 796 (4.6%) | 3.18 |
| Single Female/Mother | 1,511 (8.8%) | 3.36 |
| Non-family | 5,579 (32.6%) | 1.25 |
| Total Households | 17,128 (100.0%) | 2.48 |
Household Size by Marriage Status in Kandiyohi County
Out of a total of 17,128 households in Kandiyohi County, 11,549 (67.4%) are family households, while 5,579 (32.6%) are nonfamily households. The most numerous type of family households are 2-person households, comprising 6,103, and the most common type of nonfamily households are 1-person households, comprising 4,481.
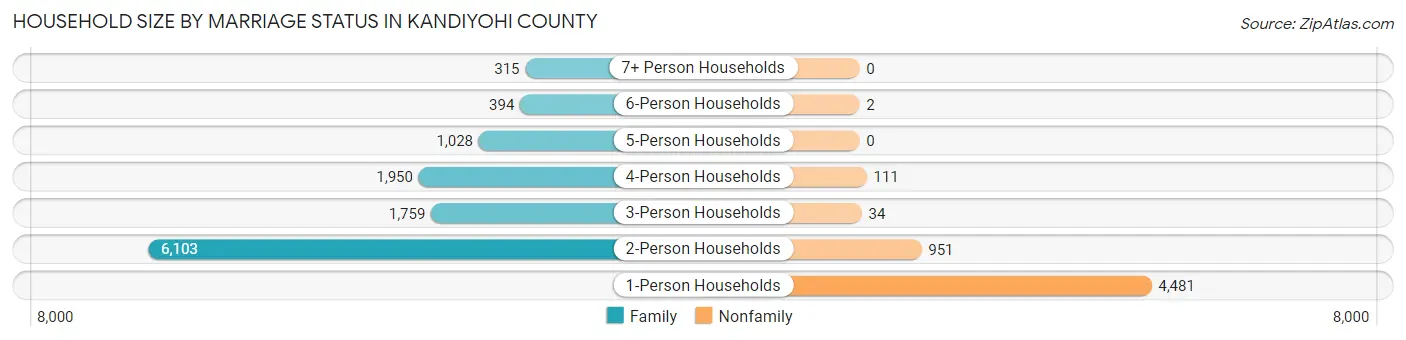
| Household Size | Family Households | Nonfamily Households |
| 1-Person Households | - | 4,481 (26.2%) |
| 2-Person Households | 6,103 (35.6%) | 951 (5.6%) |
| 3-Person Households | 1,759 (10.3%) | 34 (0.2%) |
| 4-Person Households | 1,950 (11.4%) | 111 (0.6%) |
| 5-Person Households | 1,028 (6.0%) | 0 (0.0%) |
| 6-Person Households | 394 (2.3%) | 2 (0.0%) |
| 7+ Person Households | 315 (1.8%) | 0 (0.0%) |
| Total | 11,549 (67.4%) | 5,579 (32.6%) |
Female Fertility in Kandiyohi County
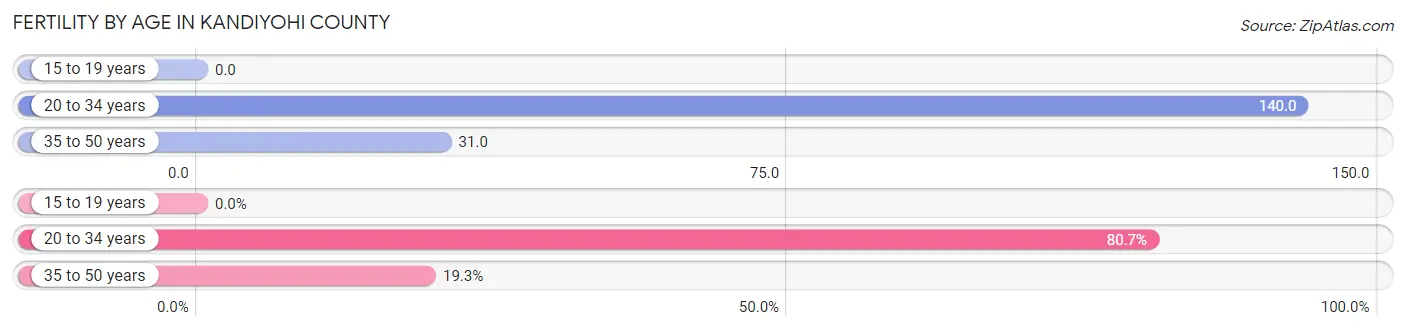
Fertility by Age in Kandiyohi County
Average fertility rate in Kandiyohi County is 70.0 births per 1,000 women. Women in the age bracket of 20 to 34 years have the highest fertility rate with 140.0 births per 1,000 women. Women in the age bracket of 20 to 34 years acount for 80.7% of all women with births.
| Age Bracket | Women with Births | Births / 1,000 Women |
| 15 to 19 years | 0 (0.0%) | 0.0 |
| 20 to 34 years | 492 (80.7%) | 140.0 |
| 35 to 50 years | 118 (19.3%) | 31.0 |
| Total | 610 (100.0%) | 70.0 |
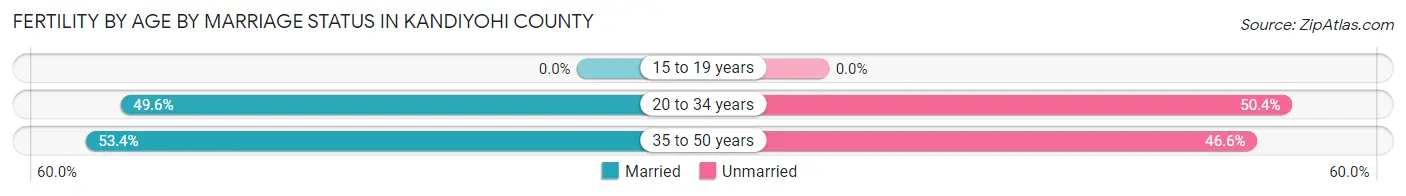
Fertility by Age by Marriage Status in Kandiyohi County
50.3% of women with births (610) in Kandiyohi County are married. The highest percentage of unmarried women with births falls into 20 to 34 years age bracket with 50.4% of them unmarried at the time of birth, while the lowest percentage of unmarried women with births belong to 35 to 50 years age bracket with 46.6% of them unmarried.
| Age Bracket | Married | Unmarried |
| 15 to 19 years | 0 (0.0%) | 0 (0.0%) |
| 20 to 34 years | 244 (49.6%) | 248 (50.4%) |
| 35 to 50 years | 63 (53.4%) | 55 (46.6%) |
| Total | 307 (50.3%) | 303 (49.7%) |
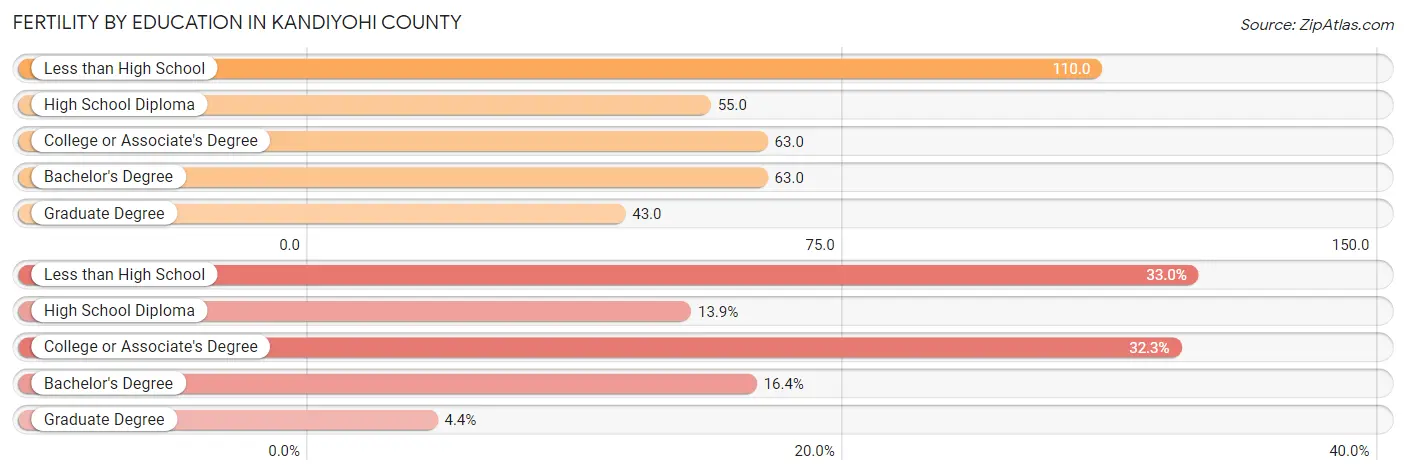
Fertility by Education in Kandiyohi County
Average fertility rate in Kandiyohi County is 70.0 births per 1,000 women. Women with the education attainment of less than high school have the highest fertility rate of 110.0 births per 1,000 women, while women with the education attainment of graduate degree have the lowest fertility at 43.0 births per 1,000 women. Women with the education attainment of less than high school represent 33.0% of all women with births.
| Educational Attainment | Women with Births | Births / 1,000 Women |
| Less than High School | 201 (33.0%) | 110.0 |
| High School Diploma | 85 (13.9%) | 55.0 |
| College or Associate's Degree | 197 (32.3%) | 63.0 |
| Bachelor's Degree | 100 (16.4%) | 63.0 |
| Graduate Degree | 27 (4.4%) | 43.0 |
| Total | 610 (100.0%) | 70.0 |
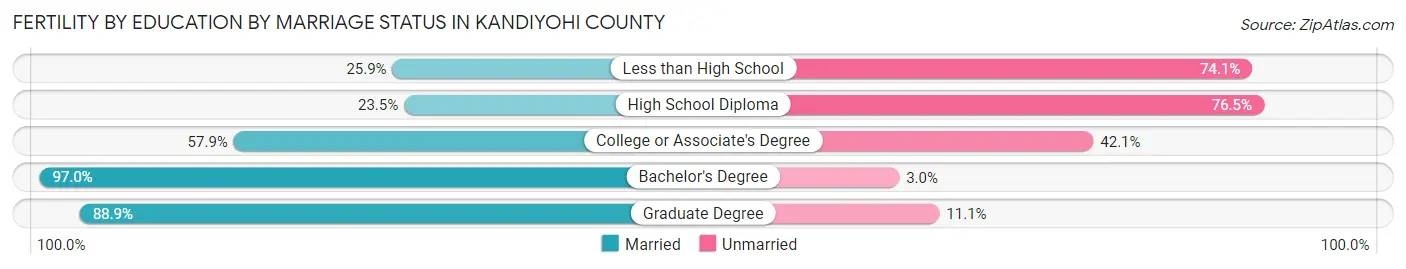
Fertility by Education by Marriage Status in Kandiyohi County
49.7% of women with births in Kandiyohi County are unmarried. Women with the educational attainment of bachelor's degree are most likely to be married with 97.0% of them married at childbirth, while women with the educational attainment of high school diploma are least likely to be married with 76.5% of them unmarried at childbirth.
| Educational Attainment | Married | Unmarried |
| Less than High School | 52 (25.9%) | 149 (74.1%) |
| High School Diploma | 20 (23.5%) | 65 (76.5%) |
| College or Associate's Degree | 114 (57.9%) | 83 (42.1%) |
| Bachelor's Degree | 97 (97.0%) | 3 (3.0%) |
| Graduate Degree | 24 (88.9%) | 3 (11.1%) |
| Total | 307 (50.3%) | 303 (49.7%) |
Income in Kandiyohi County
Income Overview in Kandiyohi County
Per Capita Income in Kandiyohi County is $35,814, while median incomes of families and households are $89,539 and $73,285 respectively.
| Characteristic | Number | Measure |
| Per Capita Income | 43,686 | $35,814 |
| Median Family Income | 11,549 | $89,539 |
| Mean Family Income | 11,549 | $104,847 |
| Median Household Income | 17,128 | $73,285 |
| Mean Household Income | 17,128 | $89,005 |
| Income Deficit | 11,549 | $11,325 |
| Wage / Income Gap (%) | 43,686 | 30.51% |
| Wage / Income Gap ($) | 43,686 | 69.49¢ per $1 |
| Gini / Inequality Index | 43,686 | 0.42 |
Earnings by Sex in Kandiyohi County
Average Earnings in Kandiyohi County are $38,232, $45,249 for men and $31,444 for women, a difference of 30.5%.
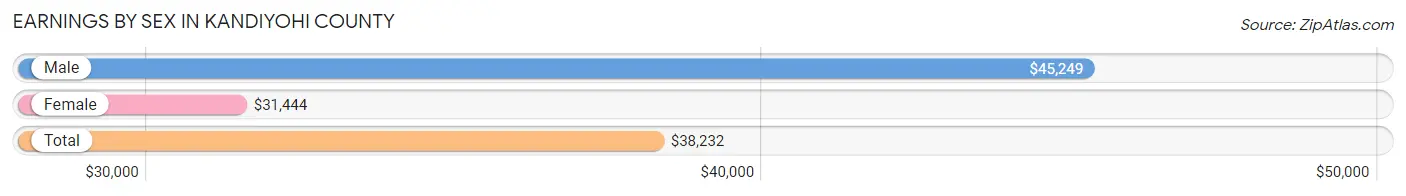
| Sex | Number | Average Earnings |
| Male | 13,308 (54.3%) | $45,249 |
| Female | 11,183 (45.7%) | $31,444 |
| Total | 24,491 (100.0%) | $38,232 |
Earnings by Sex by Income Bracket in Kandiyohi County
The most common earnings brackets in Kandiyohi County are $100,000+ for men (1,663 | 12.5%) and $55,000 to $64,999 for women (899 | 8.0%).
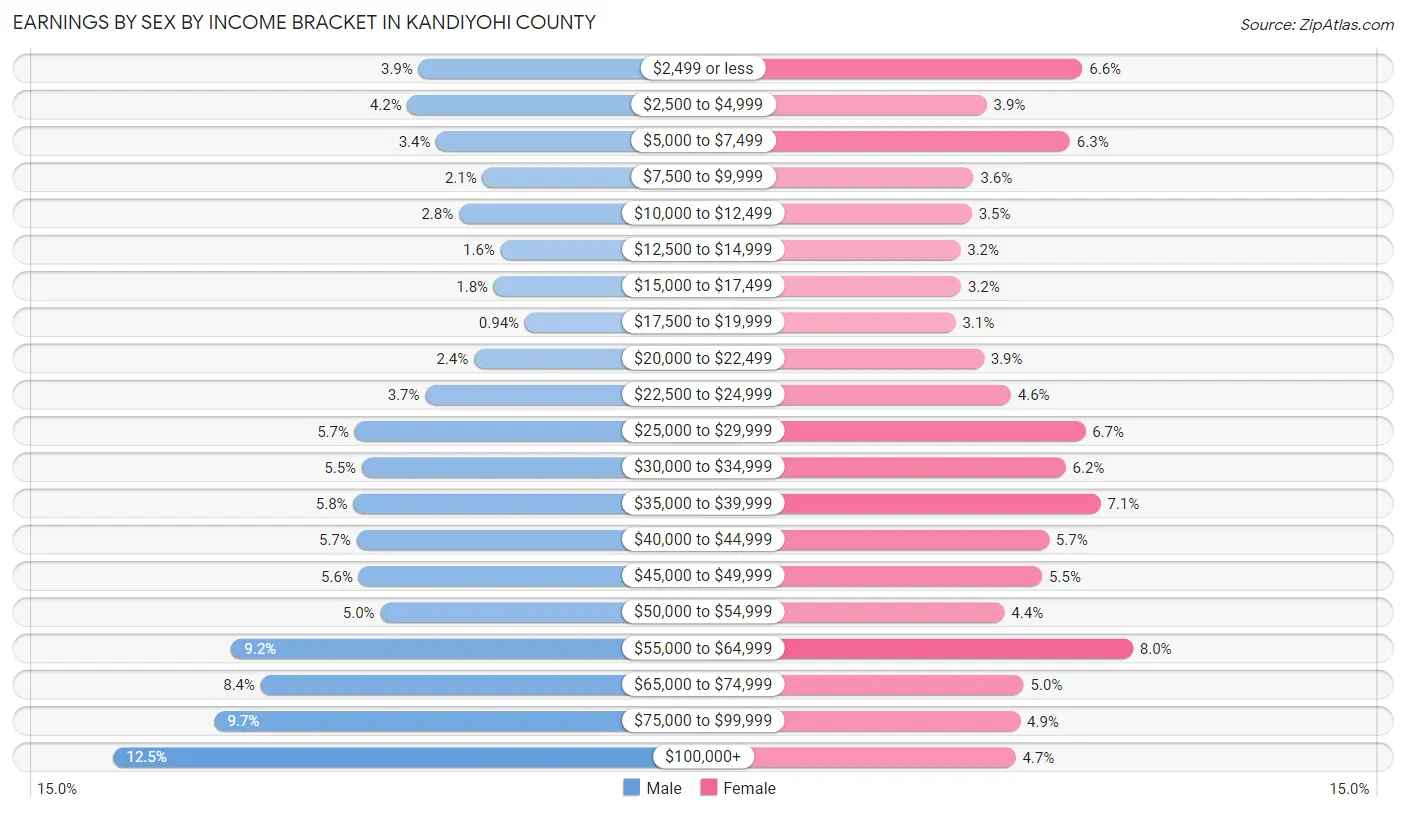
| Income | Male | Female |
| $2,499 or less | 523 (3.9%) | 740 (6.6%) |
| $2,500 to $4,999 | 564 (4.2%) | 440 (3.9%) |
| $5,000 to $7,499 | 456 (3.4%) | 701 (6.3%) |
| $7,500 to $9,999 | 284 (2.1%) | 398 (3.6%) |
| $10,000 to $12,499 | 371 (2.8%) | 393 (3.5%) |
| $12,500 to $14,999 | 216 (1.6%) | 357 (3.2%) |
| $15,000 to $17,499 | 241 (1.8%) | 359 (3.2%) |
| $17,500 to $19,999 | 125 (0.9%) | 342 (3.1%) |
| $20,000 to $22,499 | 316 (2.4%) | 430 (3.8%) |
| $22,500 to $24,999 | 498 (3.7%) | 515 (4.6%) |
| $25,000 to $29,999 | 761 (5.7%) | 749 (6.7%) |
| $30,000 to $34,999 | 734 (5.5%) | 688 (6.1%) |
| $35,000 to $39,999 | 766 (5.8%) | 797 (7.1%) |
| $40,000 to $44,999 | 755 (5.7%) | 635 (5.7%) |
| $45,000 to $49,999 | 747 (5.6%) | 614 (5.5%) |
| $50,000 to $54,999 | 666 (5.0%) | 495 (4.4%) |
| $55,000 to $64,999 | 1,223 (9.2%) | 899 (8.0%) |
| $65,000 to $74,999 | 1,113 (8.4%) | 556 (5.0%) |
| $75,000 to $99,999 | 1,286 (9.7%) | 545 (4.9%) |
| $100,000+ | 1,663 (12.5%) | 530 (4.7%) |
| Total | 13,308 (100.0%) | 11,183 (100.0%) |
Earnings by Sex by Educational Attainment in Kandiyohi County
Average earnings in Kandiyohi County are $51,800 for men and $35,604 for women, a difference of 31.3%. Men with an educational attainment of bachelor's degree enjoy the highest average annual earnings of $74,389, while those with less than high school education earn the least with $33,586. Women with an educational attainment of graduate degree earn the most with the average annual earnings of $67,938, while those with less than high school education have the smallest earnings of $22,600.
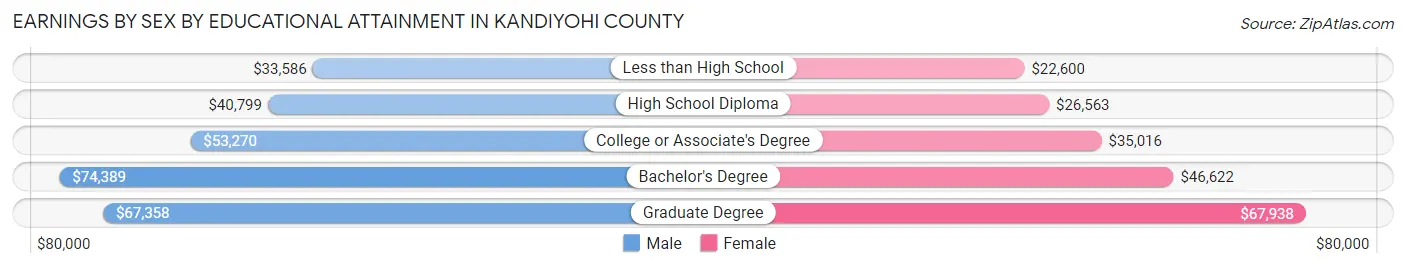
| Educational Attainment | Male Income | Female Income |
| Less than High School | $33,586 | $22,600 |
| High School Diploma | $40,799 | $26,563 |
| College or Associate's Degree | $53,270 | $35,016 |
| Bachelor's Degree | $74,389 | $46,622 |
| Graduate Degree | $67,358 | $67,938 |
| Total | $51,800 | $35,604 |
Family Income in Kandiyohi County
Family Income Brackets in Kandiyohi County
According to the Kandiyohi County family income data, there are 2,876 families falling into the $100,000 to $149,999 income range, which is the most common income bracket and makes up 24.9% of all families. Conversely, the $10,000 to $14,999 income bracket is the least frequent group with only 196 families (1.7%) belonging to this category.
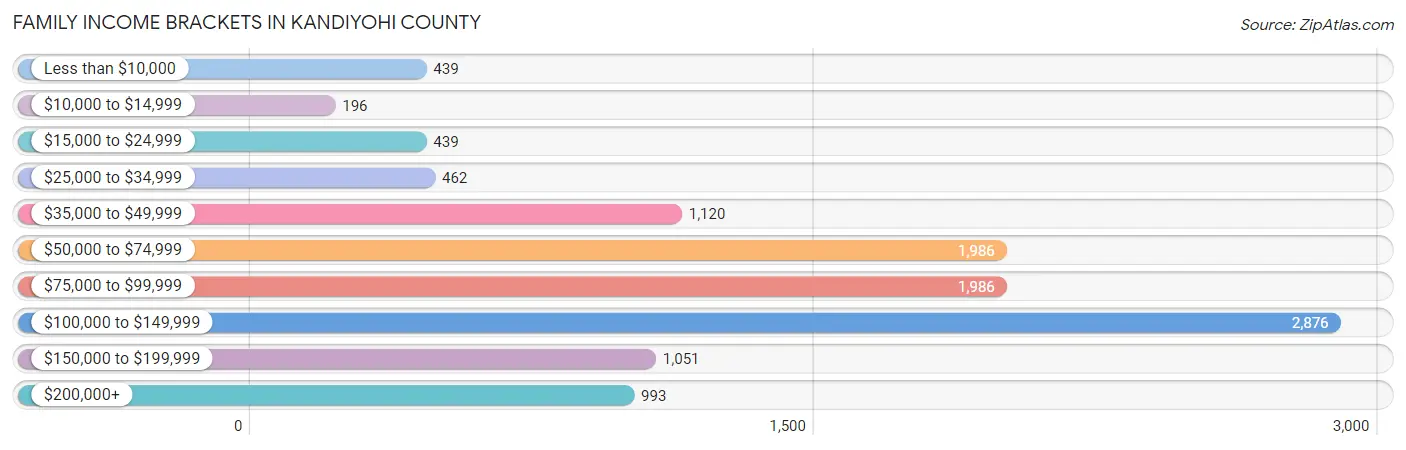
| Income Bracket | # Families | % Families |
| Less than $10,000 | 439 | 3.8% |
| $10,000 to $14,999 | 196 | 1.7% |
| $15,000 to $24,999 | 439 | 3.8% |
| $25,000 to $34,999 | 462 | 4.0% |
| $35,000 to $49,999 | 1,120 | 9.7% |
| $50,000 to $74,999 | 1,986 | 17.2% |
| $75,000 to $99,999 | 1,986 | 17.2% |
| $100,000 to $149,999 | 2,876 | 24.9% |
| $150,000 to $199,999 | 1,051 | 9.1% |
| $200,000+ | 993 | 8.6% |
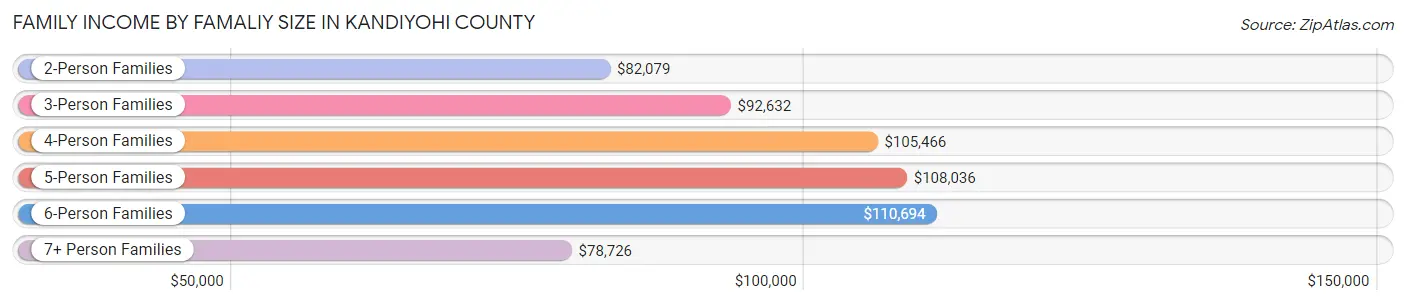
Family Income by Famaliy Size in Kandiyohi County
6-person families (417 | 3.6%) account for the highest median family income in Kandiyohi County with $110,694 per family, while 2-person families (6,472 | 56.0%) have the highest median income of $41,040 per family member.
| Income Bracket | # Families | Median Income |
| 2-Person Families | 6,472 (56.0%) | $82,079 |
| 3-Person Families | 1,674 (14.5%) | $92,632 |
| 4-Person Families | 1,801 (15.6%) | $105,466 |
| 5-Person Families | 958 (8.3%) | $108,036 |
| 6-Person Families | 417 (3.6%) | $110,694 |
| 7+ Person Families | 227 (2.0%) | $78,726 |
| Total | 11,549 (100.0%) | $89,539 |
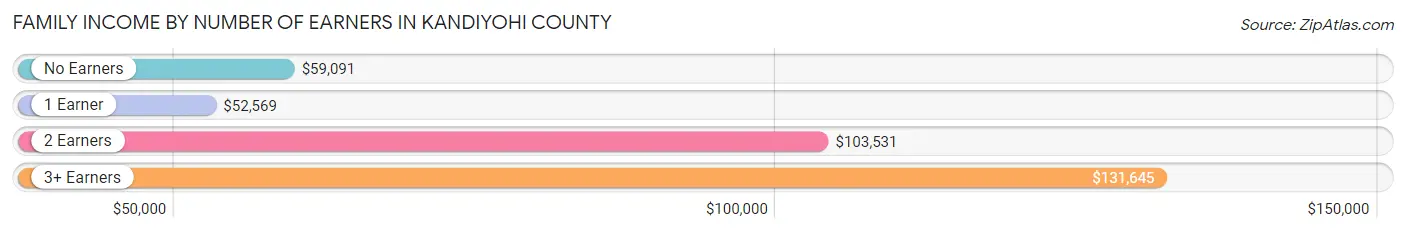
Family Income by Number of Earners in Kandiyohi County
The median family income in Kandiyohi County is $89,539, with families comprising 3+ earners (1,453) having the highest median family income of $131,645, while families with 1 earner (3,147) have the lowest median family income of $52,569, accounting for 12.6% and 27.3% of families, respectively.
| Number of Earners | # Families | Median Income |
| No Earners | 1,702 (14.7%) | $59,091 |
| 1 Earner | 3,147 (27.3%) | $52,569 |
| 2 Earners | 5,247 (45.4%) | $103,531 |
| 3+ Earners | 1,453 (12.6%) | $131,645 |
| Total | 11,549 (100.0%) | $89,539 |
Household Income in Kandiyohi County
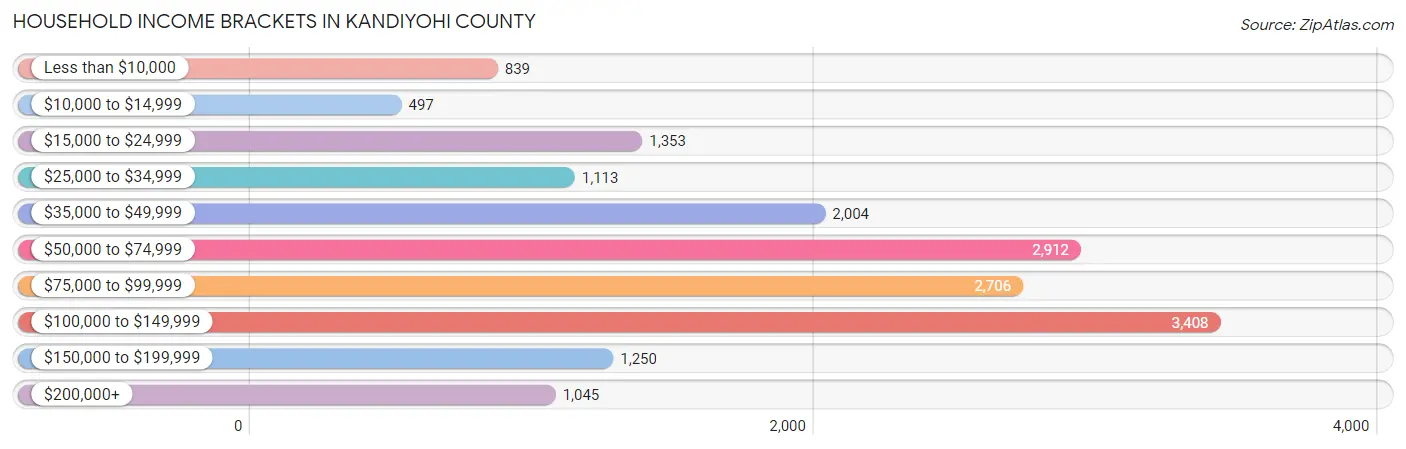
Household Income Brackets in Kandiyohi County
With 3,408 households falling in the category, the $100,000 to $149,999 income range is the most frequent in Kandiyohi County, accounting for 19.9% of all households. In contrast, only 497 households (2.9%) fall into the $10,000 to $14,999 income bracket, making it the least populous group.
| Income Bracket | # Households | % Households |
| Less than $10,000 | 839 | 4.9% |
| $10,000 to $14,999 | 497 | 2.9% |
| $15,000 to $24,999 | 1,353 | 7.9% |
| $25,000 to $34,999 | 1,113 | 6.5% |
| $35,000 to $49,999 | 2,004 | 11.7% |
| $50,000 to $74,999 | 2,912 | 17.0% |
| $75,000 to $99,999 | 2,706 | 15.8% |
| $100,000 to $149,999 | 3,408 | 19.9% |
| $150,000 to $199,999 | 1,250 | 7.3% |
| $200,000+ | 1,045 | 6.1% |
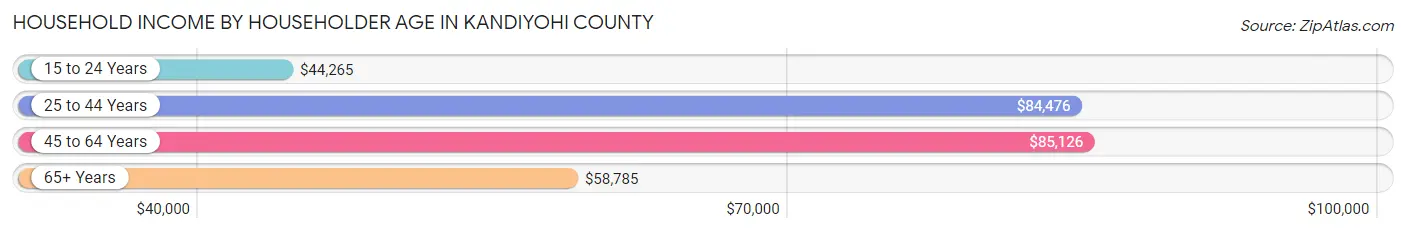
Household Income by Householder Age in Kandiyohi County
The median household income in Kandiyohi County is $73,285, with the highest median household income of $85,126 found in the 45 to 64 years age bracket for the primary householder. A total of 6,016 households (35.1%) fall into this category. Meanwhile, the 15 to 24 years age bracket for the primary householder has the lowest median household income of $44,265, with 950 households (5.6%) in this group.
| Income Bracket | # Households | Median Income |
| 15 to 24 Years | 950 (5.6%) | $44,265 |
| 25 to 44 Years | 4,907 (28.6%) | $84,476 |
| 45 to 64 Years | 6,016 (35.1%) | $85,126 |
| 65+ Years | 5,255 (30.7%) | $58,785 |
| Total | 17,128 (100.0%) | $73,285 |
Poverty in Kandiyohi County
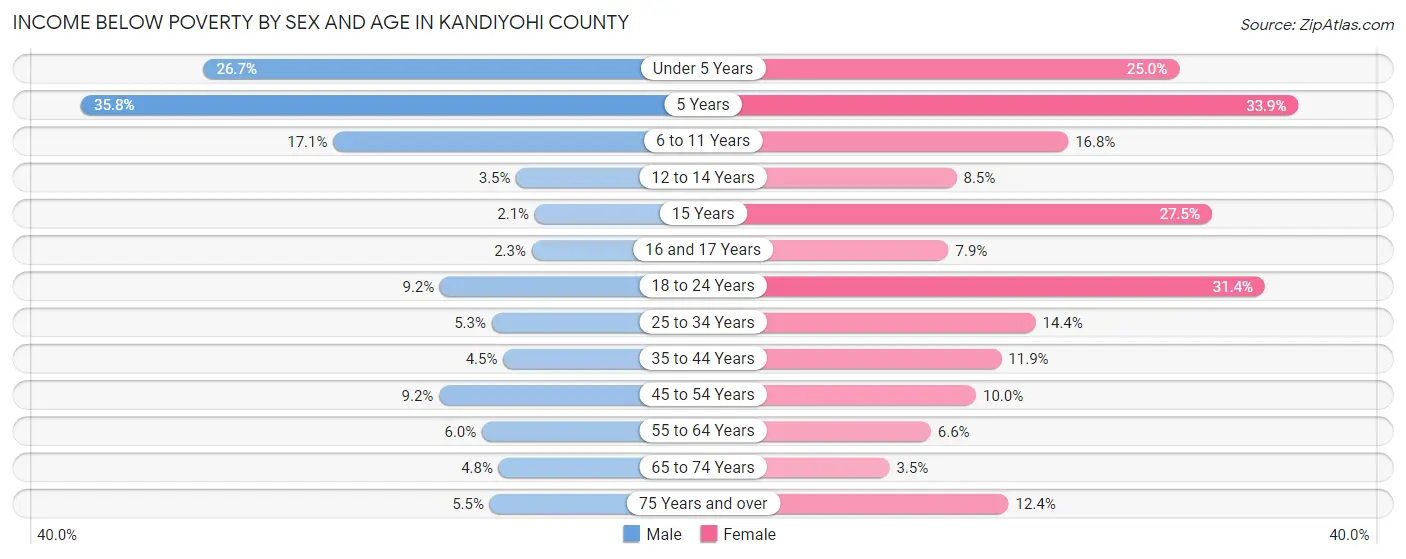
Income Below Poverty by Sex and Age in Kandiyohi County
With 8.5% poverty level for males and 13.4% for females among the residents of Kandiyohi County, 5 year old males and 5 year old females are the most vulnerable to poverty, with 87 males (35.8%) and 102 females (33.9%) in their respective age groups living below the poverty level.
| Age Bracket | Male | Female |
| Under 5 Years | 351 (26.7%) | 320 (25.0%) |
| 5 Years | 87 (35.8%) | 102 (33.9%) |
| 6 to 11 Years | 314 (17.1%) | 303 (16.8%) |
| 12 to 14 Years | 29 (3.5%) | 69 (8.5%) |
| 15 Years | 6 (2.1%) | 64 (27.5%) |
| 16 and 17 Years | 16 (2.3%) | 43 (7.9%) |
| 18 to 24 Years | 184 (9.1%) | 527 (31.4%) |
| 25 to 34 Years | 130 (5.3%) | 346 (14.4%) |
| 35 to 44 Years | 115 (4.5%) | 298 (11.8%) |
| 45 to 54 Years | 228 (9.2%) | 229 (10.0%) |
| 55 to 64 Years | 177 (6.0%) | 195 (6.6%) |
| 65 to 74 Years | 120 (4.8%) | 83 (3.5%) |
| 75 Years and over | 79 (5.5%) | 225 (12.4%) |
| Total | 1,836 (8.5%) | 2,804 (13.4%) |
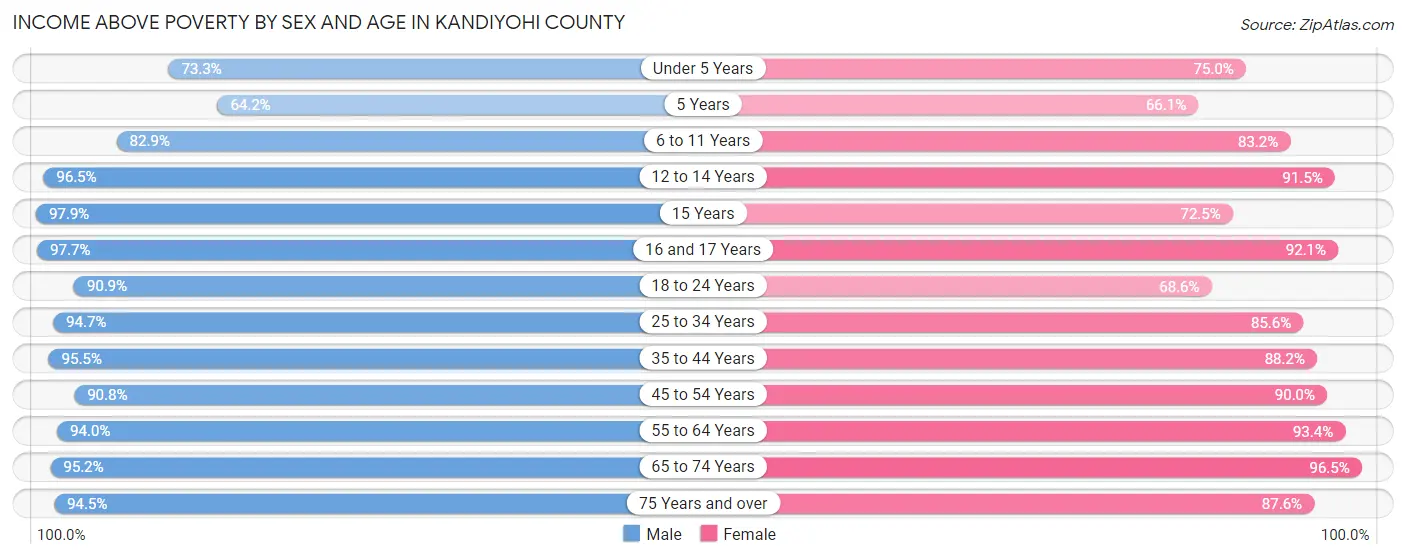
Income Above Poverty by Sex and Age in Kandiyohi County
According to the poverty statistics in Kandiyohi County, males aged 15 years and females aged 65 to 74 years are the age groups that are most secure financially, with 97.9% of males and 96.5% of females in these age groups living above the poverty line.
| Age Bracket | Male | Female |
| Under 5 Years | 963 (73.3%) | 958 (75.0%) |
| 5 Years | 156 (64.2%) | 199 (66.1%) |
| 6 to 11 Years | 1,524 (82.9%) | 1,500 (83.2%) |
| 12 to 14 Years | 802 (96.5%) | 741 (91.5%) |
| 15 Years | 278 (97.9%) | 169 (72.5%) |
| 16 and 17 Years | 667 (97.7%) | 499 (92.1%) |
| 18 to 24 Years | 1,828 (90.8%) | 1,151 (68.6%) |
| 25 to 34 Years | 2,320 (94.7%) | 2,058 (85.6%) |
| 35 to 44 Years | 2,465 (95.5%) | 2,217 (88.1%) |
| 45 to 54 Years | 2,245 (90.8%) | 2,067 (90.0%) |
| 55 to 64 Years | 2,759 (94.0%) | 2,754 (93.4%) |
| 65 to 74 Years | 2,384 (95.2%) | 2,262 (96.5%) |
| 75 Years and over | 1,369 (94.5%) | 1,592 (87.6%) |
| Total | 19,760 (91.5%) | 18,167 (86.6%) |
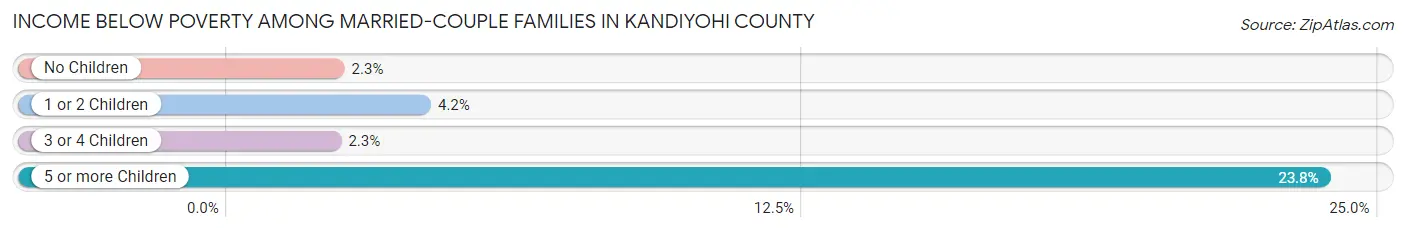
Income Below Poverty Among Married-Couple Families in Kandiyohi County
The poverty statistics for married-couple families in Kandiyohi County show that 3.0% or 282 of the total 9,242 families live below the poverty line. Families with 5 or more children have the highest poverty rate of 23.8%, comprising of 29 families. On the other hand, families with 3 or 4 children have the lowest poverty rate of 2.2%, which includes 22 families.
| Children | Above Poverty | Below Poverty |
| No Children | 5,769 (97.7%) | 137 (2.3%) |
| 1 or 2 Children | 2,142 (95.8%) | 94 (4.2%) |
| 3 or 4 Children | 956 (97.8%) | 22 (2.2%) |
| 5 or more Children | 93 (76.2%) | 29 (23.8%) |
| Total | 8,960 (97.0%) | 282 (3.0%) |
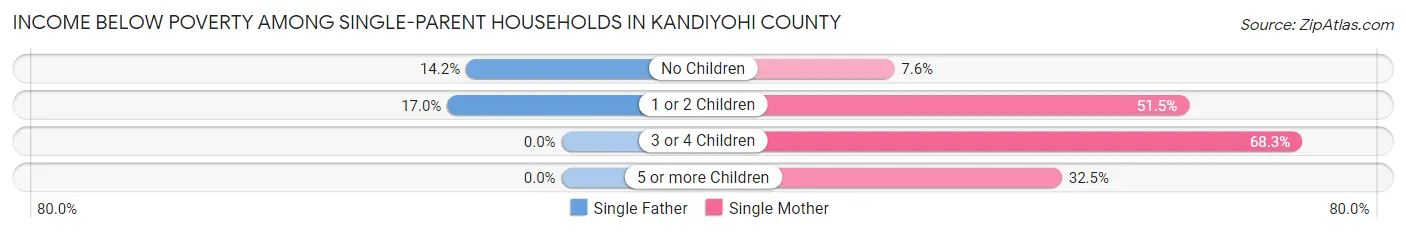
Income Below Poverty Among Single-Parent Households in Kandiyohi County
According to the poverty data in Kandiyohi County, 13.9% or 111 single-father households and 37.6% or 568 single-mother households are living below the poverty line. Among single-father households, those with 1 or 2 children have the highest poverty rate, with 71 households (17.0%) experiencing poverty. Likewise, among single-mother households, those with 3 or 4 children have the highest poverty rate, with 84 households (68.3%) falling below the poverty line.
| Children | Single Father | Single Mother |
| No Children | 40 (14.2%) | 37 (7.5%) |
| 1 or 2 Children | 71 (17.0%) | 421 (51.5%) |
| 3 or 4 Children | 0 (0.0%) | 84 (68.3%) |
| 5 or more Children | 0 (0.0%) | 26 (32.5%) |
| Total | 111 (13.9%) | 568 (37.6%) |
Income Below Poverty Among Married-Couple vs Single-Parent Households in Kandiyohi County
The poverty data for Kandiyohi County shows that 282 of the married-couple family households (3.0%) and 679 of the single-parent households (29.4%) are living below the poverty level. Within the married-couple family households, those with 5 or more children have the highest poverty rate, with 29 households (23.8%) falling below the poverty line. Among the single-parent households, those with 1 or 2 children have the highest poverty rate, with 492 household (39.8%) living below poverty.
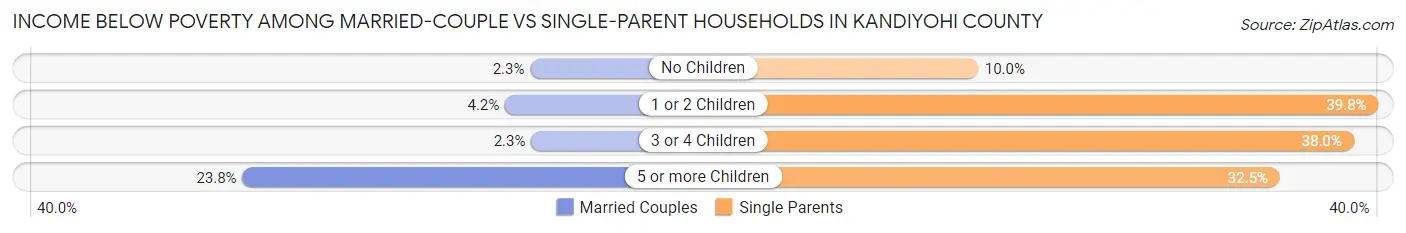
| Children | Married-Couple Families | Single-Parent Households |
| No Children | 137 (2.3%) | 77 (10.0%) |
| 1 or 2 Children | 94 (4.2%) | 492 (39.8%) |
| 3 or 4 Children | 22 (2.2%) | 84 (38.0%) |
| 5 or more Children | 29 (23.8%) | 26 (32.5%) |
| Total | 282 (3.0%) | 679 (29.4%) |
Employment Characteristics in Kandiyohi County
Employment by Class of Employer in Kandiyohi County
Among the 21,810 employed individuals in Kandiyohi County, private company employees (14,653 | 67.2%), not-for-profit organizations (1,902 | 8.7%), and local government employees (1,769 | 8.1%) make up the most common classes of employment.
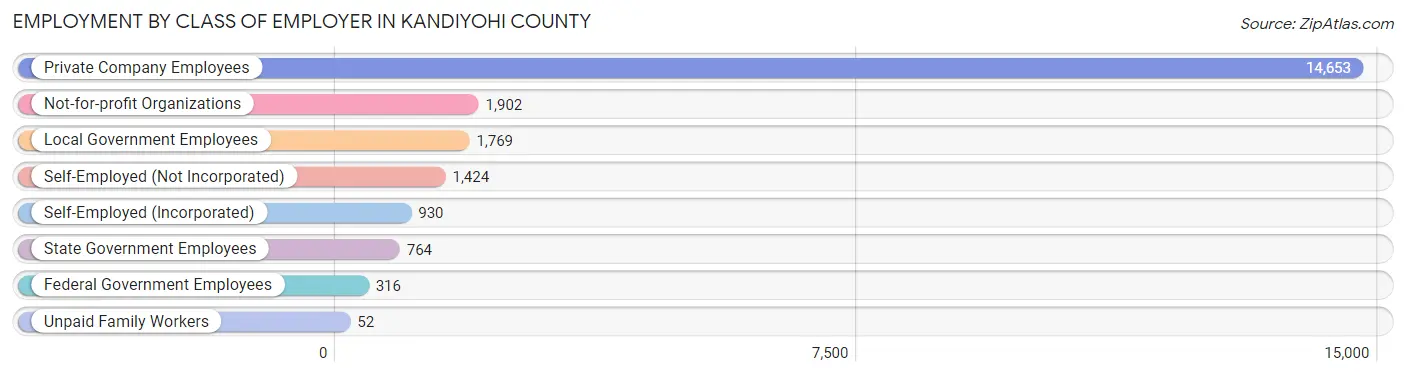
| Employer Class | # Employees | % Employees |
| Private Company Employees | 14,653 | 67.2% |
| Self-Employed (Incorporated) | 930 | 4.3% |
| Self-Employed (Not Incorporated) | 1,424 | 6.5% |
| Not-for-profit Organizations | 1,902 | 8.7% |
| Local Government Employees | 1,769 | 8.1% |
| State Government Employees | 764 | 3.5% |
| Federal Government Employees | 316 | 1.5% |
| Unpaid Family Workers | 52 | 0.2% |
| Total | 21,810 | 100.0% |
Employment Status by Age in Kandiyohi County
According to the labor force statistics for Kandiyohi County, out of the total population over 16 years of age (34,282), 67.4% or 23,106 individuals are in the labor force, with 3.8% or 878 of them unemployed. The age group with the highest labor force participation rate is 30 to 34 years, with 90.0% or 2,062 individuals in the labor force. Within the labor force, the 30 to 34 years age range has the highest percentage of unemployed individuals, with 7.4% or 153 of them being unemployed.
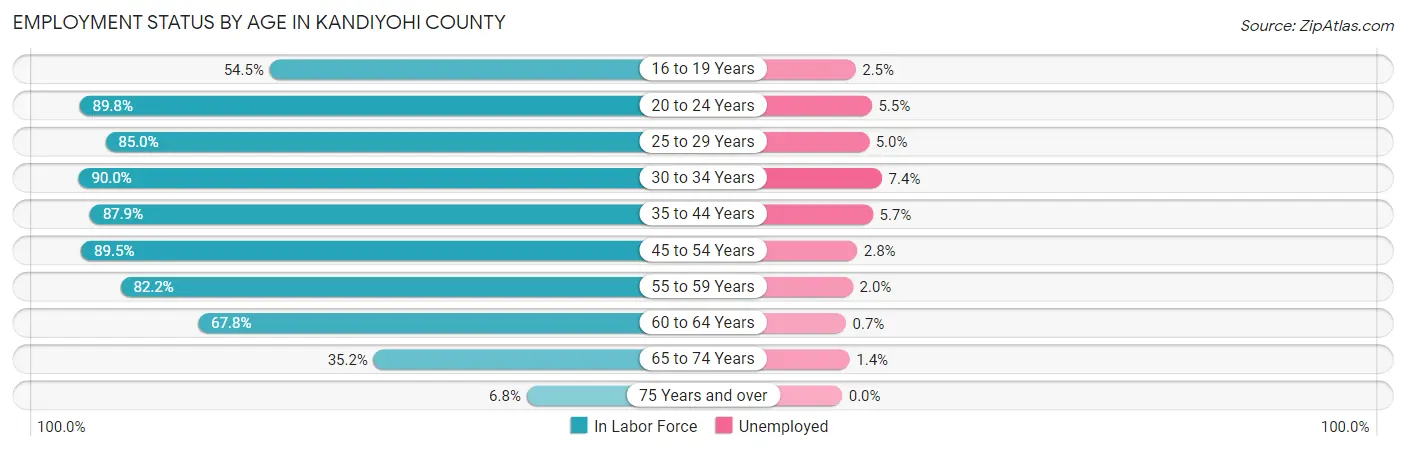
| Age Bracket | In Labor Force | Unemployed |
| 16 to 19 Years | 1,218 (54.5%) | 30 (2.5%) |
| 20 to 24 Years | 2,424 (89.8%) | 133 (5.5%) |
| 25 to 29 Years | 2,212 (85.0%) | 111 (5.0%) |
| 30 to 34 Years | 2,062 (90.0%) | 153 (7.4%) |
| 35 to 44 Years | 4,519 (87.9%) | 258 (5.7%) |
| 45 to 54 Years | 4,287 (89.5%) | 120 (2.8%) |
| 55 to 59 Years | 2,273 (82.2%) | 45 (2.0%) |
| 60 to 64 Years | 2,143 (67.8%) | 15 (0.7%) |
| 65 to 74 Years | 1,727 (35.2%) | 24 (1.4%) |
| 75 Years and over | 251 (6.8%) | 0 (0.0%) |
| Total | 23,106 (67.4%) | 878 (3.8%) |
Employment Status by Educational Attainment in Kandiyohi County
According to labor force statistics for Kandiyohi County, 84.3% of individuals (17,492) out of the total population between 25 and 64 years of age (20,750) are in the labor force, with 4.0% or 700 of them being unemployed. The group with the highest labor force participation rate are those with the educational attainment of bachelor's degree or higher, with 90.7% or 4,979 individuals in the labor force. Within the labor force, individuals with less than high school education have the highest percentage of unemployment, with 13.8% or 225 of them being unemployed.
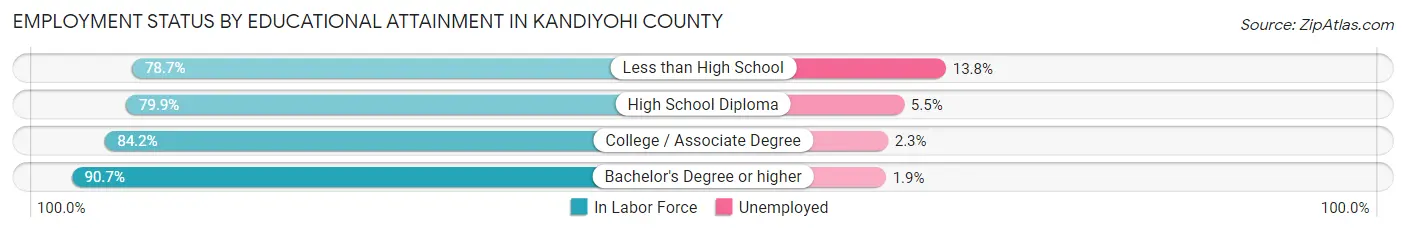
| Educational Attainment | In Labor Force | Unemployed |
| Less than High School | 1,634 (78.7%) | 286 (13.8%) |
| High School Diploma | 4,005 (79.9%) | 276 (5.5%) |
| College / Associate Degree | 6,880 (84.2%) | 188 (2.3%) |
| Bachelor's Degree or higher | 4,979 (90.7%) | 104 (1.9%) |
| Total | 17,492 (84.3%) | 830 (4.0%) |
Employment Occupations by Sex in Kandiyohi County
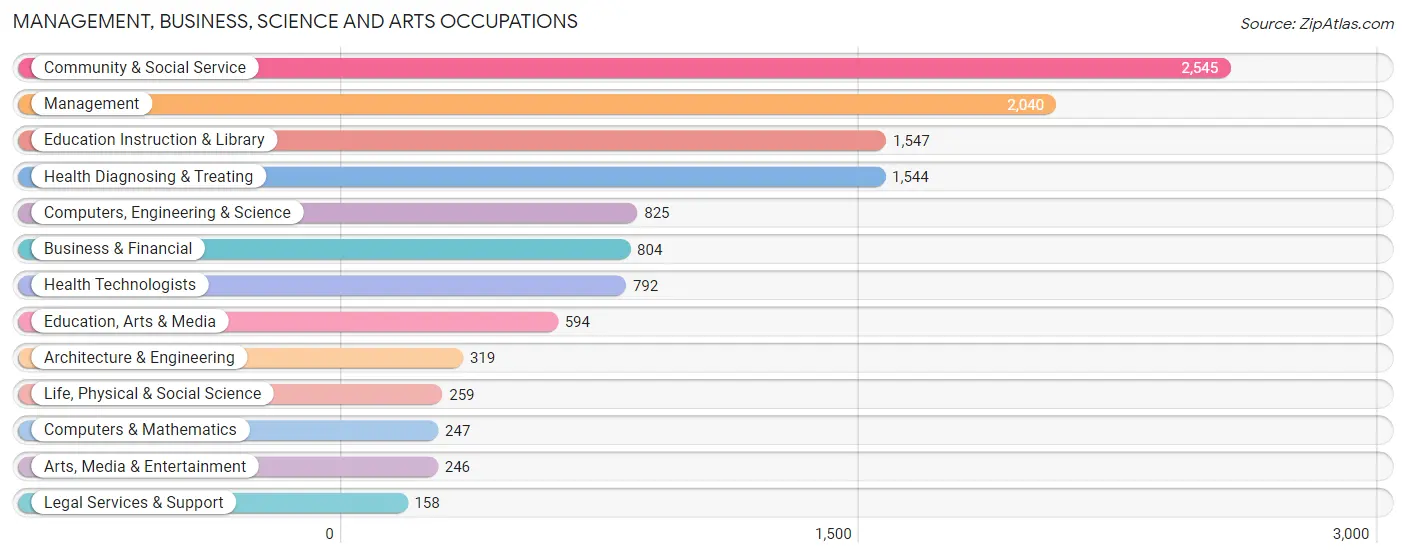
Management, Business, Science and Arts Occupations
The most common Management, Business, Science and Arts occupations in Kandiyohi County are Community & Social Service (2,545 | 11.5%), Management (2,040 | 9.2%), Education Instruction & Library (1,547 | 7.0%), Health Diagnosing & Treating (1,544 | 7.0%), and Computers, Engineering & Science (825 | 3.7%).
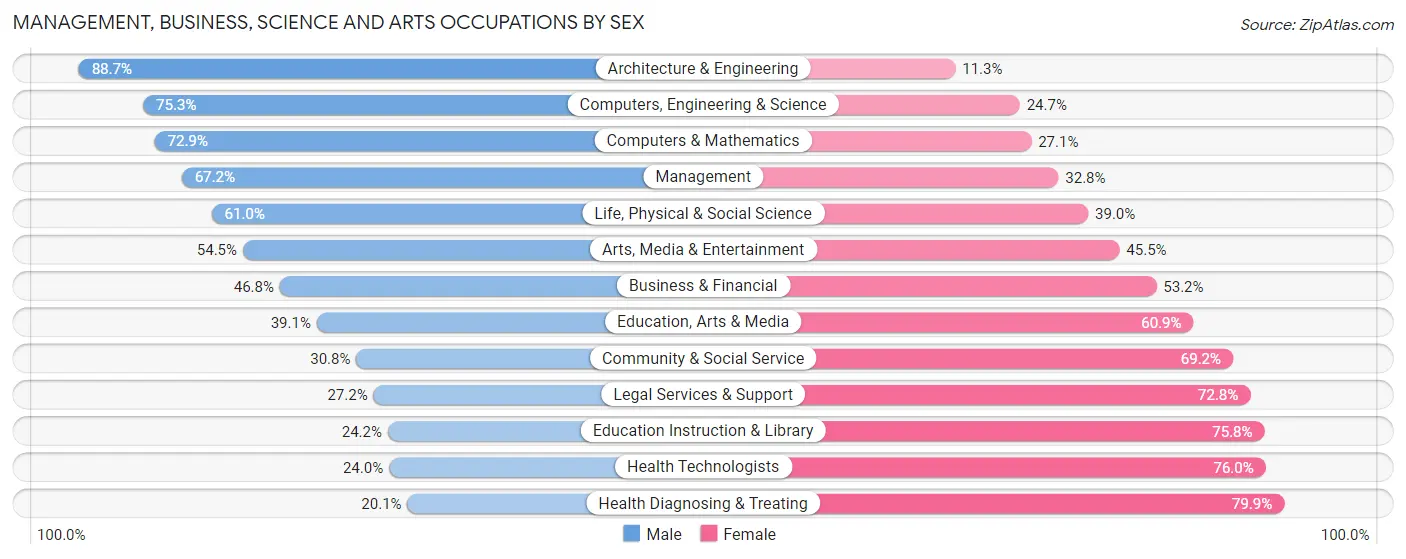
Management, Business, Science and Arts Occupations by Sex
Within the Management, Business, Science and Arts occupations in Kandiyohi County, the most male-oriented occupations are Architecture & Engineering (88.7%), Computers, Engineering & Science (75.3%), and Computers & Mathematics (72.9%), while the most female-oriented occupations are Health Diagnosing & Treating (79.9%), Health Technologists (76.0%), and Education Instruction & Library (75.8%).
| Occupation | Male | Female |
| Management | 1,371 (67.2%) | 669 (32.8%) |
| Business & Financial | 376 (46.8%) | 428 (53.2%) |
| Computers, Engineering & Science | 621 (75.3%) | 204 (24.7%) |
| Computers & Mathematics | 180 (72.9%) | 67 (27.1%) |
| Architecture & Engineering | 283 (88.7%) | 36 (11.3%) |
| Life, Physical & Social Science | 158 (61.0%) | 101 (39.0%) |
| Community & Social Service | 784 (30.8%) | 1,761 (69.2%) |
| Education, Arts & Media | 232 (39.1%) | 362 (60.9%) |
| Legal Services & Support | 43 (27.2%) | 115 (72.8%) |
| Education Instruction & Library | 375 (24.2%) | 1,172 (75.8%) |
| Arts, Media & Entertainment | 134 (54.5%) | 112 (45.5%) |
| Health Diagnosing & Treating | 311 (20.1%) | 1,233 (79.9%) |
| Health Technologists | 190 (24.0%) | 602 (76.0%) |
| Total (Category) | 3,463 (44.6%) | 4,295 (55.4%) |
| Total (Overall) | 12,016 (54.1%) | 10,205 (45.9%) |
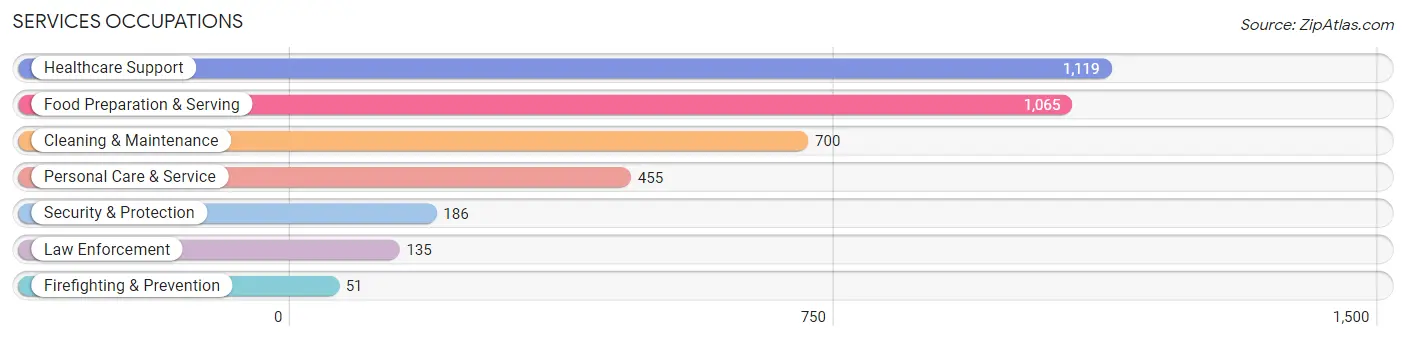
Services Occupations
The most common Services occupations in Kandiyohi County are Healthcare Support (1,119 | 5.0%), Food Preparation & Serving (1,065 | 4.8%), Cleaning & Maintenance (700 | 3.2%), Personal Care & Service (455 | 2.1%), and Security & Protection (186 | 0.8%).
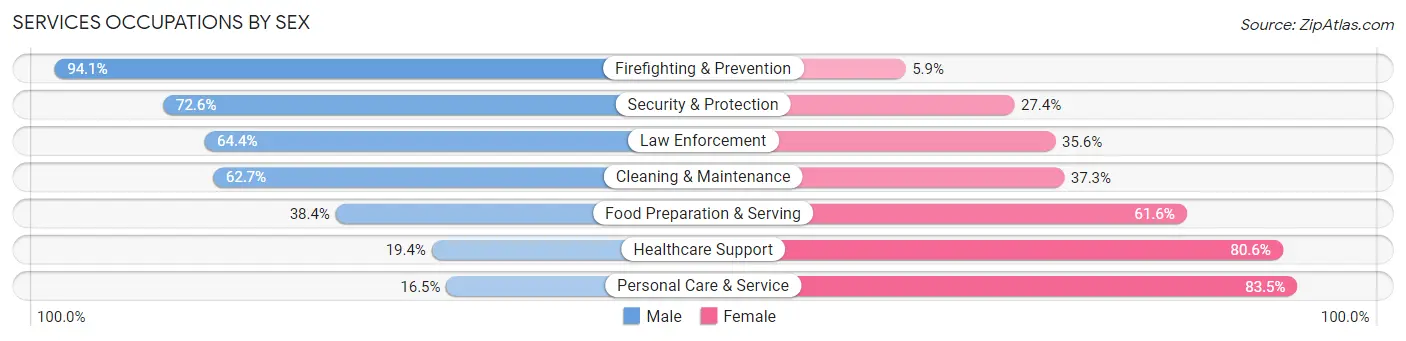
Services Occupations by Sex
Within the Services occupations in Kandiyohi County, the most male-oriented occupations are Firefighting & Prevention (94.1%), Security & Protection (72.6%), and Law Enforcement (64.4%), while the most female-oriented occupations are Personal Care & Service (83.5%), Healthcare Support (80.6%), and Food Preparation & Serving (61.6%).
| Occupation | Male | Female |
| Healthcare Support | 217 (19.4%) | 902 (80.6%) |
| Security & Protection | 135 (72.6%) | 51 (27.4%) |
| Firefighting & Prevention | 48 (94.1%) | 3 (5.9%) |
| Law Enforcement | 87 (64.4%) | 48 (35.6%) |
| Food Preparation & Serving | 409 (38.4%) | 656 (61.6%) |
| Cleaning & Maintenance | 439 (62.7%) | 261 (37.3%) |
| Personal Care & Service | 75 (16.5%) | 380 (83.5%) |
| Total (Category) | 1,275 (36.2%) | 2,250 (63.8%) |
| Total (Overall) | 12,016 (54.1%) | 10,205 (45.9%) |
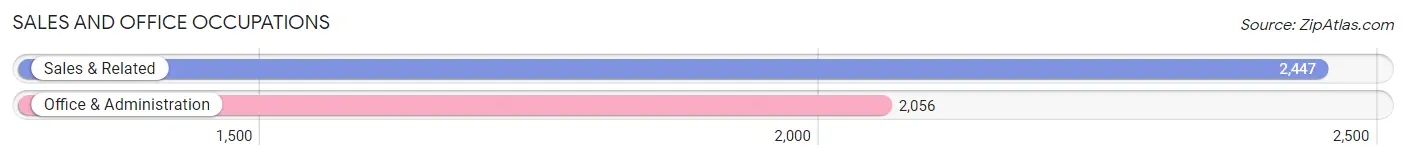
Sales and Office Occupations
The most common Sales and Office occupations in Kandiyohi County are Sales & Related (2,447 | 11.0%), and Office & Administration (2,056 | 9.2%).
Sales and Office Occupations by Sex
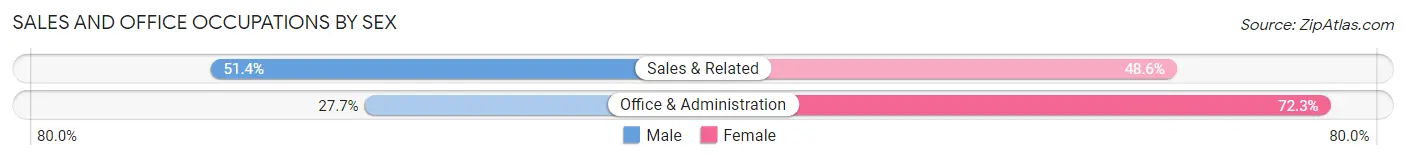
| Occupation | Male | Female |
| Sales & Related | 1,257 (51.4%) | 1,190 (48.6%) |
| Office & Administration | 570 (27.7%) | 1,486 (72.3%) |
| Total (Category) | 1,827 (40.6%) | 2,676 (59.4%) |
| Total (Overall) | 12,016 (54.1%) | 10,205 (45.9%) |
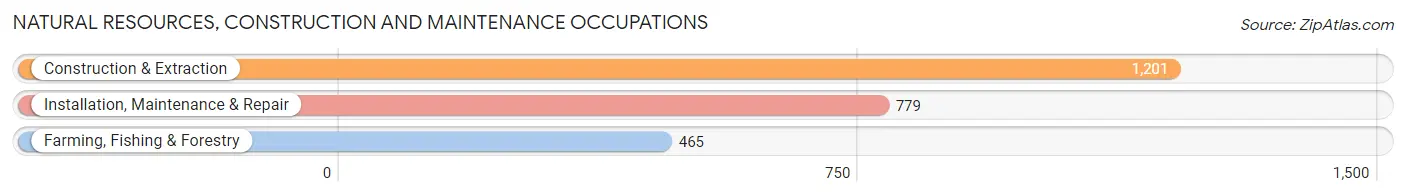
Natural Resources, Construction and Maintenance Occupations
The most common Natural Resources, Construction and Maintenance occupations in Kandiyohi County are Construction & Extraction (1,201 | 5.4%), Installation, Maintenance & Repair (779 | 3.5%), and Farming, Fishing & Forestry (465 | 2.1%).
Natural Resources, Construction and Maintenance Occupations by Sex
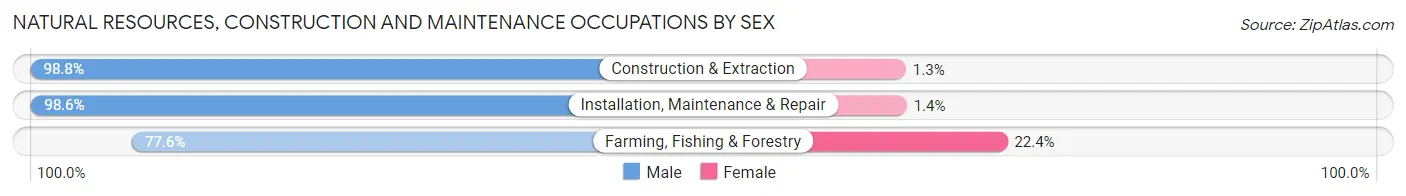
| Occupation | Male | Female |
| Farming, Fishing & Forestry | 361 (77.6%) | 104 (22.4%) |
| Construction & Extraction | 1,186 (98.8%) | 15 (1.3%) |
| Installation, Maintenance & Repair | 768 (98.6%) | 11 (1.4%) |
| Total (Category) | 2,315 (94.7%) | 130 (5.3%) |
| Total (Overall) | 12,016 (54.1%) | 10,205 (45.9%) |
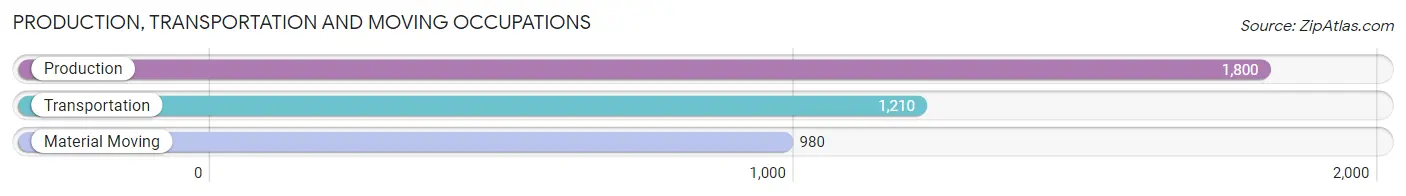
Production, Transportation and Moving Occupations
The most common Production, Transportation and Moving occupations in Kandiyohi County are Production (1,800 | 8.1%), Transportation (1,210 | 5.4%), and Material Moving (980 | 4.4%).
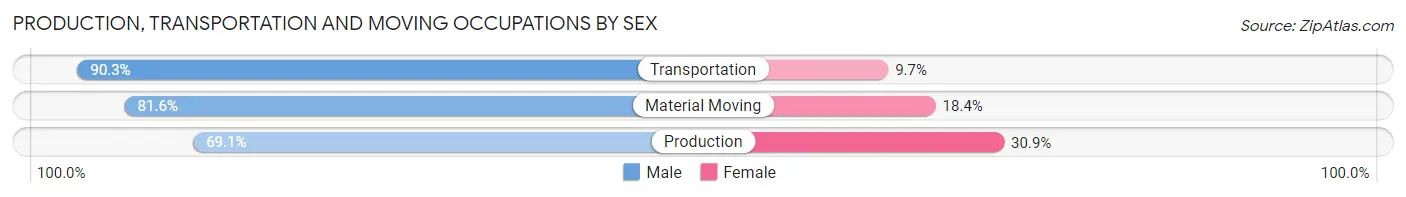
Production, Transportation and Moving Occupations by Sex
| Occupation | Male | Female |
| Production | 1,243 (69.1%) | 557 (30.9%) |
| Transportation | 1,093 (90.3%) | 117 (9.7%) |
| Material Moving | 800 (81.6%) | 180 (18.4%) |
| Total (Category) | 3,136 (78.6%) | 854 (21.4%) |
| Total (Overall) | 12,016 (54.1%) | 10,205 (45.9%) |
Employment Industries by Sex in Kandiyohi County
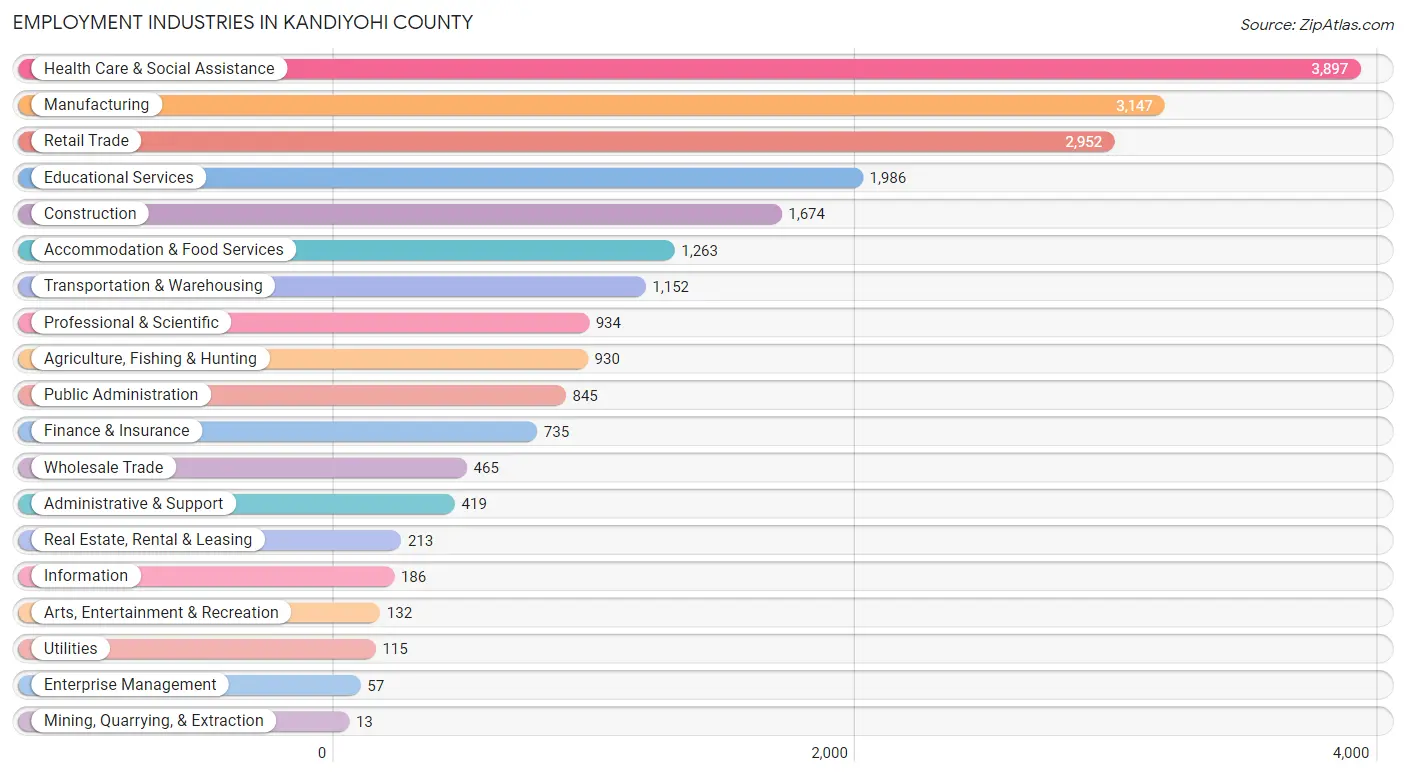
Employment Industries in Kandiyohi County
The major employment industries in Kandiyohi County include Health Care & Social Assistance (3,897 | 17.5%), Manufacturing (3,147 | 14.2%), Retail Trade (2,952 | 13.3%), Educational Services (1,986 | 8.9%), and Construction (1,674 | 7.5%).
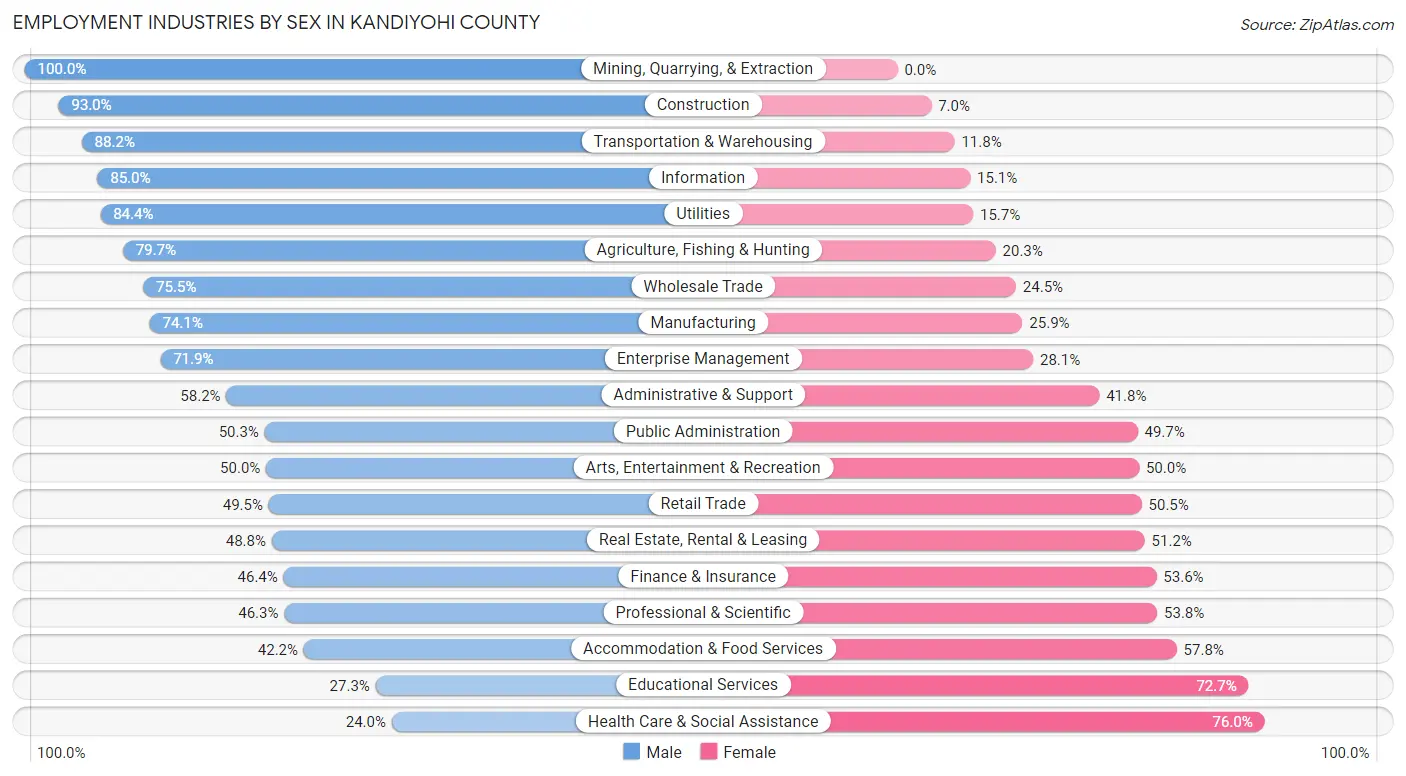
Employment Industries by Sex in Kandiyohi County
The Kandiyohi County industries that see more men than women are Mining, Quarrying, & Extraction (100.0%), Construction (93.0%), and Transportation & Warehousing (88.2%), whereas the industries that tend to have a higher number of women are Health Care & Social Assistance (76.0%), Educational Services (72.7%), and Accommodation & Food Services (57.8%).
| Industry | Male | Female |
| Agriculture, Fishing & Hunting | 741 (79.7%) | 189 (20.3%) |
| Mining, Quarrying, & Extraction | 13 (100.0%) | 0 (0.0%) |
| Construction | 1,557 (93.0%) | 117 (7.0%) |
| Manufacturing | 2,333 (74.1%) | 814 (25.9%) |
| Wholesale Trade | 351 (75.5%) | 114 (24.5%) |
| Retail Trade | 1,460 (49.5%) | 1,492 (50.5%) |
| Transportation & Warehousing | 1,016 (88.2%) | 136 (11.8%) |
| Utilities | 97 (84.4%) | 18 (15.7%) |
| Information | 158 (85.0%) | 28 (15.0%) |
| Finance & Insurance | 341 (46.4%) | 394 (53.6%) |
| Real Estate, Rental & Leasing | 104 (48.8%) | 109 (51.2%) |
| Professional & Scientific | 432 (46.3%) | 502 (53.7%) |
| Enterprise Management | 41 (71.9%) | 16 (28.1%) |
| Administrative & Support | 244 (58.2%) | 175 (41.8%) |
| Educational Services | 543 (27.3%) | 1,443 (72.7%) |
| Health Care & Social Assistance | 935 (24.0%) | 2,962 (76.0%) |
| Arts, Entertainment & Recreation | 66 (50.0%) | 66 (50.0%) |
| Accommodation & Food Services | 533 (42.2%) | 730 (57.8%) |
| Public Administration | 425 (50.3%) | 420 (49.7%) |
| Total | 12,016 (54.1%) | 10,205 (45.9%) |
Education in Kandiyohi County
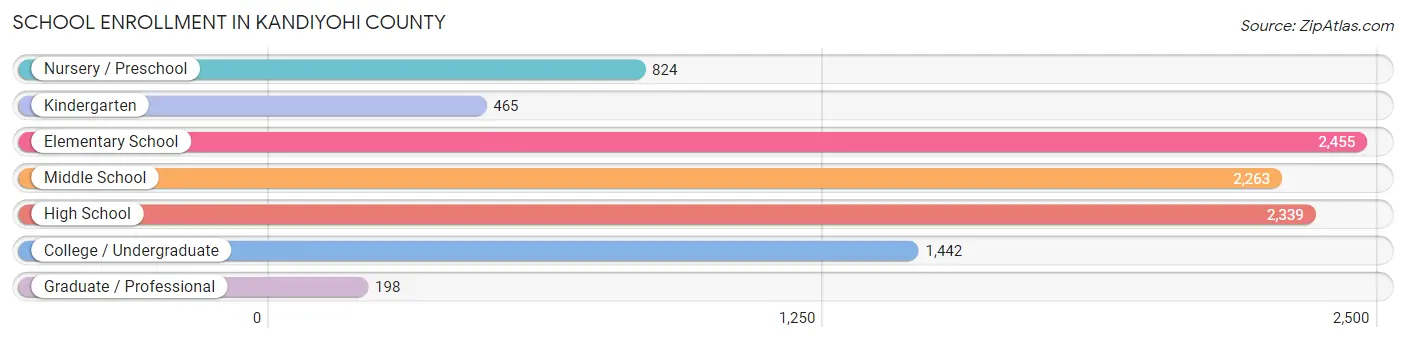
School Enrollment in Kandiyohi County
The most common levels of schooling among the 9,986 students in Kandiyohi County are elementary school (2,455 | 24.6%), high school (2,339 | 23.4%), and middle school (2,263 | 22.7%).
| School Level | # Students | % Students |
| Nursery / Preschool | 824 | 8.3% |
| Kindergarten | 465 | 4.7% |
| Elementary School | 2,455 | 24.6% |
| Middle School | 2,263 | 22.7% |
| High School | 2,339 | 23.4% |
| College / Undergraduate | 1,442 | 14.4% |
| Graduate / Professional | 198 | 2.0% |
| Total | 9,986 | 100.0% |
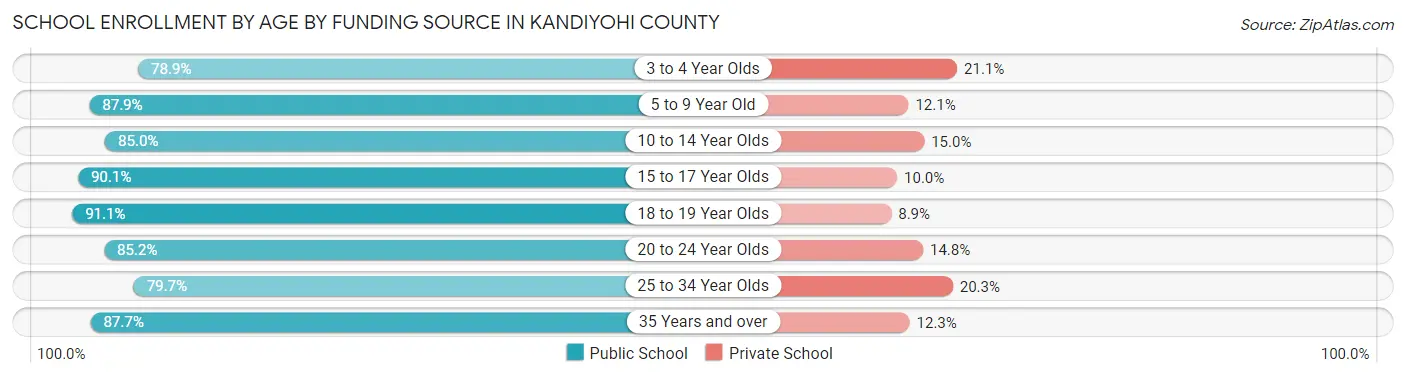
School Enrollment by Age by Funding Source in Kandiyohi County
Out of a total of 9,986 students who are enrolled in schools in Kandiyohi County, 1,338 (13.4%) attend a private institution, while the remaining 8,648 (86.6%) are enrolled in public schools. The age group of 3 to 4 year olds has the highest likelihood of being enrolled in private schools, with 108 (21.1% in the age bracket) enrolled. Conversely, the age group of 18 to 19 year olds has the lowest likelihood of being enrolled in a private school, with 514 (91.1% in the age bracket) attending a public institution.
| Age Bracket | Public School | Private School |
| 3 to 4 Year Olds | 403 (78.9%) | 108 (21.1%) |
| 5 to 9 Year Old | 2,352 (87.9%) | 323 (12.1%) |
| 10 to 14 Year Olds | 2,615 (85.0%) | 462 (15.0%) |
| 15 to 17 Year Olds | 1,548 (90.0%) | 171 (10.0%) |
| 18 to 19 Year Olds | 514 (91.1%) | 50 (8.9%) |
| 20 to 24 Year Olds | 628 (85.2%) | 109 (14.8%) |
| 25 to 34 Year Olds | 294 (79.7%) | 75 (20.3%) |
| 35 Years and over | 293 (87.7%) | 41 (12.3%) |
| Total | 8,648 (86.6%) | 1,338 (13.4%) |
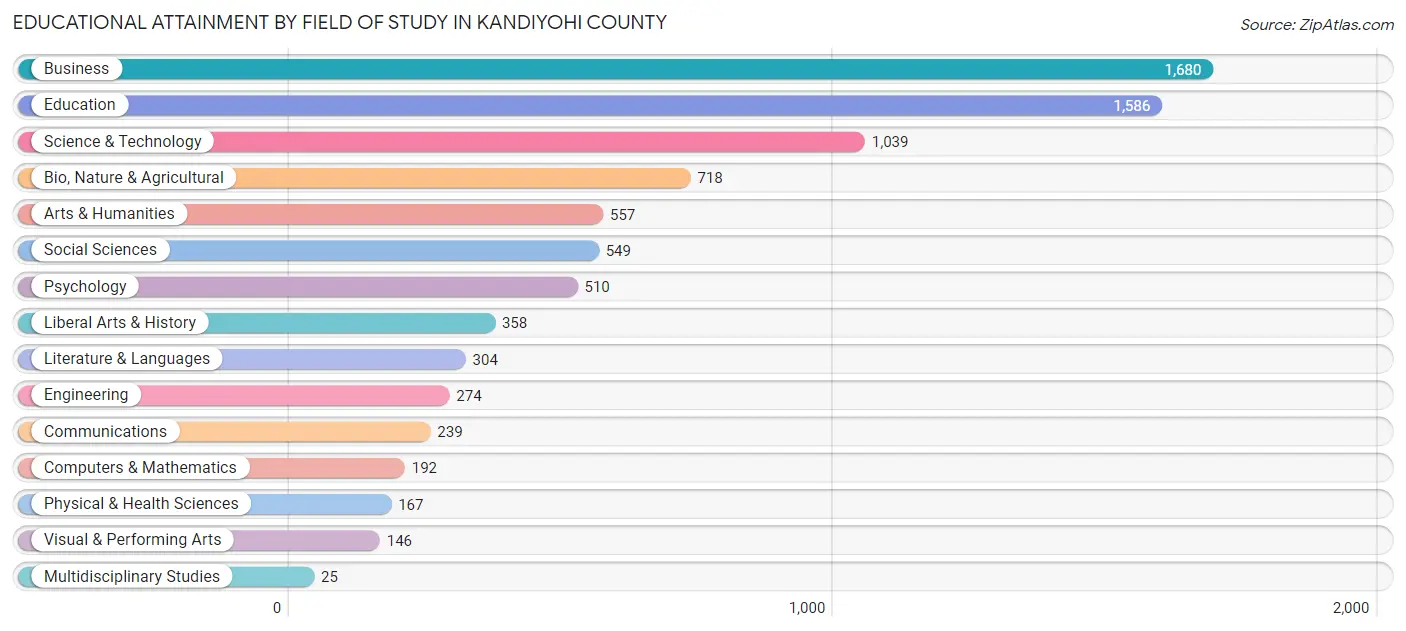
Educational Attainment by Field of Study in Kandiyohi County
Business (1,680 | 20.1%), education (1,586 | 19.0%), science & technology (1,039 | 12.4%), bio, nature & agricultural (718 | 8.6%), and arts & humanities (557 | 6.7%) are the most common fields of study among 8,344 individuals in Kandiyohi County who have obtained a bachelor's degree or higher.
| Field of Study | # Graduates | % Graduates |
| Computers & Mathematics | 192 | 2.3% |
| Bio, Nature & Agricultural | 718 | 8.6% |
| Physical & Health Sciences | 167 | 2.0% |
| Psychology | 510 | 6.1% |
| Social Sciences | 549 | 6.6% |
| Engineering | 274 | 3.3% |
| Multidisciplinary Studies | 25 | 0.3% |
| Science & Technology | 1,039 | 12.4% |
| Business | 1,680 | 20.1% |
| Education | 1,586 | 19.0% |
| Literature & Languages | 304 | 3.6% |
| Liberal Arts & History | 358 | 4.3% |
| Visual & Performing Arts | 146 | 1.8% |
| Communications | 239 | 2.9% |
| Arts & Humanities | 557 | 6.7% |
| Total | 8,344 | 100.0% |
Transportation & Commute in Kandiyohi County
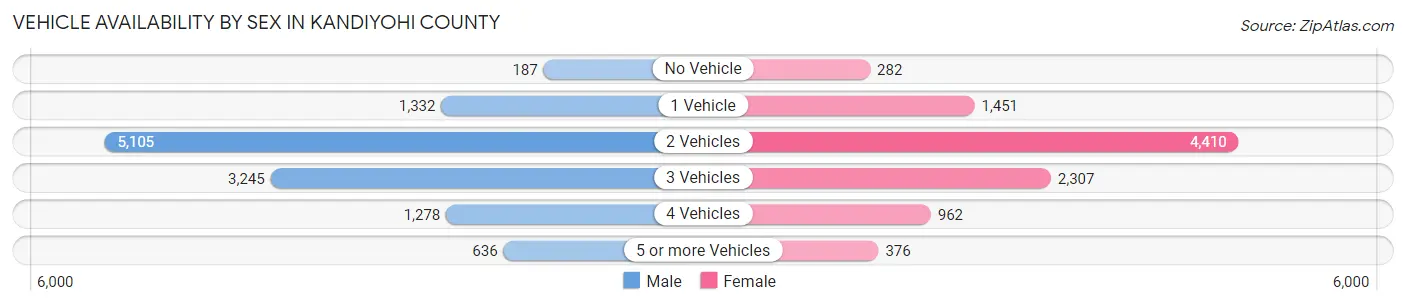
Vehicle Availability by Sex in Kandiyohi County
The most prevalent vehicle ownership categories in Kandiyohi County are males with 2 vehicles (5,105, accounting for 43.3%) and females with 2 vehicles (4,410, making up 52.2%).
| Vehicles Available | Male | Female |
| No Vehicle | 187 (1.6%) | 282 (2.9%) |
| 1 Vehicle | 1,332 (11.3%) | 1,451 (14.8%) |
| 2 Vehicles | 5,105 (43.3%) | 4,410 (45.1%) |
| 3 Vehicles | 3,245 (27.5%) | 2,307 (23.6%) |
| 4 Vehicles | 1,278 (10.8%) | 962 (9.8%) |
| 5 or more Vehicles | 636 (5.4%) | 376 (3.8%) |
| Total | 11,783 (100.0%) | 9,788 (100.0%) |
Commute Time in Kandiyohi County
The most frequently occuring commute durations in Kandiyohi County are 5 to 9 minutes (5,047 commuters, 25.0%), 10 to 14 minutes (4,372 commuters, 21.7%), and 15 to 19 minutes (3,078 commuters, 15.3%).
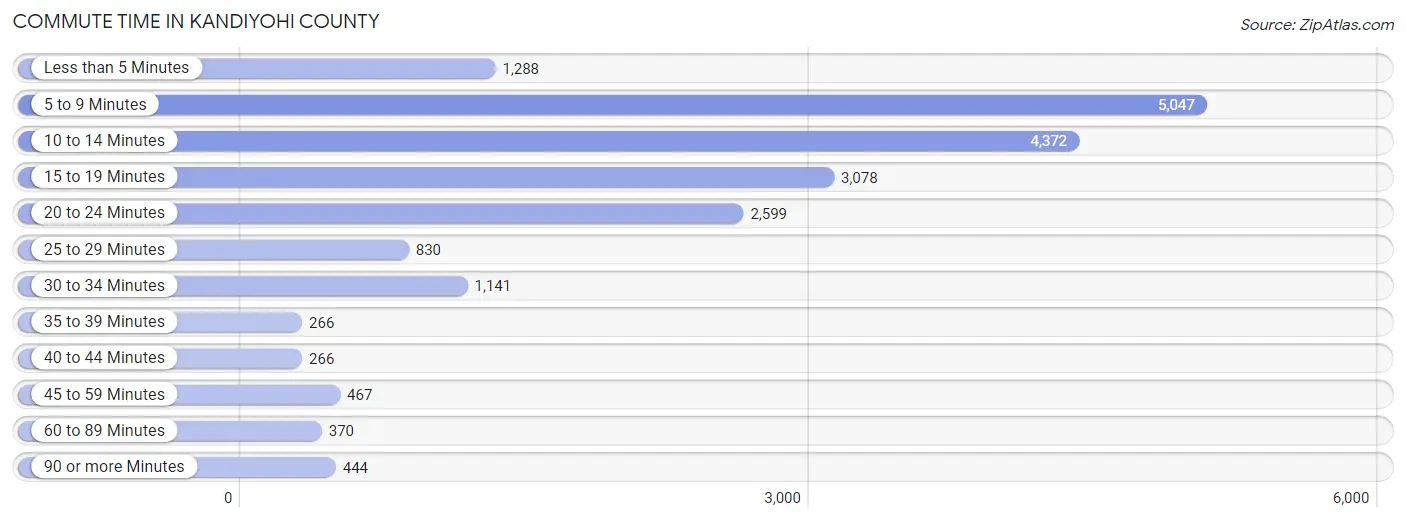
| Commute Time | # Commuters | % Commuters |
| Less than 5 Minutes | 1,288 | 6.4% |
| 5 to 9 Minutes | 5,047 | 25.0% |
| 10 to 14 Minutes | 4,372 | 21.7% |
| 15 to 19 Minutes | 3,078 | 15.3% |
| 20 to 24 Minutes | 2,599 | 12.9% |
| 25 to 29 Minutes | 830 | 4.1% |
| 30 to 34 Minutes | 1,141 | 5.7% |
| 35 to 39 Minutes | 266 | 1.3% |
| 40 to 44 Minutes | 266 | 1.3% |
| 45 to 59 Minutes | 467 | 2.3% |
| 60 to 89 Minutes | 370 | 1.8% |
| 90 or more Minutes | 444 | 2.2% |
Commute Time by Sex in Kandiyohi County
The most common commute times in Kandiyohi County are 5 to 9 minutes (3,106 commuters, 28.1%) for males and 10 to 14 minutes (2,238 commuters, 24.6%) for females.
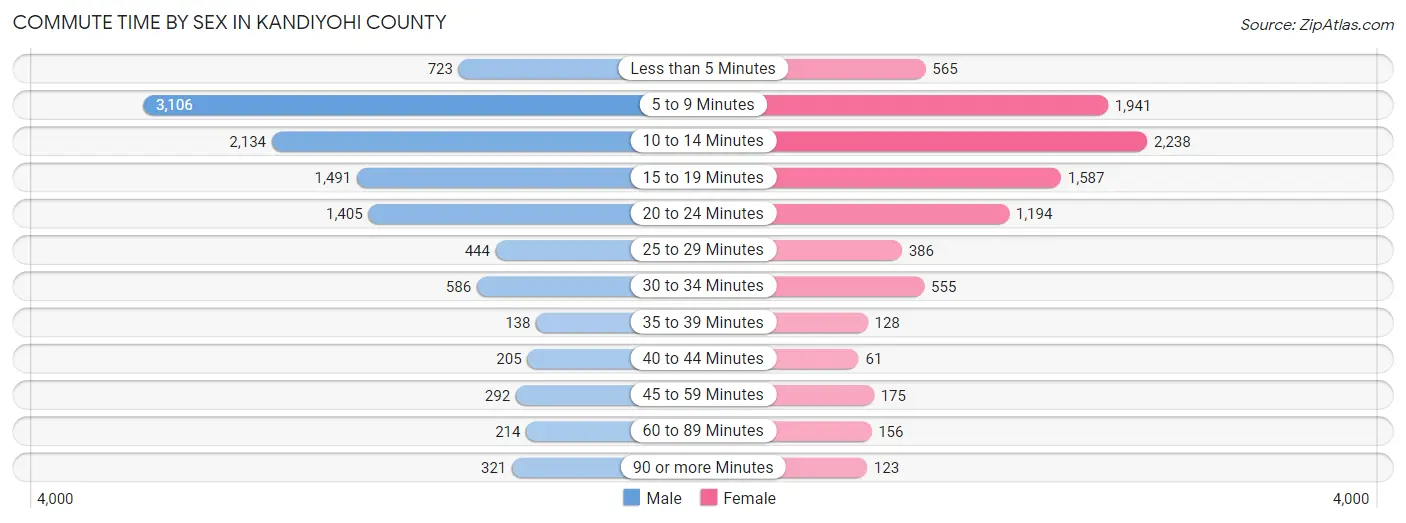
| Commute Time | Male | Female |
| Less than 5 Minutes | 723 (6.5%) | 565 (6.2%) |
| 5 to 9 Minutes | 3,106 (28.1%) | 1,941 (21.3%) |
| 10 to 14 Minutes | 2,134 (19.3%) | 2,238 (24.6%) |
| 15 to 19 Minutes | 1,491 (13.5%) | 1,587 (17.4%) |
| 20 to 24 Minutes | 1,405 (12.7%) | 1,194 (13.1%) |
| 25 to 29 Minutes | 444 (4.0%) | 386 (4.2%) |
| 30 to 34 Minutes | 586 (5.3%) | 555 (6.1%) |
| 35 to 39 Minutes | 138 (1.3%) | 128 (1.4%) |
| 40 to 44 Minutes | 205 (1.8%) | 61 (0.7%) |
| 45 to 59 Minutes | 292 (2.6%) | 175 (1.9%) |
| 60 to 89 Minutes | 214 (1.9%) | 156 (1.7%) |
| 90 or more Minutes | 321 (2.9%) | 123 (1.3%) |
Time of Departure to Work by Sex in Kandiyohi County
The most frequent times of departure to work in Kandiyohi County are 7:00 AM to 7:29 AM (1,849, 16.7%) for males and 7:30 AM to 7:59 AM (1,904, 20.9%) for females.
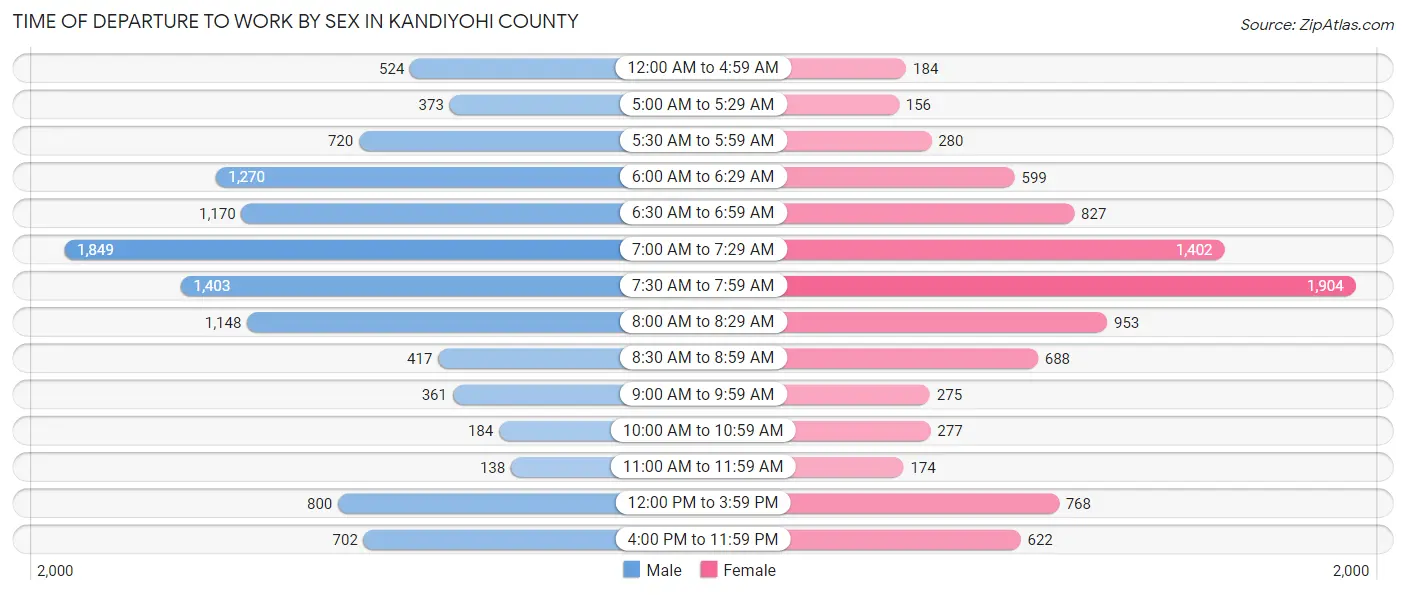
| Time of Departure | Male | Female |
| 12:00 AM to 4:59 AM | 524 (4.7%) | 184 (2.0%) |
| 5:00 AM to 5:29 AM | 373 (3.4%) | 156 (1.7%) |
| 5:30 AM to 5:59 AM | 720 (6.5%) | 280 (3.1%) |
| 6:00 AM to 6:29 AM | 1,270 (11.5%) | 599 (6.6%) |
| 6:30 AM to 6:59 AM | 1,170 (10.6%) | 827 (9.1%) |
| 7:00 AM to 7:29 AM | 1,849 (16.7%) | 1,402 (15.4%) |
| 7:30 AM to 7:59 AM | 1,403 (12.7%) | 1,904 (20.9%) |
| 8:00 AM to 8:29 AM | 1,148 (10.4%) | 953 (10.5%) |
| 8:30 AM to 8:59 AM | 417 (3.8%) | 688 (7.5%) |
| 9:00 AM to 9:59 AM | 361 (3.3%) | 275 (3.0%) |
| 10:00 AM to 10:59 AM | 184 (1.7%) | 277 (3.0%) |
| 11:00 AM to 11:59 AM | 138 (1.3%) | 174 (1.9%) |
| 12:00 PM to 3:59 PM | 800 (7.2%) | 768 (8.4%) |
| 4:00 PM to 11:59 PM | 702 (6.4%) | 622 (6.8%) |
| Total | 11,059 (100.0%) | 9,109 (100.0%) |
Housing Occupancy in Kandiyohi County
Occupancy by Ownership in Kandiyohi County
Of the total 17,128 dwellings in Kandiyohi County, owner-occupied units account for 12,660 (73.9%), while renter-occupied units make up 4,468 (26.1%).
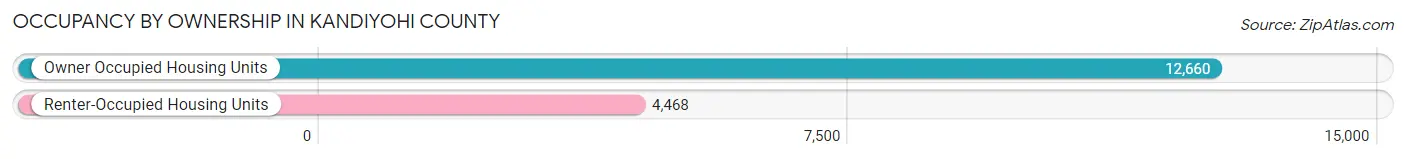
| Occupancy | # Housing Units | % Housing Units |
| Owner Occupied Housing Units | 12,660 | 73.9% |
| Renter-Occupied Housing Units | 4,468 | 26.1% |
| Total Occupied Housing Units | 17,128 | 100.0% |
Occupancy by Household Size in Kandiyohi County
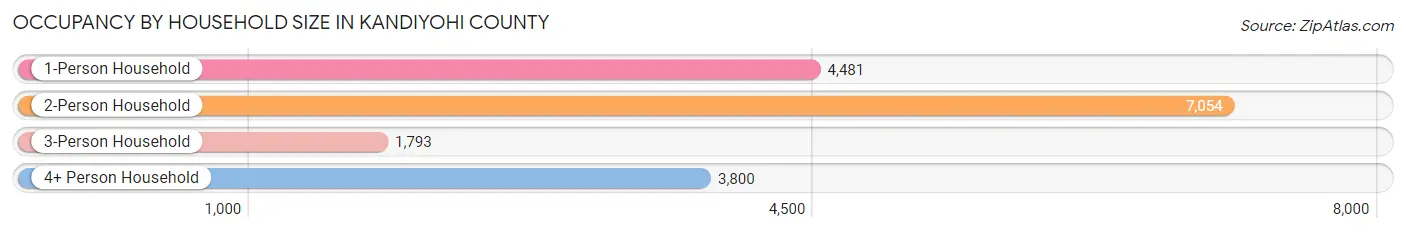
| Household Size | # Housing Units | % Housing Units |
| 1-Person Household | 4,481 | 26.2% |
| 2-Person Household | 7,054 | 41.2% |
| 3-Person Household | 1,793 | 10.5% |
| 4+ Person Household | 3,800 | 22.2% |
| Total Housing Units | 17,128 | 100.0% |
Occupancy by Ownership by Household Size in Kandiyohi County
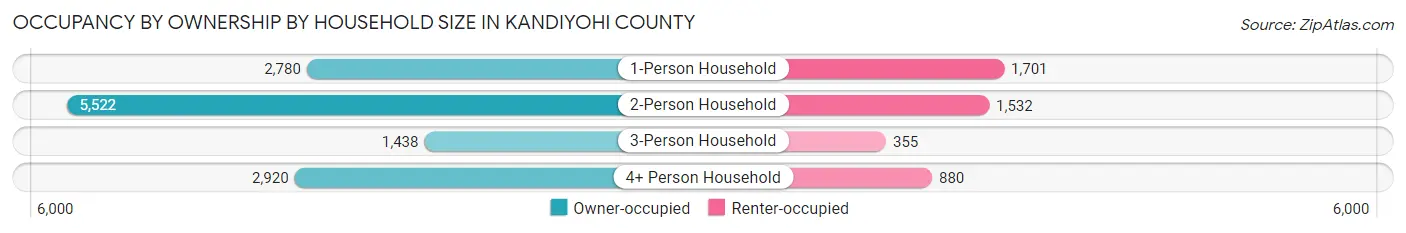
| Household Size | Owner-occupied | Renter-occupied |
| 1-Person Household | 2,780 (62.0%) | 1,701 (38.0%) |
| 2-Person Household | 5,522 (78.3%) | 1,532 (21.7%) |
| 3-Person Household | 1,438 (80.2%) | 355 (19.8%) |
| 4+ Person Household | 2,920 (76.8%) | 880 (23.2%) |
| Total Housing Units | 12,660 (73.9%) | 4,468 (26.1%) |
Occupancy by Educational Attainment in Kandiyohi County
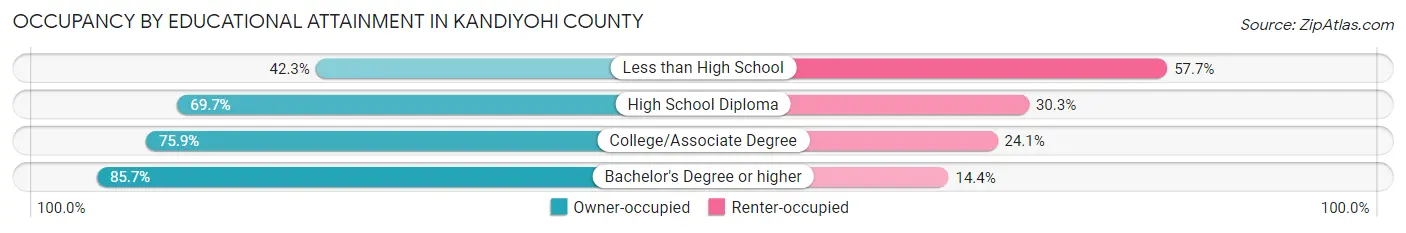
| Household Size | Owner-occupied | Renter-occupied |
| Less than High School | 676 (42.3%) | 922 (57.7%) |
| High School Diploma | 2,961 (69.7%) | 1,287 (30.3%) |
| College/Associate Degree | 4,999 (75.9%) | 1,585 (24.1%) |
| Bachelor's Degree or higher | 4,024 (85.7%) | 674 (14.3%) |
Occupancy by Age of Householder in Kandiyohi County
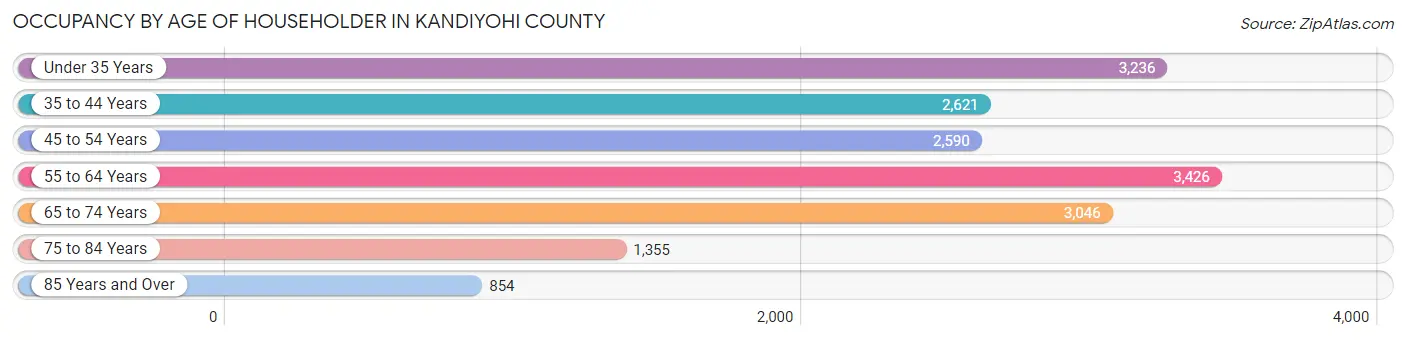
| Age Bracket | # Households | % Households |
| Under 35 Years | 3,236 | 18.9% |
| 35 to 44 Years | 2,621 | 15.3% |
| 45 to 54 Years | 2,590 | 15.1% |
| 55 to 64 Years | 3,426 | 20.0% |
| 65 to 74 Years | 3,046 | 17.8% |
| 75 to 84 Years | 1,355 | 7.9% |
| 85 Years and Over | 854 | 5.0% |
| Total | 17,128 | 100.0% |
Housing Finances in Kandiyohi County
Median Income by Occupancy in Kandiyohi County
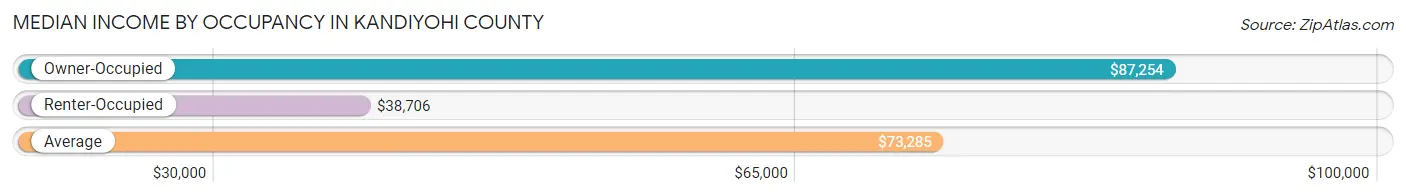
| Occupancy Type | # Households | Median Income |
| Owner-Occupied | 12,660 (73.9%) | $87,254 |
| Renter-Occupied | 4,468 (26.1%) | $38,706 |
| Average | 17,128 (100.0%) | $73,285 |
Occupancy by Householder Income Bracket in Kandiyohi County
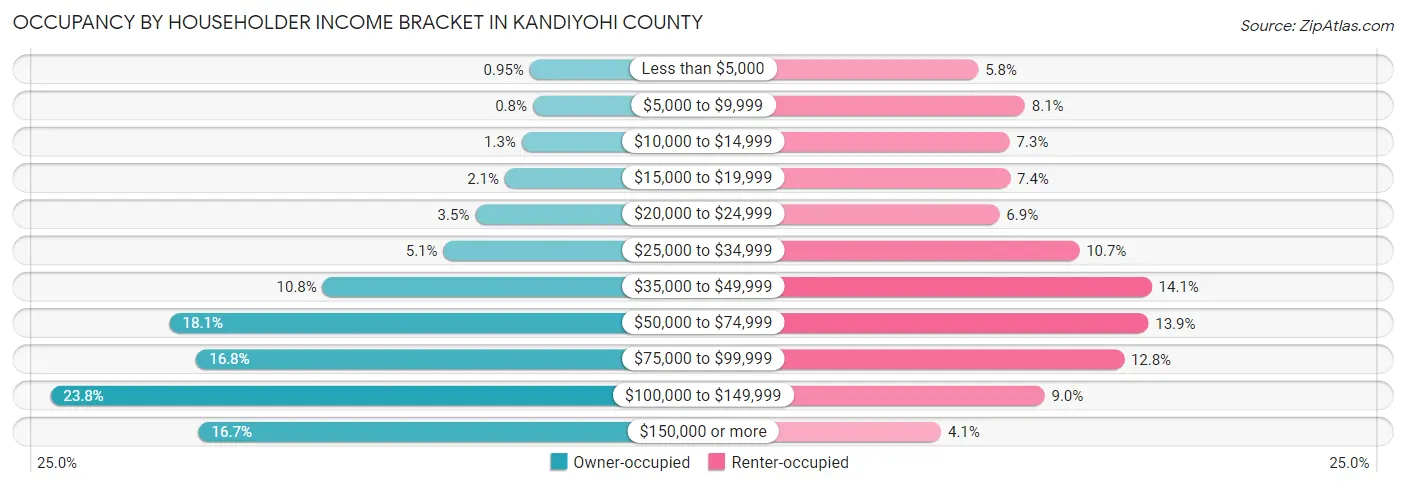
| Income Bracket | Owner-occupied | Renter-occupied |
| Less than $5,000 | 120 (0.9%) | 261 (5.8%) |
| $5,000 to $9,999 | 101 (0.8%) | 360 (8.1%) |
| $10,000 to $14,999 | 168 (1.3%) | 328 (7.3%) |
| $15,000 to $19,999 | 270 (2.1%) | 329 (7.4%) |
| $20,000 to $24,999 | 448 (3.5%) | 306 (6.9%) |
| $25,000 to $34,999 | 641 (5.1%) | 476 (10.6%) |
| $35,000 to $49,999 | 1,368 (10.8%) | 630 (14.1%) |
| $50,000 to $74,999 | 2,290 (18.1%) | 623 (13.9%) |
| $75,000 to $99,999 | 2,130 (16.8%) | 571 (12.8%) |
| $100,000 to $149,999 | 3,009 (23.8%) | 402 (9.0%) |
| $150,000 or more | 2,115 (16.7%) | 182 (4.1%) |
| Total | 12,660 (100.0%) | 4,468 (100.0%) |
Monthly Housing Cost Tiers in Kandiyohi County
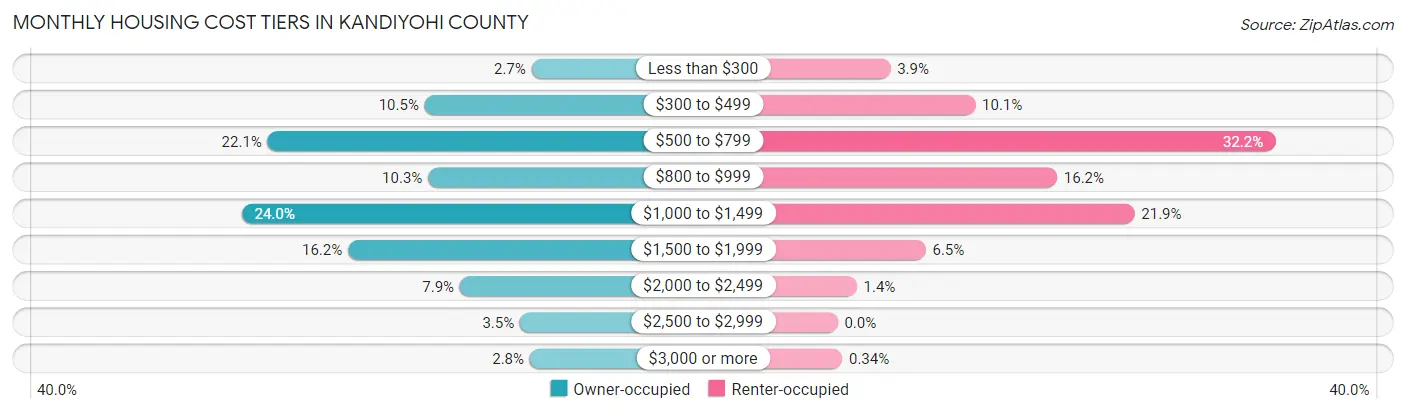
| Monthly Cost | Owner-occupied | Renter-occupied |
| Less than $300 | 337 (2.7%) | 174 (3.9%) |
| $300 to $499 | 1,333 (10.5%) | 453 (10.1%) |
| $500 to $799 | 2,798 (22.1%) | 1,440 (32.2%) |
| $800 to $999 | 1,301 (10.3%) | 722 (16.2%) |
| $1,000 to $1,499 | 3,041 (24.0%) | 977 (21.9%) |
| $1,500 to $1,999 | 2,048 (16.2%) | 290 (6.5%) |
| $2,000 to $2,499 | 1,005 (7.9%) | 63 (1.4%) |
| $2,500 to $2,999 | 444 (3.5%) | 0 (0.0%) |
| $3,000 or more | 353 (2.8%) | 15 (0.3%) |
| Total | 12,660 (100.0%) | 4,468 (100.0%) |
Physical Housing Characteristics in Kandiyohi County
Housing Structures in Kandiyohi County
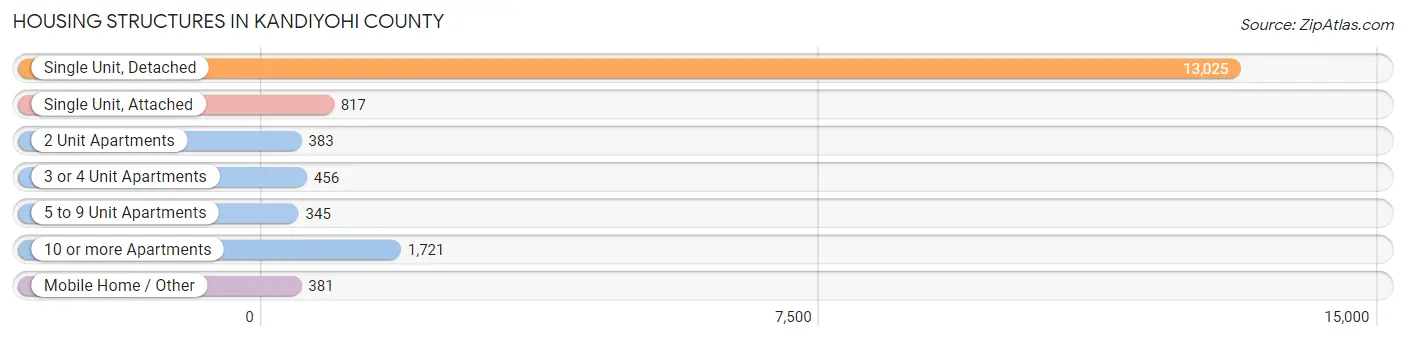
| Structure Type | # Housing Units | % Housing Units |
| Single Unit, Detached | 13,025 | 76.0% |
| Single Unit, Attached | 817 | 4.8% |
| 2 Unit Apartments | 383 | 2.2% |
| 3 or 4 Unit Apartments | 456 | 2.7% |
| 5 to 9 Unit Apartments | 345 | 2.0% |
| 10 or more Apartments | 1,721 | 10.1% |
| Mobile Home / Other | 381 | 2.2% |
| Total | 17,128 | 100.0% |
Housing Structures by Occupancy in Kandiyohi County
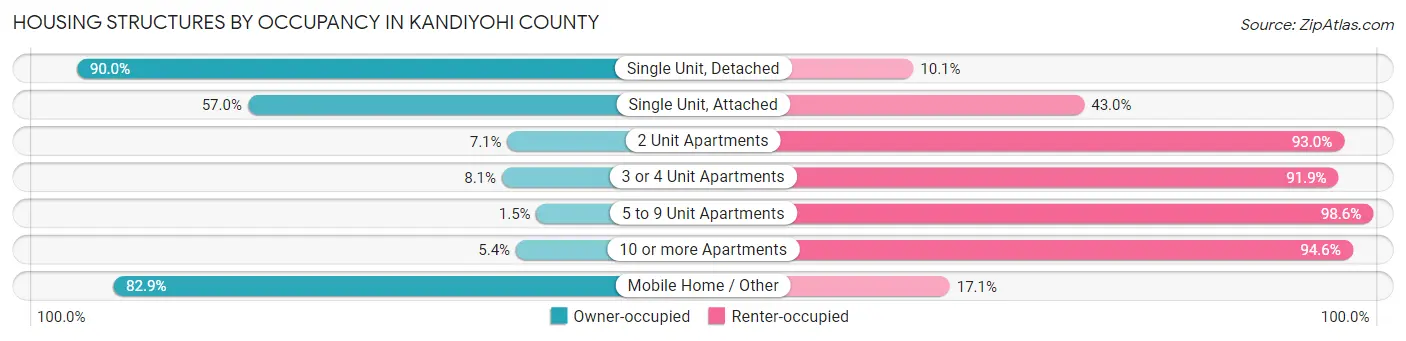
| Structure Type | Owner-occupied | Renter-occupied |
| Single Unit, Detached | 11,716 (89.9%) | 1,309 (10.1%) |
| Single Unit, Attached | 466 (57.0%) | 351 (43.0%) |
| 2 Unit Apartments | 27 (7.0%) | 356 (92.9%) |
| 3 or 4 Unit Apartments | 37 (8.1%) | 419 (91.9%) |
| 5 to 9 Unit Apartments | 5 (1.5%) | 340 (98.6%) |
| 10 or more Apartments | 93 (5.4%) | 1,628 (94.6%) |
| Mobile Home / Other | 316 (82.9%) | 65 (17.1%) |
| Total | 12,660 (73.9%) | 4,468 (26.1%) |
Housing Structures by Number of Rooms in Kandiyohi County
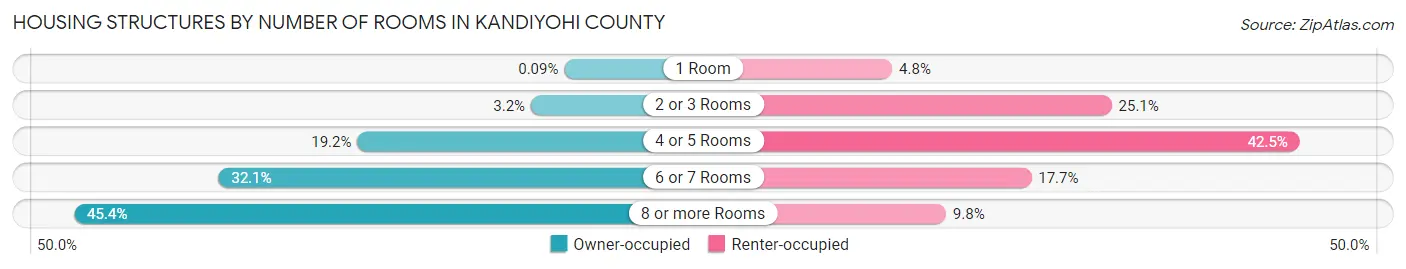
| Number of Rooms | Owner-occupied | Renter-occupied |
| 1 Room | 12 (0.1%) | 216 (4.8%) |
| 2 or 3 Rooms | 401 (3.2%) | 1,123 (25.1%) |
| 4 or 5 Rooms | 2,434 (19.2%) | 1,900 (42.5%) |
| 6 or 7 Rooms | 4,061 (32.1%) | 791 (17.7%) |
| 8 or more Rooms | 5,752 (45.4%) | 438 (9.8%) |
| Total | 12,660 (100.0%) | 4,468 (100.0%) |
Housing Structure by Heating Type in Kandiyohi County
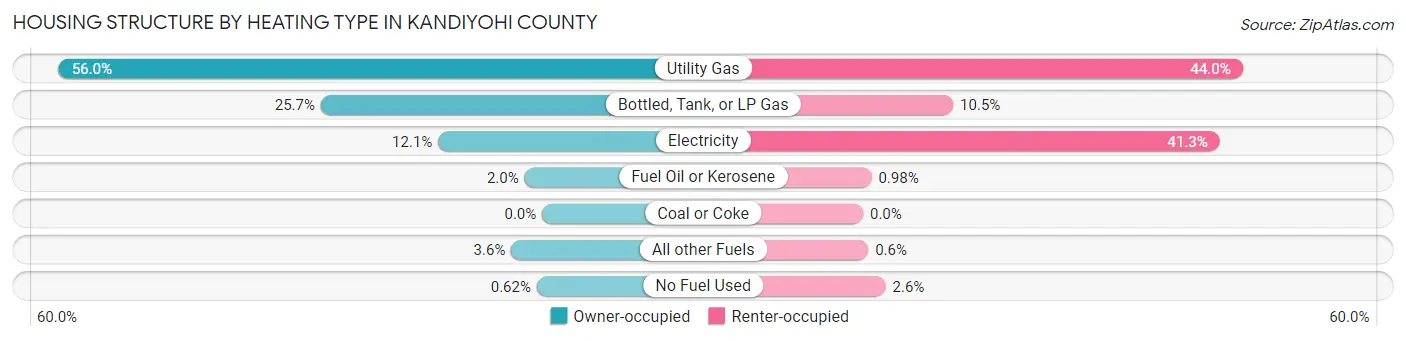
| Heating Type | Owner-occupied | Renter-occupied |
| Utility Gas | 7,095 (56.0%) | 1,966 (44.0%) |
| Bottled, Tank, or LP Gas | 3,249 (25.7%) | 467 (10.4%) |
| Electricity | 1,526 (12.0%) | 1,847 (41.3%) |
| Fuel Oil or Kerosene | 258 (2.0%) | 44 (1.0%) |
| Coal or Coke | 0 (0.0%) | 0 (0.0%) |
| All other Fuels | 453 (3.6%) | 27 (0.6%) |
| No Fuel Used | 79 (0.6%) | 117 (2.6%) |
| Total | 12,660 (100.0%) | 4,468 (100.0%) |
Household Vehicle Usage in Kandiyohi County
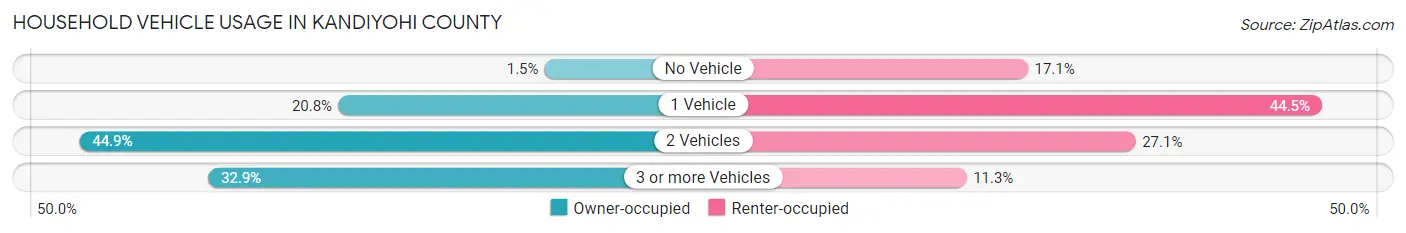
| Vehicles per Household | Owner-occupied | Renter-occupied |
| No Vehicle | 187 (1.5%) | 762 (17.1%) |
| 1 Vehicle | 2,627 (20.7%) | 1,989 (44.5%) |
| 2 Vehicles | 5,683 (44.9%) | 1,211 (27.1%) |
| 3 or more Vehicles | 4,163 (32.9%) | 506 (11.3%) |
| Total | 12,660 (100.0%) | 4,468 (100.0%) |
Real Estate & Mortgages in Kandiyohi County
Real Estate and Mortgage Overview in Kandiyohi County
| Characteristic | Without Mortgage | With Mortgage |
| Housing Units | 5,257 | 7,403 |
| Median Property Value | $217,900 | $212,600 |
| Median Household Income | $68,220 | $1,467 |
| Monthly Housing Costs | $603 | $334 |
| Real Estate Taxes | $2,180 | $107 |
Property Value by Mortgage Status in Kandiyohi County
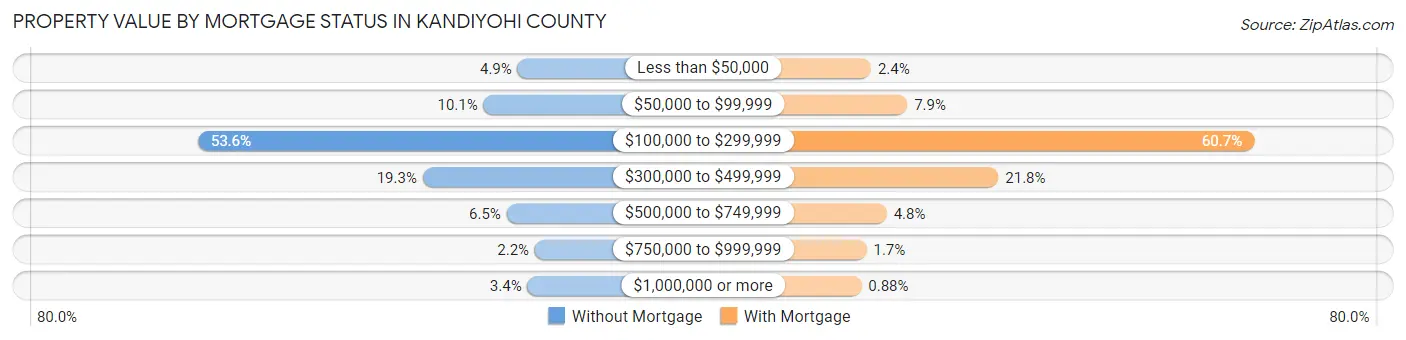
| Property Value | Without Mortgage | With Mortgage |
| Less than $50,000 | 256 (4.9%) | 174 (2.4%) |
| $50,000 to $99,999 | 529 (10.1%) | 583 (7.9%) |
| $100,000 to $299,999 | 2,818 (53.6%) | 4,494 (60.7%) |
| $300,000 to $499,999 | 1,016 (19.3%) | 1,611 (21.8%) |
| $500,000 to $749,999 | 344 (6.5%) | 352 (4.8%) |
| $750,000 to $999,999 | 117 (2.2%) | 124 (1.7%) |
| $1,000,000 or more | 177 (3.4%) | 65 (0.9%) |
| Total | 5,257 (100.0%) | 7,403 (100.0%) |
Household Income by Mortgage Status in Kandiyohi County
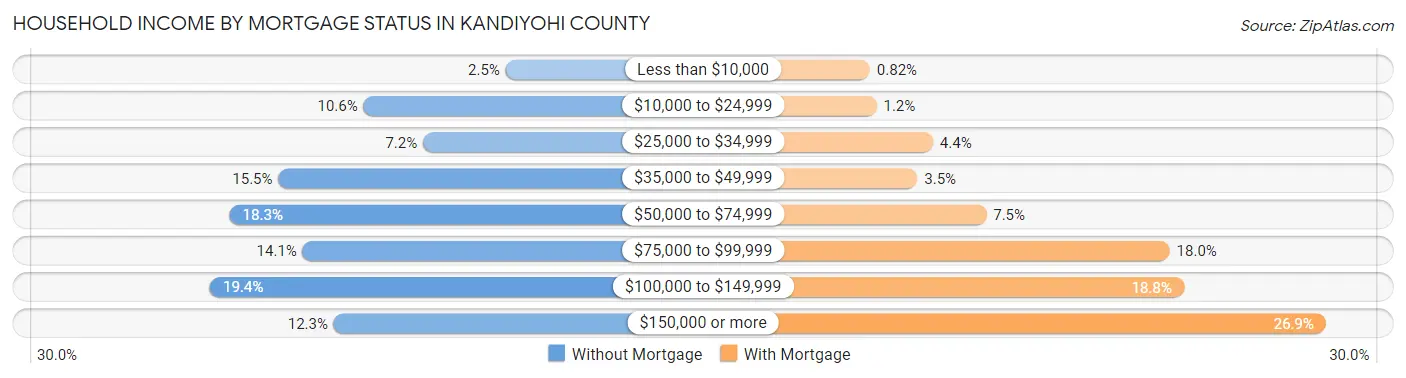
| Household Income | Without Mortgage | With Mortgage |
| Less than $10,000 | 132 (2.5%) | 61 (0.8%) |
| $10,000 to $24,999 | 559 (10.6%) | 89 (1.2%) |
| $25,000 to $34,999 | 380 (7.2%) | 327 (4.4%) |
| $35,000 to $49,999 | 815 (15.5%) | 261 (3.5%) |
| $50,000 to $74,999 | 961 (18.3%) | 553 (7.5%) |
| $75,000 to $99,999 | 742 (14.1%) | 1,329 (17.9%) |
| $100,000 to $149,999 | 1,020 (19.4%) | 1,388 (18.8%) |
| $150,000 or more | 648 (12.3%) | 1,989 (26.9%) |
| Total | 5,257 (100.0%) | 7,403 (100.0%) |
Property Value to Household Income Ratio in Kandiyohi County
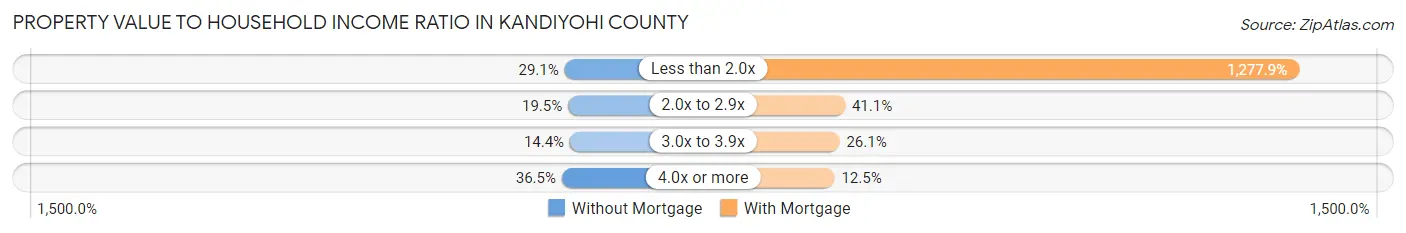
| Value-to-Income Ratio | Without Mortgage | With Mortgage |
| Less than 2.0x | 1,531 (29.1%) | 94,603 (1,277.9%) |
| 2.0x to 2.9x | 1,027 (19.5%) | 3,040 (41.1%) |
| 3.0x to 3.9x | 755 (14.4%) | 1,930 (26.1%) |
| 4.0x or more | 1,920 (36.5%) | 924 (12.5%) |
| Total | 5,257 (100.0%) | 7,403 (100.0%) |
Real Estate Taxes by Mortgage Status in Kandiyohi County
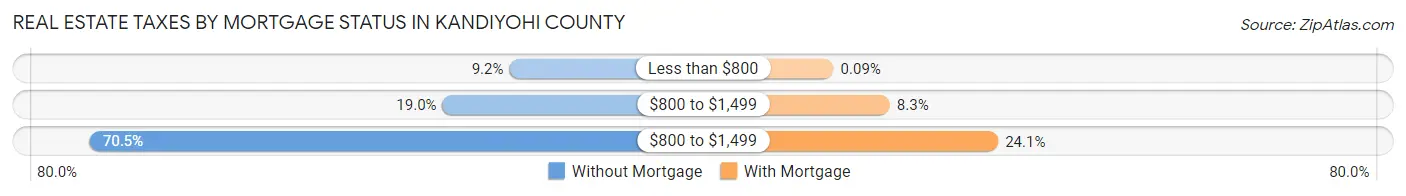
| Property Taxes | Without Mortgage | With Mortgage |
| Less than $800 | 482 (9.2%) | 7 (0.1%) |
| $800 to $1,499 | 996 (19.0%) | 615 (8.3%) |
| $800 to $1,499 | 3,704 (70.5%) | 1,787 (24.1%) |
| Total | 5,257 (100.0%) | 7,403 (100.0%) |
Health & Disability in Kandiyohi County
Health Insurance Coverage by Age in Kandiyohi County
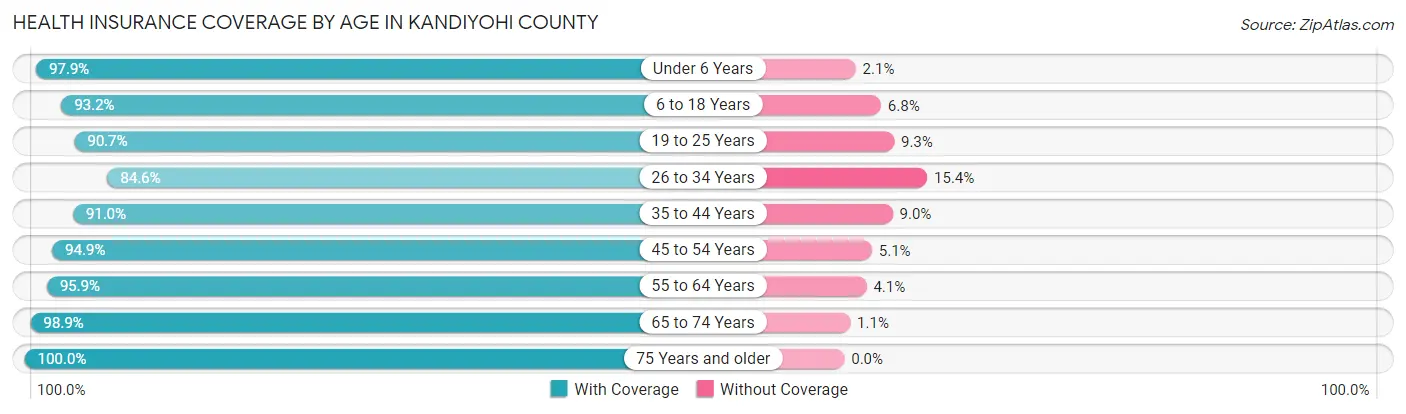
| Age Bracket | With Coverage | Without Coverage |
| Under 6 Years | 3,364 (97.9%) | 73 (2.1%) |
| 6 to 18 Years | 7,040 (93.2%) | 516 (6.8%) |
| 19 to 25 Years | 3,408 (90.7%) | 348 (9.3%) |
| 26 to 34 Years | 3,691 (84.6%) | 674 (15.4%) |
| 35 to 44 Years | 4,636 (91.0%) | 459 (9.0%) |
| 45 to 54 Years | 4,524 (94.9%) | 245 (5.1%) |
| 55 to 64 Years | 5,642 (95.9%) | 243 (4.1%) |
| 65 to 74 Years | 4,796 (98.9%) | 53 (1.1%) |
| 75 Years and older | 3,265 (100.0%) | 0 (0.0%) |
| Total | 40,366 (93.9%) | 2,611 (6.1%) |
Health Insurance Coverage by Citizenship Status in Kandiyohi County
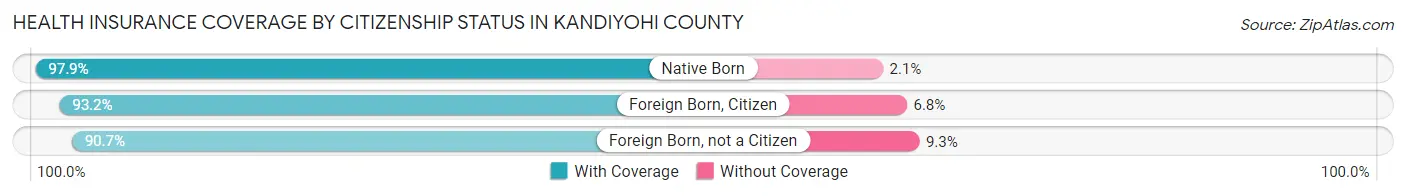
| Citizenship Status | With Coverage | Without Coverage |
| Native Born | 3,364 (97.9%) | 73 (2.1%) |
| Foreign Born, Citizen | 7,040 (93.2%) | 516 (6.8%) |
| Foreign Born, not a Citizen | 3,408 (90.7%) | 348 (9.3%) |
Health Insurance Coverage by Household Income in Kandiyohi County
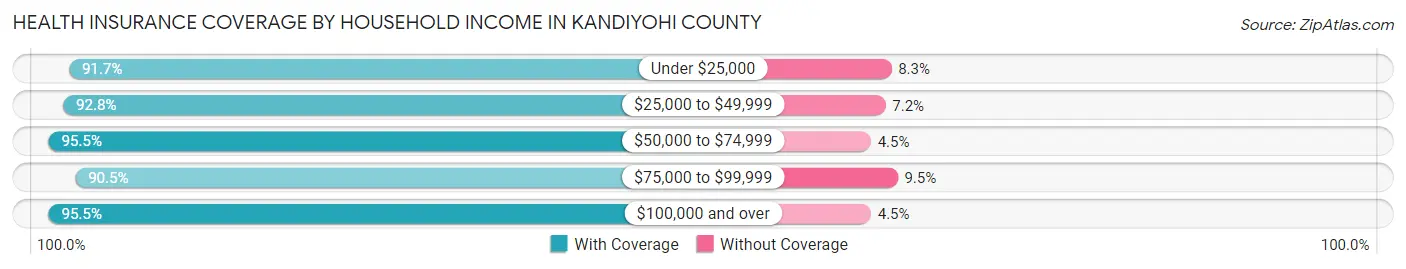
| Household Income | With Coverage | Without Coverage |
| Under $25,000 | 4,024 (91.7%) | 365 (8.3%) |
| $25,000 to $49,999 | 5,711 (92.8%) | 445 (7.2%) |
| $50,000 to $74,999 | 6,822 (95.5%) | 320 (4.5%) |
| $75,000 to $99,999 | 6,644 (90.5%) | 697 (9.5%) |
| $100,000 and over | 16,649 (95.5%) | 784 (4.5%) |
Public vs Private Health Insurance Coverage by Age in Kandiyohi County
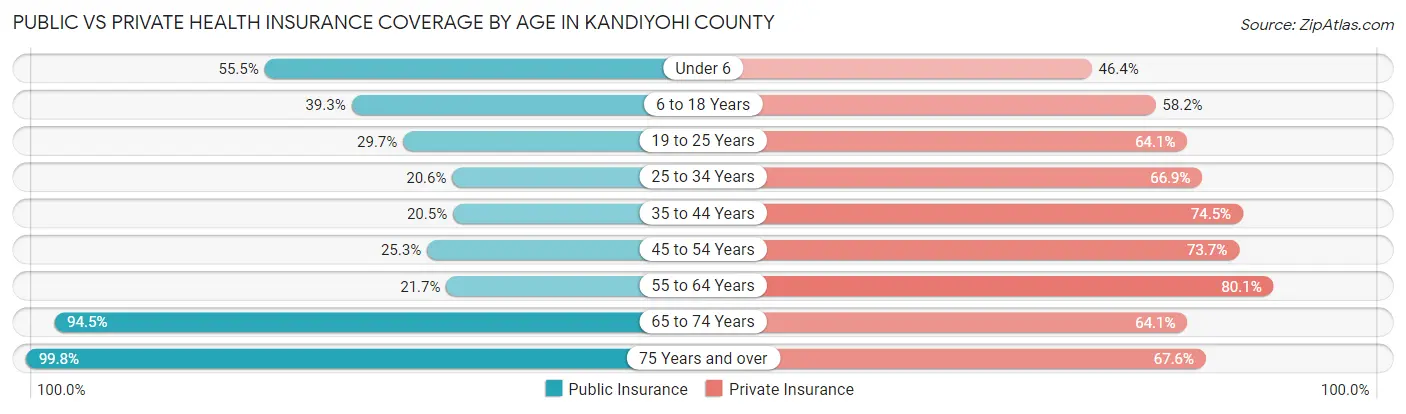
| Age Bracket | Public Insurance | Private Insurance |
| Under 6 | 1,906 (55.5%) | 1,593 (46.4%) |
| 6 to 18 Years | 2,972 (39.3%) | 4,398 (58.2%) |
| 19 to 25 Years | 1,117 (29.7%) | 2,408 (64.1%) |
| 25 to 34 Years | 900 (20.6%) | 2,921 (66.9%) |
| 35 to 44 Years | 1,044 (20.5%) | 3,793 (74.5%) |
| 45 to 54 Years | 1,207 (25.3%) | 3,516 (73.7%) |
| 55 to 64 Years | 1,279 (21.7%) | 4,715 (80.1%) |
| 65 to 74 Years | 4,583 (94.5%) | 3,109 (64.1%) |
| 75 Years and over | 3,258 (99.8%) | 2,206 (67.6%) |
| Total | 18,266 (42.5%) | 28,659 (66.7%) |
Disability Status by Sex by Age in Kandiyohi County
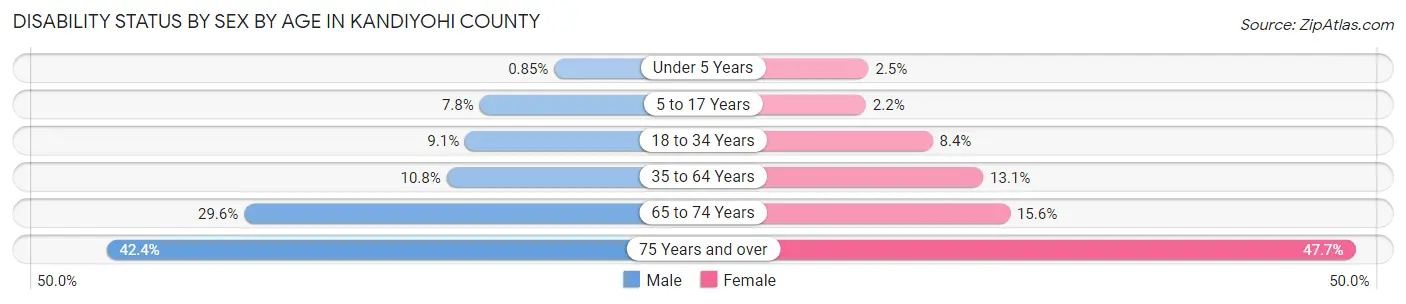
| Age Bracket | Male | Female |
| Under 5 Years | 13 (0.9%) | 34 (2.5%) |
| 5 to 17 Years | 310 (7.8%) | 83 (2.2%) |
| 18 to 34 Years | 407 (9.1%) | 344 (8.4%) |
| 35 to 64 Years | 866 (10.8%) | 1,018 (13.1%) |
| 65 to 74 Years | 742 (29.6%) | 366 (15.6%) |
| 75 Years and over | 614 (42.4%) | 866 (47.7%) |
Disability Class by Sex by Age in Kandiyohi County
Disability Class: Hearing Difficulty
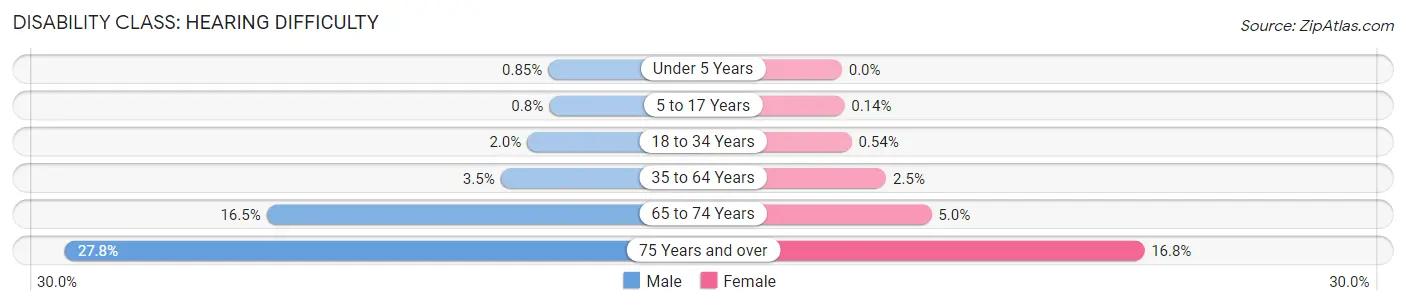
| Age Bracket | Male | Female |
| Under 5 Years | 13 (0.9%) | 0 (0.0%) |
| 5 to 17 Years | 32 (0.8%) | 5 (0.1%) |
| 18 to 34 Years | 90 (2.0%) | 22 (0.5%) |
| 35 to 64 Years | 280 (3.5%) | 192 (2.5%) |
| 65 to 74 Years | 414 (16.5%) | 117 (5.0%) |
| 75 Years and over | 402 (27.8%) | 306 (16.8%) |
Disability Class: Vision Difficulty
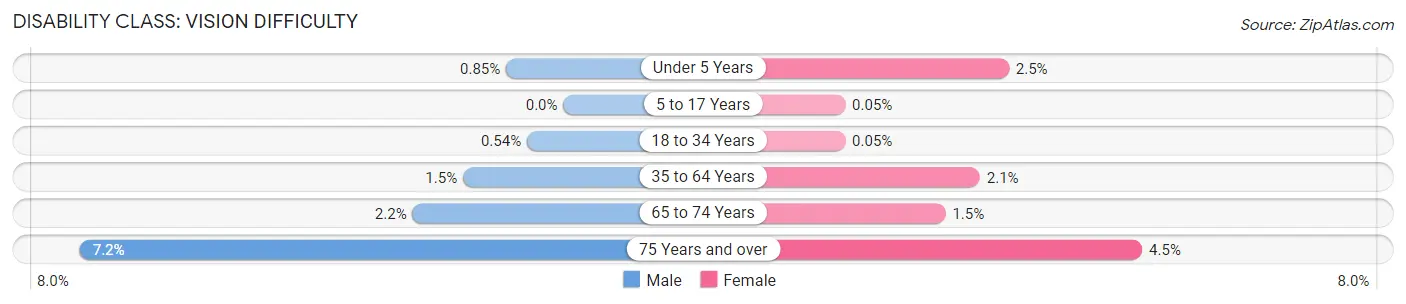
| Age Bracket | Male | Female |
| Under 5 Years | 13 (0.9%) | 34 (2.5%) |
| 5 to 17 Years | 0 (0.0%) | 2 (0.1%) |
| 18 to 34 Years | 24 (0.5%) | 2 (0.1%) |
| 35 to 64 Years | 119 (1.5%) | 159 (2.1%) |
| 65 to 74 Years | 56 (2.2%) | 36 (1.5%) |
| 75 Years and over | 104 (7.2%) | 81 (4.5%) |
Disability Class: Cognitive Difficulty
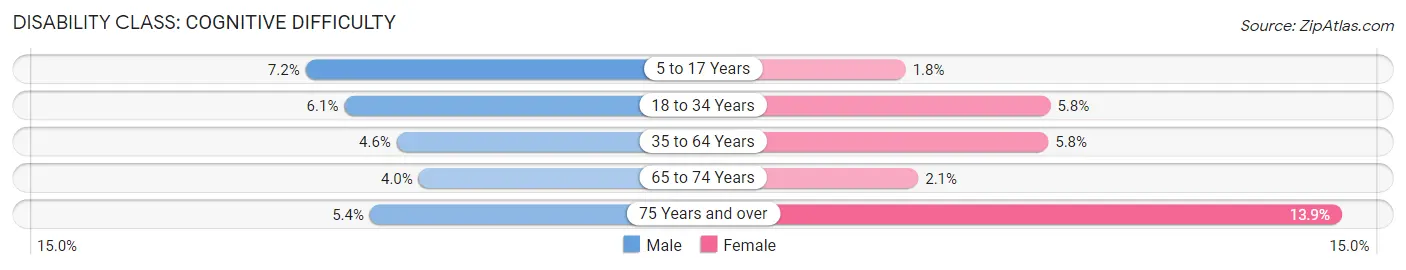
| Age Bracket | Male | Female |
| 5 to 17 Years | 286 (7.2%) | 66 (1.8%) |
| 18 to 34 Years | 272 (6.1%) | 237 (5.8%) |
| 35 to 64 Years | 371 (4.6%) | 446 (5.8%) |
| 65 to 74 Years | 101 (4.0%) | 50 (2.1%) |
| 75 Years and over | 78 (5.4%) | 253 (13.9%) |
Disability Class: Ambulatory Difficulty
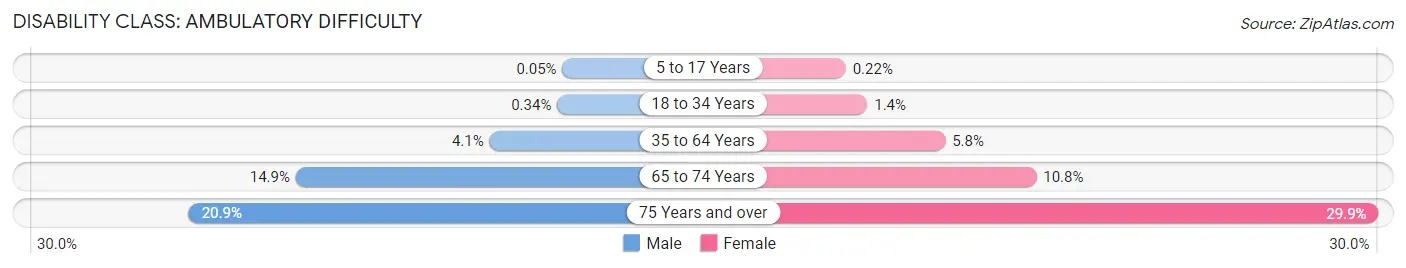
| Age Bracket | Male | Female |
| 5 to 17 Years | 2 (0.1%) | 8 (0.2%) |
| 18 to 34 Years | 15 (0.3%) | 58 (1.4%) |
| 35 to 64 Years | 328 (4.1%) | 447 (5.8%) |
| 65 to 74 Years | 373 (14.9%) | 254 (10.8%) |
| 75 Years and over | 302 (20.9%) | 543 (29.9%) |
Disability Class: Self-Care Difficulty
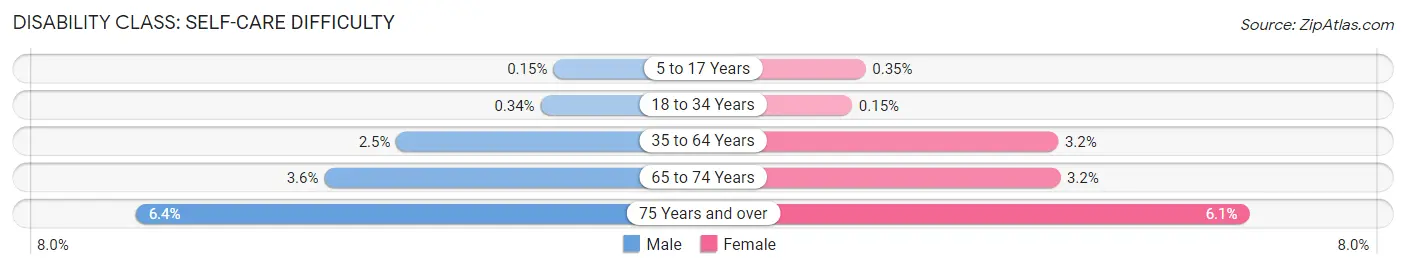
| Age Bracket | Male | Female |
| 5 to 17 Years | 6 (0.2%) | 13 (0.4%) |
| 18 to 34 Years | 15 (0.3%) | 6 (0.2%) |
| 35 to 64 Years | 198 (2.5%) | 249 (3.2%) |
| 65 to 74 Years | 89 (3.5%) | 76 (3.2%) |
| 75 Years and over | 92 (6.4%) | 110 (6.0%) |
Technology Access in Kandiyohi County
Computing Device Access in Kandiyohi County
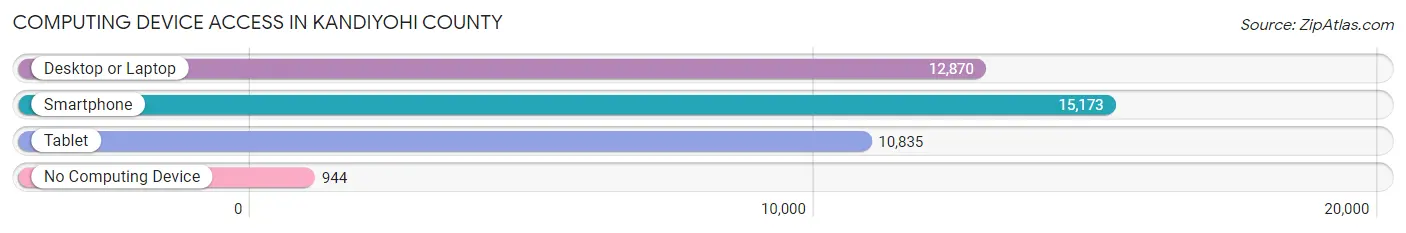
| Device Type | # Households | % Households |
| Desktop or Laptop | 12,870 | 75.1% |
| Smartphone | 15,173 | 88.6% |
| Tablet | 10,835 | 63.3% |
| No Computing Device | 944 | 5.5% |
| Total | 17,128 | 100.0% |
Internet Access in Kandiyohi County
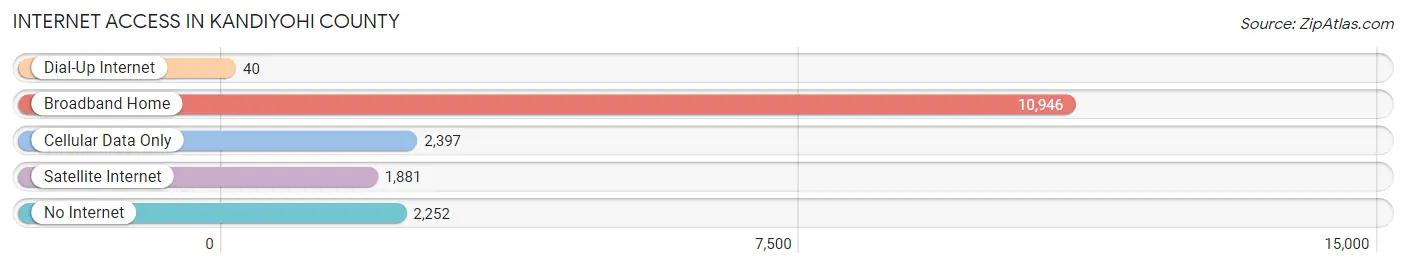
| Internet Type | # Households | % Households |
| Dial-Up Internet | 40 | 0.2% |
| Broadband Home | 10,946 | 63.9% |
| Cellular Data Only | 2,397 | 14.0% |
| Satellite Internet | 1,881 | 11.0% |
| No Internet | 2,252 | 13.2% |
| Total | 17,128 | 100.0% |
Kandiyohi County Summary
Kandiyohi County is located in the west-central part of Minnesota, in the United States. It is bordered by Chippewa County to the north, Meeker County to the east, Stearns County to the south, and Swift County to the west. The county seat is Willmar, and the largest city is Willmar. The county was established in 1858 and named after the Dakota word for “where the buffalo fish come.”
Geography
Kandiyohi County covers an area of 845 square miles, of which 843 square miles is land and 2 square miles is water. The county is located in the Central Lakes region of Minnesota, and is part of the Prairie Coteau region. The county is mostly flat, with some rolling hills in the northern and western parts. The highest point in the county is located in the northwest corner, at an elevation of 1,092 feet. The county is drained by the Chippewa River, which flows through the county from north to south.
The county is home to several lakes, including Green Lake, Lake Lillian, Lake Florida, and Lake Andrew. The county also contains several state parks, including Sibley State Park, which is located in the northern part of the county.
Climate
Kandiyohi County has a humid continental climate, with cold winters and warm summers. The average annual temperature is 43°F, and the average annual precipitation is 28 inches.
Demographics
As of the 2010 census, there were 42,239 people, 16,845 households, and 11,541 families living in the county. The population density was 50 people per square mile. The racial makeup of the county was 92.3% White, 0.7% African American, 0.5% Native American, 0.7% Asian, 4.2% from other races, and 1.6% from two or more races. Hispanic or Latino of any race were 8.2% of the population.
The median income for a household in the county was $45,945, and the median income for a family was $55,945. The per capita income for the county was $22,845. About 8.2% of families and 11.2% of the population were below the poverty line, including 14.2% of those under age 18 and 8.2% of those age 65 or over.
Economy
Kandiyohi County’s economy is largely based on agriculture, with corn, soybeans, and wheat being the main crops. The county is also home to several manufacturing companies, including Jennie-O Turkey Store, which is the largest employer in the county. Other major employers include Willmar Poultry Company, Willmar Fabricators, and Willmar Fertilizer.
The county is also home to several tourist attractions, including the Kandiyohi County Historical Society Museum, the Willmar Lakes Area Convention and Visitors Bureau, and the Willmar Lakes Area Chamber of Commerce.
Kandiyohi County is a great place to live, work, and visit. With its rich history, beautiful geography, diverse economy, and friendly people, it is a great place to call home.
Common Questions
What is the Total Population of Kandiyohi County?
Total Population of Kandiyohi County is 43,686.
What is the Total Male Population of Kandiyohi County?
Total Male Population of Kandiyohi County is 22,189.
What is the Total Female Population of Kandiyohi County?
Total Female Population of Kandiyohi County is 21,497.
What is the Ratio of Males per 100 Females in Kandiyohi County?
There are 103.22 Males per 100 Females in Kandiyohi County.
What is the Ratio of Females per 100 Males in Kandiyohi County?
There are 96.88 Females per 100 Males in Kandiyohi County.
What is the Median Population Age in Kandiyohi County?
Median Population Age in Kandiyohi County is 40.0 Years.
What is the Average Family Size in Kandiyohi County
Average Family Size in Kandiyohi County is 3.0 People.
What is the Average Household Size in Kandiyohi County
Average Household Size in Kandiyohi County is 2.5 People.
What is Per Capita Income in Kandiyohi County?
Per Capita income in Kandiyohi County is $35,814.
What is the Median Family Income in Kandiyohi County?
Median Family Income in Kandiyohi County is $89,539.
What is the Median Household income in Kandiyohi County?
Median Household Income in Kandiyohi County is $73,285.
What is Income or Wage Gap in Kandiyohi County?
Income or Wage Gap in Kandiyohi County is 30.5%.
Women in Kandiyohi County earn 69.5 cents for every dollar earned by a man.
What is Family Income Deficit in Kandiyohi County?
Family Income Deficit in Kandiyohi County is $11,325.
Families that are below poverty line in Kandiyohi County earn $11,325 less on average than the poverty threshold level.
What is Inequality or Gini Index in Kandiyohi County?
Inequality or Gini Index in Kandiyohi County is 0.42.
How Large is the Labor Force in Kandiyohi County?
There are 23,106 People in the Labor Forcein in Kandiyohi County.
What is the Percentage of People in the Labor Force in Kandiyohi County?
67.4% of People are in the Labor Force in Kandiyohi County.
What is the Unemployment Rate in Kandiyohi County?
Unemployment Rate in Kandiyohi County is 3.8%.