Itasca County, MN
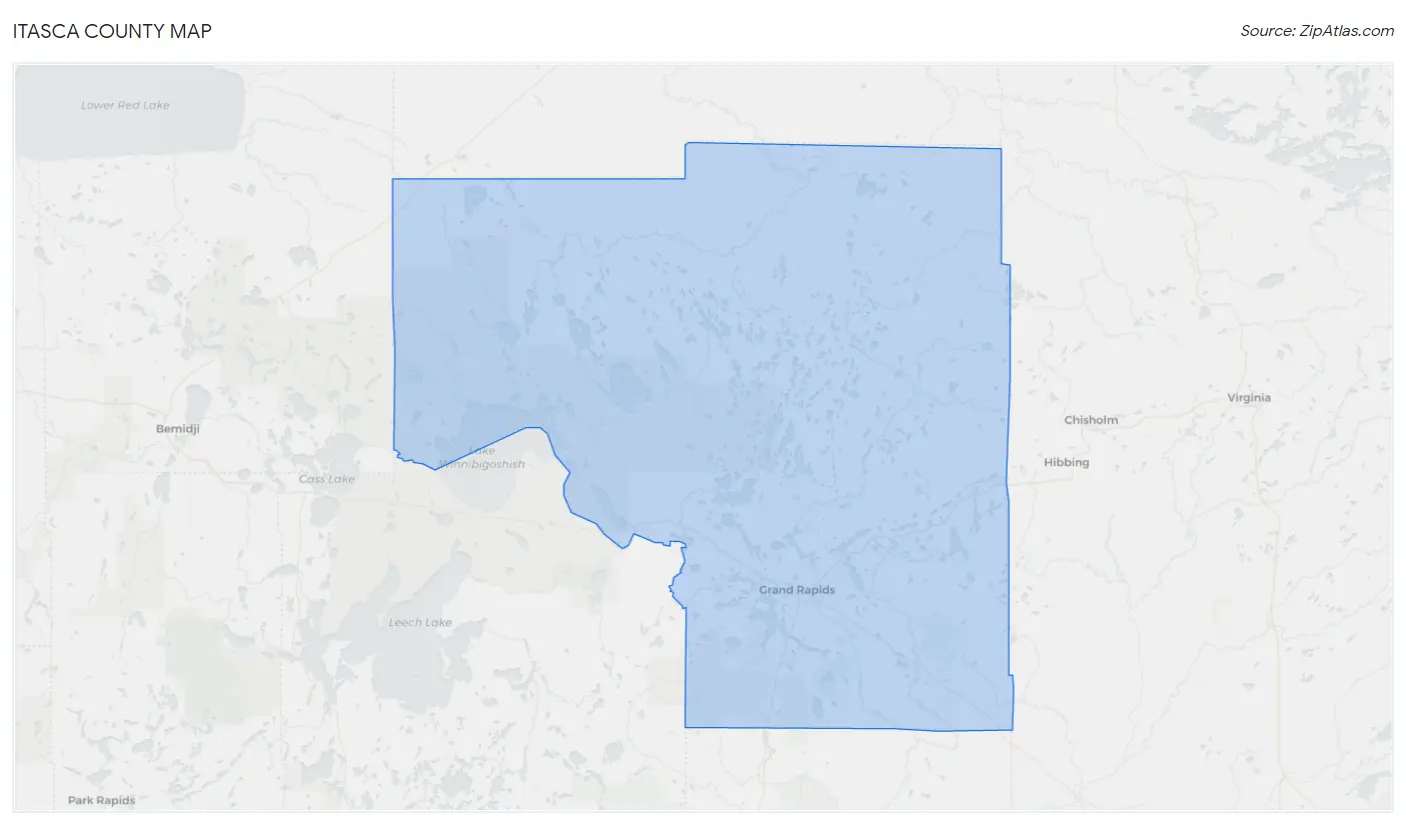
Itasca County Map
Itasca County Overview
45,054
TOTAL POPULATION
22,891
MALE POPULATION
22,163
FEMALE POPULATION
103.28
MALES / 100 FEMALES
96.82
FEMALES / 100 MALES
46.8
MEDIAN AGE
3.0
AVG FAMILY SIZE
2.4
AVG HOUSEHOLD SIZE
$34,528
PER CAPITA INCOME
$82,653
AVG FAMILY INCOME
$63,962
AVG HOUSEHOLD INCOME
34.3%
WAGE / INCOME GAP [ % ]
65.7¢/ $1
WAGE / INCOME GAP [ $ ]
$9,871
FAMILY INCOME DEFICIT
0.43
INEQUALITY / GINI INDEX
20,508
LABOR FORCE [ PEOPLE ]
55.5%
PERCENT IN LABOR FORCE
6.2%
UNEMPLOYMENT RATE
Itasca County Area Codes
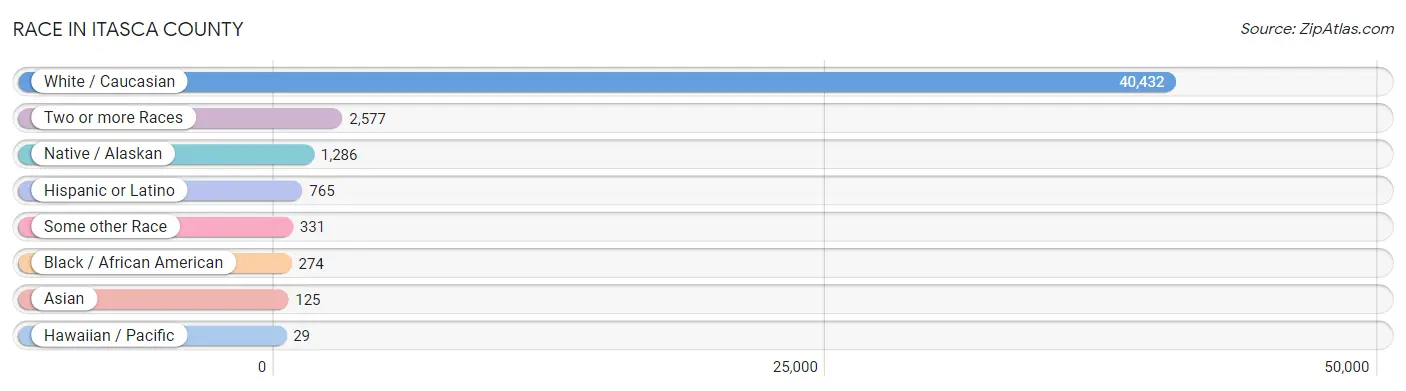
Race in Itasca County
The most populous races in Itasca County are White / Caucasian (40,432 | 89.7%), Two or more Races (2,577 | 5.7%), and Native / Alaskan (1,286 | 2.9%).
| Race | # Population | % Population |
| Asian | 125 | 0.3% |
| Black / African American | 274 | 0.6% |
| Hawaiian / Pacific | 29 | 0.1% |
| Hispanic or Latino | 765 | 1.7% |
| Native / Alaskan | 1,286 | 2.9% |
| White / Caucasian | 40,432 | 89.7% |
| Two or more Races | 2,577 | 5.7% |
| Some other Race | 331 | 0.7% |
| Total | 45,054 | 100.0% |
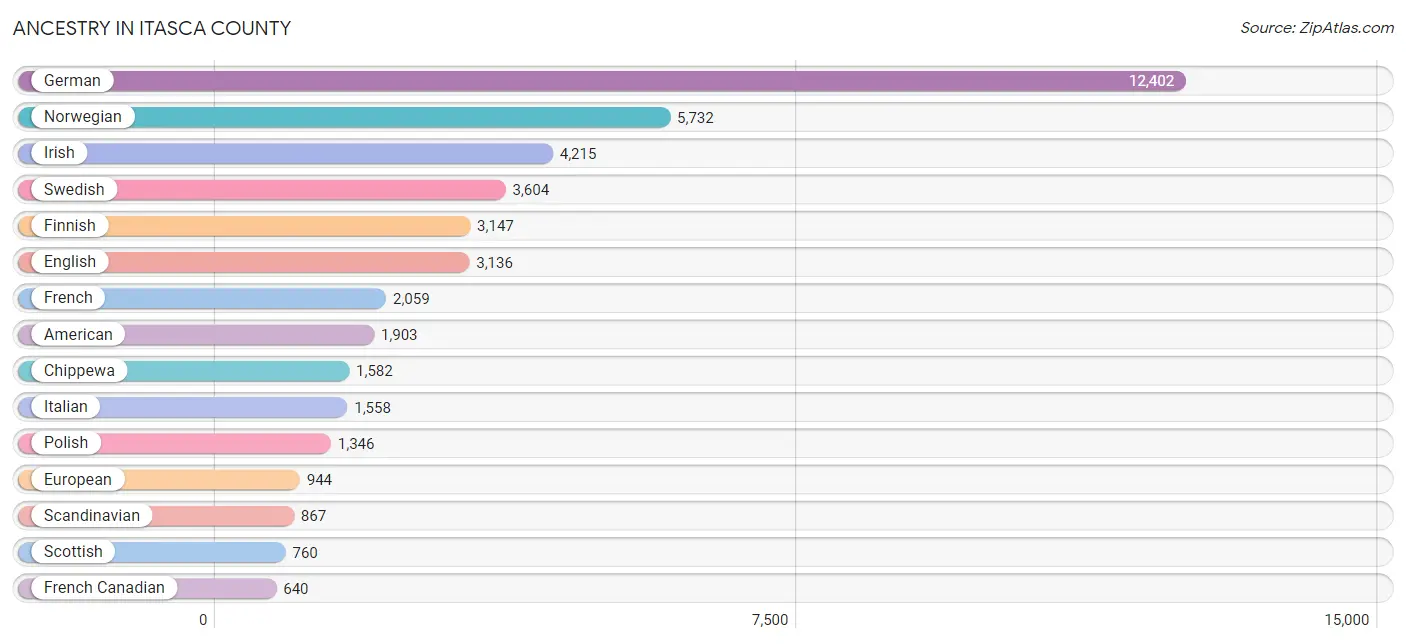
Ancestry in Itasca County
The most populous ancestries reported in Itasca County are German (12,402 | 27.5%), Norwegian (5,732 | 12.7%), Irish (4,215 | 9.4%), Swedish (3,604 | 8.0%), and Finnish (3,147 | 7.0%), together accounting for 64.6% of all Itasca County residents.
| Ancestry | # Population | % Population |
| African | 18 | 0.0% |
| Alaskan Athabascan | 13 | 0.0% |
| American | 1,903 | 4.2% |
| Arab | 5 | 0.0% |
| Armenian | 7 | 0.0% |
| Australian | 9 | 0.0% |
| Austrian | 76 | 0.2% |
| Bangladeshi | 30 | 0.1% |
| Belgian | 144 | 0.3% |
| Belizean | 1 | 0.0% |
| Bhutanese | 43 | 0.1% |
| Blackfeet | 5 | 0.0% |
| British | 159 | 0.4% |
| Burmese | 40 | 0.1% |
| Canadian | 32 | 0.1% |
| Carpatho Rusyn | 1 | 0.0% |
| Celtic | 3 | 0.0% |
| Central American | 67 | 0.2% |
| Central American Indian | 6 | 0.0% |
| Cherokee | 77 | 0.2% |
| Chilean | 1 | 0.0% |
| Chippewa | 1,582 | 3.5% |
| Choctaw | 21 | 0.1% |
| Colombian | 16 | 0.0% |
| Costa Rican | 3 | 0.0% |
| Cree | 28 | 0.1% |
| Croatian | 266 | 0.6% |
| Cuban | 22 | 0.1% |
| Czech | 459 | 1.0% |
| Czechoslovakian | 34 | 0.1% |
| Danish | 488 | 1.1% |
| Dutch | 578 | 1.3% |
| Eastern European | 75 | 0.2% |
| Ecuadorian | 7 | 0.0% |
| English | 3,136 | 7.0% |
| Estonian | 3 | 0.0% |
| Ethiopian | 3 | 0.0% |
| European | 944 | 2.1% |
| Filipino | 3 | 0.0% |
| Finnish | 3,147 | 7.0% |
| French | 2,059 | 4.6% |
| French American Indian | 19 | 0.0% |
| French Canadian | 640 | 1.4% |
| German | 12,402 | 27.5% |
| German Russian | 8 | 0.0% |
| Greek | 35 | 0.1% |
| Guamanian / Chamorro | 5 | 0.0% |
| Guatemalan | 2 | 0.0% |
| Honduran | 10 | 0.0% |
| Hungarian | 58 | 0.1% |
| Icelander | 6 | 0.0% |
| Indian (Asian) | 26 | 0.1% |
| Iranian | 12 | 0.0% |
| Irish | 4,215 | 9.4% |
| Iroquois | 10 | 0.0% |
| Italian | 1,558 | 3.5% |
| Japanese | 7 | 0.0% |
| Kiowa | 3 | 0.0% |
| Korean | 97 | 0.2% |
| Latvian | 31 | 0.1% |
| Lebanese | 3 | 0.0% |
| Lithuanian | 2 | 0.0% |
| Luxembourger | 5 | 0.0% |
| Mexican | 343 | 0.8% |
| Mexican American Indian | 5 | 0.0% |
| Native Hawaiian | 28 | 0.1% |
| Navajo | 7 | 0.0% |
| Nicaraguan | 42 | 0.1% |
| Northern European | 124 | 0.3% |
| Norwegian | 5,732 | 12.7% |
| Palestinian | 2 | 0.0% |
| Panamanian | 10 | 0.0% |
| Pennsylvania German | 5 | 0.0% |
| Peruvian | 13 | 0.0% |
| Polish | 1,346 | 3.0% |
| Portuguese | 21 | 0.1% |
| Potawatomi | 11 | 0.0% |
| Pueblo | 3 | 0.0% |
| Puerto Rican | 111 | 0.3% |
| Romanian | 1 | 0.0% |
| Russian | 151 | 0.3% |
| Scandinavian | 867 | 1.9% |
| Scotch-Irish | 242 | 0.5% |
| Scottish | 760 | 1.7% |
| Seminole | 1 | 0.0% |
| Serbian | 279 | 0.6% |
| Shoshone | 23 | 0.1% |
| Sioux | 42 | 0.1% |
| Slavic | 77 | 0.2% |
| Slovak | 83 | 0.2% |
| Slovene | 90 | 0.2% |
| South African | 9 | 0.0% |
| South American | 37 | 0.1% |
| Spaniard | 99 | 0.2% |
| Spanish | 47 | 0.1% |
| Sri Lankan | 11 | 0.0% |
| Subsaharan African | 36 | 0.1% |
| Swedish | 3,604 | 8.0% |
| Swiss | 166 | 0.4% |
| Thai | 15 | 0.0% |
| Turkish | 3 | 0.0% |
| Ugandan | 6 | 0.0% |
| Ukrainian | 56 | 0.1% |
| Welsh | 143 | 0.3% |
| Yaqui | 2 | 0.0% |
| Yugoslavian | 49 | 0.1% | View All 106 Rows |
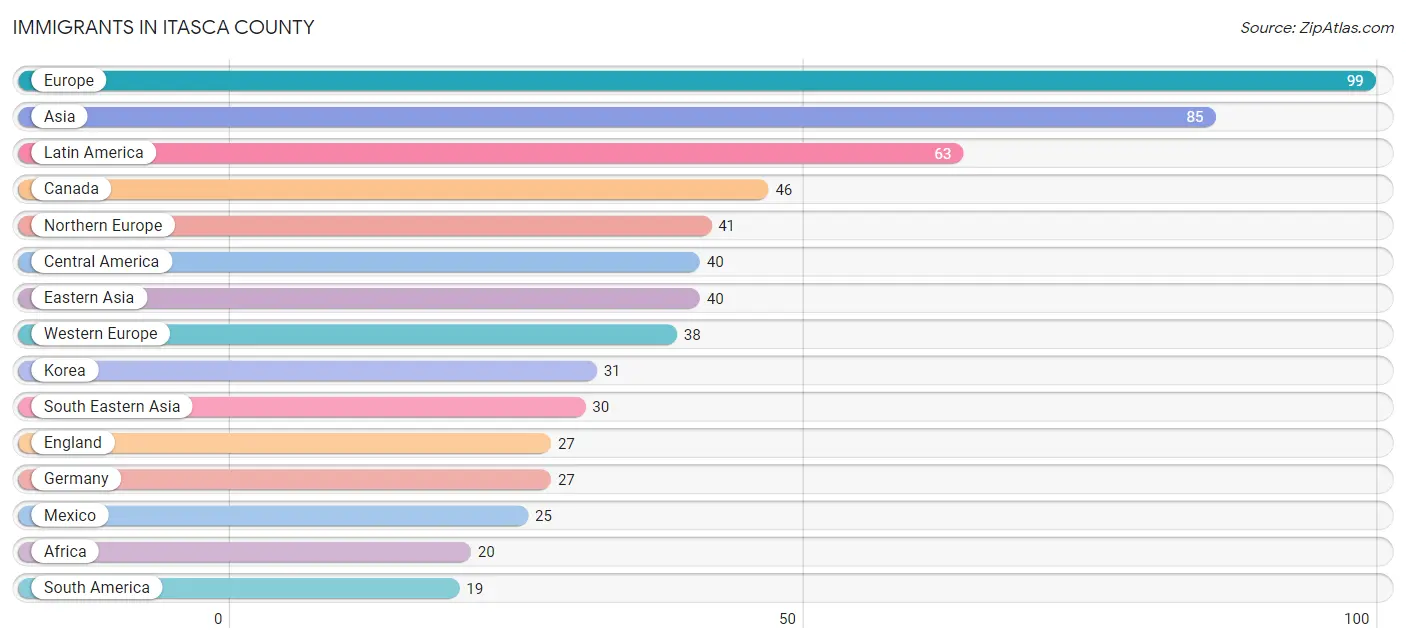
Immigrants in Itasca County
The most numerous immigrant groups reported in Itasca County came from Europe (99 | 0.2%), Asia (85 | 0.2%), Latin America (63 | 0.1%), Canada (46 | 0.1%), and Northern Europe (41 | 0.1%), together accounting for 0.7% of all Itasca County residents.
| Immigration Origin | # Population | % Population |
| Africa | 20 | 0.0% |
| Asia | 85 | 0.2% |
| Australia | 6 | 0.0% |
| Austria | 9 | 0.0% |
| Cambodia | 7 | 0.0% |
| Canada | 46 | 0.1% |
| Caribbean | 4 | 0.0% |
| Central America | 40 | 0.1% |
| Chile | 1 | 0.0% |
| China | 6 | 0.0% |
| Colombia | 12 | 0.0% |
| Costa Rica | 2 | 0.0% |
| Cuba | 4 | 0.0% |
| Eastern Africa | 11 | 0.0% |
| Eastern Asia | 40 | 0.1% |
| Eastern Europe | 18 | 0.0% |
| Ecuador | 3 | 0.0% |
| England | 27 | 0.1% |
| Eritrea | 3 | 0.0% |
| Ethiopia | 2 | 0.0% |
| Europe | 99 | 0.2% |
| Germany | 27 | 0.1% |
| Honduras | 6 | 0.0% |
| Hungary | 2 | 0.0% |
| India | 10 | 0.0% |
| Italy | 2 | 0.0% |
| Japan | 3 | 0.0% |
| Korea | 31 | 0.1% |
| Latin America | 63 | 0.1% |
| Lebanon | 2 | 0.0% |
| Mexico | 25 | 0.1% |
| Netherlands | 2 | 0.0% |
| Nicaragua | 7 | 0.0% |
| Northern Europe | 41 | 0.1% |
| Norway | 1 | 0.0% |
| Oceania | 9 | 0.0% |
| Peru | 3 | 0.0% |
| Philippines | 8 | 0.0% |
| Russia | 6 | 0.0% |
| South Africa | 9 | 0.0% |
| South America | 19 | 0.0% |
| South Central Asia | 10 | 0.0% |
| South Eastern Asia | 30 | 0.1% |
| Southern Europe | 2 | 0.0% |
| Sweden | 5 | 0.0% |
| Taiwan | 3 | 0.0% |
| Thailand | 3 | 0.0% |
| Turkey | 3 | 0.0% |
| Uganda | 6 | 0.0% |
| Ukraine | 4 | 0.0% |
| Vietnam | 12 | 0.0% |
| Western Asia | 5 | 0.0% |
| Western Europe | 38 | 0.1% | View All 53 Rows |
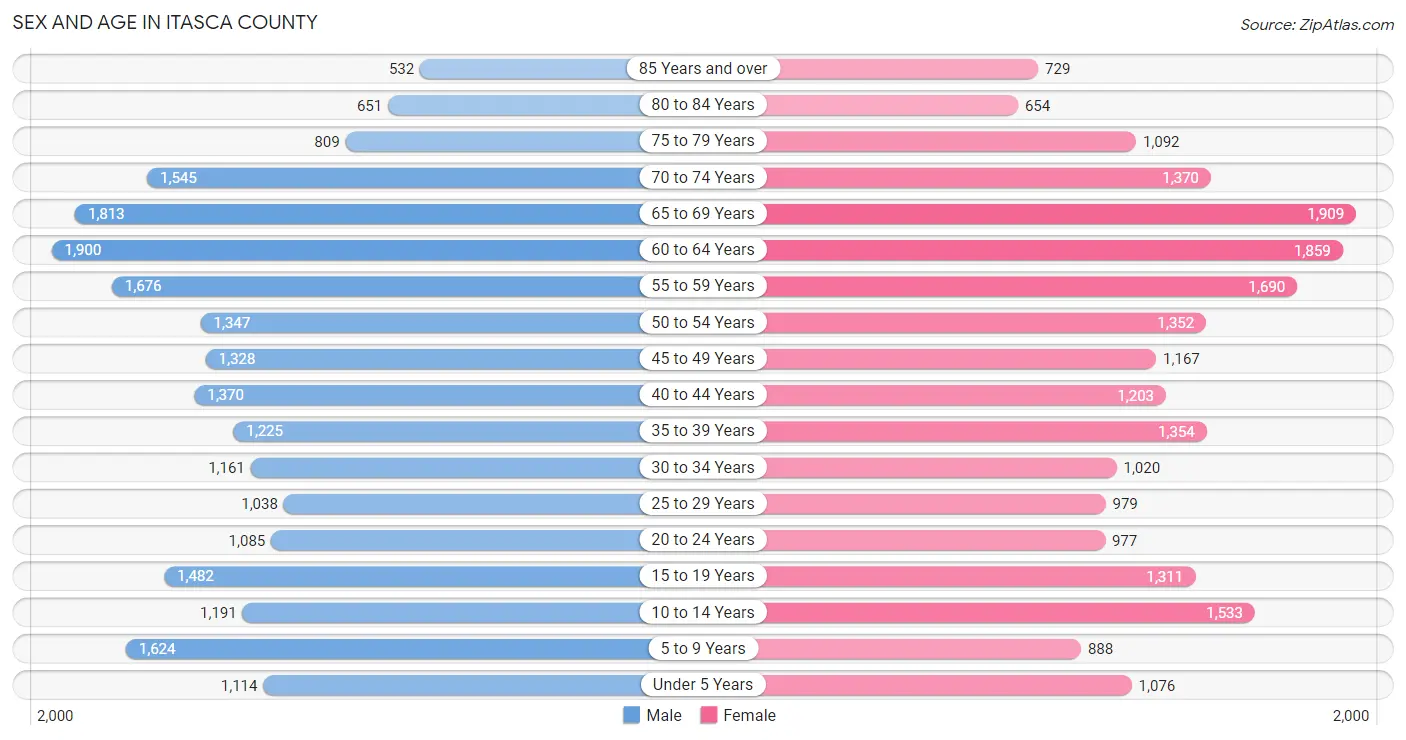
Sex and Age in Itasca County
Sex and Age in Itasca County
The most populous age groups in Itasca County are 60 to 64 Years (1,900 | 8.3%) for men and 65 to 69 Years (1,909 | 8.6%) for women.
| Age Bracket | Male | Female |
| Under 5 Years | 1,114 (4.9%) | 1,076 (4.9%) |
| 5 to 9 Years | 1,624 (7.1%) | 888 (4.0%) |
| 10 to 14 Years | 1,191 (5.2%) | 1,533 (6.9%) |
| 15 to 19 Years | 1,482 (6.5%) | 1,311 (5.9%) |
| 20 to 24 Years | 1,085 (4.7%) | 977 (4.4%) |
| 25 to 29 Years | 1,038 (4.5%) | 979 (4.4%) |
| 30 to 34 Years | 1,161 (5.1%) | 1,020 (4.6%) |
| 35 to 39 Years | 1,225 (5.3%) | 1,354 (6.1%) |
| 40 to 44 Years | 1,370 (6.0%) | 1,203 (5.4%) |
| 45 to 49 Years | 1,328 (5.8%) | 1,167 (5.3%) |
| 50 to 54 Years | 1,347 (5.9%) | 1,352 (6.1%) |
| 55 to 59 Years | 1,676 (7.3%) | 1,690 (7.6%) |
| 60 to 64 Years | 1,900 (8.3%) | 1,859 (8.4%) |
| 65 to 69 Years | 1,813 (7.9%) | 1,909 (8.6%) |
| 70 to 74 Years | 1,545 (6.8%) | 1,370 (6.2%) |
| 75 to 79 Years | 809 (3.5%) | 1,092 (4.9%) |
| 80 to 84 Years | 651 (2.8%) | 654 (2.9%) |
| 85 Years and over | 532 (2.3%) | 729 (3.3%) |
| Total | 22,891 (100.0%) | 22,163 (100.0%) |
Families and Households in Itasca County
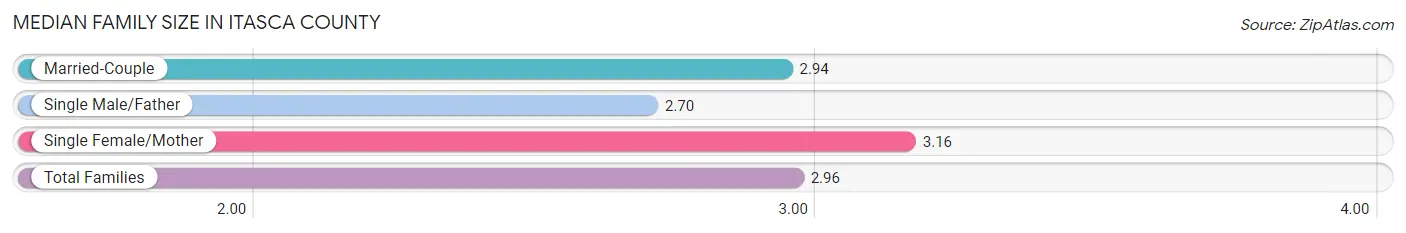
Median Family Size in Itasca County
The median family size in Itasca County is 2.96 persons per family, with single female/mother families (1,421 | 12.1%) accounting for the largest median family size of 3.16 persons per family. On the other hand, single male/father families (751 | 6.4%) represent the smallest median family size with 2.70 persons per family.
| Family Type | # Families | Family Size |
| Married-Couple | 9,545 (81.5%) | 2.94 |
| Single Male/Father | 751 (6.4%) | 2.70 |
| Single Female/Mother | 1,421 (12.1%) | 3.16 |
| Total Families | 11,717 (100.0%) | 2.96 |
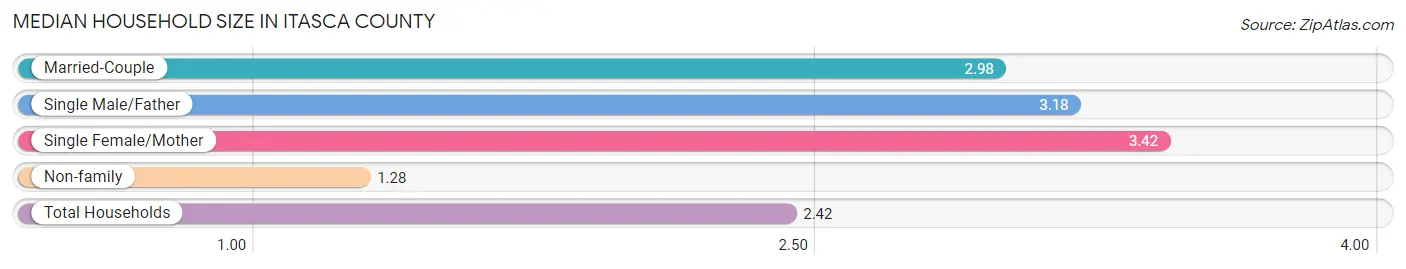
Median Household Size in Itasca County
The median household size in Itasca County is 2.42 persons per household, with single female/mother households (1,421 | 7.8%) accounting for the largest median household size of 3.42 persons per household. non-family households (6,404 | 35.3%) represent the smallest median household size with 1.28 persons per household.
| Household Type | # Households | Household Size |
| Married-Couple | 9,545 (52.7%) | 2.98 |
| Single Male/Father | 751 (4.1%) | 3.18 |
| Single Female/Mother | 1,421 (7.8%) | 3.42 |
| Non-family | 6,404 (35.3%) | 1.28 |
| Total Households | 18,121 (100.0%) | 2.42 |
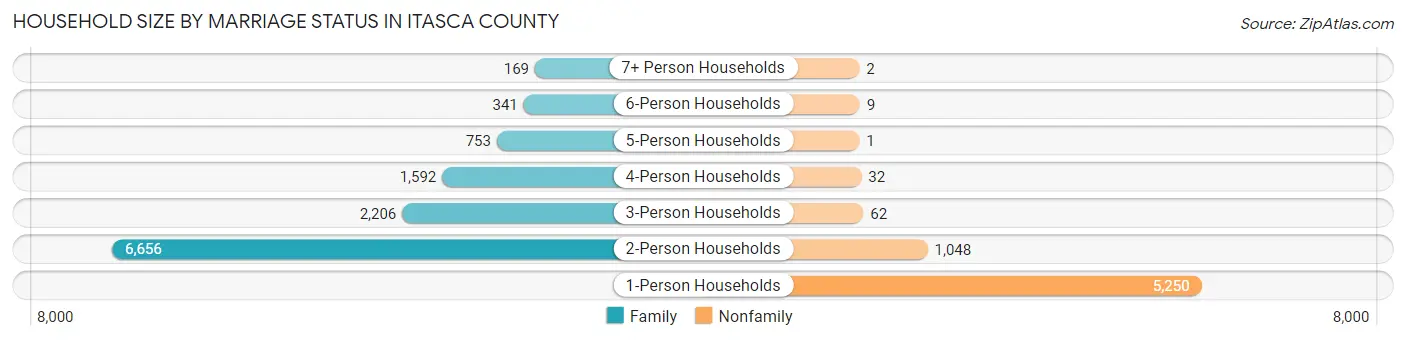
Household Size by Marriage Status in Itasca County
Out of a total of 18,121 households in Itasca County, 11,717 (64.7%) are family households, while 6,404 (35.3%) are nonfamily households. The most numerous type of family households are 2-person households, comprising 6,656, and the most common type of nonfamily households are 1-person households, comprising 5,250.
| Household Size | Family Households | Nonfamily Households |
| 1-Person Households | - | 5,250 (29.0%) |
| 2-Person Households | 6,656 (36.7%) | 1,048 (5.8%) |
| 3-Person Households | 2,206 (12.2%) | 62 (0.3%) |
| 4-Person Households | 1,592 (8.8%) | 32 (0.2%) |
| 5-Person Households | 753 (4.2%) | 1 (0.0%) |
| 6-Person Households | 341 (1.9%) | 9 (0.1%) |
| 7+ Person Households | 169 (0.9%) | 2 (0.0%) |
| Total | 11,717 (64.7%) | 6,404 (35.3%) |
Female Fertility in Itasca County
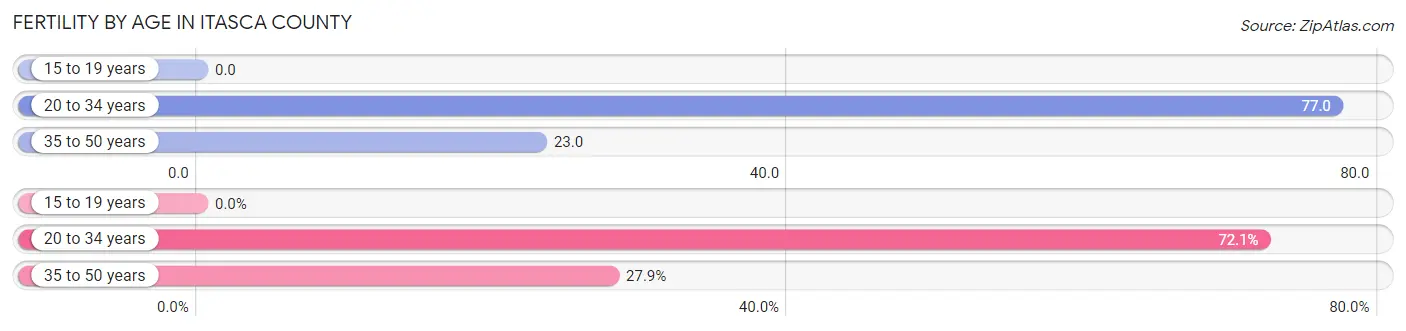
Fertility by Age in Itasca County
Average fertility rate in Itasca County is 39.0 births per 1,000 women. Women in the age bracket of 20 to 34 years have the highest fertility rate with 77.0 births per 1,000 women. Women in the age bracket of 20 to 34 years acount for 72.1% of all women with births.
| Age Bracket | Women with Births | Births / 1,000 Women |
| 15 to 19 years | 0 (0.0%) | 0.0 |
| 20 to 34 years | 230 (72.1%) | 77.0 |
| 35 to 50 years | 89 (27.9%) | 23.0 |
| Total | 319 (100.0%) | 39.0 |
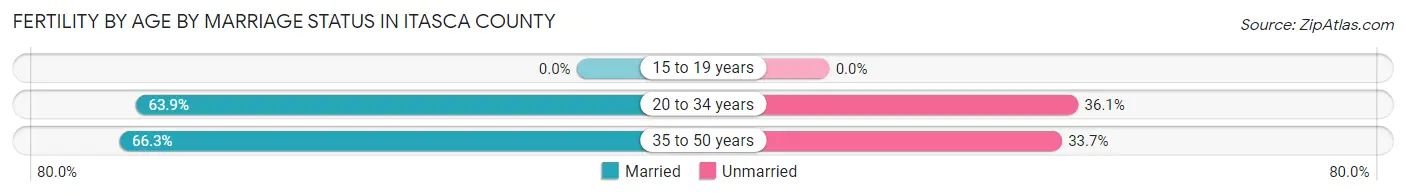
Fertility by Age by Marriage Status in Itasca County
64.6% of women with births (319) in Itasca County are married. The highest percentage of unmarried women with births falls into 20 to 34 years age bracket with 36.1% of them unmarried at the time of birth, while the lowest percentage of unmarried women with births belong to 35 to 50 years age bracket with 33.7% of them unmarried.
| Age Bracket | Married | Unmarried |
| 15 to 19 years | 0 (0.0%) | 0 (0.0%) |
| 20 to 34 years | 147 (63.9%) | 83 (36.1%) |
| 35 to 50 years | 59 (66.3%) | 30 (33.7%) |
| Total | 206 (64.6%) | 113 (35.4%) |
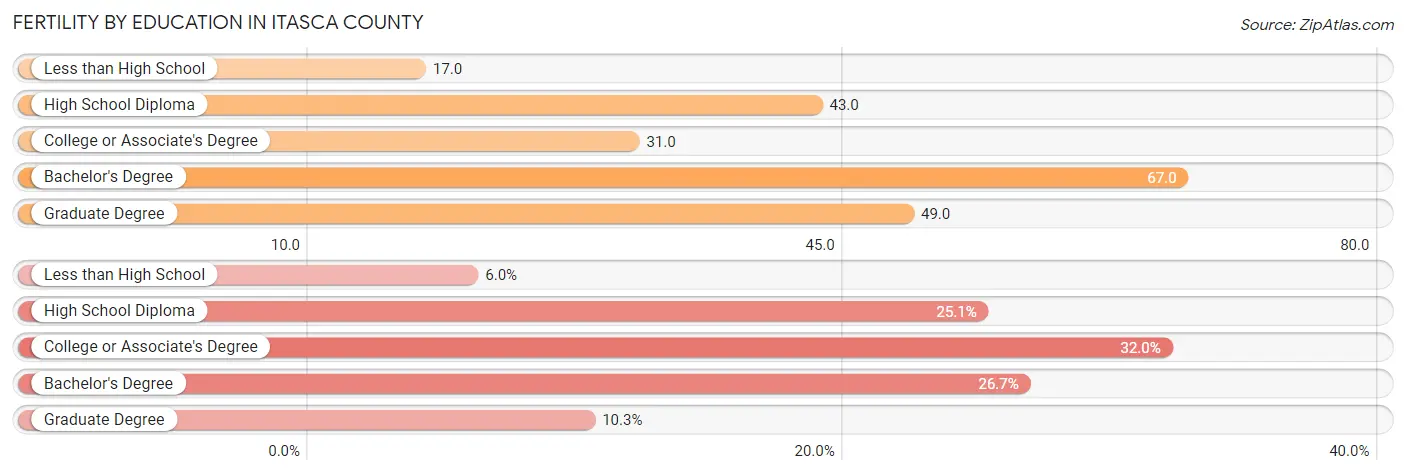
Fertility by Education in Itasca County
Average fertility rate in Itasca County is 39.0 births per 1,000 women. Women with the education attainment of bachelor's degree have the highest fertility rate of 67.0 births per 1,000 women, while women with the education attainment of less than high school have the lowest fertility at 17.0 births per 1,000 women. Women with the education attainment of college or associate's degree represent 32.0% of all women with births.
| Educational Attainment | Women with Births | Births / 1,000 Women |
| Less than High School | 19 (6.0%) | 17.0 |
| High School Diploma | 80 (25.1%) | 43.0 |
| College or Associate's Degree | 102 (32.0%) | 31.0 |
| Bachelor's Degree | 85 (26.7%) | 67.0 |
| Graduate Degree | 33 (10.3%) | 49.0 |
| Total | 319 (100.0%) | 39.0 |
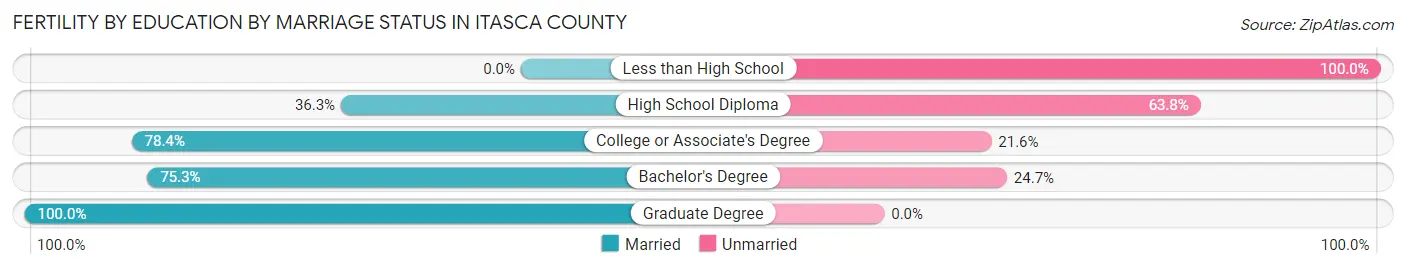
Fertility by Education by Marriage Status in Itasca County
35.4% of women with births in Itasca County are unmarried. Women with the educational attainment of graduate degree are most likely to be married with 100.0% of them married at childbirth, while women with the educational attainment of less than high school are least likely to be married with 100.0% of them unmarried at childbirth.
| Educational Attainment | Married | Unmarried |
| Less than High School | 0 (0.0%) | 19 (100.0%) |
| High School Diploma | 29 (36.2%) | 51 (63.7%) |
| College or Associate's Degree | 80 (78.4%) | 22 (21.6%) |
| Bachelor's Degree | 64 (75.3%) | 21 (24.7%) |
| Graduate Degree | 33 (100.0%) | 0 (0.0%) |
| Total | 206 (64.6%) | 113 (35.4%) |
Income in Itasca County
Income Overview in Itasca County
Per Capita Income in Itasca County is $34,528, while median incomes of families and households are $82,653 and $63,962 respectively.
| Characteristic | Number | Measure |
| Per Capita Income | 45,054 | $34,528 |
| Median Family Income | 11,717 | $82,653 |
| Mean Family Income | 11,717 | $99,987 |
| Median Household Income | 18,121 | $63,962 |
| Mean Household Income | 18,121 | $82,091 |
| Income Deficit | 11,717 | $9,871 |
| Wage / Income Gap (%) | 45,054 | 34.33% |
| Wage / Income Gap ($) | 45,054 | 65.67¢ per $1 |
| Gini / Inequality Index | 45,054 | 0.43 |
Earnings by Sex in Itasca County
Average Earnings in Itasca County are $36,864, $47,003 for men and $30,867 for women, a difference of 34.3%.
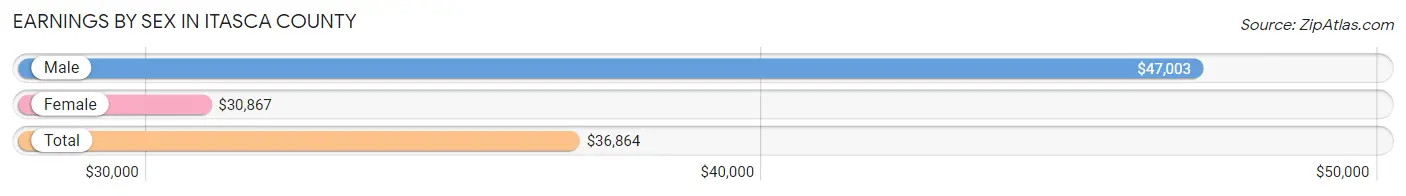
| Sex | Number | Average Earnings |
| Male | 11,675 (52.9%) | $47,003 |
| Female | 10,380 (47.1%) | $30,867 |
| Total | 22,055 (100.0%) | $36,864 |
Earnings by Sex by Income Bracket in Itasca County
The most common earnings brackets in Itasca County are $100,000+ for men (1,633 | 14.0%) and $75,000 to $99,999 for women (863 | 8.3%).
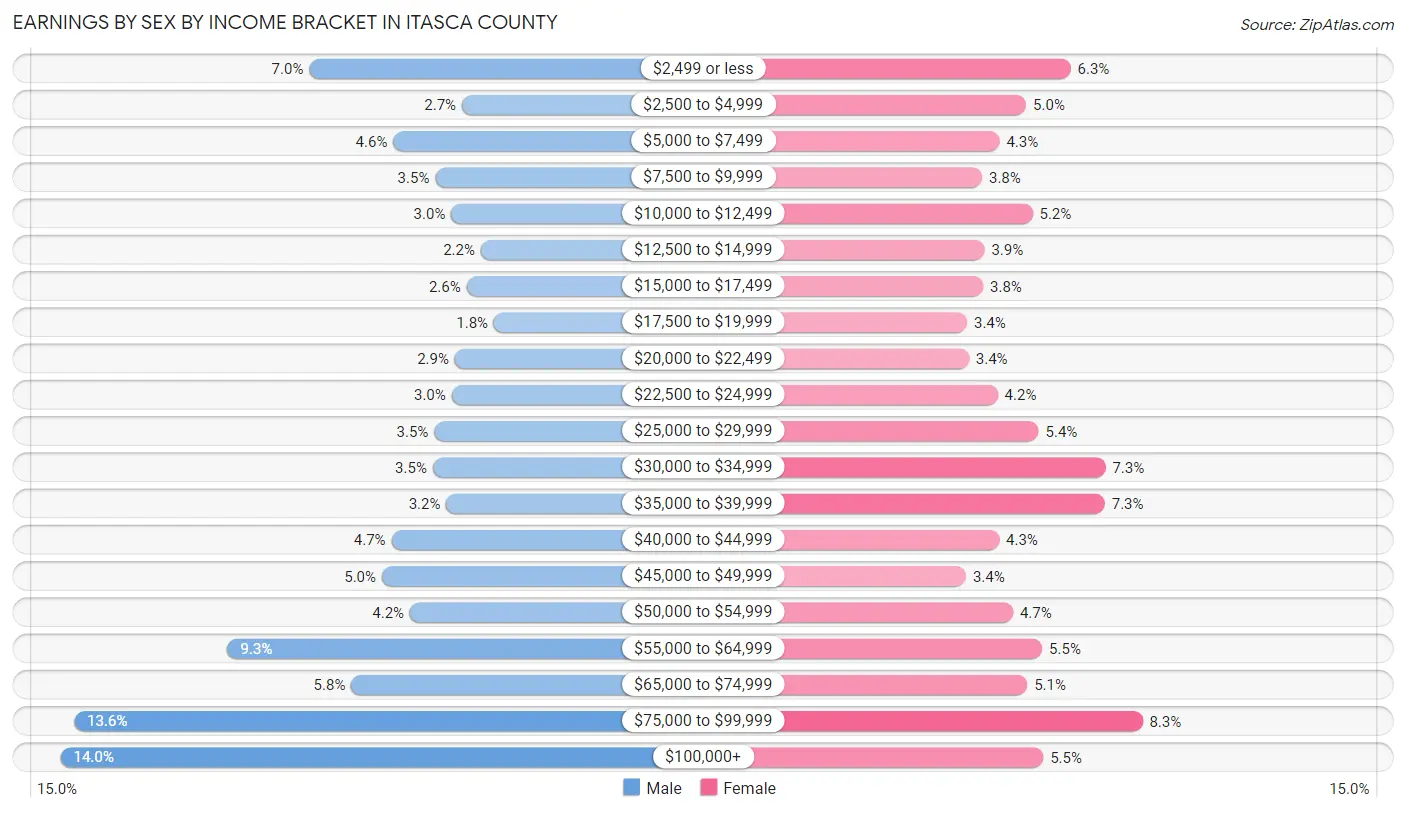
| Income | Male | Female |
| $2,499 or less | 817 (7.0%) | 653 (6.3%) |
| $2,500 to $4,999 | 316 (2.7%) | 523 (5.0%) |
| $5,000 to $7,499 | 542 (4.6%) | 445 (4.3%) |
| $7,500 to $9,999 | 404 (3.5%) | 394 (3.8%) |
| $10,000 to $12,499 | 352 (3.0%) | 542 (5.2%) |
| $12,500 to $14,999 | 254 (2.2%) | 402 (3.9%) |
| $15,000 to $17,499 | 301 (2.6%) | 398 (3.8%) |
| $17,500 to $19,999 | 211 (1.8%) | 351 (3.4%) |
| $20,000 to $22,499 | 340 (2.9%) | 356 (3.4%) |
| $22,500 to $24,999 | 350 (3.0%) | 440 (4.2%) |
| $25,000 to $29,999 | 408 (3.5%) | 559 (5.4%) |
| $30,000 to $34,999 | 412 (3.5%) | 755 (7.3%) |
| $35,000 to $39,999 | 368 (3.2%) | 753 (7.2%) |
| $40,000 to $44,999 | 547 (4.7%) | 444 (4.3%) |
| $45,000 to $49,999 | 579 (5.0%) | 348 (3.4%) |
| $50,000 to $54,999 | 487 (4.2%) | 485 (4.7%) |
| $55,000 to $64,999 | 1,086 (9.3%) | 570 (5.5%) |
| $65,000 to $74,999 | 679 (5.8%) | 526 (5.1%) |
| $75,000 to $99,999 | 1,589 (13.6%) | 863 (8.3%) |
| $100,000+ | 1,633 (14.0%) | 573 (5.5%) |
| Total | 11,675 (100.0%) | 10,380 (100.0%) |
Earnings by Sex by Educational Attainment in Itasca County
Average earnings in Itasca County are $53,113 for men and $35,221 for women, a difference of 33.7%. Men with an educational attainment of bachelor's degree enjoy the highest average annual earnings of $65,962, while those with less than high school education earn the least with $20,972. Women with an educational attainment of graduate degree earn the most with the average annual earnings of $78,224, while those with less than high school education have the smallest earnings of $15,230.
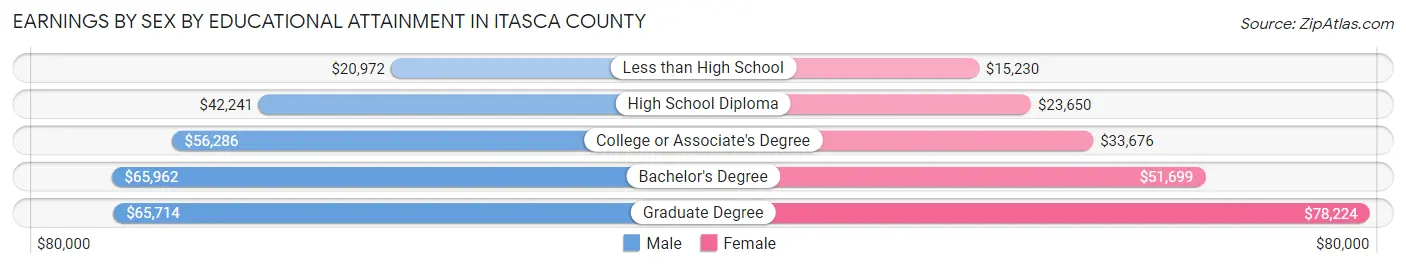
| Educational Attainment | Male Income | Female Income |
| Less than High School | $20,972 | $15,230 |
| High School Diploma | $42,241 | $23,650 |
| College or Associate's Degree | $56,286 | $33,676 |
| Bachelor's Degree | $65,962 | $51,699 |
| Graduate Degree | $65,714 | $78,224 |
| Total | $53,113 | $35,221 |
Family Income in Itasca County
Family Income Brackets in Itasca County
According to the Itasca County family income data, there are 2,613 families falling into the $100,000 to $149,999 income range, which is the most common income bracket and makes up 22.3% of all families. Conversely, the $10,000 to $14,999 income bracket is the least frequent group with only 234 families (2.0%) belonging to this category.
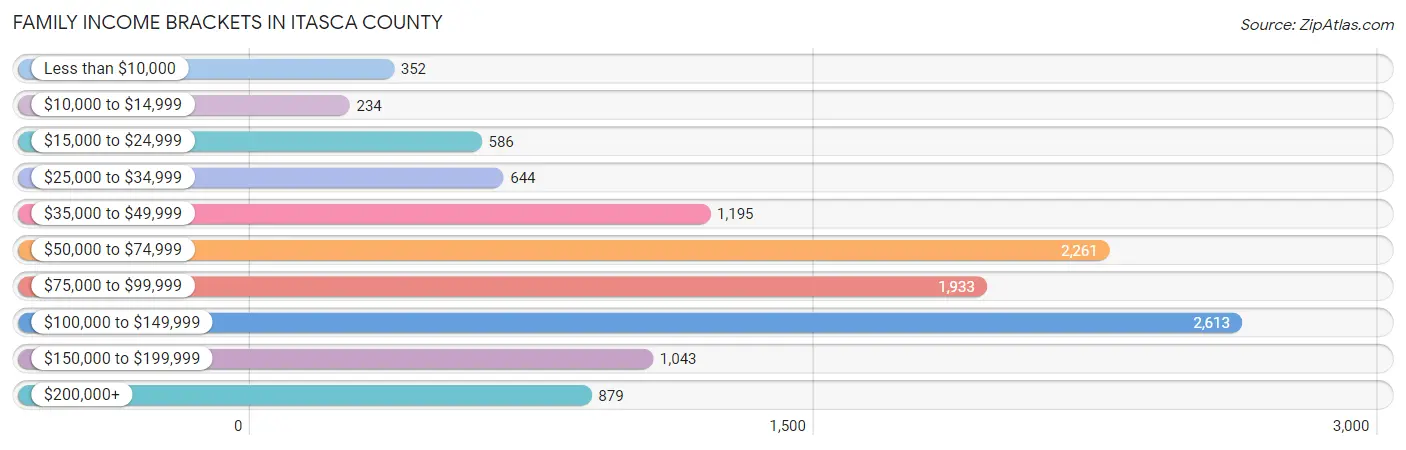
| Income Bracket | # Families | % Families |
| Less than $10,000 | 352 | 3.0% |
| $10,000 to $14,999 | 234 | 2.0% |
| $15,000 to $24,999 | 586 | 5.0% |
| $25,000 to $34,999 | 644 | 5.5% |
| $35,000 to $49,999 | 1,195 | 10.2% |
| $50,000 to $74,999 | 2,261 | 19.3% |
| $75,000 to $99,999 | 1,933 | 16.5% |
| $100,000 to $149,999 | 2,613 | 22.3% |
| $150,000 to $199,999 | 1,043 | 8.9% |
| $200,000+ | 879 | 7.5% |
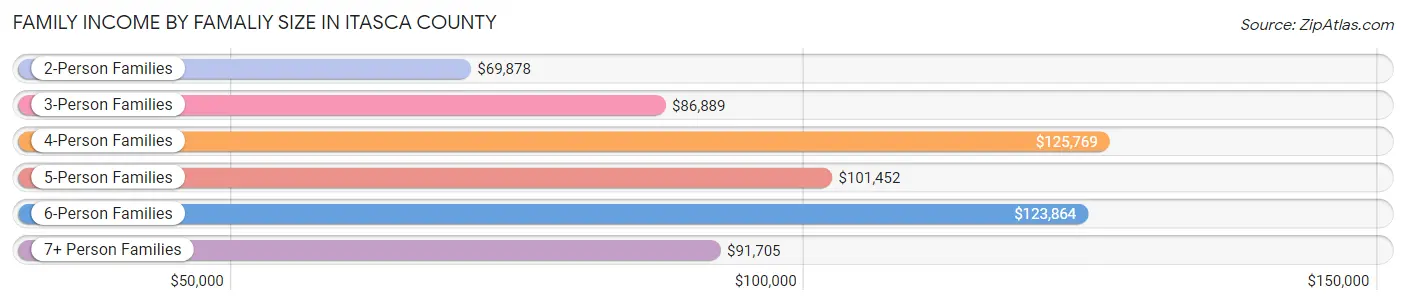
Family Income by Famaliy Size in Itasca County
4-person families (1,454 | 12.4%) account for the highest median family income in Itasca County with $125,769 per family, while 2-person families (6,990 | 59.7%) have the highest median income of $34,939 per family member.
| Income Bracket | # Families | Median Income |
| 2-Person Families | 6,990 (59.7%) | $69,878 |
| 3-Person Families | 2,142 (18.3%) | $86,889 |
| 4-Person Families | 1,454 (12.4%) | $125,769 |
| 5-Person Families | 734 (6.3%) | $101,452 |
| 6-Person Families | 256 (2.2%) | $123,864 |
| 7+ Person Families | 141 (1.2%) | $91,705 |
| Total | 11,717 (100.0%) | $82,653 |
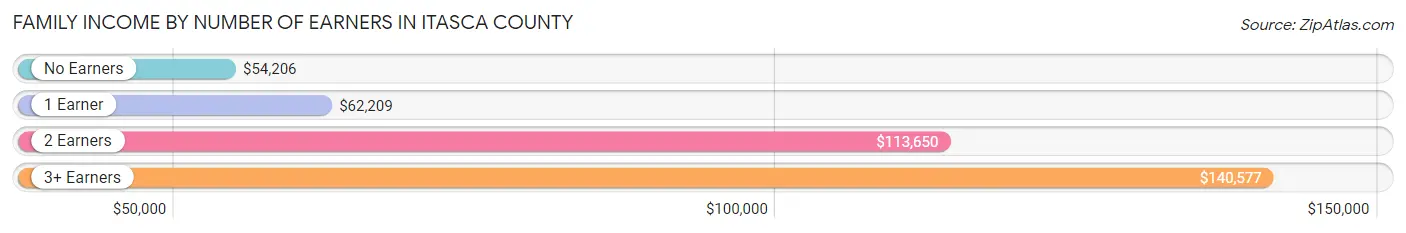
Family Income by Number of Earners in Itasca County
The median family income in Itasca County is $82,653, with families comprising 3+ earners (1,080) having the highest median family income of $140,577, while families with no earners (2,975) have the lowest median family income of $54,206, accounting for 9.2% and 25.4% of families, respectively.
| Number of Earners | # Families | Median Income |
| No Earners | 2,975 (25.4%) | $54,206 |
| 1 Earner | 3,160 (27.0%) | $62,209 |
| 2 Earners | 4,502 (38.4%) | $113,650 |
| 3+ Earners | 1,080 (9.2%) | $140,577 |
| Total | 11,717 (100.0%) | $82,653 |
Household Income in Itasca County
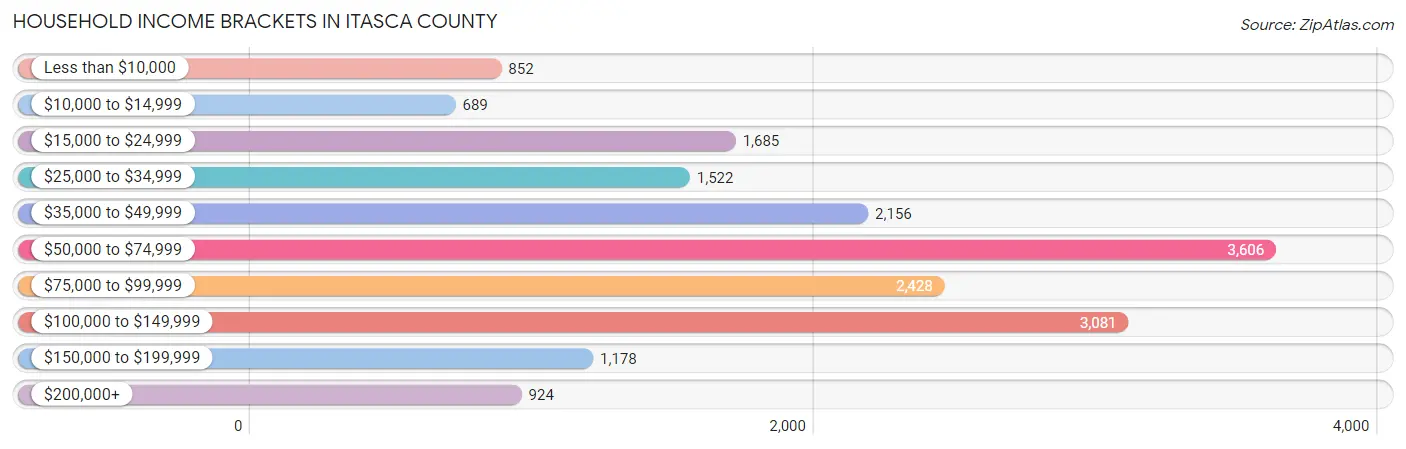
Household Income Brackets in Itasca County
With 3,606 households falling in the category, the $50,000 to $74,999 income range is the most frequent in Itasca County, accounting for 19.9% of all households. In contrast, only 689 households (3.8%) fall into the $10,000 to $14,999 income bracket, making it the least populous group.
| Income Bracket | # Households | % Households |
| Less than $10,000 | 852 | 4.7% |
| $10,000 to $14,999 | 689 | 3.8% |
| $15,000 to $24,999 | 1,685 | 9.3% |
| $25,000 to $34,999 | 1,522 | 8.4% |
| $35,000 to $49,999 | 2,156 | 11.9% |
| $50,000 to $74,999 | 3,606 | 19.9% |
| $75,000 to $99,999 | 2,428 | 13.4% |
| $100,000 to $149,999 | 3,081 | 17.0% |
| $150,000 to $199,999 | 1,178 | 6.5% |
| $200,000+ | 924 | 5.1% |
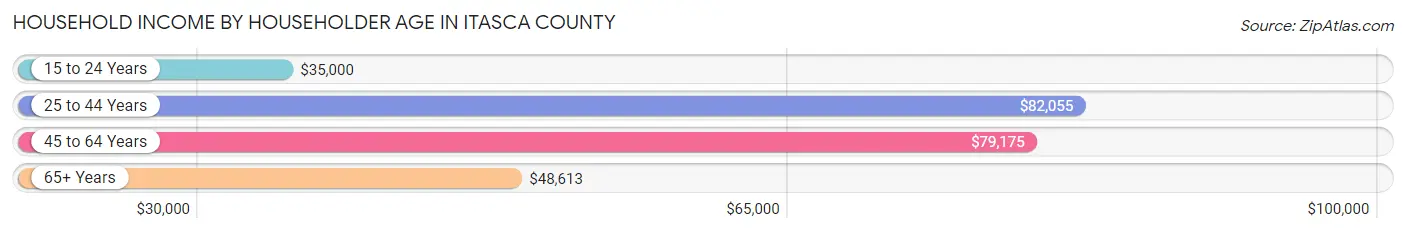
Household Income by Householder Age in Itasca County
The median household income in Itasca County is $63,962, with the highest median household income of $82,055 found in the 25 to 44 years age bracket for the primary householder. A total of 4,311 households (23.8%) fall into this category. Meanwhile, the 15 to 24 years age bracket for the primary householder has the lowest median household income of $35,000, with 360 households (2.0%) in this group.
| Income Bracket | # Households | Median Income |
| 15 to 24 Years | 360 (2.0%) | $35,000 |
| 25 to 44 Years | 4,311 (23.8%) | $82,055 |
| 45 to 64 Years | 6,698 (37.0%) | $79,175 |
| 65+ Years | 6,752 (37.3%) | $48,613 |
| Total | 18,121 (100.0%) | $63,962 |
Poverty in Itasca County
Income Below Poverty by Sex and Age in Itasca County
With 10.4% poverty level for males and 13.2% for females among the residents of Itasca County, 15 year old males and under 5 year old females are the most vulnerable to poverty, with 82 males (27.8%) and 315 females (29.6%) in their respective age groups living below the poverty level.
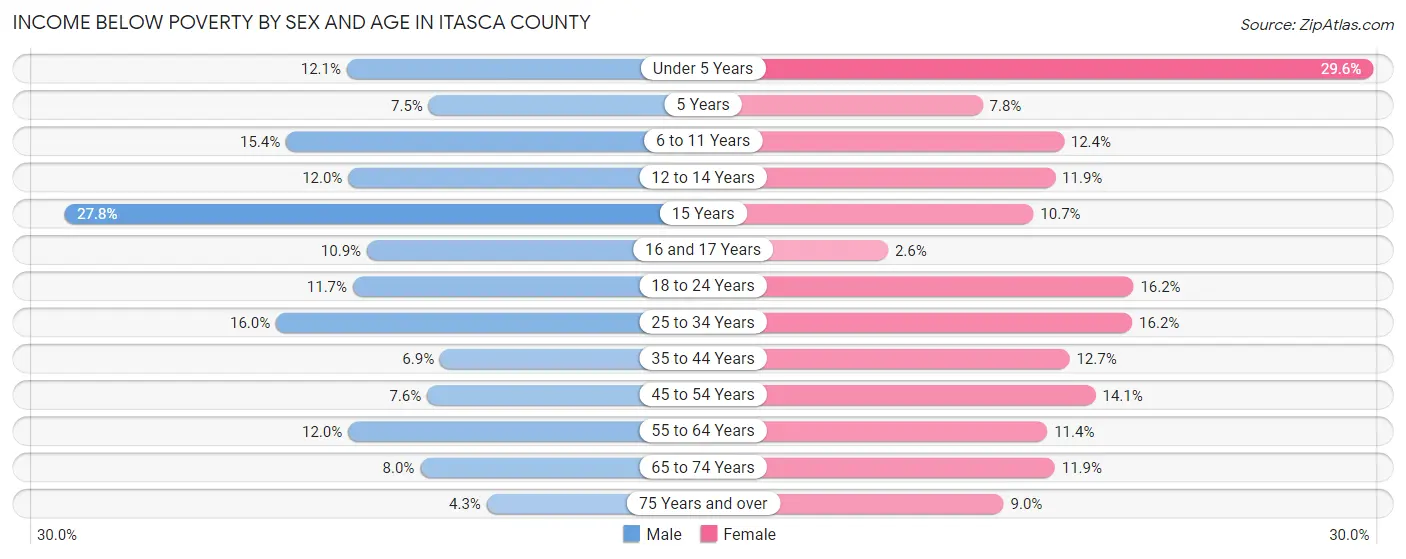
| Age Bracket | Male | Female |
| Under 5 Years | 128 (12.1%) | 315 (29.6%) |
| 5 Years | 21 (7.5%) | 8 (7.8%) |
| 6 to 11 Years | 278 (15.4%) | 144 (12.4%) |
| 12 to 14 Years | 78 (12.0%) | 111 (11.9%) |
| 15 Years | 82 (27.8%) | 38 (10.7%) |
| 16 and 17 Years | 58 (10.9%) | 13 (2.6%) |
| 18 to 24 Years | 191 (11.7%) | 223 (16.2%) |
| 25 to 34 Years | 343 (16.0%) | 321 (16.2%) |
| 35 to 44 Years | 176 (6.9%) | 324 (12.7%) |
| 45 to 54 Years | 202 (7.6%) | 352 (14.1%) |
| 55 to 64 Years | 422 (12.0%) | 398 (11.4%) |
| 65 to 74 Years | 263 (8.0%) | 387 (11.9%) |
| 75 Years and over | 82 (4.3%) | 203 (9.0%) |
| Total | 2,324 (10.4%) | 2,837 (13.2%) |
Income Above Poverty by Sex and Age in Itasca County
According to the poverty statistics in Itasca County, males aged 75 years and over and females aged 16 and 17 years are the age groups that are most secure financially, with 95.7% of males and 97.4% of females in these age groups living above the poverty line.
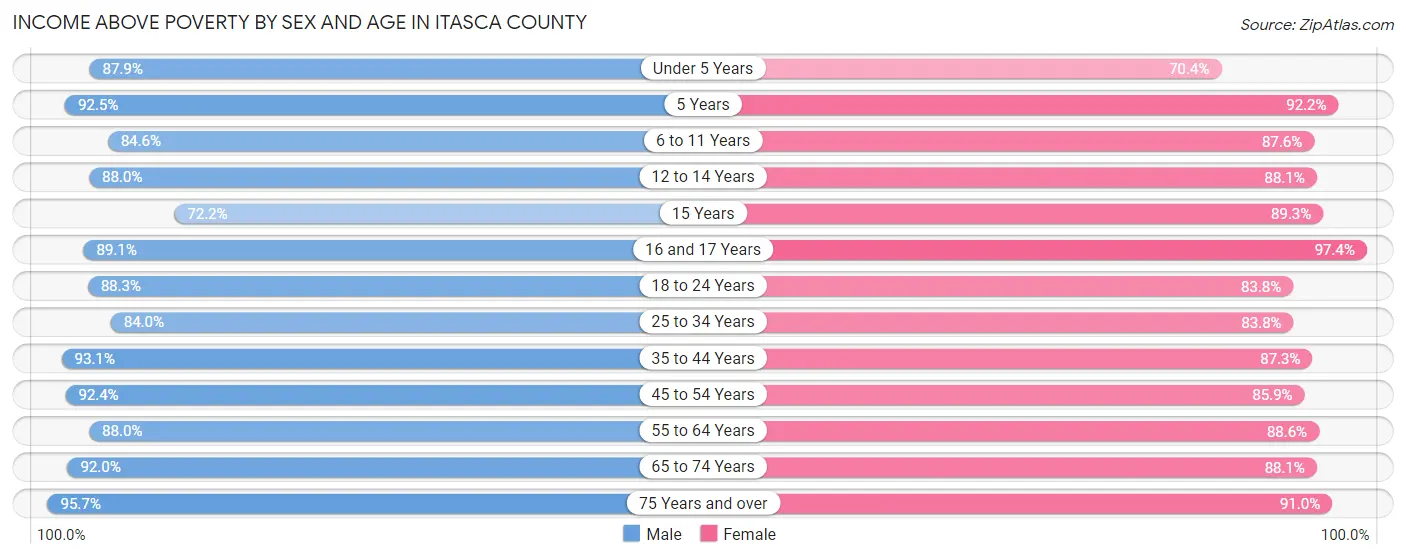
| Age Bracket | Male | Female |
| Under 5 Years | 933 (87.9%) | 750 (70.4%) |
| 5 Years | 259 (92.5%) | 94 (92.2%) |
| 6 to 11 Years | 1,523 (84.6%) | 1,021 (87.6%) |
| 12 to 14 Years | 573 (88.0%) | 823 (88.1%) |
| 15 Years | 213 (72.2%) | 318 (89.3%) |
| 16 and 17 Years | 472 (89.1%) | 492 (97.4%) |
| 18 to 24 Years | 1,438 (88.3%) | 1,150 (83.8%) |
| 25 to 34 Years | 1,801 (84.0%) | 1,664 (83.8%) |
| 35 to 44 Years | 2,385 (93.1%) | 2,232 (87.3%) |
| 45 to 54 Years | 2,458 (92.4%) | 2,140 (85.9%) |
| 55 to 64 Years | 3,098 (88.0%) | 3,082 (88.6%) |
| 65 to 74 Years | 3,038 (92.0%) | 2,876 (88.1%) |
| 75 Years and over | 1,839 (95.7%) | 2,050 (91.0%) |
| Total | 20,030 (89.6%) | 18,692 (86.8%) |
Income Below Poverty Among Married-Couple Families in Itasca County
The poverty statistics for married-couple families in Itasca County show that 3.9% or 372 of the total 9,545 families live below the poverty line. Families with 3 or 4 children have the highest poverty rate of 10.3%, comprising of 70 families. On the other hand, families with 1 or 2 children have the lowest poverty rate of 1.6%, which includes 34 families.
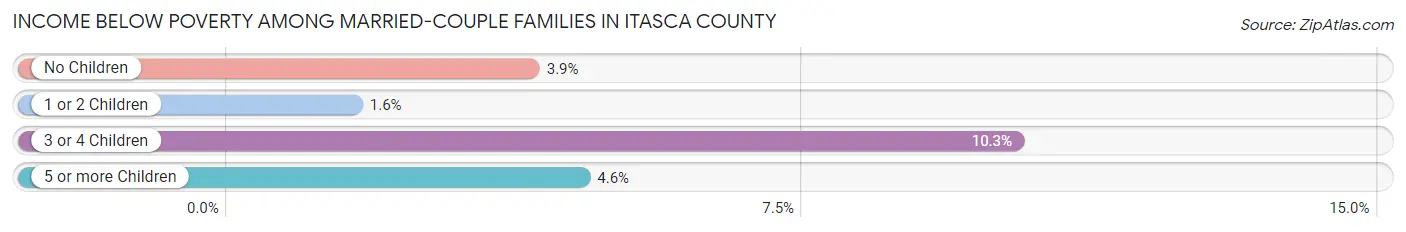
| Children | Above Poverty | Below Poverty |
| No Children | 6,431 (96.1%) | 264 (3.9%) |
| 1 or 2 Children | 2,047 (98.4%) | 34 (1.6%) |
| 3 or 4 Children | 612 (89.7%) | 70 (10.3%) |
| 5 or more Children | 83 (95.4%) | 4 (4.6%) |
| Total | 9,173 (96.1%) | 372 (3.9%) |
Income Below Poverty Among Single-Parent Households in Itasca County
According to the poverty data in Itasca County, 14.4% or 108 single-father households and 31.9% or 453 single-mother households are living below the poverty line. Among single-father households, those with 3 or 4 children have the highest poverty rate, with 10 households (27.8%) experiencing poverty. Likewise, among single-mother households, those with 3 or 4 children have the highest poverty rate, with 105 households (71.0%) falling below the poverty line.
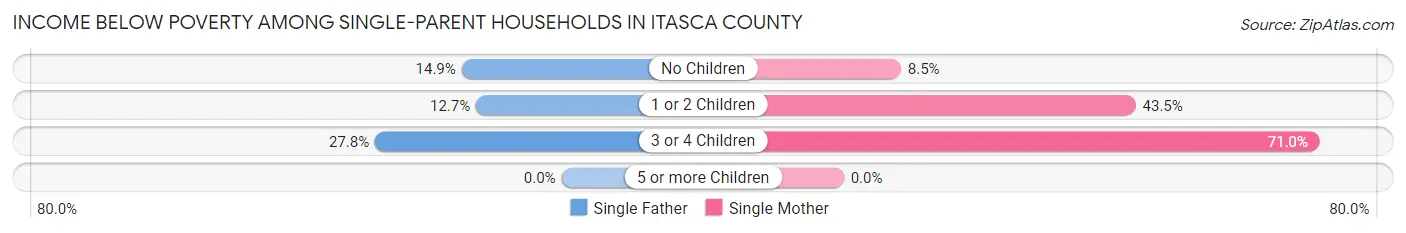
| Children | Single Father | Single Mother |
| No Children | 50 (14.9%) | 50 (8.5%) |
| 1 or 2 Children | 48 (12.7%) | 298 (43.5%) |
| 3 or 4 Children | 10 (27.8%) | 105 (71.0%) |
| 5 or more Children | 0 (0.0%) | 0 (0.0%) |
| Total | 108 (14.4%) | 453 (31.9%) |
Income Below Poverty Among Married-Couple vs Single-Parent Households in Itasca County
The poverty data for Itasca County shows that 372 of the married-couple family households (3.9%) and 561 of the single-parent households (25.8%) are living below the poverty level. Within the married-couple family households, those with 3 or 4 children have the highest poverty rate, with 70 households (10.3%) falling below the poverty line. Among the single-parent households, those with 3 or 4 children have the highest poverty rate, with 115 household (62.5%) living below poverty.
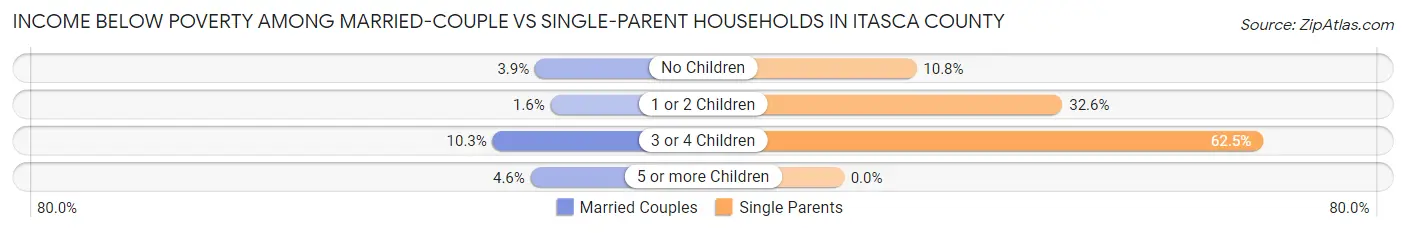
| Children | Married-Couple Families | Single-Parent Households |
| No Children | 264 (3.9%) | 100 (10.8%) |
| 1 or 2 Children | 34 (1.6%) | 346 (32.6%) |
| 3 or 4 Children | 70 (10.3%) | 115 (62.5%) |
| 5 or more Children | 4 (4.6%) | 0 (0.0%) |
| Total | 372 (3.9%) | 561 (25.8%) |
Employment Characteristics in Itasca County
Employment by Class of Employer in Itasca County
Among the 18,780 employed individuals in Itasca County, private company employees (11,843 | 63.1%), not-for-profit organizations (2,029 | 10.8%), and local government employees (1,734 | 9.2%) make up the most common classes of employment.
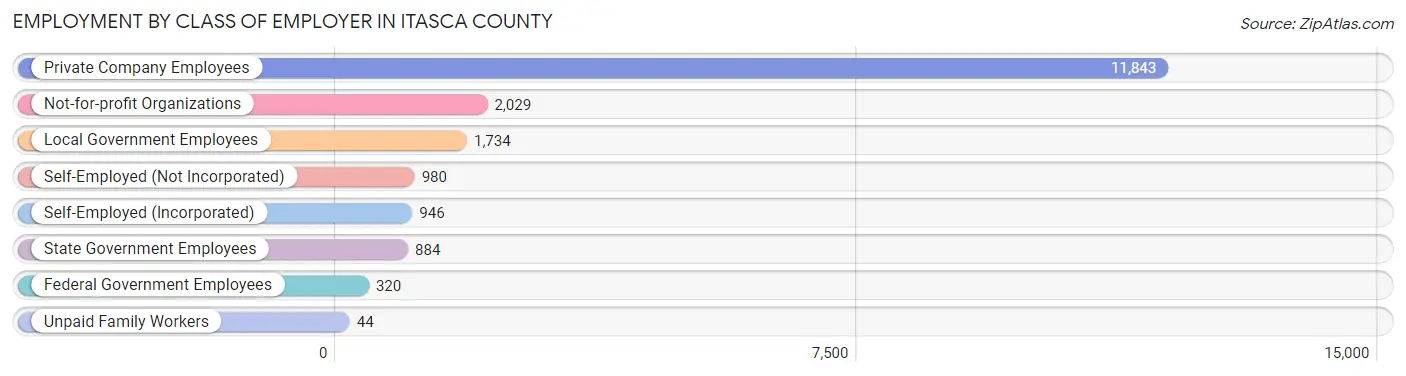
| Employer Class | # Employees | % Employees |
| Private Company Employees | 11,843 | 63.1% |
| Self-Employed (Incorporated) | 946 | 5.0% |
| Self-Employed (Not Incorporated) | 980 | 5.2% |
| Not-for-profit Organizations | 2,029 | 10.8% |
| Local Government Employees | 1,734 | 9.2% |
| State Government Employees | 884 | 4.7% |
| Federal Government Employees | 320 | 1.7% |
| Unpaid Family Workers | 44 | 0.2% |
| Total | 18,780 | 100.0% |
Employment Status by Age in Itasca County
According to the labor force statistics for Itasca County, out of the total population over 16 years of age (36,952), 55.5% or 20,508 individuals are in the labor force, with 6.2% or 1,271 of them unemployed. The age group with the highest labor force participation rate is 35 to 44 years, with 86.5% or 4,456 individuals in the labor force. Within the labor force, the 20 to 24 years age range has the highest percentage of unemployed individuals, with 15.7% or 263 of them being unemployed.
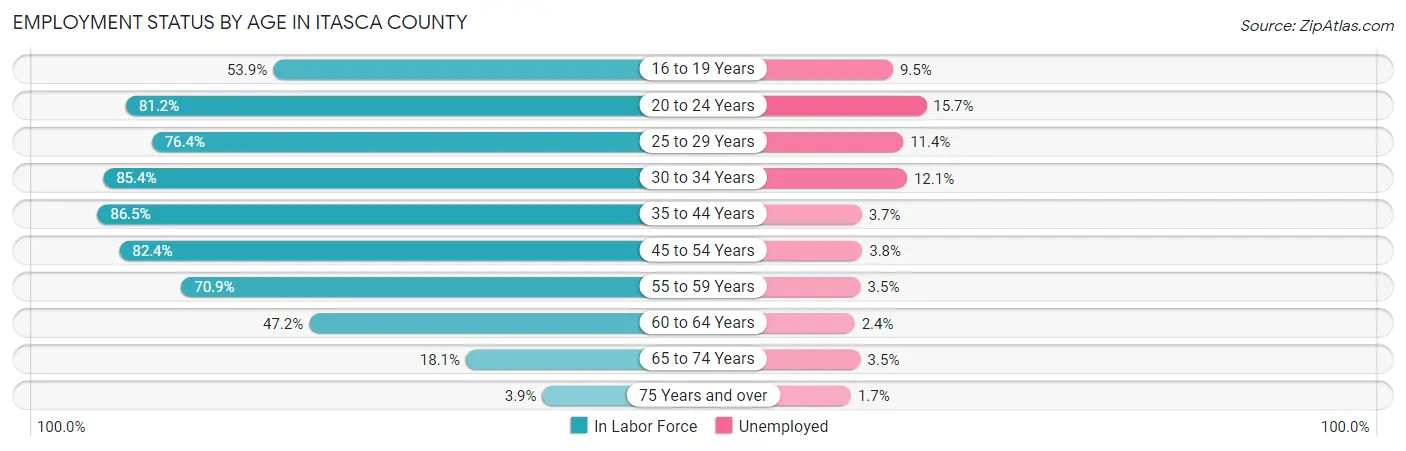
| Age Bracket | In Labor Force | Unemployed |
| 16 to 19 Years | 1,141 (53.9%) | 108 (9.5%) |
| 20 to 24 Years | 1,674 (81.2%) | 263 (15.7%) |
| 25 to 29 Years | 1,541 (76.4%) | 176 (11.4%) |
| 30 to 34 Years | 1,863 (85.4%) | 225 (12.1%) |
| 35 to 44 Years | 4,456 (86.5%) | 165 (3.7%) |
| 45 to 54 Years | 4,280 (82.4%) | 163 (3.8%) |
| 55 to 59 Years | 2,386 (70.9%) | 84 (3.5%) |
| 60 to 64 Years | 1,774 (47.2%) | 43 (2.4%) |
| 65 to 74 Years | 1,201 (18.1%) | 42 (3.5%) |
| 75 Years and over | 174 (3.9%) | 3 (1.7%) |
| Total | 20,508 (55.5%) | 1,271 (6.2%) |
Employment Status by Educational Attainment in Itasca County
According to labor force statistics for Itasca County, 75.2% of individuals (16,295) out of the total population between 25 and 64 years of age (21,669) are in the labor force, with 5.2% or 847 of them being unemployed. The group with the highest labor force participation rate are those with the educational attainment of bachelor's degree or higher, with 87.0% or 4,780 individuals in the labor force. Within the labor force, individuals with less than high school education have the highest percentage of unemployment, with 17.9% or 121 of them being unemployed.
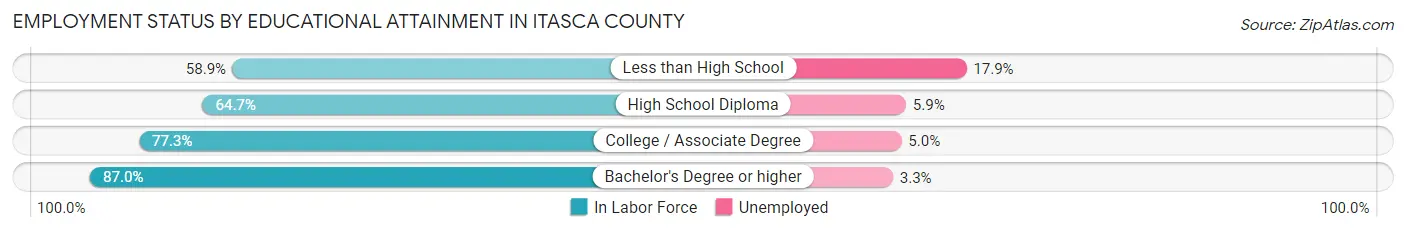
| Educational Attainment | In Labor Force | Unemployed |
| Less than High School | 677 (58.9%) | 206 (17.9%) |
| High School Diploma | 3,954 (64.7%) | 361 (5.9%) |
| College / Associate Degree | 6,891 (77.3%) | 446 (5.0%) |
| Bachelor's Degree or higher | 4,780 (87.0%) | 181 (3.3%) |
| Total | 16,295 (75.2%) | 1,127 (5.2%) |
Employment Occupations by Sex in Itasca County
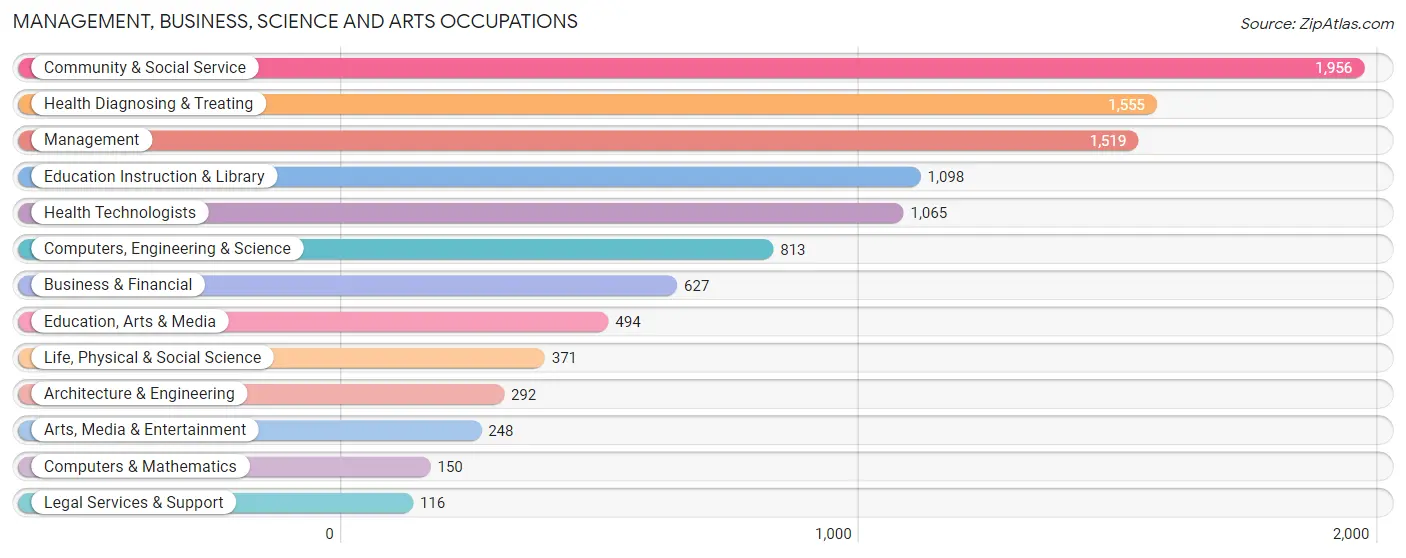
Management, Business, Science and Arts Occupations
The most common Management, Business, Science and Arts occupations in Itasca County are Community & Social Service (1,956 | 10.2%), Health Diagnosing & Treating (1,555 | 8.1%), Management (1,519 | 7.9%), Education Instruction & Library (1,098 | 5.7%), and Health Technologists (1,065 | 5.6%).
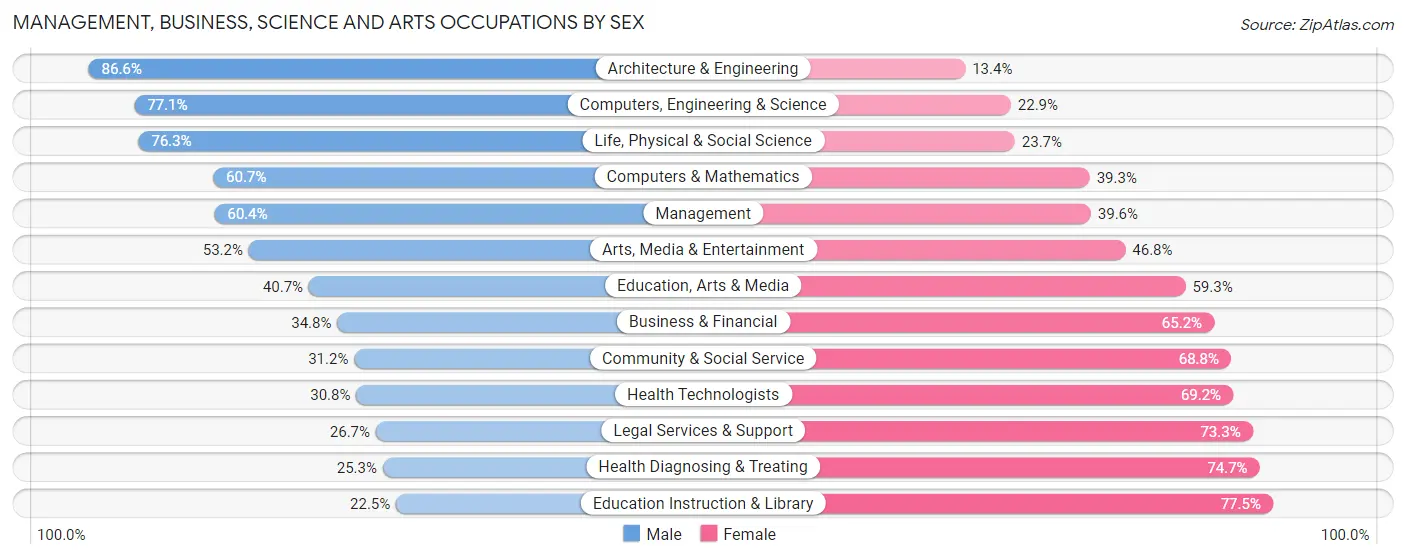
Management, Business, Science and Arts Occupations by Sex
Within the Management, Business, Science and Arts occupations in Itasca County, the most male-oriented occupations are Architecture & Engineering (86.6%), Computers, Engineering & Science (77.1%), and Life, Physical & Social Science (76.3%), while the most female-oriented occupations are Education Instruction & Library (77.5%), Health Diagnosing & Treating (74.7%), and Legal Services & Support (73.3%).
| Occupation | Male | Female |
| Management | 918 (60.4%) | 601 (39.6%) |
| Business & Financial | 218 (34.8%) | 409 (65.2%) |
| Computers, Engineering & Science | 627 (77.1%) | 186 (22.9%) |
| Computers & Mathematics | 91 (60.7%) | 59 (39.3%) |
| Architecture & Engineering | 253 (86.6%) | 39 (13.4%) |
| Life, Physical & Social Science | 283 (76.3%) | 88 (23.7%) |
| Community & Social Service | 611 (31.2%) | 1,345 (68.8%) |
| Education, Arts & Media | 201 (40.7%) | 293 (59.3%) |
| Legal Services & Support | 31 (26.7%) | 85 (73.3%) |
| Education Instruction & Library | 247 (22.5%) | 851 (77.5%) |
| Arts, Media & Entertainment | 132 (53.2%) | 116 (46.8%) |
| Health Diagnosing & Treating | 393 (25.3%) | 1,162 (74.7%) |
| Health Technologists | 328 (30.8%) | 737 (69.2%) |
| Total (Category) | 2,767 (42.8%) | 3,703 (57.2%) |
| Total (Overall) | 9,885 (51.5%) | 9,315 (48.5%) |
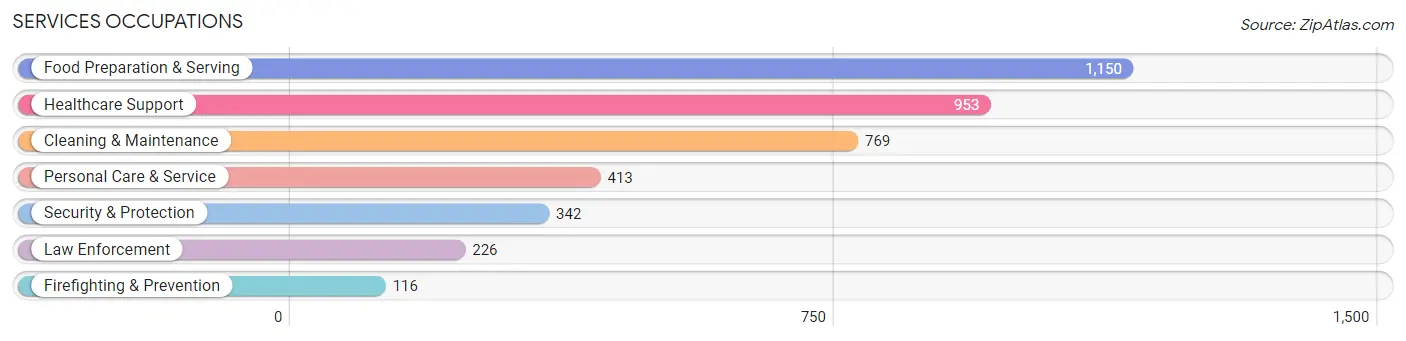
Services Occupations
The most common Services occupations in Itasca County are Food Preparation & Serving (1,150 | 6.0%), Healthcare Support (953 | 5.0%), Cleaning & Maintenance (769 | 4.0%), Personal Care & Service (413 | 2.1%), and Security & Protection (342 | 1.8%).
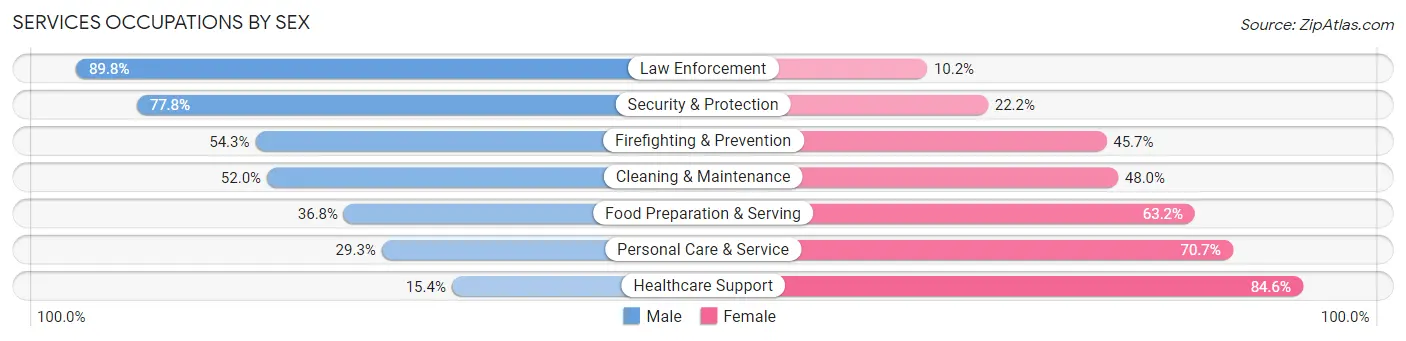
Services Occupations by Sex
Within the Services occupations in Itasca County, the most male-oriented occupations are Law Enforcement (89.8%), Security & Protection (77.8%), and Firefighting & Prevention (54.3%), while the most female-oriented occupations are Healthcare Support (84.6%), Personal Care & Service (70.7%), and Food Preparation & Serving (63.2%).
| Occupation | Male | Female |
| Healthcare Support | 147 (15.4%) | 806 (84.6%) |
| Security & Protection | 266 (77.8%) | 76 (22.2%) |
| Firefighting & Prevention | 63 (54.3%) | 53 (45.7%) |
| Law Enforcement | 203 (89.8%) | 23 (10.2%) |
| Food Preparation & Serving | 423 (36.8%) | 727 (63.2%) |
| Cleaning & Maintenance | 400 (52.0%) | 369 (48.0%) |
| Personal Care & Service | 121 (29.3%) | 292 (70.7%) |
| Total (Category) | 1,357 (37.4%) | 2,270 (62.6%) |
| Total (Overall) | 9,885 (51.5%) | 9,315 (48.5%) |
Sales and Office Occupations
The most common Sales and Office occupations in Itasca County are Sales & Related (2,056 | 10.7%), and Office & Administration (1,781 | 9.3%).

Sales and Office Occupations by Sex
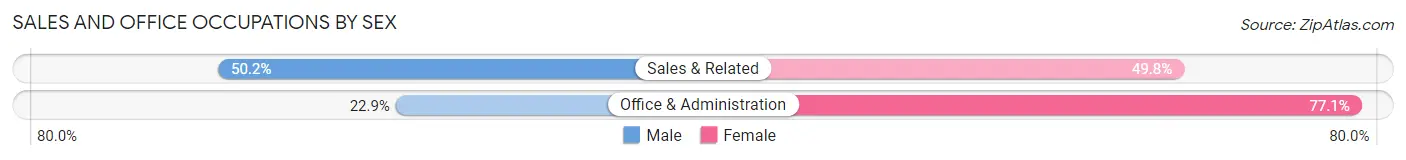
| Occupation | Male | Female |
| Sales & Related | 1,033 (50.2%) | 1,023 (49.8%) |
| Office & Administration | 408 (22.9%) | 1,373 (77.1%) |
| Total (Category) | 1,441 (37.6%) | 2,396 (62.4%) |
| Total (Overall) | 9,885 (51.5%) | 9,315 (48.5%) |
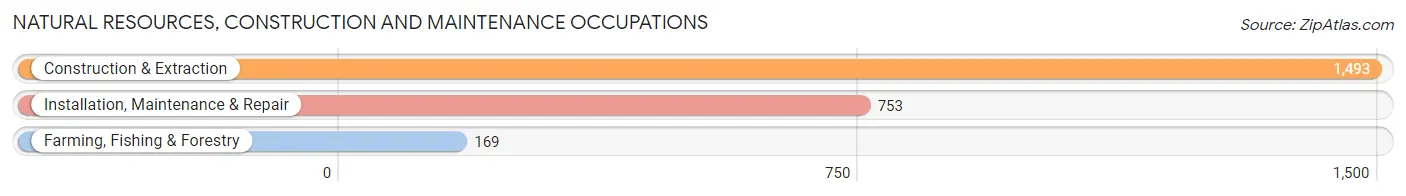
Natural Resources, Construction and Maintenance Occupations
The most common Natural Resources, Construction and Maintenance occupations in Itasca County are Construction & Extraction (1,493 | 7.8%), Installation, Maintenance & Repair (753 | 3.9%), and Farming, Fishing & Forestry (169 | 0.9%).
Natural Resources, Construction and Maintenance Occupations by Sex
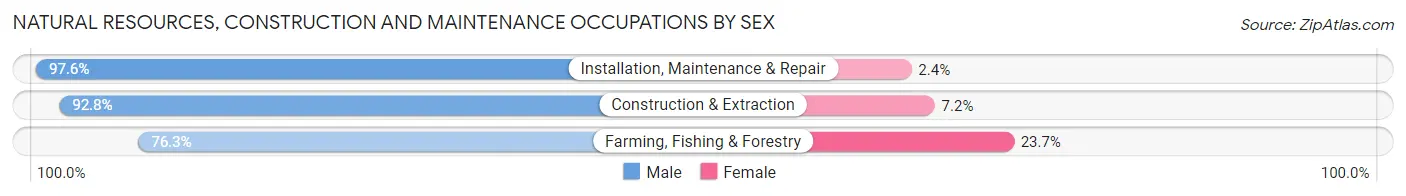
| Occupation | Male | Female |
| Farming, Fishing & Forestry | 129 (76.3%) | 40 (23.7%) |
| Construction & Extraction | 1,385 (92.8%) | 108 (7.2%) |
| Installation, Maintenance & Repair | 735 (97.6%) | 18 (2.4%) |
| Total (Category) | 2,249 (93.1%) | 166 (6.9%) |
| Total (Overall) | 9,885 (51.5%) | 9,315 (48.5%) |
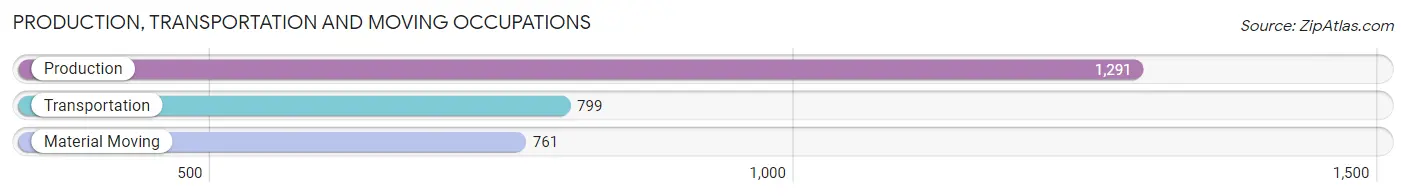
Production, Transportation and Moving Occupations
The most common Production, Transportation and Moving occupations in Itasca County are Production (1,291 | 6.7%), Transportation (799 | 4.2%), and Material Moving (761 | 4.0%).
Production, Transportation and Moving Occupations by Sex
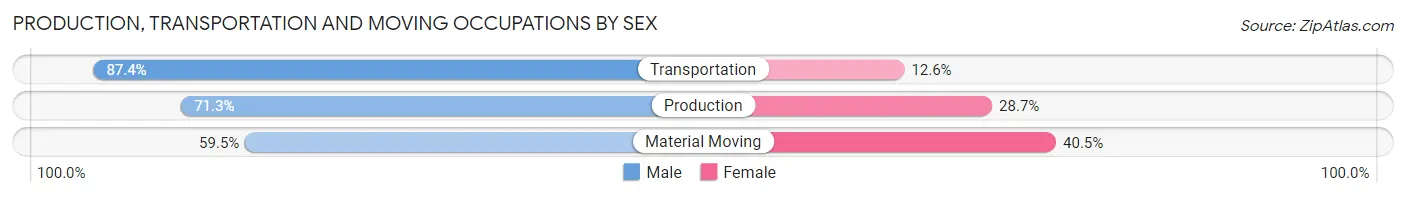
| Occupation | Male | Female |
| Production | 920 (71.3%) | 371 (28.7%) |
| Transportation | 698 (87.4%) | 101 (12.6%) |
| Material Moving | 453 (59.5%) | 308 (40.5%) |
| Total (Category) | 2,071 (72.6%) | 780 (27.4%) |
| Total (Overall) | 9,885 (51.5%) | 9,315 (48.5%) |
Employment Industries by Sex in Itasca County
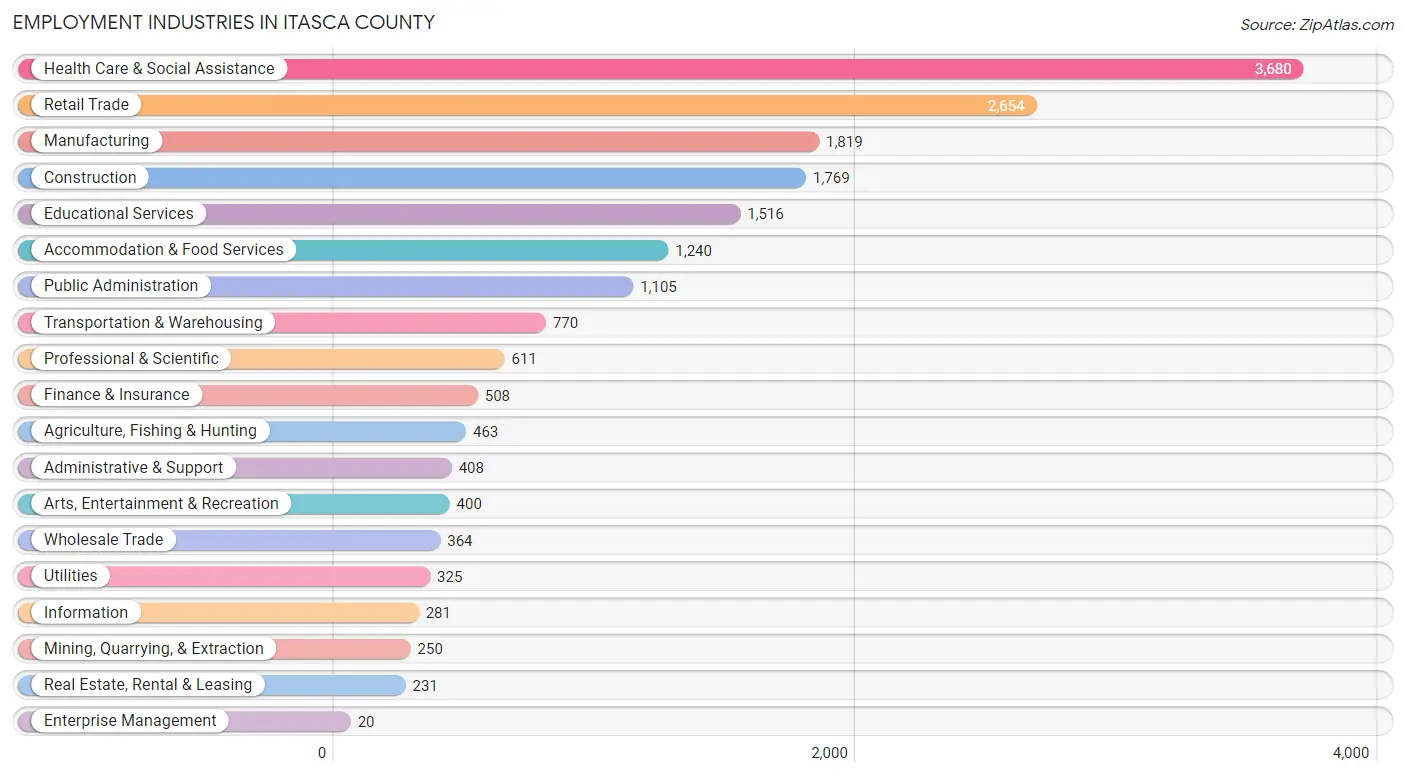
Employment Industries in Itasca County
The major employment industries in Itasca County include Health Care & Social Assistance (3,680 | 19.2%), Retail Trade (2,654 | 13.8%), Manufacturing (1,819 | 9.5%), Construction (1,769 | 9.2%), and Educational Services (1,516 | 7.9%).
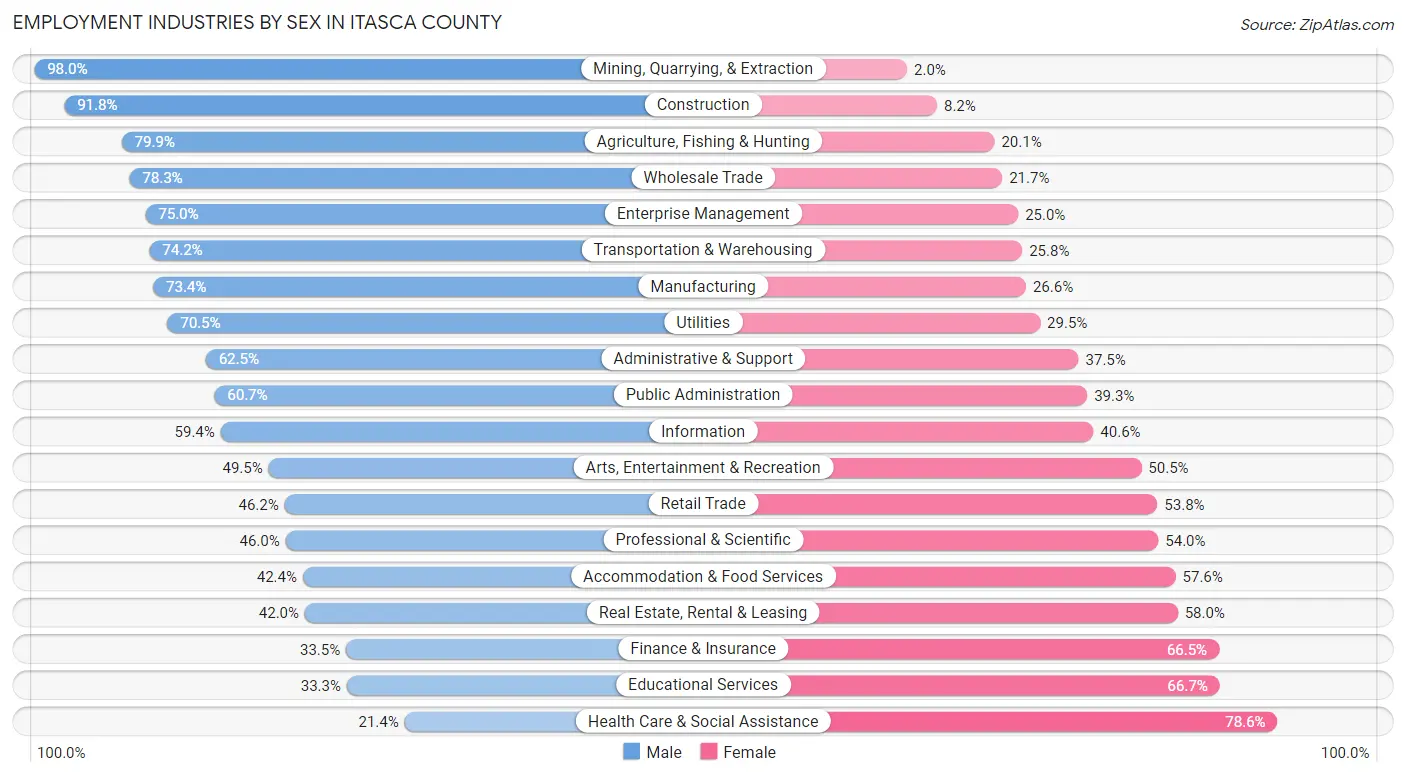
Employment Industries by Sex in Itasca County
The Itasca County industries that see more men than women are Mining, Quarrying, & Extraction (98.0%), Construction (91.8%), and Agriculture, Fishing & Hunting (79.9%), whereas the industries that tend to have a higher number of women are Health Care & Social Assistance (78.6%), Educational Services (66.7%), and Finance & Insurance (66.5%).
| Industry | Male | Female |
| Agriculture, Fishing & Hunting | 370 (79.9%) | 93 (20.1%) |
| Mining, Quarrying, & Extraction | 245 (98.0%) | 5 (2.0%) |
| Construction | 1,624 (91.8%) | 145 (8.2%) |
| Manufacturing | 1,335 (73.4%) | 484 (26.6%) |
| Wholesale Trade | 285 (78.3%) | 79 (21.7%) |
| Retail Trade | 1,226 (46.2%) | 1,428 (53.8%) |
| Transportation & Warehousing | 571 (74.2%) | 199 (25.8%) |
| Utilities | 229 (70.5%) | 96 (29.5%) |
| Information | 167 (59.4%) | 114 (40.6%) |
| Finance & Insurance | 170 (33.5%) | 338 (66.5%) |
| Real Estate, Rental & Leasing | 97 (42.0%) | 134 (58.0%) |
| Professional & Scientific | 281 (46.0%) | 330 (54.0%) |
| Enterprise Management | 15 (75.0%) | 5 (25.0%) |
| Administrative & Support | 255 (62.5%) | 153 (37.5%) |
| Educational Services | 505 (33.3%) | 1,011 (66.7%) |
| Health Care & Social Assistance | 786 (21.4%) | 2,894 (78.6%) |
| Arts, Entertainment & Recreation | 198 (49.5%) | 202 (50.5%) |
| Accommodation & Food Services | 526 (42.4%) | 714 (57.6%) |
| Public Administration | 671 (60.7%) | 434 (39.3%) |
| Total | 9,885 (51.5%) | 9,315 (48.5%) |
Education in Itasca County
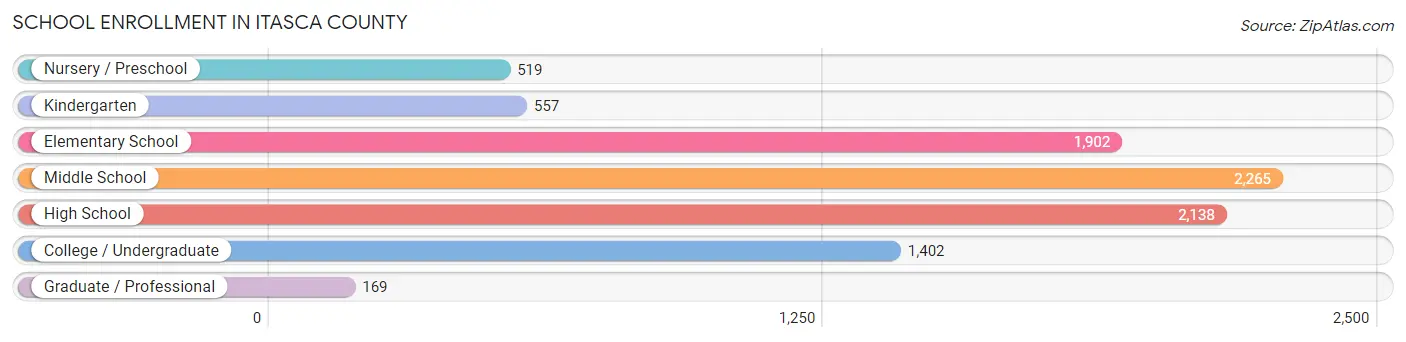
School Enrollment in Itasca County
The most common levels of schooling among the 8,952 students in Itasca County are middle school (2,265 | 25.3%), high school (2,138 | 23.9%), and elementary school (1,902 | 21.2%).
| School Level | # Students | % Students |
| Nursery / Preschool | 519 | 5.8% |
| Kindergarten | 557 | 6.2% |
| Elementary School | 1,902 | 21.2% |
| Middle School | 2,265 | 25.3% |
| High School | 2,138 | 23.9% |
| College / Undergraduate | 1,402 | 15.7% |
| Graduate / Professional | 169 | 1.9% |
| Total | 8,952 | 100.0% |
School Enrollment by Age by Funding Source in Itasca County
Out of a total of 8,952 students who are enrolled in schools in Itasca County, 1,101 (12.3%) attend a private institution, while the remaining 7,851 (87.7%) are enrolled in public schools. The age group of 3 to 4 year olds has the highest likelihood of being enrolled in private schools, with 96 (30.0% in the age bracket) enrolled. Conversely, the age group of 15 to 17 year olds has the lowest likelihood of being enrolled in a private school, with 1,621 (95.4% in the age bracket) attending a public institution.
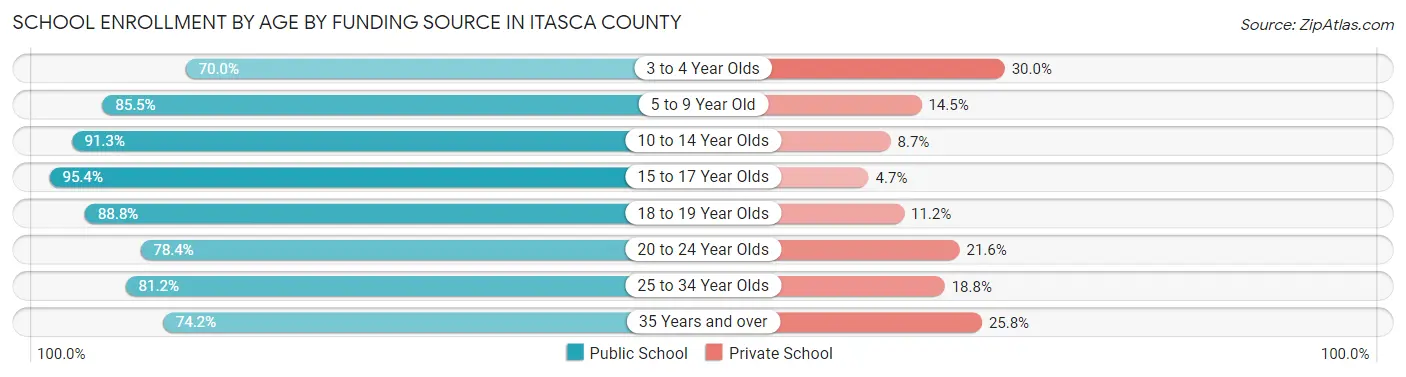
| Age Bracket | Public School | Private School |
| 3 to 4 Year Olds | 224 (70.0%) | 96 (30.0%) |
| 5 to 9 Year Old | 2,006 (85.5%) | 340 (14.5%) |
| 10 to 14 Year Olds | 2,422 (91.3%) | 232 (8.7%) |
| 15 to 17 Year Olds | 1,621 (95.4%) | 79 (4.6%) |
| 18 to 19 Year Olds | 616 (88.8%) | 78 (11.2%) |
| 20 to 24 Year Olds | 458 (78.4%) | 126 (21.6%) |
| 25 to 34 Year Olds | 263 (81.2%) | 61 (18.8%) |
| 35 Years and over | 245 (74.2%) | 85 (25.8%) |
| Total | 7,851 (87.7%) | 1,101 (12.3%) |
Educational Attainment by Field of Study in Itasca County
Education (2,004 | 22.6%), business (1,129 | 12.7%), science & technology (1,105 | 12.5%), bio, nature & agricultural (884 | 10.0%), and arts & humanities (608 | 6.9%) are the most common fields of study among 8,864 individuals in Itasca County who have obtained a bachelor's degree or higher.
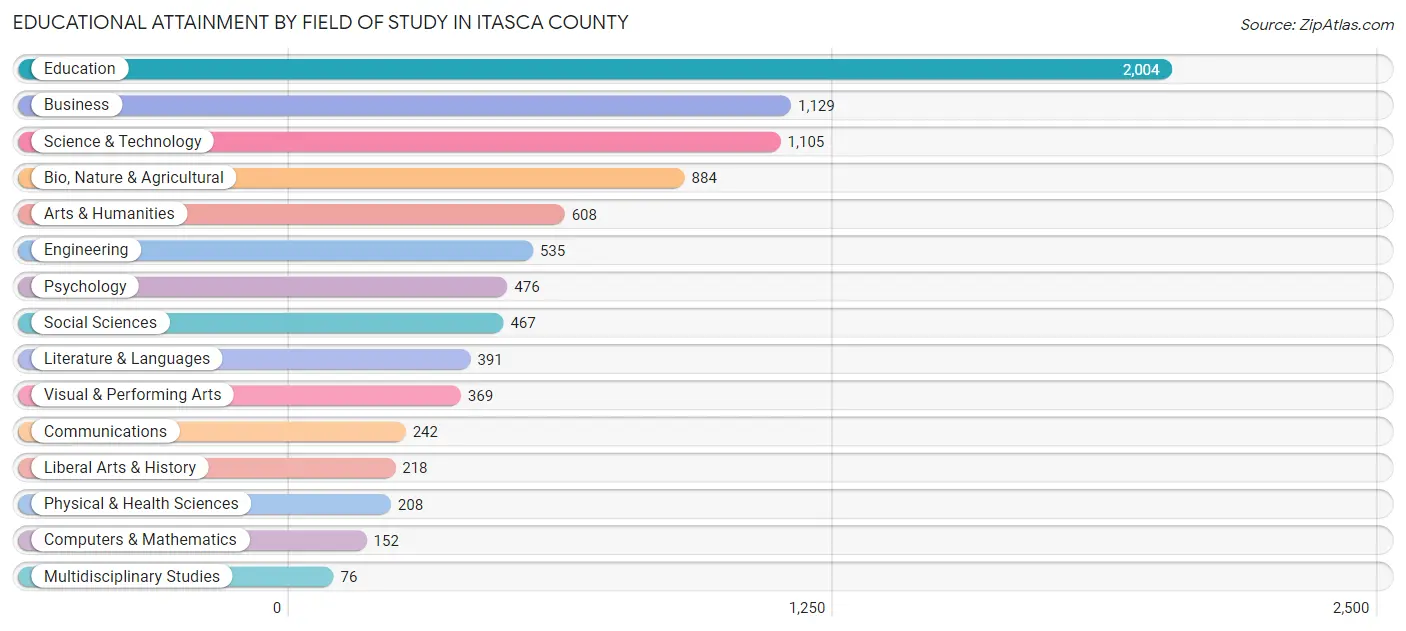
| Field of Study | # Graduates | % Graduates |
| Computers & Mathematics | 152 | 1.7% |
| Bio, Nature & Agricultural | 884 | 10.0% |
| Physical & Health Sciences | 208 | 2.4% |
| Psychology | 476 | 5.4% |
| Social Sciences | 467 | 5.3% |
| Engineering | 535 | 6.0% |
| Multidisciplinary Studies | 76 | 0.9% |
| Science & Technology | 1,105 | 12.5% |
| Business | 1,129 | 12.7% |
| Education | 2,004 | 22.6% |
| Literature & Languages | 391 | 4.4% |
| Liberal Arts & History | 218 | 2.5% |
| Visual & Performing Arts | 369 | 4.2% |
| Communications | 242 | 2.7% |
| Arts & Humanities | 608 | 6.9% |
| Total | 8,864 | 100.0% |
Transportation & Commute in Itasca County
Vehicle Availability by Sex in Itasca County
The most prevalent vehicle ownership categories in Itasca County are males with 2 vehicles (3,849, accounting for 39.9%) and females with 2 vehicles (3,635, making up 42.7%).
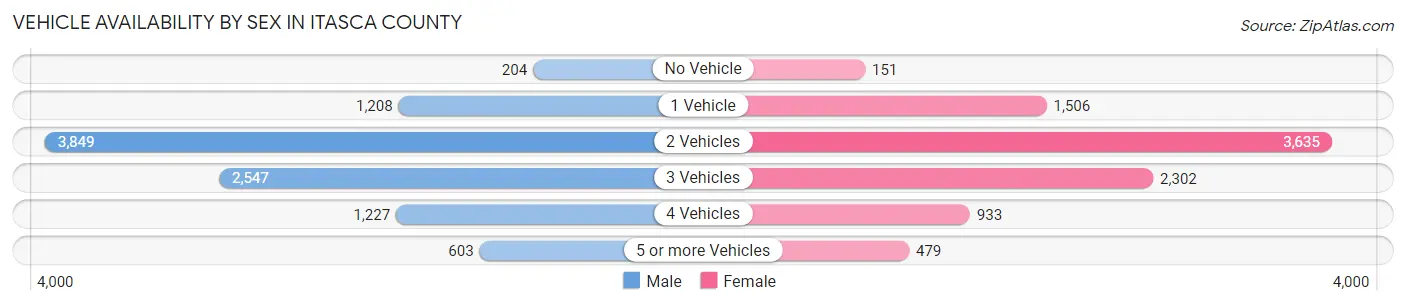
| Vehicles Available | Male | Female |
| No Vehicle | 204 (2.1%) | 151 (1.7%) |
| 1 Vehicle | 1,208 (12.5%) | 1,506 (16.7%) |
| 2 Vehicles | 3,849 (39.9%) | 3,635 (40.4%) |
| 3 Vehicles | 2,547 (26.4%) | 2,302 (25.6%) |
| 4 Vehicles | 1,227 (12.7%) | 933 (10.4%) |
| 5 or more Vehicles | 603 (6.3%) | 479 (5.3%) |
| Total | 9,638 (100.0%) | 9,006 (100.0%) |
Commute Time in Itasca County
The most frequently occuring commute durations in Itasca County are 10 to 14 minutes (2,889 commuters, 16.7%), 5 to 9 minutes (2,605 commuters, 15.0%), and 15 to 19 minutes (2,593 commuters, 15.0%).
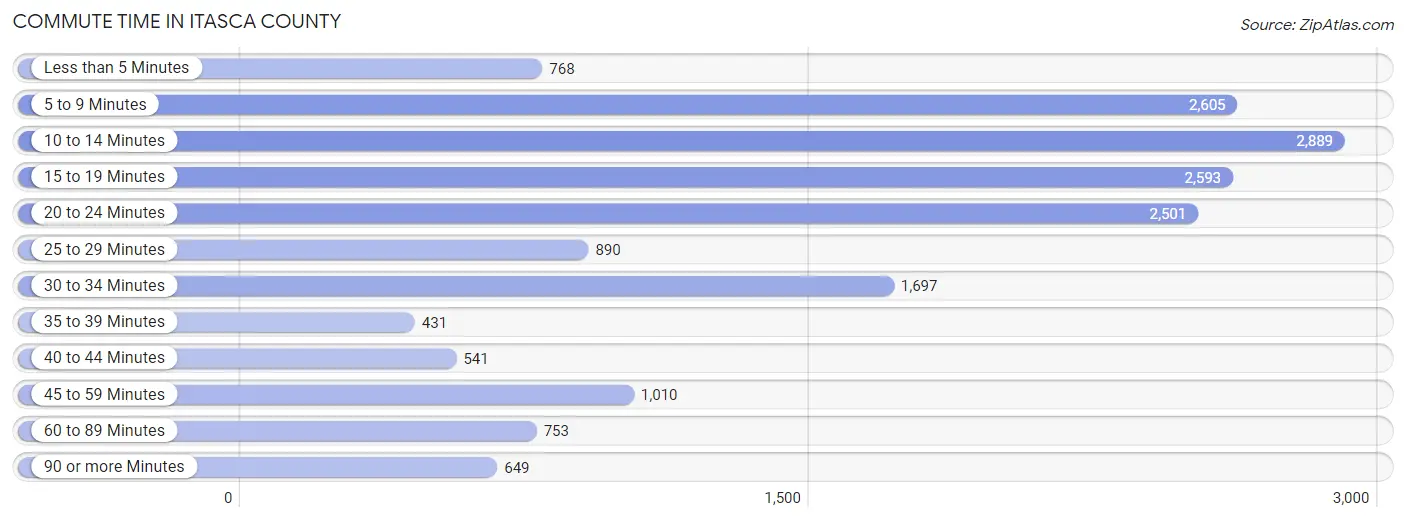
| Commute Time | # Commuters | % Commuters |
| Less than 5 Minutes | 768 | 4.4% |
| 5 to 9 Minutes | 2,605 | 15.0% |
| 10 to 14 Minutes | 2,889 | 16.7% |
| 15 to 19 Minutes | 2,593 | 15.0% |
| 20 to 24 Minutes | 2,501 | 14.4% |
| 25 to 29 Minutes | 890 | 5.1% |
| 30 to 34 Minutes | 1,697 | 9.8% |
| 35 to 39 Minutes | 431 | 2.5% |
| 40 to 44 Minutes | 541 | 3.1% |
| 45 to 59 Minutes | 1,010 | 5.8% |
| 60 to 89 Minutes | 753 | 4.3% |
| 90 or more Minutes | 649 | 3.7% |
Commute Time by Sex in Itasca County
The most common commute times in Itasca County are 20 to 24 minutes (1,315 commuters, 14.4%) for males and 10 to 14 minutes (1,586 commuters, 19.3%) for females.
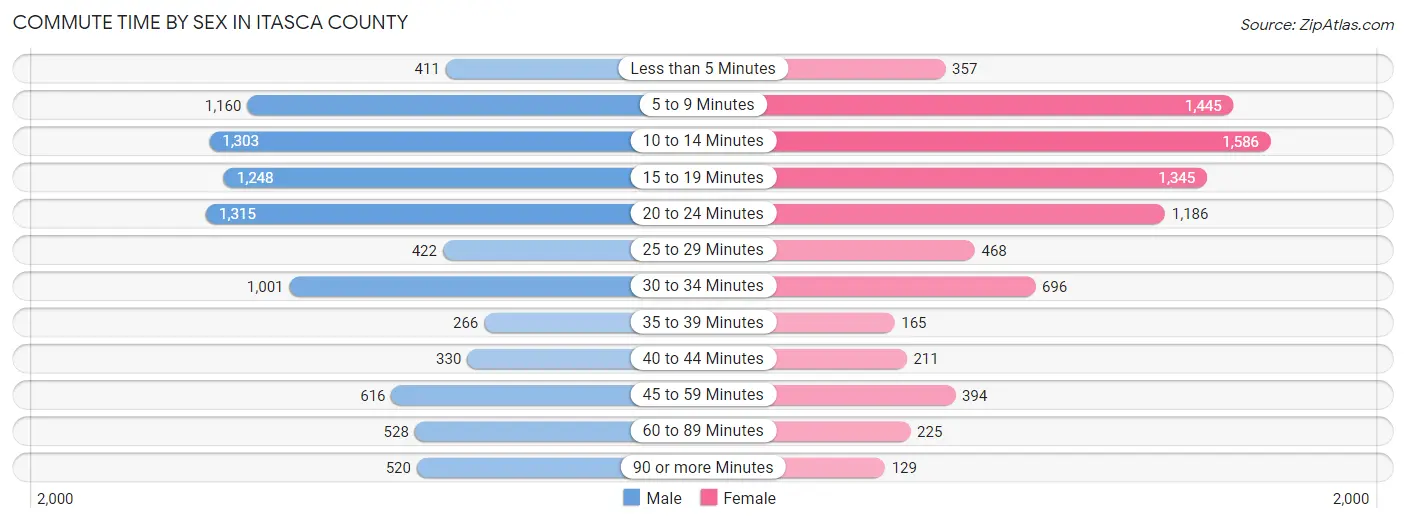
| Commute Time | Male | Female |
| Less than 5 Minutes | 411 (4.5%) | 357 (4.3%) |
| 5 to 9 Minutes | 1,160 (12.7%) | 1,445 (17.6%) |
| 10 to 14 Minutes | 1,303 (14.3%) | 1,586 (19.3%) |
| 15 to 19 Minutes | 1,248 (13.7%) | 1,345 (16.4%) |
| 20 to 24 Minutes | 1,315 (14.4%) | 1,186 (14.4%) |
| 25 to 29 Minutes | 422 (4.6%) | 468 (5.7%) |
| 30 to 34 Minutes | 1,001 (11.0%) | 696 (8.5%) |
| 35 to 39 Minutes | 266 (2.9%) | 165 (2.0%) |
| 40 to 44 Minutes | 330 (3.6%) | 211 (2.6%) |
| 45 to 59 Minutes | 616 (6.8%) | 394 (4.8%) |
| 60 to 89 Minutes | 528 (5.8%) | 225 (2.7%) |
| 90 or more Minutes | 520 (5.7%) | 129 (1.6%) |
Time of Departure to Work by Sex in Itasca County
The most frequent times of departure to work in Itasca County are 6:30 AM to 6:59 AM (1,088, 11.9%) for males and 7:30 AM to 7:59 AM (1,500, 18.3%) for females.
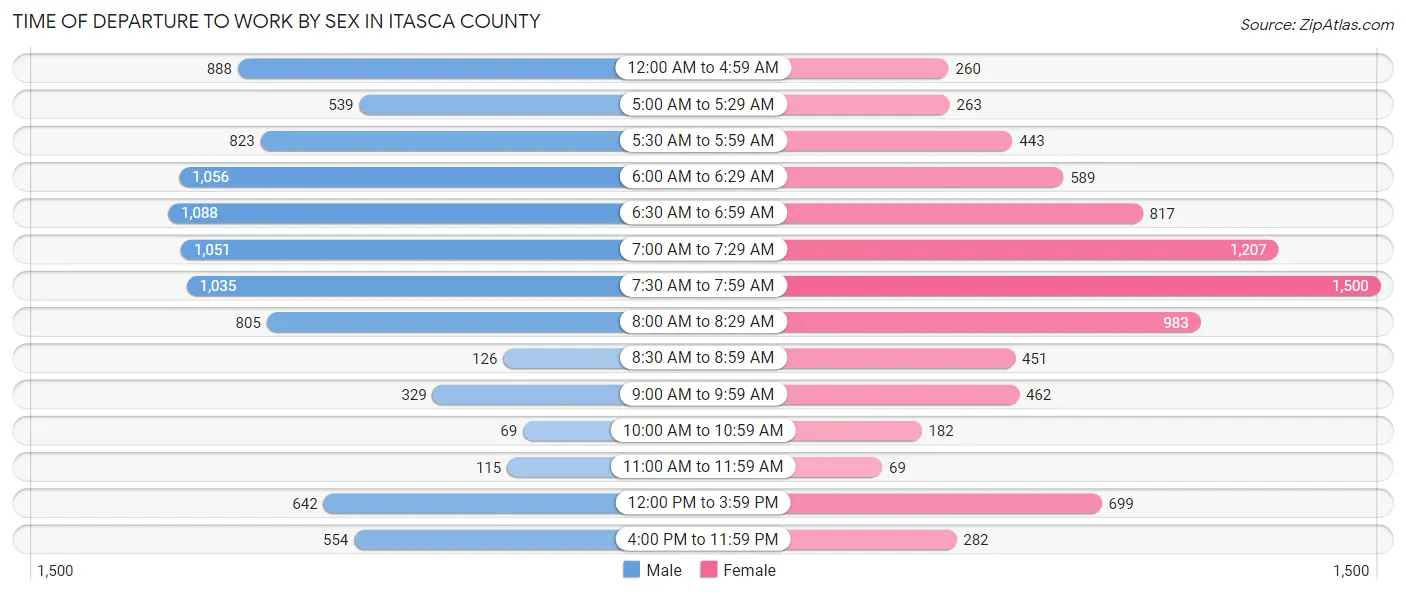
| Time of Departure | Male | Female |
| 12:00 AM to 4:59 AM | 888 (9.7%) | 260 (3.2%) |
| 5:00 AM to 5:29 AM | 539 (5.9%) | 263 (3.2%) |
| 5:30 AM to 5:59 AM | 823 (9.0%) | 443 (5.4%) |
| 6:00 AM to 6:29 AM | 1,056 (11.6%) | 589 (7.2%) |
| 6:30 AM to 6:59 AM | 1,088 (11.9%) | 817 (10.0%) |
| 7:00 AM to 7:29 AM | 1,051 (11.5%) | 1,207 (14.7%) |
| 7:30 AM to 7:59 AM | 1,035 (11.4%) | 1,500 (18.3%) |
| 8:00 AM to 8:29 AM | 805 (8.8%) | 983 (12.0%) |
| 8:30 AM to 8:59 AM | 126 (1.4%) | 451 (5.5%) |
| 9:00 AM to 9:59 AM | 329 (3.6%) | 462 (5.6%) |
| 10:00 AM to 10:59 AM | 69 (0.8%) | 182 (2.2%) |
| 11:00 AM to 11:59 AM | 115 (1.3%) | 69 (0.8%) |
| 12:00 PM to 3:59 PM | 642 (7.0%) | 699 (8.5%) |
| 4:00 PM to 11:59 PM | 554 (6.1%) | 282 (3.4%) |
| Total | 9,120 (100.0%) | 8,207 (100.0%) |
Housing Occupancy in Itasca County
Occupancy by Ownership in Itasca County
Of the total 18,121 dwellings in Itasca County, owner-occupied units account for 14,942 (82.5%), while renter-occupied units make up 3,179 (17.5%).
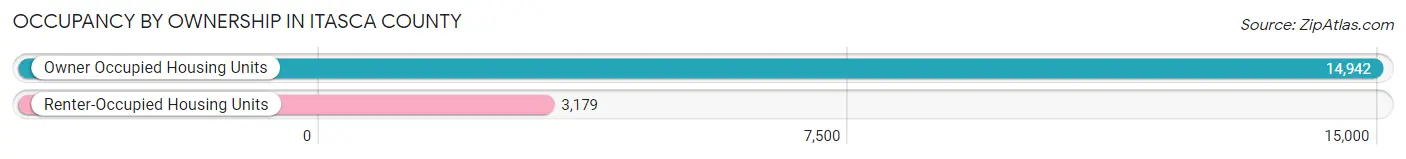
| Occupancy | # Housing Units | % Housing Units |
| Owner Occupied Housing Units | 14,942 | 82.5% |
| Renter-Occupied Housing Units | 3,179 | 17.5% |
| Total Occupied Housing Units | 18,121 | 100.0% |
Occupancy by Household Size in Itasca County
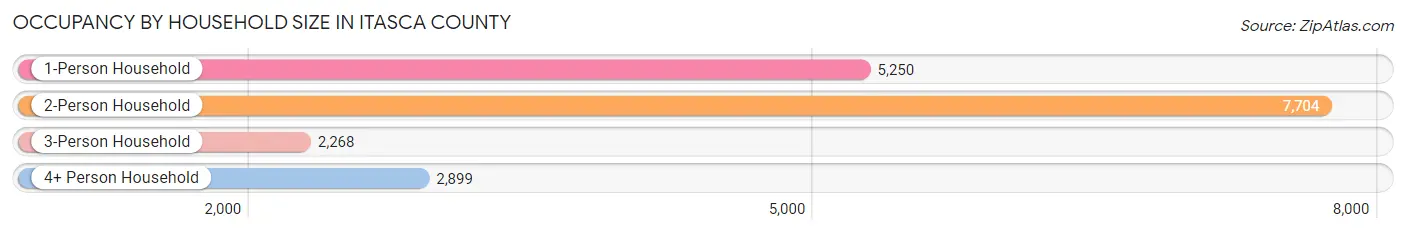
| Household Size | # Housing Units | % Housing Units |
| 1-Person Household | 5,250 | 29.0% |
| 2-Person Household | 7,704 | 42.5% |
| 3-Person Household | 2,268 | 12.5% |
| 4+ Person Household | 2,899 | 16.0% |
| Total Housing Units | 18,121 | 100.0% |
Occupancy by Ownership by Household Size in Itasca County
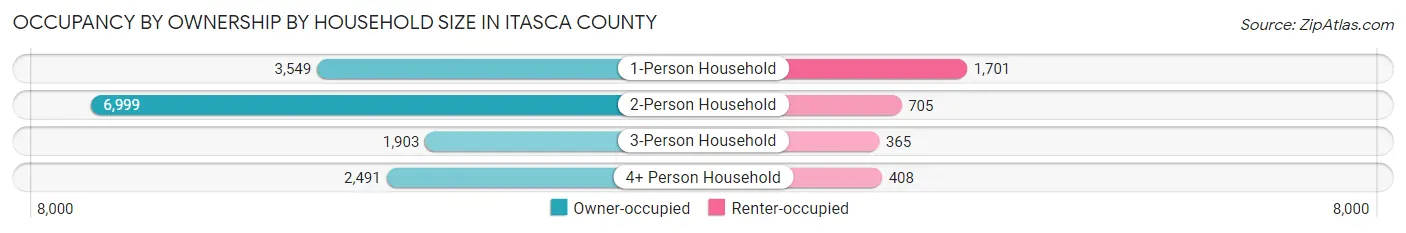
| Household Size | Owner-occupied | Renter-occupied |
| 1-Person Household | 3,549 (67.6%) | 1,701 (32.4%) |
| 2-Person Household | 6,999 (90.8%) | 705 (9.1%) |
| 3-Person Household | 1,903 (83.9%) | 365 (16.1%) |
| 4+ Person Household | 2,491 (85.9%) | 408 (14.1%) |
| Total Housing Units | 14,942 (82.5%) | 3,179 (17.5%) |
Occupancy by Educational Attainment in Itasca County
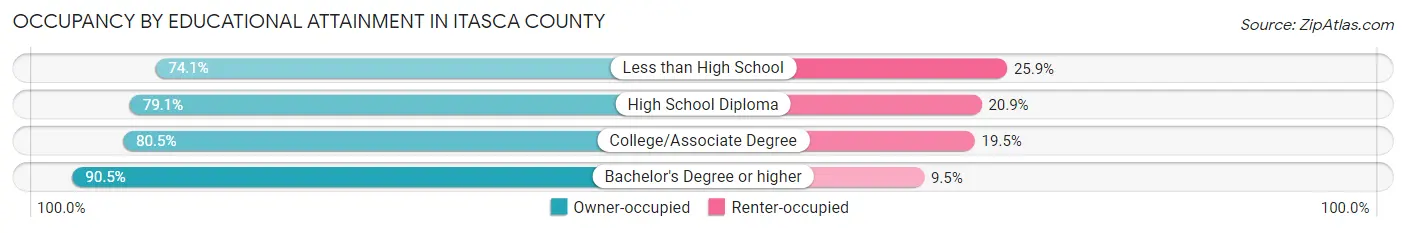
| Household Size | Owner-occupied | Renter-occupied |
| Less than High School | 540 (74.1%) | 189 (25.9%) |
| High School Diploma | 3,965 (79.1%) | 1,046 (20.9%) |
| College/Associate Degree | 6,169 (80.5%) | 1,497 (19.5%) |
| Bachelor's Degree or higher | 4,268 (90.5%) | 447 (9.5%) |
Occupancy by Age of Householder in Itasca County
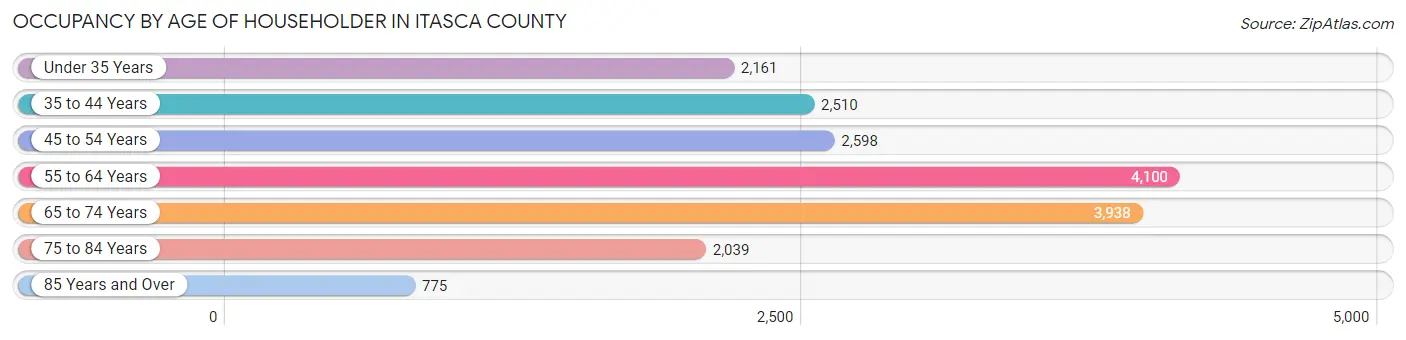
| Age Bracket | # Households | % Households |
| Under 35 Years | 2,161 | 11.9% |
| 35 to 44 Years | 2,510 | 13.9% |
| 45 to 54 Years | 2,598 | 14.3% |
| 55 to 64 Years | 4,100 | 22.6% |
| 65 to 74 Years | 3,938 | 21.7% |
| 75 to 84 Years | 2,039 | 11.3% |
| 85 Years and Over | 775 | 4.3% |
| Total | 18,121 | 100.0% |
Housing Finances in Itasca County
Median Income by Occupancy in Itasca County
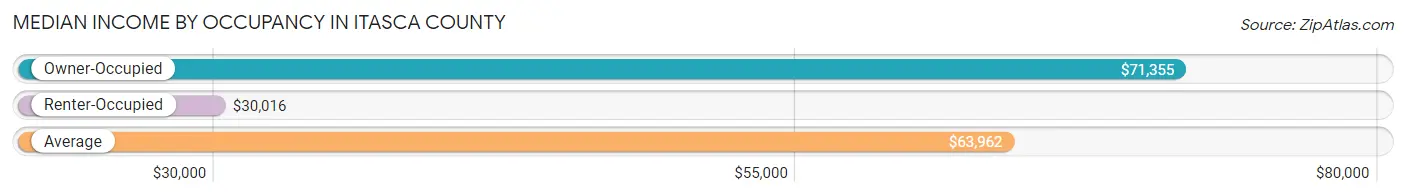
| Occupancy Type | # Households | Median Income |
| Owner-Occupied | 14,942 (82.5%) | $71,355 |
| Renter-Occupied | 3,179 (17.5%) | $30,016 |
| Average | 18,121 (100.0%) | $63,962 |
Occupancy by Householder Income Bracket in Itasca County
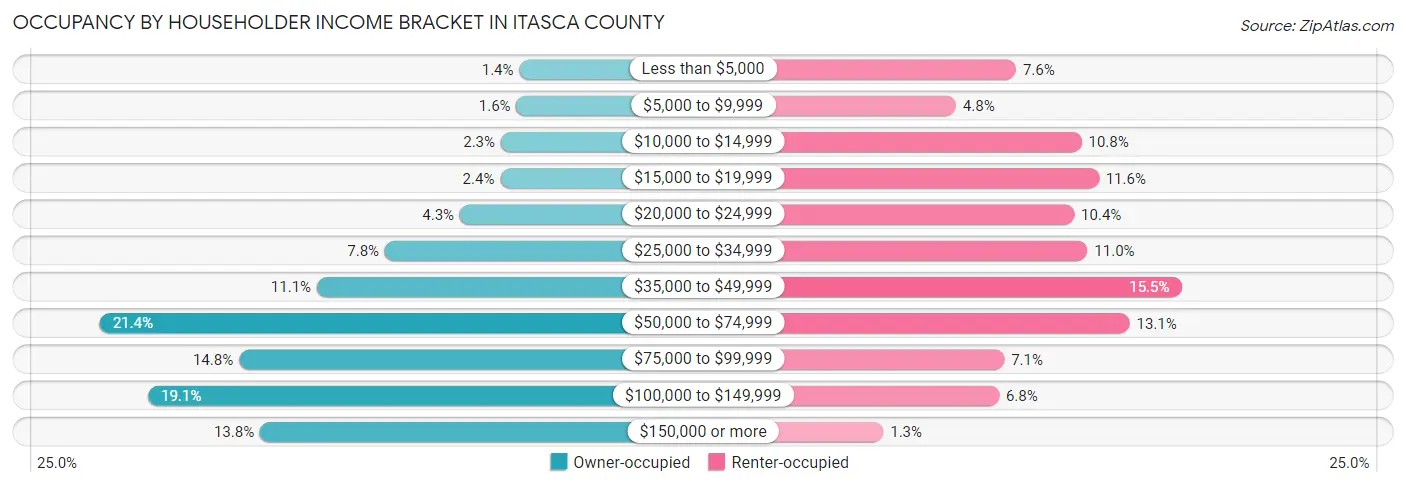
| Income Bracket | Owner-occupied | Renter-occupied |
| Less than $5,000 | 215 (1.4%) | 243 (7.6%) |
| $5,000 to $9,999 | 236 (1.6%) | 152 (4.8%) |
| $10,000 to $14,999 | 347 (2.3%) | 342 (10.8%) |
| $15,000 to $19,999 | 351 (2.4%) | 368 (11.6%) |
| $20,000 to $24,999 | 638 (4.3%) | 331 (10.4%) |
| $25,000 to $34,999 | 1,172 (7.8%) | 351 (11.0%) |
| $35,000 to $49,999 | 1,656 (11.1%) | 493 (15.5%) |
| $50,000 to $74,999 | 3,200 (21.4%) | 415 (13.1%) |
| $75,000 to $99,999 | 2,210 (14.8%) | 225 (7.1%) |
| $100,000 to $149,999 | 2,857 (19.1%) | 217 (6.8%) |
| $150,000 or more | 2,060 (13.8%) | 42 (1.3%) |
| Total | 14,942 (100.0%) | 3,179 (100.0%) |
Monthly Housing Cost Tiers in Itasca County
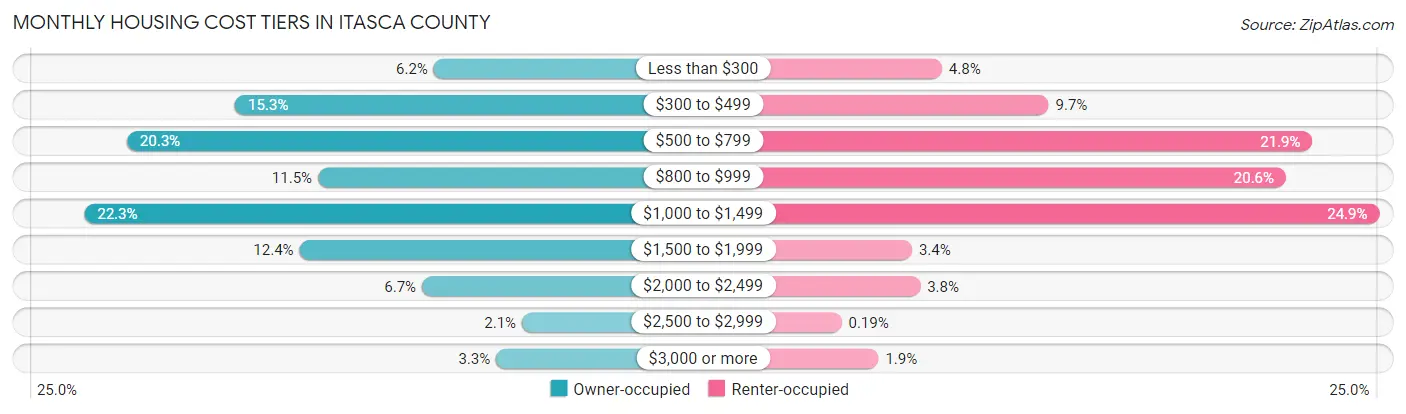
| Monthly Cost | Owner-occupied | Renter-occupied |
| Less than $300 | 922 (6.2%) | 153 (4.8%) |
| $300 to $499 | 2,287 (15.3%) | 309 (9.7%) |
| $500 to $799 | 3,031 (20.3%) | 695 (21.9%) |
| $800 to $999 | 1,719 (11.5%) | 656 (20.6%) |
| $1,000 to $1,499 | 3,325 (22.3%) | 793 (24.9%) |
| $1,500 to $1,999 | 1,846 (12.3%) | 109 (3.4%) |
| $2,000 to $2,499 | 1,003 (6.7%) | 121 (3.8%) |
| $2,500 to $2,999 | 316 (2.1%) | 6 (0.2%) |
| $3,000 or more | 493 (3.3%) | 60 (1.9%) |
| Total | 14,942 (100.0%) | 3,179 (100.0%) |
Physical Housing Characteristics in Itasca County
Housing Structures in Itasca County
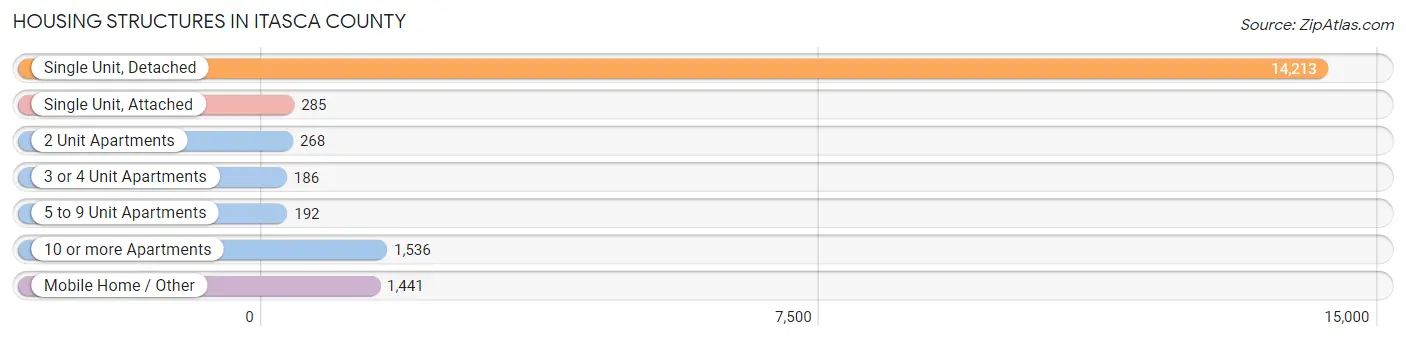
| Structure Type | # Housing Units | % Housing Units |
| Single Unit, Detached | 14,213 | 78.4% |
| Single Unit, Attached | 285 | 1.6% |
| 2 Unit Apartments | 268 | 1.5% |
| 3 or 4 Unit Apartments | 186 | 1.0% |
| 5 to 9 Unit Apartments | 192 | 1.1% |
| 10 or more Apartments | 1,536 | 8.5% |
| Mobile Home / Other | 1,441 | 8.0% |
| Total | 18,121 | 100.0% |
Housing Structures by Occupancy in Itasca County
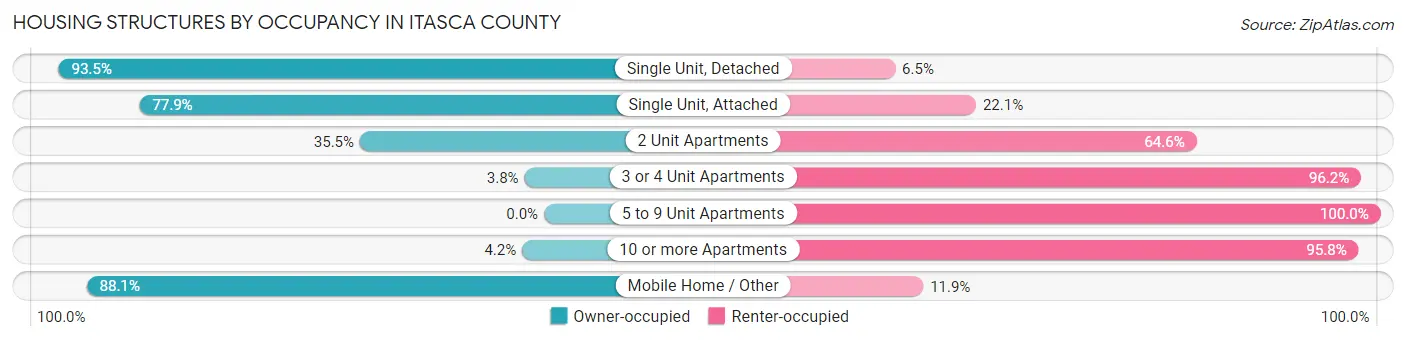
| Structure Type | Owner-occupied | Renter-occupied |
| Single Unit, Detached | 13,284 (93.5%) | 929 (6.5%) |
| Single Unit, Attached | 222 (77.9%) | 63 (22.1%) |
| 2 Unit Apartments | 95 (35.4%) | 173 (64.5%) |
| 3 or 4 Unit Apartments | 7 (3.8%) | 179 (96.2%) |
| 5 to 9 Unit Apartments | 0 (0.0%) | 192 (100.0%) |
| 10 or more Apartments | 65 (4.2%) | 1,471 (95.8%) |
| Mobile Home / Other | 1,269 (88.1%) | 172 (11.9%) |
| Total | 14,942 (82.5%) | 3,179 (17.5%) |
Housing Structures by Number of Rooms in Itasca County
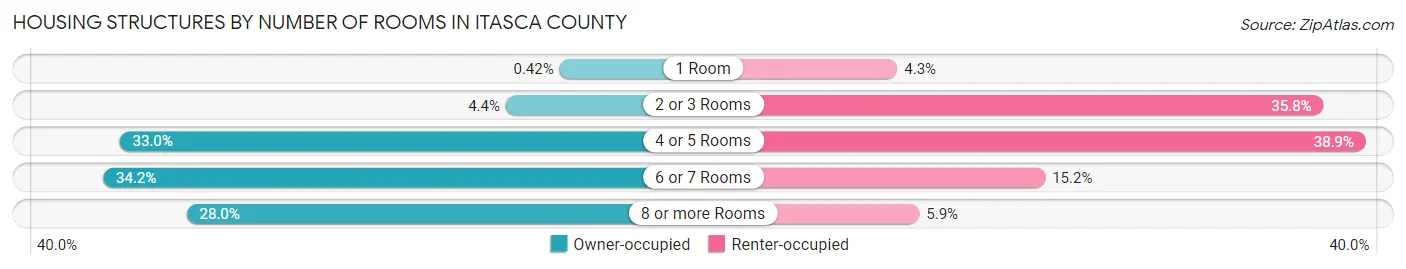
| Number of Rooms | Owner-occupied | Renter-occupied |
| 1 Room | 63 (0.4%) | 135 (4.3%) |
| 2 or 3 Rooms | 658 (4.4%) | 1,137 (35.8%) |
| 4 or 5 Rooms | 4,926 (33.0%) | 1,237 (38.9%) |
| 6 or 7 Rooms | 5,109 (34.2%) | 483 (15.2%) |
| 8 or more Rooms | 4,186 (28.0%) | 187 (5.9%) |
| Total | 14,942 (100.0%) | 3,179 (100.0%) |
Housing Structure by Heating Type in Itasca County
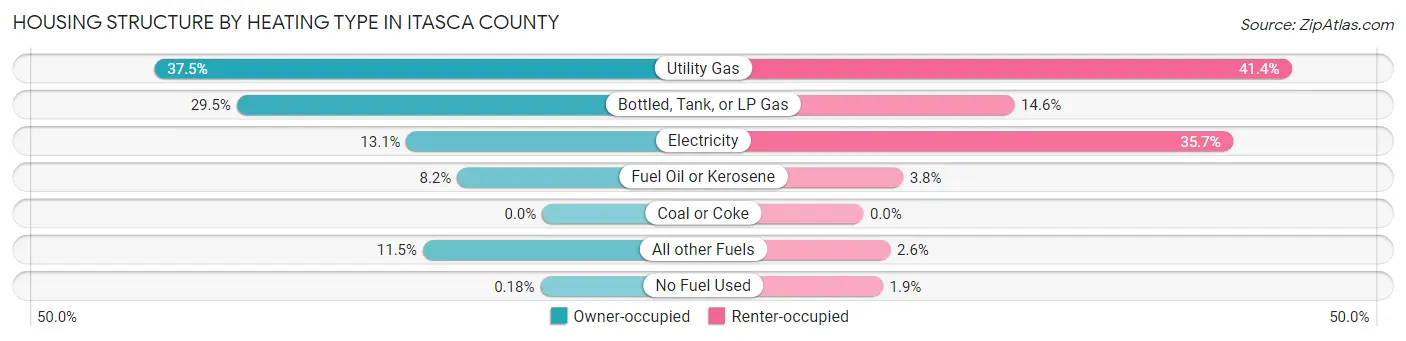
| Heating Type | Owner-occupied | Renter-occupied |
| Utility Gas | 5,598 (37.5%) | 1,315 (41.4%) |
| Bottled, Tank, or LP Gas | 4,409 (29.5%) | 464 (14.6%) |
| Electricity | 1,959 (13.1%) | 1,135 (35.7%) |
| Fuel Oil or Kerosene | 1,227 (8.2%) | 122 (3.8%) |
| Coal or Coke | 0 (0.0%) | 0 (0.0%) |
| All other Fuels | 1,722 (11.5%) | 83 (2.6%) |
| No Fuel Used | 27 (0.2%) | 60 (1.9%) |
| Total | 14,942 (100.0%) | 3,179 (100.0%) |
Household Vehicle Usage in Itasca County
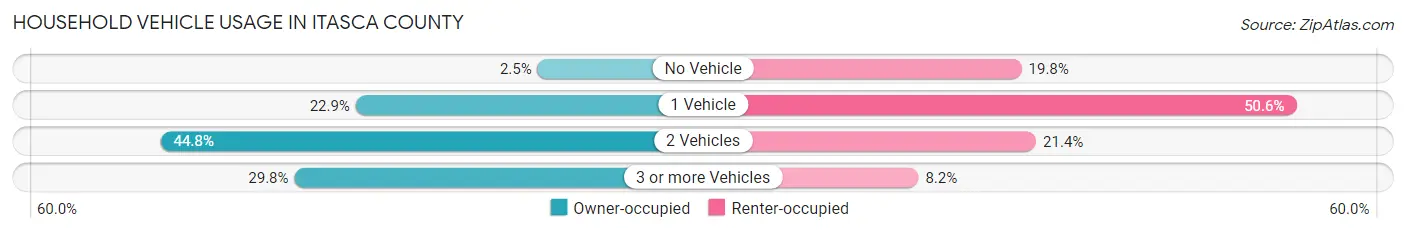
| Vehicles per Household | Owner-occupied | Renter-occupied |
| No Vehicle | 379 (2.5%) | 629 (19.8%) |
| 1 Vehicle | 3,423 (22.9%) | 1,607 (50.5%) |
| 2 Vehicles | 6,690 (44.8%) | 681 (21.4%) |
| 3 or more Vehicles | 4,450 (29.8%) | 262 (8.2%) |
| Total | 14,942 (100.0%) | 3,179 (100.0%) |
Real Estate & Mortgages in Itasca County
Real Estate and Mortgage Overview in Itasca County
| Characteristic | Without Mortgage | With Mortgage |
| Housing Units | 6,671 | 8,271 |
| Median Property Value | $191,100 | $205,500 |
| Median Household Income | $56,640 | $1,569 |
| Monthly Housing Costs | $520 | $479 |
| Real Estate Taxes | $1,679 | $189 |
Property Value by Mortgage Status in Itasca County
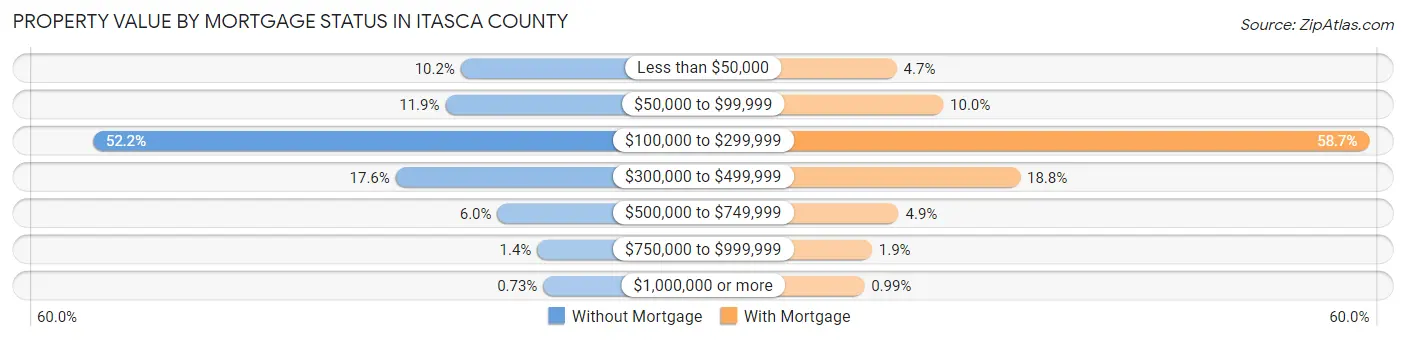
| Property Value | Without Mortgage | With Mortgage |
| Less than $50,000 | 678 (10.2%) | 389 (4.7%) |
| $50,000 to $99,999 | 795 (11.9%) | 828 (10.0%) |
| $100,000 to $299,999 | 3,482 (52.2%) | 4,856 (58.7%) |
| $300,000 to $499,999 | 1,174 (17.6%) | 1,555 (18.8%) |
| $500,000 to $749,999 | 398 (6.0%) | 407 (4.9%) |
| $750,000 to $999,999 | 95 (1.4%) | 154 (1.9%) |
| $1,000,000 or more | 49 (0.7%) | 82 (1.0%) |
| Total | 6,671 (100.0%) | 8,271 (100.0%) |
Household Income by Mortgage Status in Itasca County
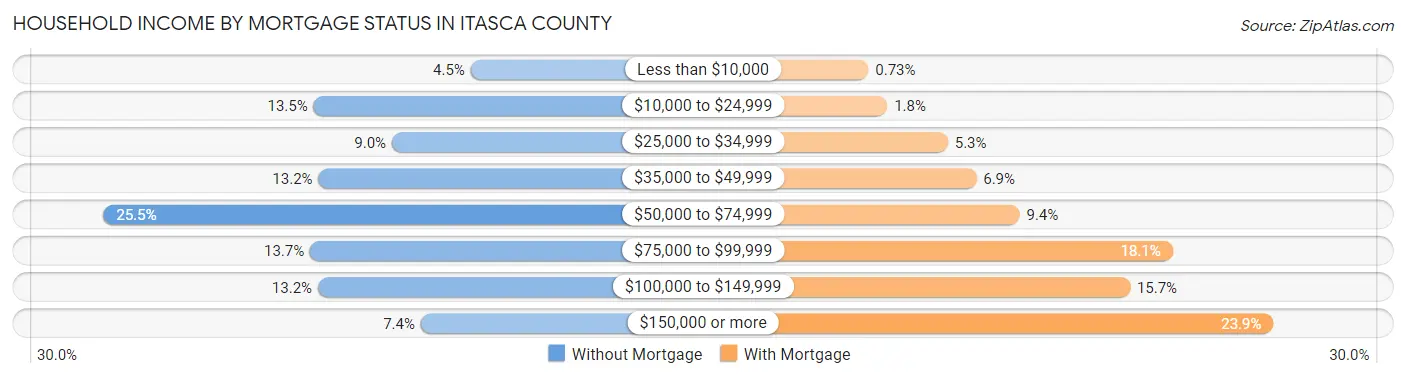
| Household Income | Without Mortgage | With Mortgage |
| Less than $10,000 | 301 (4.5%) | 60 (0.7%) |
| $10,000 to $24,999 | 900 (13.5%) | 150 (1.8%) |
| $25,000 to $34,999 | 601 (9.0%) | 436 (5.3%) |
| $35,000 to $49,999 | 881 (13.2%) | 571 (6.9%) |
| $50,000 to $74,999 | 1,701 (25.5%) | 775 (9.4%) |
| $75,000 to $99,999 | 913 (13.7%) | 1,499 (18.1%) |
| $100,000 to $149,999 | 883 (13.2%) | 1,297 (15.7%) |
| $150,000 or more | 491 (7.4%) | 1,974 (23.9%) |
| Total | 6,671 (100.0%) | 8,271 (100.0%) |
Property Value to Household Income Ratio in Itasca County
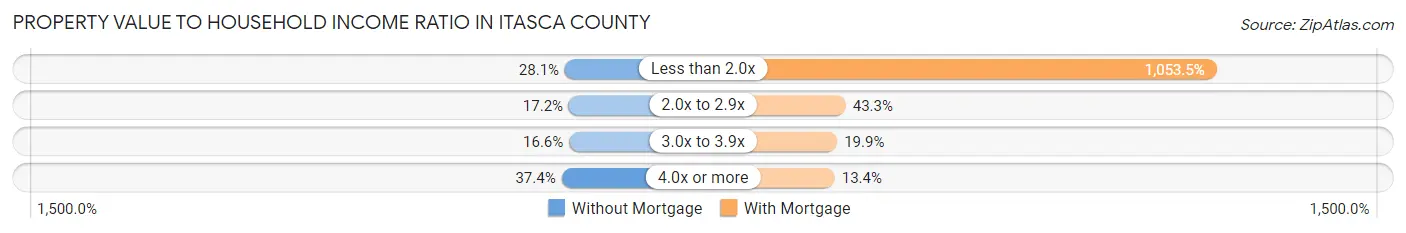
| Value-to-Income Ratio | Without Mortgage | With Mortgage |
| Less than 2.0x | 1,871 (28.1%) | 87,135 (1,053.5%) |
| 2.0x to 2.9x | 1,144 (17.2%) | 3,584 (43.3%) |
| 3.0x to 3.9x | 1,110 (16.6%) | 1,645 (19.9%) |
| 4.0x or more | 2,493 (37.4%) | 1,107 (13.4%) |
| Total | 6,671 (100.0%) | 8,271 (100.0%) |
Real Estate Taxes by Mortgage Status in Itasca County
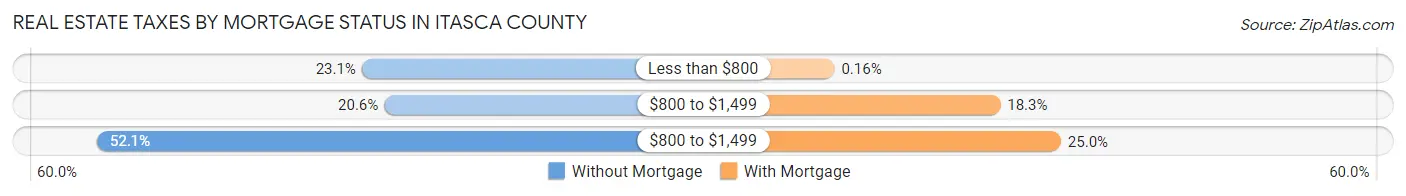
| Property Taxes | Without Mortgage | With Mortgage |
| Less than $800 | 1,538 (23.1%) | 13 (0.2%) |
| $800 to $1,499 | 1,374 (20.6%) | 1,516 (18.3%) |
| $800 to $1,499 | 3,474 (52.1%) | 2,065 (25.0%) |
| Total | 6,671 (100.0%) | 8,271 (100.0%) |
Health & Disability in Itasca County
Health Insurance Coverage by Age in Itasca County
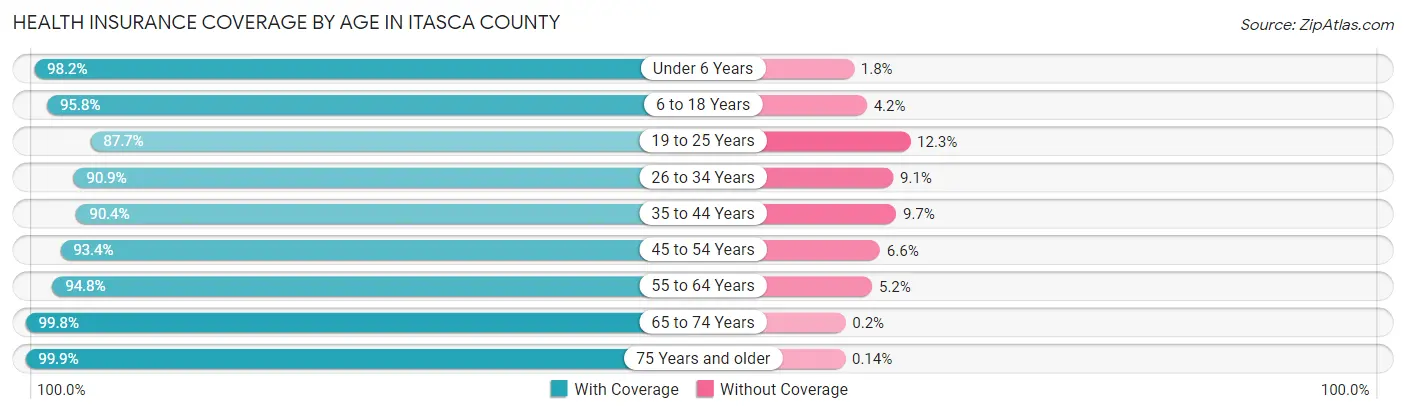
| Age Bracket | With Coverage | Without Coverage |
| Under 6 Years | 2,533 (98.2%) | 46 (1.8%) |
| 6 to 18 Years | 6,714 (95.8%) | 293 (4.2%) |
| 19 to 25 Years | 2,616 (87.7%) | 366 (12.3%) |
| 26 to 34 Years | 3,407 (90.9%) | 341 (9.1%) |
| 35 to 44 Years | 4,609 (90.3%) | 492 (9.7%) |
| 45 to 54 Years | 4,810 (93.4%) | 342 (6.6%) |
| 55 to 64 Years | 6,638 (94.8%) | 362 (5.2%) |
| 65 to 74 Years | 6,551 (99.8%) | 13 (0.2%) |
| 75 Years and older | 4,168 (99.9%) | 6 (0.1%) |
| Total | 42,046 (94.9%) | 2,261 (5.1%) |
Health Insurance Coverage by Citizenship Status in Itasca County
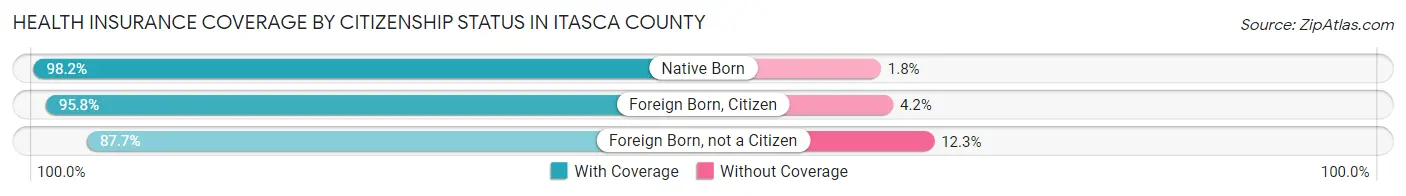
| Citizenship Status | With Coverage | Without Coverage |
| Native Born | 2,533 (98.2%) | 46 (1.8%) |
| Foreign Born, Citizen | 6,714 (95.8%) | 293 (4.2%) |
| Foreign Born, not a Citizen | 2,616 (87.7%) | 366 (12.3%) |
Health Insurance Coverage by Household Income in Itasca County
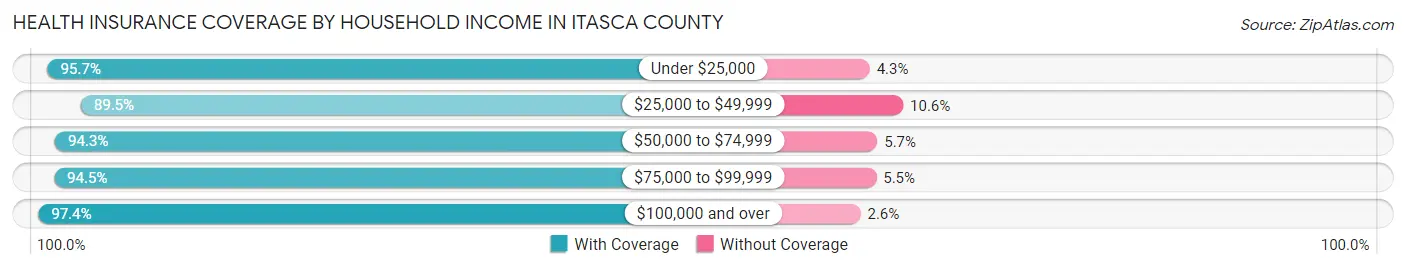
| Household Income | With Coverage | Without Coverage |
| Under $25,000 | 4,993 (95.7%) | 224 (4.3%) |
| $25,000 to $49,999 | 6,281 (89.4%) | 741 (10.5%) |
| $50,000 to $74,999 | 7,643 (94.3%) | 463 (5.7%) |
| $75,000 to $99,999 | 6,571 (94.5%) | 384 (5.5%) |
| $100,000 and over | 16,103 (97.4%) | 425 (2.6%) |
Public vs Private Health Insurance Coverage by Age in Itasca County
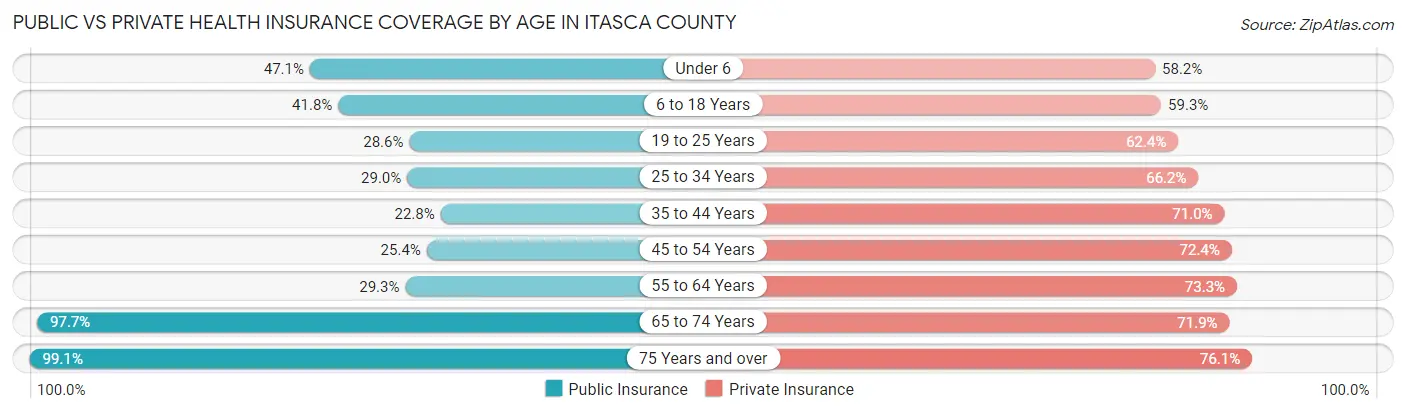
| Age Bracket | Public Insurance | Private Insurance |
| Under 6 | 1,214 (47.1%) | 1,500 (58.2%) |
| 6 to 18 Years | 2,929 (41.8%) | 4,154 (59.3%) |
| 19 to 25 Years | 853 (28.6%) | 1,862 (62.4%) |
| 25 to 34 Years | 1,087 (29.0%) | 2,480 (66.2%) |
| 35 to 44 Years | 1,163 (22.8%) | 3,622 (71.0%) |
| 45 to 54 Years | 1,307 (25.4%) | 3,728 (72.4%) |
| 55 to 64 Years | 2,054 (29.3%) | 5,133 (73.3%) |
| 65 to 74 Years | 6,413 (97.7%) | 4,722 (71.9%) |
| 75 Years and over | 4,136 (99.1%) | 3,178 (76.1%) |
| Total | 21,156 (47.7%) | 30,379 (68.6%) |
Disability Status by Sex by Age in Itasca County
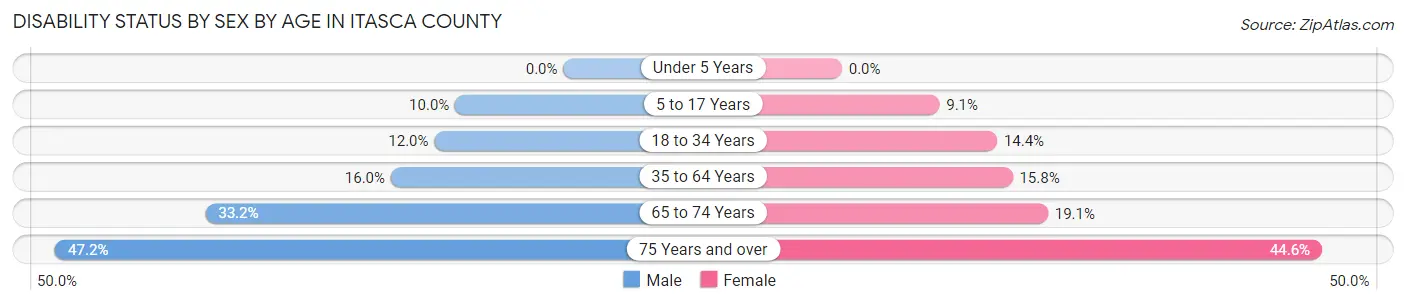
| Age Bracket | Male | Female |
| Under 5 Years | 0 (0.0%) | 0 (0.0%) |
| 5 to 17 Years | 365 (10.0%) | 296 (9.0%) |
| 18 to 34 Years | 458 (12.0%) | 489 (14.4%) |
| 35 to 64 Years | 1,397 (16.0%) | 1,351 (15.8%) |
| 65 to 74 Years | 1,097 (33.2%) | 624 (19.1%) |
| 75 Years and over | 906 (47.2%) | 1,004 (44.6%) |
Disability Class by Sex by Age in Itasca County
Disability Class: Hearing Difficulty
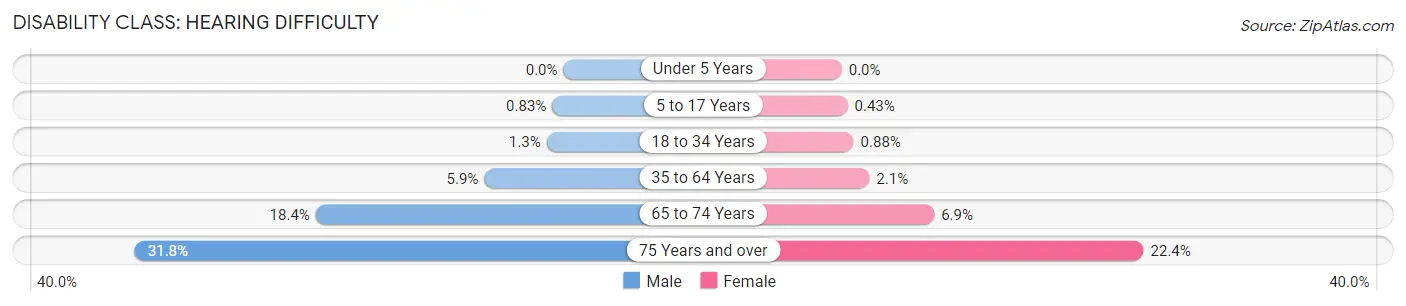
| Age Bracket | Male | Female |
| Under 5 Years | 0 (0.0%) | 0 (0.0%) |
| 5 to 17 Years | 30 (0.8%) | 14 (0.4%) |
| 18 to 34 Years | 48 (1.3%) | 30 (0.9%) |
| 35 to 64 Years | 513 (5.9%) | 175 (2.1%) |
| 65 to 74 Years | 607 (18.4%) | 224 (6.9%) |
| 75 Years and over | 611 (31.8%) | 505 (22.4%) |
Disability Class: Vision Difficulty
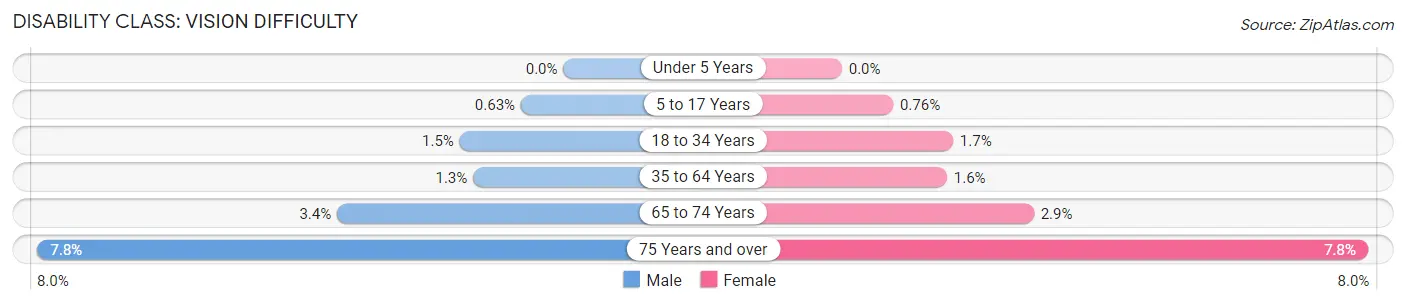
| Age Bracket | Male | Female |
| Under 5 Years | 0 (0.0%) | 0 (0.0%) |
| 5 to 17 Years | 23 (0.6%) | 25 (0.8%) |
| 18 to 34 Years | 59 (1.5%) | 56 (1.7%) |
| 35 to 64 Years | 117 (1.3%) | 133 (1.6%) |
| 65 to 74 Years | 111 (3.4%) | 93 (2.9%) |
| 75 Years and over | 150 (7.8%) | 176 (7.8%) |
Disability Class: Cognitive Difficulty
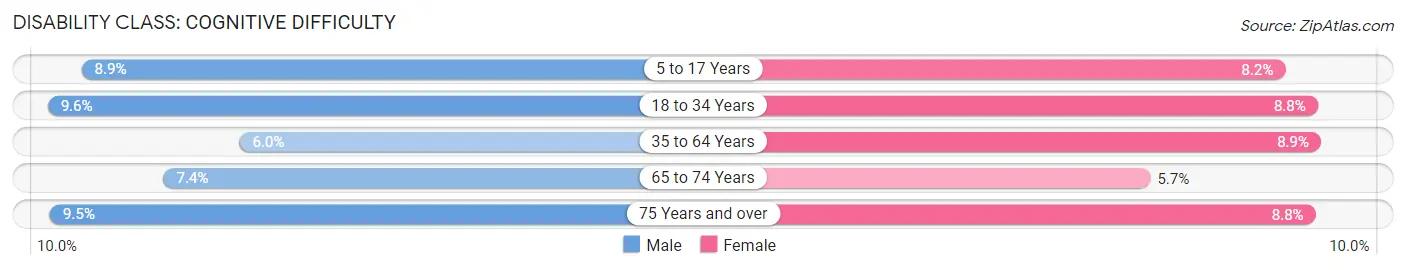
| Age Bracket | Male | Female |
| 5 to 17 Years | 325 (8.9%) | 269 (8.2%) |
| 18 to 34 Years | 366 (9.6%) | 300 (8.8%) |
| 35 to 64 Years | 524 (6.0%) | 758 (8.9%) |
| 65 to 74 Years | 245 (7.4%) | 187 (5.7%) |
| 75 Years and over | 183 (9.5%) | 198 (8.8%) |
Disability Class: Ambulatory Difficulty
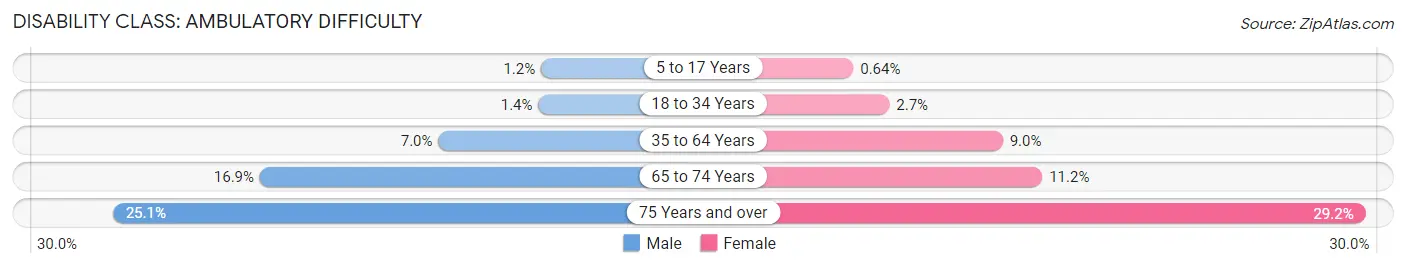
| Age Bracket | Male | Female |
| 5 to 17 Years | 45 (1.2%) | 21 (0.6%) |
| 18 to 34 Years | 53 (1.4%) | 90 (2.6%) |
| 35 to 64 Years | 607 (7.0%) | 764 (9.0%) |
| 65 to 74 Years | 558 (16.9%) | 364 (11.2%) |
| 75 Years and over | 482 (25.1%) | 657 (29.2%) |
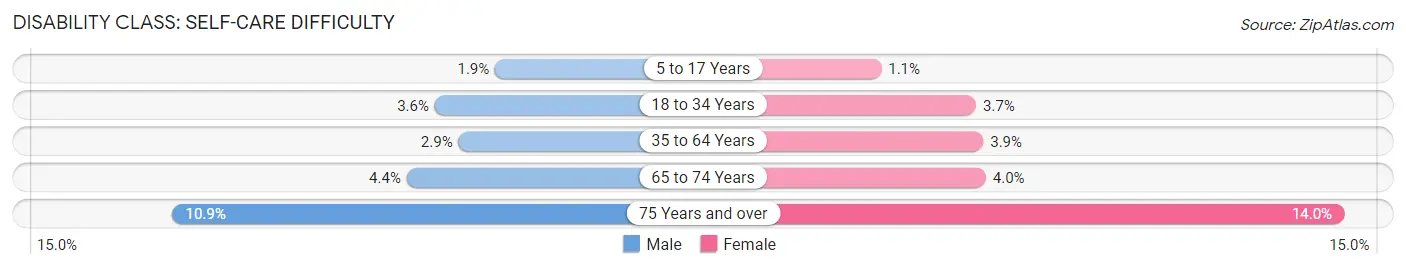
Disability Class: Self-Care Difficulty
| Age Bracket | Male | Female |
| 5 to 17 Years | 69 (1.9%) | 36 (1.1%) |
| 18 to 34 Years | 137 (3.6%) | 127 (3.7%) |
| 35 to 64 Years | 255 (2.9%) | 336 (3.9%) |
| 65 to 74 Years | 144 (4.4%) | 131 (4.0%) |
| 75 Years and over | 209 (10.9%) | 315 (14.0%) |
Technology Access in Itasca County
Computing Device Access in Itasca County
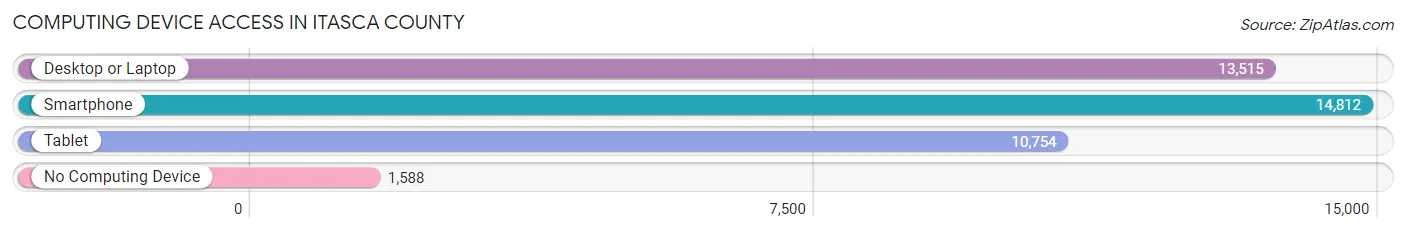
| Device Type | # Households | % Households |
| Desktop or Laptop | 13,515 | 74.6% |
| Smartphone | 14,812 | 81.7% |
| Tablet | 10,754 | 59.4% |
| No Computing Device | 1,588 | 8.8% |
| Total | 18,121 | 100.0% |
Internet Access in Itasca County
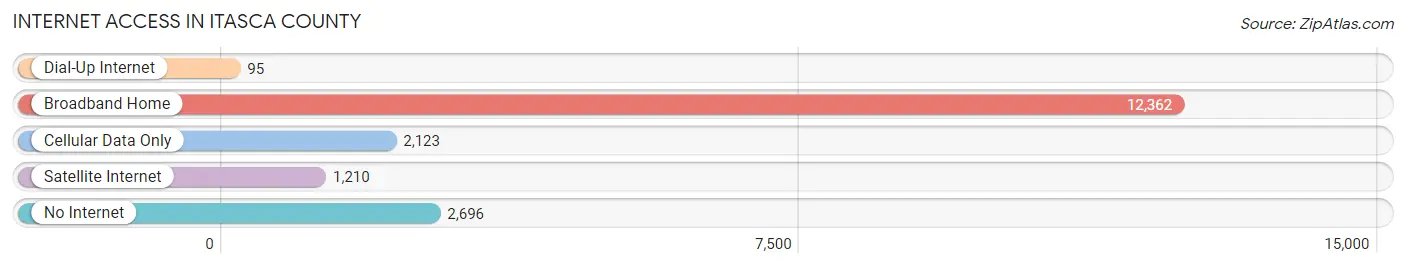
| Internet Type | # Households | % Households |
| Dial-Up Internet | 95 | 0.5% |
| Broadband Home | 12,362 | 68.2% |
| Cellular Data Only | 2,123 | 11.7% |
| Satellite Internet | 1,210 | 6.7% |
| No Internet | 2,696 | 14.9% |
| Total | 18,121 | 100.0% |
Itasca County Summary
Itasca County is located in the north-central region of Minnesota, and is part of the state’s Iron Range. It is bordered by Koochiching County to the north, St. Louis County to the east, Aitkin County to the south, and Clearwater County to the west. The county seat is Grand Rapids, and the county’s population was 45,058 as of the 2010 census.
History
Itasca County was established in 1849, and was named after Lake Itasca, the source of the Mississippi River. The county was originally part of St. Louis County, and was organized in 1871. The county was initially populated by Native Americans, and the first white settlers arrived in the late 1800s. The county was largely rural until the early 1900s, when the iron ore industry began to develop in the area. This led to a population boom, and the county’s population grew from just over 5,000 in 1900 to over 20,000 by 1930.
Geography
Itasca County covers an area of 2,945 square miles, making it the second-largest county in Minnesota. The county is located in the northern part of the state, and is part of the Iron Range. The county is mostly forested, with the majority of the land being covered by coniferous trees. The county is home to several lakes, including Lake Winnibigoshish, Bowstring Lake, and Lake Pokegama. The county is also home to the Mississippi Headwaters, the source of the Mississippi River.
Economy
Itasca County’s economy is largely based on natural resources, particularly timber and iron ore. The county is home to several large timber companies, and the iron ore industry is a major employer in the area. The county is also home to several manufacturing companies, including paper mills and food processing plants. Tourism is also an important part of the county’s economy, with many visitors coming to the area to enjoy the lakes and forests.
Demographics
As of the 2010 census, Itasca County had a population of 45,058. The population is largely white (94.3%), with small percentages of Native Americans (2.2%), African Americans (1.2%), and Asians (1.1%). The median household income is $45,845, and the median age is 44.7. The county’s population is largely rural, with only 11.3% of the population living in urban areas.
Itasca County is a largely rural county with a strong economy based on natural resources. The county is home to several lakes and forests, making it a popular destination for tourists. The county’s population is largely white, with small percentages of other races. The median household income is slightly above the state average, and the median age is slightly higher than the state average.
Common Questions
What is the Total Population of Itasca County?
Total Population of Itasca County is 45,054.
What is the Total Male Population of Itasca County?
Total Male Population of Itasca County is 22,891.
What is the Total Female Population of Itasca County?
Total Female Population of Itasca County is 22,163.
What is the Ratio of Males per 100 Females in Itasca County?
There are 103.28 Males per 100 Females in Itasca County.
What is the Ratio of Females per 100 Males in Itasca County?
There are 96.82 Females per 100 Males in Itasca County.
What is the Median Population Age in Itasca County?
Median Population Age in Itasca County is 46.8 Years.
What is the Average Family Size in Itasca County
Average Family Size in Itasca County is 3.0 People.
What is the Average Household Size in Itasca County
Average Household Size in Itasca County is 2.4 People.
What is Per Capita Income in Itasca County?
Per Capita income in Itasca County is $34,528.
What is the Median Family Income in Itasca County?
Median Family Income in Itasca County is $82,653.
What is the Median Household income in Itasca County?
Median Household Income in Itasca County is $63,962.
What is Income or Wage Gap in Itasca County?
Income or Wage Gap in Itasca County is 34.3%.
Women in Itasca County earn 65.7 cents for every dollar earned by a man.
What is Family Income Deficit in Itasca County?
Family Income Deficit in Itasca County is $9,871.
Families that are below poverty line in Itasca County earn $9,871 less on average than the poverty threshold level.
What is Inequality or Gini Index in Itasca County?
Inequality or Gini Index in Itasca County is 0.43.
How Large is the Labor Force in Itasca County?
There are 20,508 People in the Labor Forcein in Itasca County.
What is the Percentage of People in the Labor Force in Itasca County?
55.5% of People are in the Labor Force in Itasca County.
What is the Unemployment Rate in Itasca County?
Unemployment Rate in Itasca County is 6.2%.