Isanti County, MN
Isanti County Map
Isanti County Overview
41,257
TOTAL POPULATION
20,955
MALE POPULATION
20,302
FEMALE POPULATION
103.22
MALES / 100 FEMALES
96.88
FEMALES / 100 MALES
40.2
MEDIAN AGE
3.1
AVG FAMILY SIZE
2.6
AVG HOUSEHOLD SIZE
$38,609
PER CAPITA INCOME
$93,773
AVG FAMILY INCOME
$84,063
AVG HOUSEHOLD INCOME
37.2%
WAGE / INCOME GAP [ % ]
62.8¢/ $1
WAGE / INCOME GAP [ $ ]
$9,633
FAMILY INCOME DEFICIT
0.39
INEQUALITY / GINI INDEX
22,050
LABOR FORCE [ PEOPLE ]
67.3%
PERCENT IN LABOR FORCE
4.2%
UNEMPLOYMENT RATE
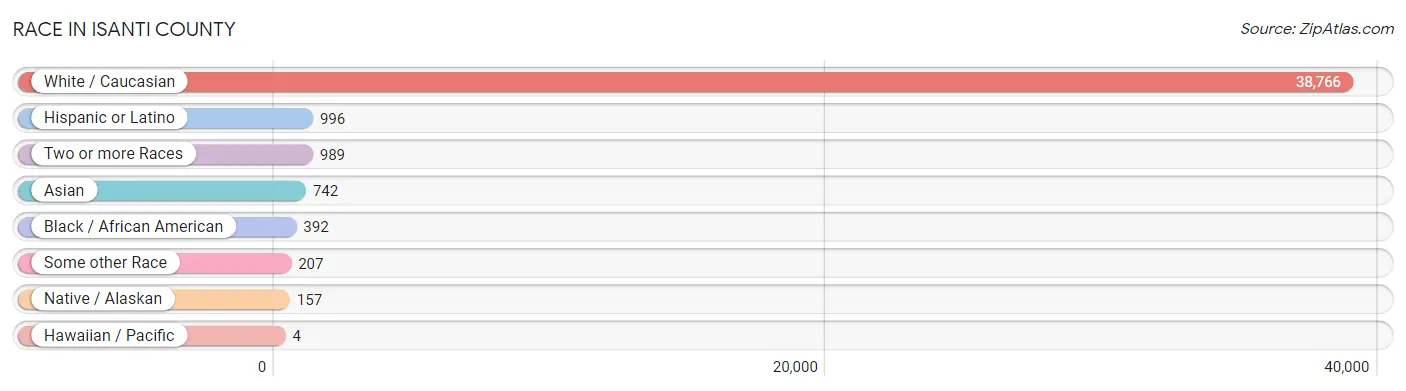
Race in Isanti County
The most populous races in Isanti County are White / Caucasian (38,766 | 94.0%), Hispanic or Latino (996 | 2.4%), and Two or more Races (989 | 2.4%).
| Race | # Population | % Population |
| Asian | 742 | 1.8% |
| Black / African American | 392 | 0.9% |
| Hawaiian / Pacific | 4 | 0.0% |
| Hispanic or Latino | 996 | 2.4% |
| Native / Alaskan | 157 | 0.4% |
| White / Caucasian | 38,766 | 94.0% |
| Two or more Races | 989 | 2.4% |
| Some other Race | 207 | 0.5% |
| Total | 41,257 | 100.0% |
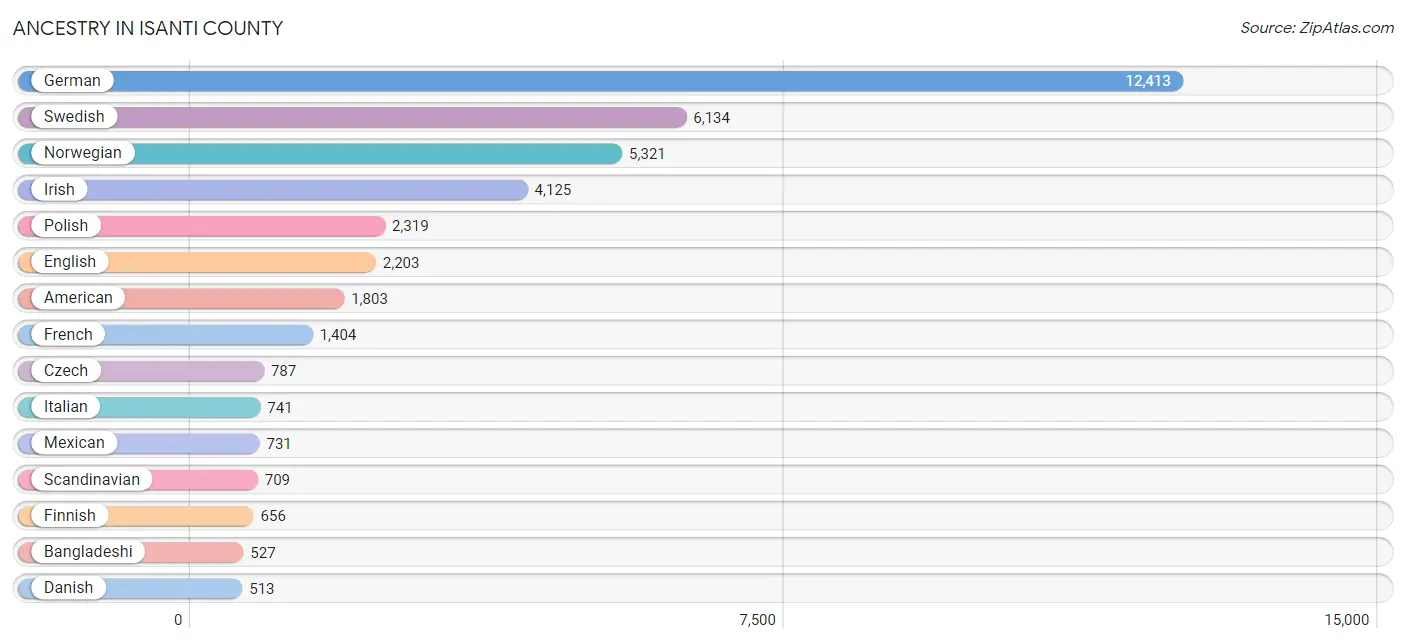
Ancestry in Isanti County
The most populous ancestries reported in Isanti County are German (12,413 | 30.1%), Swedish (6,134 | 14.9%), Norwegian (5,321 | 12.9%), Irish (4,125 | 10.0%), and Polish (2,319 | 5.6%), together accounting for 73.5% of all Isanti County residents.
| Ancestry | # Population | % Population |
| African | 118 | 0.3% |
| American | 1,803 | 4.4% |
| Apache | 12 | 0.0% |
| Arab | 212 | 0.5% |
| Argentinean | 12 | 0.0% |
| Austrian | 157 | 0.4% |
| Bangladeshi | 527 | 1.3% |
| Belgian | 21 | 0.1% |
| Bhutanese | 25 | 0.1% |
| Blackfeet | 103 | 0.3% |
| British | 63 | 0.2% |
| Burmese | 12 | 0.0% |
| Canadian | 74 | 0.2% |
| Central American | 57 | 0.1% |
| Central American Indian | 11 | 0.0% |
| Cherokee | 33 | 0.1% |
| Chickasaw | 7 | 0.0% |
| Chippewa | 221 | 0.5% |
| Colombian | 2 | 0.0% |
| Cree | 4 | 0.0% |
| Croatian | 23 | 0.1% |
| Cuban | 23 | 0.1% |
| Czech | 787 | 1.9% |
| Czechoslovakian | 75 | 0.2% |
| Danish | 513 | 1.2% |
| Dutch | 382 | 0.9% |
| Eastern European | 20 | 0.1% |
| Egyptian | 6 | 0.0% |
| English | 2,203 | 5.3% |
| Ethiopian | 6 | 0.0% |
| European | 454 | 1.1% |
| Finnish | 656 | 1.6% |
| French | 1,404 | 3.4% |
| French American Indian | 9 | 0.0% |
| French Canadian | 343 | 0.8% |
| German | 12,413 | 30.1% |
| Greek | 18 | 0.0% |
| Guatemalan | 4 | 0.0% |
| Honduran | 53 | 0.1% |
| Hopi | 26 | 0.1% |
| Hungarian | 194 | 0.5% |
| Icelander | 118 | 0.3% |
| Indian (Asian) | 56 | 0.1% |
| Indonesian | 2 | 0.0% |
| Irish | 4,125 | 10.0% |
| Italian | 741 | 1.8% |
| Japanese | 24 | 0.1% |
| Kenyan | 62 | 0.2% |
| Korean | 44 | 0.1% |
| Lebanese | 74 | 0.2% |
| Lithuanian | 23 | 0.1% |
| Luxembourger | 38 | 0.1% |
| Malaysian | 47 | 0.1% |
| Mexican | 731 | 1.8% |
| Mexican American Indian | 7 | 0.0% |
| Navajo | 26 | 0.1% |
| Nigerian | 14 | 0.0% |
| Northern European | 144 | 0.4% |
| Norwegian | 5,321 | 12.9% |
| Pakistani | 8 | 0.0% |
| Polish | 2,319 | 5.6% |
| Portuguese | 17 | 0.0% |
| Potawatomi | 4 | 0.0% |
| Puerto Rican | 18 | 0.0% |
| Romanian | 11 | 0.0% |
| Russian | 111 | 0.3% |
| Scandinavian | 709 | 1.7% |
| Scotch-Irish | 170 | 0.4% |
| Scottish | 388 | 0.9% |
| Serbian | 7 | 0.0% |
| Sioux | 61 | 0.2% |
| Slavic | 61 | 0.2% |
| Slovak | 15 | 0.0% |
| Slovene | 52 | 0.1% |
| Somali | 6 | 0.0% |
| South American | 51 | 0.1% |
| Spaniard | 12 | 0.0% |
| Spanish | 15 | 0.0% |
| Sri Lankan | 14 | 0.0% |
| Subsaharan African | 206 | 0.5% |
| Swedish | 6,134 | 14.9% |
| Swiss | 114 | 0.3% |
| Syrian | 106 | 0.3% |
| Thai | 94 | 0.2% |
| Ukrainian | 49 | 0.1% |
| Venezuelan | 37 | 0.1% |
| Welsh | 111 | 0.3% |
| Yugoslavian | 9 | 0.0% | View All 88 Rows |
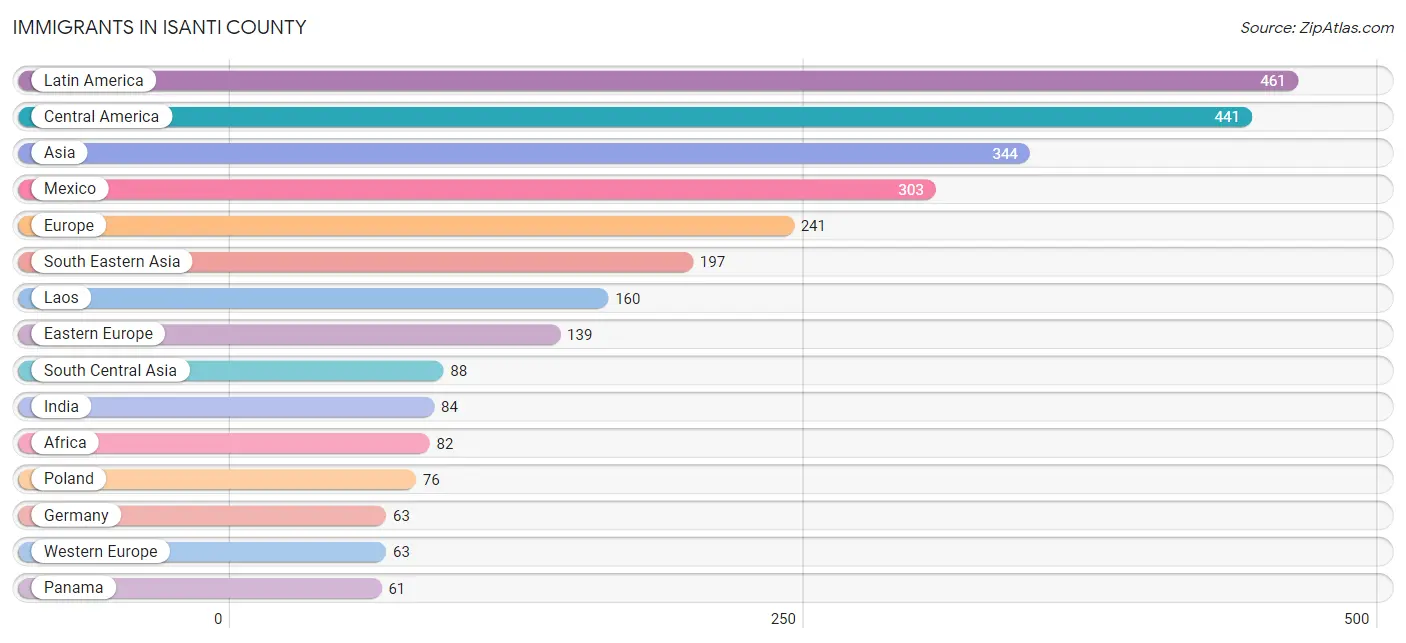
Immigrants in Isanti County
The most numerous immigrant groups reported in Isanti County came from Latin America (461 | 1.1%), Central America (441 | 1.1%), Asia (344 | 0.8%), Mexico (303 | 0.7%), and Europe (241 | 0.6%), together accounting for 4.3% of all Isanti County residents.
| Immigration Origin | # Population | % Population |
| Africa | 82 | 0.2% |
| Argentina | 18 | 0.0% |
| Asia | 344 | 0.8% |
| Belarus | 7 | 0.0% |
| Canada | 39 | 0.1% |
| Central America | 441 | 1.1% |
| China | 54 | 0.1% |
| Colombia | 2 | 0.0% |
| Croatia | 6 | 0.0% |
| Eastern Africa | 40 | 0.1% |
| Eastern Asia | 59 | 0.1% |
| Eastern Europe | 139 | 0.3% |
| England | 14 | 0.0% |
| Europe | 241 | 0.6% |
| Germany | 63 | 0.2% |
| Greece | 8 | 0.0% |
| Guatemala | 24 | 0.1% |
| Honduras | 53 | 0.1% |
| Hungary | 16 | 0.0% |
| India | 84 | 0.2% |
| Italy | 4 | 0.0% |
| Japan | 3 | 0.0% |
| Kenya | 36 | 0.1% |
| Korea | 2 | 0.0% |
| Laos | 160 | 0.4% |
| Latin America | 461 | 1.1% |
| Liberia | 42 | 0.1% |
| Mexico | 303 | 0.7% |
| Moldova | 11 | 0.0% |
| Northern Europe | 25 | 0.1% |
| Panama | 61 | 0.2% |
| Philippines | 4 | 0.0% |
| Poland | 76 | 0.2% |
| Russia | 18 | 0.0% |
| Somalia | 4 | 0.0% |
| South America | 20 | 0.1% |
| South Central Asia | 88 | 0.2% |
| South Eastern Asia | 197 | 0.5% |
| Southern Europe | 12 | 0.0% |
| Sri Lanka | 4 | 0.0% |
| Thailand | 26 | 0.1% |
| Ukraine | 5 | 0.0% |
| Vietnam | 5 | 0.0% |
| Western Africa | 42 | 0.1% |
| Western Europe | 63 | 0.2% | View All 45 Rows |
Sex and Age in Isanti County
Sex and Age in Isanti County
The most populous age groups in Isanti County are 55 to 59 Years (1,717 | 8.2%) for men and 55 to 59 Years (1,545 | 7.6%) for women.
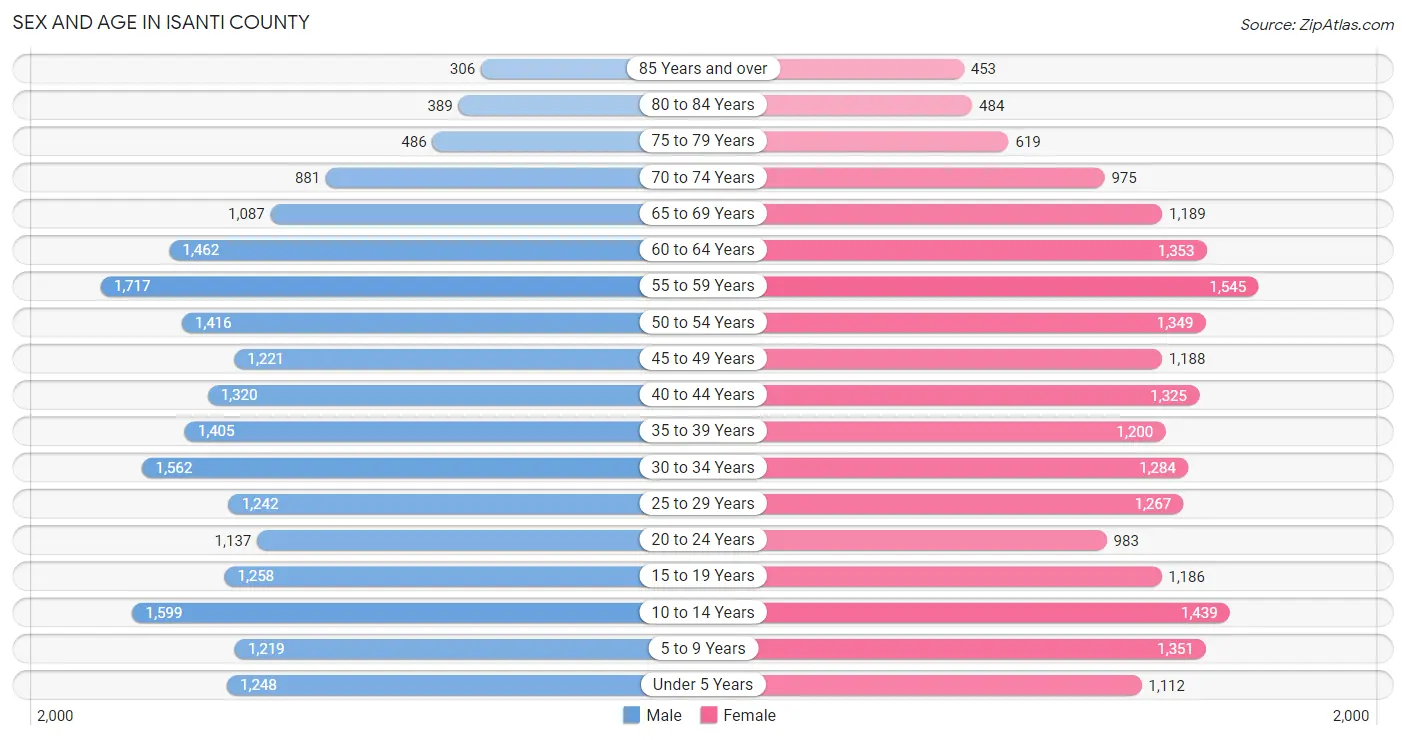
| Age Bracket | Male | Female |
| Under 5 Years | 1,248 (6.0%) | 1,112 (5.5%) |
| 5 to 9 Years | 1,219 (5.8%) | 1,351 (6.7%) |
| 10 to 14 Years | 1,599 (7.6%) | 1,439 (7.1%) |
| 15 to 19 Years | 1,258 (6.0%) | 1,186 (5.8%) |
| 20 to 24 Years | 1,137 (5.4%) | 983 (4.8%) |
| 25 to 29 Years | 1,242 (5.9%) | 1,267 (6.2%) |
| 30 to 34 Years | 1,562 (7.4%) | 1,284 (6.3%) |
| 35 to 39 Years | 1,405 (6.7%) | 1,200 (5.9%) |
| 40 to 44 Years | 1,320 (6.3%) | 1,325 (6.5%) |
| 45 to 49 Years | 1,221 (5.8%) | 1,188 (5.9%) |
| 50 to 54 Years | 1,416 (6.8%) | 1,349 (6.6%) |
| 55 to 59 Years | 1,717 (8.2%) | 1,545 (7.6%) |
| 60 to 64 Years | 1,462 (7.0%) | 1,353 (6.7%) |
| 65 to 69 Years | 1,087 (5.2%) | 1,189 (5.9%) |
| 70 to 74 Years | 881 (4.2%) | 975 (4.8%) |
| 75 to 79 Years | 486 (2.3%) | 619 (3.0%) |
| 80 to 84 Years | 389 (1.9%) | 484 (2.4%) |
| 85 Years and over | 306 (1.5%) | 453 (2.2%) |
| Total | 20,955 (100.0%) | 20,302 (100.0%) |
Families and Households in Isanti County
Median Family Size in Isanti County
The median family size in Isanti County is 3.10 persons per family, with single female/mother families (1,433 | 13.7%) accounting for the largest median family size of 3.26 persons per family. On the other hand, married-couple families (8,139 | 77.9%) represent the smallest median family size with 3.07 persons per family.
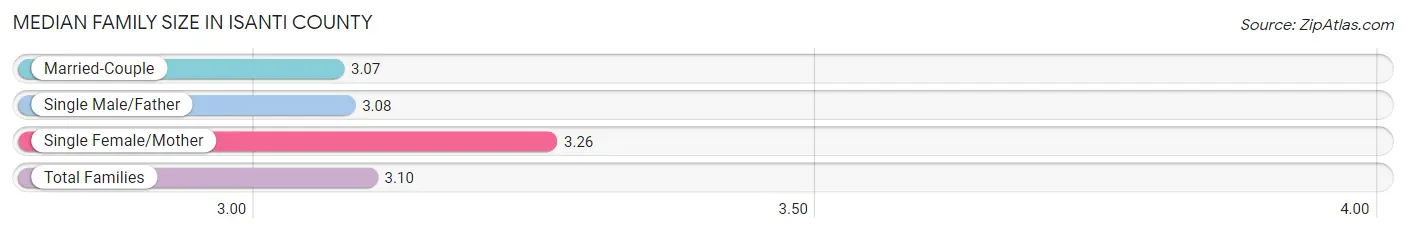
| Family Type | # Families | Family Size |
| Married-Couple | 8,139 (77.9%) | 3.07 |
| Single Male/Father | 877 (8.4%) | 3.08 |
| Single Female/Mother | 1,433 (13.7%) | 3.26 |
| Total Families | 10,449 (100.0%) | 3.10 |
Median Household Size in Isanti County
The median household size in Isanti County is 2.62 persons per household, with single male/father households (877 | 5.6%) accounting for the largest median household size of 3.89 persons per household. non-family households (5,123 | 32.9%) represent the smallest median household size with 1.35 persons per household.
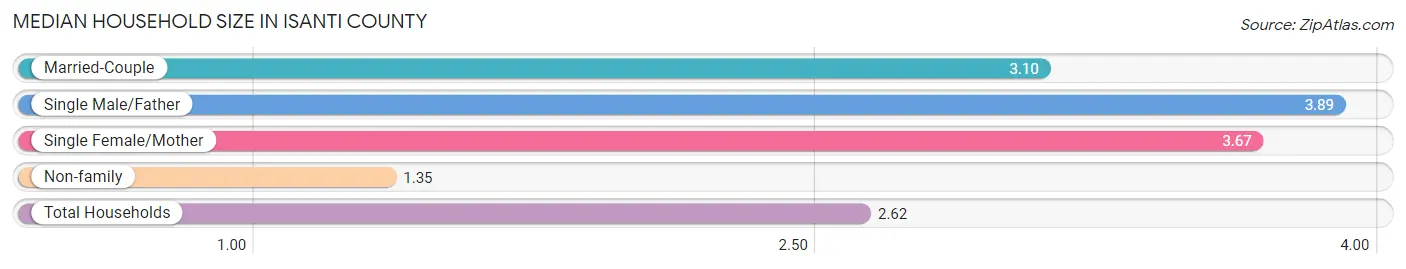
| Household Type | # Households | Household Size |
| Married-Couple | 8,139 (52.3%) | 3.10 |
| Single Male/Father | 877 (5.6%) | 3.89 |
| Single Female/Mother | 1,433 (9.2%) | 3.67 |
| Non-family | 5,123 (32.9%) | 1.35 |
| Total Households | 15,572 (100.0%) | 2.62 |
Household Size by Marriage Status in Isanti County
Out of a total of 15,572 households in Isanti County, 10,449 (67.1%) are family households, while 5,123 (32.9%) are nonfamily households. The most numerous type of family households are 2-person households, comprising 4,925, and the most common type of nonfamily households are 1-person households, comprising 3,838.
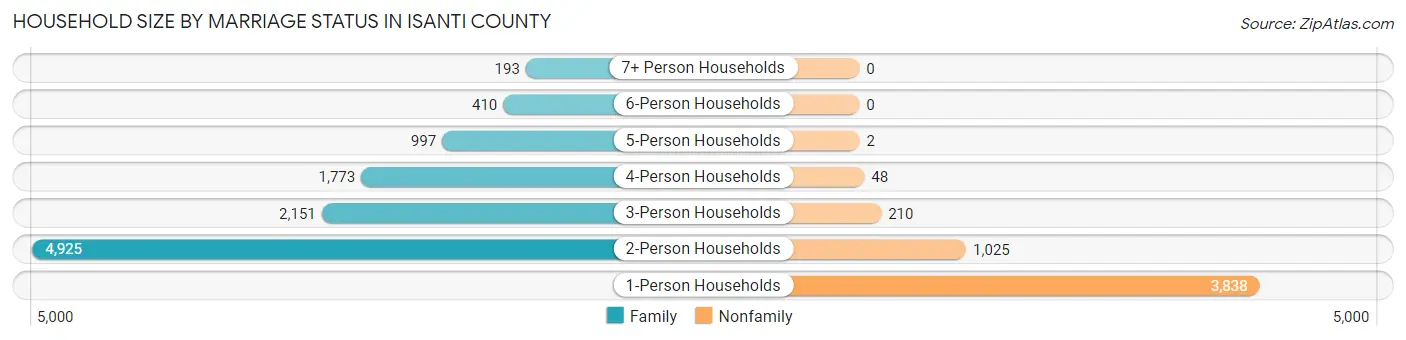
| Household Size | Family Households | Nonfamily Households |
| 1-Person Households | - | 3,838 (24.6%) |
| 2-Person Households | 4,925 (31.6%) | 1,025 (6.6%) |
| 3-Person Households | 2,151 (13.8%) | 210 (1.3%) |
| 4-Person Households | 1,773 (11.4%) | 48 (0.3%) |
| 5-Person Households | 997 (6.4%) | 2 (0.0%) |
| 6-Person Households | 410 (2.6%) | 0 (0.0%) |
| 7+ Person Households | 193 (1.2%) | 0 (0.0%) |
| Total | 10,449 (67.1%) | 5,123 (32.9%) |
Female Fertility in Isanti County
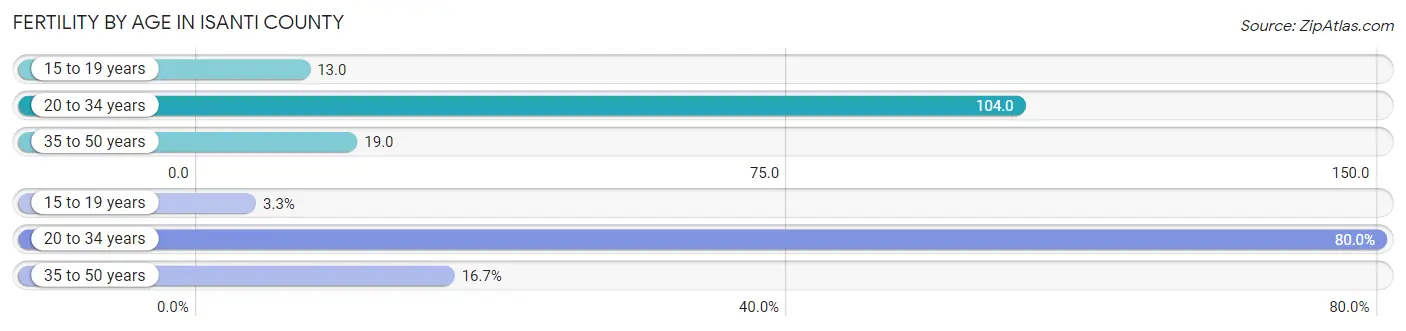
Fertility by Age in Isanti County
Average fertility rate in Isanti County is 52.0 births per 1,000 women. Women in the age bracket of 20 to 34 years have the highest fertility rate with 104.0 births per 1,000 women. Women in the age bracket of 20 to 34 years acount for 80.0% of all women with births.
| Age Bracket | Women with Births | Births / 1,000 Women |
| 15 to 19 years | 15 (3.3%) | 13.0 |
| 20 to 34 years | 368 (80.0%) | 104.0 |
| 35 to 50 years | 77 (16.7%) | 19.0 |
| Total | 460 (100.0%) | 52.0 |
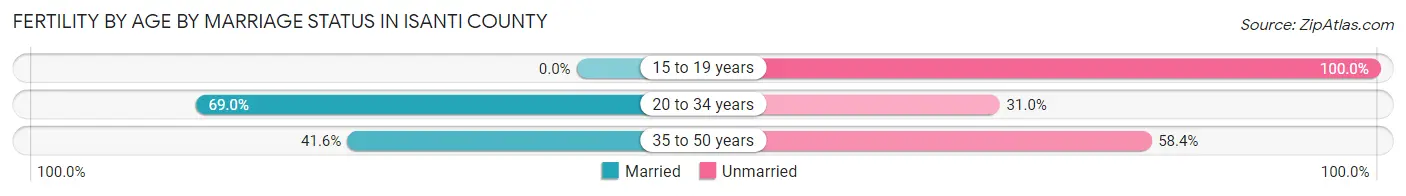
Fertility by Age by Marriage Status in Isanti County
62.2% of women with births (460) in Isanti County are married. The highest percentage of unmarried women with births falls into 15 to 19 years age bracket with 100.0% of them unmarried at the time of birth, while the lowest percentage of unmarried women with births belong to 20 to 34 years age bracket with 31.0% of them unmarried.
| Age Bracket | Married | Unmarried |
| 15 to 19 years | 0 (0.0%) | 15 (100.0%) |
| 20 to 34 years | 254 (69.0%) | 114 (31.0%) |
| 35 to 50 years | 32 (41.6%) | 45 (58.4%) |
| Total | 286 (62.2%) | 174 (37.8%) |
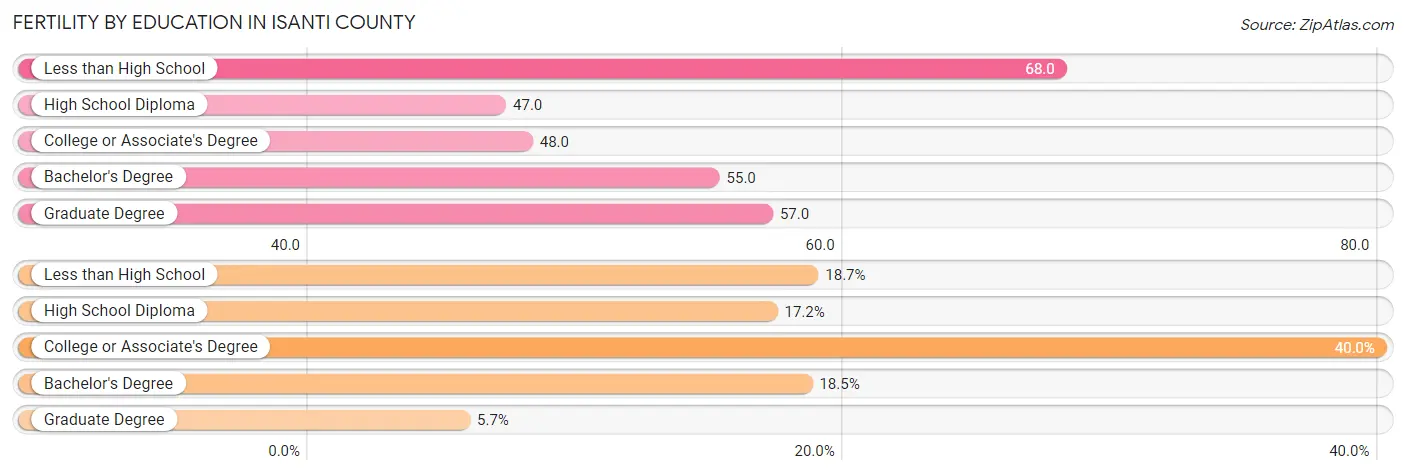
Fertility by Education in Isanti County
Average fertility rate in Isanti County is 52.0 births per 1,000 women. Women with the education attainment of less than high school have the highest fertility rate of 68.0 births per 1,000 women, while women with the education attainment of high school diploma have the lowest fertility at 47.0 births per 1,000 women. Women with the education attainment of college or associate's degree represent 40.0% of all women with births.
| Educational Attainment | Women with Births | Births / 1,000 Women |
| Less than High School | 86 (18.7%) | 68.0 |
| High School Diploma | 79 (17.2%) | 47.0 |
| College or Associate's Degree | 184 (40.0%) | 48.0 |
| Bachelor's Degree | 85 (18.5%) | 55.0 |
| Graduate Degree | 26 (5.7%) | 57.0 |
| Total | 460 (100.0%) | 52.0 |
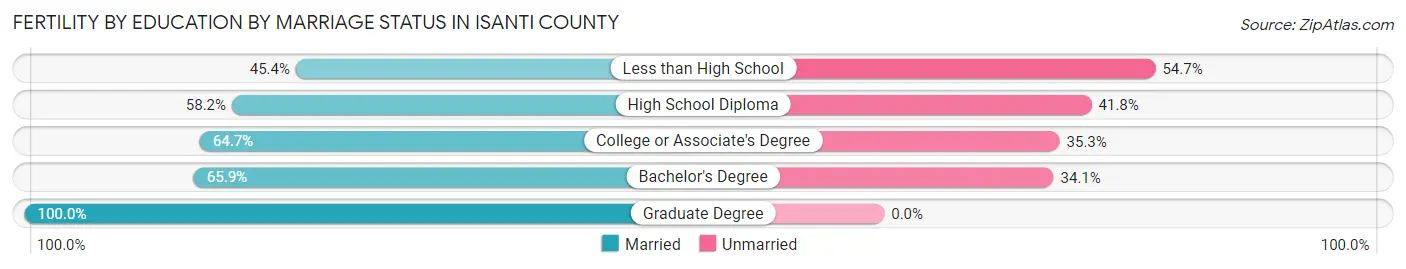
Fertility by Education by Marriage Status in Isanti County
37.8% of women with births in Isanti County are unmarried. Women with the educational attainment of graduate degree are most likely to be married with 100.0% of them married at childbirth, while women with the educational attainment of less than high school are least likely to be married with 54.6% of them unmarried at childbirth.
| Educational Attainment | Married | Unmarried |
| Less than High School | 39 (45.4%) | 47 (54.6%) |
| High School Diploma | 46 (58.2%) | 33 (41.8%) |
| College or Associate's Degree | 119 (64.7%) | 65 (35.3%) |
| Bachelor's Degree | 56 (65.9%) | 29 (34.1%) |
| Graduate Degree | 26 (100.0%) | 0 (0.0%) |
| Total | 286 (62.2%) | 174 (37.8%) |
Income in Isanti County
Income Overview in Isanti County
Per Capita Income in Isanti County is $38,609, while median incomes of families and households are $93,773 and $84,063 respectively.
| Characteristic | Number | Measure |
| Per Capita Income | 41,257 | $38,609 |
| Median Family Income | 10,449 | $93,773 |
| Mean Family Income | 10,449 | $111,719 |
| Median Household Income | 15,572 | $84,063 |
| Mean Household Income | 15,572 | $98,379 |
| Income Deficit | 10,449 | $9,633 |
| Wage / Income Gap (%) | 41,257 | 37.21% |
| Wage / Income Gap ($) | 41,257 | 62.79¢ per $1 |
| Gini / Inequality Index | 41,257 | 0.39 |
Earnings by Sex in Isanti County
Average Earnings in Isanti County are $46,315, $56,980 for men and $35,777 for women, a difference of 37.2%.
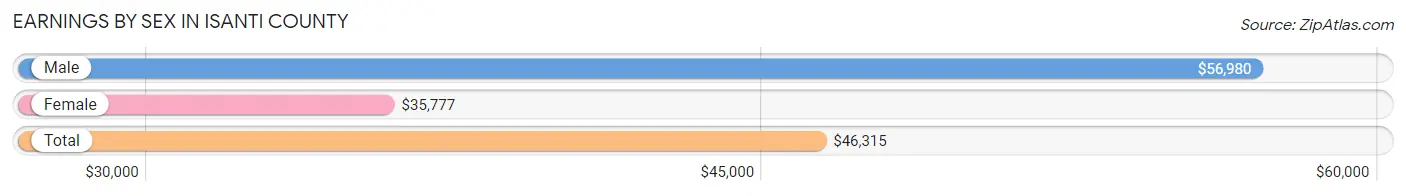
| Sex | Number | Average Earnings |
| Male | 12,460 (53.7%) | $56,980 |
| Female | 10,732 (46.3%) | $35,777 |
| Total | 23,192 (100.0%) | $46,315 |
Earnings by Sex by Income Bracket in Isanti County
The most common earnings brackets in Isanti County are $100,000+ for men (2,038 | 16.4%) and $55,000 to $64,999 for women (958 | 8.9%).
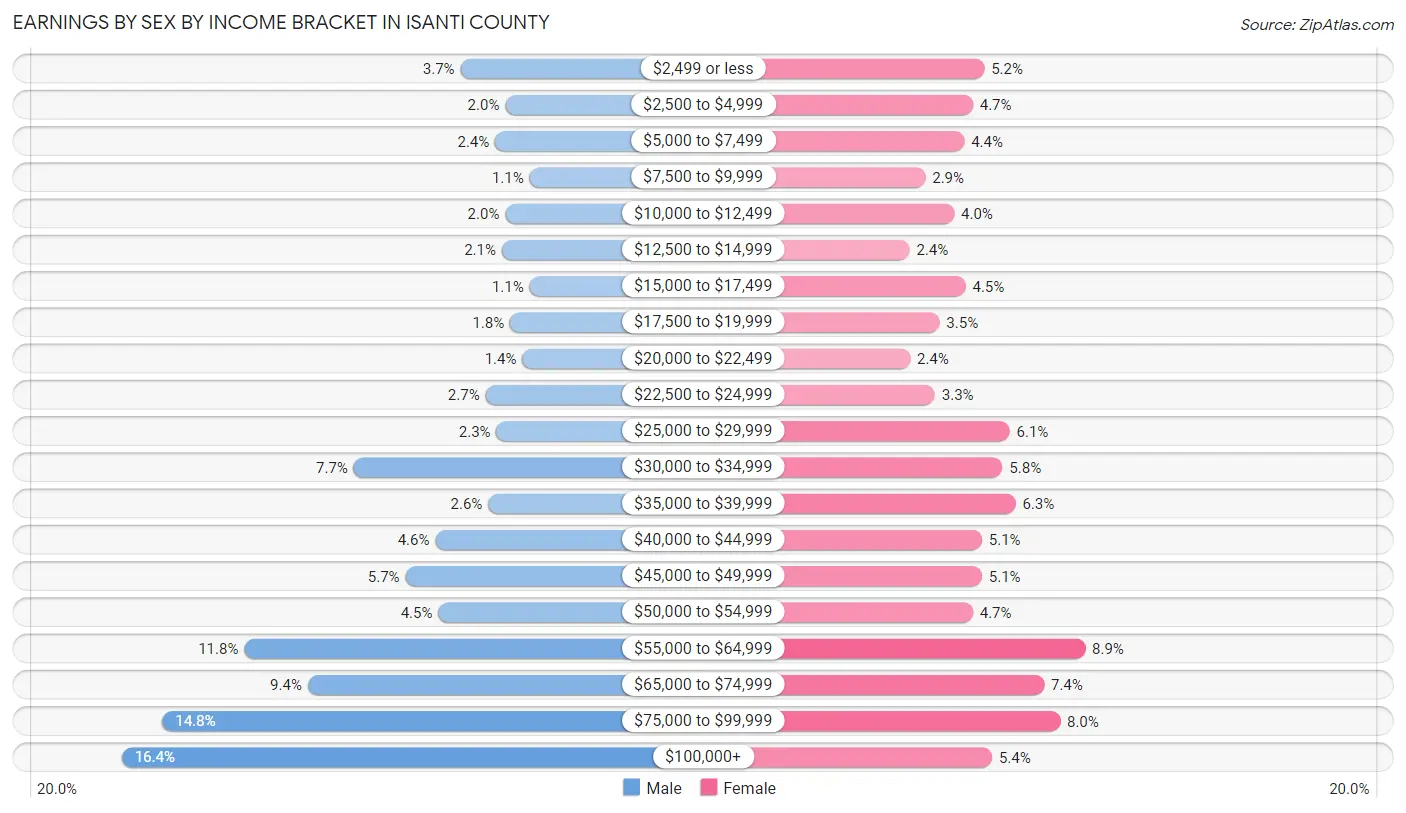
| Income | Male | Female |
| $2,499 or less | 457 (3.7%) | 553 (5.1%) |
| $2,500 to $4,999 | 248 (2.0%) | 507 (4.7%) |
| $5,000 to $7,499 | 295 (2.4%) | 472 (4.4%) |
| $7,500 to $9,999 | 134 (1.1%) | 315 (2.9%) |
| $10,000 to $12,499 | 248 (2.0%) | 431 (4.0%) |
| $12,500 to $14,999 | 264 (2.1%) | 252 (2.4%) |
| $15,000 to $17,499 | 135 (1.1%) | 478 (4.4%) |
| $17,500 to $19,999 | 225 (1.8%) | 372 (3.5%) |
| $20,000 to $22,499 | 168 (1.3%) | 254 (2.4%) |
| $22,500 to $24,999 | 340 (2.7%) | 354 (3.3%) |
| $25,000 to $29,999 | 289 (2.3%) | 655 (6.1%) |
| $30,000 to $34,999 | 956 (7.7%) | 626 (5.8%) |
| $35,000 to $39,999 | 328 (2.6%) | 678 (6.3%) |
| $40,000 to $44,999 | 575 (4.6%) | 543 (5.1%) |
| $45,000 to $49,999 | 714 (5.7%) | 543 (5.1%) |
| $50,000 to $54,999 | 561 (4.5%) | 507 (4.7%) |
| $55,000 to $64,999 | 1,466 (11.8%) | 958 (8.9%) |
| $65,000 to $74,999 | 1,170 (9.4%) | 793 (7.4%) |
| $75,000 to $99,999 | 1,849 (14.8%) | 857 (8.0%) |
| $100,000+ | 2,038 (16.4%) | 584 (5.4%) |
| Total | 12,460 (100.0%) | 10,732 (100.0%) |
Earnings by Sex by Educational Attainment in Isanti County
Average earnings in Isanti County are $61,889 for men and $41,090 for women, a difference of 33.6%. Men with an educational attainment of graduate degree enjoy the highest average annual earnings of $97,619, while those with less than high school education earn the least with $32,358. Women with an educational attainment of graduate degree earn the most with the average annual earnings of $66,379, while those with high school diploma education have the smallest earnings of $28,416.
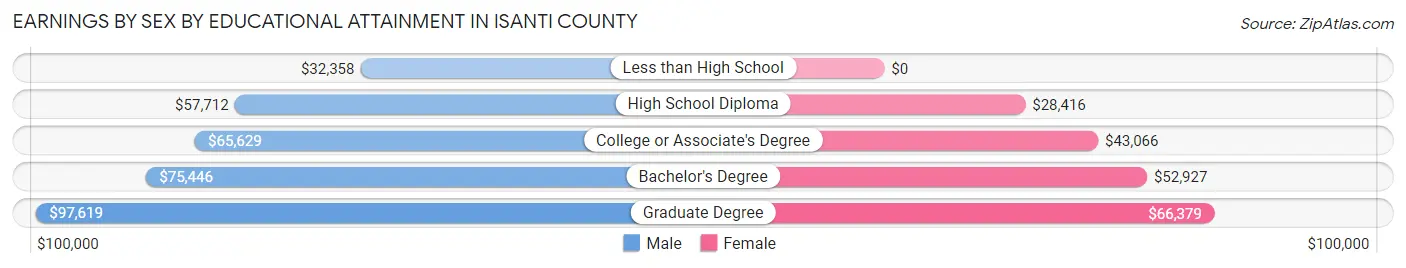
| Educational Attainment | Male Income | Female Income |
| Less than High School | $32,358 | $0 |
| High School Diploma | $57,712 | $28,416 |
| College or Associate's Degree | $65,629 | $43,066 |
| Bachelor's Degree | $75,446 | $52,927 |
| Graduate Degree | $97,619 | $66,379 |
| Total | $61,889 | $41,090 |
Family Income in Isanti County
Family Income Brackets in Isanti County
According to the Isanti County family income data, there are 2,539 families falling into the $100,000 to $149,999 income range, which is the most common income bracket and makes up 24.3% of all families. Conversely, the $10,000 to $14,999 income bracket is the least frequent group with only 136 families (1.3%) belonging to this category.
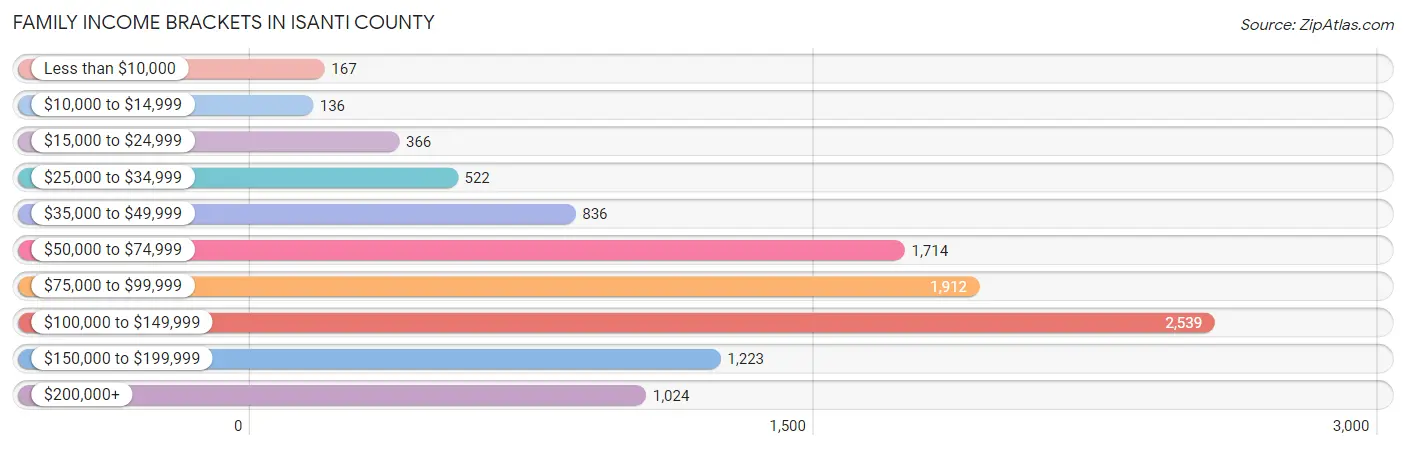
| Income Bracket | # Families | % Families |
| Less than $10,000 | 167 | 1.6% |
| $10,000 to $14,999 | 136 | 1.3% |
| $15,000 to $24,999 | 366 | 3.5% |
| $25,000 to $34,999 | 522 | 5.0% |
| $35,000 to $49,999 | 836 | 8.0% |
| $50,000 to $74,999 | 1,714 | 16.4% |
| $75,000 to $99,999 | 1,912 | 18.3% |
| $100,000 to $149,999 | 2,539 | 24.3% |
| $150,000 to $199,999 | 1,223 | 11.7% |
| $200,000+ | 1,024 | 9.8% |
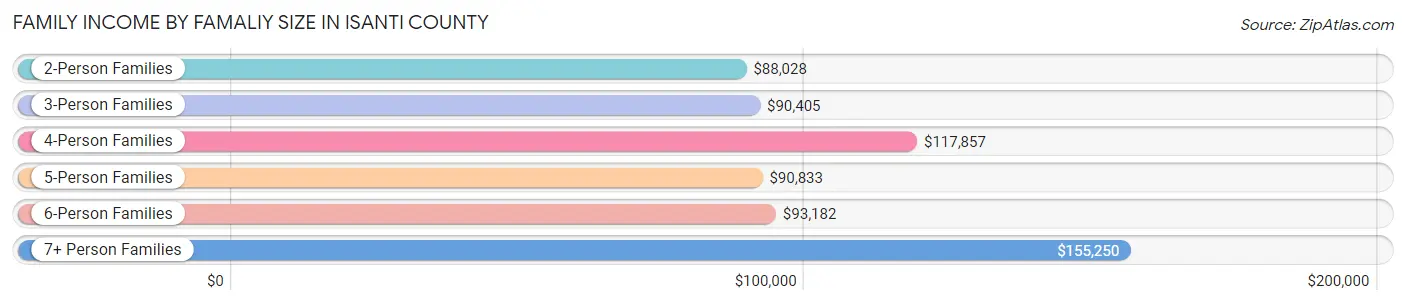
Family Income by Famaliy Size in Isanti County
7+ person families (121 | 1.2%) account for the highest median family income in Isanti County with $155,250 per family, while 2-person families (5,326 | 51.0%) have the highest median income of $44,014 per family member.
| Income Bracket | # Families | Median Income |
| 2-Person Families | 5,326 (51.0%) | $88,028 |
| 3-Person Families | 2,204 (21.1%) | $90,405 |
| 4-Person Families | 1,542 (14.8%) | $117,857 |
| 5-Person Families | 978 (9.4%) | $90,833 |
| 6-Person Families | 278 (2.7%) | $93,182 |
| 7+ Person Families | 121 (1.2%) | $155,250 |
| Total | 10,449 (100.0%) | $93,773 |
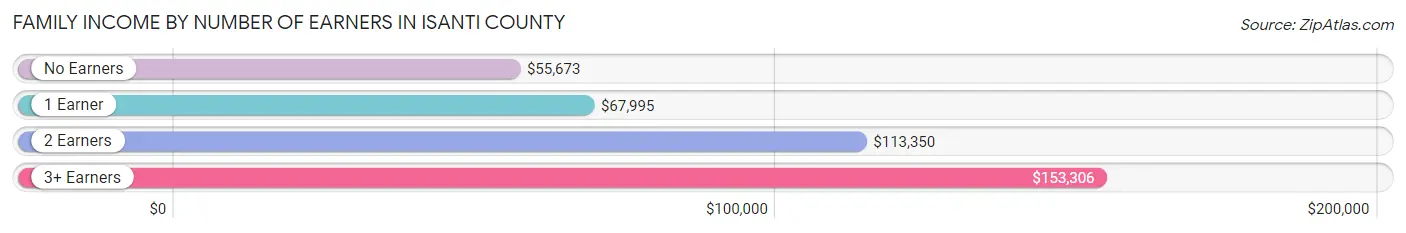
Family Income by Number of Earners in Isanti County
The median family income in Isanti County is $93,773, with families comprising 3+ earners (1,501) having the highest median family income of $153,306, while families with no earners (1,578) have the lowest median family income of $55,673, accounting for 14.4% and 15.1% of families, respectively.
| Number of Earners | # Families | Median Income |
| No Earners | 1,578 (15.1%) | $55,673 |
| 1 Earner | 3,146 (30.1%) | $67,995 |
| 2 Earners | 4,224 (40.4%) | $113,350 |
| 3+ Earners | 1,501 (14.4%) | $153,306 |
| Total | 10,449 (100.0%) | $93,773 |
Household Income in Isanti County
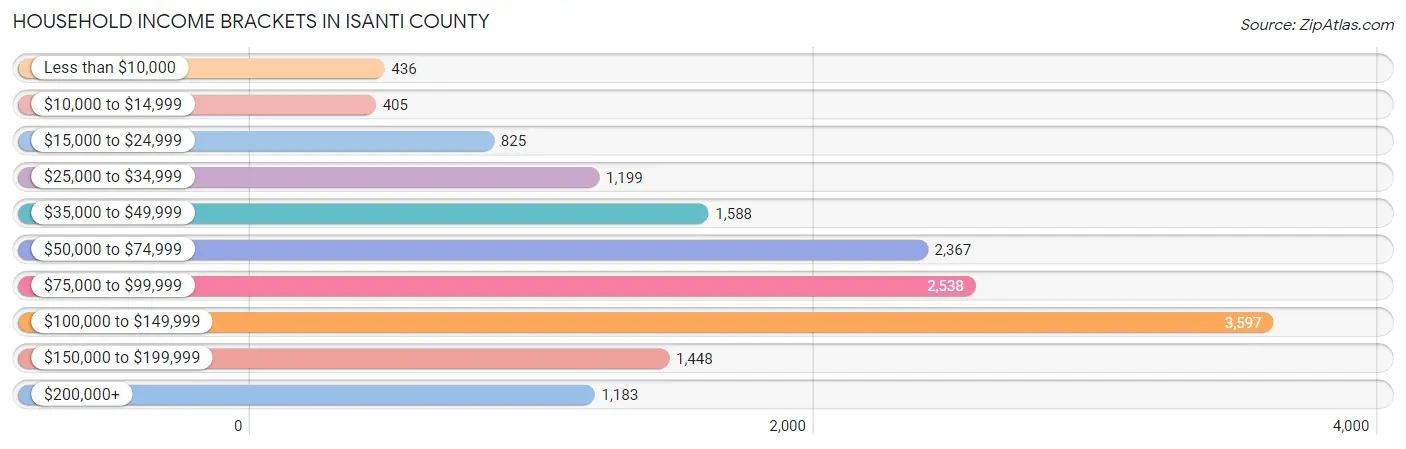
Household Income Brackets in Isanti County
With 3,597 households falling in the category, the $100,000 to $149,999 income range is the most frequent in Isanti County, accounting for 23.1% of all households. In contrast, only 405 households (2.6%) fall into the $10,000 to $14,999 income bracket, making it the least populous group.
| Income Bracket | # Households | % Households |
| Less than $10,000 | 436 | 2.8% |
| $10,000 to $14,999 | 405 | 2.6% |
| $15,000 to $24,999 | 825 | 5.3% |
| $25,000 to $34,999 | 1,199 | 7.7% |
| $35,000 to $49,999 | 1,588 | 10.2% |
| $50,000 to $74,999 | 2,367 | 15.2% |
| $75,000 to $99,999 | 2,538 | 16.3% |
| $100,000 to $149,999 | 3,597 | 23.1% |
| $150,000 to $199,999 | 1,448 | 9.3% |
| $200,000+ | 1,183 | 7.6% |
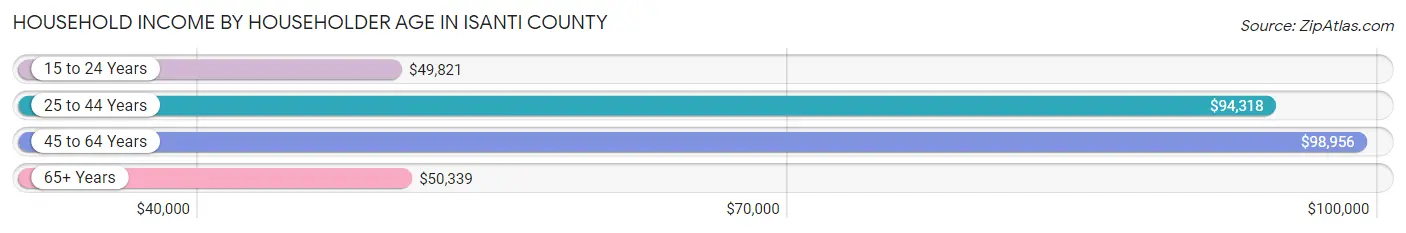
Household Income by Householder Age in Isanti County
The median household income in Isanti County is $84,063, with the highest median household income of $98,956 found in the 45 to 64 years age bracket for the primary householder. A total of 5,916 households (38.0%) fall into this category. Meanwhile, the 15 to 24 years age bracket for the primary householder has the lowest median household income of $49,821, with 359 households (2.3%) in this group.
| Income Bracket | # Households | Median Income |
| 15 to 24 Years | 359 (2.3%) | $49,821 |
| 25 to 44 Years | 4,946 (31.8%) | $94,318 |
| 45 to 64 Years | 5,916 (38.0%) | $98,956 |
| 65+ Years | 4,351 (27.9%) | $50,339 |
| Total | 15,572 (100.0%) | $84,063 |
Poverty in Isanti County
Income Below Poverty by Sex and Age in Isanti County
With 7.5% poverty level for males and 10.1% for females among the residents of Isanti County, 15 year old males and 6 to 11 year old females are the most vulnerable to poverty, with 59 males (20.3%) and 227 females (16.0%) in their respective age groups living below the poverty level.
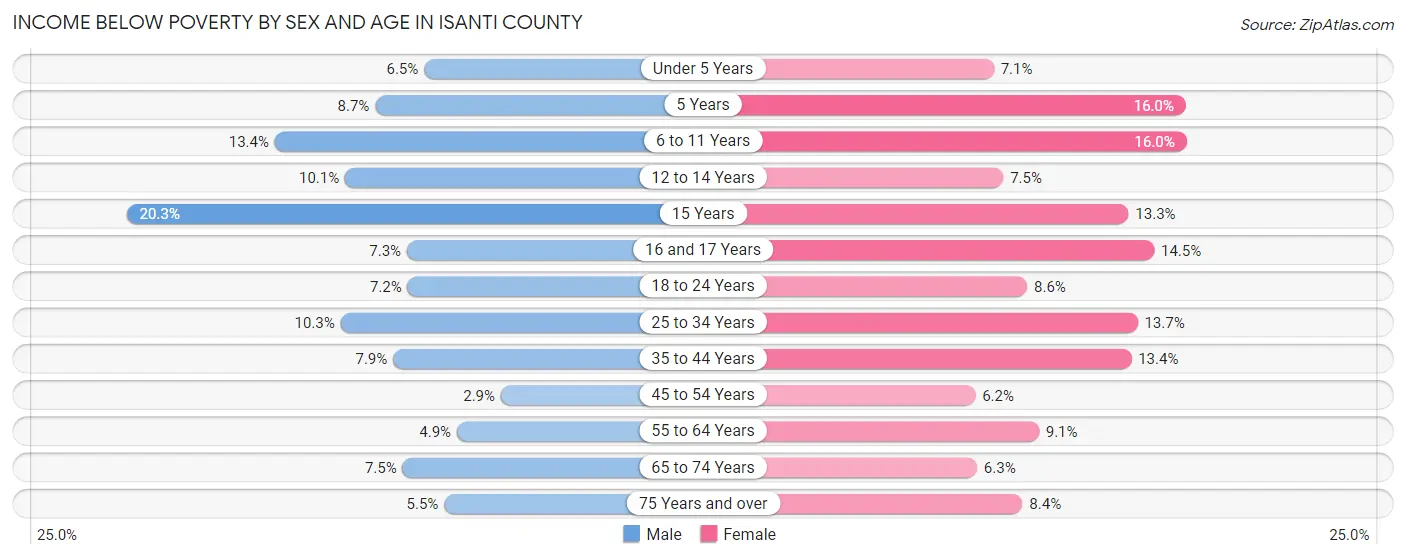
| Age Bracket | Male | Female |
| Under 5 Years | 78 (6.5%) | 77 (7.0%) |
| 5 Years | 22 (8.7%) | 60 (16.0%) |
| 6 to 11 Years | 202 (13.4%) | 227 (16.0%) |
| 12 to 14 Years | 96 (10.1%) | 69 (7.5%) |
| 15 Years | 59 (20.3%) | 31 (13.3%) |
| 16 and 17 Years | 39 (7.3%) | 80 (14.5%) |
| 18 to 24 Years | 113 (7.2%) | 119 (8.6%) |
| 25 to 34 Years | 290 (10.3%) | 350 (13.7%) |
| 35 to 44 Years | 214 (7.9%) | 339 (13.4%) |
| 45 to 54 Years | 76 (2.9%) | 157 (6.2%) |
| 55 to 64 Years | 157 (4.9%) | 265 (9.1%) |
| 65 to 74 Years | 146 (7.5%) | 134 (6.3%) |
| 75 Years and over | 64 (5.5%) | 127 (8.4%) |
| Total | 1,556 (7.5%) | 2,035 (10.1%) |
Income Above Poverty by Sex and Age in Isanti County
According to the poverty statistics in Isanti County, males aged 45 to 54 years and females aged 45 to 54 years are the age groups that are most secure financially, with 97.1% of males and 93.8% of females in these age groups living above the poverty line.
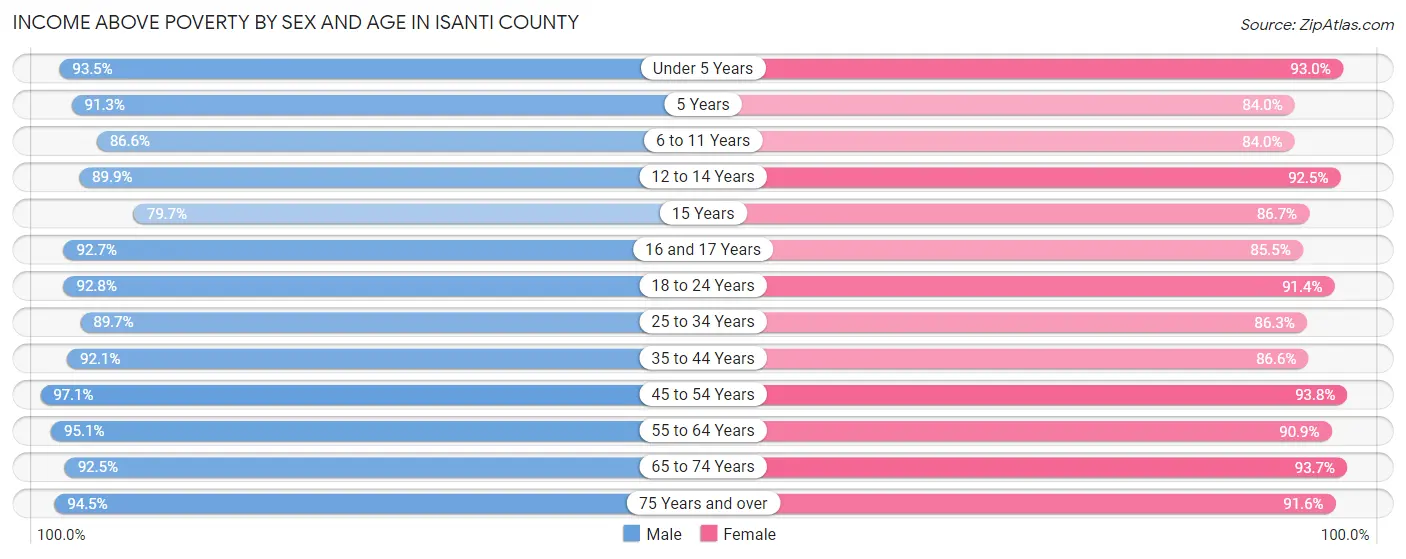
| Age Bracket | Male | Female |
| Under 5 Years | 1,130 (93.5%) | 1,015 (92.9%) |
| 5 Years | 230 (91.3%) | 316 (84.0%) |
| 6 to 11 Years | 1,307 (86.6%) | 1,192 (84.0%) |
| 12 to 14 Years | 852 (89.9%) | 852 (92.5%) |
| 15 Years | 232 (79.7%) | 202 (86.7%) |
| 16 and 17 Years | 498 (92.7%) | 472 (85.5%) |
| 18 to 24 Years | 1,451 (92.8%) | 1,264 (91.4%) |
| 25 to 34 Years | 2,514 (89.7%) | 2,201 (86.3%) |
| 35 to 44 Years | 2,494 (92.1%) | 2,186 (86.6%) |
| 45 to 54 Years | 2,542 (97.1%) | 2,380 (93.8%) |
| 55 to 64 Years | 3,022 (95.1%) | 2,633 (90.9%) |
| 65 to 74 Years | 1,811 (92.5%) | 2,002 (93.7%) |
| 75 Years and over | 1,094 (94.5%) | 1,388 (91.6%) |
| Total | 19,177 (92.5%) | 18,103 (89.9%) |
Income Below Poverty Among Married-Couple Families in Isanti County
The poverty statistics for married-couple families in Isanti County show that 4.2% or 343 of the total 8,139 families live below the poverty line. Families with 3 or 4 children have the highest poverty rate of 22.2%, comprising of 164 families. On the other hand, families with 1 or 2 children have the lowest poverty rate of 1.2%, which includes 26 families.
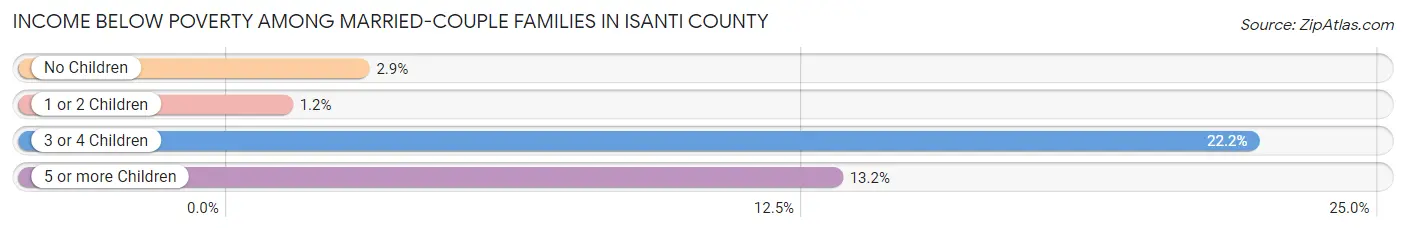
| Children | Above Poverty | Below Poverty |
| No Children | 5,032 (97.1%) | 148 (2.9%) |
| 1 or 2 Children | 2,157 (98.8%) | 26 (1.2%) |
| 3 or 4 Children | 574 (77.8%) | 164 (22.2%) |
| 5 or more Children | 33 (86.8%) | 5 (13.2%) |
| Total | 7,796 (95.8%) | 343 (4.2%) |
Income Below Poverty Among Single-Parent Households in Isanti County
According to the poverty data in Isanti County, 4.9% or 43 single-father households and 18.3% or 263 single-mother households are living below the poverty line. Among single-father households, those with 3 or 4 children have the highest poverty rate, with 4 households (7.4%) experiencing poverty. Likewise, among single-mother households, those with 5 or more children have the highest poverty rate, with 6 households (100.0%) falling below the poverty line.
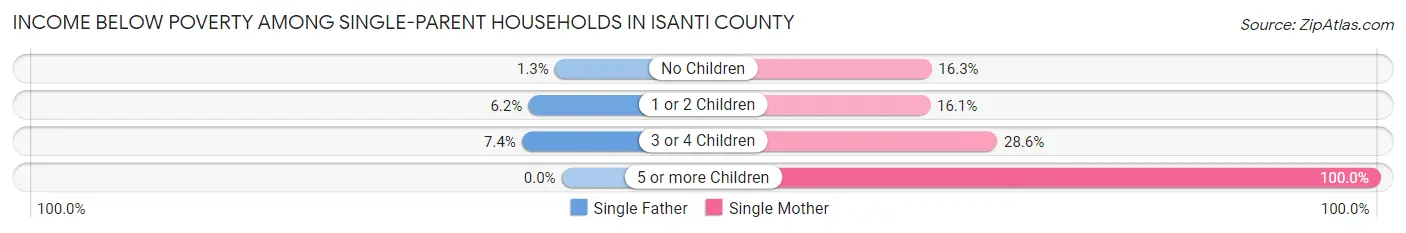
| Children | Single Father | Single Mother |
| No Children | 3 (1.3%) | 83 (16.3%) |
| 1 or 2 Children | 36 (6.2%) | 114 (16.1%) |
| 3 or 4 Children | 4 (7.4%) | 60 (28.6%) |
| 5 or more Children | 0 (0.0%) | 6 (100.0%) |
| Total | 43 (4.9%) | 263 (18.3%) |
Income Below Poverty Among Married-Couple vs Single-Parent Households in Isanti County
The poverty data for Isanti County shows that 343 of the married-couple family households (4.2%) and 306 of the single-parent households (13.3%) are living below the poverty level. Within the married-couple family households, those with 3 or 4 children have the highest poverty rate, with 164 households (22.2%) falling below the poverty line. Among the single-parent households, those with 5 or more children have the highest poverty rate, with 6 household (40.0%) living below poverty.
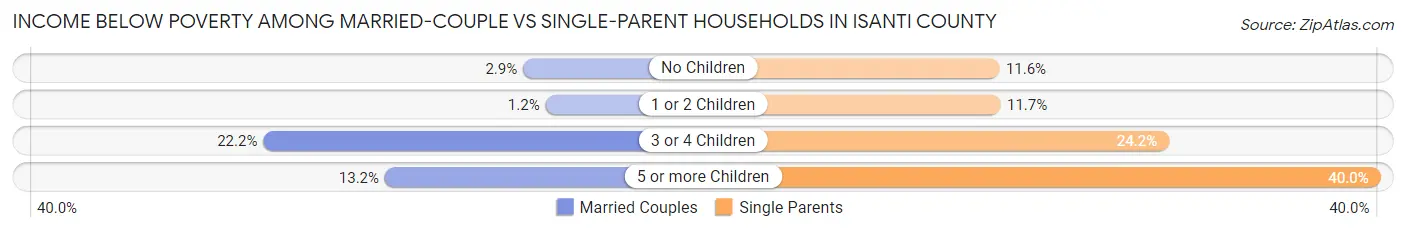
| Children | Married-Couple Families | Single-Parent Households |
| No Children | 148 (2.9%) | 86 (11.6%) |
| 1 or 2 Children | 26 (1.2%) | 150 (11.7%) |
| 3 or 4 Children | 164 (22.2%) | 64 (24.2%) |
| 5 or more Children | 5 (13.2%) | 6 (40.0%) |
| Total | 343 (4.2%) | 306 (13.3%) |
Employment Characteristics in Isanti County
Employment by Class of Employer in Isanti County
Among the 20,699 employed individuals in Isanti County, private company employees (13,409 | 64.8%), not-for-profit organizations (2,338 | 11.3%), and local government employees (1,724 | 8.3%) make up the most common classes of employment.
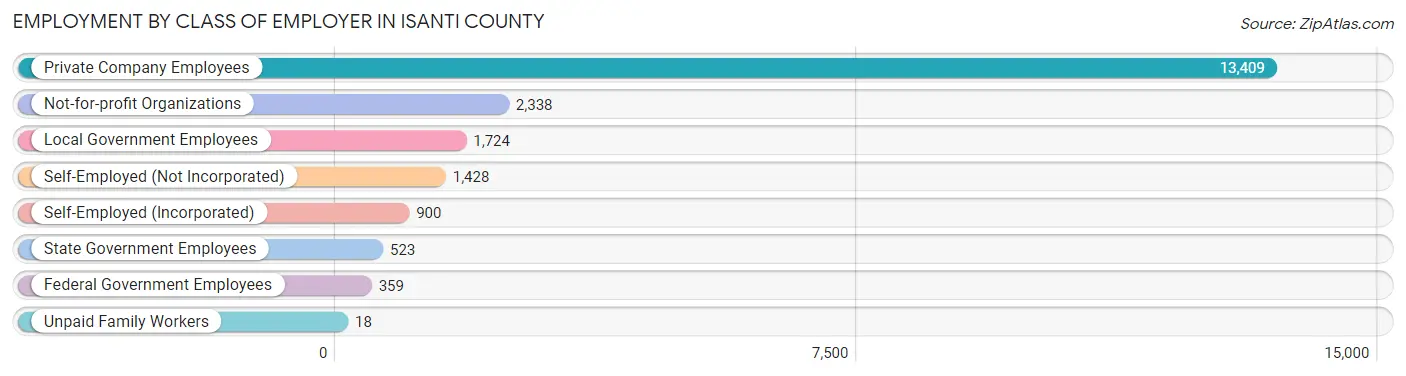
| Employer Class | # Employees | % Employees |
| Private Company Employees | 13,409 | 64.8% |
| Self-Employed (Incorporated) | 900 | 4.3% |
| Self-Employed (Not Incorporated) | 1,428 | 6.9% |
| Not-for-profit Organizations | 2,338 | 11.3% |
| Local Government Employees | 1,724 | 8.3% |
| State Government Employees | 523 | 2.5% |
| Federal Government Employees | 359 | 1.7% |
| Unpaid Family Workers | 18 | 0.1% |
| Total | 20,699 | 100.0% |
Employment Status by Age in Isanti County
According to the labor force statistics for Isanti County, out of the total population over 16 years of age (32,764), 67.3% or 22,050 individuals are in the labor force, with 4.2% or 926 of them unemployed. The age group with the highest labor force participation rate is 35 to 44 years, with 88.8% or 4,662 individuals in the labor force. Within the labor force, the 20 to 24 years age range has the highest percentage of unemployed individuals, with 8.3% or 149 of them being unemployed.
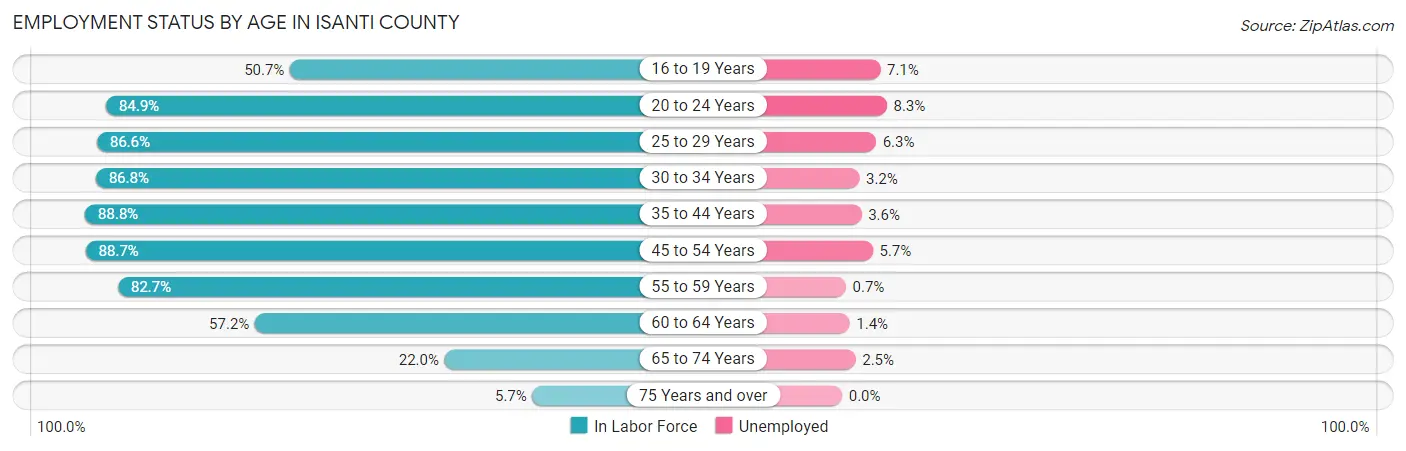
| Age Bracket | In Labor Force | Unemployed |
| 16 to 19 Years | 973 (50.7%) | 69 (7.1%) |
| 20 to 24 Years | 1,800 (84.9%) | 149 (8.3%) |
| 25 to 29 Years | 2,173 (86.6%) | 137 (6.3%) |
| 30 to 34 Years | 2,470 (86.8%) | 79 (3.2%) |
| 35 to 44 Years | 4,662 (88.8%) | 168 (3.6%) |
| 45 to 54 Years | 4,589 (88.7%) | 262 (5.7%) |
| 55 to 59 Years | 2,698 (82.7%) | 19 (0.7%) |
| 60 to 64 Years | 1,610 (57.2%) | 23 (1.4%) |
| 65 to 74 Years | 909 (22.0%) | 23 (2.5%) |
| 75 Years and over | 156 (5.7%) | 0 (0.0%) |
| Total | 22,050 (67.3%) | 926 (4.2%) |
Employment Status by Educational Attainment in Isanti County
According to labor force statistics for Isanti County, 83.3% of individuals (18,206) out of the total population between 25 and 64 years of age (21,856) are in the labor force, with 3.8% or 692 of them being unemployed. The group with the highest labor force participation rate are those with the educational attainment of bachelor's degree or higher, with 90.2% or 4,098 individuals in the labor force. Within the labor force, individuals with less than high school education have the highest percentage of unemployment, with 17.2% or 172 of them being unemployed.
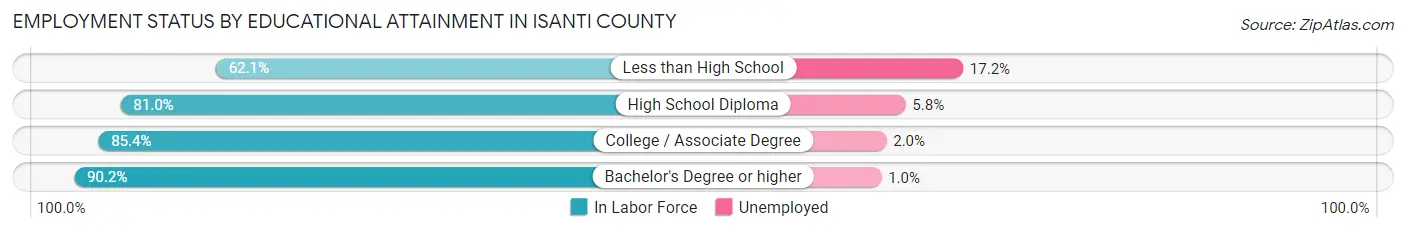
| Educational Attainment | In Labor Force | Unemployed |
| Less than High School | 999 (62.1%) | 277 (17.2%) |
| High School Diploma | 5,642 (81.0%) | 404 (5.8%) |
| College / Associate Degree | 7,464 (85.4%) | 175 (2.0%) |
| Bachelor's Degree or higher | 4,098 (90.2%) | 45 (1.0%) |
| Total | 18,206 (83.3%) | 831 (3.8%) |
Employment Occupations by Sex in Isanti County
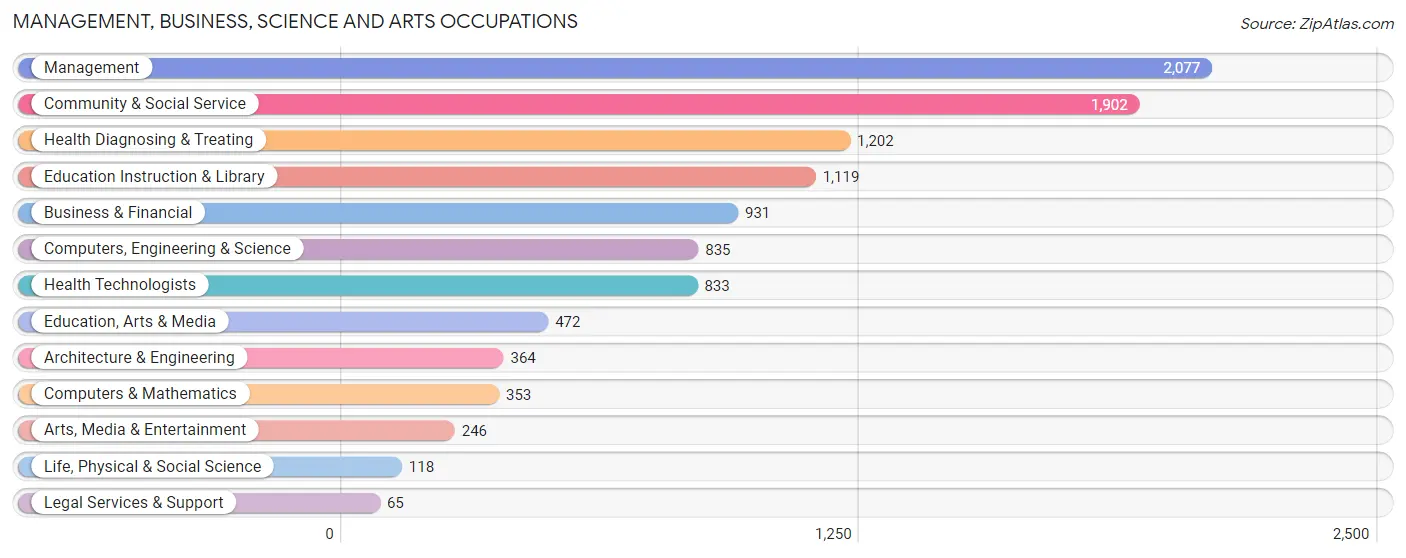
Management, Business, Science and Arts Occupations
The most common Management, Business, Science and Arts occupations in Isanti County are Management (2,077 | 9.9%), Community & Social Service (1,902 | 9.0%), Health Diagnosing & Treating (1,202 | 5.7%), Education Instruction & Library (1,119 | 5.3%), and Business & Financial (931 | 4.4%).
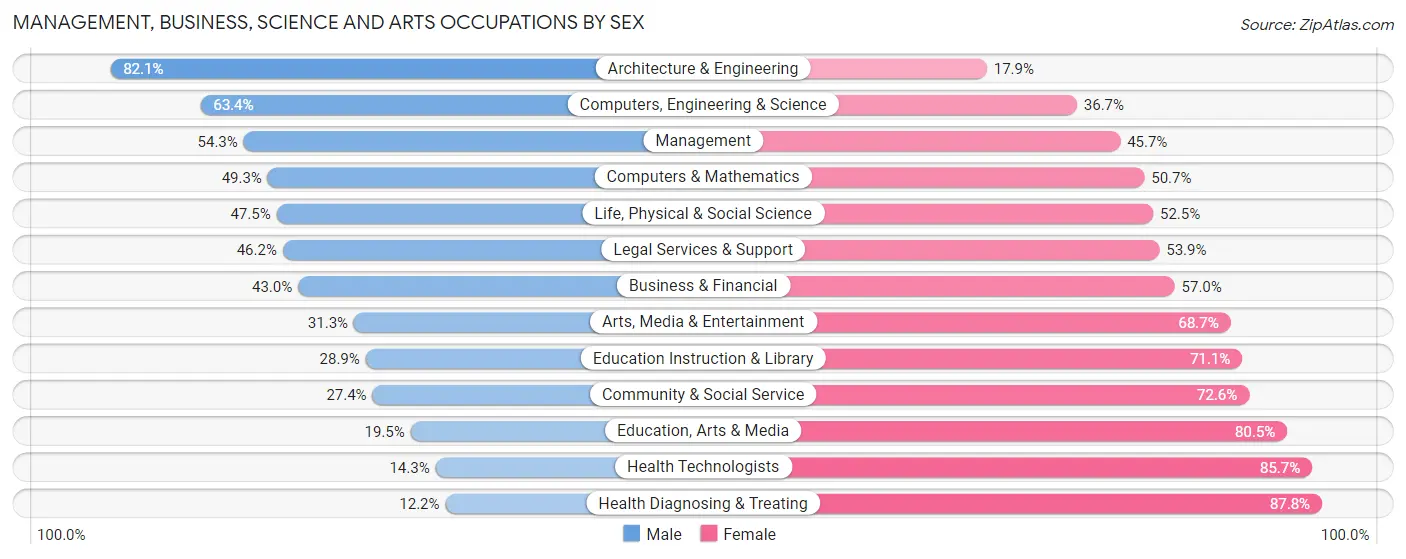
Management, Business, Science and Arts Occupations by Sex
Within the Management, Business, Science and Arts occupations in Isanti County, the most male-oriented occupations are Architecture & Engineering (82.1%), Computers, Engineering & Science (63.3%), and Management (54.3%), while the most female-oriented occupations are Health Diagnosing & Treating (87.8%), Health Technologists (85.7%), and Education, Arts & Media (80.5%).
| Occupation | Male | Female |
| Management | 1,128 (54.3%) | 949 (45.7%) |
| Business & Financial | 400 (43.0%) | 531 (57.0%) |
| Computers, Engineering & Science | 529 (63.3%) | 306 (36.6%) |
| Computers & Mathematics | 174 (49.3%) | 179 (50.7%) |
| Architecture & Engineering | 299 (82.1%) | 65 (17.9%) |
| Life, Physical & Social Science | 56 (47.5%) | 62 (52.5%) |
| Community & Social Service | 522 (27.4%) | 1,380 (72.6%) |
| Education, Arts & Media | 92 (19.5%) | 380 (80.5%) |
| Legal Services & Support | 30 (46.2%) | 35 (53.8%) |
| Education Instruction & Library | 323 (28.9%) | 796 (71.1%) |
| Arts, Media & Entertainment | 77 (31.3%) | 169 (68.7%) |
| Health Diagnosing & Treating | 147 (12.2%) | 1,055 (87.8%) |
| Health Technologists | 119 (14.3%) | 714 (85.7%) |
| Total (Category) | 2,726 (39.2%) | 4,221 (60.8%) |
| Total (Overall) | 11,329 (53.7%) | 9,759 (46.3%) |
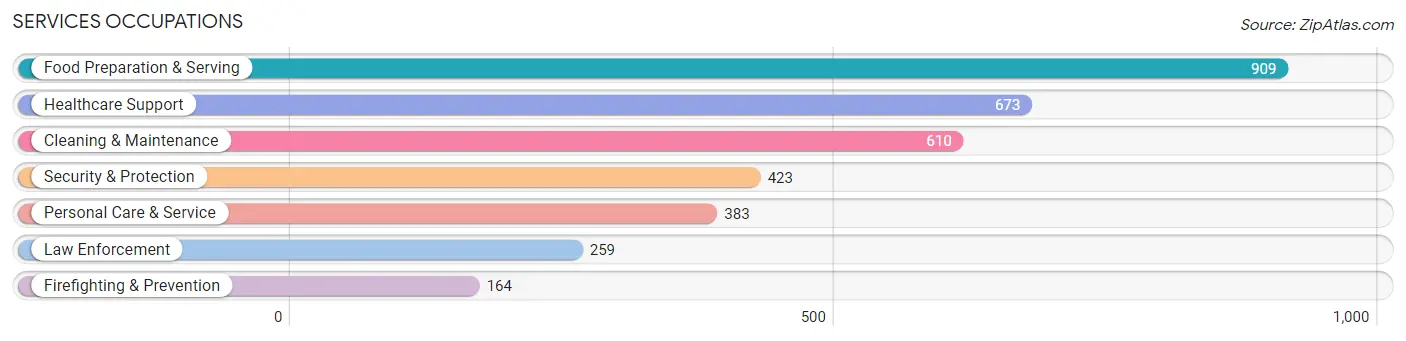
Services Occupations
The most common Services occupations in Isanti County are Food Preparation & Serving (909 | 4.3%), Healthcare Support (673 | 3.2%), Cleaning & Maintenance (610 | 2.9%), Security & Protection (423 | 2.0%), and Personal Care & Service (383 | 1.8%).
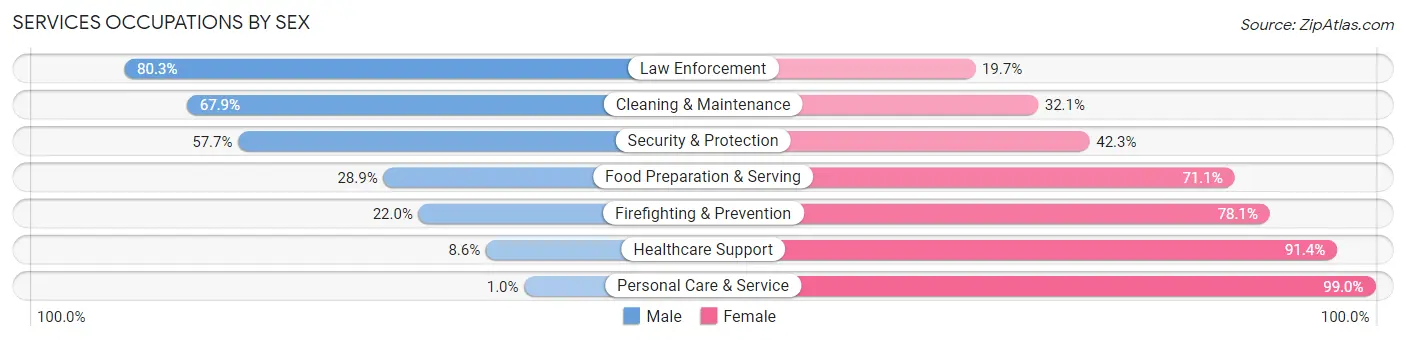
Services Occupations by Sex
Within the Services occupations in Isanti County, the most male-oriented occupations are Law Enforcement (80.3%), Cleaning & Maintenance (67.9%), and Security & Protection (57.7%), while the most female-oriented occupations are Personal Care & Service (99.0%), Healthcare Support (91.4%), and Firefighting & Prevention (78.0%).
| Occupation | Male | Female |
| Healthcare Support | 58 (8.6%) | 615 (91.4%) |
| Security & Protection | 244 (57.7%) | 179 (42.3%) |
| Firefighting & Prevention | 36 (22.0%) | 128 (78.0%) |
| Law Enforcement | 208 (80.3%) | 51 (19.7%) |
| Food Preparation & Serving | 263 (28.9%) | 646 (71.1%) |
| Cleaning & Maintenance | 414 (67.9%) | 196 (32.1%) |
| Personal Care & Service | 4 (1.0%) | 379 (99.0%) |
| Total (Category) | 983 (32.8%) | 2,015 (67.2%) |
| Total (Overall) | 11,329 (53.7%) | 9,759 (46.3%) |
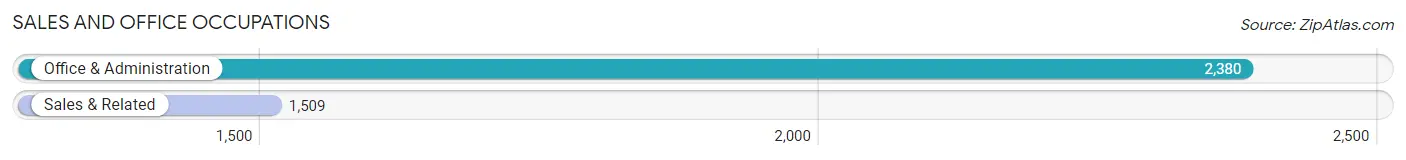
Sales and Office Occupations
The most common Sales and Office occupations in Isanti County are Office & Administration (2,380 | 11.3%), and Sales & Related (1,509 | 7.2%).
Sales and Office Occupations by Sex
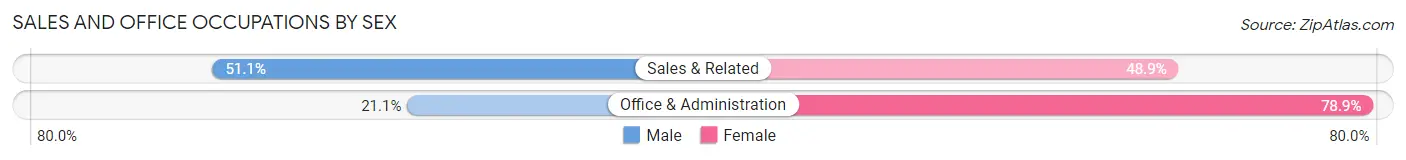
| Occupation | Male | Female |
| Sales & Related | 771 (51.1%) | 738 (48.9%) |
| Office & Administration | 503 (21.1%) | 1,877 (78.9%) |
| Total (Category) | 1,274 (32.8%) | 2,615 (67.2%) |
| Total (Overall) | 11,329 (53.7%) | 9,759 (46.3%) |
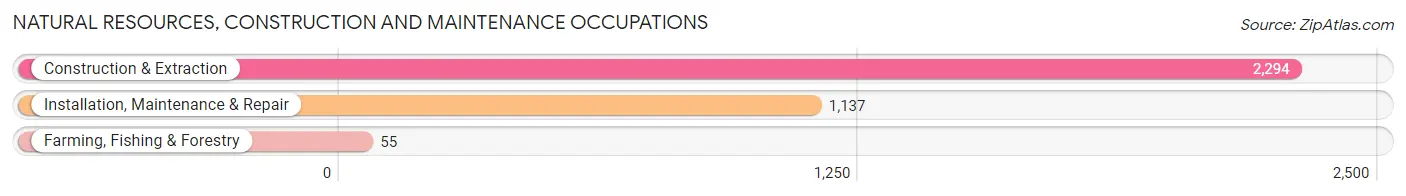
Natural Resources, Construction and Maintenance Occupations
The most common Natural Resources, Construction and Maintenance occupations in Isanti County are Construction & Extraction (2,294 | 10.9%), Installation, Maintenance & Repair (1,137 | 5.4%), and Farming, Fishing & Forestry (55 | 0.3%).
Natural Resources, Construction and Maintenance Occupations by Sex
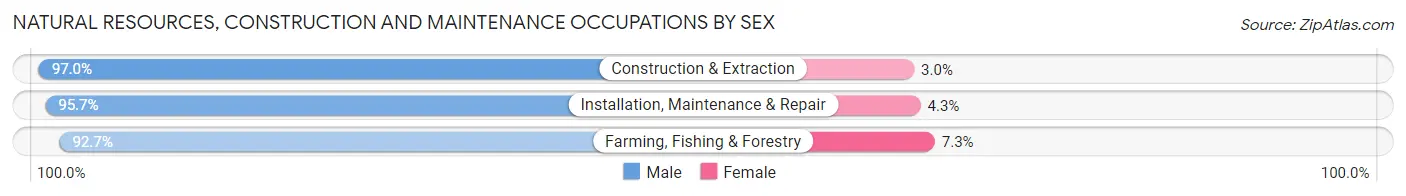
| Occupation | Male | Female |
| Farming, Fishing & Forestry | 51 (92.7%) | 4 (7.3%) |
| Construction & Extraction | 2,226 (97.0%) | 68 (3.0%) |
| Installation, Maintenance & Repair | 1,088 (95.7%) | 49 (4.3%) |
| Total (Category) | 3,365 (96.5%) | 121 (3.5%) |
| Total (Overall) | 11,329 (53.7%) | 9,759 (46.3%) |
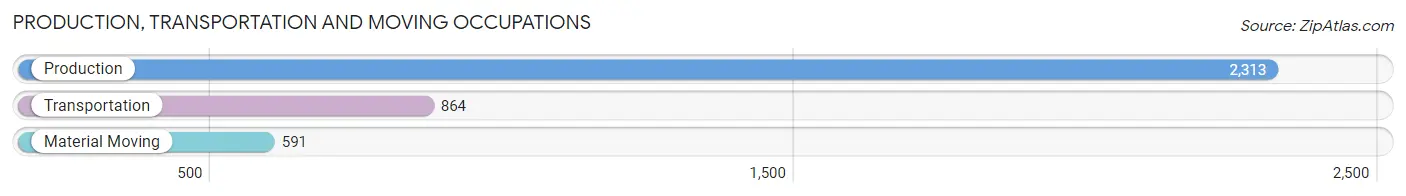
Production, Transportation and Moving Occupations
The most common Production, Transportation and Moving occupations in Isanti County are Production (2,313 | 11.0%), Transportation (864 | 4.1%), and Material Moving (591 | 2.8%).
Production, Transportation and Moving Occupations by Sex
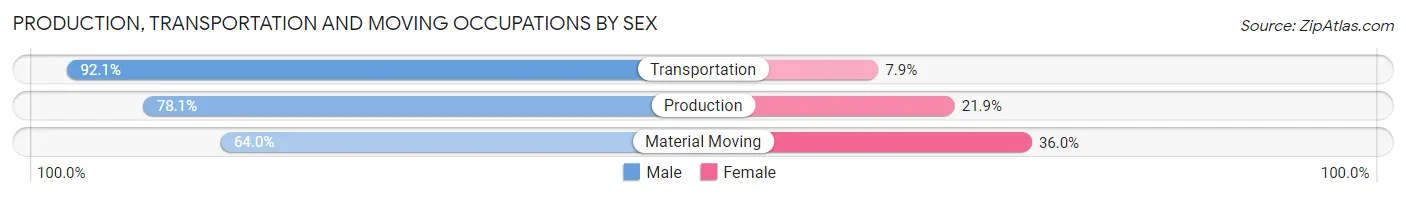
| Occupation | Male | Female |
| Production | 1,807 (78.1%) | 506 (21.9%) |
| Transportation | 796 (92.1%) | 68 (7.9%) |
| Material Moving | 378 (64.0%) | 213 (36.0%) |
| Total (Category) | 2,981 (79.1%) | 787 (20.9%) |
| Total (Overall) | 11,329 (53.7%) | 9,759 (46.3%) |
Employment Industries by Sex in Isanti County
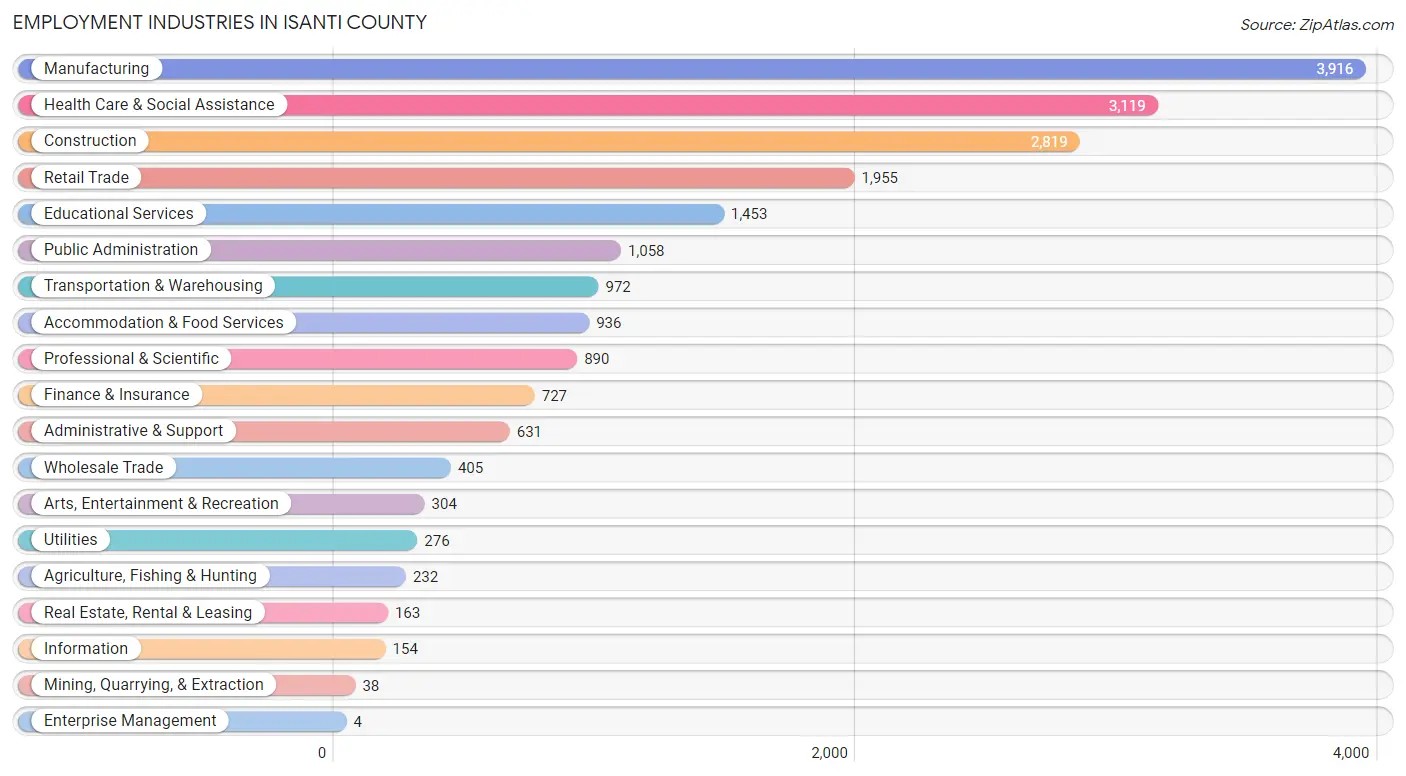
Employment Industries in Isanti County
The major employment industries in Isanti County include Manufacturing (3,916 | 18.6%), Health Care & Social Assistance (3,119 | 14.8%), Construction (2,819 | 13.4%), Retail Trade (1,955 | 9.3%), and Educational Services (1,453 | 6.9%).
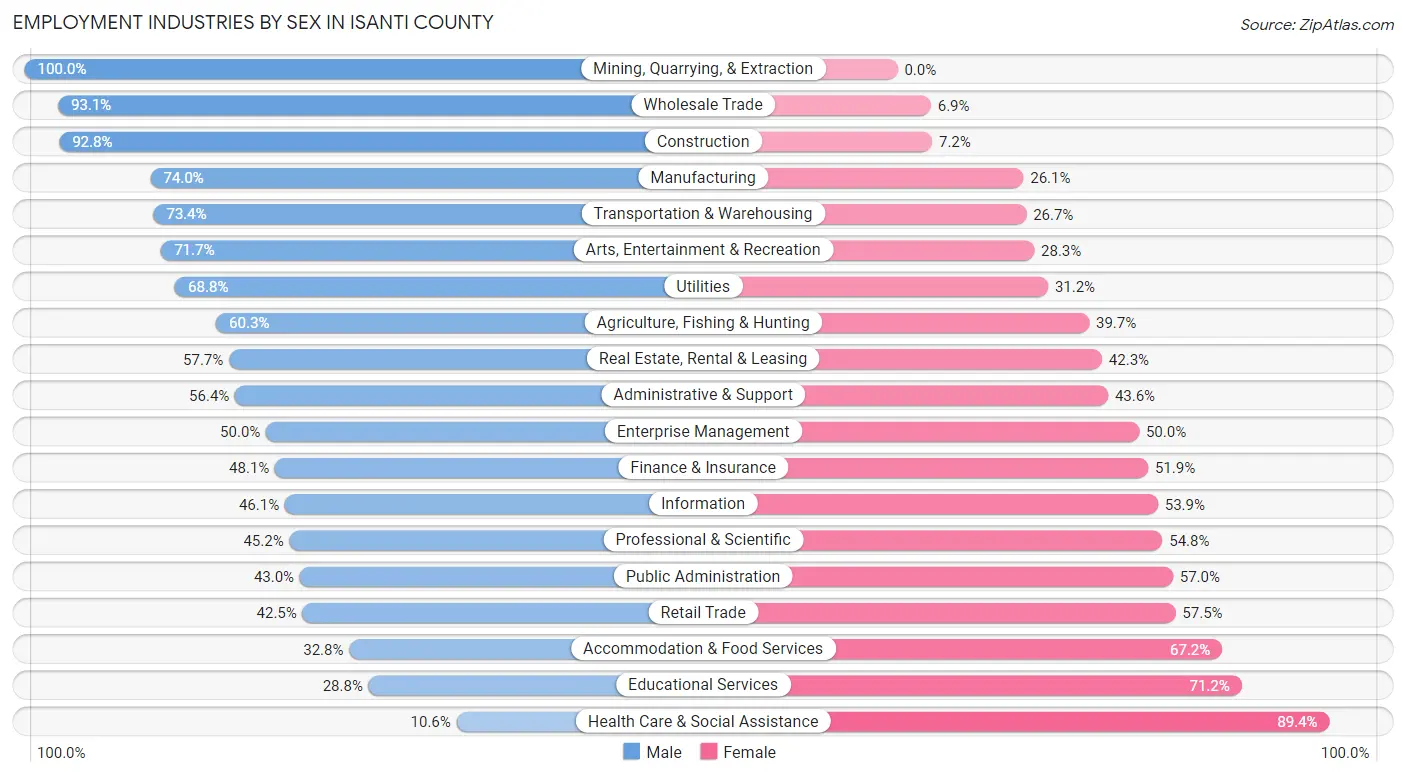
Employment Industries by Sex in Isanti County
The Isanti County industries that see more men than women are Mining, Quarrying, & Extraction (100.0%), Wholesale Trade (93.1%), and Construction (92.8%), whereas the industries that tend to have a higher number of women are Health Care & Social Assistance (89.4%), Educational Services (71.2%), and Accommodation & Food Services (67.2%).
| Industry | Male | Female |
| Agriculture, Fishing & Hunting | 140 (60.3%) | 92 (39.7%) |
| Mining, Quarrying, & Extraction | 38 (100.0%) | 0 (0.0%) |
| Construction | 2,617 (92.8%) | 202 (7.2%) |
| Manufacturing | 2,896 (74.0%) | 1,020 (26.1%) |
| Wholesale Trade | 377 (93.1%) | 28 (6.9%) |
| Retail Trade | 830 (42.5%) | 1,125 (57.5%) |
| Transportation & Warehousing | 713 (73.4%) | 259 (26.7%) |
| Utilities | 190 (68.8%) | 86 (31.2%) |
| Information | 71 (46.1%) | 83 (53.9%) |
| Finance & Insurance | 350 (48.1%) | 377 (51.9%) |
| Real Estate, Rental & Leasing | 94 (57.7%) | 69 (42.3%) |
| Professional & Scientific | 402 (45.2%) | 488 (54.8%) |
| Enterprise Management | 2 (50.0%) | 2 (50.0%) |
| Administrative & Support | 356 (56.4%) | 275 (43.6%) |
| Educational Services | 418 (28.8%) | 1,035 (71.2%) |
| Health Care & Social Assistance | 330 (10.6%) | 2,789 (89.4%) |
| Arts, Entertainment & Recreation | 218 (71.7%) | 86 (28.3%) |
| Accommodation & Food Services | 307 (32.8%) | 629 (67.2%) |
| Public Administration | 455 (43.0%) | 603 (57.0%) |
| Total | 11,329 (53.7%) | 9,759 (46.3%) |
Education in Isanti County
School Enrollment in Isanti County
The most common levels of schooling among the 8,983 students in Isanti County are middle school (2,307 | 25.7%), high school (2,140 | 23.8%), and elementary school (1,972 | 22.0%).
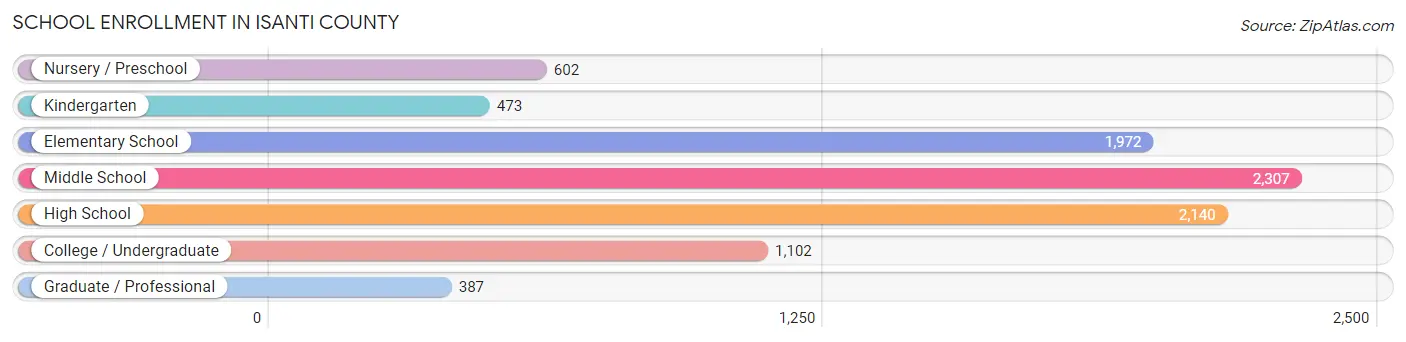
| School Level | # Students | % Students |
| Nursery / Preschool | 602 | 6.7% |
| Kindergarten | 473 | 5.3% |
| Elementary School | 1,972 | 22.0% |
| Middle School | 2,307 | 25.7% |
| High School | 2,140 | 23.8% |
| College / Undergraduate | 1,102 | 12.3% |
| Graduate / Professional | 387 | 4.3% |
| Total | 8,983 | 100.0% |
School Enrollment by Age by Funding Source in Isanti County
Out of a total of 8,983 students who are enrolled in schools in Isanti County, 1,132 (12.6%) attend a private institution, while the remaining 7,851 (87.4%) are enrolled in public schools. The age group of 3 to 4 year olds has the highest likelihood of being enrolled in private schools, with 88 (20.7% in the age bracket) enrolled. Conversely, the age group of 35 years and over has the lowest likelihood of being enrolled in a private school, with 300 (92.6% in the age bracket) attending a public institution.
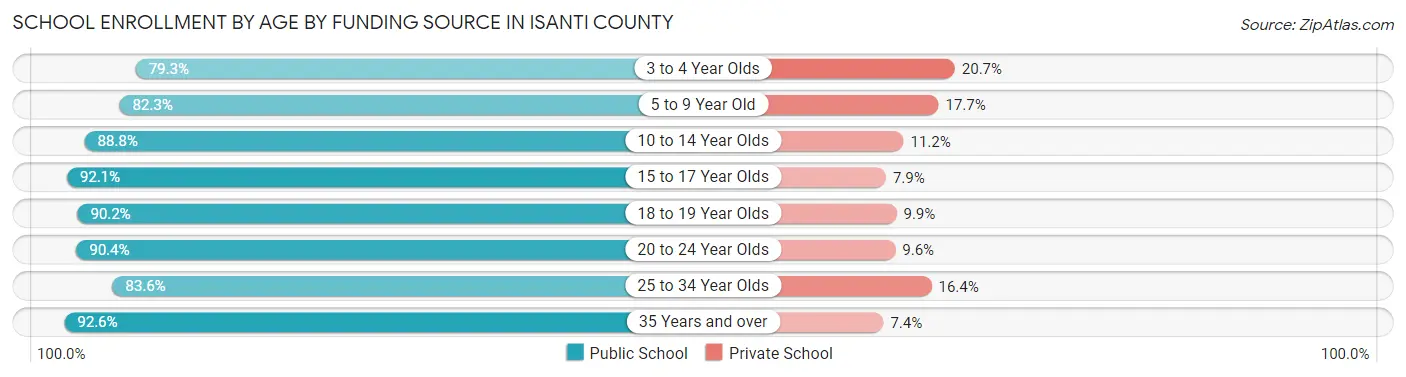
| Age Bracket | Public School | Private School |
| 3 to 4 Year Olds | 337 (79.3%) | 88 (20.7%) |
| 5 to 9 Year Old | 1,834 (82.3%) | 394 (17.7%) |
| 10 to 14 Year Olds | 2,611 (88.8%) | 328 (11.2%) |
| 15 to 17 Year Olds | 1,450 (92.1%) | 124 (7.9%) |
| 18 to 19 Year Olds | 531 (90.1%) | 58 (9.9%) |
| 20 to 24 Year Olds | 469 (90.4%) | 50 (9.6%) |
| 25 to 34 Year Olds | 322 (83.6%) | 63 (16.4%) |
| 35 Years and over | 300 (92.6%) | 24 (7.4%) |
| Total | 7,851 (87.4%) | 1,132 (12.6%) |
Educational Attainment by Field of Study in Isanti County
Business (1,190 | 19.0%), education (1,111 | 17.7%), science & technology (793 | 12.6%), bio, nature & agricultural (543 | 8.6%), and arts & humanities (492 | 7.8%) are the most common fields of study among 6,278 individuals in Isanti County who have obtained a bachelor's degree or higher.
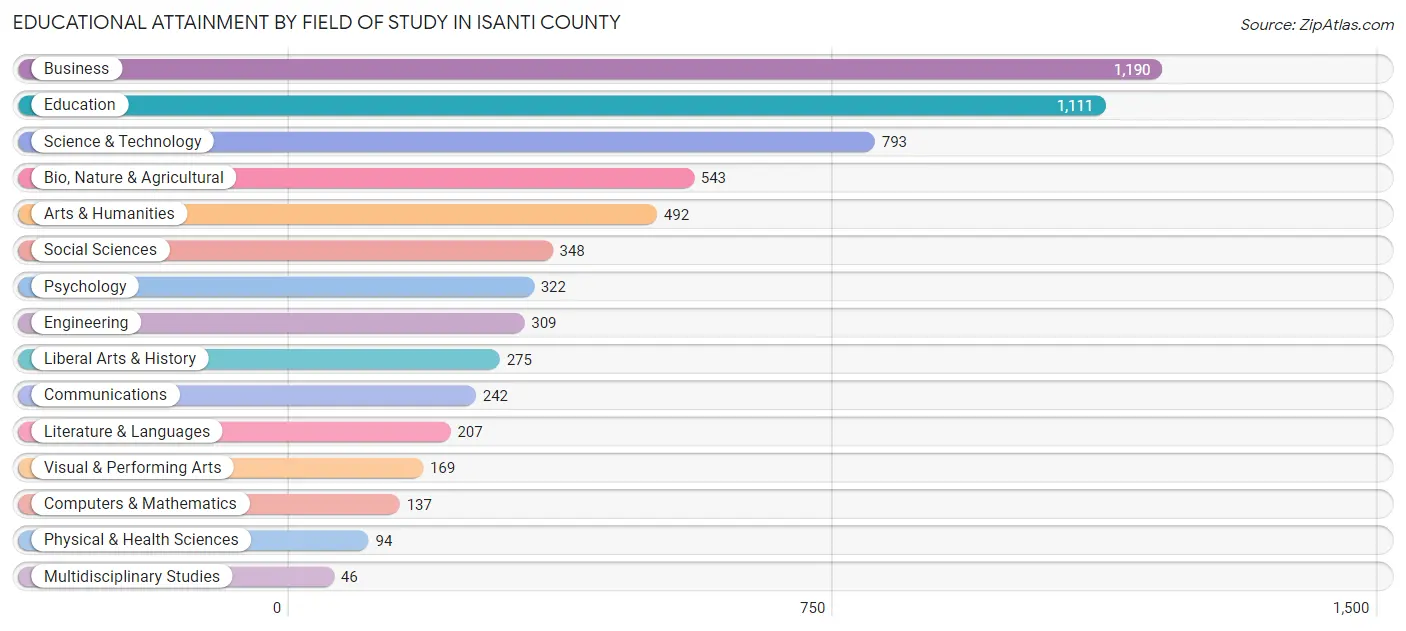
| Field of Study | # Graduates | % Graduates |
| Computers & Mathematics | 137 | 2.2% |
| Bio, Nature & Agricultural | 543 | 8.6% |
| Physical & Health Sciences | 94 | 1.5% |
| Psychology | 322 | 5.1% |
| Social Sciences | 348 | 5.5% |
| Engineering | 309 | 4.9% |
| Multidisciplinary Studies | 46 | 0.7% |
| Science & Technology | 793 | 12.6% |
| Business | 1,190 | 19.0% |
| Education | 1,111 | 17.7% |
| Literature & Languages | 207 | 3.3% |
| Liberal Arts & History | 275 | 4.4% |
| Visual & Performing Arts | 169 | 2.7% |
| Communications | 242 | 3.8% |
| Arts & Humanities | 492 | 7.8% |
| Total | 6,278 | 100.0% |
Transportation & Commute in Isanti County
Vehicle Availability by Sex in Isanti County
The most prevalent vehicle ownership categories in Isanti County are males with 2 vehicles (3,621, accounting for 32.6%) and females with 2 vehicles (2,948, making up 38.1%).
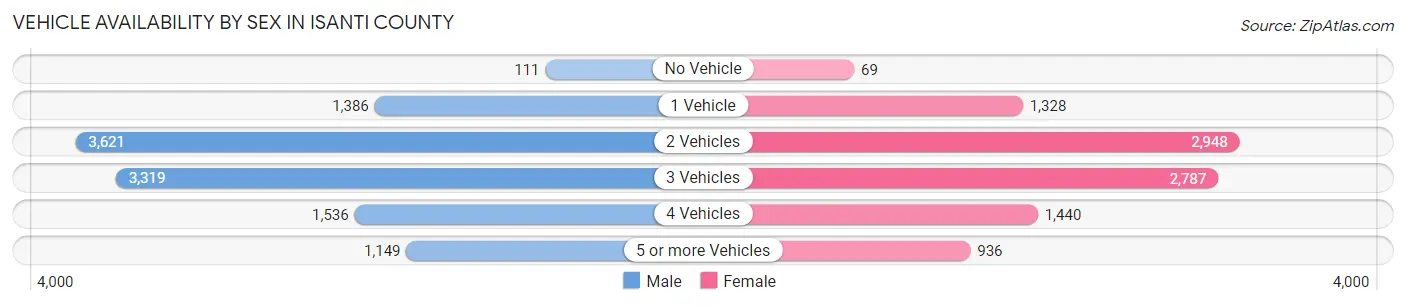
| Vehicles Available | Male | Female |
| No Vehicle | 111 (1.0%) | 69 (0.7%) |
| 1 Vehicle | 1,386 (12.5%) | 1,328 (14.0%) |
| 2 Vehicles | 3,621 (32.6%) | 2,948 (31.0%) |
| 3 Vehicles | 3,319 (29.8%) | 2,787 (29.3%) |
| 4 Vehicles | 1,536 (13.8%) | 1,440 (15.1%) |
| 5 or more Vehicles | 1,149 (10.3%) | 936 (9.8%) |
| Total | 11,122 (100.0%) | 9,508 (100.0%) |
Commute Time in Isanti County
The most frequently occuring commute durations in Isanti County are 60 to 89 minutes (2,804 commuters, 15.0%), 45 to 59 minutes (2,783 commuters, 14.9%), and 10 to 14 minutes (2,331 commuters, 12.4%).
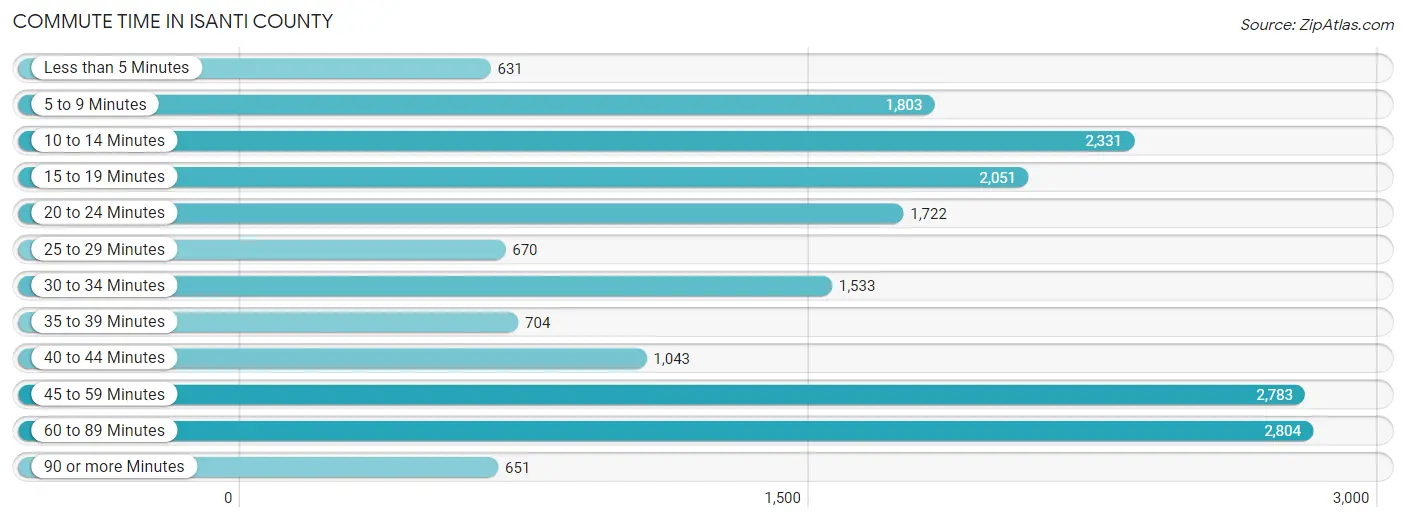
| Commute Time | # Commuters | % Commuters |
| Less than 5 Minutes | 631 | 3.4% |
| 5 to 9 Minutes | 1,803 | 9.6% |
| 10 to 14 Minutes | 2,331 | 12.4% |
| 15 to 19 Minutes | 2,051 | 11.0% |
| 20 to 24 Minutes | 1,722 | 9.2% |
| 25 to 29 Minutes | 670 | 3.6% |
| 30 to 34 Minutes | 1,533 | 8.2% |
| 35 to 39 Minutes | 704 | 3.8% |
| 40 to 44 Minutes | 1,043 | 5.6% |
| 45 to 59 Minutes | 2,783 | 14.9% |
| 60 to 89 Minutes | 2,804 | 15.0% |
| 90 or more Minutes | 651 | 3.5% |
Commute Time by Sex in Isanti County
The most common commute times in Isanti County are 60 to 89 minutes (1,941 commuters, 18.7%) for males and 15 to 19 minutes (1,320 commuters, 15.8%) for females.
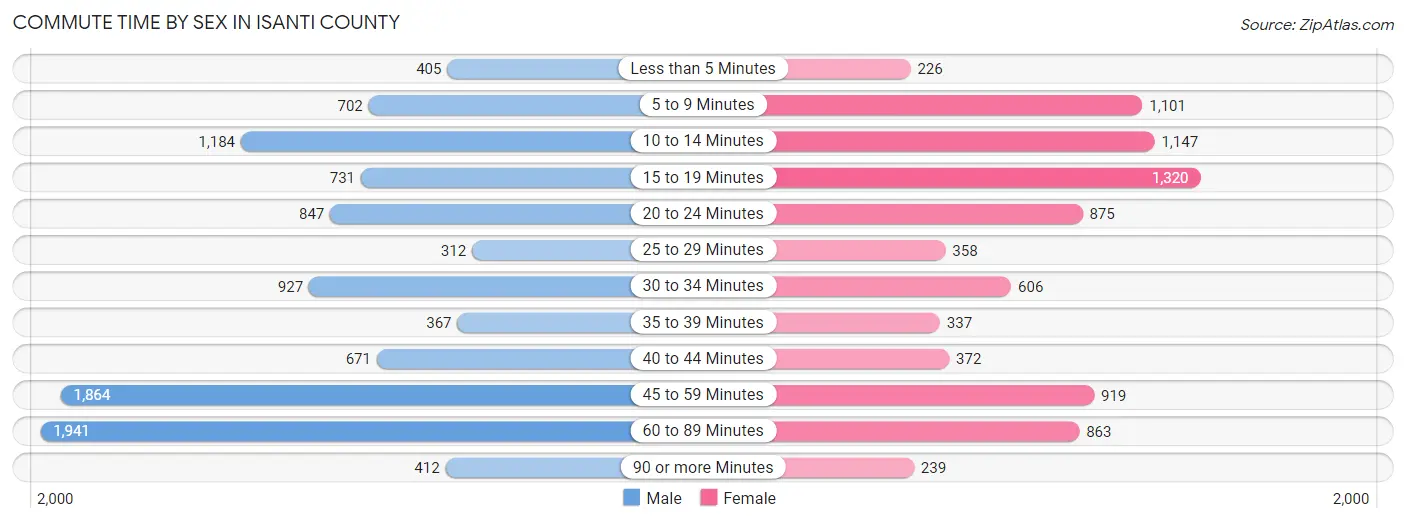
| Commute Time | Male | Female |
| Less than 5 Minutes | 405 (3.9%) | 226 (2.7%) |
| 5 to 9 Minutes | 702 (6.8%) | 1,101 (13.2%) |
| 10 to 14 Minutes | 1,184 (11.4%) | 1,147 (13.7%) |
| 15 to 19 Minutes | 731 (7.0%) | 1,320 (15.8%) |
| 20 to 24 Minutes | 847 (8.2%) | 875 (10.5%) |
| 25 to 29 Minutes | 312 (3.0%) | 358 (4.3%) |
| 30 to 34 Minutes | 927 (8.9%) | 606 (7.2%) |
| 35 to 39 Minutes | 367 (3.5%) | 337 (4.0%) |
| 40 to 44 Minutes | 671 (6.5%) | 372 (4.4%) |
| 45 to 59 Minutes | 1,864 (18.0%) | 919 (11.0%) |
| 60 to 89 Minutes | 1,941 (18.7%) | 863 (10.3%) |
| 90 or more Minutes | 412 (4.0%) | 239 (2.9%) |
Time of Departure to Work by Sex in Isanti County
The most frequent times of departure to work in Isanti County are 5:30 AM to 5:59 AM (1,546, 14.9%) for males and 7:00 AM to 7:29 AM (1,348, 16.1%) for females.
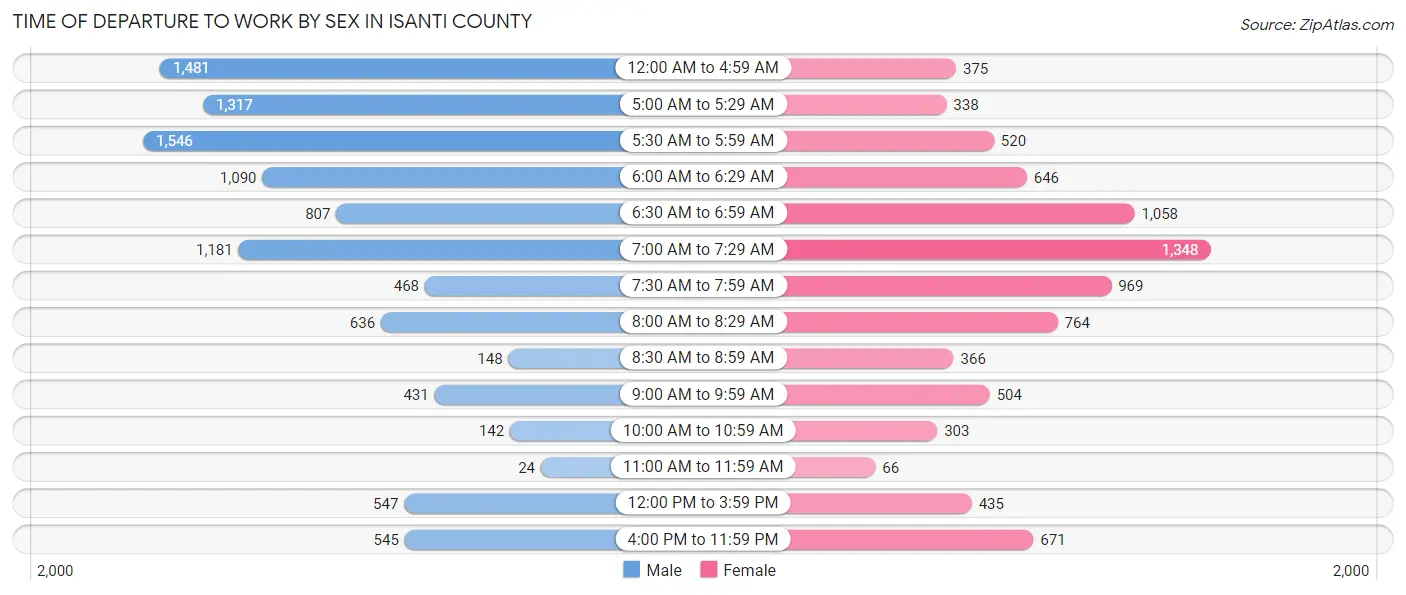
| Time of Departure | Male | Female |
| 12:00 AM to 4:59 AM | 1,481 (14.3%) | 375 (4.5%) |
| 5:00 AM to 5:29 AM | 1,317 (12.7%) | 338 (4.0%) |
| 5:30 AM to 5:59 AM | 1,546 (14.9%) | 520 (6.2%) |
| 6:00 AM to 6:29 AM | 1,090 (10.5%) | 646 (7.7%) |
| 6:30 AM to 6:59 AM | 807 (7.8%) | 1,058 (12.7%) |
| 7:00 AM to 7:29 AM | 1,181 (11.4%) | 1,348 (16.1%) |
| 7:30 AM to 7:59 AM | 468 (4.5%) | 969 (11.6%) |
| 8:00 AM to 8:29 AM | 636 (6.1%) | 764 (9.1%) |
| 8:30 AM to 8:59 AM | 148 (1.4%) | 366 (4.4%) |
| 9:00 AM to 9:59 AM | 431 (4.2%) | 504 (6.0%) |
| 10:00 AM to 10:59 AM | 142 (1.4%) | 303 (3.6%) |
| 11:00 AM to 11:59 AM | 24 (0.2%) | 66 (0.8%) |
| 12:00 PM to 3:59 PM | 547 (5.3%) | 435 (5.2%) |
| 4:00 PM to 11:59 PM | 545 (5.3%) | 671 (8.0%) |
| Total | 10,363 (100.0%) | 8,363 (100.0%) |
Housing Occupancy in Isanti County
Occupancy by Ownership in Isanti County
Of the total 15,572 dwellings in Isanti County, owner-occupied units account for 13,084 (84.0%), while renter-occupied units make up 2,488 (16.0%).
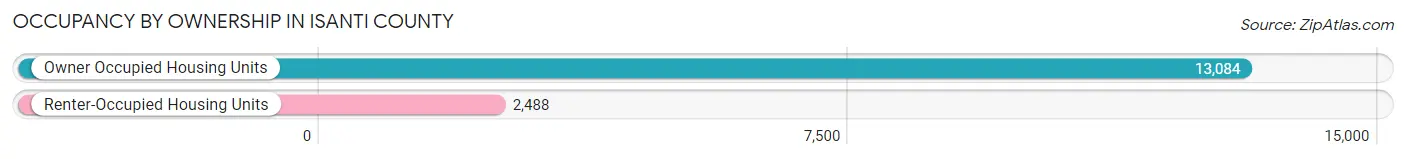
| Occupancy | # Housing Units | % Housing Units |
| Owner Occupied Housing Units | 13,084 | 84.0% |
| Renter-Occupied Housing Units | 2,488 | 16.0% |
| Total Occupied Housing Units | 15,572 | 100.0% |
Occupancy by Household Size in Isanti County
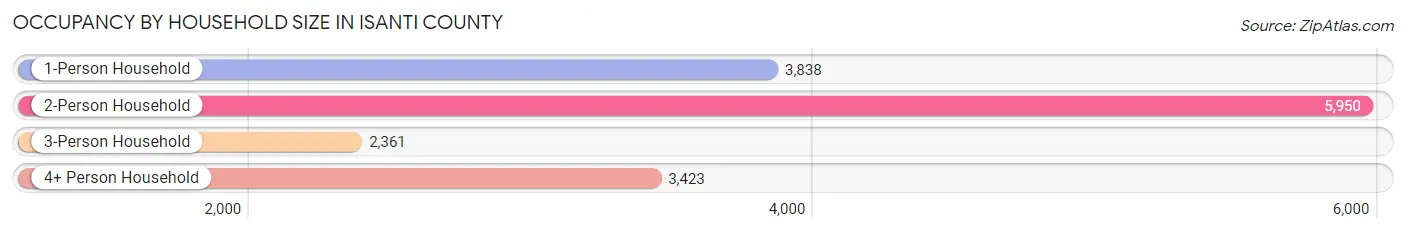
| Household Size | # Housing Units | % Housing Units |
| 1-Person Household | 3,838 | 24.6% |
| 2-Person Household | 5,950 | 38.2% |
| 3-Person Household | 2,361 | 15.2% |
| 4+ Person Household | 3,423 | 22.0% |
| Total Housing Units | 15,572 | 100.0% |
Occupancy by Ownership by Household Size in Isanti County
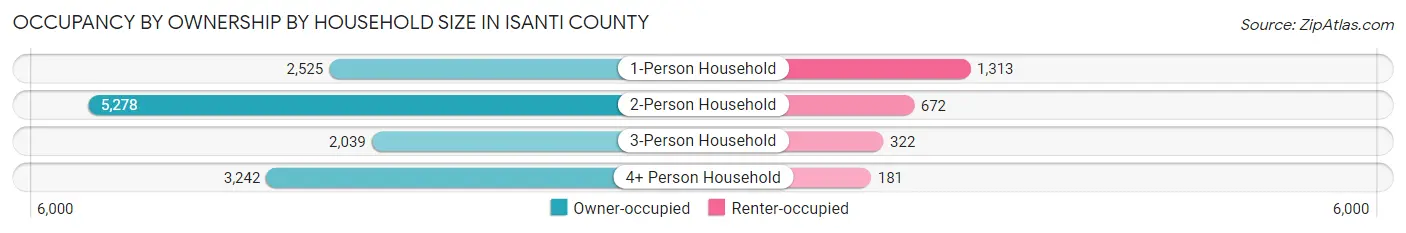
| Household Size | Owner-occupied | Renter-occupied |
| 1-Person Household | 2,525 (65.8%) | 1,313 (34.2%) |
| 2-Person Household | 5,278 (88.7%) | 672 (11.3%) |
| 3-Person Household | 2,039 (86.4%) | 322 (13.6%) |
| 4+ Person Household | 3,242 (94.7%) | 181 (5.3%) |
| Total Housing Units | 13,084 (84.0%) | 2,488 (16.0%) |
Occupancy by Educational Attainment in Isanti County
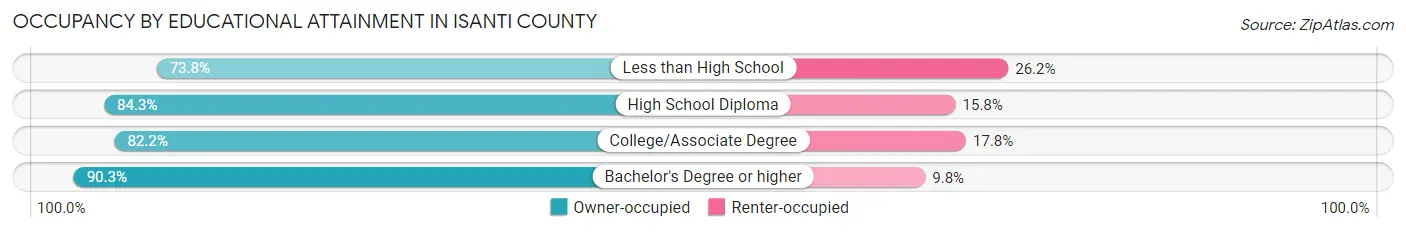
| Household Size | Owner-occupied | Renter-occupied |
| Less than High School | 586 (73.8%) | 208 (26.2%) |
| High School Diploma | 4,264 (84.3%) | 797 (15.8%) |
| College/Associate Degree | 5,449 (82.2%) | 1,182 (17.8%) |
| Bachelor's Degree or higher | 2,785 (90.2%) | 301 (9.8%) |
Occupancy by Age of Householder in Isanti County
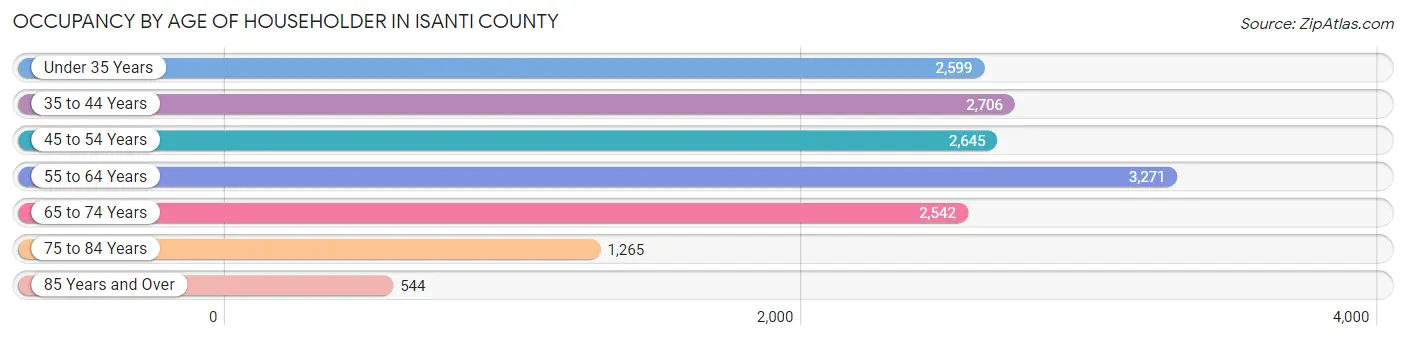
| Age Bracket | # Households | % Households |
| Under 35 Years | 2,599 | 16.7% |
| 35 to 44 Years | 2,706 | 17.4% |
| 45 to 54 Years | 2,645 | 17.0% |
| 55 to 64 Years | 3,271 | 21.0% |
| 65 to 74 Years | 2,542 | 16.3% |
| 75 to 84 Years | 1,265 | 8.1% |
| 85 Years and Over | 544 | 3.5% |
| Total | 15,572 | 100.0% |
Housing Finances in Isanti County
Median Income by Occupancy in Isanti County
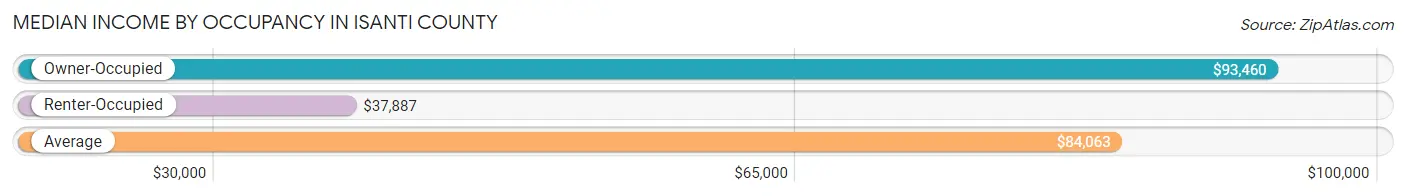
| Occupancy Type | # Households | Median Income |
| Owner-Occupied | 13,084 (84.0%) | $93,460 |
| Renter-Occupied | 2,488 (16.0%) | $37,887 |
| Average | 15,572 (100.0%) | $84,063 |
Occupancy by Householder Income Bracket in Isanti County
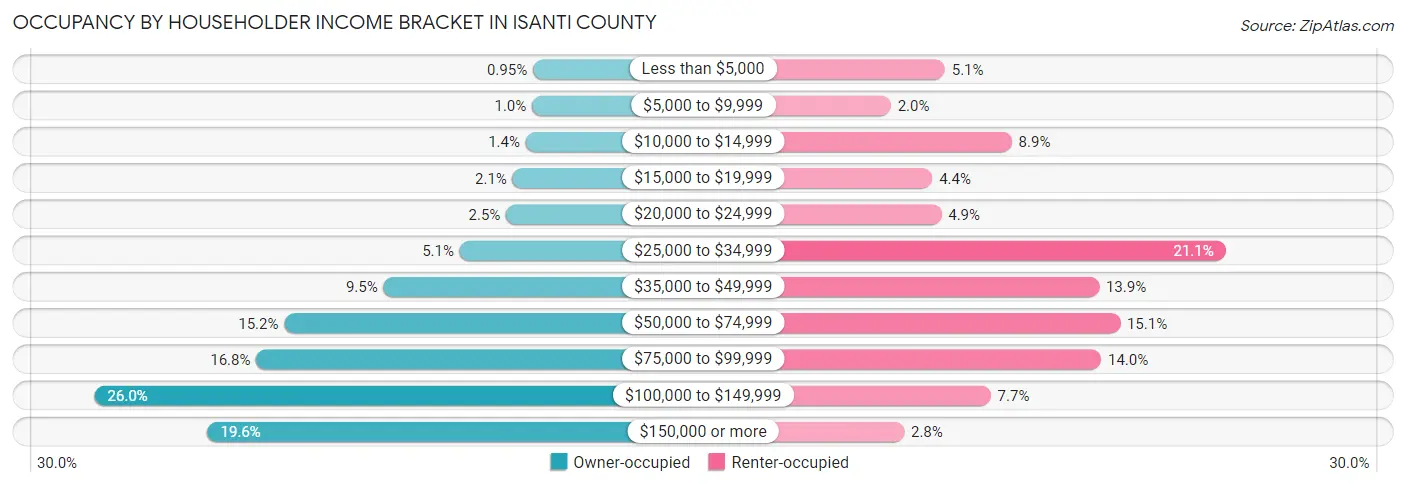
| Income Bracket | Owner-occupied | Renter-occupied |
| Less than $5,000 | 124 (0.9%) | 127 (5.1%) |
| $5,000 to $9,999 | 131 (1.0%) | 50 (2.0%) |
| $10,000 to $14,999 | 178 (1.4%) | 222 (8.9%) |
| $15,000 to $19,999 | 276 (2.1%) | 109 (4.4%) |
| $20,000 to $24,999 | 324 (2.5%) | 122 (4.9%) |
| $25,000 to $34,999 | 671 (5.1%) | 526 (21.1%) |
| $35,000 to $49,999 | 1,242 (9.5%) | 346 (13.9%) |
| $50,000 to $74,999 | 1,984 (15.2%) | 376 (15.1%) |
| $75,000 to $99,999 | 2,193 (16.8%) | 349 (14.0%) |
| $100,000 to $149,999 | 3,403 (26.0%) | 192 (7.7%) |
| $150,000 or more | 2,558 (19.6%) | 69 (2.8%) |
| Total | 13,084 (100.0%) | 2,488 (100.0%) |
Monthly Housing Cost Tiers in Isanti County
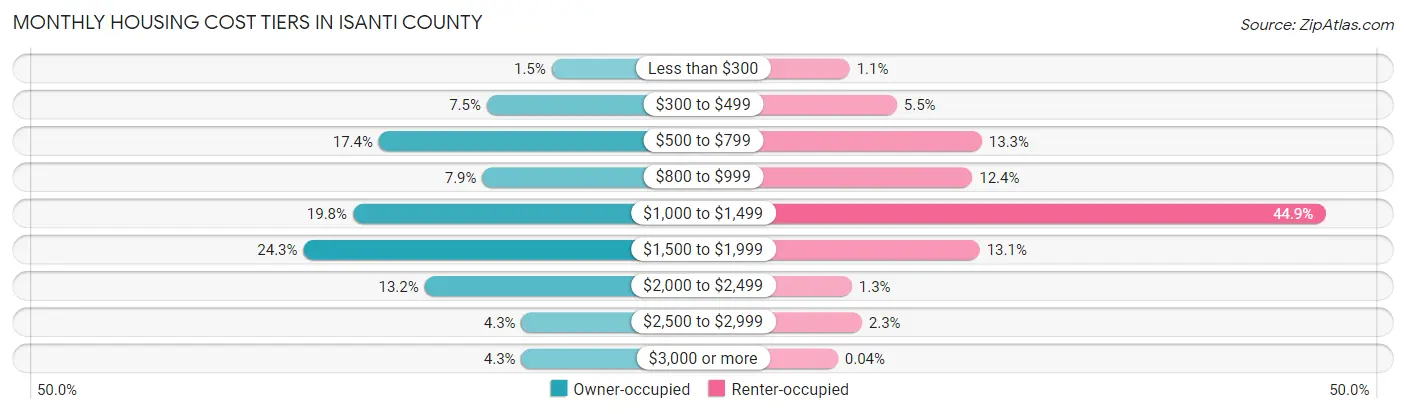
| Monthly Cost | Owner-occupied | Renter-occupied |
| Less than $300 | 193 (1.5%) | 28 (1.1%) |
| $300 to $499 | 975 (7.4%) | 136 (5.5%) |
| $500 to $799 | 2,275 (17.4%) | 331 (13.3%) |
| $800 to $999 | 1,028 (7.9%) | 309 (12.4%) |
| $1,000 to $1,499 | 2,588 (19.8%) | 1,117 (44.9%) |
| $1,500 to $1,999 | 3,185 (24.3%) | 326 (13.1%) |
| $2,000 to $2,499 | 1,725 (13.2%) | 33 (1.3%) |
| $2,500 to $2,999 | 558 (4.3%) | 56 (2.2%) |
| $3,000 or more | 557 (4.3%) | 1 (0.0%) |
| Total | 13,084 (100.0%) | 2,488 (100.0%) |
Physical Housing Characteristics in Isanti County
Housing Structures in Isanti County
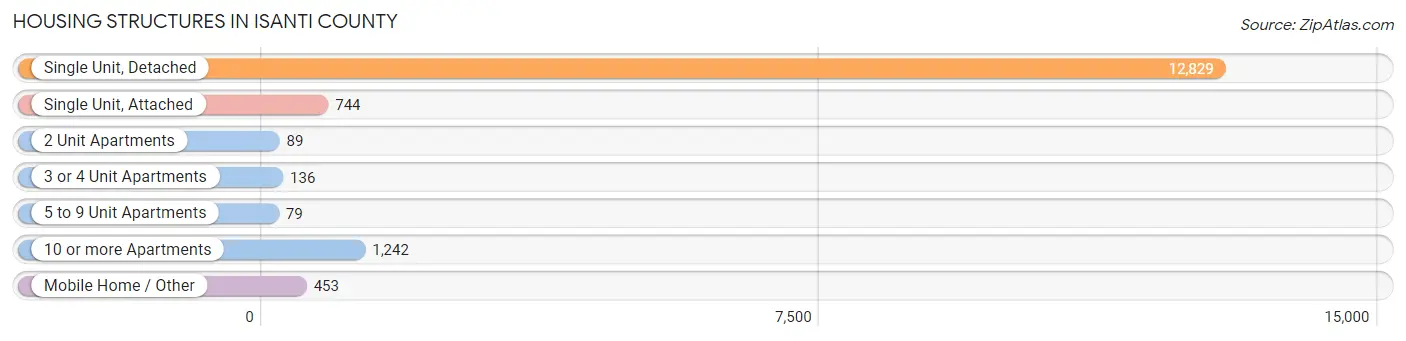
| Structure Type | # Housing Units | % Housing Units |
| Single Unit, Detached | 12,829 | 82.4% |
| Single Unit, Attached | 744 | 4.8% |
| 2 Unit Apartments | 89 | 0.6% |
| 3 or 4 Unit Apartments | 136 | 0.9% |
| 5 to 9 Unit Apartments | 79 | 0.5% |
| 10 or more Apartments | 1,242 | 8.0% |
| Mobile Home / Other | 453 | 2.9% |
| Total | 15,572 | 100.0% |
Housing Structures by Occupancy in Isanti County
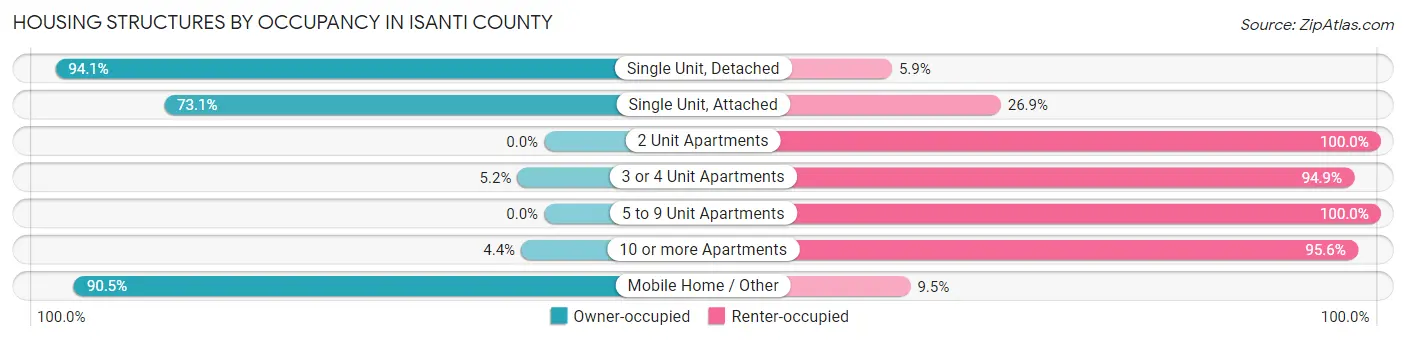
| Structure Type | Owner-occupied | Renter-occupied |
| Single Unit, Detached | 12,068 (94.1%) | 761 (5.9%) |
| Single Unit, Attached | 544 (73.1%) | 200 (26.9%) |
| 2 Unit Apartments | 0 (0.0%) | 89 (100.0%) |
| 3 or 4 Unit Apartments | 7 (5.1%) | 129 (94.9%) |
| 5 to 9 Unit Apartments | 0 (0.0%) | 79 (100.0%) |
| 10 or more Apartments | 55 (4.4%) | 1,187 (95.6%) |
| Mobile Home / Other | 410 (90.5%) | 43 (9.5%) |
| Total | 13,084 (84.0%) | 2,488 (16.0%) |
Housing Structures by Number of Rooms in Isanti County
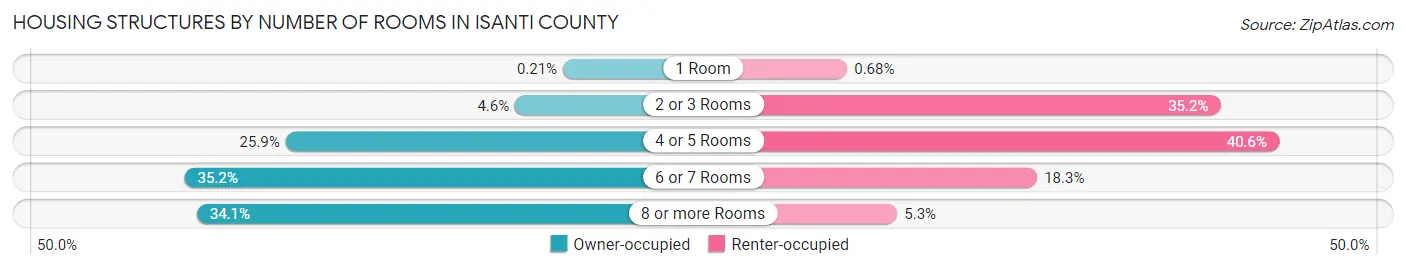
| Number of Rooms | Owner-occupied | Renter-occupied |
| 1 Room | 28 (0.2%) | 17 (0.7%) |
| 2 or 3 Rooms | 607 (4.6%) | 875 (35.2%) |
| 4 or 5 Rooms | 3,385 (25.9%) | 1,010 (40.6%) |
| 6 or 7 Rooms | 4,606 (35.2%) | 454 (18.2%) |
| 8 or more Rooms | 4,458 (34.1%) | 132 (5.3%) |
| Total | 13,084 (100.0%) | 2,488 (100.0%) |
Housing Structure by Heating Type in Isanti County
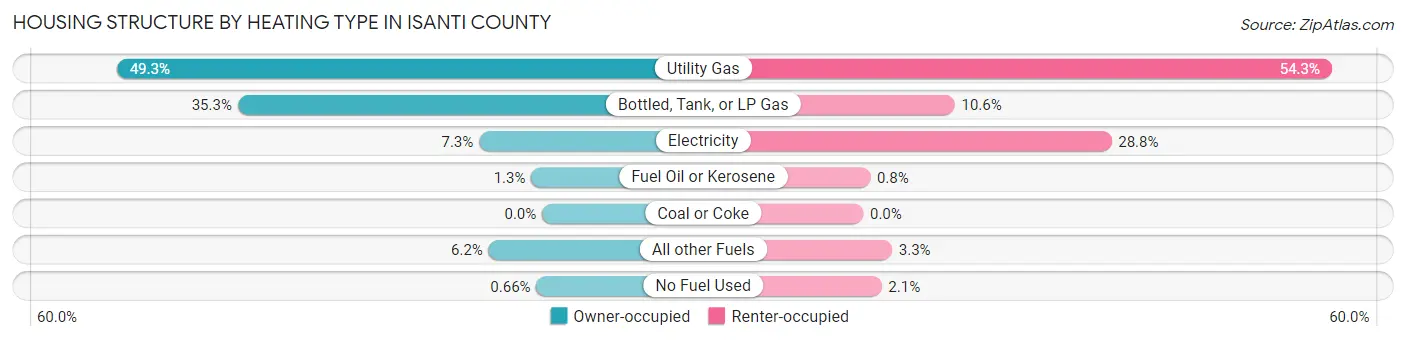
| Heating Type | Owner-occupied | Renter-occupied |
| Utility Gas | 6,453 (49.3%) | 1,352 (54.3%) |
| Bottled, Tank, or LP Gas | 4,617 (35.3%) | 264 (10.6%) |
| Electricity | 955 (7.3%) | 716 (28.8%) |
| Fuel Oil or Kerosene | 163 (1.3%) | 20 (0.8%) |
| Coal or Coke | 0 (0.0%) | 0 (0.0%) |
| All other Fuels | 810 (6.2%) | 83 (3.3%) |
| No Fuel Used | 86 (0.7%) | 53 (2.1%) |
| Total | 13,084 (100.0%) | 2,488 (100.0%) |
Household Vehicle Usage in Isanti County
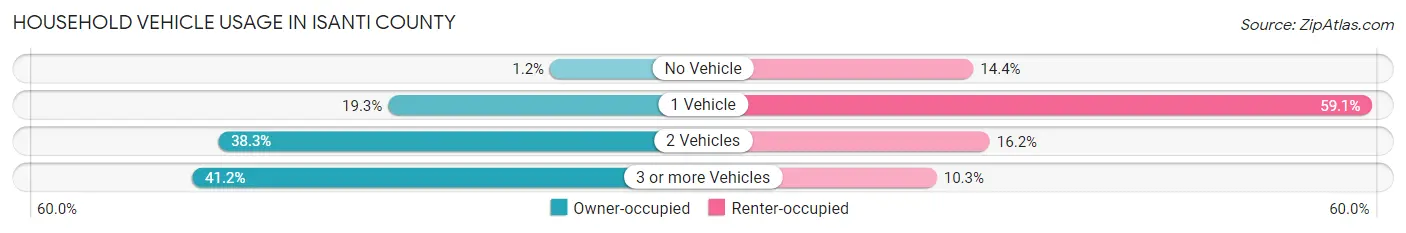
| Vehicles per Household | Owner-occupied | Renter-occupied |
| No Vehicle | 150 (1.1%) | 358 (14.4%) |
| 1 Vehicle | 2,523 (19.3%) | 1,470 (59.1%) |
| 2 Vehicles | 5,016 (38.3%) | 404 (16.2%) |
| 3 or more Vehicles | 5,395 (41.2%) | 256 (10.3%) |
| Total | 13,084 (100.0%) | 2,488 (100.0%) |
Real Estate & Mortgages in Isanti County
Real Estate and Mortgage Overview in Isanti County
| Characteristic | Without Mortgage | With Mortgage |
| Housing Units | 4,135 | 8,949 |
| Median Property Value | $250,700 | $266,600 |
| Median Household Income | $69,789 | $1,921 |
| Monthly Housing Costs | $600 | $554 |
| Real Estate Taxes | $2,699 | $124 |
Property Value by Mortgage Status in Isanti County
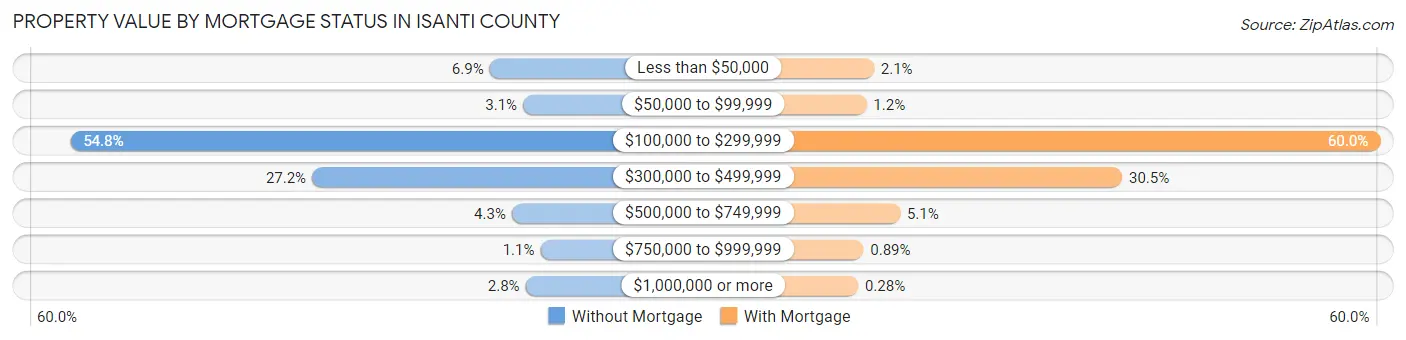
| Property Value | Without Mortgage | With Mortgage |
| Less than $50,000 | 284 (6.9%) | 187 (2.1%) |
| $50,000 to $99,999 | 126 (3.0%) | 111 (1.2%) |
| $100,000 to $299,999 | 2,265 (54.8%) | 5,365 (60.0%) |
| $300,000 to $499,999 | 1,123 (27.2%) | 2,726 (30.5%) |
| $500,000 to $749,999 | 179 (4.3%) | 455 (5.1%) |
| $750,000 to $999,999 | 44 (1.1%) | 80 (0.9%) |
| $1,000,000 or more | 114 (2.8%) | 25 (0.3%) |
| Total | 4,135 (100.0%) | 8,949 (100.0%) |
Household Income by Mortgage Status in Isanti County
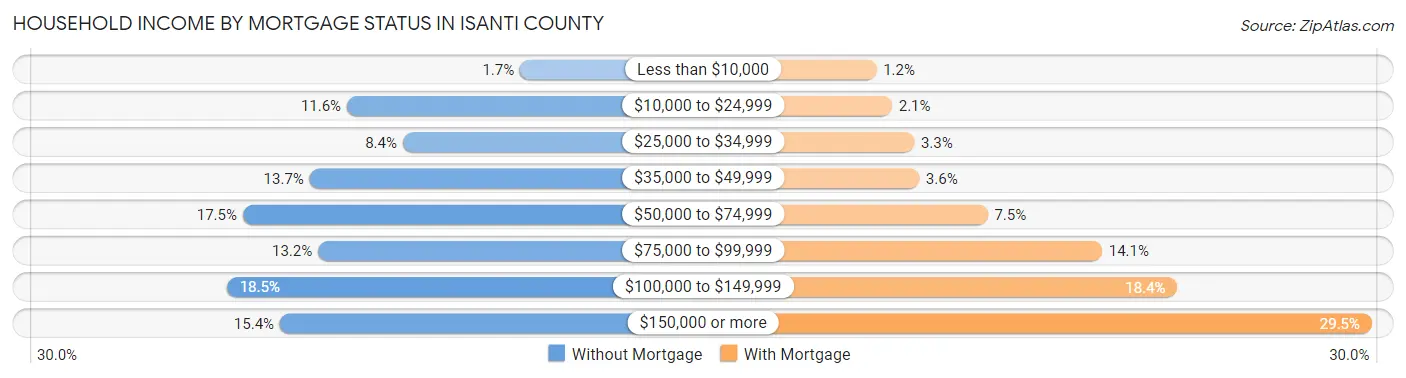
| Household Income | Without Mortgage | With Mortgage |
| Less than $10,000 | 70 (1.7%) | 106 (1.2%) |
| $10,000 to $24,999 | 479 (11.6%) | 185 (2.1%) |
| $25,000 to $34,999 | 347 (8.4%) | 299 (3.3%) |
| $35,000 to $49,999 | 567 (13.7%) | 324 (3.6%) |
| $50,000 to $74,999 | 725 (17.5%) | 675 (7.5%) |
| $75,000 to $99,999 | 547 (13.2%) | 1,259 (14.1%) |
| $100,000 to $149,999 | 763 (18.4%) | 1,646 (18.4%) |
| $150,000 or more | 637 (15.4%) | 2,640 (29.5%) |
| Total | 4,135 (100.0%) | 8,949 (100.0%) |
Property Value to Household Income Ratio in Isanti County
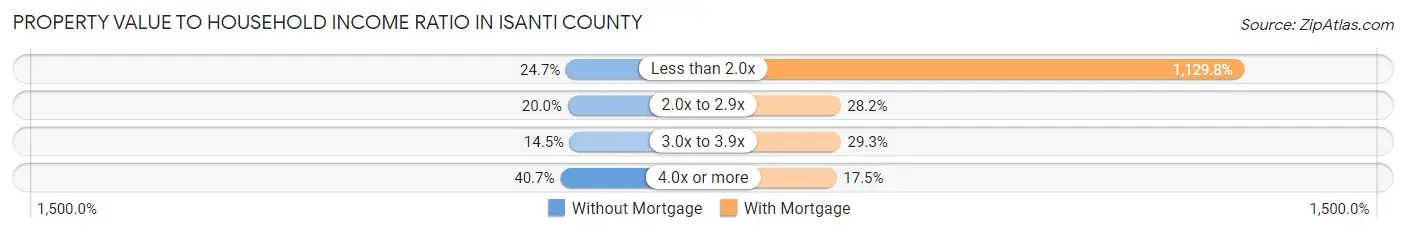
| Value-to-Income Ratio | Without Mortgage | With Mortgage |
| Less than 2.0x | 1,022 (24.7%) | 101,109 (1,129.8%) |
| 2.0x to 2.9x | 828 (20.0%) | 2,519 (28.1%) |
| 3.0x to 3.9x | 598 (14.5%) | 2,622 (29.3%) |
| 4.0x or more | 1,681 (40.6%) | 1,570 (17.5%) |
| Total | 4,135 (100.0%) | 8,949 (100.0%) |
Real Estate Taxes by Mortgage Status in Isanti County
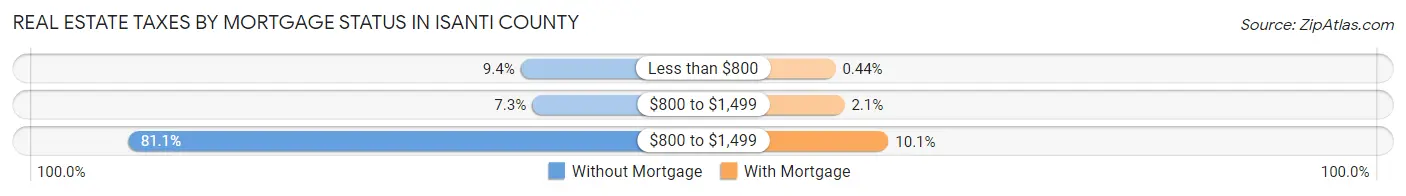
| Property Taxes | Without Mortgage | With Mortgage |
| Less than $800 | 390 (9.4%) | 39 (0.4%) |
| $800 to $1,499 | 303 (7.3%) | 186 (2.1%) |
| $800 to $1,499 | 3,355 (81.1%) | 904 (10.1%) |
| Total | 4,135 (100.0%) | 8,949 (100.0%) |
Health & Disability in Isanti County
Health Insurance Coverage by Age in Isanti County
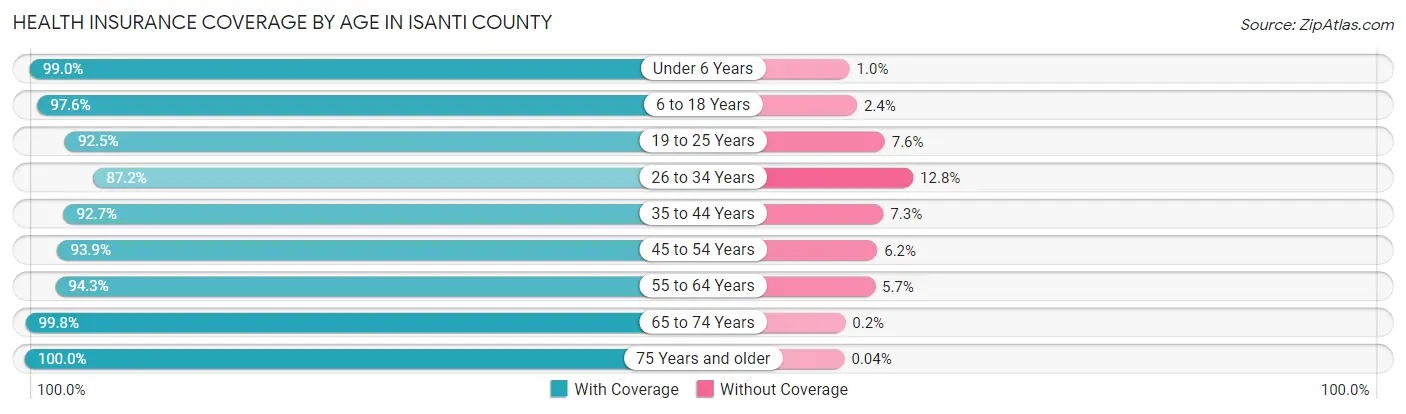
| Age Bracket | With Coverage | Without Coverage |
| Under 6 Years | 2,985 (99.0%) | 30 (1.0%) |
| 6 to 18 Years | 6,794 (97.6%) | 165 (2.4%) |
| 19 to 25 Years | 2,742 (92.4%) | 224 (7.5%) |
| 26 to 34 Years | 4,298 (87.2%) | 633 (12.8%) |
| 35 to 44 Years | 4,842 (92.7%) | 381 (7.3%) |
| 45 to 54 Years | 4,838 (93.9%) | 317 (6.1%) |
| 55 to 64 Years | 5,729 (94.3%) | 348 (5.7%) |
| 65 to 74 Years | 4,085 (99.8%) | 8 (0.2%) |
| 75 Years and older | 2,672 (100.0%) | 1 (0.0%) |
| Total | 38,985 (94.9%) | 2,107 (5.1%) |
Health Insurance Coverage by Citizenship Status in Isanti County
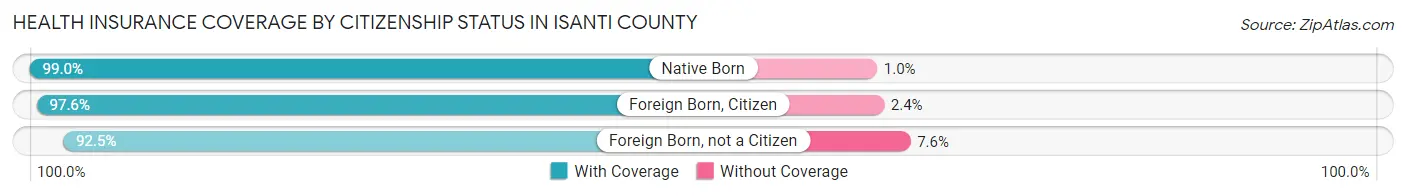
| Citizenship Status | With Coverage | Without Coverage |
| Native Born | 2,985 (99.0%) | 30 (1.0%) |
| Foreign Born, Citizen | 6,794 (97.6%) | 165 (2.4%) |
| Foreign Born, not a Citizen | 2,742 (92.4%) | 224 (7.5%) |
Health Insurance Coverage by Household Income in Isanti County
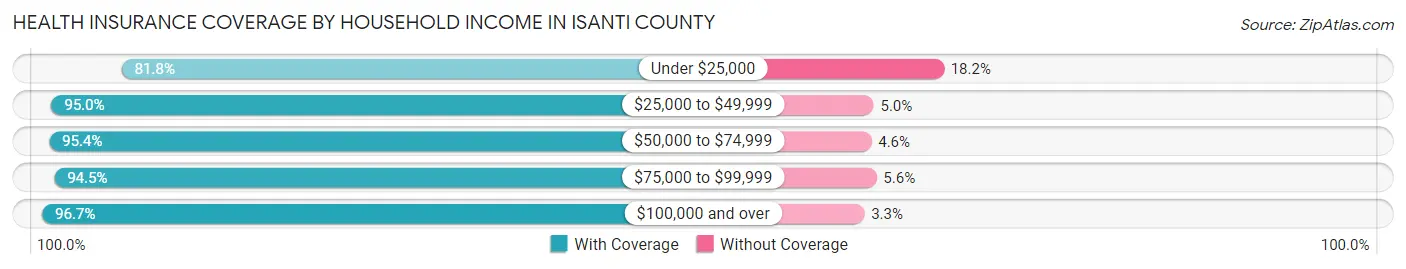
| Household Income | With Coverage | Without Coverage |
| Under $25,000 | 2,307 (81.8%) | 512 (18.2%) |
| $25,000 to $49,999 | 4,837 (95.0%) | 255 (5.0%) |
| $50,000 to $74,999 | 5,718 (95.4%) | 275 (4.6%) |
| $75,000 to $99,999 | 6,716 (94.5%) | 395 (5.6%) |
| $100,000 and over | 19,154 (96.7%) | 647 (3.3%) |
Public vs Private Health Insurance Coverage by Age in Isanti County
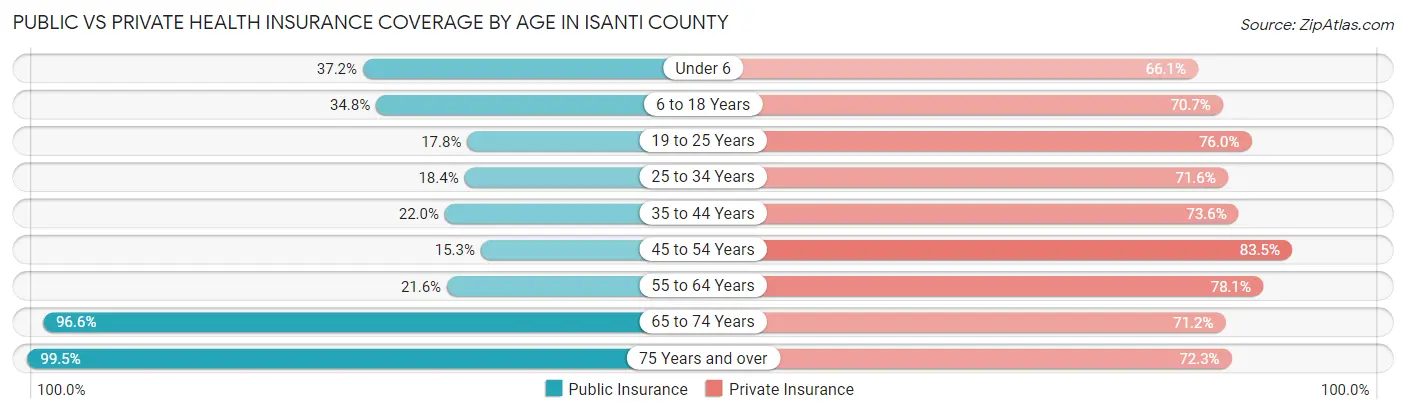
| Age Bracket | Public Insurance | Private Insurance |
| Under 6 | 1,122 (37.2%) | 1,992 (66.1%) |
| 6 to 18 Years | 2,419 (34.8%) | 4,919 (70.7%) |
| 19 to 25 Years | 529 (17.8%) | 2,254 (76.0%) |
| 25 to 34 Years | 905 (18.3%) | 3,530 (71.6%) |
| 35 to 44 Years | 1,149 (22.0%) | 3,846 (73.6%) |
| 45 to 54 Years | 790 (15.3%) | 4,306 (83.5%) |
| 55 to 64 Years | 1,313 (21.6%) | 4,748 (78.1%) |
| 65 to 74 Years | 3,953 (96.6%) | 2,913 (71.2%) |
| 75 Years and over | 2,659 (99.5%) | 1,933 (72.3%) |
| Total | 14,839 (36.1%) | 30,441 (74.1%) |
Disability Status by Sex by Age in Isanti County
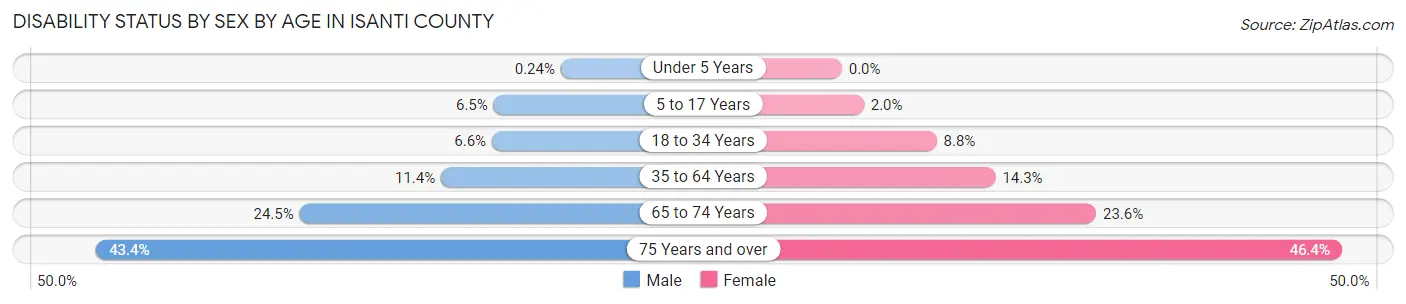
| Age Bracket | Male | Female |
| Under 5 Years | 3 (0.2%) | 0 (0.0%) |
| 5 to 17 Years | 236 (6.5%) | 73 (2.0%) |
| 18 to 34 Years | 289 (6.6%) | 346 (8.8%) |
| 35 to 64 Years | 964 (11.4%) | 1,135 (14.3%) |
| 65 to 74 Years | 479 (24.5%) | 504 (23.6%) |
| 75 Years and over | 502 (43.3%) | 703 (46.4%) |
Disability Class by Sex by Age in Isanti County
Disability Class: Hearing Difficulty
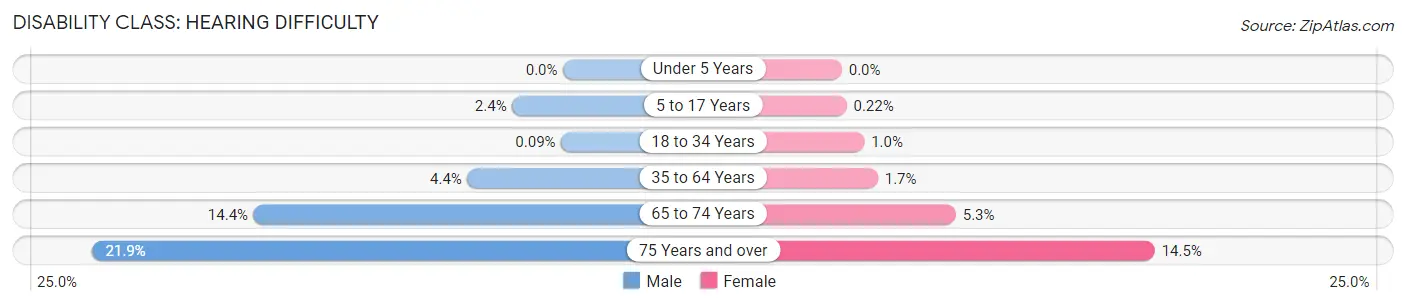
| Age Bracket | Male | Female |
| Under 5 Years | 0 (0.0%) | 0 (0.0%) |
| 5 to 17 Years | 86 (2.4%) | 8 (0.2%) |
| 18 to 34 Years | 4 (0.1%) | 41 (1.0%) |
| 35 to 64 Years | 377 (4.4%) | 133 (1.7%) |
| 65 to 74 Years | 281 (14.4%) | 113 (5.3%) |
| 75 Years and over | 253 (21.8%) | 220 (14.5%) |
Disability Class: Vision Difficulty
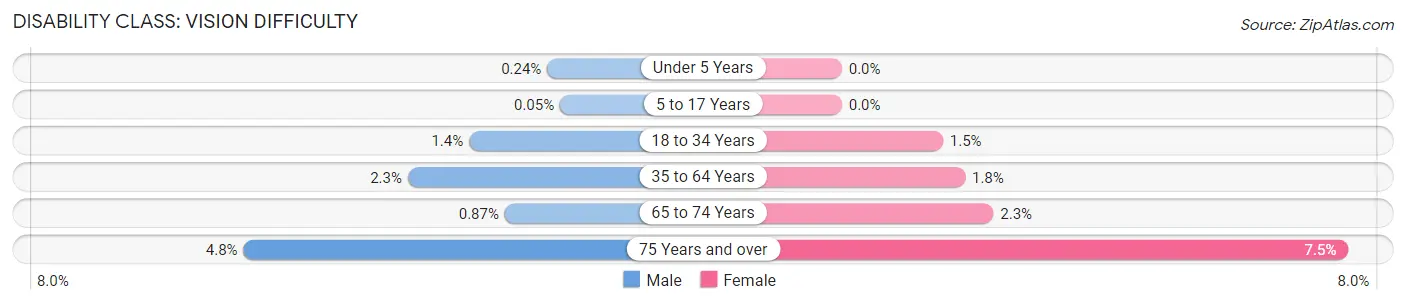
| Age Bracket | Male | Female |
| Under 5 Years | 3 (0.2%) | 0 (0.0%) |
| 5 to 17 Years | 2 (0.1%) | 0 (0.0%) |
| 18 to 34 Years | 61 (1.4%) | 59 (1.5%) |
| 35 to 64 Years | 196 (2.3%) | 146 (1.8%) |
| 65 to 74 Years | 17 (0.9%) | 48 (2.2%) |
| 75 Years and over | 55 (4.8%) | 114 (7.5%) |
Disability Class: Cognitive Difficulty
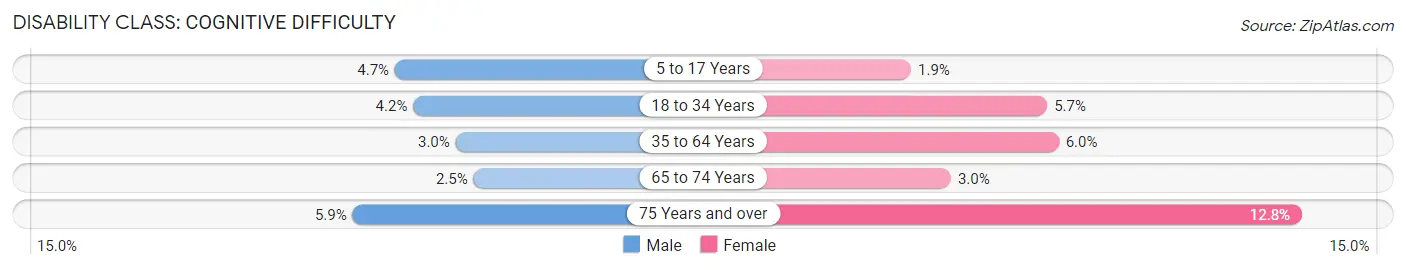
| Age Bracket | Male | Female |
| 5 to 17 Years | 171 (4.7%) | 69 (1.9%) |
| 18 to 34 Years | 182 (4.2%) | 225 (5.7%) |
| 35 to 64 Years | 255 (3.0%) | 481 (6.0%) |
| 65 to 74 Years | 49 (2.5%) | 65 (3.0%) |
| 75 Years and over | 68 (5.9%) | 194 (12.8%) |
Disability Class: Ambulatory Difficulty
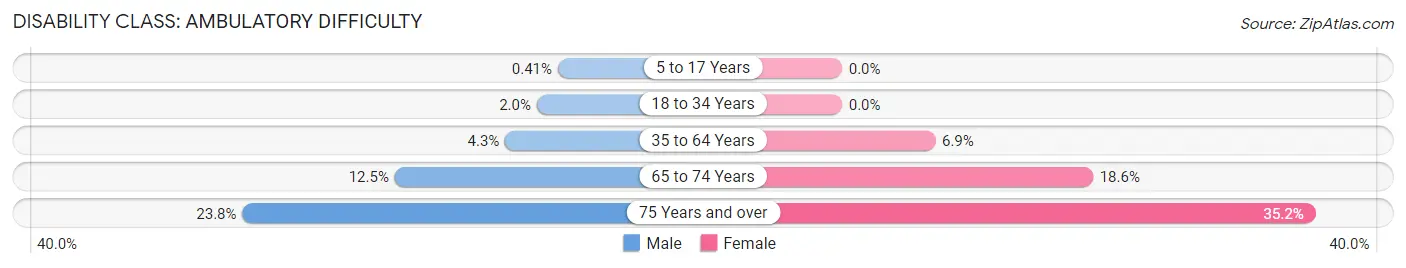
| Age Bracket | Male | Female |
| 5 to 17 Years | 15 (0.4%) | 0 (0.0%) |
| 18 to 34 Years | 86 (2.0%) | 0 (0.0%) |
| 35 to 64 Years | 367 (4.3%) | 551 (6.9%) |
| 65 to 74 Years | 245 (12.5%) | 398 (18.6%) |
| 75 Years and over | 276 (23.8%) | 533 (35.2%) |
Disability Class: Self-Care Difficulty
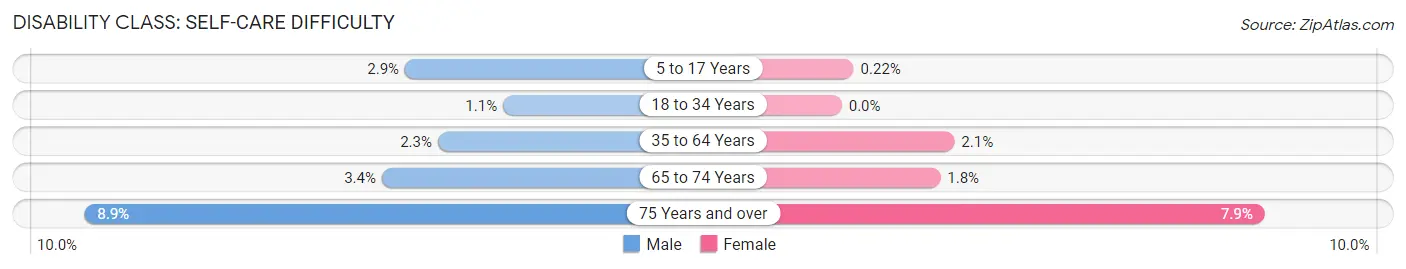
| Age Bracket | Male | Female |
| 5 to 17 Years | 107 (2.9%) | 8 (0.2%) |
| 18 to 34 Years | 49 (1.1%) | 0 (0.0%) |
| 35 to 64 Years | 198 (2.3%) | 166 (2.1%) |
| 65 to 74 Years | 66 (3.4%) | 39 (1.8%) |
| 75 Years and over | 103 (8.9%) | 119 (7.9%) |
Technology Access in Isanti County
Computing Device Access in Isanti County
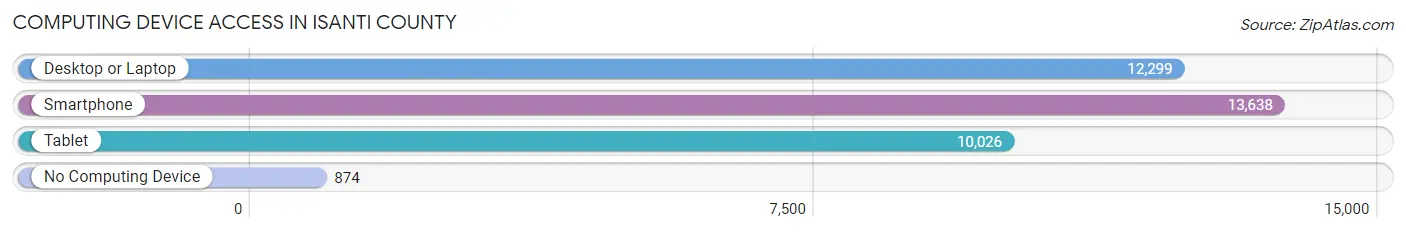
| Device Type | # Households | % Households |
| Desktop or Laptop | 12,299 | 79.0% |
| Smartphone | 13,638 | 87.6% |
| Tablet | 10,026 | 64.4% |
| No Computing Device | 874 | 5.6% |
| Total | 15,572 | 100.0% |
Internet Access in Isanti County
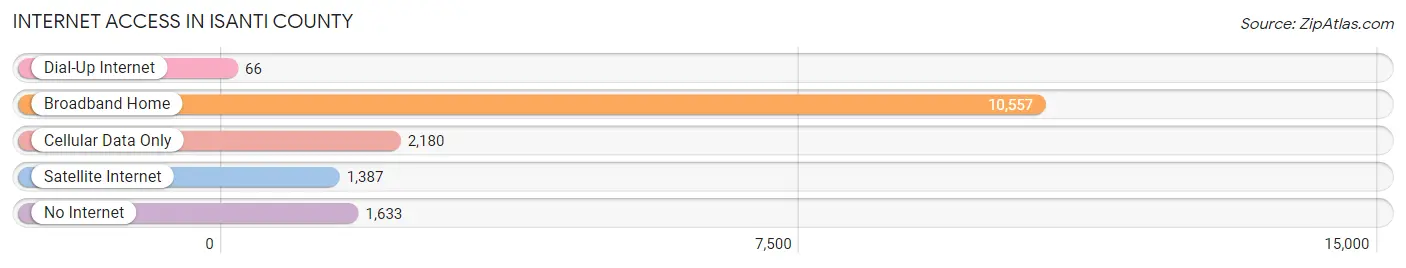
| Internet Type | # Households | % Households |
| Dial-Up Internet | 66 | 0.4% |
| Broadband Home | 10,557 | 67.8% |
| Cellular Data Only | 2,180 | 14.0% |
| Satellite Internet | 1,387 | 8.9% |
| No Internet | 1,633 | 10.5% |
| Total | 15,572 | 100.0% |
Isanti County Summary
Isanti County is located in east-central Minnesota, approximately 40 miles north of Minneapolis. It is bordered by Anoka, Chisago, Kanabec, Mille Lacs, Pine, and Sherburne counties. The county seat is Cambridge, and the largest city is Isanti. The county was established in 1857 and named after the Isanti people, a band of the Dakota Sioux.
Geography
Isanti County covers an area of 545 square miles, of which 543 square miles is land and 2 square miles is water. The county is located in the Anoka Sand Plain region of Minnesota, and is characterized by rolling hills, lakes, and wetlands. The Rum River, which flows through the county, is the main waterway. Other major bodies of water include Lake Isabel, Lake Elizabeth, and Lake Francis. The county is home to several state parks, including Sand Dunes State Forest, St. Croix State Park, and Wild River State Park.
Demographics
As of the 2010 census, Isanti County had a population of 37,816. The racial makeup of the county was 94.2% White, 1.2% African American, 0.7% Native American, 1.2% Asian, 0.1% Pacific Islander, 1.2% from other races, and 1.5% from two or more races. Hispanic or Latino of any race were 3.2% of the population.
The median household income in Isanti County was $60,945 in 2019, and the median family income was $71,945. The per capita income was $27,945. About 8.2% of families and 11.2% of the population were below the poverty line, including 15.2% of those under age 18 and 8.2% of those age 65 or over.
Economy
Isanti County’s economy is largely based on agriculture, manufacturing, and tourism. The county is home to several large agricultural operations, including dairy farms, hog farms, and grain farms. The county is also home to several manufacturing companies, including a paper mill, a plastics manufacturer, and a metal fabrication plant.
Tourism is an important part of the county’s economy, with visitors coming to enjoy the county’s many lakes, parks, and trails. The county is also home to several popular festivals, including the Isanti County Fair and the Isanti County Bluegrass Festival.
History
Isanti County was first settled in the mid-1800s by settlers from Sweden, Norway, and Germany. The county was officially established in 1857 and named after the Isanti people, a band of the Dakota Sioux.
In the late 1800s, the county’s economy was largely based on logging and farming. The county’s first railroad was built in 1872, connecting the county to Minneapolis. This allowed for the development of the county’s manufacturing industry, which included a paper mill, a plastics manufacturer, and a metal fabrication plant.
In the early 1900s, the county’s population began to grow rapidly, and the county’s economy shifted to focus more on agriculture. The county’s population peaked in the 1950s, and has since declined slightly. Today, the county’s economy is largely based on agriculture, manufacturing, and tourism.
Common Questions
What is the Total Population of Isanti County?
Total Population of Isanti County is 41,257.
What is the Total Male Population of Isanti County?
Total Male Population of Isanti County is 20,955.
What is the Total Female Population of Isanti County?
Total Female Population of Isanti County is 20,302.
What is the Ratio of Males per 100 Females in Isanti County?
There are 103.22 Males per 100 Females in Isanti County.
What is the Ratio of Females per 100 Males in Isanti County?
There are 96.88 Females per 100 Males in Isanti County.
What is the Median Population Age in Isanti County?
Median Population Age in Isanti County is 40.2 Years.
What is the Average Family Size in Isanti County
Average Family Size in Isanti County is 3.1 People.
What is the Average Household Size in Isanti County
Average Household Size in Isanti County is 2.6 People.
What is Per Capita Income in Isanti County?
Per Capita income in Isanti County is $38,609.
What is the Median Family Income in Isanti County?
Median Family Income in Isanti County is $93,773.
What is the Median Household income in Isanti County?
Median Household Income in Isanti County is $84,063.
What is Income or Wage Gap in Isanti County?
Income or Wage Gap in Isanti County is 37.2%.
Women in Isanti County earn 62.8 cents for every dollar earned by a man.
What is Family Income Deficit in Isanti County?
Family Income Deficit in Isanti County is $9,633.
Families that are below poverty line in Isanti County earn $9,633 less on average than the poverty threshold level.
What is Inequality or Gini Index in Isanti County?
Inequality or Gini Index in Isanti County is 0.39.
How Large is the Labor Force in Isanti County?
There are 22,050 People in the Labor Forcein in Isanti County.
What is the Percentage of People in the Labor Force in Isanti County?
67.3% of People are in the Labor Force in Isanti County.
What is the Unemployment Rate in Isanti County?
Unemployment Rate in Isanti County is 4.2%.