Hennepin County, MN
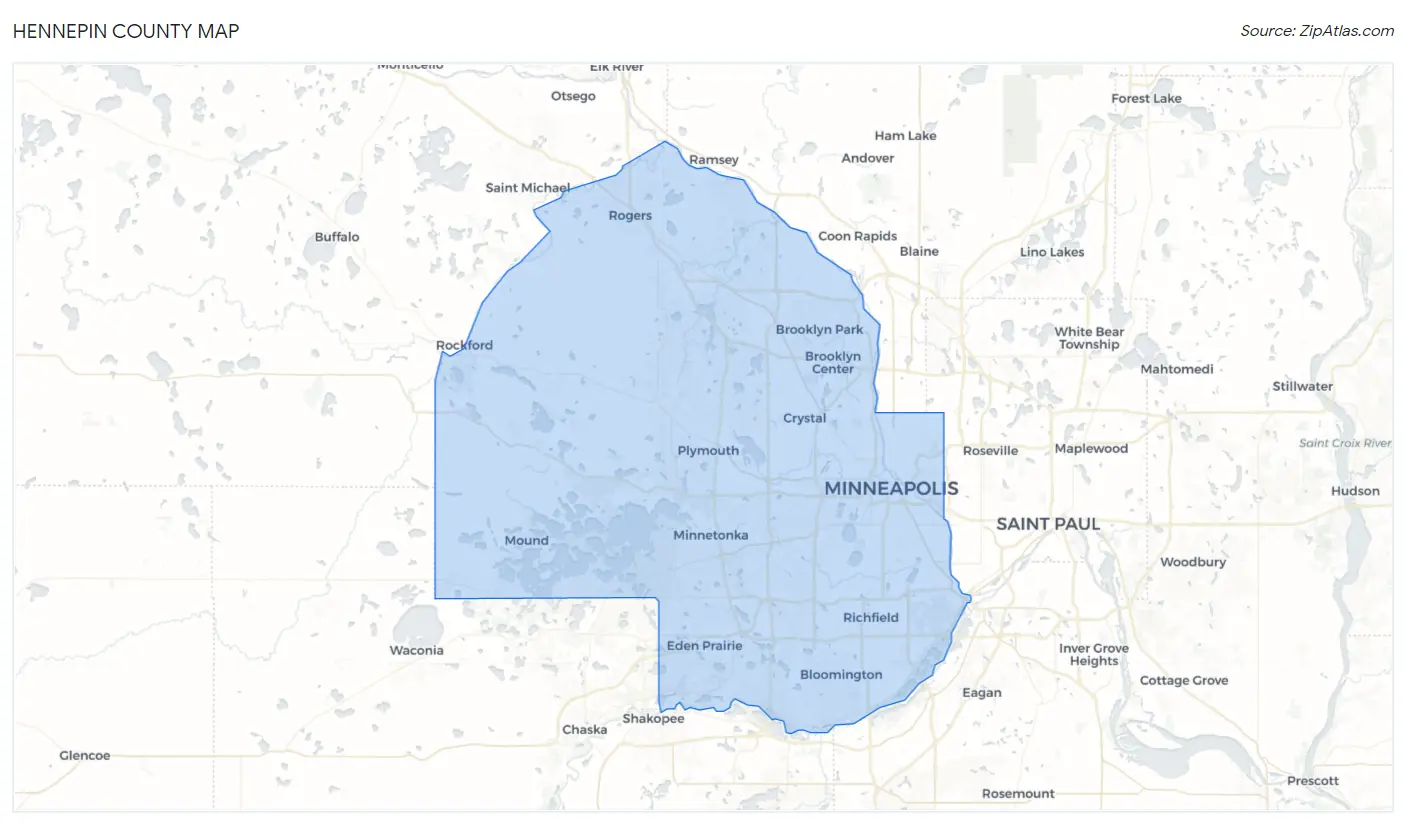
Hennepin County Map
Hennepin County Overview
1,270,787
TOTAL POPULATION
633,454
MALE POPULATION
637,333
FEMALE POPULATION
99.39
MALES / 100 FEMALES
100.61
FEMALES / 100 MALES
37.2
MEDIAN AGE
3.1
AVG FAMILY SIZE
2.4
AVG HOUSEHOLD SIZE
$55,199
PER CAPITA INCOME
$126,404
AVG FAMILY INCOME
$92,595
AVG HOUSEHOLD INCOME
21.9%
WAGE / INCOME GAP [ % ]
78.1¢/ $1
WAGE / INCOME GAP [ $ ]
$10,656
FAMILY INCOME DEFICIT
0.48
INEQUALITY / GINI INDEX
735,236
LABOR FORCE [ PEOPLE ]
71.7%
PERCENT IN LABOR FORCE
4.3%
UNEMPLOYMENT RATE
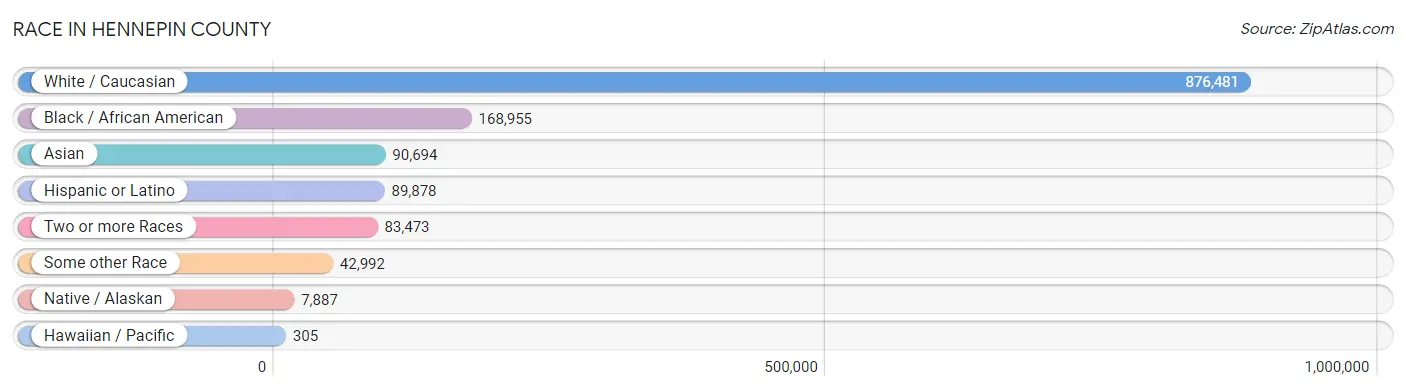
Race in Hennepin County
The most populous races in Hennepin County are White / Caucasian (876,481 | 69.0%), Black / African American (168,955 | 13.3%), and Asian (90,694 | 7.1%).
| Race | # Population | % Population |
| Asian | 90,694 | 7.1% |
| Black / African American | 168,955 | 13.3% |
| Hawaiian / Pacific | 305 | 0.0% |
| Hispanic or Latino | 89,878 | 7.1% |
| Native / Alaskan | 7,887 | 0.6% |
| White / Caucasian | 876,481 | 69.0% |
| Two or more Races | 83,473 | 6.6% |
| Some other Race | 42,992 | 3.4% |
| Total | 1,270,787 | 100.0% |
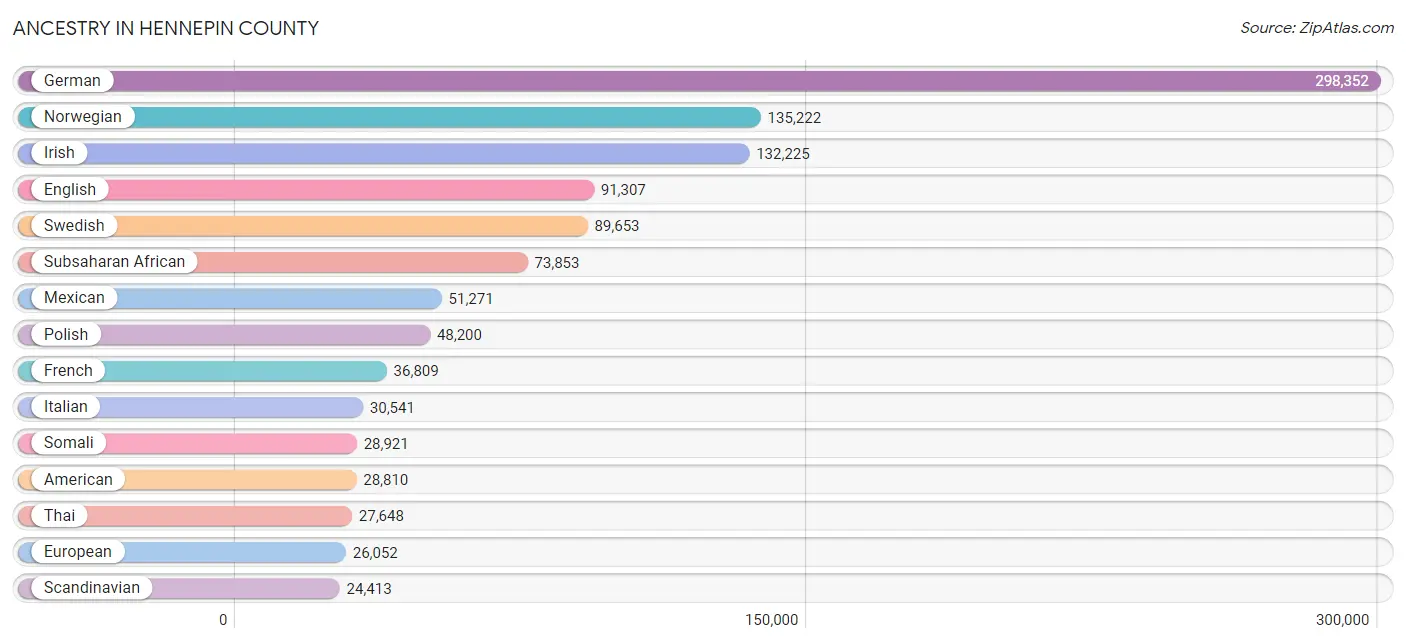
Ancestry in Hennepin County
The most populous ancestries reported in Hennepin County are German (298,352 | 23.5%), Norwegian (135,222 | 10.6%), Irish (132,225 | 10.4%), English (91,307 | 7.2%), and Swedish (89,653 | 7.0%), together accounting for 58.8% of all Hennepin County residents.
| Ancestry | # Population | % Population |
| Afghan | 597 | 0.1% |
| African | 12,385 | 1.0% |
| Alaska Native | 33 | 0.0% |
| Alaskan Athabascan | 21 | 0.0% |
| Albanian | 342 | 0.0% |
| Alsatian | 34 | 0.0% |
| American | 28,810 | 2.3% |
| Apache | 66 | 0.0% |
| Arab | 8,500 | 0.7% |
| Arapaho | 28 | 0.0% |
| Argentinean | 896 | 0.1% |
| Armenian | 412 | 0.0% |
| Assyrian / Chaldean / Syriac | 27 | 0.0% |
| Australian | 390 | 0.0% |
| Austrian | 4,374 | 0.3% |
| Bahamian | 482 | 0.0% |
| Bangladeshi | 24,111 | 1.9% |
| Barbadian | 174 | 0.0% |
| Basque | 17 | 0.0% |
| Belgian | 2,126 | 0.2% |
| Belizean | 132 | 0.0% |
| Bhutanese | 3,588 | 0.3% |
| Blackfeet | 209 | 0.0% |
| Bolivian | 314 | 0.0% |
| Brazilian | 842 | 0.1% |
| British | 6,418 | 0.5% |
| British West Indian | 25 | 0.0% |
| Bulgarian | 472 | 0.0% |
| Burmese | 8,204 | 0.6% |
| Cajun | 105 | 0.0% |
| Cambodian | 54 | 0.0% |
| Canadian | 2,115 | 0.2% |
| Cape Verdean | 41 | 0.0% |
| Carpatho Rusyn | 119 | 0.0% |
| Celtic | 53 | 0.0% |
| Central American | 8,233 | 0.6% |
| Central American Indian | 1,076 | 0.1% |
| Cherokee | 1,640 | 0.1% |
| Cheyenne | 29 | 0.0% |
| Chickasaw | 105 | 0.0% |
| Chilean | 748 | 0.1% |
| Chinese | 9 | 0.0% |
| Chippewa | 7,587 | 0.6% |
| Choctaw | 217 | 0.0% |
| Colombian | 2,639 | 0.2% |
| Comanche | 60 | 0.0% |
| Costa Rican | 579 | 0.1% |
| Cree | 113 | 0.0% |
| Creek | 77 | 0.0% |
| Croatian | 2,640 | 0.2% |
| Crow | 14 | 0.0% |
| Cuban | 2,030 | 0.2% |
| Cypriot | 89 | 0.0% |
| Czech | 14,672 | 1.1% |
| Czechoslovakian | 2,143 | 0.2% |
| Danish | 15,422 | 1.2% |
| Dominican | 845 | 0.1% |
| Dutch | 17,383 | 1.4% |
| Eastern European | 6,104 | 0.5% |
| Ecuadorian | 8,786 | 0.7% |
| Egyptian | 1,575 | 0.1% |
| English | 91,307 | 7.2% |
| Estonian | 146 | 0.0% |
| Ethiopian | 8,633 | 0.7% |
| European | 26,052 | 2.1% |
| Fijian | 20 | 0.0% |
| Filipino | 1,082 | 0.1% |
| Finnish | 15,240 | 1.2% |
| French | 36,809 | 2.9% |
| French American Indian | 219 | 0.0% |
| French Canadian | 8,812 | 0.7% |
| German | 298,352 | 23.5% |
| German Russian | 331 | 0.0% |
| Ghanaian | 1,694 | 0.1% |
| Greek | 3,553 | 0.3% |
| Guamanian / Chamorro | 74 | 0.0% |
| Guatemalan | 2,632 | 0.2% |
| Guyanese | 1,205 | 0.1% |
| Haitian | 444 | 0.0% |
| Honduran | 1,074 | 0.1% |
| Hopi | 108 | 0.0% |
| Hungarian | 3,245 | 0.3% |
| Icelander | 784 | 0.1% |
| Indian (Asian) | 17,103 | 1.3% |
| Indonesian | 239 | 0.0% |
| Inupiat | 8 | 0.0% |
| Iranian | 1,695 | 0.1% |
| Iraqi | 219 | 0.0% |
| Irish | 132,225 | 10.4% |
| Iroquois | 221 | 0.0% |
| Israeli | 360 | 0.0% |
| Italian | 30,541 | 2.4% |
| Jamaican | 1,503 | 0.1% |
| Japanese | 1,663 | 0.1% |
| Jordanian | 309 | 0.0% |
| Kenyan | 2,725 | 0.2% |
| Kiowa | 98 | 0.0% |
| Korean | 6,244 | 0.5% |
| Laotian | 390 | 0.0% |
| Latvian | 1,118 | 0.1% |
| Lebanese | 2,965 | 0.2% |
| Liberian | 10,895 | 0.9% |
| Lithuanian | 2,073 | 0.2% |
| Luxembourger | 1,197 | 0.1% |
| Macedonian | 137 | 0.0% |
| Malaysian | 4,422 | 0.4% |
| Maltese | 23 | 0.0% |
| Menominee | 64 | 0.0% |
| Mexican | 51,271 | 4.0% |
| Mexican American Indian | 1,152 | 0.1% |
| Mongolian | 291 | 0.0% |
| Moroccan | 425 | 0.0% |
| Native Hawaiian | 550 | 0.0% |
| Navajo | 161 | 0.0% |
| New Zealander | 28 | 0.0% |
| Nicaraguan | 711 | 0.1% |
| Nigerian | 4,009 | 0.3% |
| Northern European | 4,646 | 0.4% |
| Norwegian | 135,222 | 10.6% |
| Okinawan | 49 | 0.0% |
| Osage | 45 | 0.0% |
| Ottawa | 25 | 0.0% |
| Paiute | 6 | 0.0% |
| Pakistani | 1,196 | 0.1% |
| Palestinian | 987 | 0.1% |
| Panamanian | 337 | 0.0% |
| Paraguayan | 110 | 0.0% |
| Pennsylvania German | 243 | 0.0% |
| Peruvian | 1,296 | 0.1% |
| Polish | 48,200 | 3.8% |
| Portuguese | 1,141 | 0.1% |
| Potawatomi | 107 | 0.0% |
| Pueblo | 138 | 0.0% |
| Puerto Rican | 4,586 | 0.4% |
| Puget Sound Salish | 7 | 0.0% |
| Romanian | 2,182 | 0.2% |
| Russian | 12,422 | 1.0% |
| Salvadoran | 2,874 | 0.2% |
| Samoan | 314 | 0.0% |
| Scandinavian | 24,413 | 1.9% |
| Scotch-Irish | 6,700 | 0.5% |
| Scottish | 17,469 | 1.4% |
| Senegalese | 138 | 0.0% |
| Serbian | 761 | 0.1% |
| Sierra Leonean | 353 | 0.0% |
| Sioux | 2,169 | 0.2% |
| Slavic | 785 | 0.1% |
| Slovak | 2,623 | 0.2% |
| Slovene | 1,811 | 0.1% |
| Somali | 28,921 | 2.3% |
| South African | 296 | 0.0% |
| South American | 16,155 | 1.3% |
| South American Indian | 148 | 0.0% |
| Soviet Union | 30 | 0.0% |
| Spaniard | 2,201 | 0.2% |
| Spanish | 1,106 | 0.1% |
| Sri Lankan | 10,797 | 0.9% |
| Subsaharan African | 73,853 | 5.8% |
| Sudanese | 415 | 0.0% |
| Swedish | 89,653 | 7.0% |
| Swiss | 5,214 | 0.4% |
| Syrian | 508 | 0.0% |
| Thai | 27,648 | 2.2% |
| Tlingit-Haida | 57 | 0.0% |
| Tongan | 165 | 0.0% |
| Trinidadian and Tobagonian | 596 | 0.1% |
| Tsimshian | 41 | 0.0% |
| Turkish | 473 | 0.0% |
| Ugandan | 320 | 0.0% |
| Ukrainian | 5,842 | 0.5% |
| Uruguayan | 444 | 0.0% |
| Ute | 18 | 0.0% |
| Venezuelan | 922 | 0.1% |
| Vietnamese | 506 | 0.0% |
| Welsh | 6,751 | 0.5% |
| West Indian | 518 | 0.0% |
| Yaqui | 32 | 0.0% |
| Yugoslavian | 699 | 0.1% |
| Yuman | 4 | 0.0% |
| Yup'ik | 38 | 0.0% |
| Zimbabwean | 9 | 0.0% | View All 181 Rows |
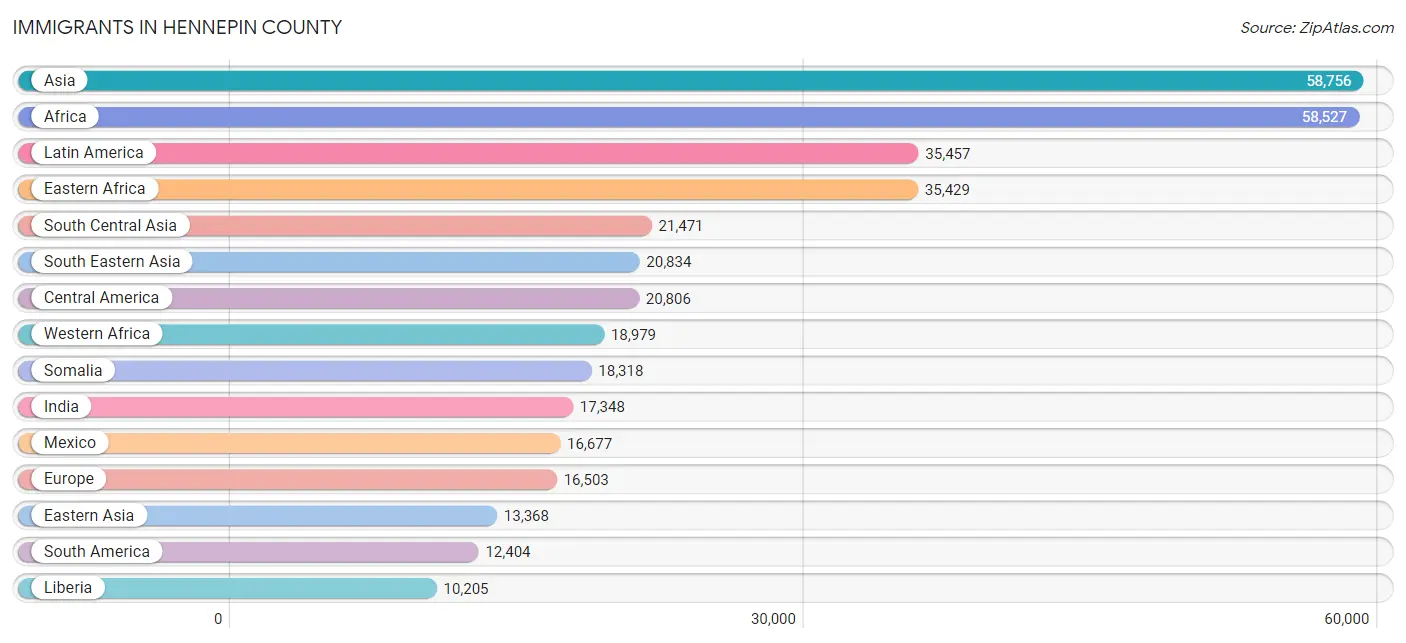
Immigrants in Hennepin County
The most numerous immigrant groups reported in Hennepin County came from Asia (58,756 | 4.6%), Africa (58,527 | 4.6%), Latin America (35,457 | 2.8%), Eastern Africa (35,429 | 2.8%), and South Central Asia (21,471 | 1.7%), together accounting for 16.5% of all Hennepin County residents.
| Immigration Origin | # Population | % Population |
| Afghanistan | 576 | 0.1% |
| Africa | 58,527 | 4.6% |
| Albania | 121 | 0.0% |
| Argentina | 715 | 0.1% |
| Asia | 58,756 | 4.6% |
| Australia | 314 | 0.0% |
| Austria | 84 | 0.0% |
| Azores | 4 | 0.0% |
| Bahamas | 181 | 0.0% |
| Bangladesh | 328 | 0.0% |
| Barbados | 81 | 0.0% |
| Belarus | 743 | 0.1% |
| Belgium | 181 | 0.0% |
| Belize | 75 | 0.0% |
| Bolivia | 166 | 0.0% |
| Bosnia and Herzegovina | 490 | 0.0% |
| Brazil | 1,492 | 0.1% |
| Bulgaria | 246 | 0.0% |
| Cabo Verde | 24 | 0.0% |
| Cambodia | 823 | 0.1% |
| Cameroon | 875 | 0.1% |
| Canada | 4,344 | 0.3% |
| Caribbean | 2,247 | 0.2% |
| Central America | 20,806 | 1.6% |
| Chile | 269 | 0.0% |
| China | 8,780 | 0.7% |
| Colombia | 1,126 | 0.1% |
| Congo | 50 | 0.0% |
| Costa Rica | 201 | 0.0% |
| Croatia | 60 | 0.0% |
| Cuba | 504 | 0.0% |
| Czechoslovakia | 273 | 0.0% |
| Denmark | 135 | 0.0% |
| Dominican Republic | 345 | 0.0% |
| Eastern Africa | 35,429 | 2.8% |
| Eastern Asia | 13,368 | 1.1% |
| Eastern Europe | 8,935 | 0.7% |
| Ecuador | 5,221 | 0.4% |
| Egypt | 768 | 0.1% |
| El Salvador | 1,355 | 0.1% |
| England | 1,078 | 0.1% |
| Eritrea | 294 | 0.0% |
| Ethiopia | 8,672 | 0.7% |
| Europe | 16,503 | 1.3% |
| Fiji | 32 | 0.0% |
| France | 854 | 0.1% |
| Germany | 1,748 | 0.1% |
| Ghana | 1,382 | 0.1% |
| Greece | 172 | 0.0% |
| Grenada | 8 | 0.0% |
| Guatemala | 1,672 | 0.1% |
| Guyana | 1,728 | 0.1% |
| Haiti | 186 | 0.0% |
| Honduras | 560 | 0.0% |
| Hong Kong | 365 | 0.0% |
| Hungary | 175 | 0.0% |
| India | 17,348 | 1.4% |
| Indonesia | 101 | 0.0% |
| Iran | 979 | 0.1% |
| Iraq | 121 | 0.0% |
| Ireland | 346 | 0.0% |
| Israel | 279 | 0.0% |
| Italy | 414 | 0.0% |
| Jamaica | 353 | 0.0% |
| Japan | 732 | 0.1% |
| Jordan | 227 | 0.0% |
| Kazakhstan | 141 | 0.0% |
| Kenya | 6,612 | 0.5% |
| Korea | 3,817 | 0.3% |
| Kuwait | 171 | 0.0% |
| Laos | 6,986 | 0.5% |
| Latin America | 35,457 | 2.8% |
| Latvia | 378 | 0.0% |
| Lebanon | 355 | 0.0% |
| Liberia | 10,205 | 0.8% |
| Lithuania | 137 | 0.0% |
| Malaysia | 408 | 0.0% |
| Mexico | 16,677 | 1.3% |
| Micronesia | 10 | 0.0% |
| Middle Africa | 1,019 | 0.1% |
| Moldova | 992 | 0.1% |
| Morocco | 246 | 0.0% |
| Nepal | 761 | 0.1% |
| Netherlands | 327 | 0.0% |
| Nicaragua | 79 | 0.0% |
| Nigeria | 3,516 | 0.3% |
| Northern Africa | 2,014 | 0.2% |
| Northern Europe | 3,087 | 0.2% |
| Norway | 163 | 0.0% |
| Oceania | 515 | 0.0% |
| Pakistan | 687 | 0.1% |
| Panama | 187 | 0.0% |
| Peru | 550 | 0.0% |
| Philippines | 2,606 | 0.2% |
| Poland | 185 | 0.0% |
| Portugal | 46 | 0.0% |
| Romania | 246 | 0.0% |
| Russia | 2,745 | 0.2% |
| Saudi Arabia | 381 | 0.0% |
| Scotland | 192 | 0.0% |
| Senegal | 129 | 0.0% |
| Serbia | 115 | 0.0% |
| Sierra Leone | 698 | 0.1% |
| Singapore | 67 | 0.0% |
| Somalia | 18,318 | 1.4% |
| South Africa | 442 | 0.0% |
| South America | 12,404 | 1.0% |
| South Central Asia | 21,471 | 1.7% |
| South Eastern Asia | 20,834 | 1.6% |
| Southern Europe | 1,163 | 0.1% |
| Spain | 531 | 0.0% |
| Sri Lanka | 334 | 0.0% |
| Sudan | 621 | 0.1% |
| Sweden | 179 | 0.0% |
| Switzerland | 105 | 0.0% |
| Syria | 240 | 0.0% |
| Taiwan | 1,124 | 0.1% |
| Thailand | 3,708 | 0.3% |
| Trinidad and Tobago | 416 | 0.0% |
| Turkey | 318 | 0.0% |
| Uganda | 545 | 0.0% |
| Ukraine | 1,513 | 0.1% |
| Uruguay | 258 | 0.0% |
| Uzbekistan | 225 | 0.0% |
| Venezuela | 754 | 0.1% |
| Vietnam | 6,047 | 0.5% |
| Western Africa | 18,979 | 1.5% |
| Western Asia | 3,040 | 0.2% |
| Western Europe | 3,299 | 0.3% |
| Yemen | 136 | 0.0% |
| Zaire | 74 | 0.0% |
| Zimbabwe | 102 | 0.0% | View All 132 Rows |
Sex and Age in Hennepin County
Sex and Age in Hennepin County
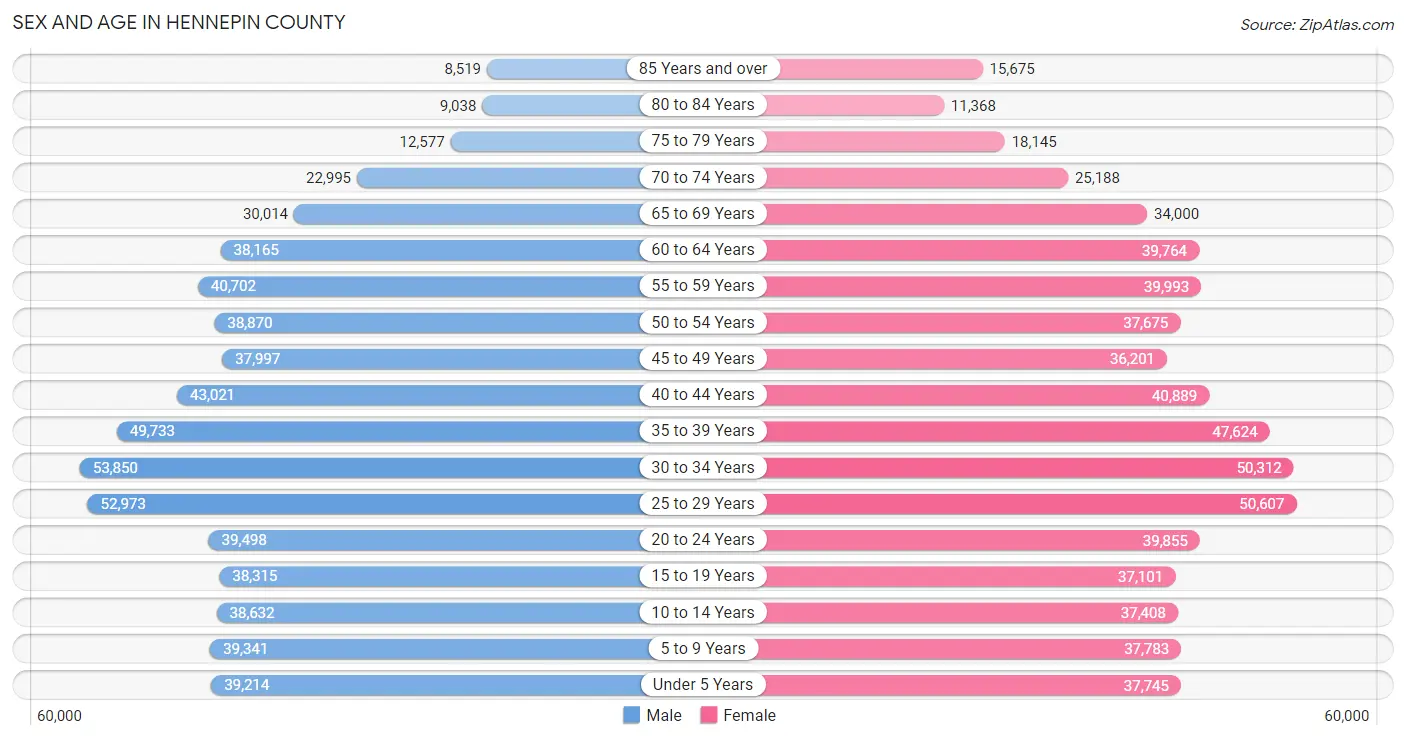
The most populous age groups in Hennepin County are 30 to 34 Years (53,850 | 8.5%) for men and 25 to 29 Years (50,607 | 7.9%) for women.
| Age Bracket | Male | Female |
| Under 5 Years | 39,214 (6.2%) | 37,745 (5.9%) |
| 5 to 9 Years | 39,341 (6.2%) | 37,783 (5.9%) |
| 10 to 14 Years | 38,632 (6.1%) | 37,408 (5.9%) |
| 15 to 19 Years | 38,315 (6.0%) | 37,101 (5.8%) |
| 20 to 24 Years | 39,498 (6.2%) | 39,855 (6.2%) |
| 25 to 29 Years | 52,973 (8.4%) | 50,607 (7.9%) |
| 30 to 34 Years | 53,850 (8.5%) | 50,312 (7.9%) |
| 35 to 39 Years | 49,733 (7.9%) | 47,624 (7.5%) |
| 40 to 44 Years | 43,021 (6.8%) | 40,889 (6.4%) |
| 45 to 49 Years | 37,997 (6.0%) | 36,201 (5.7%) |
| 50 to 54 Years | 38,870 (6.1%) | 37,675 (5.9%) |
| 55 to 59 Years | 40,702 (6.4%) | 39,993 (6.3%) |
| 60 to 64 Years | 38,165 (6.0%) | 39,764 (6.2%) |
| 65 to 69 Years | 30,014 (4.7%) | 34,000 (5.3%) |
| 70 to 74 Years | 22,995 (3.6%) | 25,188 (4.0%) |
| 75 to 79 Years | 12,577 (2.0%) | 18,145 (2.9%) |
| 80 to 84 Years | 9,038 (1.4%) | 11,368 (1.8%) |
| 85 Years and over | 8,519 (1.3%) | 15,675 (2.5%) |
| Total | 633,454 (100.0%) | 637,333 (100.0%) |
Families and Households in Hennepin County
Median Family Size in Hennepin County
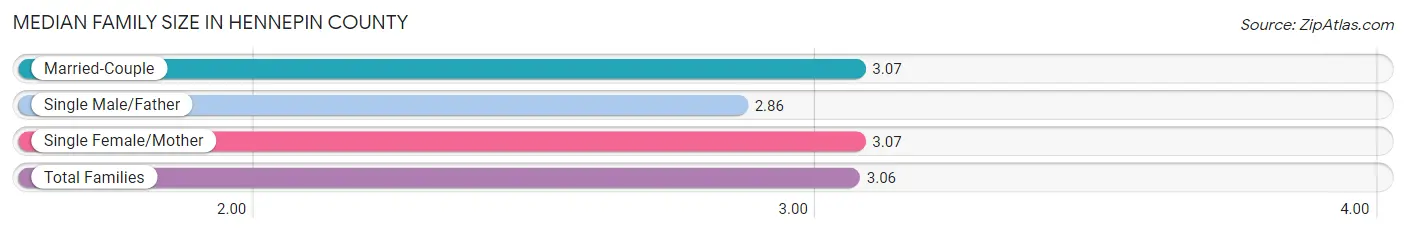
The median family size in Hennepin County is 3.06 persons per family, with married-couple families (231,614 | 77.4%) accounting for the largest median family size of 3.07 persons per family. On the other hand, single male/father families (20,384 | 6.8%) represent the smallest median family size with 2.86 persons per family.
| Family Type | # Families | Family Size |
| Married-Couple | 231,614 (77.4%) | 3.07 |
| Single Male/Father | 20,384 (6.8%) | 2.86 |
| Single Female/Mother | 47,269 (15.8%) | 3.07 |
| Total Families | 299,267 (100.0%) | 3.06 |
Median Household Size in Hennepin County
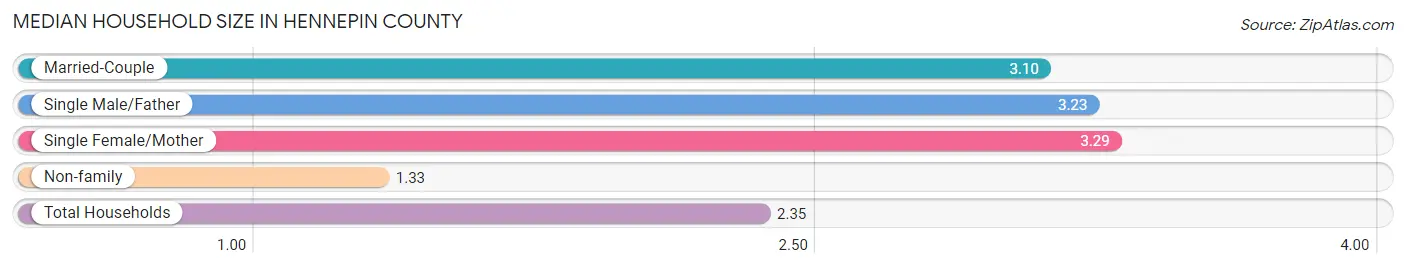
The median household size in Hennepin County is 2.35 persons per household, with single female/mother households (47,269 | 8.9%) accounting for the largest median household size of 3.29 persons per household. non-family households (229,762 | 43.4%) represent the smallest median household size with 1.33 persons per household.
| Household Type | # Households | Household Size |
| Married-Couple | 231,614 (43.8%) | 3.10 |
| Single Male/Father | 20,384 (3.8%) | 3.23 |
| Single Female/Mother | 47,269 (8.9%) | 3.29 |
| Non-family | 229,762 (43.4%) | 1.33 |
| Total Households | 529,029 (100.0%) | 2.35 |
Household Size by Marriage Status in Hennepin County
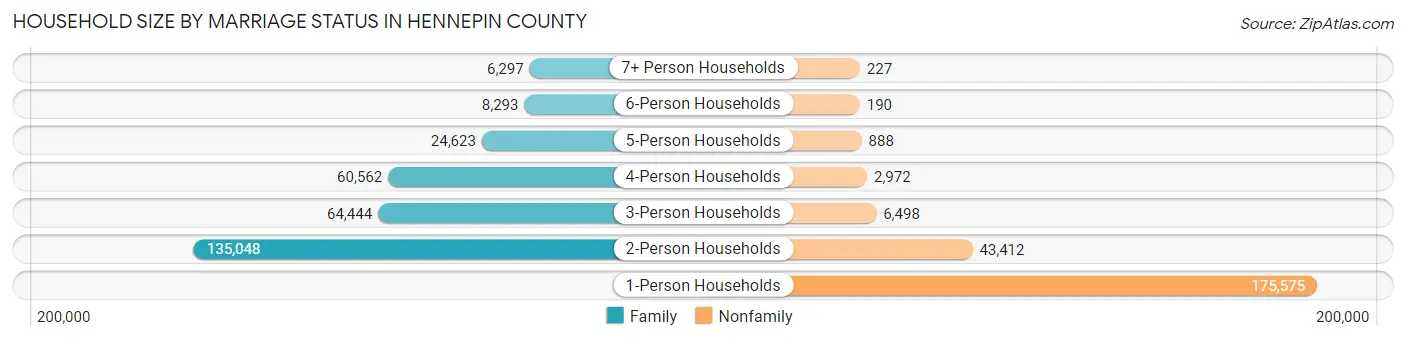
Out of a total of 529,029 households in Hennepin County, 299,267 (56.6%) are family households, while 229,762 (43.4%) are nonfamily households. The most numerous type of family households are 2-person households, comprising 135,048, and the most common type of nonfamily households are 1-person households, comprising 175,575.
| Household Size | Family Households | Nonfamily Households |
| 1-Person Households | - | 175,575 (33.2%) |
| 2-Person Households | 135,048 (25.5%) | 43,412 (8.2%) |
| 3-Person Households | 64,444 (12.2%) | 6,498 (1.2%) |
| 4-Person Households | 60,562 (11.5%) | 2,972 (0.6%) |
| 5-Person Households | 24,623 (4.6%) | 888 (0.2%) |
| 6-Person Households | 8,293 (1.6%) | 190 (0.0%) |
| 7+ Person Households | 6,297 (1.2%) | 227 (0.0%) |
| Total | 299,267 (56.6%) | 229,762 (43.4%) |
Female Fertility in Hennepin County
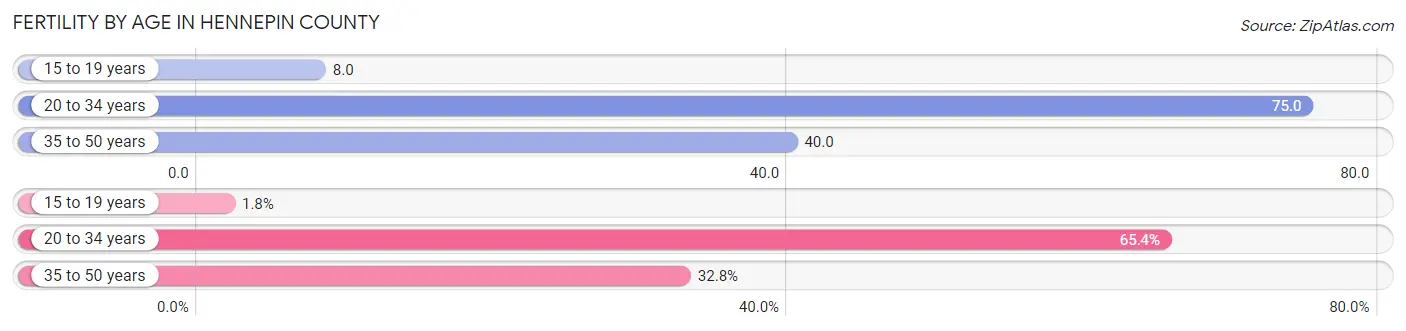
Fertility by Age in Hennepin County
Average fertility rate in Hennepin County is 52.0 births per 1,000 women. Women in the age bracket of 20 to 34 years have the highest fertility rate with 75.0 births per 1,000 women. Women in the age bracket of 20 to 34 years acount for 65.4% of all women with births.
| Age Bracket | Women with Births | Births / 1,000 Women |
| 15 to 19 years | 294 (1.8%) | 8.0 |
| 20 to 34 years | 10,527 (65.4%) | 75.0 |
| 35 to 50 years | 5,274 (32.8%) | 40.0 |
| Total | 16,095 (100.0%) | 52.0 |
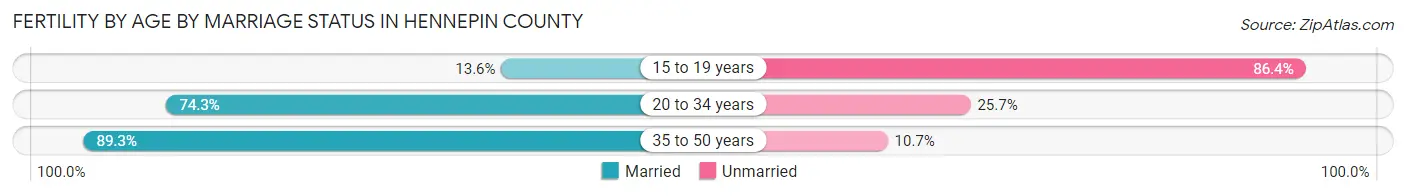
Fertility by Age by Marriage Status in Hennepin County
78.1% of women with births (16,095) in Hennepin County are married. The highest percentage of unmarried women with births falls into 15 to 19 years age bracket with 86.4% of them unmarried at the time of birth, while the lowest percentage of unmarried women with births belong to 35 to 50 years age bracket with 10.7% of them unmarried.
| Age Bracket | Married | Unmarried |
| 15 to 19 years | 40 (13.6%) | 254 (86.4%) |
| 20 to 34 years | 7,822 (74.3%) | 2,705 (25.7%) |
| 35 to 50 years | 4,710 (89.3%) | 564 (10.7%) |
| Total | 12,570 (78.1%) | 3,525 (21.9%) |
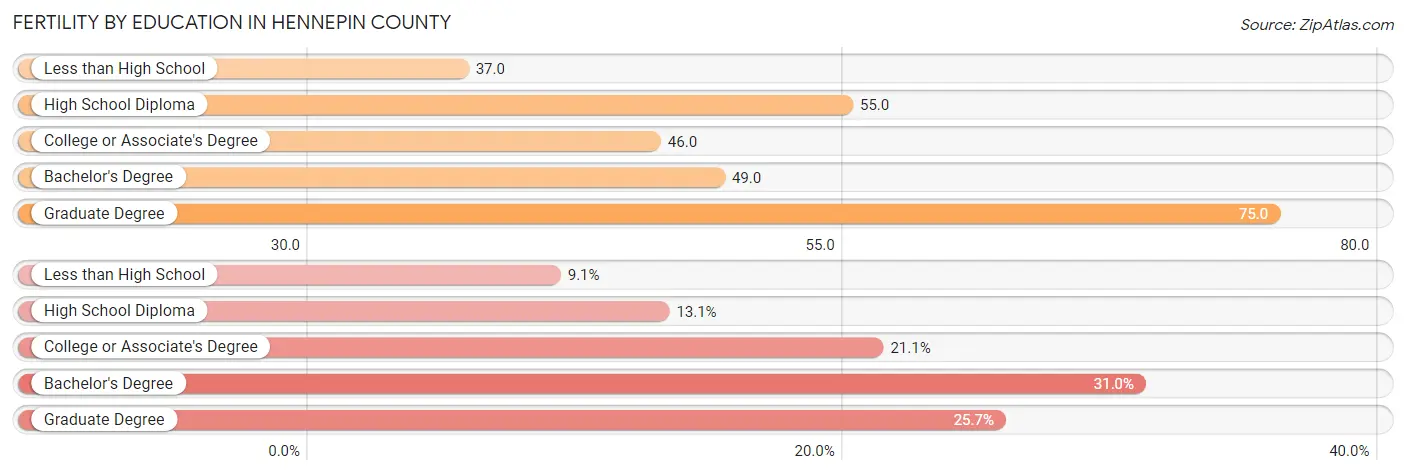
Fertility by Education in Hennepin County
Average fertility rate in Hennepin County is 52.0 births per 1,000 women. Women with the education attainment of graduate degree have the highest fertility rate of 75.0 births per 1,000 women, while women with the education attainment of less than high school have the lowest fertility at 37.0 births per 1,000 women. Women with the education attainment of bachelor's degree represent 31.0% of all women with births.
| Educational Attainment | Women with Births | Births / 1,000 Women |
| Less than High School | 1,456 (9.0%) | 37.0 |
| High School Diploma | 2,112 (13.1%) | 55.0 |
| College or Associate's Degree | 3,403 (21.1%) | 46.0 |
| Bachelor's Degree | 4,985 (31.0%) | 49.0 |
| Graduate Degree | 4,139 (25.7%) | 75.0 |
| Total | 16,095 (100.0%) | 52.0 |
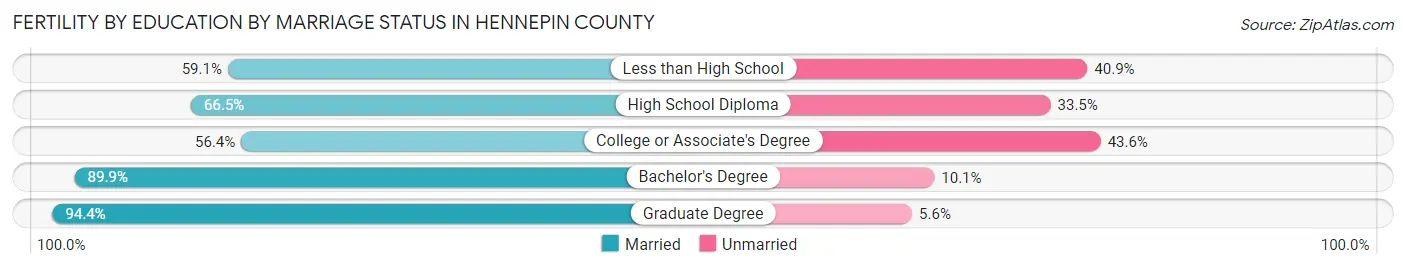
Fertility by Education by Marriage Status in Hennepin County
21.9% of women with births in Hennepin County are unmarried. Women with the educational attainment of graduate degree are most likely to be married with 94.4% of them married at childbirth, while women with the educational attainment of college or associate's degree are least likely to be married with 43.6% of them unmarried at childbirth.
| Educational Attainment | Married | Unmarried |
| Less than High School | 860 (59.1%) | 596 (40.9%) |
| High School Diploma | 1,404 (66.5%) | 708 (33.5%) |
| College or Associate's Degree | 1,919 (56.4%) | 1,484 (43.6%) |
| Bachelor's Degree | 4,482 (89.9%) | 503 (10.1%) |
| Graduate Degree | 3,907 (94.4%) | 232 (5.6%) |
| Total | 12,570 (78.1%) | 3,525 (21.9%) |
Income in Hennepin County
Income Overview in Hennepin County
Per Capita Income in Hennepin County is $55,199, while median incomes of families and households are $126,404 and $92,595 respectively.
| Characteristic | Number | Measure |
| Per Capita Income | 1,270,787 | $55,199 |
| Median Family Income | 299,267 | $126,404 |
| Mean Family Income | 299,267 | $166,715 |
| Median Household Income | 529,029 | $92,595 |
| Mean Household Income | 529,029 | $130,586 |
| Income Deficit | 299,267 | $10,656 |
| Wage / Income Gap (%) | 1,270,787 | 21.89% |
| Wage / Income Gap ($) | 1,270,787 | 78.11¢ per $1 |
| Gini / Inequality Index | 1,270,787 | 0.48 |
Earnings by Sex in Hennepin County
Average Earnings in Hennepin County are $52,420, $58,950 for men and $46,048 for women, a difference of 21.9%.
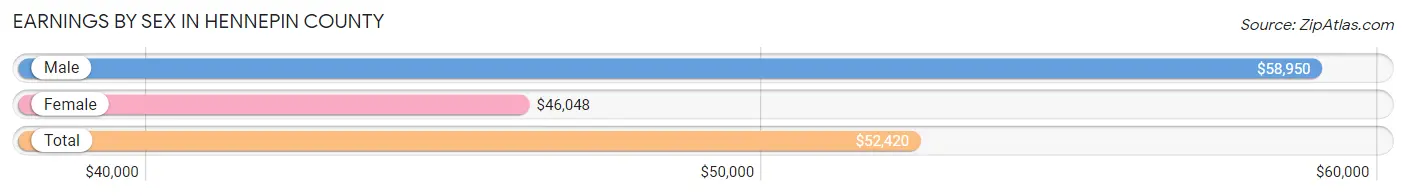
| Sex | Number | Average Earnings |
| Male | 401,779 (52.0%) | $58,950 |
| Female | 370,099 (47.9%) | $46,048 |
| Total | 771,878 (100.0%) | $52,420 |
Earnings by Sex by Income Bracket in Hennepin County
The most common earnings brackets in Hennepin County are $100,000+ for men (110,136 | 27.4%) and $100,000+ for women (59,012 | 15.9%).
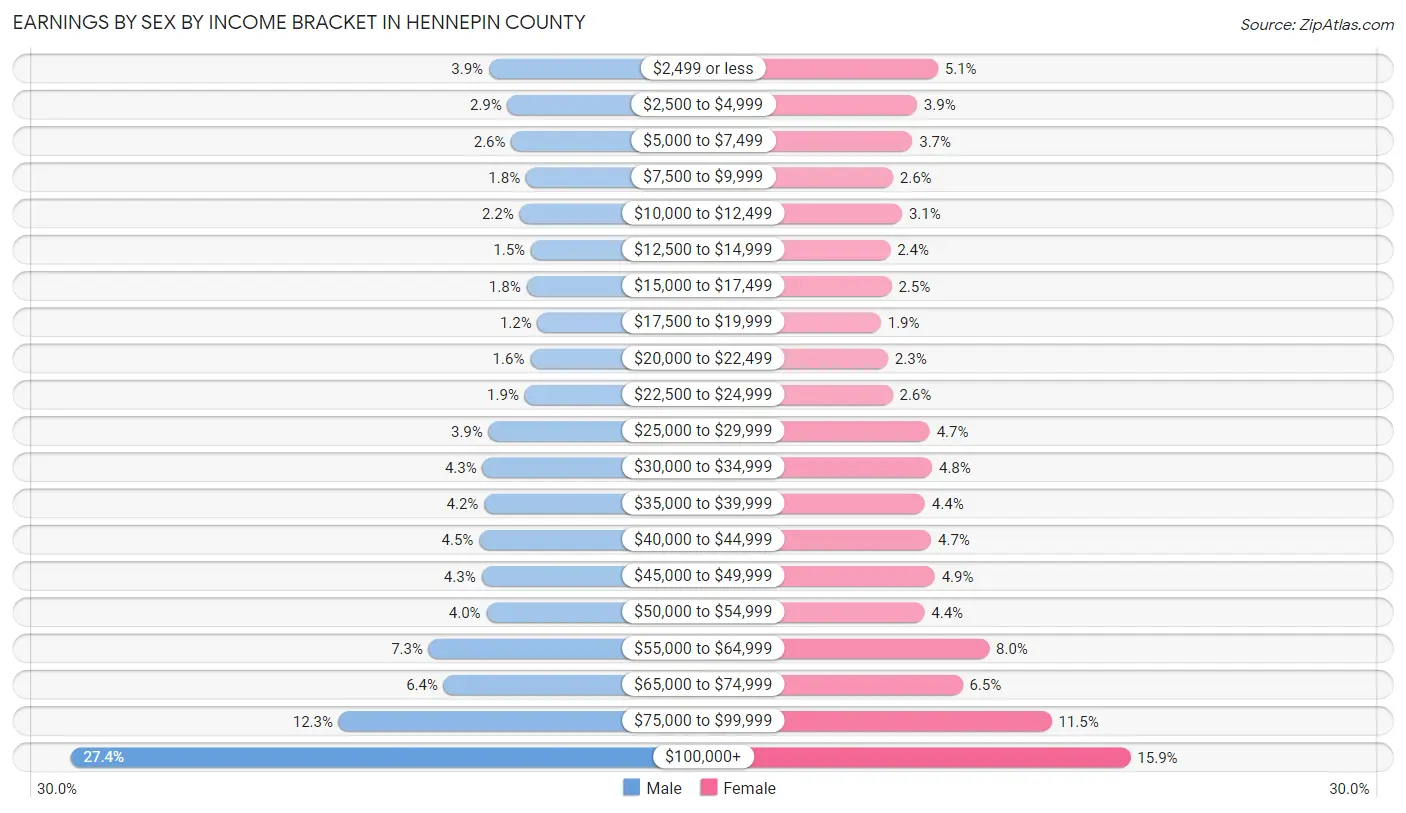
| Income | Male | Female |
| $2,499 or less | 15,682 (3.9%) | 18,962 (5.1%) |
| $2,500 to $4,999 | 11,464 (2.9%) | 14,582 (3.9%) |
| $5,000 to $7,499 | 10,600 (2.6%) | 13,605 (3.7%) |
| $7,500 to $9,999 | 7,328 (1.8%) | 9,593 (2.6%) |
| $10,000 to $12,499 | 8,760 (2.2%) | 11,456 (3.1%) |
| $12,500 to $14,999 | 6,206 (1.5%) | 9,030 (2.4%) |
| $15,000 to $17,499 | 7,174 (1.8%) | 9,284 (2.5%) |
| $17,500 to $19,999 | 4,690 (1.2%) | 7,070 (1.9%) |
| $20,000 to $22,499 | 6,342 (1.6%) | 8,531 (2.3%) |
| $22,500 to $24,999 | 7,585 (1.9%) | 9,530 (2.6%) |
| $25,000 to $29,999 | 15,749 (3.9%) | 17,262 (4.7%) |
| $30,000 to $34,999 | 17,099 (4.3%) | 17,730 (4.8%) |
| $35,000 to $39,999 | 16,735 (4.2%) | 16,238 (4.4%) |
| $40,000 to $44,999 | 17,872 (4.4%) | 17,538 (4.7%) |
| $45,000 to $49,999 | 17,364 (4.3%) | 18,292 (4.9%) |
| $50,000 to $54,999 | 16,251 (4.0%) | 16,131 (4.4%) |
| $55,000 to $64,999 | 29,268 (7.3%) | 29,623 (8.0%) |
| $65,000 to $74,999 | 25,894 (6.4%) | 24,042 (6.5%) |
| $75,000 to $99,999 | 49,580 (12.3%) | 42,588 (11.5%) |
| $100,000+ | 110,136 (27.4%) | 59,012 (15.9%) |
| Total | 401,779 (100.0%) | 370,099 (100.0%) |
Earnings by Sex by Educational Attainment in Hennepin County
Average earnings in Hennepin County are $68,589 for men and $53,356 for women, a difference of 22.2%. Men with an educational attainment of graduate degree enjoy the highest average annual earnings of $110,995, while those with less than high school education earn the least with $37,702. Women with an educational attainment of graduate degree earn the most with the average annual earnings of $79,744, while those with less than high school education have the smallest earnings of $25,671.
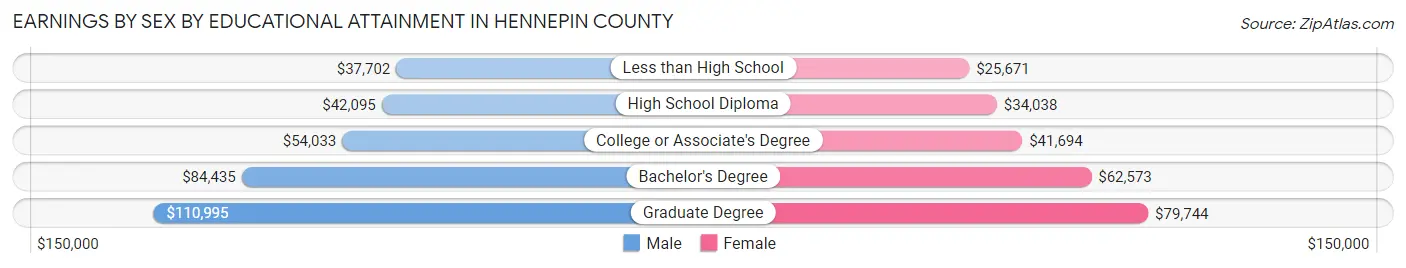
| Educational Attainment | Male Income | Female Income |
| Less than High School | $37,702 | $25,671 |
| High School Diploma | $42,095 | $34,038 |
| College or Associate's Degree | $54,033 | $41,694 |
| Bachelor's Degree | $84,435 | $62,573 |
| Graduate Degree | $110,995 | $79,744 |
| Total | $68,589 | $53,356 |
Family Income in Hennepin County
Family Income Brackets in Hennepin County
According to the Hennepin County family income data, there are 77,510 families falling into the $200,000+ income range, which is the most common income bracket and makes up 25.9% of all families. Conversely, the $10,000 to $14,999 income bracket is the least frequent group with only 3,292 families (1.1%) belonging to this category.
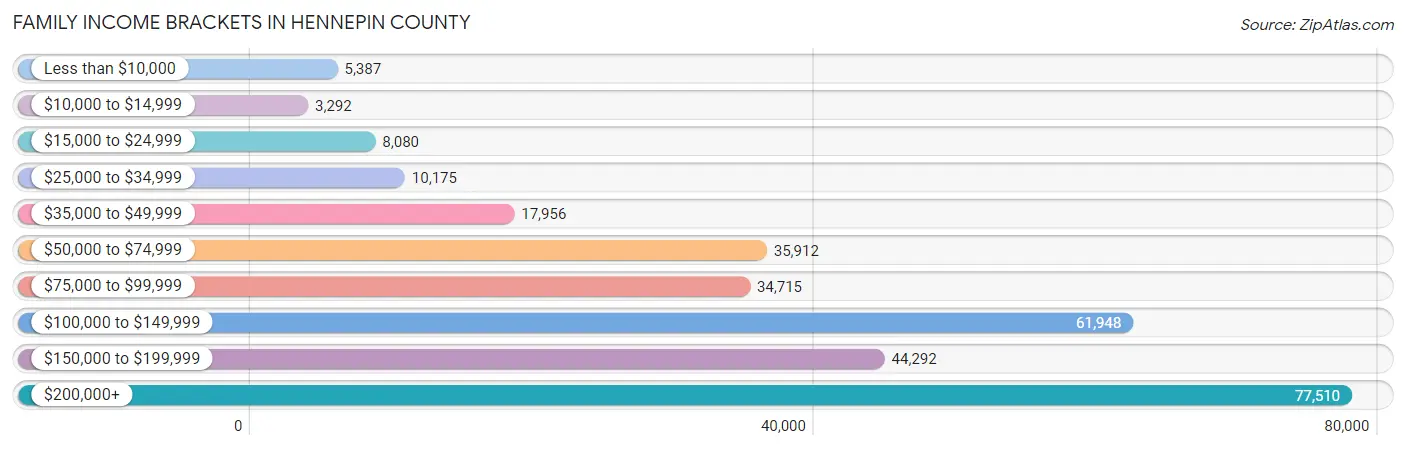
| Income Bracket | # Families | % Families |
| Less than $10,000 | 5,387 | 1.8% |
| $10,000 to $14,999 | 3,292 | 1.1% |
| $15,000 to $24,999 | 8,080 | 2.7% |
| $25,000 to $34,999 | 10,175 | 3.4% |
| $35,000 to $49,999 | 17,956 | 6.0% |
| $50,000 to $74,999 | 35,912 | 12.0% |
| $75,000 to $99,999 | 34,715 | 11.6% |
| $100,000 to $149,999 | 61,948 | 20.7% |
| $150,000 to $199,999 | 44,292 | 14.8% |
| $200,000+ | 77,510 | 25.9% |
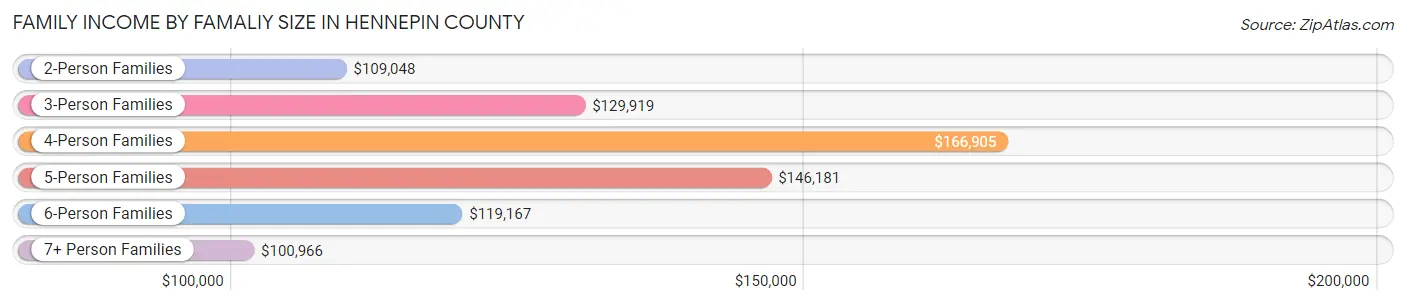
Family Income by Famaliy Size in Hennepin County
4-person families (57,730 | 19.3%) account for the highest median family income in Hennepin County with $166,905 per family, while 2-person families (143,032 | 47.8%) have the highest median income of $54,524 per family member.
| Income Bracket | # Families | Median Income |
| 2-Person Families | 143,032 (47.8%) | $109,048 |
| 3-Person Families | 63,161 (21.1%) | $129,919 |
| 4-Person Families | 57,730 (19.3%) | $166,905 |
| 5-Person Families | 22,618 (7.6%) | $146,181 |
| 6-Person Families | 7,370 (2.5%) | $119,167 |
| 7+ Person Families | 5,356 (1.8%) | $100,966 |
| Total | 299,267 (100.0%) | $126,404 |
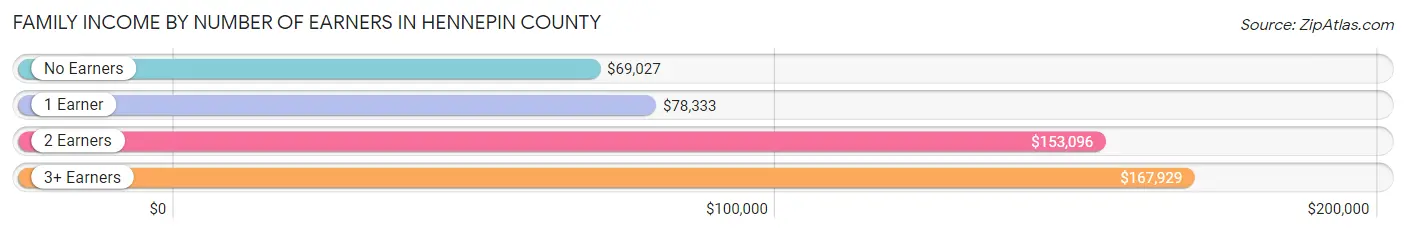
Family Income by Number of Earners in Hennepin County
The median family income in Hennepin County is $126,404, with families comprising 3+ earners (37,292) having the highest median family income of $167,929, while families with no earners (31,868) have the lowest median family income of $69,027, accounting for 12.5% and 10.6% of families, respectively.
| Number of Earners | # Families | Median Income |
| No Earners | 31,868 (10.6%) | $69,027 |
| 1 Earner | 78,317 (26.2%) | $78,333 |
| 2 Earners | 151,790 (50.7%) | $153,096 |
| 3+ Earners | 37,292 (12.5%) | $167,929 |
| Total | 299,267 (100.0%) | $126,404 |
Household Income in Hennepin County
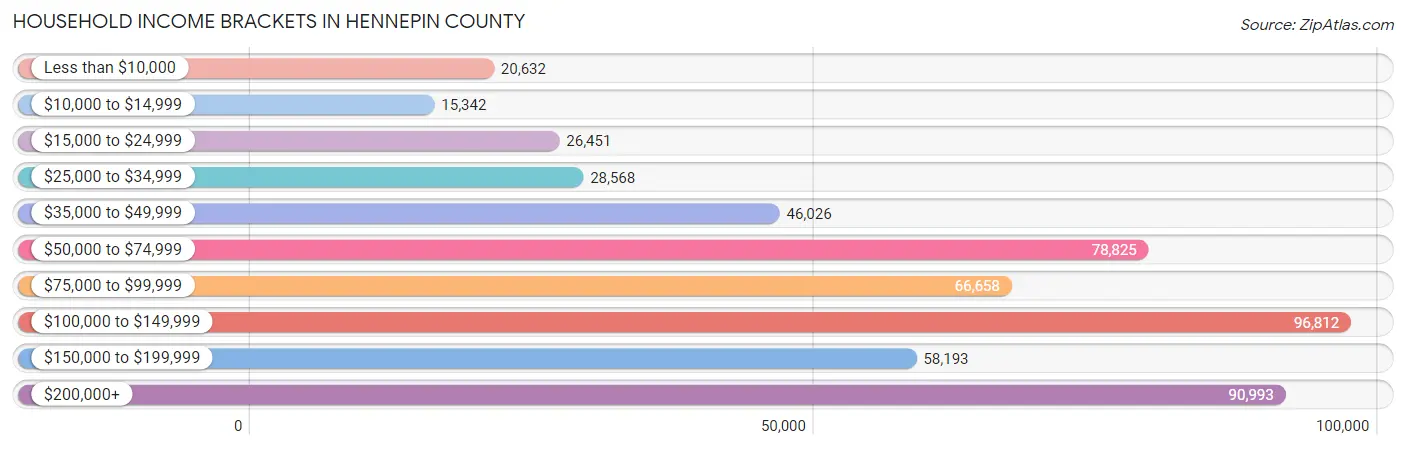
Household Income Brackets in Hennepin County
With 96,812 households falling in the category, the $100,000 to $149,999 income range is the most frequent in Hennepin County, accounting for 18.3% of all households. In contrast, only 15,342 households (2.9%) fall into the $10,000 to $14,999 income bracket, making it the least populous group.
| Income Bracket | # Households | % Households |
| Less than $10,000 | 20,632 | 3.9% |
| $10,000 to $14,999 | 15,342 | 2.9% |
| $15,000 to $24,999 | 26,451 | 5.0% |
| $25,000 to $34,999 | 28,568 | 5.4% |
| $35,000 to $49,999 | 46,026 | 8.7% |
| $50,000 to $74,999 | 78,825 | 14.9% |
| $75,000 to $99,999 | 66,658 | 12.6% |
| $100,000 to $149,999 | 96,812 | 18.3% |
| $150,000 to $199,999 | 58,193 | 11.0% |
| $200,000+ | 90,993 | 17.2% |
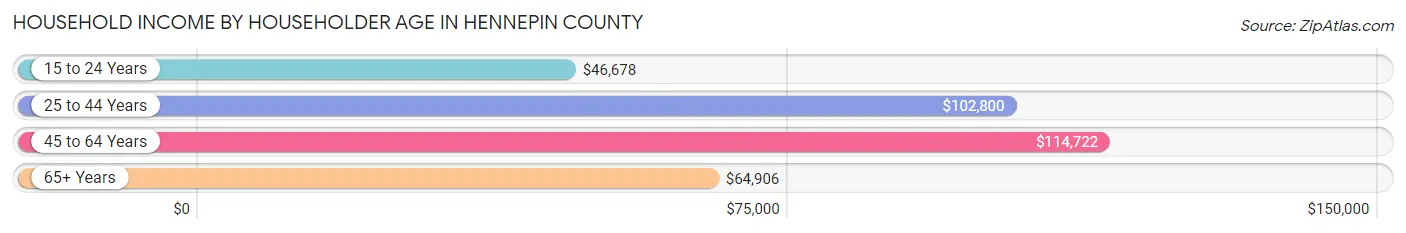
Household Income by Householder Age in Hennepin County
The median household income in Hennepin County is $92,595, with the highest median household income of $114,722 found in the 45 to 64 years age bracket for the primary householder. A total of 179,535 households (33.9%) fall into this category. Meanwhile, the 15 to 24 years age bracket for the primary householder has the lowest median household income of $46,678, with 24,115 households (4.6%) in this group.
| Income Bracket | # Households | Median Income |
| 15 to 24 Years | 24,115 (4.6%) | $46,678 |
| 25 to 44 Years | 204,747 (38.7%) | $102,800 |
| 45 to 64 Years | 179,535 (33.9%) | $114,722 |
| 65+ Years | 120,632 (22.8%) | $64,906 |
| Total | 529,029 (100.0%) | $92,595 |
Poverty in Hennepin County
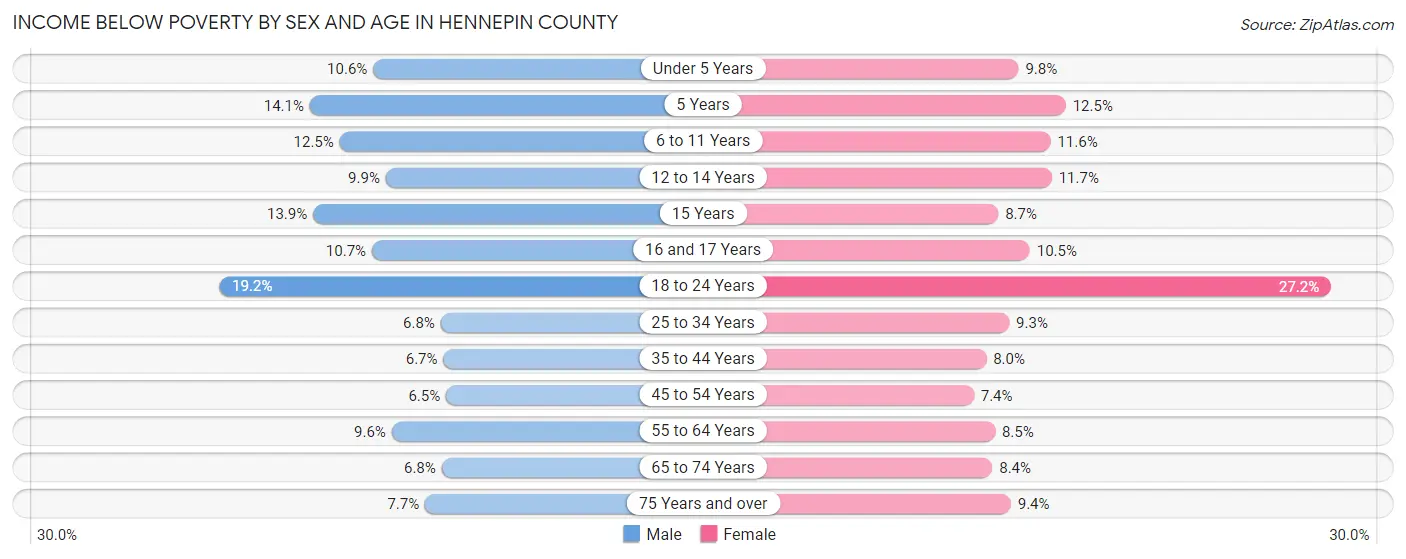
Income Below Poverty by Sex and Age in Hennepin County
With 9.2% poverty level for males and 10.5% for females among the residents of Hennepin County, 18 to 24 year old males and 18 to 24 year old females are the most vulnerable to poverty, with 9,641 males (19.2%) and 13,670 females (27.2%) in their respective age groups living below the poverty level.
| Age Bracket | Male | Female |
| Under 5 Years | 4,047 (10.6%) | 3,652 (9.8%) |
| 5 Years | 1,051 (14.1%) | 861 (12.5%) |
| 6 to 11 Years | 5,996 (12.5%) | 5,095 (11.6%) |
| 12 to 14 Years | 2,071 (9.9%) | 2,726 (11.7%) |
| 15 Years | 1,088 (13.9%) | 644 (8.7%) |
| 16 and 17 Years | 1,590 (10.7%) | 1,537 (10.5%) |
| 18 to 24 Years | 9,641 (19.2%) | 13,670 (27.2%) |
| 25 to 34 Years | 7,267 (6.8%) | 9,392 (9.3%) |
| 35 to 44 Years | 6,180 (6.7%) | 7,113 (8.0%) |
| 45 to 54 Years | 4,998 (6.5%) | 5,415 (7.3%) |
| 55 to 64 Years | 7,476 (9.6%) | 6,766 (8.5%) |
| 65 to 74 Years | 3,538 (6.8%) | 4,884 (8.4%) |
| 75 Years and over | 2,198 (7.7%) | 4,008 (9.4%) |
| Total | 57,141 (9.2%) | 65,763 (10.5%) |
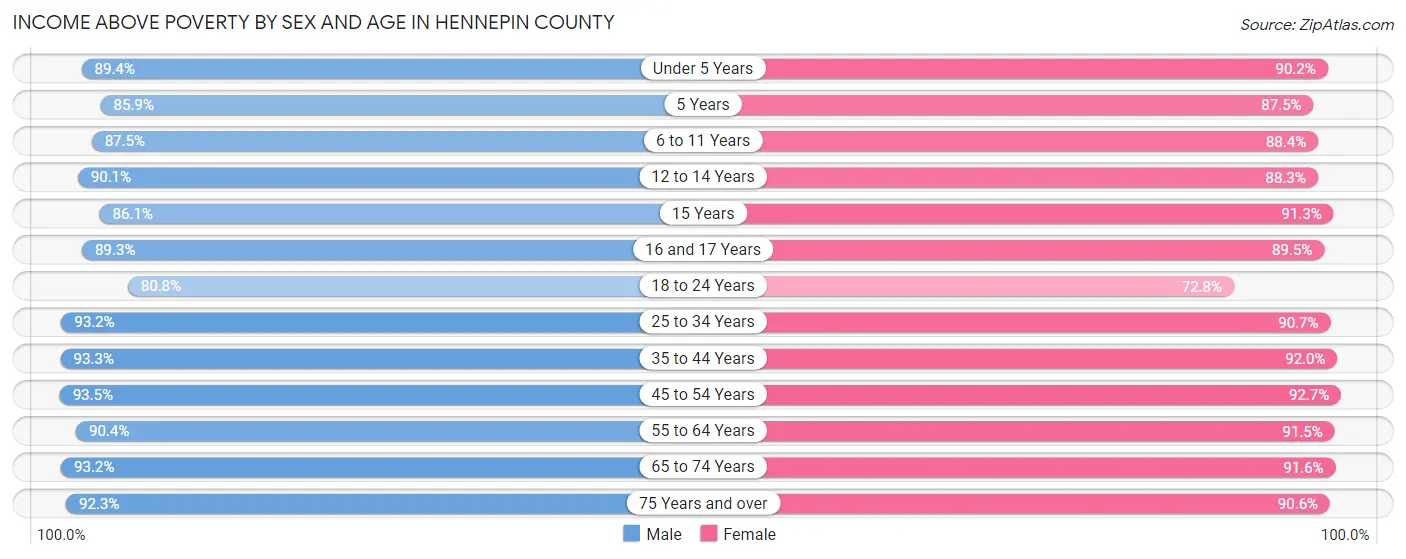
Income Above Poverty by Sex and Age in Hennepin County
According to the poverty statistics in Hennepin County, males aged 45 to 54 years and females aged 45 to 54 years are the age groups that are most secure financially, with 93.5% of males and 92.6% of females in these age groups living above the poverty line.
| Age Bracket | Male | Female |
| Under 5 Years | 34,174 (89.4%) | 33,470 (90.2%) |
| 5 Years | 6,394 (85.9%) | 6,043 (87.5%) |
| 6 to 11 Years | 42,138 (87.5%) | 38,748 (88.4%) |
| 12 to 14 Years | 18,873 (90.1%) | 20,600 (88.3%) |
| 15 Years | 6,716 (86.1%) | 6,749 (91.3%) |
| 16 and 17 Years | 13,331 (89.3%) | 13,146 (89.5%) |
| 18 to 24 Years | 40,644 (80.8%) | 36,517 (72.8%) |
| 25 to 34 Years | 99,088 (93.2%) | 91,404 (90.7%) |
| 35 to 44 Years | 86,293 (93.3%) | 81,322 (92.0%) |
| 45 to 54 Years | 71,556 (93.5%) | 68,259 (92.6%) |
| 55 to 64 Years | 70,728 (90.4%) | 72,592 (91.5%) |
| 65 to 74 Years | 48,641 (93.2%) | 53,418 (91.6%) |
| 75 Years and over | 26,361 (92.3%) | 38,579 (90.6%) |
| Total | 564,937 (90.8%) | 560,847 (89.5%) |
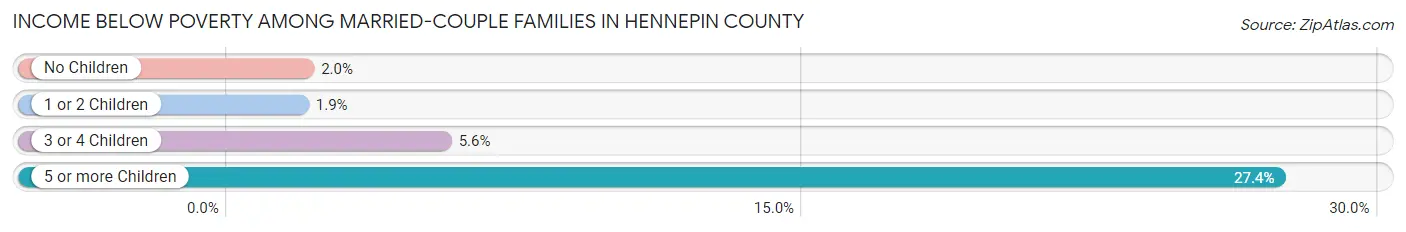
Income Below Poverty Among Married-Couple Families in Hennepin County
The poverty statistics for married-couple families in Hennepin County show that 2.4% or 5,648 of the total 231,614 families live below the poverty line. Families with 5 or more children have the highest poverty rate of 27.4%, comprising of 542 families. On the other hand, families with 1 or 2 children have the lowest poverty rate of 1.8%, which includes 1,473 families.
| Children | Above Poverty | Below Poverty |
| No Children | 129,243 (98.0%) | 2,618 (2.0%) |
| 1 or 2 Children | 78,110 (98.2%) | 1,473 (1.8%) |
| 3 or 4 Children | 17,175 (94.4%) | 1,015 (5.6%) |
| 5 or more Children | 1,438 (72.6%) | 542 (27.4%) |
| Total | 225,966 (97.6%) | 5,648 (2.4%) |
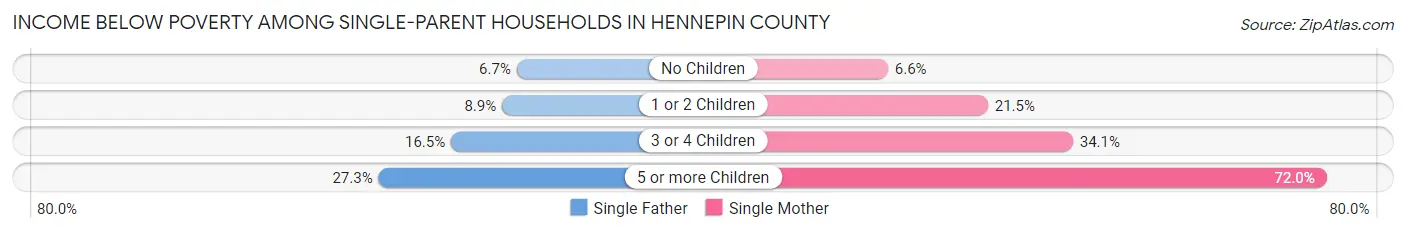
Income Below Poverty Among Single-Parent Households in Hennepin County
According to the poverty data in Hennepin County, 8.8% or 1,785 single-father households and 18.7% or 8,859 single-mother households are living below the poverty line. Among single-father households, those with 5 or more children have the highest poverty rate, with 66 households (27.3%) experiencing poverty. Likewise, among single-mother households, those with 5 or more children have the highest poverty rate, with 757 households (72.0%) falling below the poverty line.
| Children | Single Father | Single Mother |
| No Children | 587 (6.7%) | 1,097 (6.6%) |
| 1 or 2 Children | 856 (8.9%) | 5,222 (21.5%) |
| 3 or 4 Children | 276 (16.5%) | 1,783 (34.1%) |
| 5 or more Children | 66 (27.3%) | 757 (72.0%) |
| Total | 1,785 (8.8%) | 8,859 (18.7%) |
Income Below Poverty Among Married-Couple vs Single-Parent Households in Hennepin County
The poverty data for Hennepin County shows that 5,648 of the married-couple family households (2.4%) and 10,644 of the single-parent households (15.7%) are living below the poverty level. Within the married-couple family households, those with 5 or more children have the highest poverty rate, with 542 households (27.4%) falling below the poverty line. Among the single-parent households, those with 5 or more children have the highest poverty rate, with 823 household (63.6%) living below poverty.
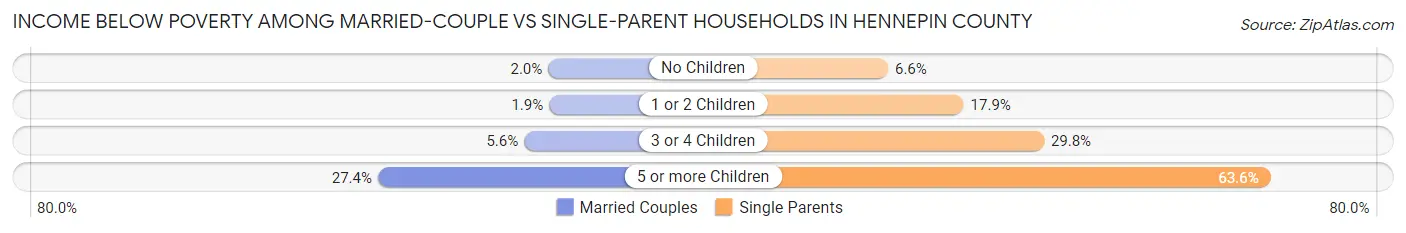
| Children | Married-Couple Families | Single-Parent Households |
| No Children | 2,618 (2.0%) | 1,684 (6.6%) |
| 1 or 2 Children | 1,473 (1.8%) | 6,078 (17.9%) |
| 3 or 4 Children | 1,015 (5.6%) | 2,059 (29.8%) |
| 5 or more Children | 542 (27.4%) | 823 (63.6%) |
| Total | 5,648 (2.4%) | 10,644 (15.7%) |
Employment Characteristics in Hennepin County
Employment by Class of Employer in Hennepin County
Among the 690,929 employed individuals in Hennepin County, private company employees (474,454 | 68.7%), not-for-profit organizations (80,392 | 11.6%), and local government employees (40,627 | 5.9%) make up the most common classes of employment.
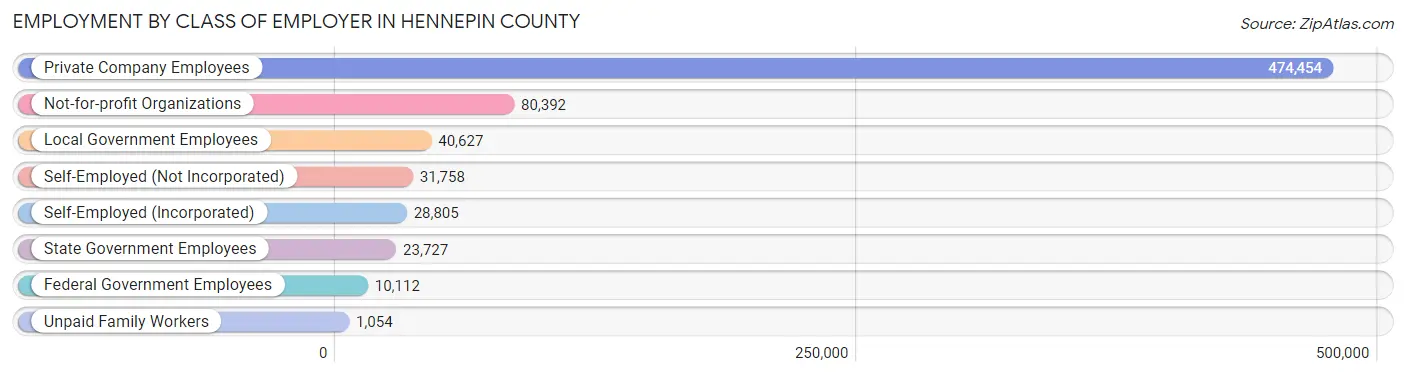
| Employer Class | # Employees | % Employees |
| Private Company Employees | 474,454 | 68.7% |
| Self-Employed (Incorporated) | 28,805 | 4.2% |
| Self-Employed (Not Incorporated) | 31,758 | 4.6% |
| Not-for-profit Organizations | 80,392 | 11.6% |
| Local Government Employees | 40,627 | 5.9% |
| State Government Employees | 23,727 | 3.4% |
| Federal Government Employees | 10,112 | 1.5% |
| Unpaid Family Workers | 1,054 | 0.2% |
| Total | 690,929 | 100.0% |
Employment Status by Age in Hennepin County
According to the labor force statistics for Hennepin County, out of the total population over 16 years of age (1,025,434), 71.7% or 735,236 individuals are in the labor force, with 4.3% or 31,615 of them unemployed. The age group with the highest labor force participation rate is 30 to 34 years, with 91.2% or 94,996 individuals in the labor force. Within the labor force, the 16 to 19 years age range has the highest percentage of unemployed individuals, with 13.7% or 3,991 of them being unemployed.
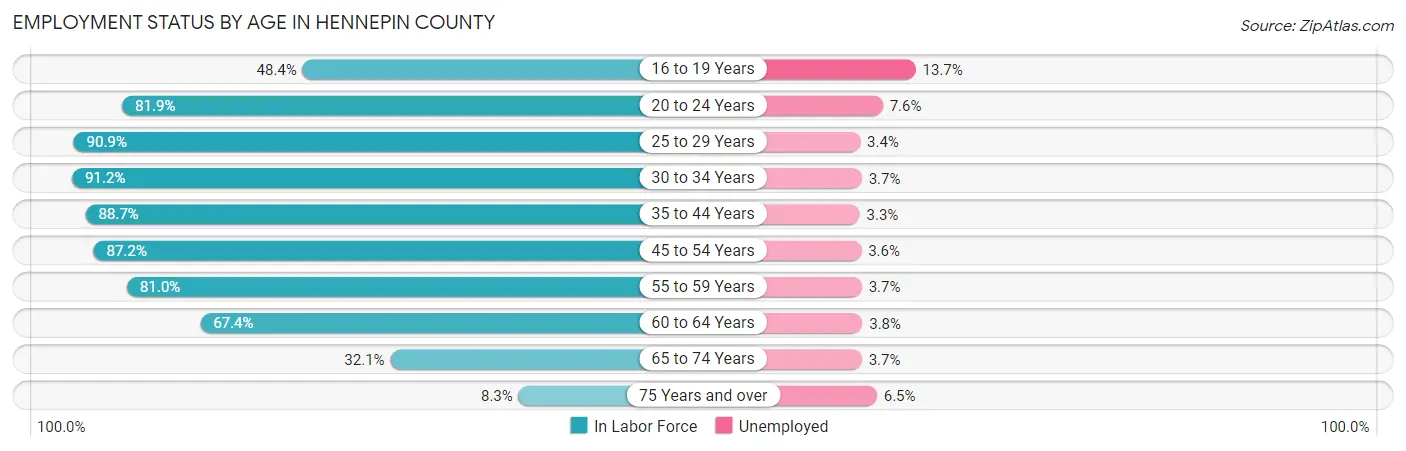
| Age Bracket | In Labor Force | Unemployed |
| 16 to 19 Years | 29,130 (48.4%) | 3,991 (13.7%) |
| 20 to 24 Years | 64,990 (81.9%) | 4,939 (7.6%) |
| 25 to 29 Years | 94,154 (90.9%) | 3,201 (3.4%) |
| 30 to 34 Years | 94,996 (91.2%) | 3,515 (3.7%) |
| 35 to 44 Years | 160,784 (88.7%) | 5,306 (3.3%) |
| 45 to 54 Years | 131,448 (87.2%) | 4,732 (3.6%) |
| 55 to 59 Years | 65,363 (81.0%) | 2,418 (3.7%) |
| 60 to 64 Years | 52,524 (67.4%) | 1,996 (3.8%) |
| 65 to 74 Years | 36,015 (32.1%) | 1,333 (3.7%) |
| 75 Years and over | 6,252 (8.3%) | 406 (6.5%) |
| Total | 735,236 (71.7%) | 31,615 (4.3%) |
Employment Status by Educational Attainment in Hennepin County
According to labor force statistics for Hennepin County, 85.8% of individuals (599,207) out of the total population between 25 and 64 years of age (698,376) are in the labor force, with 3.5% or 20,972 of them being unemployed. The group with the highest labor force participation rate are those with the educational attainment of bachelor's degree or higher, with 90.9% or 350,710 individuals in the labor force. Within the labor force, individuals with less than high school education have the highest percentage of unemployment, with 7.9% or 2,210 of them being unemployed.
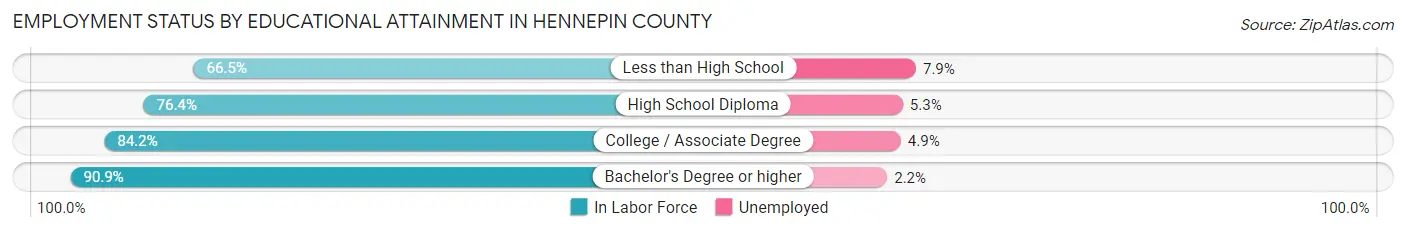
| Educational Attainment | In Labor Force | Unemployed |
| Less than High School | 27,977 (66.5%) | 3,324 (7.9%) |
| High School Diploma | 73,006 (76.4%) | 5,065 (5.3%) |
| College / Associate Degree | 147,289 (84.2%) | 8,571 (4.9%) |
| Bachelor's Degree or higher | 350,710 (90.9%) | 8,488 (2.2%) |
| Total | 599,207 (85.8%) | 24,443 (3.5%) |
Employment Occupations by Sex in Hennepin County
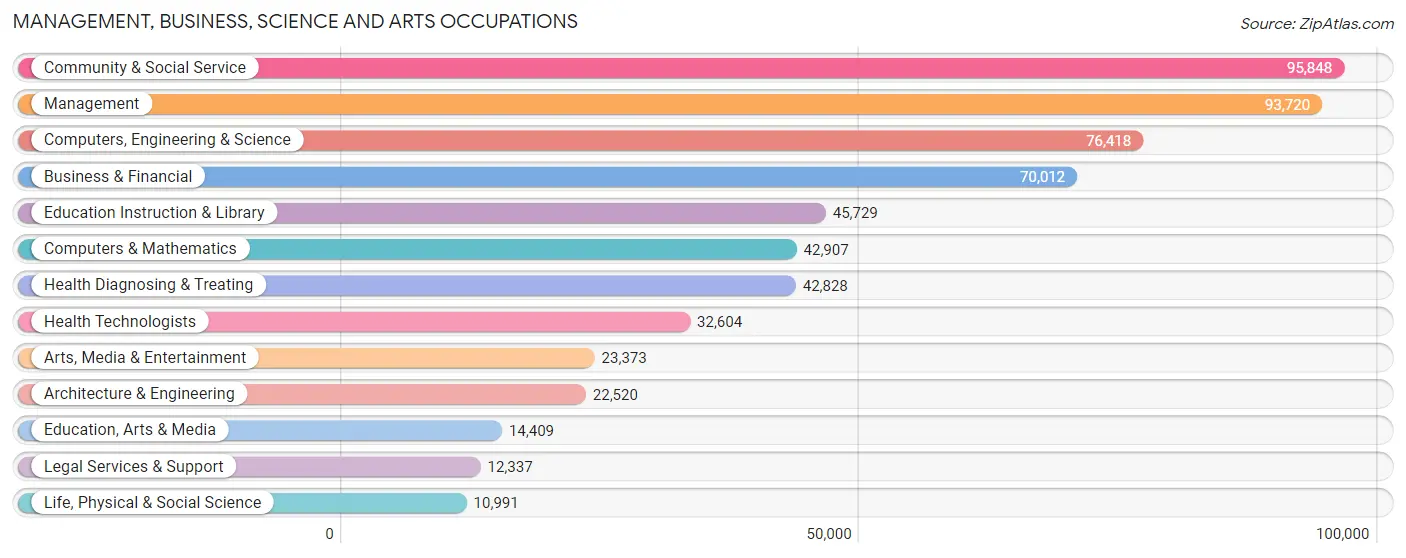
Management, Business, Science and Arts Occupations
The most common Management, Business, Science and Arts occupations in Hennepin County are Community & Social Service (95,848 | 13.6%), Management (93,720 | 13.3%), Computers, Engineering & Science (76,418 | 10.9%), Business & Financial (70,012 | 10.0%), and Education Instruction & Library (45,729 | 6.5%).
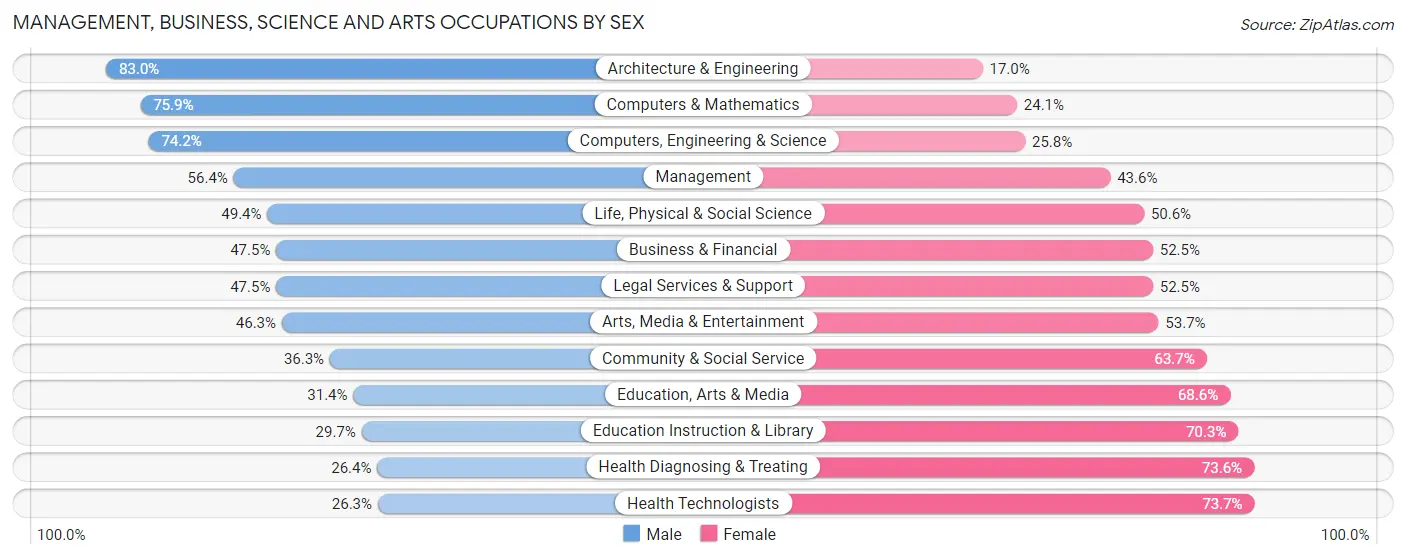
Management, Business, Science and Arts Occupations by Sex
Within the Management, Business, Science and Arts occupations in Hennepin County, the most male-oriented occupations are Architecture & Engineering (83.0%), Computers & Mathematics (75.9%), and Computers, Engineering & Science (74.2%), while the most female-oriented occupations are Health Technologists (73.7%), Health Diagnosing & Treating (73.6%), and Education Instruction & Library (70.3%).
| Occupation | Male | Female |
| Management | 52,851 (56.4%) | 40,869 (43.6%) |
| Business & Financial | 33,260 (47.5%) | 36,752 (52.5%) |
| Computers, Engineering & Science | 56,675 (74.2%) | 19,743 (25.8%) |
| Computers & Mathematics | 32,554 (75.9%) | 10,353 (24.1%) |
| Architecture & Engineering | 18,696 (83.0%) | 3,824 (17.0%) |
| Life, Physical & Social Science | 5,425 (49.4%) | 5,566 (50.6%) |
| Community & Social Service | 34,796 (36.3%) | 61,052 (63.7%) |
| Education, Arts & Media | 4,527 (31.4%) | 9,882 (68.6%) |
| Legal Services & Support | 5,861 (47.5%) | 6,476 (52.5%) |
| Education Instruction & Library | 13,578 (29.7%) | 32,151 (70.3%) |
| Arts, Media & Entertainment | 10,830 (46.3%) | 12,543 (53.7%) |
| Health Diagnosing & Treating | 11,315 (26.4%) | 31,513 (73.6%) |
| Health Technologists | 8,577 (26.3%) | 24,027 (73.7%) |
| Total (Category) | 188,897 (49.9%) | 189,929 (50.1%) |
| Total (Overall) | 367,168 (52.2%) | 335,849 (47.8%) |
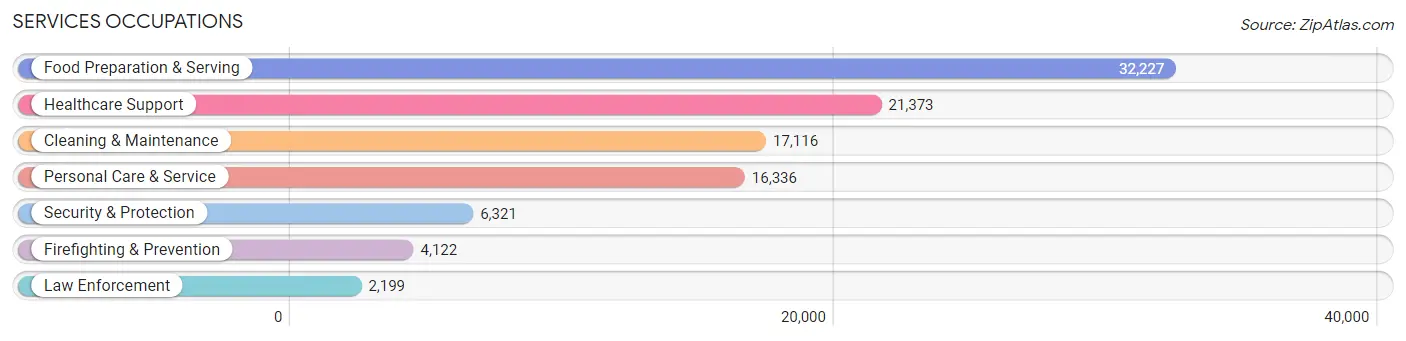
Services Occupations
The most common Services occupations in Hennepin County are Food Preparation & Serving (32,227 | 4.6%), Healthcare Support (21,373 | 3.0%), Cleaning & Maintenance (17,116 | 2.4%), Personal Care & Service (16,336 | 2.3%), and Security & Protection (6,321 | 0.9%).
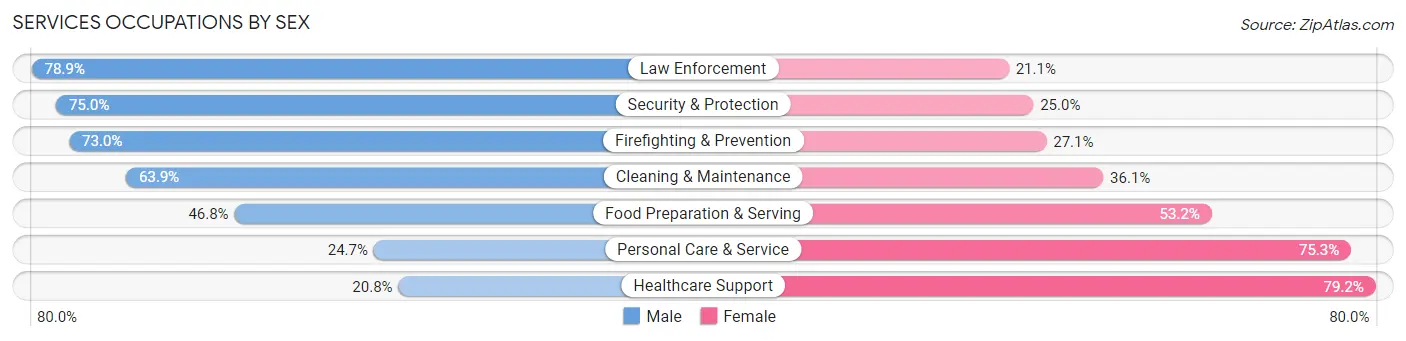
Services Occupations by Sex
Within the Services occupations in Hennepin County, the most male-oriented occupations are Law Enforcement (78.9%), Security & Protection (75.0%), and Firefighting & Prevention (73.0%), while the most female-oriented occupations are Healthcare Support (79.2%), Personal Care & Service (75.3%), and Food Preparation & Serving (53.2%).
| Occupation | Male | Female |
| Healthcare Support | 4,442 (20.8%) | 16,931 (79.2%) |
| Security & Protection | 4,742 (75.0%) | 1,579 (25.0%) |
| Firefighting & Prevention | 3,007 (73.0%) | 1,115 (27.1%) |
| Law Enforcement | 1,735 (78.9%) | 464 (21.1%) |
| Food Preparation & Serving | 15,069 (46.8%) | 17,158 (53.2%) |
| Cleaning & Maintenance | 10,944 (63.9%) | 6,172 (36.1%) |
| Personal Care & Service | 4,032 (24.7%) | 12,304 (75.3%) |
| Total (Category) | 39,229 (42.0%) | 54,144 (58.0%) |
| Total (Overall) | 367,168 (52.2%) | 335,849 (47.8%) |
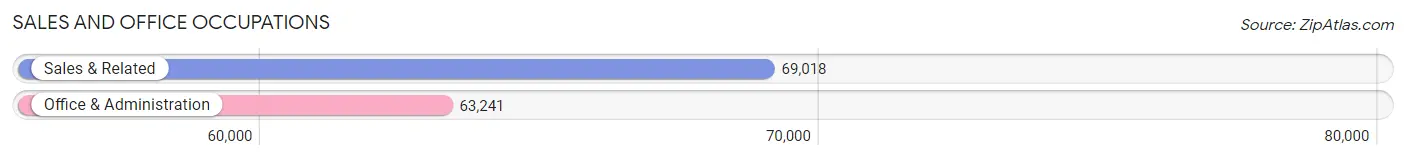
Sales and Office Occupations
The most common Sales and Office occupations in Hennepin County are Sales & Related (69,018 | 9.8%), and Office & Administration (63,241 | 9.0%).
Sales and Office Occupations by Sex
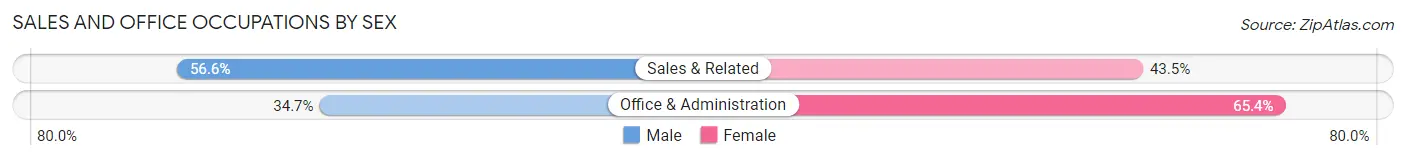
| Occupation | Male | Female |
| Sales & Related | 39,029 (56.6%) | 29,989 (43.4%) |
| Office & Administration | 21,911 (34.6%) | 41,330 (65.3%) |
| Total (Category) | 60,940 (46.1%) | 71,319 (53.9%) |
| Total (Overall) | 367,168 (52.2%) | 335,849 (47.8%) |
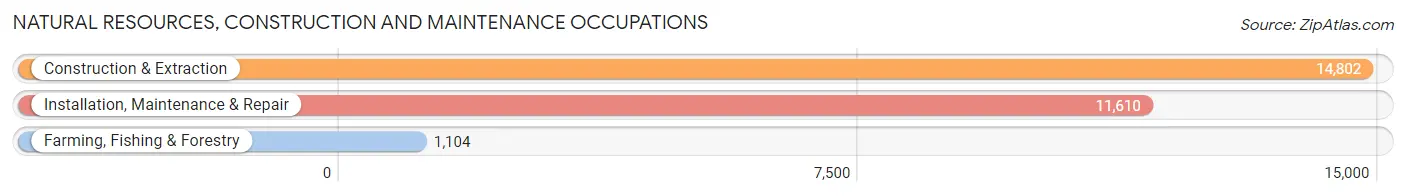
Natural Resources, Construction and Maintenance Occupations
The most common Natural Resources, Construction and Maintenance occupations in Hennepin County are Construction & Extraction (14,802 | 2.1%), Installation, Maintenance & Repair (11,610 | 1.7%), and Farming, Fishing & Forestry (1,104 | 0.2%).
Natural Resources, Construction and Maintenance Occupations by Sex
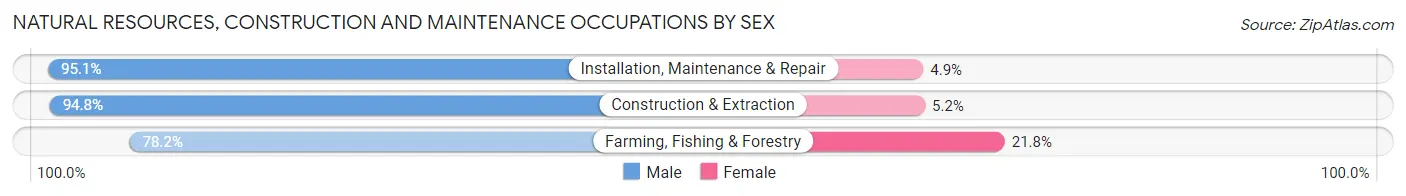
| Occupation | Male | Female |
| Farming, Fishing & Forestry | 863 (78.2%) | 241 (21.8%) |
| Construction & Extraction | 14,026 (94.8%) | 776 (5.2%) |
| Installation, Maintenance & Repair | 11,044 (95.1%) | 566 (4.9%) |
| Total (Category) | 25,933 (94.3%) | 1,583 (5.8%) |
| Total (Overall) | 367,168 (52.2%) | 335,849 (47.8%) |
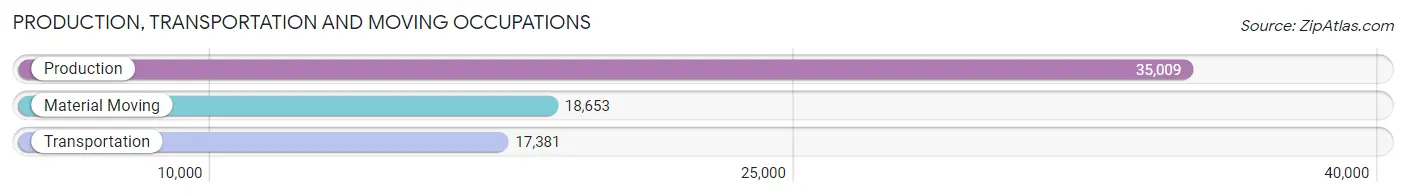
Production, Transportation and Moving Occupations
The most common Production, Transportation and Moving occupations in Hennepin County are Production (35,009 | 5.0%), Material Moving (18,653 | 2.6%), and Transportation (17,381 | 2.5%).
Production, Transportation and Moving Occupations by Sex
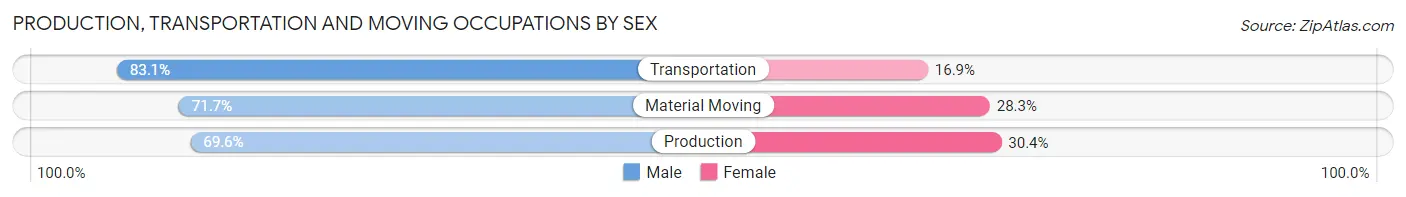
| Occupation | Male | Female |
| Production | 24,360 (69.6%) | 10,649 (30.4%) |
| Transportation | 14,436 (83.1%) | 2,945 (16.9%) |
| Material Moving | 13,373 (71.7%) | 5,280 (28.3%) |
| Total (Category) | 52,169 (73.4%) | 18,874 (26.6%) |
| Total (Overall) | 367,168 (52.2%) | 335,849 (47.8%) |
Employment Industries by Sex in Hennepin County
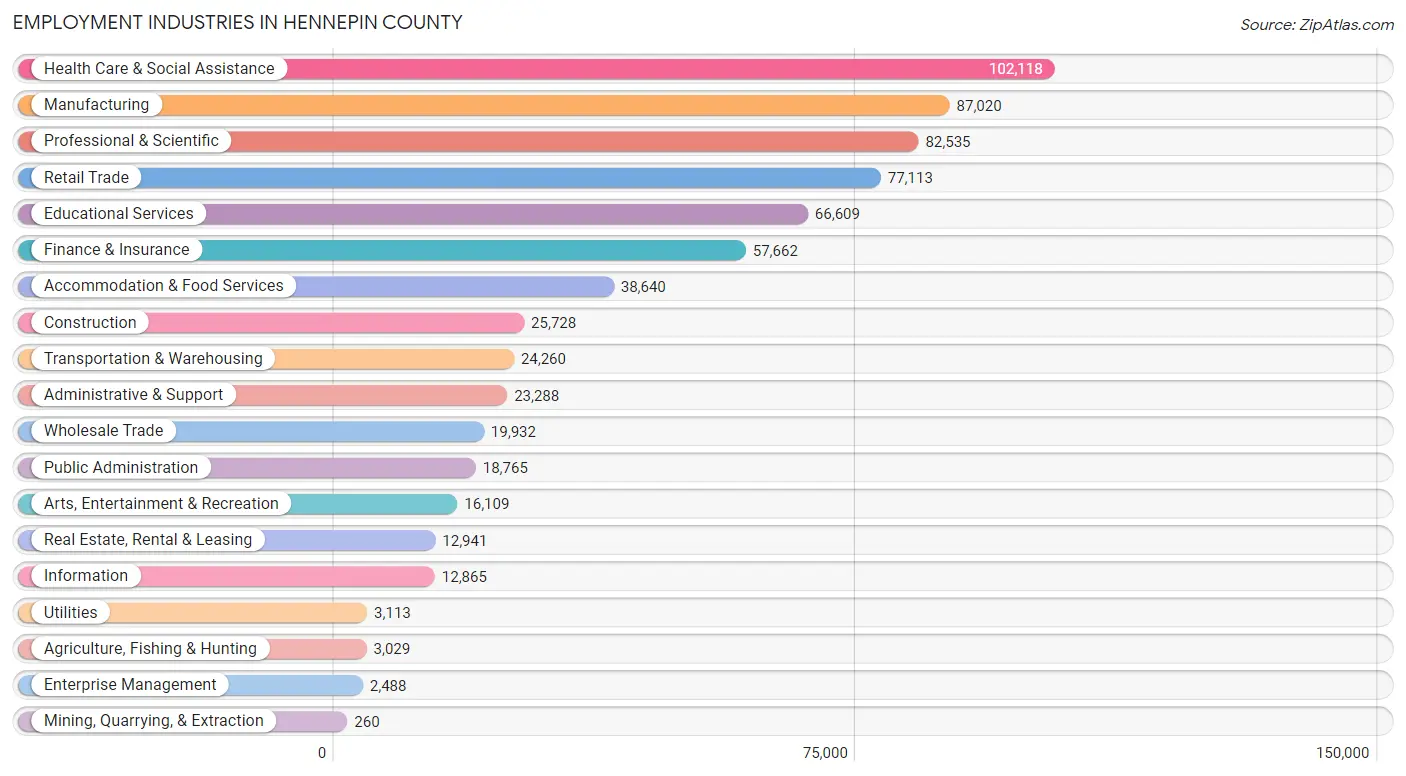
Employment Industries in Hennepin County
The major employment industries in Hennepin County include Health Care & Social Assistance (102,118 | 14.5%), Manufacturing (87,020 | 12.4%), Professional & Scientific (82,535 | 11.7%), Retail Trade (77,113 | 11.0%), and Educational Services (66,609 | 9.5%).
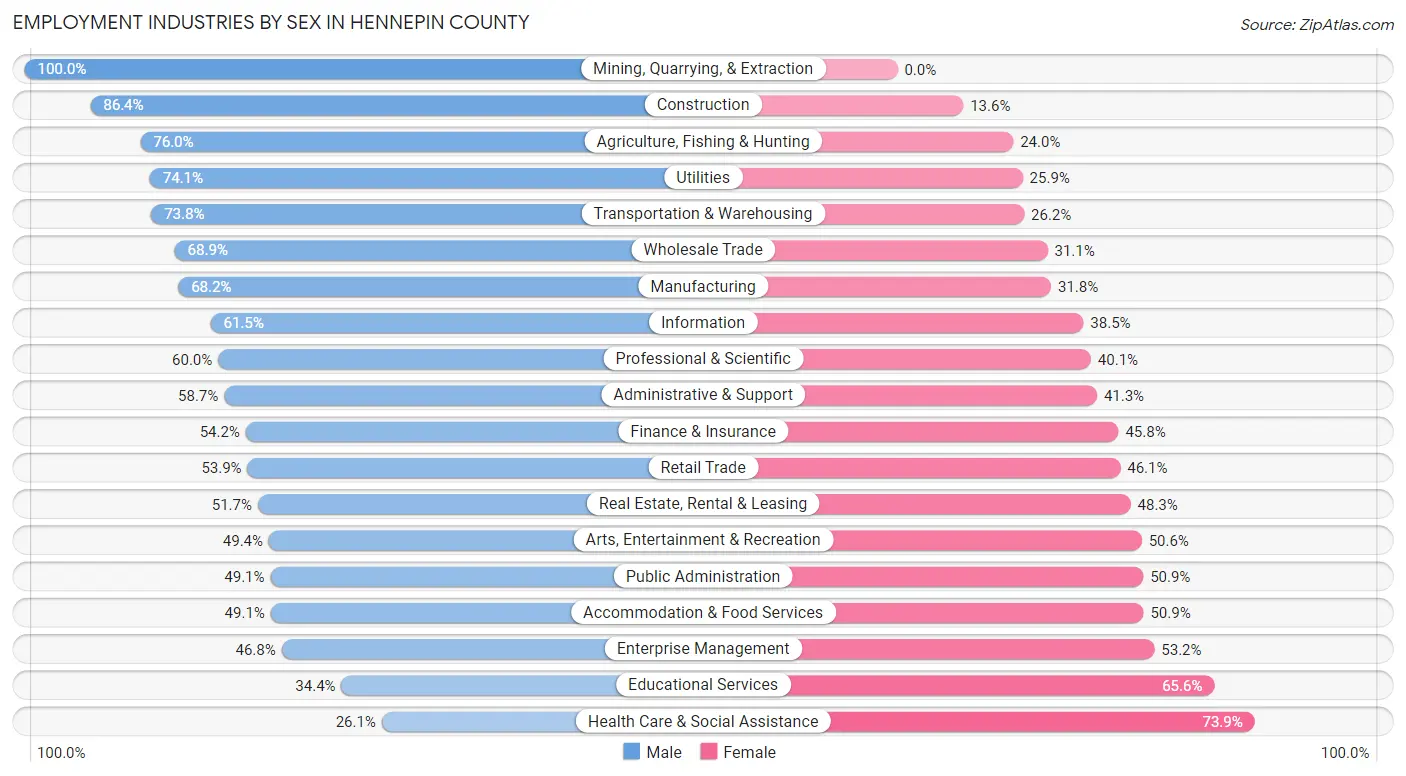
Employment Industries by Sex in Hennepin County
The Hennepin County industries that see more men than women are Mining, Quarrying, & Extraction (100.0%), Construction (86.4%), and Agriculture, Fishing & Hunting (76.0%), whereas the industries that tend to have a higher number of women are Health Care & Social Assistance (73.9%), Educational Services (65.6%), and Enterprise Management (53.2%).
| Industry | Male | Female |
| Agriculture, Fishing & Hunting | 2,303 (76.0%) | 726 (24.0%) |
| Mining, Quarrying, & Extraction | 260 (100.0%) | 0 (0.0%) |
| Construction | 22,225 (86.4%) | 3,503 (13.6%) |
| Manufacturing | 59,346 (68.2%) | 27,674 (31.8%) |
| Wholesale Trade | 13,740 (68.9%) | 6,192 (31.1%) |
| Retail Trade | 41,543 (53.9%) | 35,570 (46.1%) |
| Transportation & Warehousing | 17,900 (73.8%) | 6,360 (26.2%) |
| Utilities | 2,306 (74.1%) | 807 (25.9%) |
| Information | 7,912 (61.5%) | 4,953 (38.5%) |
| Finance & Insurance | 31,274 (54.2%) | 26,388 (45.8%) |
| Real Estate, Rental & Leasing | 6,695 (51.7%) | 6,246 (48.3%) |
| Professional & Scientific | 49,477 (60.0%) | 33,058 (40.1%) |
| Enterprise Management | 1,165 (46.8%) | 1,323 (53.2%) |
| Administrative & Support | 13,671 (58.7%) | 9,617 (41.3%) |
| Educational Services | 22,932 (34.4%) | 43,677 (65.6%) |
| Health Care & Social Assistance | 26,641 (26.1%) | 75,477 (73.9%) |
| Arts, Entertainment & Recreation | 7,964 (49.4%) | 8,145 (50.6%) |
| Accommodation & Food Services | 18,959 (49.1%) | 19,681 (50.9%) |
| Public Administration | 9,219 (49.1%) | 9,546 (50.9%) |
| Total | 367,168 (52.2%) | 335,849 (47.8%) |
Education in Hennepin County
School Enrollment in Hennepin County
The most common levels of schooling among the 309,407 students in Hennepin County are college / undergraduate (65,116 | 21.0%), high school (61,478 | 19.9%), and elementary school (61,134 | 19.8%).
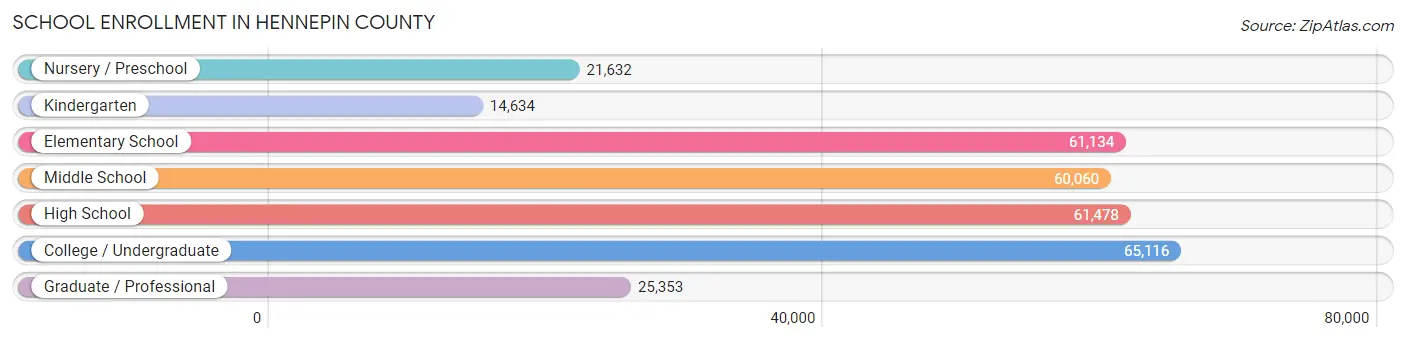
| School Level | # Students | % Students |
| Nursery / Preschool | 21,632 | 7.0% |
| Kindergarten | 14,634 | 4.7% |
| Elementary School | 61,134 | 19.8% |
| Middle School | 60,060 | 19.4% |
| High School | 61,478 | 19.9% |
| College / Undergraduate | 65,116 | 21.0% |
| Graduate / Professional | 25,353 | 8.2% |
| Total | 309,407 | 100.0% |
School Enrollment by Age by Funding Source in Hennepin County
Out of a total of 309,407 students who are enrolled in schools in Hennepin County, 53,837 (17.4%) attend a private institution, while the remaining 255,570 (82.6%) are enrolled in public schools. The age group of 3 to 4 year olds has the highest likelihood of being enrolled in private schools, with 7,200 (44.7% in the age bracket) enrolled. Conversely, the age group of 15 to 17 year olds has the lowest likelihood of being enrolled in a private school, with 38,993 (88.6% in the age bracket) attending a public institution.
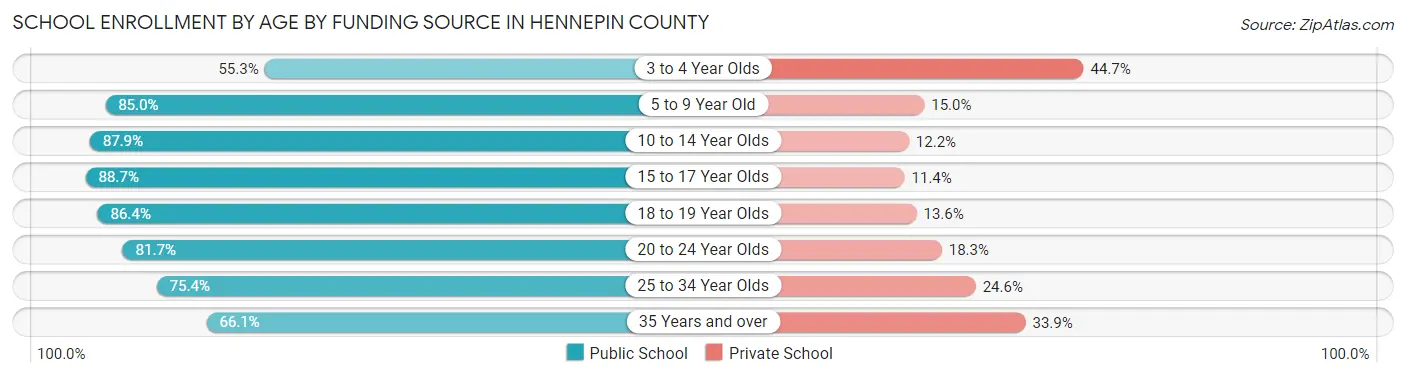
| Age Bracket | Public School | Private School |
| 3 to 4 Year Olds | 8,914 (55.3%) | 7,200 (44.7%) |
| 5 to 9 Year Old | 62,271 (85.0%) | 11,002 (15.0%) |
| 10 to 14 Year Olds | 65,545 (87.8%) | 9,067 (12.1%) |
| 15 to 17 Year Olds | 38,993 (88.6%) | 4,993 (11.4%) |
| 18 to 19 Year Olds | 21,538 (86.4%) | 3,385 (13.6%) |
| 20 to 24 Year Olds | 27,749 (81.7%) | 6,204 (18.3%) |
| 25 to 34 Year Olds | 19,004 (75.4%) | 6,200 (24.6%) |
| 35 Years and over | 11,466 (66.1%) | 5,876 (33.9%) |
| Total | 255,570 (82.6%) | 53,837 (17.4%) |
Educational Attainment by Field of Study in Hennepin County
Business (103,404 | 19.8%), social sciences (54,190 | 10.4%), education (42,989 | 8.2%), science & technology (38,396 | 7.3%), and engineering (36,942 | 7.1%) are the most common fields of study among 522,783 individuals in Hennepin County who have obtained a bachelor's degree or higher.
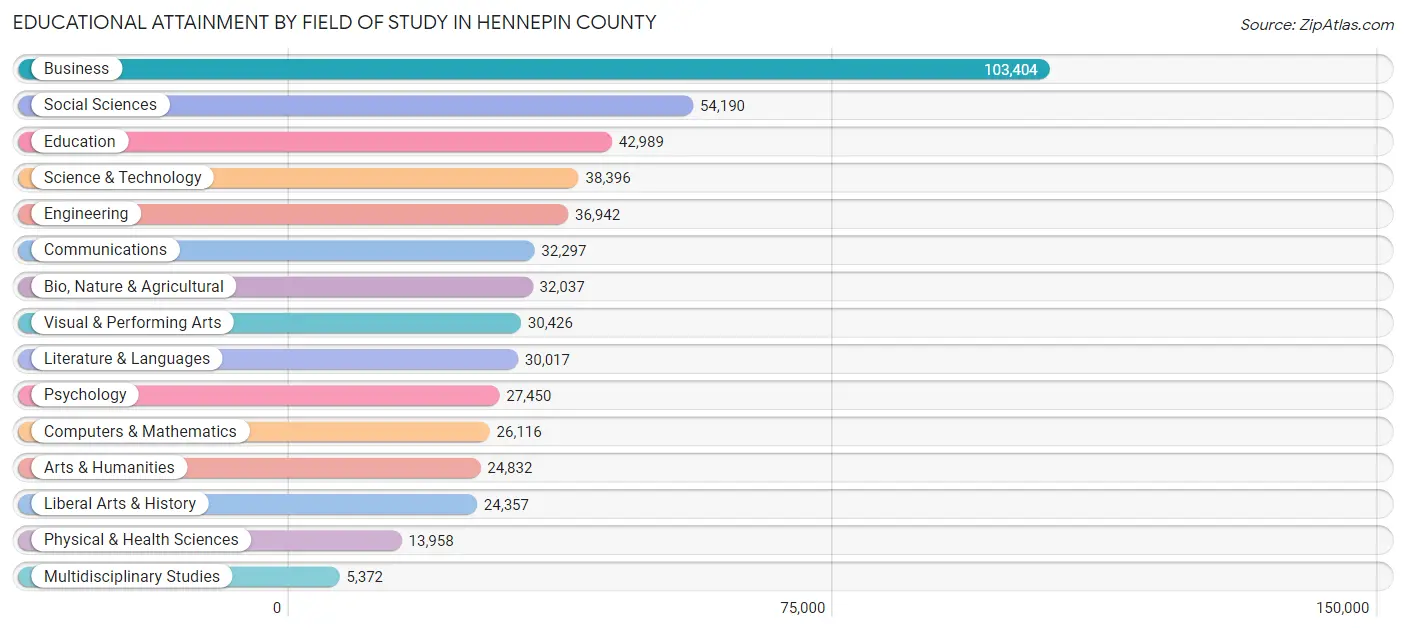
| Field of Study | # Graduates | % Graduates |
| Computers & Mathematics | 26,116 | 5.0% |
| Bio, Nature & Agricultural | 32,037 | 6.1% |
| Physical & Health Sciences | 13,958 | 2.7% |
| Psychology | 27,450 | 5.2% |
| Social Sciences | 54,190 | 10.4% |
| Engineering | 36,942 | 7.1% |
| Multidisciplinary Studies | 5,372 | 1.0% |
| Science & Technology | 38,396 | 7.3% |
| Business | 103,404 | 19.8% |
| Education | 42,989 | 8.2% |
| Literature & Languages | 30,017 | 5.7% |
| Liberal Arts & History | 24,357 | 4.7% |
| Visual & Performing Arts | 30,426 | 5.8% |
| Communications | 32,297 | 6.2% |
| Arts & Humanities | 24,832 | 4.8% |
| Total | 522,783 | 100.0% |
Transportation & Commute in Hennepin County
Vehicle Availability by Sex in Hennepin County
The most prevalent vehicle ownership categories in Hennepin County are males with 2 vehicles (168,097, accounting for 46.7%) and females with 2 vehicles (149,607, making up 51.6%).
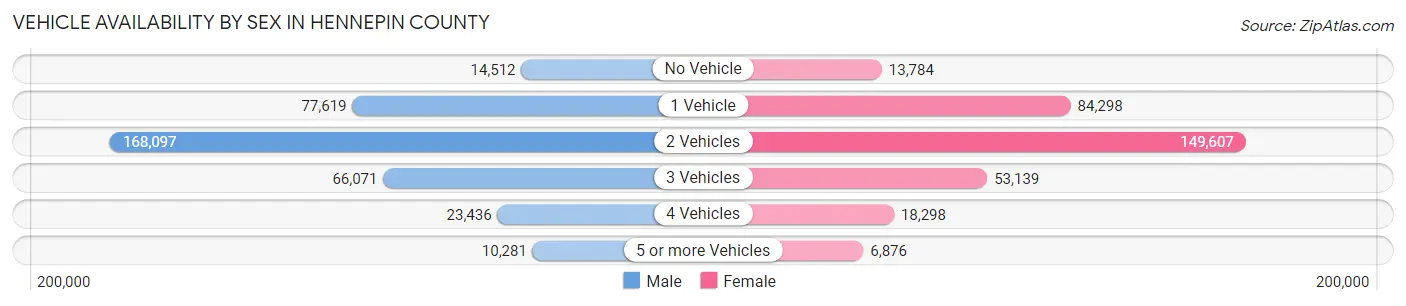
| Vehicles Available | Male | Female |
| No Vehicle | 14,512 (4.0%) | 13,784 (4.2%) |
| 1 Vehicle | 77,619 (21.6%) | 84,298 (25.9%) |
| 2 Vehicles | 168,097 (46.7%) | 149,607 (45.9%) |
| 3 Vehicles | 66,071 (18.3%) | 53,139 (16.3%) |
| 4 Vehicles | 23,436 (6.5%) | 18,298 (5.6%) |
| 5 or more Vehicles | 10,281 (2.9%) | 6,876 (2.1%) |
| Total | 360,016 (100.0%) | 326,002 (100.0%) |
Commute Time in Hennepin County
The most frequently occuring commute durations in Hennepin County are 15 to 19 minutes (106,093 commuters, 19.0%), 20 to 24 minutes (105,664 commuters, 18.9%), and 30 to 34 minutes (80,557 commuters, 14.4%).
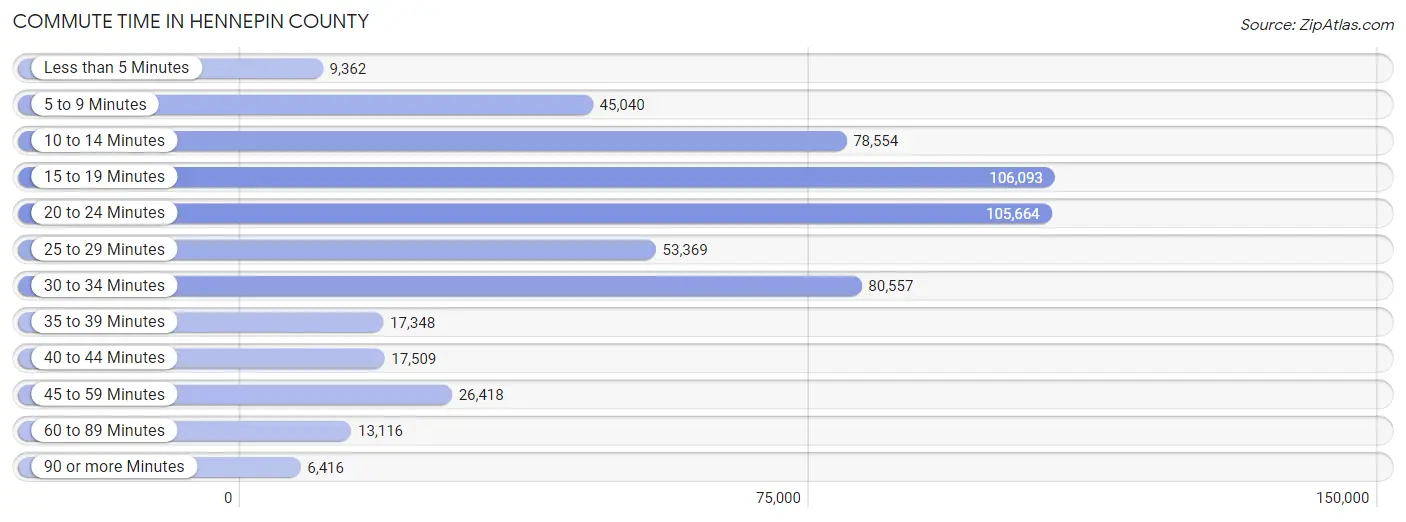
| Commute Time | # Commuters | % Commuters |
| Less than 5 Minutes | 9,362 | 1.7% |
| 5 to 9 Minutes | 45,040 | 8.1% |
| 10 to 14 Minutes | 78,554 | 14.0% |
| 15 to 19 Minutes | 106,093 | 19.0% |
| 20 to 24 Minutes | 105,664 | 18.9% |
| 25 to 29 Minutes | 53,369 | 9.5% |
| 30 to 34 Minutes | 80,557 | 14.4% |
| 35 to 39 Minutes | 17,348 | 3.1% |
| 40 to 44 Minutes | 17,509 | 3.1% |
| 45 to 59 Minutes | 26,418 | 4.7% |
| 60 to 89 Minutes | 13,116 | 2.3% |
| 90 or more Minutes | 6,416 | 1.1% |
Commute Time by Sex in Hennepin County
The most common commute times in Hennepin County are 20 to 24 minutes (56,502 commuters, 19.1%) for males and 15 to 19 minutes (50,994 commuters, 19.4%) for females.
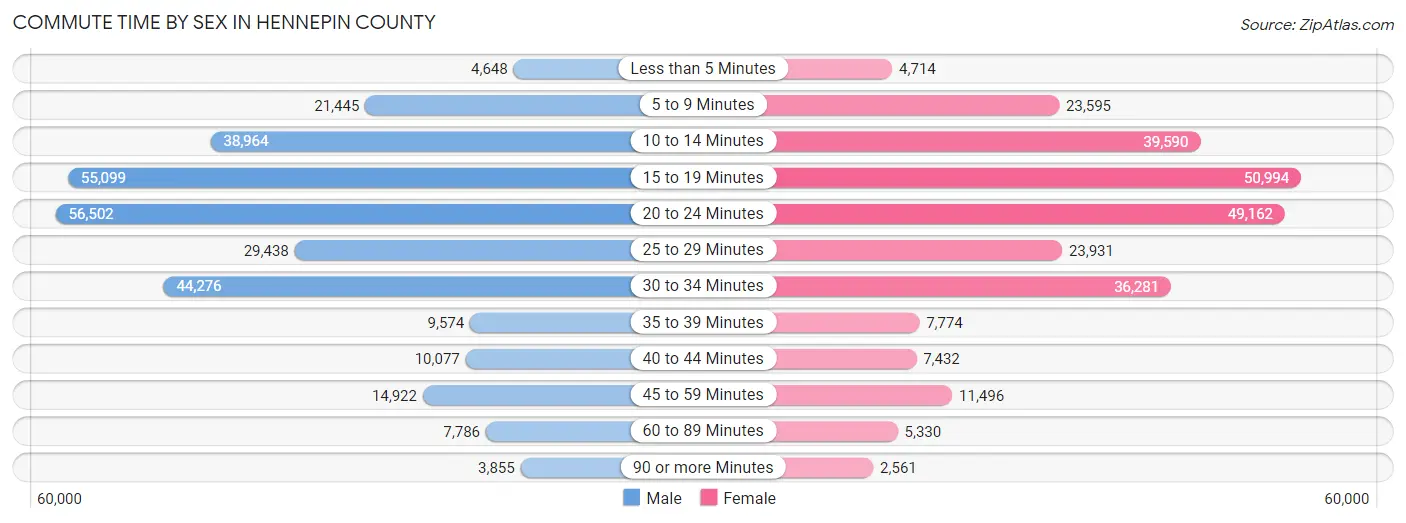
| Commute Time | Male | Female |
| Less than 5 Minutes | 4,648 (1.6%) | 4,714 (1.8%) |
| 5 to 9 Minutes | 21,445 (7.2%) | 23,595 (9.0%) |
| 10 to 14 Minutes | 38,964 (13.1%) | 39,590 (15.1%) |
| 15 to 19 Minutes | 55,099 (18.6%) | 50,994 (19.4%) |
| 20 to 24 Minutes | 56,502 (19.1%) | 49,162 (18.7%) |
| 25 to 29 Minutes | 29,438 (9.9%) | 23,931 (9.1%) |
| 30 to 34 Minutes | 44,276 (14.9%) | 36,281 (13.8%) |
| 35 to 39 Minutes | 9,574 (3.2%) | 7,774 (3.0%) |
| 40 to 44 Minutes | 10,077 (3.4%) | 7,432 (2.8%) |
| 45 to 59 Minutes | 14,922 (5.0%) | 11,496 (4.4%) |
| 60 to 89 Minutes | 7,786 (2.6%) | 5,330 (2.0%) |
| 90 or more Minutes | 3,855 (1.3%) | 2,561 (1.0%) |
Time of Departure to Work by Sex in Hennepin County
The most frequent times of departure to work in Hennepin County are 7:00 AM to 7:29 AM (41,540, 14.0%) for males and 7:30 AM to 7:59 AM (39,384, 15.0%) for females.
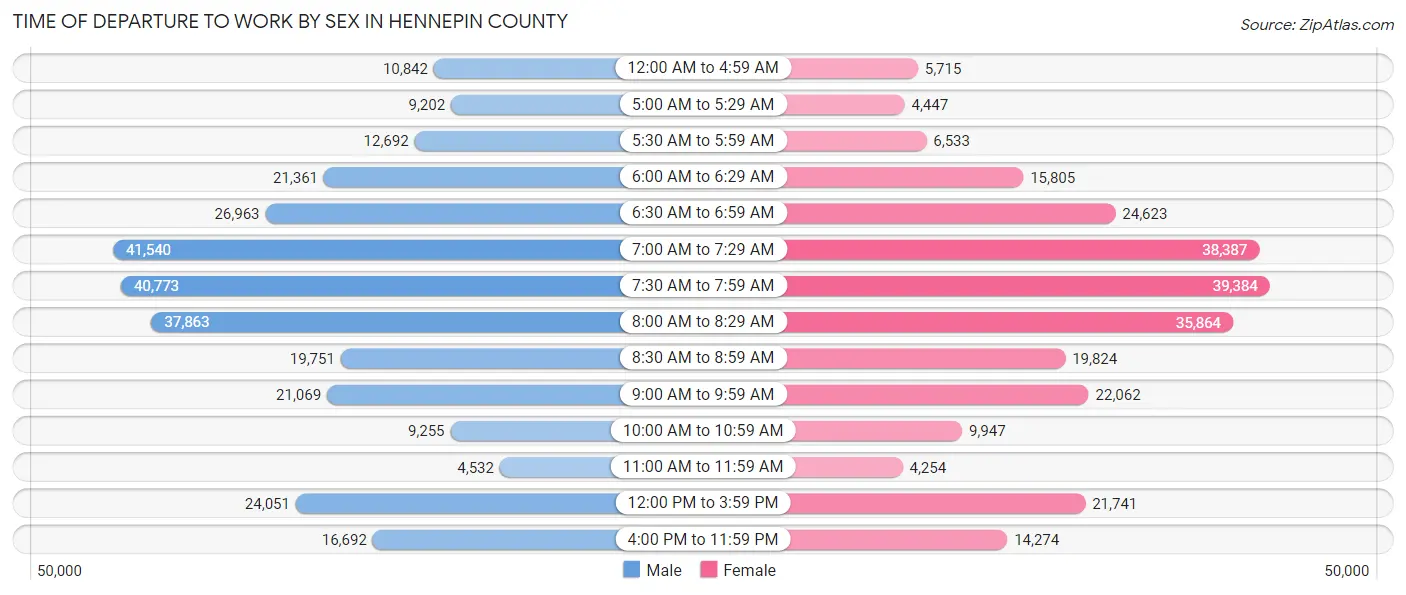
| Time of Departure | Male | Female |
| 12:00 AM to 4:59 AM | 10,842 (3.7%) | 5,715 (2.2%) |
| 5:00 AM to 5:29 AM | 9,202 (3.1%) | 4,447 (1.7%) |
| 5:30 AM to 5:59 AM | 12,692 (4.3%) | 6,533 (2.5%) |
| 6:00 AM to 6:29 AM | 21,361 (7.2%) | 15,805 (6.0%) |
| 6:30 AM to 6:59 AM | 26,963 (9.1%) | 24,623 (9.4%) |
| 7:00 AM to 7:29 AM | 41,540 (14.0%) | 38,387 (14.6%) |
| 7:30 AM to 7:59 AM | 40,773 (13.8%) | 39,384 (15.0%) |
| 8:00 AM to 8:29 AM | 37,863 (12.8%) | 35,864 (13.6%) |
| 8:30 AM to 8:59 AM | 19,751 (6.7%) | 19,824 (7.5%) |
| 9:00 AM to 9:59 AM | 21,069 (7.1%) | 22,062 (8.4%) |
| 10:00 AM to 10:59 AM | 9,255 (3.1%) | 9,947 (3.8%) |
| 11:00 AM to 11:59 AM | 4,532 (1.5%) | 4,254 (1.6%) |
| 12:00 PM to 3:59 PM | 24,051 (8.1%) | 21,741 (8.3%) |
| 4:00 PM to 11:59 PM | 16,692 (5.6%) | 14,274 (5.4%) |
| Total | 296,586 (100.0%) | 262,860 (100.0%) |
Housing Occupancy in Hennepin County
Occupancy by Ownership in Hennepin County
Of the total 529,029 dwellings in Hennepin County, owner-occupied units account for 333,104 (63.0%), while renter-occupied units make up 195,925 (37.0%).
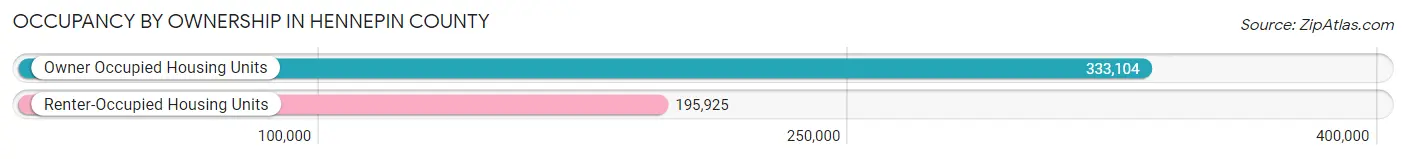
| Occupancy | # Housing Units | % Housing Units |
| Owner Occupied Housing Units | 333,104 | 63.0% |
| Renter-Occupied Housing Units | 195,925 | 37.0% |
| Total Occupied Housing Units | 529,029 | 100.0% |
Occupancy by Household Size in Hennepin County
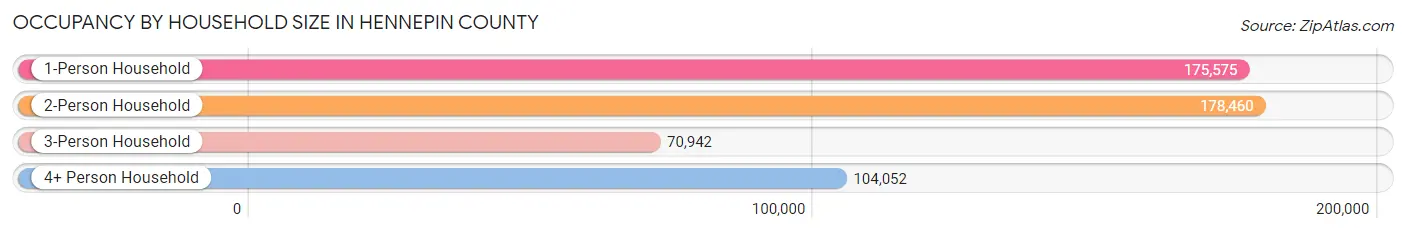
| Household Size | # Housing Units | % Housing Units |
| 1-Person Household | 175,575 | 33.2% |
| 2-Person Household | 178,460 | 33.7% |
| 3-Person Household | 70,942 | 13.4% |
| 4+ Person Household | 104,052 | 19.7% |
| Total Housing Units | 529,029 | 100.0% |
Occupancy by Ownership by Household Size in Hennepin County
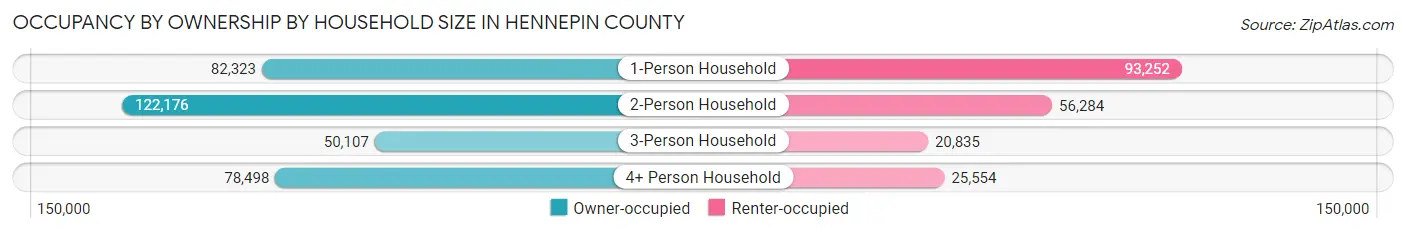
| Household Size | Owner-occupied | Renter-occupied |
| 1-Person Household | 82,323 (46.9%) | 93,252 (53.1%) |
| 2-Person Household | 122,176 (68.5%) | 56,284 (31.5%) |
| 3-Person Household | 50,107 (70.6%) | 20,835 (29.4%) |
| 4+ Person Household | 78,498 (75.4%) | 25,554 (24.6%) |
| Total Housing Units | 333,104 (63.0%) | 195,925 (37.0%) |
Occupancy by Educational Attainment in Hennepin County
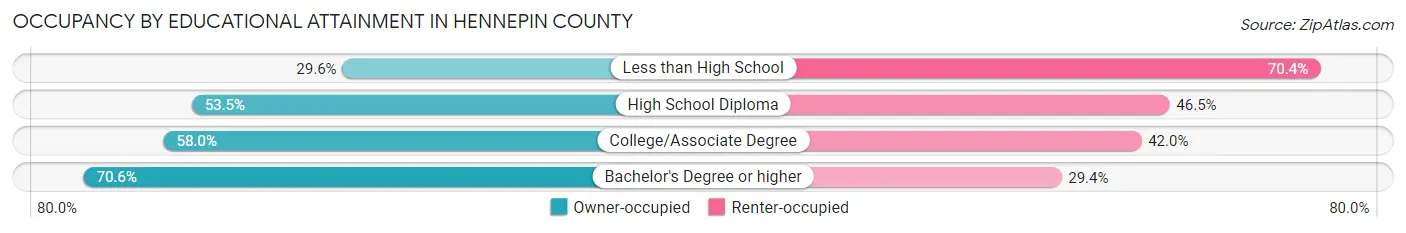
| Household Size | Owner-occupied | Renter-occupied |
| Less than High School | 7,695 (29.6%) | 18,311 (70.4%) |
| High School Diploma | 37,054 (53.5%) | 32,224 (46.5%) |
| College/Associate Degree | 82,438 (58.0%) | 59,787 (42.0%) |
| Bachelor's Degree or higher | 205,917 (70.6%) | 85,603 (29.4%) |
Occupancy by Age of Householder in Hennepin County
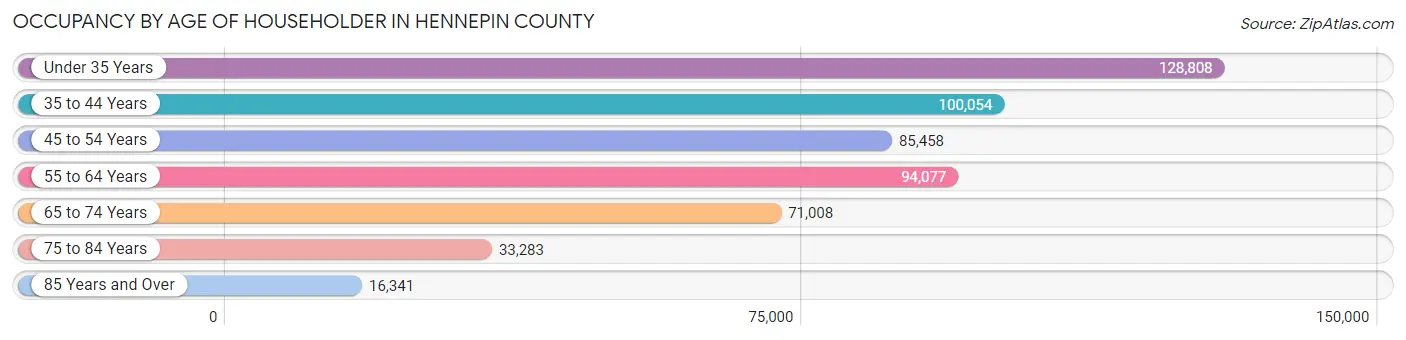
| Age Bracket | # Households | % Households |
| Under 35 Years | 128,808 | 24.3% |
| 35 to 44 Years | 100,054 | 18.9% |
| 45 to 54 Years | 85,458 | 16.2% |
| 55 to 64 Years | 94,077 | 17.8% |
| 65 to 74 Years | 71,008 | 13.4% |
| 75 to 84 Years | 33,283 | 6.3% |
| 85 Years and Over | 16,341 | 3.1% |
| Total | 529,029 | 100.0% |
Housing Finances in Hennepin County
Median Income by Occupancy in Hennepin County
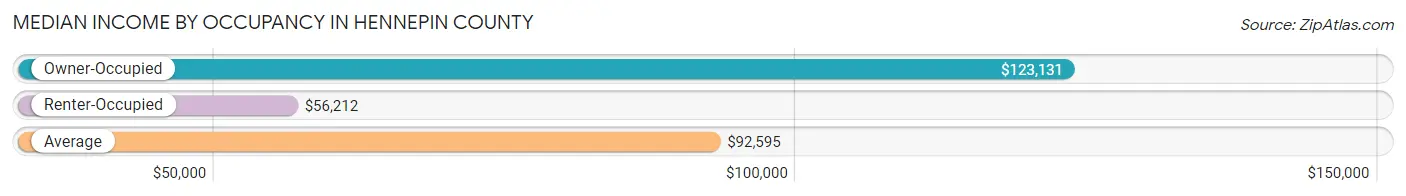
| Occupancy Type | # Households | Median Income |
| Owner-Occupied | 333,104 (63.0%) | $123,131 |
| Renter-Occupied | 195,925 (37.0%) | $56,212 |
| Average | 529,029 (100.0%) | $92,595 |
Occupancy by Householder Income Bracket in Hennepin County
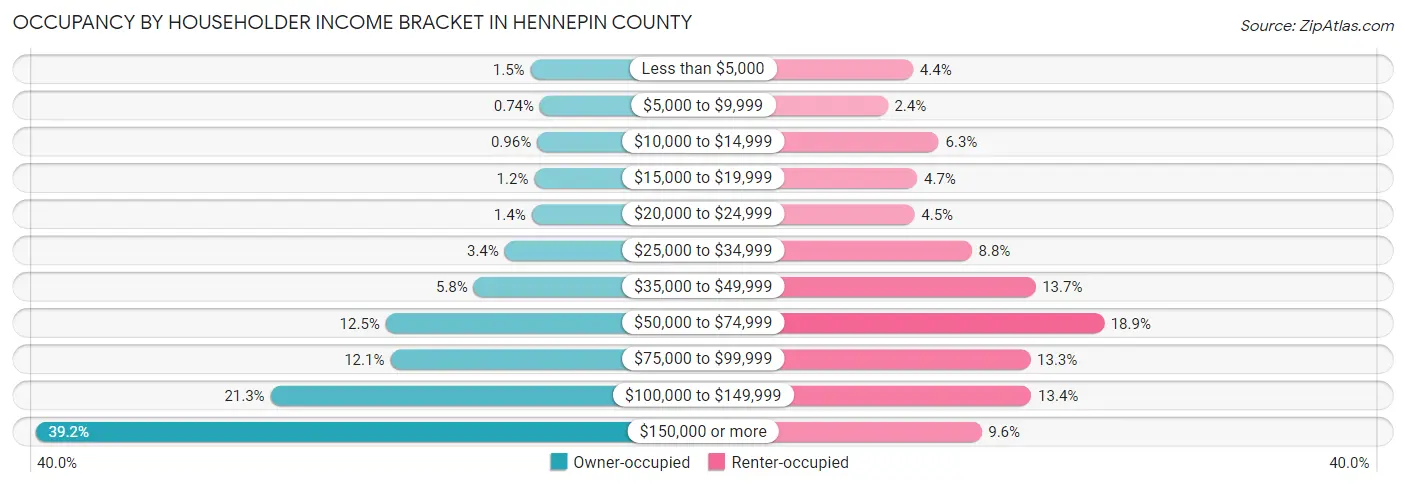
| Income Bracket | Owner-occupied | Renter-occupied |
| Less than $5,000 | 4,849 (1.5%) | 8,563 (4.4%) |
| $5,000 to $9,999 | 2,471 (0.7%) | 4,762 (2.4%) |
| $10,000 to $14,999 | 3,196 (1.0%) | 12,393 (6.3%) |
| $15,000 to $19,999 | 3,906 (1.2%) | 9,182 (4.7%) |
| $20,000 to $24,999 | 4,599 (1.4%) | 8,770 (4.5%) |
| $25,000 to $34,999 | 11,418 (3.4%) | 17,326 (8.8%) |
| $35,000 to $49,999 | 19,303 (5.8%) | 26,829 (13.7%) |
| $50,000 to $74,999 | 41,620 (12.5%) | 37,047 (18.9%) |
| $75,000 to $99,999 | 40,436 (12.1%) | 26,060 (13.3%) |
| $100,000 to $149,999 | 70,848 (21.3%) | 26,220 (13.4%) |
| $150,000 or more | 130,458 (39.2%) | 18,773 (9.6%) |
| Total | 333,104 (100.0%) | 195,925 (100.0%) |
Monthly Housing Cost Tiers in Hennepin County
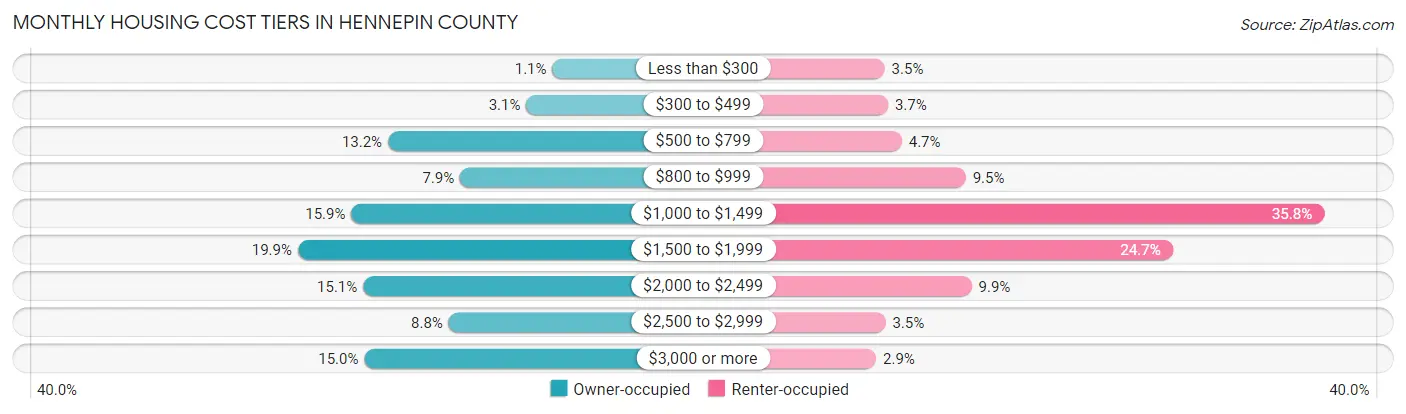
| Monthly Cost | Owner-occupied | Renter-occupied |
| Less than $300 | 3,760 (1.1%) | 6,818 (3.5%) |
| $300 to $499 | 10,169 (3.0%) | 7,282 (3.7%) |
| $500 to $799 | 44,090 (13.2%) | 9,284 (4.7%) |
| $800 to $999 | 26,411 (7.9%) | 18,520 (9.5%) |
| $1,000 to $1,499 | 53,098 (15.9%) | 70,201 (35.8%) |
| $1,500 to $1,999 | 66,237 (19.9%) | 48,359 (24.7%) |
| $2,000 to $2,499 | 50,208 (15.1%) | 19,363 (9.9%) |
| $2,500 to $2,999 | 29,227 (8.8%) | 6,927 (3.5%) |
| $3,000 or more | 49,904 (15.0%) | 5,590 (2.9%) |
| Total | 333,104 (100.0%) | 195,925 (100.0%) |
Physical Housing Characteristics in Hennepin County
Housing Structures in Hennepin County
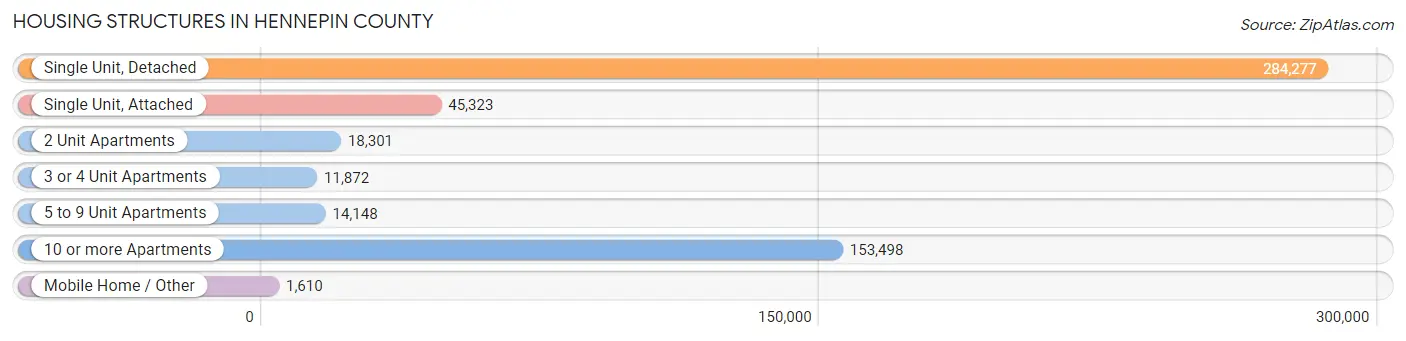
| Structure Type | # Housing Units | % Housing Units |
| Single Unit, Detached | 284,277 | 53.7% |
| Single Unit, Attached | 45,323 | 8.6% |
| 2 Unit Apartments | 18,301 | 3.5% |
| 3 or 4 Unit Apartments | 11,872 | 2.2% |
| 5 to 9 Unit Apartments | 14,148 | 2.7% |
| 10 or more Apartments | 153,498 | 29.0% |
| Mobile Home / Other | 1,610 | 0.3% |
| Total | 529,029 | 100.0% |
Housing Structures by Occupancy in Hennepin County
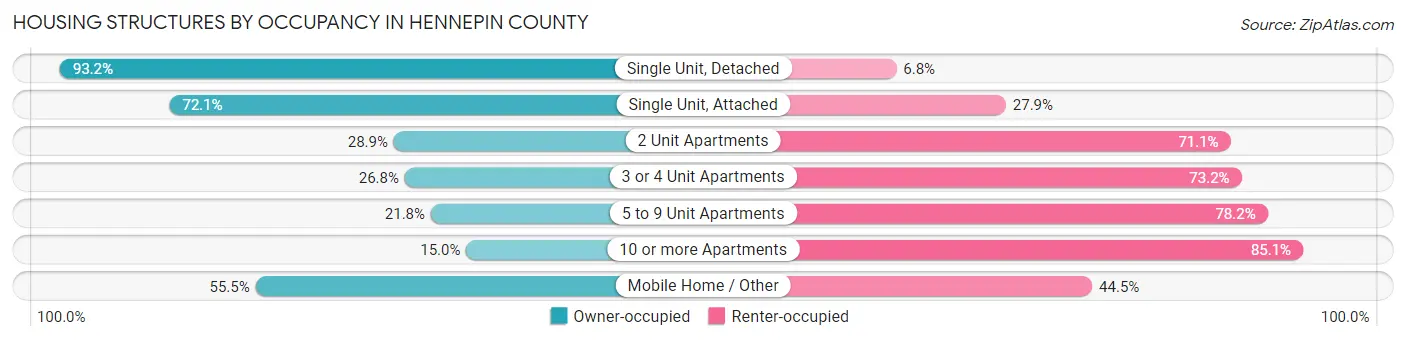
| Structure Type | Owner-occupied | Renter-occupied |
| Single Unit, Detached | 265,016 (93.2%) | 19,261 (6.8%) |
| Single Unit, Attached | 32,694 (72.1%) | 12,629 (27.9%) |
| 2 Unit Apartments | 5,290 (28.9%) | 13,011 (71.1%) |
| 3 or 4 Unit Apartments | 3,182 (26.8%) | 8,690 (73.2%) |
| 5 to 9 Unit Apartments | 3,081 (21.8%) | 11,067 (78.2%) |
| 10 or more Apartments | 22,947 (14.9%) | 130,551 (85.1%) |
| Mobile Home / Other | 894 (55.5%) | 716 (44.5%) |
| Total | 333,104 (63.0%) | 195,925 (37.0%) |
Housing Structures by Number of Rooms in Hennepin County
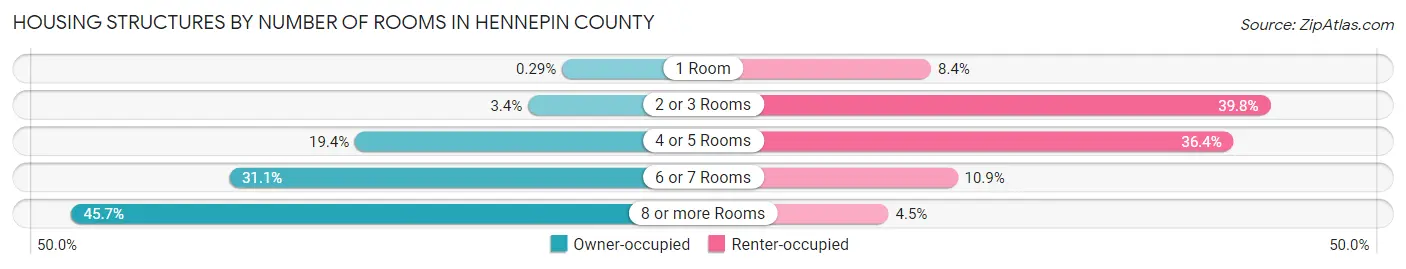
| Number of Rooms | Owner-occupied | Renter-occupied |
| 1 Room | 957 (0.3%) | 16,509 (8.4%) |
| 2 or 3 Rooms | 11,444 (3.4%) | 77,978 (39.8%) |
| 4 or 5 Rooms | 64,740 (19.4%) | 71,313 (36.4%) |
| 6 or 7 Rooms | 103,607 (31.1%) | 21,318 (10.9%) |
| 8 or more Rooms | 152,356 (45.7%) | 8,807 (4.5%) |
| Total | 333,104 (100.0%) | 195,925 (100.0%) |
Housing Structure by Heating Type in Hennepin County
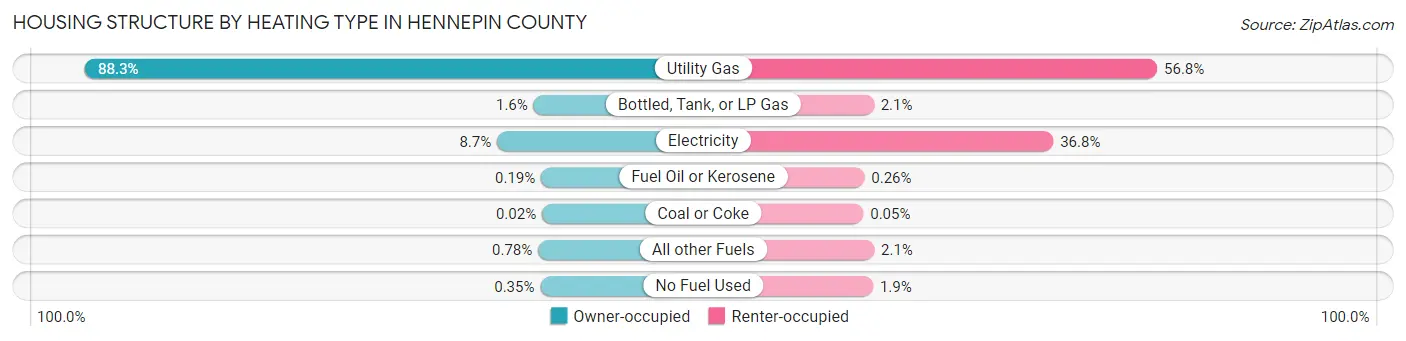
| Heating Type | Owner-occupied | Renter-occupied |
| Utility Gas | 294,113 (88.3%) | 111,334 (56.8%) |
| Bottled, Tank, or LP Gas | 5,479 (1.6%) | 4,035 (2.1%) |
| Electricity | 29,013 (8.7%) | 72,005 (36.7%) |
| Fuel Oil or Kerosene | 632 (0.2%) | 517 (0.3%) |
| Coal or Coke | 75 (0.0%) | 96 (0.1%) |
| All other Fuels | 2,612 (0.8%) | 4,198 (2.1%) |
| No Fuel Used | 1,180 (0.4%) | 3,740 (1.9%) |
| Total | 333,104 (100.0%) | 195,925 (100.0%) |
Household Vehicle Usage in Hennepin County
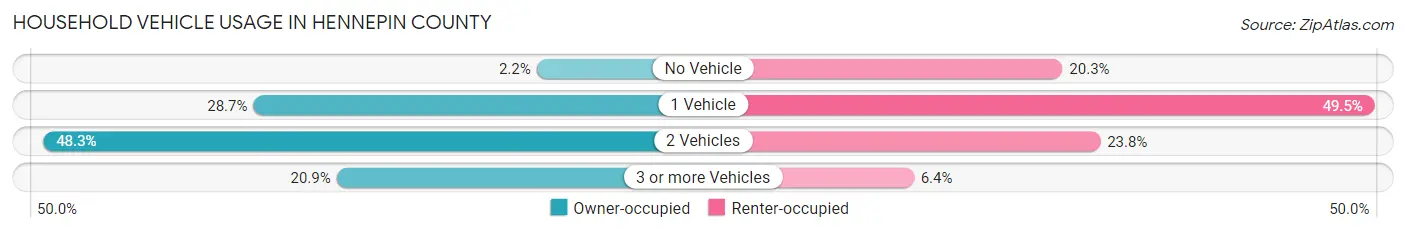
| Vehicles per Household | Owner-occupied | Renter-occupied |
| No Vehicle | 7,356 (2.2%) | 39,776 (20.3%) |
| 1 Vehicle | 95,432 (28.6%) | 96,887 (49.4%) |
| 2 Vehicles | 160,761 (48.3%) | 46,691 (23.8%) |
| 3 or more Vehicles | 69,555 (20.9%) | 12,571 (6.4%) |
| Total | 333,104 (100.0%) | 195,925 (100.0%) |
Real Estate & Mortgages in Hennepin County
Real Estate and Mortgage Overview in Hennepin County
| Characteristic | Without Mortgage | With Mortgage |
| Housing Units | 100,754 | 232,350 |
| Median Property Value | $340,900 | $365,000 |
| Median Household Income | $90,274 | $103,502 |
| Monthly Housing Costs | $774 | $48,241 |
| Real Estate Taxes | $4,068 | $2,975 |
Property Value by Mortgage Status in Hennepin County
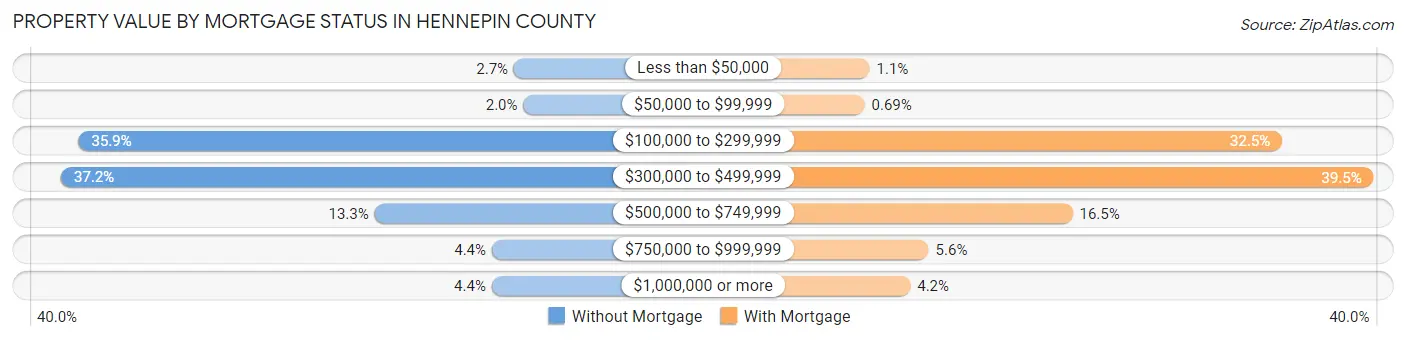
| Property Value | Without Mortgage | With Mortgage |
| Less than $50,000 | 2,742 (2.7%) | 2,477 (1.1%) |
| $50,000 to $99,999 | 2,011 (2.0%) | 1,609 (0.7%) |
| $100,000 to $299,999 | 36,174 (35.9%) | 75,512 (32.5%) |
| $300,000 to $499,999 | 37,509 (37.2%) | 91,700 (39.5%) |
| $500,000 to $749,999 | 13,439 (13.3%) | 38,409 (16.5%) |
| $750,000 to $999,999 | 4,438 (4.4%) | 12,948 (5.6%) |
| $1,000,000 or more | 4,441 (4.4%) | 9,695 (4.2%) |
| Total | 100,754 (100.0%) | 232,350 (100.0%) |
Household Income by Mortgage Status in Hennepin County
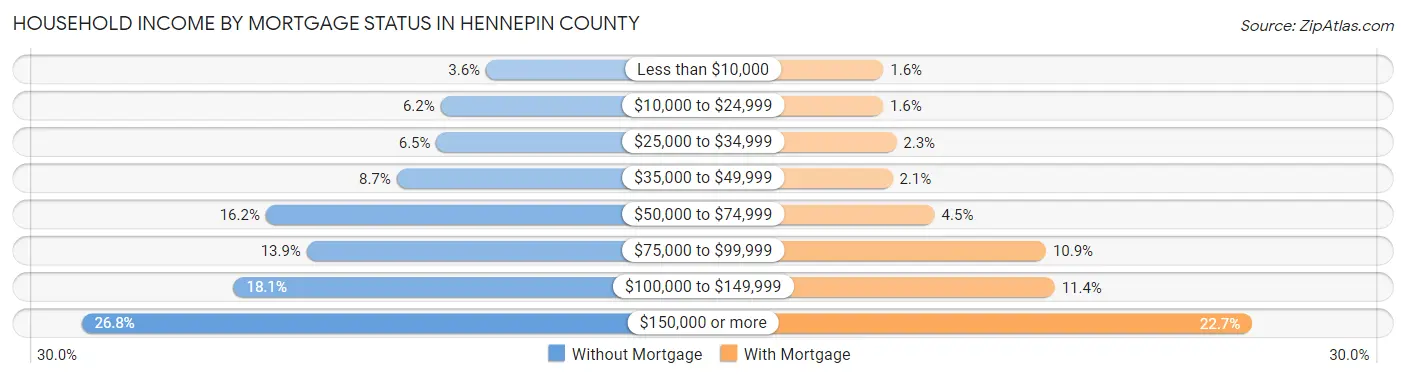
| Household Income | Without Mortgage | With Mortgage |
| Less than $10,000 | 3,668 (3.6%) | 3,683 (1.6%) |
| $10,000 to $24,999 | 6,281 (6.2%) | 3,652 (1.6%) |
| $25,000 to $34,999 | 6,520 (6.5%) | 5,420 (2.3%) |
| $35,000 to $49,999 | 8,809 (8.7%) | 4,898 (2.1%) |
| $50,000 to $74,999 | 16,338 (16.2%) | 10,494 (4.5%) |
| $75,000 to $99,999 | 13,984 (13.9%) | 25,282 (10.9%) |
| $100,000 to $149,999 | 18,198 (18.1%) | 26,452 (11.4%) |
| $150,000 or more | 26,956 (26.8%) | 52,650 (22.7%) |
| Total | 100,754 (100.0%) | 232,350 (100.0%) |
Property Value to Household Income Ratio in Hennepin County
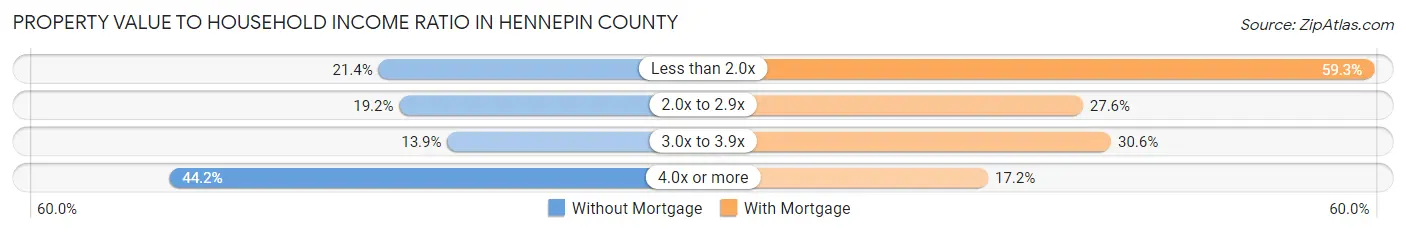
| Value-to-Income Ratio | Without Mortgage | With Mortgage |
| Less than 2.0x | 21,587 (21.4%) | 137,767 (59.3%) |
| 2.0x to 2.9x | 19,314 (19.2%) | 64,044 (27.6%) |
| 3.0x to 3.9x | 14,050 (13.9%) | 71,173 (30.6%) |
| 4.0x or more | 44,568 (44.2%) | 40,040 (17.2%) |
| Total | 100,754 (100.0%) | 232,350 (100.0%) |
Real Estate Taxes by Mortgage Status in Hennepin County
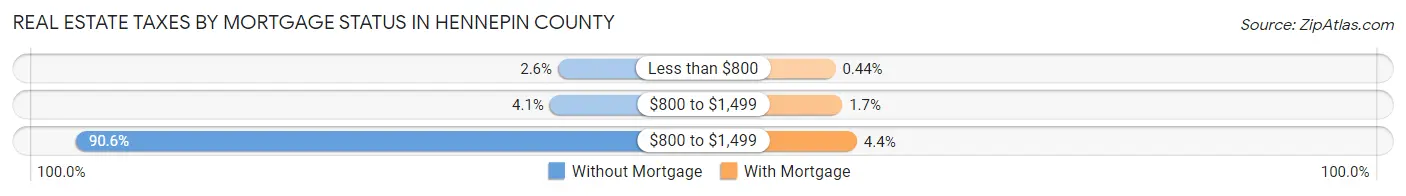
| Property Taxes | Without Mortgage | With Mortgage |
| Less than $800 | 2,622 (2.6%) | 1,024 (0.4%) |
| $800 to $1,499 | 4,133 (4.1%) | 3,897 (1.7%) |
| $800 to $1,499 | 91,328 (90.6%) | 10,142 (4.4%) |
| Total | 100,754 (100.0%) | 232,350 (100.0%) |
Health & Disability in Hennepin County
Health Insurance Coverage by Age in Hennepin County
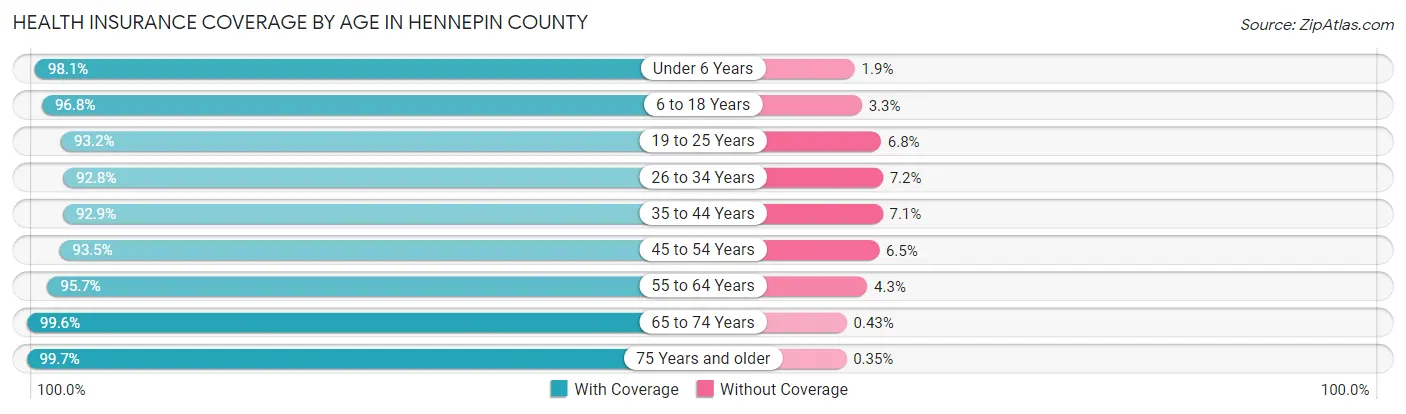
| Age Bracket | With Coverage | Without Coverage |
| Under 6 Years | 89,809 (98.1%) | 1,768 (1.9%) |
| 6 to 18 Years | 193,484 (96.8%) | 6,500 (3.3%) |
| 19 to 25 Years | 107,126 (93.2%) | 7,839 (6.8%) |
| 26 to 34 Years | 171,506 (92.8%) | 13,237 (7.2%) |
| 35 to 44 Years | 167,957 (92.9%) | 12,886 (7.1%) |
| 45 to 54 Years | 140,281 (93.5%) | 9,711 (6.5%) |
| 55 to 64 Years | 150,785 (95.7%) | 6,706 (4.3%) |
| 65 to 74 Years | 110,005 (99.6%) | 476 (0.4%) |
| 75 Years and older | 70,900 (99.7%) | 246 (0.4%) |
| Total | 1,201,853 (95.3%) | 59,369 (4.7%) |
Health Insurance Coverage by Citizenship Status in Hennepin County
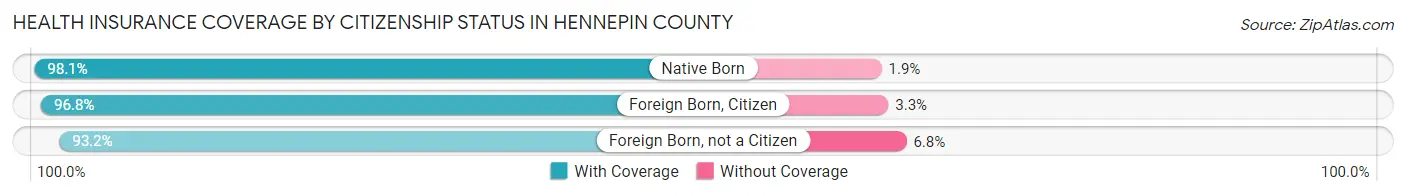
| Citizenship Status | With Coverage | Without Coverage |
| Native Born | 89,809 (98.1%) | 1,768 (1.9%) |
| Foreign Born, Citizen | 193,484 (96.8%) | 6,500 (3.3%) |
| Foreign Born, not a Citizen | 107,126 (93.2%) | 7,839 (6.8%) |
Health Insurance Coverage by Household Income in Hennepin County
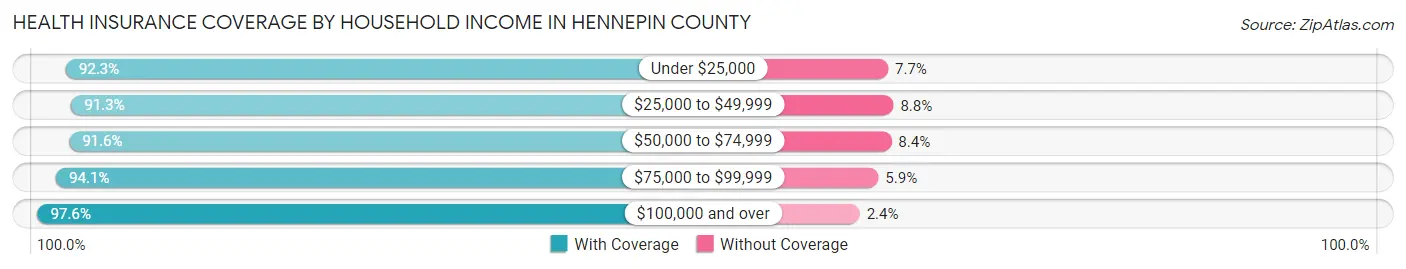
| Household Income | With Coverage | Without Coverage |
| Under $25,000 | 89,510 (92.3%) | 7,509 (7.7%) |
| $25,000 to $49,999 | 126,693 (91.2%) | 12,153 (8.7%) |
| $50,000 to $74,999 | 145,466 (91.6%) | 13,264 (8.4%) |
| $75,000 to $99,999 | 142,594 (94.1%) | 8,976 (5.9%) |
| $100,000 and over | 679,957 (97.6%) | 16,889 (2.4%) |
Public vs Private Health Insurance Coverage by Age in Hennepin County
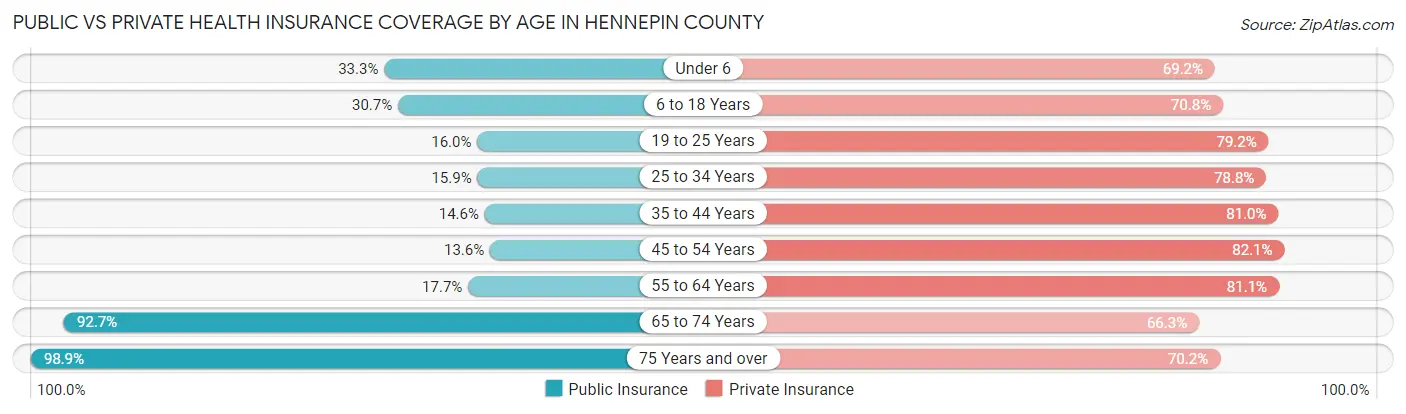
| Age Bracket | Public Insurance | Private Insurance |
| Under 6 | 30,451 (33.3%) | 63,406 (69.2%) |
| 6 to 18 Years | 61,379 (30.7%) | 141,502 (70.8%) |
| 19 to 25 Years | 18,373 (16.0%) | 91,051 (79.2%) |
| 25 to 34 Years | 29,449 (15.9%) | 145,515 (78.8%) |
| 35 to 44 Years | 26,373 (14.6%) | 146,539 (81.0%) |
| 45 to 54 Years | 20,393 (13.6%) | 123,206 (82.1%) |
| 55 to 64 Years | 27,825 (17.7%) | 127,774 (81.1%) |
| 65 to 74 Years | 102,417 (92.7%) | 73,234 (66.3%) |
| 75 Years and over | 70,327 (98.9%) | 49,950 (70.2%) |
| Total | 386,987 (30.7%) | 962,177 (76.3%) |
Disability Status by Sex by Age in Hennepin County
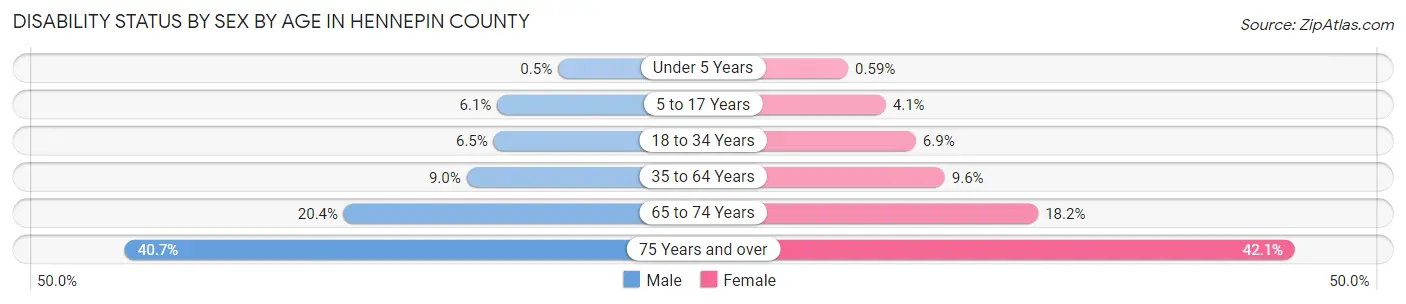
| Age Bracket | Male | Female |
| Under 5 Years | 196 (0.5%) | 222 (0.6%) |
| 5 to 17 Years | 6,185 (6.1%) | 3,975 (4.1%) |
| 18 to 34 Years | 10,406 (6.5%) | 10,709 (6.9%) |
| 35 to 64 Years | 22,171 (9.0%) | 23,082 (9.6%) |
| 65 to 74 Years | 10,629 (20.4%) | 10,630 (18.2%) |
| 75 Years and over | 11,620 (40.7%) | 17,906 (42.0%) |
Disability Class by Sex by Age in Hennepin County
Disability Class: Hearing Difficulty
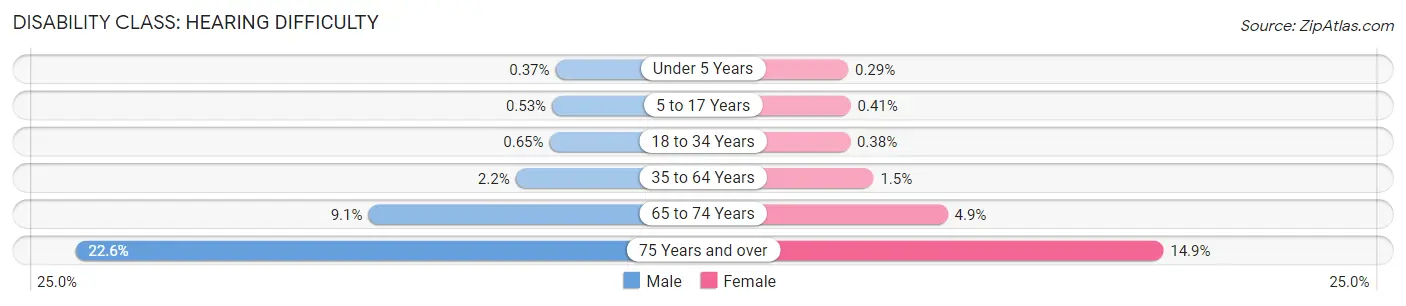
| Age Bracket | Male | Female |
| Under 5 Years | 147 (0.4%) | 108 (0.3%) |
| 5 to 17 Years | 534 (0.5%) | 396 (0.4%) |
| 18 to 34 Years | 1,046 (0.6%) | 593 (0.4%) |
| 35 to 64 Years | 5,472 (2.2%) | 3,550 (1.5%) |
| 65 to 74 Years | 4,724 (9.0%) | 2,865 (4.9%) |
| 75 Years and over | 6,467 (22.6%) | 6,356 (14.9%) |
Disability Class: Vision Difficulty
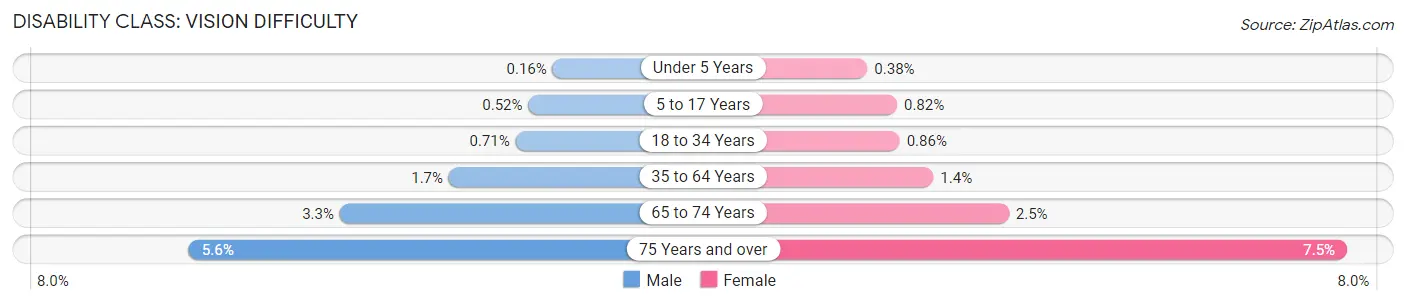
| Age Bracket | Male | Female |
| Under 5 Years | 62 (0.2%) | 143 (0.4%) |
| 5 to 17 Years | 527 (0.5%) | 800 (0.8%) |
| 18 to 34 Years | 1,149 (0.7%) | 1,336 (0.9%) |
| 35 to 64 Years | 4,185 (1.7%) | 3,295 (1.4%) |
| 65 to 74 Years | 1,731 (3.3%) | 1,443 (2.5%) |
| 75 Years and over | 1,588 (5.6%) | 3,196 (7.5%) |
Disability Class: Cognitive Difficulty
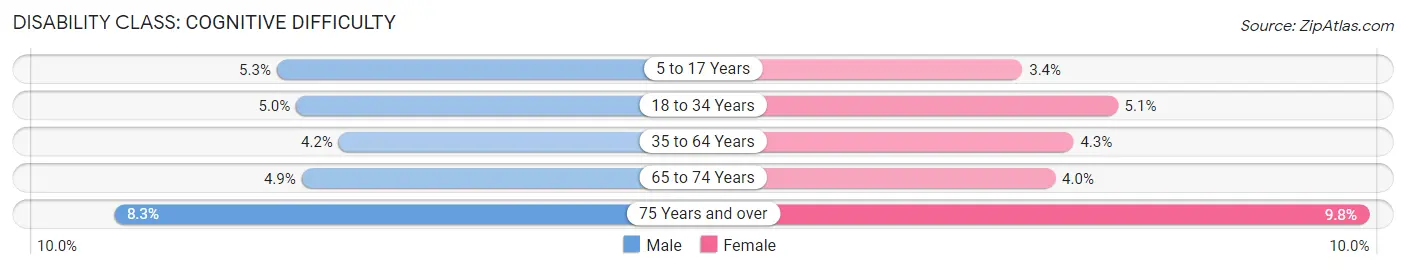
| Age Bracket | Male | Female |
| 5 to 17 Years | 5,359 (5.3%) | 3,262 (3.4%) |
| 18 to 34 Years | 7,980 (5.0%) | 7,961 (5.1%) |
| 35 to 64 Years | 10,293 (4.2%) | 10,389 (4.3%) |
| 65 to 74 Years | 2,538 (4.9%) | 2,306 (4.0%) |
| 75 Years and over | 2,381 (8.3%) | 4,166 (9.8%) |
Disability Class: Ambulatory Difficulty
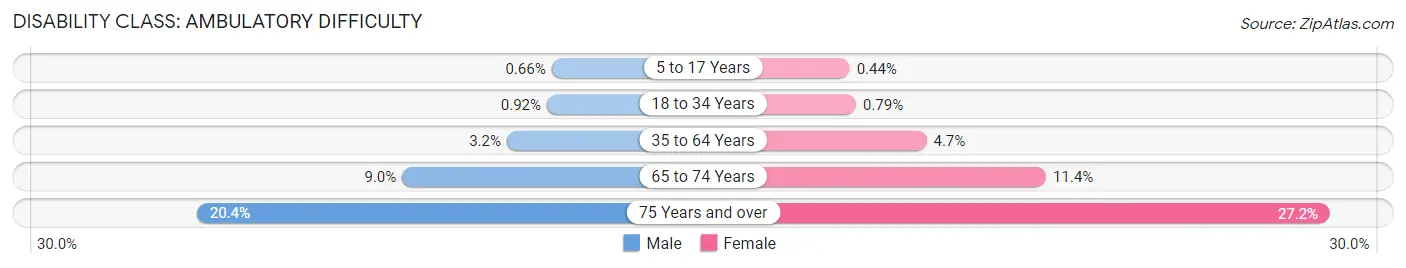
| Age Bracket | Male | Female |
| 5 to 17 Years | 669 (0.7%) | 427 (0.4%) |
| 18 to 34 Years | 1,481 (0.9%) | 1,230 (0.8%) |
| 35 to 64 Years | 7,784 (3.2%) | 11,386 (4.7%) |
| 65 to 74 Years | 4,686 (9.0%) | 6,637 (11.4%) |
| 75 Years and over | 5,830 (20.4%) | 11,574 (27.2%) |
Disability Class: Self-Care Difficulty
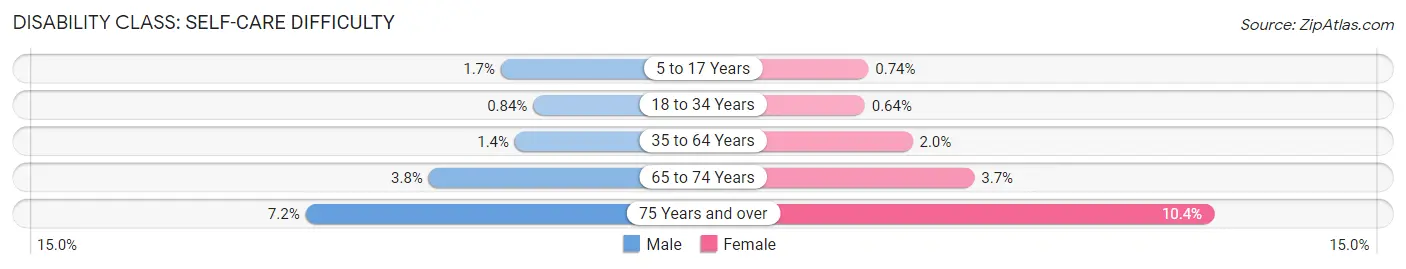
| Age Bracket | Male | Female |
| 5 to 17 Years | 1,750 (1.7%) | 723 (0.7%) |
| 18 to 34 Years | 1,347 (0.8%) | 990 (0.6%) |
| 35 to 64 Years | 3,336 (1.3%) | 4,758 (2.0%) |
| 65 to 74 Years | 1,959 (3.7%) | 2,149 (3.7%) |
| 75 Years and over | 2,051 (7.2%) | 4,414 (10.4%) |
Technology Access in Hennepin County
Computing Device Access in Hennepin County
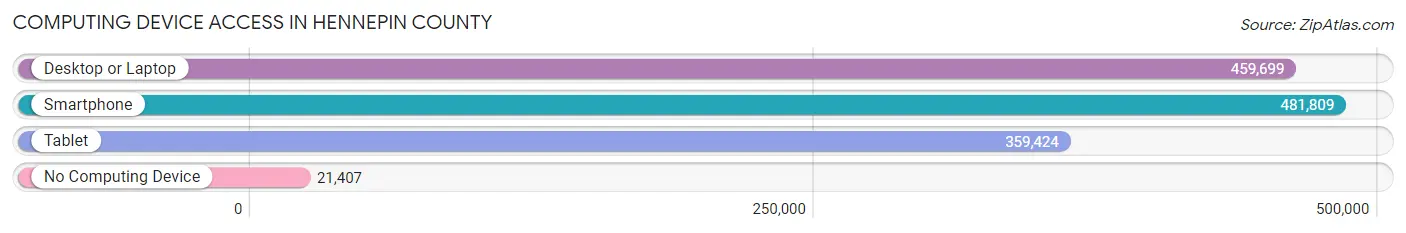
| Device Type | # Households | % Households |
| Desktop or Laptop | 459,699 | 86.9% |
| Smartphone | 481,809 | 91.1% |
| Tablet | 359,424 | 67.9% |
| No Computing Device | 21,407 | 4.1% |
| Total | 529,029 | 100.0% |
Internet Access in Hennepin County
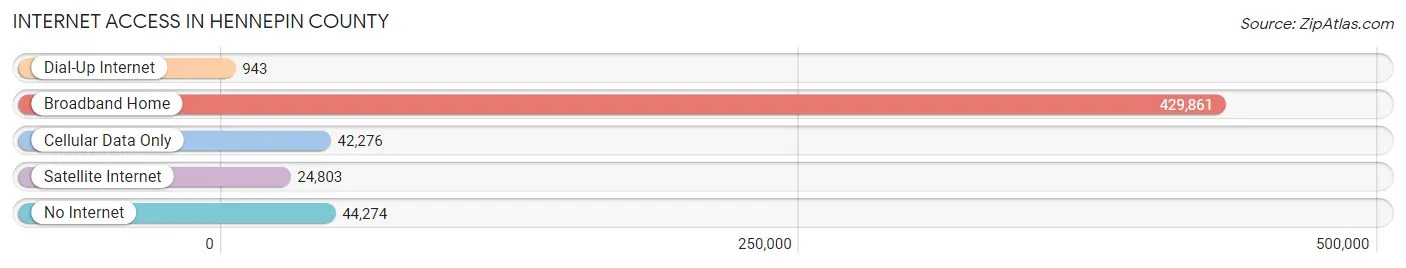
| Internet Type | # Households | % Households |
| Dial-Up Internet | 943 | 0.2% |
| Broadband Home | 429,861 | 81.2% |
| Cellular Data Only | 42,276 | 8.0% |
| Satellite Internet | 24,803 | 4.7% |
| No Internet | 44,274 | 8.4% |
| Total | 529,029 | 100.0% |
Hennepin County Summary
Hennepin County is located in the state of Minnesota and is the most populous county in the state. It is located in the Twin Cities metropolitan area and is home to the cities of Minneapolis and Saint Paul. The county was established in 1852 and named after the 17th-century explorer Father Louis Hennepin.
Geography
Hennepin County covers an area of 523 square miles and is located in the central part of Minnesota. It is bordered by Anoka County to the north, Ramsey County to the east, Carver County to the south, and Wright County to the west. The county is home to the Mississippi River, which forms its western border. The county also contains several lakes, including Lake Minnetonka, Lake Calhoun, and Lake Harriet.
The county is divided into seven townships: Brooklyn Center, Brooklyn Park, Champlin, Corcoran, Crystal, Golden Valley, and New Hope. The county seat is Minneapolis, which is also the largest city in the county.
Economy
Hennepin County has a diverse economy that is driven by a variety of industries. The county is home to several Fortune 500 companies, including Target Corporation, U.S. Bancorp, and General Mills. The county is also home to several major healthcare providers, including Allina Health, Fairview Health Services, and Park Nicollet Health Services.
The county is also home to several major educational institutions, including the University of Minnesota, Augsburg University, and the Minneapolis College of Art and Design. The county is also home to several major cultural institutions, including the Walker Art Center, the Minneapolis Institute of Art, and the Minnesota Orchestra.
Demographics
As of the 2010 census, Hennepin County had a population of 1,152,425. The racial makeup of the county was 73.3% White, 14.2% African American, 5.2% Asian, 0.7% Native American, and 6.6% from other races. The median household income was $60,879, and the median family income was $76,062.
The county is home to a large immigrant population, with over 20% of the population being foreign-born. The largest immigrant groups are from Mexico, India, Somalia, Ethiopia, and Laos.
Conclusion
Hennepin County is the most populous county in Minnesota and is home to the cities of Minneapolis and Saint Paul. The county has a diverse economy that is driven by a variety of industries, including healthcare, education, and culture. The county is also home to a large immigrant population, with over 20% of the population being foreign-born. Hennepin County is a vibrant and diverse county that is an important part of the Twin Cities metropolitan area.
Common Questions
What is the Total Population of Hennepin County?
Total Population of Hennepin County is 1,270,787.
What is the Total Male Population of Hennepin County?
Total Male Population of Hennepin County is 633,454.
What is the Total Female Population of Hennepin County?
Total Female Population of Hennepin County is 637,333.
What is the Ratio of Males per 100 Females in Hennepin County?
There are 99.39 Males per 100 Females in Hennepin County.
What is the Ratio of Females per 100 Males in Hennepin County?
There are 100.61 Females per 100 Males in Hennepin County.
What is the Median Population Age in Hennepin County?
Median Population Age in Hennepin County is 37.2 Years.
What is the Average Family Size in Hennepin County
Average Family Size in Hennepin County is 3.1 People.
What is the Average Household Size in Hennepin County
Average Household Size in Hennepin County is 2.4 People.
What is Per Capita Income in Hennepin County?
Per Capita income in Hennepin County is $55,199.
What is the Median Family Income in Hennepin County?
Median Family Income in Hennepin County is $126,404.
What is the Median Household income in Hennepin County?
Median Household Income in Hennepin County is $92,595.
What is Income or Wage Gap in Hennepin County?
Income or Wage Gap in Hennepin County is 21.9%.
Women in Hennepin County earn 78.1 cents for every dollar earned by a man.
What is Family Income Deficit in Hennepin County?
Family Income Deficit in Hennepin County is $10,656.
Families that are below poverty line in Hennepin County earn $10,656 less on average than the poverty threshold level.
What is Inequality or Gini Index in Hennepin County?
Inequality or Gini Index in Hennepin County is 0.48.
How Large is the Labor Force in Hennepin County?
There are 735,236 People in the Labor Forcein in Hennepin County.
What is the Percentage of People in the Labor Force in Hennepin County?
71.7% of People are in the Labor Force in Hennepin County.
What is the Unemployment Rate in Hennepin County?
Unemployment Rate in Hennepin County is 4.3%.