Freeborn County, MN
Freeborn County Map

Freeborn County Overview
30,857
TOTAL POPULATION
15,429
MALE POPULATION
15,428
FEMALE POPULATION
100.01
MALES / 100 FEMALES
99.99
FEMALES / 100 MALES
44.1
MEDIAN AGE
2.9
AVG FAMILY SIZE
2.4
AVG HOUSEHOLD SIZE
$36,751
PER CAPITA INCOME
$81,502
AVG FAMILY INCOME
$65,679
AVG HOUSEHOLD INCOME
25.1%
WAGE / INCOME GAP [ % ]
74.9¢/ $1
WAGE / INCOME GAP [ $ ]
$13,642
FAMILY INCOME DEFICIT
0.45
INEQUALITY / GINI INDEX
15,376
LABOR FORCE [ PEOPLE ]
62.0%
PERCENT IN LABOR FORCE
4.4%
UNEMPLOYMENT RATE
Freeborn County Area Codes
Race in Freeborn County
The most populous races in Freeborn County are White / Caucasian (26,387 | 85.5%), Hispanic or Latino (3,284 | 10.6%), and Two or more Races (2,035 | 6.6%).

| Race | # Population | % Population |
| Asian | 909 | 2.9% |
| Black / African American | 367 | 1.2% |
| Hawaiian / Pacific | 14 | 0.1% |
| Hispanic or Latino | 3,284 | 10.6% |
| Native / Alaskan | 106 | 0.3% |
| White / Caucasian | 26,387 | 85.5% |
| Two or more Races | 2,035 | 6.6% |
| Some other Race | 1,039 | 3.4% |
| Total | 30,857 | 100.0% |
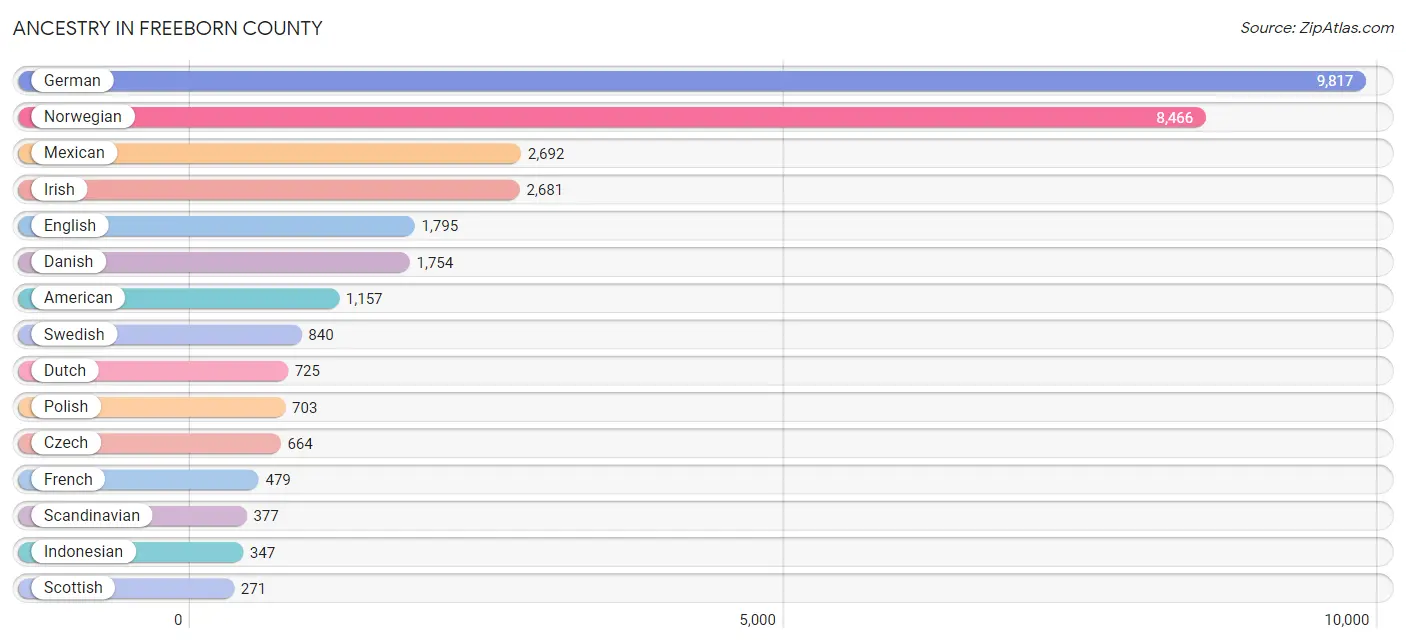
Ancestry in Freeborn County
The most populous ancestries reported in Freeborn County are German (9,817 | 31.8%), Norwegian (8,466 | 27.4%), Mexican (2,692 | 8.7%), Irish (2,681 | 8.7%), and English (1,795 | 5.8%), together accounting for 82.5% of all Freeborn County residents.
| Ancestry | # Population | % Population |
| American | 1,157 | 3.7% |
| Arab | 77 | 0.3% |
| Armenian | 1 | 0.0% |
| Austrian | 104 | 0.3% |
| Bangladeshi | 40 | 0.1% |
| Belgian | 63 | 0.2% |
| Bhutanese | 27 | 0.1% |
| Blackfeet | 10 | 0.0% |
| Brazilian | 4 | 0.0% |
| British | 86 | 0.3% |
| Burmese | 82 | 0.3% |
| Canadian | 1 | 0.0% |
| Celtic | 1 | 0.0% |
| Central American | 118 | 0.4% |
| Central American Indian | 4 | 0.0% |
| Cherokee | 86 | 0.3% |
| Chickasaw | 2 | 0.0% |
| Chippewa | 40 | 0.1% |
| Colombian | 115 | 0.4% |
| Creek | 10 | 0.0% |
| Croatian | 8 | 0.0% |
| Cuban | 115 | 0.4% |
| Czech | 664 | 2.1% |
| Czechoslovakian | 25 | 0.1% |
| Danish | 1,754 | 5.7% |
| Dominican | 14 | 0.1% |
| Dutch | 725 | 2.4% |
| Eastern European | 20 | 0.1% |
| Egyptian | 18 | 0.1% |
| English | 1,795 | 5.8% |
| European | 171 | 0.5% |
| Finnish | 75 | 0.2% |
| French | 479 | 1.5% |
| French Canadian | 162 | 0.5% |
| German | 9,817 | 31.8% |
| Greek | 5 | 0.0% |
| Guamanian / Chamorro | 14 | 0.1% |
| Guatemalan | 3 | 0.0% |
| Hungarian | 14 | 0.1% |
| Indian (Asian) | 16 | 0.1% |
| Indonesian | 347 | 1.1% |
| Irish | 2,681 | 8.7% |
| Italian | 238 | 0.8% |
| Japanese | 16 | 0.1% |
| Jordanian | 43 | 0.1% |
| Korean | 142 | 0.5% |
| Latvian | 24 | 0.1% |
| Lebanese | 14 | 0.1% |
| Lithuanian | 5 | 0.0% |
| Luxembourger | 3 | 0.0% |
| Malaysian | 90 | 0.3% |
| Mexican | 2,692 | 8.7% |
| Mexican American Indian | 45 | 0.2% |
| Nicaraguan | 101 | 0.3% |
| Northern European | 50 | 0.2% |
| Norwegian | 8,466 | 27.4% |
| Pakistani | 43 | 0.1% |
| Pennsylvania German | 18 | 0.1% |
| Peruvian | 58 | 0.2% |
| Polish | 703 | 2.3% |
| Portuguese | 4 | 0.0% |
| Potawatomi | 1 | 0.0% |
| Puerto Rican | 52 | 0.2% |
| Romanian | 12 | 0.0% |
| Russian | 84 | 0.3% |
| Salvadoran | 14 | 0.1% |
| Scandinavian | 377 | 1.2% |
| Scotch-Irish | 78 | 0.3% |
| Scottish | 271 | 0.9% |
| Sioux | 14 | 0.1% |
| South American | 175 | 0.6% |
| South American Indian | 7 | 0.0% |
| Spaniard | 38 | 0.1% |
| Spanish | 8 | 0.0% |
| Sri Lankan | 106 | 0.3% |
| Swedish | 840 | 2.7% |
| Swiss | 41 | 0.1% |
| Syrian | 2 | 0.0% |
| Thai | 33 | 0.1% |
| Ukrainian | 21 | 0.1% |
| Venezuelan | 1 | 0.0% |
| Welsh | 74 | 0.2% |
| Yugoslavian | 8 | 0.0% | View All 83 Rows |
Immigrants in Freeborn County
The most numerous immigrant groups reported in Freeborn County came from Latin America (748 | 2.4%), Central America (656 | 2.1%), Asia (640 | 2.1%), Mexico (573 | 1.9%), and South Eastern Asia (521 | 1.7%), together accounting for 10.2% of all Freeborn County residents.

| Immigration Origin | # Population | % Population |
| Africa | 24 | 0.1% |
| Asia | 640 | 2.1% |
| Austria | 1 | 0.0% |
| Bolivia | 3 | 0.0% |
| Brazil | 4 | 0.0% |
| Canada | 22 | 0.1% |
| Caribbean | 52 | 0.2% |
| Central America | 656 | 2.1% |
| China | 3 | 0.0% |
| Colombia | 1 | 0.0% |
| Cuba | 52 | 0.2% |
| Eastern Asia | 75 | 0.2% |
| Eastern Europe | 19 | 0.1% |
| Egypt | 4 | 0.0% |
| Europe | 72 | 0.2% |
| France | 2 | 0.0% |
| Germany | 9 | 0.0% |
| Guatemala | 3 | 0.0% |
| Guyana | 1 | 0.0% |
| Honduras | 9 | 0.0% |
| India | 19 | 0.1% |
| Ireland | 13 | 0.0% |
| Italy | 4 | 0.0% |
| Japan | 22 | 0.1% |
| Jordan | 21 | 0.1% |
| Korea | 50 | 0.2% |
| Laos | 18 | 0.1% |
| Latin America | 748 | 2.4% |
| Latvia | 2 | 0.0% |
| Mexico | 573 | 1.9% |
| Netherlands | 5 | 0.0% |
| Nicaragua | 71 | 0.2% |
| Northern Africa | 4 | 0.0% |
| Northern Europe | 32 | 0.1% |
| Norway | 11 | 0.0% |
| Oceania | 6 | 0.0% |
| Peru | 31 | 0.1% |
| Philippines | 43 | 0.1% |
| Saudi Arabia | 4 | 0.0% |
| South America | 40 | 0.1% |
| South Central Asia | 19 | 0.1% |
| South Eastern Asia | 521 | 1.7% |
| Southern Europe | 4 | 0.0% |
| Thailand | 147 | 0.5% |
| Ukraine | 9 | 0.0% |
| Vietnam | 32 | 0.1% |
| Western Africa | 20 | 0.1% |
| Western Asia | 25 | 0.1% |
| Western Europe | 17 | 0.1% | View All 49 Rows |
Sex and Age in Freeborn County
Sex and Age in Freeborn County
The most populous age groups in Freeborn County are 60 to 64 Years (1,334 | 8.6%) for men and 60 to 64 Years (1,196 | 7.7%) for women.

| Age Bracket | Male | Female |
| Under 5 Years | 844 (5.5%) | 842 (5.5%) |
| 5 to 9 Years | 996 (6.5%) | 847 (5.5%) |
| 10 to 14 Years | 1,010 (6.6%) | 1,008 (6.5%) |
| 15 to 19 Years | 941 (6.1%) | 842 (5.5%) |
| 20 to 24 Years | 748 (4.9%) | 820 (5.3%) |
| 25 to 29 Years | 857 (5.6%) | 829 (5.4%) |
| 30 to 34 Years | 799 (5.2%) | 804 (5.2%) |
| 35 to 39 Years | 938 (6.1%) | 843 (5.5%) |
| 40 to 44 Years | 831 (5.4%) | 855 (5.5%) |
| 45 to 49 Years | 863 (5.6%) | 808 (5.2%) |
| 50 to 54 Years | 1,054 (6.8%) | 886 (5.7%) |
| 55 to 59 Years | 1,037 (6.7%) | 1,125 (7.3%) |
| 60 to 64 Years | 1,334 (8.6%) | 1,196 (7.7%) |
| 65 to 69 Years | 1,075 (7.0%) | 957 (6.2%) |
| 70 to 74 Years | 787 (5.1%) | 883 (5.7%) |
| 75 to 79 Years | 529 (3.4%) | 475 (3.1%) |
| 80 to 84 Years | 466 (3.0%) | 527 (3.4%) |
| 85 Years and over | 320 (2.1%) | 881 (5.7%) |
| Total | 15,429 (100.0%) | 15,428 (100.0%) |
Families and Households in Freeborn County
Median Family Size in Freeborn County
The median family size in Freeborn County is 2.91 persons per family, with single male/father families (841 | 10.4%) accounting for the largest median family size of 3.12 persons per family. On the other hand, married-couple families (6,087 | 75.4%) represent the smallest median family size with 2.88 persons per family.

| Family Type | # Families | Family Size |
| Married-Couple | 6,087 (75.4%) | 2.88 |
| Single Male/Father | 841 (10.4%) | 3.12 |
| Single Female/Mother | 1,145 (14.2%) | 2.93 |
| Total Families | 8,073 (100.0%) | 2.91 |
Median Household Size in Freeborn County
The median household size in Freeborn County is 2.35 persons per household, with single male/father households (841 | 6.5%) accounting for the largest median household size of 3.68 persons per household. non-family households (4,817 | 37.4%) represent the smallest median household size with 1.20 persons per household.

| Household Type | # Households | Household Size |
| Married-Couple | 6,087 (47.2%) | 2.90 |
| Single Male/Father | 841 (6.5%) | 3.68 |
| Single Female/Mother | 1,145 (8.9%) | 3.31 |
| Non-family | 4,817 (37.4%) | 1.20 |
| Total Households | 12,890 (100.0%) | 2.35 |
Household Size by Marriage Status in Freeborn County
Out of a total of 12,890 households in Freeborn County, 8,073 (62.6%) are family households, while 4,817 (37.4%) are nonfamily households. The most numerous type of family households are 2-person households, comprising 4,134, and the most common type of nonfamily households are 1-person households, comprising 4,079.

| Household Size | Family Households | Nonfamily Households |
| 1-Person Households | - | 4,079 (31.6%) |
| 2-Person Households | 4,134 (32.1%) | 671 (5.2%) |
| 3-Person Households | 1,501 (11.6%) | 55 (0.4%) |
| 4-Person Households | 1,335 (10.4%) | 10 (0.1%) |
| 5-Person Households | 659 (5.1%) | 2 (0.0%) |
| 6-Person Households | 340 (2.6%) | 0 (0.0%) |
| 7+ Person Households | 104 (0.8%) | 0 (0.0%) |
| Total | 8,073 (62.6%) | 4,817 (37.4%) |
Female Fertility in Freeborn County
Fertility by Age in Freeborn County
Average fertility rate in Freeborn County is 71.0 births per 1,000 women. Women in the age bracket of 20 to 34 years have the highest fertility rate with 137.0 births per 1,000 women. Women in the age bracket of 20 to 34 years acount for 79.6% of all women with births.

| Age Bracket | Women with Births | Births / 1,000 Women |
| 15 to 19 years | 2 (0.5%) | 2.0 |
| 20 to 34 years | 336 (79.6%) | 137.0 |
| 35 to 50 years | 84 (19.9%) | 31.0 |
| Total | 422 (100.0%) | 71.0 |
Fertility by Age by Marriage Status in Freeborn County
60.9% of women with births (422) in Freeborn County are married. The highest percentage of unmarried women with births falls into 15 to 19 years age bracket with 100.0% of them unmarried at the time of birth, while the lowest percentage of unmarried women with births belong to 35 to 50 years age bracket with 15.5% of them unmarried.

| Age Bracket | Married | Unmarried |
| 15 to 19 years | 0 (0.0%) | 2 (100.0%) |
| 20 to 34 years | 186 (55.4%) | 150 (44.6%) |
| 35 to 50 years | 71 (84.5%) | 13 (15.5%) |
| Total | 257 (60.9%) | 165 (39.1%) |
Fertility by Education in Freeborn County
Average fertility rate in Freeborn County is 71.0 births per 1,000 women. Women with the education attainment of bachelor's degree have the highest fertility rate of 113.0 births per 1,000 women, while women with the education attainment of high school diploma have the lowest fertility at 59.0 births per 1,000 women. Women with the education attainment of college or associate's degree represent 34.1% of all women with births.

| Educational Attainment | Women with Births | Births / 1,000 Women |
| Less than High School | 78 (18.5%) | 67.0 |
| High School Diploma | 82 (19.4%) | 59.0 |
| College or Associate's Degree | 144 (34.1%) | 64.0 |
| Bachelor's Degree | 92 (21.8%) | 113.0 |
| Graduate Degree | 26 (6.2%) | 77.0 |
| Total | 422 (100.0%) | 71.0 |
Fertility by Education by Marriage Status in Freeborn County
39.1% of women with births in Freeborn County are unmarried. Women with the educational attainment of graduate degree are most likely to be married with 100.0% of them married at childbirth, while women with the educational attainment of high school diploma are least likely to be married with 67.1% of them unmarried at childbirth.

| Educational Attainment | Married | Unmarried |
| Less than High School | 30 (38.5%) | 48 (61.5%) |
| High School Diploma | 27 (32.9%) | 55 (67.1%) |
| College or Associate's Degree | 91 (63.2%) | 53 (36.8%) |
| Bachelor's Degree | 83 (90.2%) | 9 (9.8%) |
| Graduate Degree | 26 (100.0%) | 0 (0.0%) |
| Total | 257 (60.9%) | 165 (39.1%) |
Income in Freeborn County
Income Overview in Freeborn County
Per Capita Income in Freeborn County is $36,751, while median incomes of families and households are $81,502 and $65,679 respectively.
| Characteristic | Number | Measure |
| Per Capita Income | 30,857 | $36,751 |
| Median Family Income | 8,073 | $81,502 |
| Mean Family Income | 8,073 | $104,517 |
| Median Household Income | 12,890 | $65,679 |
| Mean Household Income | 12,890 | $86,121 |
| Income Deficit | 8,073 | $13,642 |
| Wage / Income Gap (%) | 30,857 | 25.12% |
| Wage / Income Gap ($) | 30,857 | 74.88¢ per $1 |
| Gini / Inequality Index | 30,857 | 0.45 |
Earnings by Sex in Freeborn County
Average Earnings in Freeborn County are $41,769, $47,578 for men and $35,625 for women, a difference of 25.1%.

| Sex | Number | Average Earnings |
| Male | 8,660 (53.8%) | $47,578 |
| Female | 7,429 (46.2%) | $35,625 |
| Total | 16,089 (100.0%) | $41,769 |
Earnings by Sex by Income Bracket in Freeborn County
The most common earnings brackets in Freeborn County are $55,000 to $64,999 for men (1,010 | 11.7%) and $25,000 to $29,999 for women (769 | 10.3%).

| Income | Male | Female |
| $2,499 or less | 305 (3.5%) | 350 (4.7%) |
| $2,500 to $4,999 | 175 (2.0%) | 298 (4.0%) |
| $5,000 to $7,499 | 217 (2.5%) | 316 (4.3%) |
| $7,500 to $9,999 | 254 (2.9%) | 202 (2.7%) |
| $10,000 to $12,499 | 244 (2.8%) | 220 (3.0%) |
| $12,500 to $14,999 | 172 (2.0%) | 204 (2.8%) |
| $15,000 to $17,499 | 190 (2.2%) | 222 (3.0%) |
| $17,500 to $19,999 | 180 (2.1%) | 186 (2.5%) |
| $20,000 to $22,499 | 130 (1.5%) | 150 (2.0%) |
| $22,500 to $24,999 | 245 (2.8%) | 234 (3.2%) |
| $25,000 to $29,999 | 366 (4.2%) | 769 (10.3%) |
| $30,000 to $34,999 | 394 (4.5%) | 468 (6.3%) |
| $35,000 to $39,999 | 470 (5.4%) | 635 (8.6%) |
| $40,000 to $44,999 | 534 (6.2%) | 565 (7.6%) |
| $45,000 to $49,999 | 732 (8.5%) | 453 (6.1%) |
| $50,000 to $54,999 | 482 (5.6%) | 350 (4.7%) |
| $55,000 to $64,999 | 1,010 (11.7%) | 455 (6.1%) |
| $65,000 to $74,999 | 714 (8.2%) | 396 (5.3%) |
| $75,000 to $99,999 | 985 (11.4%) | 515 (6.9%) |
| $100,000+ | 861 (9.9%) | 441 (5.9%) |
| Total | 8,660 (100.0%) | 7,429 (100.0%) |
Earnings by Sex by Educational Attainment in Freeborn County
Average earnings in Freeborn County are $51,875 for men and $39,065 for women, a difference of 24.7%. Men with an educational attainment of graduate degree enjoy the highest average annual earnings of $81,250, while those with less than high school education earn the least with $39,224. Women with an educational attainment of graduate degree earn the most with the average annual earnings of $68,500, while those with less than high school education have the smallest earnings of $28,095.

| Educational Attainment | Male Income | Female Income |
| Less than High School | $39,224 | $28,095 |
| High School Diploma | $48,150 | $34,901 |
| College or Associate's Degree | $55,183 | $38,158 |
| Bachelor's Degree | $58,652 | $48,906 |
| Graduate Degree | $81,250 | $68,500 |
| Total | $51,875 | $39,065 |
Family Income in Freeborn County
Family Income Brackets in Freeborn County
According to the Freeborn County family income data, there are 1,808 families falling into the $100,000 to $149,999 income range, which is the most common income bracket and makes up 22.4% of all families. Conversely, the $10,000 to $14,999 income bracket is the least frequent group with only 48 families (0.6%) belonging to this category.

| Income Bracket | # Families | % Families |
| Less than $10,000 | 218 | 2.7% |
| $10,000 to $14,999 | 48 | 0.6% |
| $15,000 to $24,999 | 307 | 3.8% |
| $25,000 to $34,999 | 614 | 7.6% |
| $35,000 to $49,999 | 880 | 10.9% |
| $50,000 to $74,999 | 1,671 | 20.7% |
| $75,000 to $99,999 | 1,227 | 15.2% |
| $100,000 to $149,999 | 1,808 | 22.4% |
| $150,000 to $199,999 | 702 | 8.7% |
| $200,000+ | 589 | 7.3% |
Family Income by Famaliy Size in Freeborn County
4-person families (1,251 | 15.5%) account for the highest median family income in Freeborn County with $104,464 per family, while 2-person families (4,391 | 54.4%) have the highest median income of $36,438 per family member.

| Income Bracket | # Families | Median Income |
| 2-Person Families | 4,391 (54.4%) | $72,877 |
| 3-Person Families | 1,499 (18.6%) | $84,088 |
| 4-Person Families | 1,251 (15.5%) | $104,464 |
| 5-Person Families | 603 (7.5%) | $94,028 |
| 6-Person Families | 270 (3.3%) | $92,500 |
| 7+ Person Families | 59 (0.7%) | $0 |
| Total | 8,073 (100.0%) | $81,502 |
Family Income by Number of Earners in Freeborn County
The median family income in Freeborn County is $81,502, with families comprising 3+ earners (825) having the highest median family income of $134,821, while families with no earners (1,511) have the lowest median family income of $50,579, accounting for 10.2% and 18.7% of families, respectively.

| Number of Earners | # Families | Median Income |
| No Earners | 1,511 (18.7%) | $50,579 |
| 1 Earner | 2,354 (29.2%) | $59,219 |
| 2 Earners | 3,383 (41.9%) | $104,570 |
| 3+ Earners | 825 (10.2%) | $134,821 |
| Total | 8,073 (100.0%) | $81,502 |
Household Income in Freeborn County
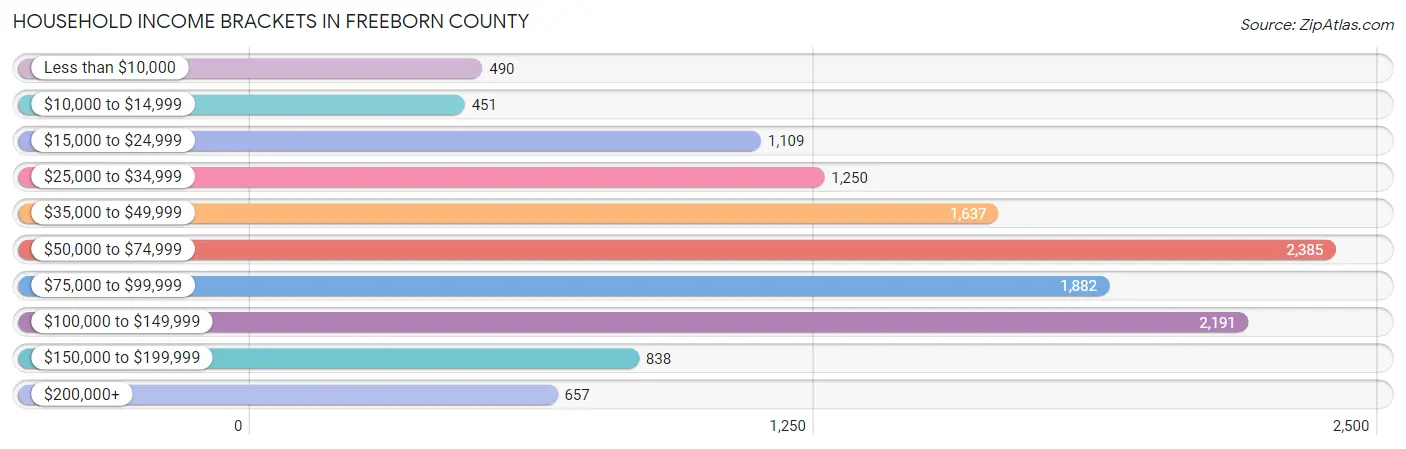
Household Income Brackets in Freeborn County
With 2,385 households falling in the category, the $50,000 to $74,999 income range is the most frequent in Freeborn County, accounting for 18.5% of all households. In contrast, only 451 households (3.5%) fall into the $10,000 to $14,999 income bracket, making it the least populous group.
| Income Bracket | # Households | % Households |
| Less than $10,000 | 490 | 3.8% |
| $10,000 to $14,999 | 451 | 3.5% |
| $15,000 to $24,999 | 1,109 | 8.6% |
| $25,000 to $34,999 | 1,250 | 9.7% |
| $35,000 to $49,999 | 1,637 | 12.7% |
| $50,000 to $74,999 | 2,385 | 18.5% |
| $75,000 to $99,999 | 1,882 | 14.6% |
| $100,000 to $149,999 | 2,191 | 17.0% |
| $150,000 to $199,999 | 838 | 6.5% |
| $200,000+ | 657 | 5.1% |
Household Income by Householder Age in Freeborn County
The median household income in Freeborn County is $65,679, with the highest median household income of $79,874 found in the 45 to 64 years age bracket for the primary householder. A total of 4,858 households (37.7%) fall into this category. Meanwhile, the 65+ years age bracket for the primary householder has the lowest median household income of $45,694, with 4,408 households (34.2%) in this group.

| Income Bracket | # Households | Median Income |
| 15 to 24 Years | 253 (2.0%) | $52,250 |
| 25 to 44 Years | 3,371 (26.2%) | $74,531 |
| 45 to 64 Years | 4,858 (37.7%) | $79,874 |
| 65+ Years | 4,408 (34.2%) | $45,694 |
| Total | 12,890 (100.0%) | $65,679 |
Poverty in Freeborn County
Income Below Poverty by Sex and Age in Freeborn County
With 8.3% poverty level for males and 10.8% for females among the residents of Freeborn County, 15 year old males and 5 year old females are the most vulnerable to poverty, with 39 males (15.6%) and 91 females (48.9%) in their respective age groups living below the poverty level.

| Age Bracket | Male | Female |
| Under 5 Years | 83 (10.5%) | 138 (16.7%) |
| 5 Years | 20 (10.2%) | 91 (48.9%) |
| 6 to 11 Years | 171 (15.0%) | 117 (10.5%) |
| 12 to 14 Years | 29 (4.5%) | 40 (7.3%) |
| 15 Years | 39 (15.6%) | 55 (21.2%) |
| 16 and 17 Years | 18 (5.3%) | 29 (8.4%) |
| 18 to 24 Years | 120 (11.5%) | 123 (11.6%) |
| 25 to 34 Years | 77 (4.7%) | 252 (15.4%) |
| 35 to 44 Years | 97 (5.5%) | 186 (11.0%) |
| 45 to 54 Years | 264 (13.8%) | 162 (9.6%) |
| 55 to 64 Years | 206 (8.8%) | 155 (6.7%) |
| 65 to 74 Years | 97 (5.2%) | 135 (7.4%) |
| 75 Years and over | 40 (3.2%) | 151 (9.0%) |
| Total | 1,261 (8.3%) | 1,634 (10.8%) |
Income Above Poverty by Sex and Age in Freeborn County
According to the poverty statistics in Freeborn County, males aged 75 years and over and females aged 55 to 64 years are the age groups that are most secure financially, with 96.8% of males and 93.3% of females in these age groups living above the poverty line.

| Age Bracket | Male | Female |
| Under 5 Years | 705 (89.5%) | 690 (83.3%) |
| 5 Years | 176 (89.8%) | 95 (51.1%) |
| 6 to 11 Years | 971 (85.0%) | 1,000 (89.5%) |
| 12 to 14 Years | 611 (95.5%) | 508 (92.7%) |
| 15 Years | 211 (84.4%) | 204 (78.8%) |
| 16 and 17 Years | 320 (94.7%) | 316 (91.6%) |
| 18 to 24 Years | 928 (88.5%) | 935 (88.4%) |
| 25 to 34 Years | 1,550 (95.3%) | 1,381 (84.6%) |
| 35 to 44 Years | 1,656 (94.5%) | 1,512 (89.0%) |
| 45 to 54 Years | 1,645 (86.2%) | 1,532 (90.4%) |
| 55 to 64 Years | 2,141 (91.2%) | 2,166 (93.3%) |
| 65 to 74 Years | 1,752 (94.8%) | 1,686 (92.6%) |
| 75 Years and over | 1,227 (96.8%) | 1,517 (90.9%) |
| Total | 13,893 (91.7%) | 13,542 (89.2%) |
Income Below Poverty Among Married-Couple Families in Freeborn County
The poverty statistics for married-couple families in Freeborn County show that 2.2% or 136 of the total 6,087 families live below the poverty line. Families with 5 or more children have the highest poverty rate of 16.0%, comprising of 4 families. On the other hand, families with no children have the lowest poverty rate of 1.8%, which includes 72 families.

| Children | Above Poverty | Below Poverty |
| No Children | 3,969 (98.2%) | 72 (1.8%) |
| 1 or 2 Children | 1,441 (97.1%) | 43 (2.9%) |
| 3 or 4 Children | 520 (96.8%) | 17 (3.2%) |
| 5 or more Children | 21 (84.0%) | 4 (16.0%) |
| Total | 5,951 (97.8%) | 136 (2.2%) |
Income Below Poverty Among Single-Parent Households in Freeborn County
According to the poverty data in Freeborn County, 11.1% or 93 single-father households and 20.1% or 230 single-mother households are living below the poverty line. Among single-father households, those with 3 or 4 children have the highest poverty rate, with 69 households (42.1%) experiencing poverty. Likewise, among single-mother households, those with 5 or more children have the highest poverty rate, with 9 households (100.0%) falling below the poverty line.

| Children | Single Father | Single Mother |
| No Children | 5 (1.9%) | 46 (14.5%) |
| 1 or 2 Children | 19 (4.9%) | 126 (19.1%) |
| 3 or 4 Children | 69 (42.1%) | 49 (30.8%) |
| 5 or more Children | 0 (0.0%) | 9 (100.0%) |
| Total | 93 (11.1%) | 230 (20.1%) |
Income Below Poverty Among Married-Couple vs Single-Parent Households in Freeborn County
The poverty data for Freeborn County shows that 136 of the married-couple family households (2.2%) and 323 of the single-parent households (16.3%) are living below the poverty level. Within the married-couple family households, those with 5 or more children have the highest poverty rate, with 4 households (16.0%) falling below the poverty line. Among the single-parent households, those with 3 or 4 children have the highest poverty rate, with 118 household (36.5%) living below poverty.

| Children | Married-Couple Families | Single-Parent Households |
| No Children | 72 (1.8%) | 51 (8.9%) |
| 1 or 2 Children | 43 (2.9%) | 145 (13.9%) |
| 3 or 4 Children | 17 (3.2%) | 118 (36.5%) |
| 5 or more Children | 4 (16.0%) | 9 (20.9%) |
| Total | 136 (2.2%) | 323 (16.3%) |
Employment Characteristics in Freeborn County
Employment by Class of Employer in Freeborn County
Among the 14,440 employed individuals in Freeborn County, private company employees (9,482 | 65.7%), not-for-profit organizations (1,695 | 11.7%), and self-employed (not incorporated) (1,140 | 7.9%) make up the most common classes of employment.

| Employer Class | # Employees | % Employees |
| Private Company Employees | 9,482 | 65.7% |
| Self-Employed (Incorporated) | 539 | 3.7% |
| Self-Employed (Not Incorporated) | 1,140 | 7.9% |
| Not-for-profit Organizations | 1,695 | 11.7% |
| Local Government Employees | 1,101 | 7.6% |
| State Government Employees | 263 | 1.8% |
| Federal Government Employees | 171 | 1.2% |
| Unpaid Family Workers | 49 | 0.3% |
| Total | 14,440 | 100.0% |
Employment Status by Age in Freeborn County
According to the labor force statistics for Freeborn County, out of the total population over 16 years of age (24,800), 62.0% or 15,376 individuals are in the labor force, with 4.4% or 677 of them unemployed. The age group with the highest labor force participation rate is 30 to 34 years, with 86.5% or 1,387 individuals in the labor force. Within the labor force, the 16 to 19 years age range has the highest percentage of unemployed individuals, with 17.1% or 104 of them being unemployed.

| Age Bracket | In Labor Force | Unemployed |
| 16 to 19 Years | 608 (47.8%) | 104 (17.1%) |
| 20 to 24 Years | 1,303 (83.1%) | 120 (9.2%) |
| 25 to 29 Years | 1,383 (82.0%) | 57 (4.1%) |
| 30 to 34 Years | 1,387 (86.5%) | 58 (4.2%) |
| 35 to 44 Years | 2,982 (86.0%) | 119 (4.0%) |
| 45 to 54 Years | 3,091 (85.6%) | 99 (3.2%) |
| 55 to 59 Years | 1,853 (85.7%) | 48 (2.6%) |
| 60 to 64 Years | 1,665 (65.8%) | 45 (2.7%) |
| 65 to 74 Years | 914 (24.7%) | 18 (2.0%) |
| 75 Years and over | 189 (5.9%) | 0 (0.0%) |
| Total | 15,376 (62.0%) | 677 (4.4%) |
Employment Status by Educational Attainment in Freeborn County
According to labor force statistics for Freeborn County, 82.1% of individuals (12,363) out of the total population between 25 and 64 years of age (15,059) are in the labor force, with 3.5% or 433 of them being unemployed. The group with the highest labor force participation rate are those with the educational attainment of bachelor's degree or higher, with 90.2% or 2,315 individuals in the labor force. Within the labor force, individuals with less than high school education have the highest percentage of unemployment, with 9.9% or 112 of them being unemployed.

| Educational Attainment | In Labor Force | Unemployed |
| Less than High School | 1,130 (65.9%) | 170 (9.9%) |
| High School Diploma | 3,480 (77.2%) | 158 (3.5%) |
| College / Associate Degree | 5,437 (86.7%) | 169 (2.7%) |
| Bachelor's Degree or higher | 2,315 (90.2%) | 54 (2.1%) |
| Total | 12,363 (82.1%) | 527 (3.5%) |
Employment Occupations by Sex in Freeborn County
Management, Business, Science and Arts Occupations
The most common Management, Business, Science and Arts occupations in Freeborn County are Management (1,477 | 10.1%), Community & Social Service (1,086 | 7.4%), Health Diagnosing & Treating (928 | 6.3%), Education Instruction & Library (676 | 4.6%), and Health Technologists (555 | 3.8%).

Management, Business, Science and Arts Occupations by Sex
Within the Management, Business, Science and Arts occupations in Freeborn County, the most male-oriented occupations are Architecture & Engineering (90.5%), Life, Physical & Social Science (78.0%), and Computers, Engineering & Science (77.1%), while the most female-oriented occupations are Health Diagnosing & Treating (87.4%), Health Technologists (84.3%), and Education Instruction & Library (83.9%).

| Occupation | Male | Female |
| Management | 1,022 (69.2%) | 455 (30.8%) |
| Business & Financial | 173 (33.2%) | 348 (66.8%) |
| Computers, Engineering & Science | 324 (77.1%) | 96 (22.9%) |
| Computers & Mathematics | 145 (68.7%) | 66 (31.3%) |
| Architecture & Engineering | 115 (90.5%) | 12 (9.5%) |
| Life, Physical & Social Science | 64 (78.0%) | 18 (22.0%) |
| Community & Social Service | 269 (24.8%) | 817 (75.2%) |
| Education, Arts & Media | 100 (40.2%) | 149 (59.8%) |
| Legal Services & Support | 18 (56.2%) | 14 (43.8%) |
| Education Instruction & Library | 109 (16.1%) | 567 (83.9%) |
| Arts, Media & Entertainment | 42 (32.6%) | 87 (67.4%) |
| Health Diagnosing & Treating | 117 (12.6%) | 811 (87.4%) |
| Health Technologists | 87 (15.7%) | 468 (84.3%) |
| Total (Category) | 1,905 (43.0%) | 2,527 (57.0%) |
| Total (Overall) | 7,759 (52.8%) | 6,936 (47.2%) |
Services Occupations
The most common Services occupations in Freeborn County are Healthcare Support (658 | 4.5%), Food Preparation & Serving (585 | 4.0%), Cleaning & Maintenance (533 | 3.6%), Personal Care & Service (405 | 2.8%), and Security & Protection (131 | 0.9%).

Services Occupations by Sex
Within the Services occupations in Freeborn County, the most male-oriented occupations are Law Enforcement (77.5%), Security & Protection (74.1%), and Cleaning & Maintenance (69.8%), while the most female-oriented occupations are Healthcare Support (91.9%), Personal Care & Service (89.1%), and Food Preparation & Serving (84.3%).

| Occupation | Male | Female |
| Healthcare Support | 53 (8.1%) | 605 (91.9%) |
| Security & Protection | 97 (74.1%) | 34 (26.0%) |
| Firefighting & Prevention | 35 (68.6%) | 16 (31.4%) |
| Law Enforcement | 62 (77.5%) | 18 (22.5%) |
| Food Preparation & Serving | 92 (15.7%) | 493 (84.3%) |
| Cleaning & Maintenance | 372 (69.8%) | 161 (30.2%) |
| Personal Care & Service | 44 (10.9%) | 361 (89.1%) |
| Total (Category) | 658 (28.5%) | 1,654 (71.5%) |
| Total (Overall) | 7,759 (52.8%) | 6,936 (47.2%) |
Sales and Office Occupations
The most common Sales and Office occupations in Freeborn County are Office & Administration (1,688 | 11.5%), and Sales & Related (1,199 | 8.2%).

Sales and Office Occupations by Sex

| Occupation | Male | Female |
| Sales & Related | 636 (53.0%) | 563 (47.0%) |
| Office & Administration | 323 (19.1%) | 1,365 (80.9%) |
| Total (Category) | 959 (33.2%) | 1,928 (66.8%) |
| Total (Overall) | 7,759 (52.8%) | 6,936 (47.2%) |
Natural Resources, Construction and Maintenance Occupations
The most common Natural Resources, Construction and Maintenance occupations in Freeborn County are Construction & Extraction (771 | 5.2%), Installation, Maintenance & Repair (730 | 5.0%), and Farming, Fishing & Forestry (128 | 0.9%).

Natural Resources, Construction and Maintenance Occupations by Sex

| Occupation | Male | Female |
| Farming, Fishing & Forestry | 120 (93.8%) | 8 (6.2%) |
| Construction & Extraction | 764 (99.1%) | 7 (0.9%) |
| Installation, Maintenance & Repair | 727 (99.6%) | 3 (0.4%) |
| Total (Category) | 1,611 (98.9%) | 18 (1.1%) |
| Total (Overall) | 7,759 (52.8%) | 6,936 (47.2%) |
Production, Transportation and Moving Occupations
The most common Production, Transportation and Moving occupations in Freeborn County are Production (1,987 | 13.5%), Material Moving (795 | 5.4%), and Transportation (653 | 4.4%).

Production, Transportation and Moving Occupations by Sex

| Occupation | Male | Female |
| Production | 1,415 (71.2%) | 572 (28.8%) |
| Transportation | 614 (94.0%) | 39 (6.0%) |
| Material Moving | 597 (75.1%) | 198 (24.9%) |
| Total (Category) | 2,626 (76.4%) | 809 (23.5%) |
| Total (Overall) | 7,759 (52.8%) | 6,936 (47.2%) |
Employment Industries by Sex in Freeborn County
Employment Industries in Freeborn County
The major employment industries in Freeborn County include Manufacturing (3,152 | 21.4%), Health Care & Social Assistance (2,358 | 16.1%), Retail Trade (1,755 | 11.9%), Construction (991 | 6.7%), and Educational Services (885 | 6.0%).

Employment Industries by Sex in Freeborn County
The Freeborn County industries that see more men than women are Mining, Quarrying, & Extraction (100.0%), Enterprise Management (95.5%), and Construction (94.3%), whereas the industries that tend to have a higher number of women are Health Care & Social Assistance (86.9%), Educational Services (80.3%), and Finance & Insurance (72.0%).

| Industry | Male | Female |
| Agriculture, Fishing & Hunting | 579 (84.3%) | 108 (15.7%) |
| Mining, Quarrying, & Extraction | 12 (100.0%) | 0 (0.0%) |
| Construction | 934 (94.3%) | 57 (5.8%) |
| Manufacturing | 2,234 (70.9%) | 918 (29.1%) |
| Wholesale Trade | 286 (76.5%) | 88 (23.5%) |
| Retail Trade | 812 (46.3%) | 943 (53.7%) |
| Transportation & Warehousing | 604 (87.8%) | 84 (12.2%) |
| Utilities | 112 (75.2%) | 37 (24.8%) |
| Information | 140 (77.3%) | 41 (22.7%) |
| Finance & Insurance | 126 (28.0%) | 324 (72.0%) |
| Real Estate, Rental & Leasing | 25 (47.2%) | 28 (52.8%) |
| Professional & Scientific | 129 (41.9%) | 179 (58.1%) |
| Enterprise Management | 21 (95.5%) | 1 (4.5%) |
| Administrative & Support | 318 (61.9%) | 196 (38.1%) |
| Educational Services | 174 (19.7%) | 711 (80.3%) |
| Health Care & Social Assistance | 310 (13.2%) | 2,048 (86.9%) |
| Arts, Entertainment & Recreation | 110 (44.5%) | 137 (55.5%) |
| Accommodation & Food Services | 271 (39.9%) | 409 (60.2%) |
| Public Administration | 192 (43.4%) | 250 (56.6%) |
| Total | 7,759 (52.8%) | 6,936 (47.2%) |
Education in Freeborn County
School Enrollment in Freeborn County
The most common levels of schooling among the 6,625 students in Freeborn County are high school (1,638 | 24.7%), middle school (1,625 | 24.5%), and elementary school (1,371 | 20.7%).

| School Level | # Students | % Students |
| Nursery / Preschool | 448 | 6.8% |
| Kindergarten | 382 | 5.8% |
| Elementary School | 1,371 | 20.7% |
| Middle School | 1,625 | 24.5% |
| High School | 1,638 | 24.7% |
| College / Undergraduate | 1,002 | 15.1% |
| Graduate / Professional | 159 | 2.4% |
| Total | 6,625 | 100.0% |
School Enrollment by Age by Funding Source in Freeborn County
Out of a total of 6,625 students who are enrolled in schools in Freeborn County, 543 (8.2%) attend a private institution, while the remaining 6,082 (91.8%) are enrolled in public schools. The age group of 20 to 24 year olds has the highest likelihood of being enrolled in private schools, with 95 (20.2% in the age bracket) enrolled. Conversely, the age group of 15 to 17 year olds has the lowest likelihood of being enrolled in a private school, with 1,126 (96.0% in the age bracket) attending a public institution.

| Age Bracket | Public School | Private School |
| 3 to 4 Year Olds | 288 (83.0%) | 59 (17.0%) |
| 5 to 9 Year Old | 1,561 (93.1%) | 116 (6.9%) |
| 10 to 14 Year Olds | 1,871 (94.0%) | 120 (6.0%) |
| 15 to 17 Year Olds | 1,126 (96.0%) | 47 (4.0%) |
| 18 to 19 Year Olds | 316 (92.9%) | 24 (7.1%) |
| 20 to 24 Year Olds | 376 (79.8%) | 95 (20.2%) |
| 25 to 34 Year Olds | 268 (93.1%) | 20 (6.9%) |
| 35 Years and over | 278 (82.3%) | 60 (17.7%) |
| Total | 6,082 (91.8%) | 543 (8.2%) |
Educational Attainment by Field of Study in Freeborn County
Education (937 | 22.9%), business (657 | 16.1%), science & technology (455 | 11.1%), bio, nature & agricultural (361 | 8.8%), and arts & humanities (295 | 7.2%) are the most common fields of study among 4,088 individuals in Freeborn County who have obtained a bachelor's degree or higher.

| Field of Study | # Graduates | % Graduates |
| Computers & Mathematics | 139 | 3.4% |
| Bio, Nature & Agricultural | 361 | 8.8% |
| Physical & Health Sciences | 149 | 3.6% |
| Psychology | 122 | 3.0% |
| Social Sciences | 215 | 5.3% |
| Engineering | 189 | 4.6% |
| Multidisciplinary Studies | 29 | 0.7% |
| Science & Technology | 455 | 11.1% |
| Business | 657 | 16.1% |
| Education | 937 | 22.9% |
| Literature & Languages | 83 | 2.0% |
| Liberal Arts & History | 193 | 4.7% |
| Visual & Performing Arts | 138 | 3.4% |
| Communications | 126 | 3.1% |
| Arts & Humanities | 295 | 7.2% |
| Total | 4,088 | 100.0% |
Transportation & Commute in Freeborn County
Vehicle Availability by Sex in Freeborn County
The most prevalent vehicle ownership categories in Freeborn County are males with 2 vehicles (3,119, accounting for 40.9%) and females with 2 vehicles (2,432, making up 45.9%).

| Vehicles Available | Male | Female |
| No Vehicle | 288 (3.8%) | 102 (1.5%) |
| 1 Vehicle | 1,008 (13.2%) | 1,097 (16.1%) |
| 2 Vehicles | 3,119 (40.9%) | 2,432 (35.8%) |
| 3 Vehicles | 1,905 (25.0%) | 1,969 (29.0%) |
| 4 Vehicles | 900 (11.8%) | 835 (12.3%) |
| 5 or more Vehicles | 409 (5.4%) | 360 (5.3%) |
| Total | 7,629 (100.0%) | 6,795 (100.0%) |
Commute Time in Freeborn County
The most frequently occuring commute durations in Freeborn County are 5 to 9 minutes (2,842 commuters, 21.1%), 10 to 14 minutes (2,763 commuters, 20.5%), and 15 to 19 minutes (1,863 commuters, 13.8%).

| Commute Time | # Commuters | % Commuters |
| Less than 5 Minutes | 881 | 6.6% |
| 5 to 9 Minutes | 2,842 | 21.1% |
| 10 to 14 Minutes | 2,763 | 20.5% |
| 15 to 19 Minutes | 1,863 | 13.8% |
| 20 to 24 Minutes | 1,496 | 11.1% |
| 25 to 29 Minutes | 748 | 5.6% |
| 30 to 34 Minutes | 963 | 7.2% |
| 35 to 39 Minutes | 406 | 3.0% |
| 40 to 44 Minutes | 246 | 1.8% |
| 45 to 59 Minutes | 436 | 3.2% |
| 60 to 89 Minutes | 451 | 3.4% |
| 90 or more Minutes | 363 | 2.7% |
Commute Time by Sex in Freeborn County
The most common commute times in Freeborn County are 10 to 14 minutes (1,463 commuters, 20.2%) for males and 5 to 9 minutes (1,474 commuters, 23.8%) for females.

| Commute Time | Male | Female |
| Less than 5 Minutes | 579 (8.0%) | 302 (4.9%) |
| 5 to 9 Minutes | 1,368 (18.9%) | 1,474 (23.8%) |
| 10 to 14 Minutes | 1,463 (20.2%) | 1,300 (21.0%) |
| 15 to 19 Minutes | 940 (13.0%) | 923 (14.9%) |
| 20 to 24 Minutes | 726 (10.0%) | 770 (12.4%) |
| 25 to 29 Minutes | 393 (5.4%) | 355 (5.7%) |
| 30 to 34 Minutes | 527 (7.3%) | 436 (7.0%) |
| 35 to 39 Minutes | 269 (3.7%) | 137 (2.2%) |
| 40 to 44 Minutes | 134 (1.8%) | 112 (1.8%) |
| 45 to 59 Minutes | 270 (3.7%) | 166 (2.7%) |
| 60 to 89 Minutes | 275 (3.8%) | 176 (2.8%) |
| 90 or more Minutes | 311 (4.3%) | 52 (0.8%) |
Time of Departure to Work by Sex in Freeborn County
The most frequent times of departure to work in Freeborn County are 7:00 AM to 7:29 AM (1,044, 14.4%) for males and 7:30 AM to 7:59 AM (980, 15.8%) for females.

| Time of Departure | Male | Female |
| 12:00 AM to 4:59 AM | 617 (8.5%) | 293 (4.7%) |
| 5:00 AM to 5:29 AM | 361 (5.0%) | 116 (1.9%) |
| 5:30 AM to 5:59 AM | 570 (7.9%) | 229 (3.7%) |
| 6:00 AM to 6:29 AM | 748 (10.3%) | 458 (7.4%) |
| 6:30 AM to 6:59 AM | 882 (12.2%) | 635 (10.2%) |
| 7:00 AM to 7:29 AM | 1,044 (14.4%) | 959 (15.5%) |
| 7:30 AM to 7:59 AM | 835 (11.5%) | 980 (15.8%) |
| 8:00 AM to 8:29 AM | 456 (6.3%) | 514 (8.3%) |
| 8:30 AM to 8:59 AM | 180 (2.5%) | 322 (5.2%) |
| 9:00 AM to 9:59 AM | 201 (2.8%) | 275 (4.4%) |
| 10:00 AM to 10:59 AM | 104 (1.4%) | 124 (2.0%) |
| 11:00 AM to 11:59 AM | 15 (0.2%) | 67 (1.1%) |
| 12:00 PM to 3:59 PM | 791 (10.9%) | 673 (10.8%) |
| 4:00 PM to 11:59 PM | 451 (6.2%) | 558 (9.0%) |
| Total | 7,255 (100.0%) | 6,203 (100.0%) |
Housing Occupancy in Freeborn County
Occupancy by Ownership in Freeborn County
Of the total 12,890 dwellings in Freeborn County, owner-occupied units account for 10,100 (78.4%), while renter-occupied units make up 2,790 (21.6%).

| Occupancy | # Housing Units | % Housing Units |
| Owner Occupied Housing Units | 10,100 | 78.4% |
| Renter-Occupied Housing Units | 2,790 | 21.6% |
| Total Occupied Housing Units | 12,890 | 100.0% |
Occupancy by Household Size in Freeborn County

| Household Size | # Housing Units | % Housing Units |
| 1-Person Household | 4,079 | 31.6% |
| 2-Person Household | 4,805 | 37.3% |
| 3-Person Household | 1,556 | 12.1% |
| 4+ Person Household | 2,450 | 19.0% |
| Total Housing Units | 12,890 | 100.0% |
Occupancy by Ownership by Household Size in Freeborn County

| Household Size | Owner-occupied | Renter-occupied |
| 1-Person Household | 2,746 (67.3%) | 1,333 (32.7%) |
| 2-Person Household | 4,096 (85.2%) | 709 (14.8%) |
| 3-Person Household | 1,241 (79.8%) | 315 (20.2%) |
| 4+ Person Household | 2,017 (82.3%) | 433 (17.7%) |
| Total Housing Units | 10,100 (78.4%) | 2,790 (21.6%) |
Occupancy by Educational Attainment in Freeborn County

| Household Size | Owner-occupied | Renter-occupied |
| Less than High School | 770 (57.1%) | 578 (42.9%) |
| High School Diploma | 3,224 (76.8%) | 976 (23.2%) |
| College/Associate Degree | 4,103 (80.9%) | 970 (19.1%) |
| Bachelor's Degree or higher | 2,003 (88.3%) | 266 (11.7%) |
Occupancy by Age of Householder in Freeborn County

| Age Bracket | # Households | % Households |
| Under 35 Years | 1,677 | 13.0% |
| 35 to 44 Years | 1,947 | 15.1% |
| 45 to 54 Years | 2,068 | 16.0% |
| 55 to 64 Years | 2,790 | 21.6% |
| 65 to 74 Years | 2,207 | 17.1% |
| 75 to 84 Years | 1,283 | 10.0% |
| 85 Years and Over | 918 | 7.1% |
| Total | 12,890 | 100.0% |
Housing Finances in Freeborn County
Median Income by Occupancy in Freeborn County
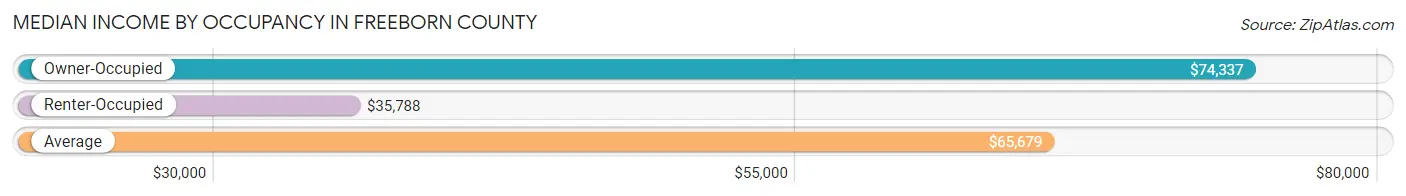
| Occupancy Type | # Households | Median Income |
| Owner-Occupied | 10,100 (78.4%) | $74,337 |
| Renter-Occupied | 2,790 (21.6%) | $35,788 |
| Average | 12,890 (100.0%) | $65,679 |
Occupancy by Householder Income Bracket in Freeborn County

| Income Bracket | Owner-occupied | Renter-occupied |
| Less than $5,000 | 228 (2.3%) | 113 (4.1%) |
| $5,000 to $9,999 | 83 (0.8%) | 64 (2.3%) |
| $10,000 to $14,999 | 205 (2.0%) | 249 (8.9%) |
| $15,000 to $19,999 | 261 (2.6%) | 227 (8.1%) |
| $20,000 to $24,999 | 396 (3.9%) | 227 (8.1%) |
| $25,000 to $34,999 | 764 (7.6%) | 492 (17.6%) |
| $35,000 to $49,999 | 1,224 (12.1%) | 418 (15.0%) |
| $50,000 to $74,999 | 1,937 (19.2%) | 444 (15.9%) |
| $75,000 to $99,999 | 1,728 (17.1%) | 149 (5.3%) |
| $100,000 to $149,999 | 1,863 (18.4%) | 325 (11.7%) |
| $150,000 or more | 1,411 (14.0%) | 82 (2.9%) |
| Total | 10,100 (100.0%) | 2,790 (100.0%) |
Monthly Housing Cost Tiers in Freeborn County

| Monthly Cost | Owner-occupied | Renter-occupied |
| Less than $300 | 516 (5.1%) | 98 (3.5%) |
| $300 to $499 | 1,772 (17.5%) | 397 (14.2%) |
| $500 to $799 | 2,341 (23.2%) | 777 (27.9%) |
| $800 to $999 | 1,259 (12.5%) | 508 (18.2%) |
| $1,000 to $1,499 | 2,185 (21.6%) | 496 (17.8%) |
| $1,500 to $1,999 | 1,119 (11.1%) | 220 (7.9%) |
| $2,000 to $2,499 | 461 (4.6%) | 19 (0.7%) |
| $2,500 to $2,999 | 196 (1.9%) | 0 (0.0%) |
| $3,000 or more | 251 (2.5%) | 48 (1.7%) |
| Total | 10,100 (100.0%) | 2,790 (100.0%) |
Physical Housing Characteristics in Freeborn County
Housing Structures in Freeborn County

| Structure Type | # Housing Units | % Housing Units |
| Single Unit, Detached | 10,345 | 80.3% |
| Single Unit, Attached | 589 | 4.6% |
| 2 Unit Apartments | 227 | 1.8% |
| 3 or 4 Unit Apartments | 171 | 1.3% |
| 5 to 9 Unit Apartments | 263 | 2.0% |
| 10 or more Apartments | 1,018 | 7.9% |
| Mobile Home / Other | 277 | 2.1% |
| Total | 12,890 | 100.0% |
Housing Structures by Occupancy in Freeborn County

| Structure Type | Owner-occupied | Renter-occupied |
| Single Unit, Detached | 9,166 (88.6%) | 1,179 (11.4%) |
| Single Unit, Attached | 404 (68.6%) | 185 (31.4%) |
| 2 Unit Apartments | 22 (9.7%) | 205 (90.3%) |
| 3 or 4 Unit Apartments | 31 (18.1%) | 140 (81.9%) |
| 5 to 9 Unit Apartments | 34 (12.9%) | 229 (87.1%) |
| 10 or more Apartments | 202 (19.8%) | 816 (80.2%) |
| Mobile Home / Other | 241 (87.0%) | 36 (13.0%) |
| Total | 10,100 (78.4%) | 2,790 (21.6%) |
Housing Structures by Number of Rooms in Freeborn County

| Number of Rooms | Owner-occupied | Renter-occupied |
| 1 Room | 5 (0.1%) | 113 (4.1%) |
| 2 or 3 Rooms | 265 (2.6%) | 773 (27.7%) |
| 4 or 5 Rooms | 2,708 (26.8%) | 1,129 (40.5%) |
| 6 or 7 Rooms | 3,753 (37.2%) | 584 (20.9%) |
| 8 or more Rooms | 3,369 (33.4%) | 191 (6.9%) |
| Total | 10,100 (100.0%) | 2,790 (100.0%) |
Housing Structure by Heating Type in Freeborn County

| Heating Type | Owner-occupied | Renter-occupied |
| Utility Gas | 6,600 (65.3%) | 1,889 (67.7%) |
| Bottled, Tank, or LP Gas | 2,272 (22.5%) | 194 (7.0%) |
| Electricity | 870 (8.6%) | 608 (21.8%) |
| Fuel Oil or Kerosene | 99 (1.0%) | 45 (1.6%) |
| Coal or Coke | 0 (0.0%) | 0 (0.0%) |
| All other Fuels | 225 (2.2%) | 52 (1.9%) |
| No Fuel Used | 34 (0.3%) | 2 (0.1%) |
| Total | 10,100 (100.0%) | 2,790 (100.0%) |
Household Vehicle Usage in Freeborn County

| Vehicles per Household | Owner-occupied | Renter-occupied |
| No Vehicle | 175 (1.7%) | 641 (23.0%) |
| 1 Vehicle | 2,490 (24.6%) | 1,340 (48.0%) |
| 2 Vehicles | 4,048 (40.1%) | 621 (22.3%) |
| 3 or more Vehicles | 3,387 (33.5%) | 188 (6.7%) |
| Total | 10,100 (100.0%) | 2,790 (100.0%) |
Real Estate & Mortgages in Freeborn County
Real Estate and Mortgage Overview in Freeborn County
| Characteristic | Without Mortgage | With Mortgage |
| Housing Units | 4,645 | 5,455 |
| Median Property Value | $142,200 | $161,900 |
| Median Household Income | $57,424 | $921 |
| Monthly Housing Costs | $509 | $225 |
| Real Estate Taxes | $1,618 | $43 |
Property Value by Mortgage Status in Freeborn County

| Property Value | Without Mortgage | With Mortgage |
| Less than $50,000 | 521 (11.2%) | 237 (4.3%) |
| $50,000 to $99,999 | 905 (19.5%) | 1,183 (21.7%) |
| $100,000 to $299,999 | 2,622 (56.5%) | 3,174 (58.2%) |
| $300,000 to $499,999 | 422 (9.1%) | 639 (11.7%) |
| $500,000 to $749,999 | 114 (2.5%) | 172 (3.2%) |
| $750,000 to $999,999 | 25 (0.5%) | 20 (0.4%) |
| $1,000,000 or more | 36 (0.8%) | 30 (0.5%) |
| Total | 4,645 (100.0%) | 5,455 (100.0%) |
Household Income by Mortgage Status in Freeborn County

| Household Income | Without Mortgage | With Mortgage |
| Less than $10,000 | 200 (4.3%) | 130 (2.4%) |
| $10,000 to $24,999 | 637 (13.7%) | 111 (2.0%) |
| $25,000 to $34,999 | 530 (11.4%) | 225 (4.1%) |
| $35,000 to $49,999 | 635 (13.7%) | 234 (4.3%) |
| $50,000 to $74,999 | 946 (20.4%) | 589 (10.8%) |
| $75,000 to $99,999 | 627 (13.5%) | 991 (18.2%) |
| $100,000 to $149,999 | 580 (12.5%) | 1,101 (20.2%) |
| $150,000 or more | 490 (10.5%) | 1,283 (23.5%) |
| Total | 4,645 (100.0%) | 5,455 (100.0%) |
Property Value to Household Income Ratio in Freeborn County

| Value-to-Income Ratio | Without Mortgage | With Mortgage |
| Less than 2.0x | 1,788 (38.5%) | 90,859 (1,665.6%) |
| 2.0x to 2.9x | 926 (19.9%) | 2,894 (53.0%) |
| 3.0x to 3.9x | 590 (12.7%) | 1,160 (21.3%) |
| 4.0x or more | 1,278 (27.5%) | 419 (7.7%) |
| Total | 4,645 (100.0%) | 5,455 (100.0%) |
Real Estate Taxes by Mortgage Status in Freeborn County

| Property Taxes | Without Mortgage | With Mortgage |
| Less than $800 | 794 (17.1%) | 51 (0.9%) |
| $800 to $1,499 | 1,345 (29.0%) | 743 (13.6%) |
| $800 to $1,499 | 2,411 (51.9%) | 1,711 (31.4%) |
| Total | 4,645 (100.0%) | 5,455 (100.0%) |
Health & Disability in Freeborn County
Health Insurance Coverage by Age in Freeborn County

| Age Bracket | With Coverage | Without Coverage |
| Under 6 Years | 1,928 (93.2%) | 140 (6.8%) |
| 6 to 18 Years | 4,936 (97.5%) | 126 (2.5%) |
| 19 to 25 Years | 1,710 (85.6%) | 288 (14.4%) |
| 26 to 34 Years | 2,506 (84.6%) | 458 (15.4%) |
| 35 to 44 Years | 3,156 (91.5%) | 294 (8.5%) |
| 45 to 54 Years | 3,209 (89.1%) | 394 (10.9%) |
| 55 to 64 Years | 4,367 (93.5%) | 301 (6.5%) |
| 65 to 74 Years | 3,666 (99.9%) | 4 (0.1%) |
| 75 Years and older | 2,933 (99.9%) | 2 (0.1%) |
| Total | 28,411 (93.4%) | 2,007 (6.6%) |
Health Insurance Coverage by Citizenship Status in Freeborn County

| Citizenship Status | With Coverage | Without Coverage |
| Native Born | 1,928 (93.2%) | 140 (6.8%) |
| Foreign Born, Citizen | 4,936 (97.5%) | 126 (2.5%) |
| Foreign Born, not a Citizen | 1,710 (85.6%) | 288 (14.4%) |
Health Insurance Coverage by Household Income in Freeborn County

| Household Income | With Coverage | Without Coverage |
| Under $25,000 | 2,695 (91.0%) | 268 (9.0%) |
| $25,000 to $49,999 | 4,920 (89.6%) | 568 (10.3%) |
| $50,000 to $74,999 | 5,409 (93.3%) | 389 (6.7%) |
| $75,000 to $99,999 | 4,538 (93.7%) | 305 (6.3%) |
| $100,000 and over | 10,703 (95.7%) | 476 (4.3%) |
Public vs Private Health Insurance Coverage by Age in Freeborn County

| Age Bracket | Public Insurance | Private Insurance |
| Under 6 | 981 (47.4%) | 1,108 (53.6%) |
| 6 to 18 Years | 2,257 (44.6%) | 3,120 (61.6%) |
| 19 to 25 Years | 506 (25.3%) | 1,244 (62.3%) |
| 25 to 34 Years | 723 (24.4%) | 1,942 (65.5%) |
| 35 to 44 Years | 933 (27.0%) | 2,303 (66.7%) |
| 45 to 54 Years | 752 (20.9%) | 2,599 (72.1%) |
| 55 to 64 Years | 1,030 (22.1%) | 3,643 (78.0%) |
| 65 to 74 Years | 3,499 (95.3%) | 2,422 (66.0%) |
| 75 Years and over | 2,931 (99.9%) | 2,124 (72.4%) |
| Total | 13,612 (44.8%) | 20,505 (67.4%) |
Disability Status by Sex by Age in Freeborn County

| Age Bracket | Male | Female |
| Under 5 Years | 3 (0.4%) | 12 (1.4%) |
| 5 to 17 Years | 174 (6.7%) | 164 (6.7%) |
| 18 to 34 Years | 243 (9.1%) | 186 (6.9%) |
| 35 to 64 Years | 726 (12.1%) | 610 (10.7%) |
| 65 to 74 Years | 463 (25.0%) | 363 (19.9%) |
| 75 Years and over | 513 (40.5%) | 653 (39.2%) |
Disability Class by Sex by Age in Freeborn County
Disability Class: Hearing Difficulty

| Age Bracket | Male | Female |
| Under 5 Years | 0 (0.0%) | 12 (1.4%) |
| 5 to 17 Years | 2 (0.1%) | 8 (0.3%) |
| 18 to 34 Years | 48 (1.8%) | 10 (0.4%) |
| 35 to 64 Years | 313 (5.2%) | 111 (1.9%) |
| 65 to 74 Years | 226 (12.2%) | 108 (5.9%) |
| 75 Years and over | 324 (25.6%) | 293 (17.6%) |
Disability Class: Vision Difficulty

| Age Bracket | Male | Female |
| Under 5 Years | 3 (0.4%) | 0 (0.0%) |
| 5 to 17 Years | 11 (0.4%) | 68 (2.8%) |
| 18 to 34 Years | 57 (2.1%) | 22 (0.8%) |
| 35 to 64 Years | 69 (1.1%) | 126 (2.2%) |
| 65 to 74 Years | 96 (5.2%) | 49 (2.7%) |
| 75 Years and over | 69 (5.4%) | 128 (7.7%) |
Disability Class: Cognitive Difficulty

| Age Bracket | Male | Female |
| 5 to 17 Years | 156 (6.0%) | 78 (3.2%) |
| 18 to 34 Years | 185 (6.9%) | 120 (4.5%) |
| 35 to 64 Years | 305 (5.1%) | 181 (3.2%) |
| 65 to 74 Years | 74 (4.0%) | 68 (3.7%) |
| 75 Years and over | 81 (6.4%) | 88 (5.3%) |
Disability Class: Ambulatory Difficulty

| Age Bracket | Male | Female |
| 5 to 17 Years | 13 (0.5%) | 18 (0.7%) |
| 18 to 34 Years | 42 (1.6%) | 22 (0.8%) |
| 35 to 64 Years | 321 (5.3%) | 315 (5.5%) |
| 65 to 74 Years | 223 (12.1%) | 246 (13.5%) |
| 75 Years and over | 268 (21.1%) | 400 (24.0%) |
Disability Class: Self-Care Difficulty

| Age Bracket | Male | Female |
| 5 to 17 Years | 39 (1.5%) | 34 (1.4%) |
| 18 to 34 Years | 28 (1.1%) | 14 (0.5%) |
| 35 to 64 Years | 69 (1.1%) | 101 (1.8%) |
| 65 to 74 Years | 58 (3.1%) | 54 (3.0%) |
| 75 Years and over | 137 (10.8%) | 191 (11.5%) |
Technology Access in Freeborn County
Computing Device Access in Freeborn County

| Device Type | # Households | % Households |
| Desktop or Laptop | 9,391 | 72.9% |
| Smartphone | 10,400 | 80.7% |
| Tablet | 7,548 | 58.6% |
| No Computing Device | 1,359 | 10.5% |
| Total | 12,890 | 100.0% |
Internet Access in Freeborn County

| Internet Type | # Households | % Households |
| Dial-Up Internet | 66 | 0.5% |
| Broadband Home | 8,117 | 63.0% |
| Cellular Data Only | 1,807 | 14.0% |
| Satellite Internet | 1,007 | 7.8% |
| No Internet | 2,135 | 16.6% |
| Total | 12,890 | 100.0% |
Freeborn County Summary
Freeborn County is located in the southeastern corner of Minnesota, and is part of the Albert Lea micropolitan area. It is bordered by Mower County to the north, Steele County to the east, Faribault County to the south, and Dodge and Waseca counties to the west. The county seat is Albert Lea, and the county has a total area of 576 square miles, of which 571 square miles is land and 5.2 square miles is water.
History
Freeborn County was established in 1855 and was named after William Freeborn, a prominent early settler in the area. The county was originally part of Mower County, but was split off in 1855. The first settlers in the area were mostly of German and Scandinavian descent, and the county was largely agricultural.
In the late 19th century, the county was home to several large industries, including a flour mill, a woolen mill, and a brickyard. The county also had a thriving lumber industry, and the town of Albert Lea was a major hub for the industry.
Geography
Freeborn County is located in the southeastern corner of Minnesota, and is part of the Albert Lea micropolitan area. It is bordered by Mower County to the north, Steele County to the east, Faribault County to the south, and Dodge and Waseca counties to the west. The county has a total area of 576 square miles, of which 571 square miles is land and 5.2 square miles is water.
The county is mostly flat, with rolling hills in the northern and western parts. The highest point in the county is located in the northwest corner, at an elevation of 1,092 feet. The county is drained by the Shell Rock River, which flows through the center of the county.
Economy
Freeborn County has a diverse economy, with a mix of manufacturing, agriculture, and services. The county is home to several large employers, including Hormel Foods, which has a large pork processing plant in Albert Lea. Other major employers include the Mayo Clinic Health System, Albert Lea Medical Center, and the Freeborn County Co-op.
Agriculture is also an important part of the county’s economy, with corn, soybeans, and hogs being the main crops. The county also has a thriving tourism industry, with several lakes and parks in the area.
Demographics
As of the 2010 census, Freeborn County had a population of 31,255. The population was spread out, with 24.3% under the age of 18, 8.2% from 18 to 24, 28.2% from 25 to 44, 24.2% from 45 to 64, and 14.1% who were 65 years of age or older. The median age was 37.4 years.
The racial makeup of the county was 94.2% White, 1.2% African American, 0.4% Native American, 0.7% Asian, 0.1% Pacific Islander, 2.2% from other races, and 1.2% from two or more races. Hispanic or Latino of any race were 4.3% of the population.
The median income for a household in the county was $48,945, and the median income for a family was $58,945. The per capita income for the county was $22,845. About 8.2% of families and 11.2% of the population were below the poverty line, including 15.2% of those under age 18 and 8.2% of those age 65 or over.
Common Questions
What is the Total Population of Freeborn County?
Total Population of Freeborn County is 30,857.
What is the Total Male Population of Freeborn County?
Total Male Population of Freeborn County is 15,429.
What is the Total Female Population of Freeborn County?
Total Female Population of Freeborn County is 15,428.
What is the Ratio of Males per 100 Females in Freeborn County?
There are 100.01 Males per 100 Females in Freeborn County.
What is the Ratio of Females per 100 Males in Freeborn County?
There are 99.99 Females per 100 Males in Freeborn County.
What is the Median Population Age in Freeborn County?
Median Population Age in Freeborn County is 44.1 Years.
What is the Average Family Size in Freeborn County
Average Family Size in Freeborn County is 2.9 People.
What is the Average Household Size in Freeborn County
Average Household Size in Freeborn County is 2.4 People.
What is Per Capita Income in Freeborn County?
Per Capita income in Freeborn County is $36,751.
What is the Median Family Income in Freeborn County?
Median Family Income in Freeborn County is $81,502.
What is the Median Household income in Freeborn County?
Median Household Income in Freeborn County is $65,679.
What is Income or Wage Gap in Freeborn County?
Income or Wage Gap in Freeborn County is 25.1%.
Women in Freeborn County earn 74.9 cents for every dollar earned by a man.
What is Family Income Deficit in Freeborn County?
Family Income Deficit in Freeborn County is $13,642.
Families that are below poverty line in Freeborn County earn $13,642 less on average than the poverty threshold level.
What is Inequality or Gini Index in Freeborn County?
Inequality or Gini Index in Freeborn County is 0.45.
How Large is the Labor Force in Freeborn County?
There are 15,376 People in the Labor Forcein in Freeborn County.
What is the Percentage of People in the Labor Force in Freeborn County?
62.0% of People are in the Labor Force in Freeborn County.
What is the Unemployment Rate in Freeborn County?
Unemployment Rate in Freeborn County is 4.4%.