Clay County, MN
Clay County Map
Clay County Overview
65,307
TOTAL POPULATION
32,443
MALE POPULATION
32,864
FEMALE POPULATION
98.72
MALES / 100 FEMALES
101.30
FEMALES / 100 MALES
32.8
MEDIAN AGE
3.1
AVG FAMILY SIZE
2.4
AVG HOUSEHOLD SIZE
$36,586
PER CAPITA INCOME
$103,513
AVG FAMILY INCOME
$75,006
AVG HOUSEHOLD INCOME
32.6%
WAGE / INCOME GAP [ % ]
67.4¢/ $1
WAGE / INCOME GAP [ $ ]
$11,523
FAMILY INCOME DEFICIT
0.44
INEQUALITY / GINI INDEX
35,953
LABOR FORCE [ PEOPLE ]
70.9%
PERCENT IN LABOR FORCE
4.0%
UNEMPLOYMENT RATE
Race in Clay County
The most populous races in Clay County are White / Caucasian (57,105 | 87.4%), Hispanic or Latino (3,176 | 4.9%), and Two or more Races (3,031 | 4.6%).
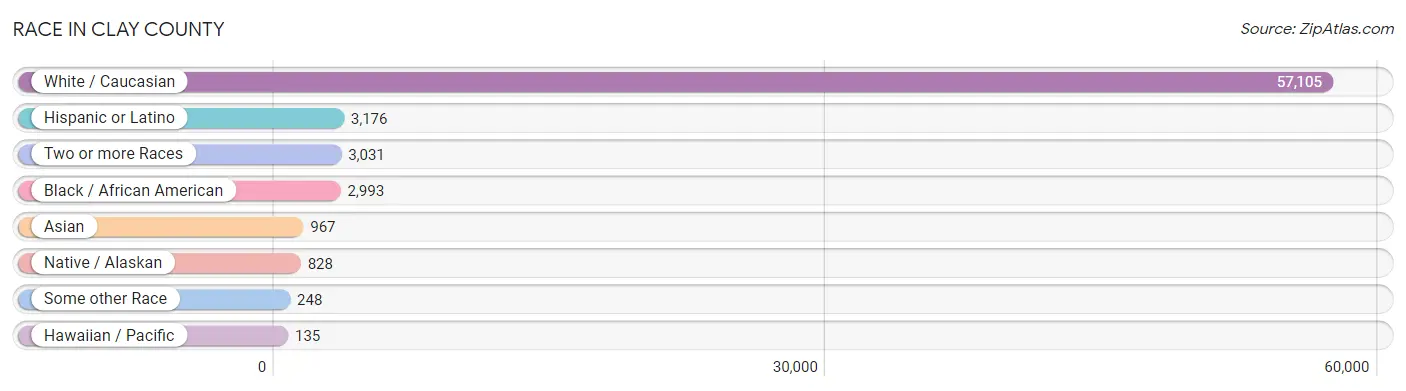
| Race | # Population | % Population |
| Asian | 967 | 1.5% |
| Black / African American | 2,993 | 4.6% |
| Hawaiian / Pacific | 135 | 0.2% |
| Hispanic or Latino | 3,176 | 4.9% |
| Native / Alaskan | 828 | 1.3% |
| White / Caucasian | 57,105 | 87.4% |
| Two or more Races | 3,031 | 4.6% |
| Some other Race | 248 | 0.4% |
| Total | 65,307 | 100.0% |
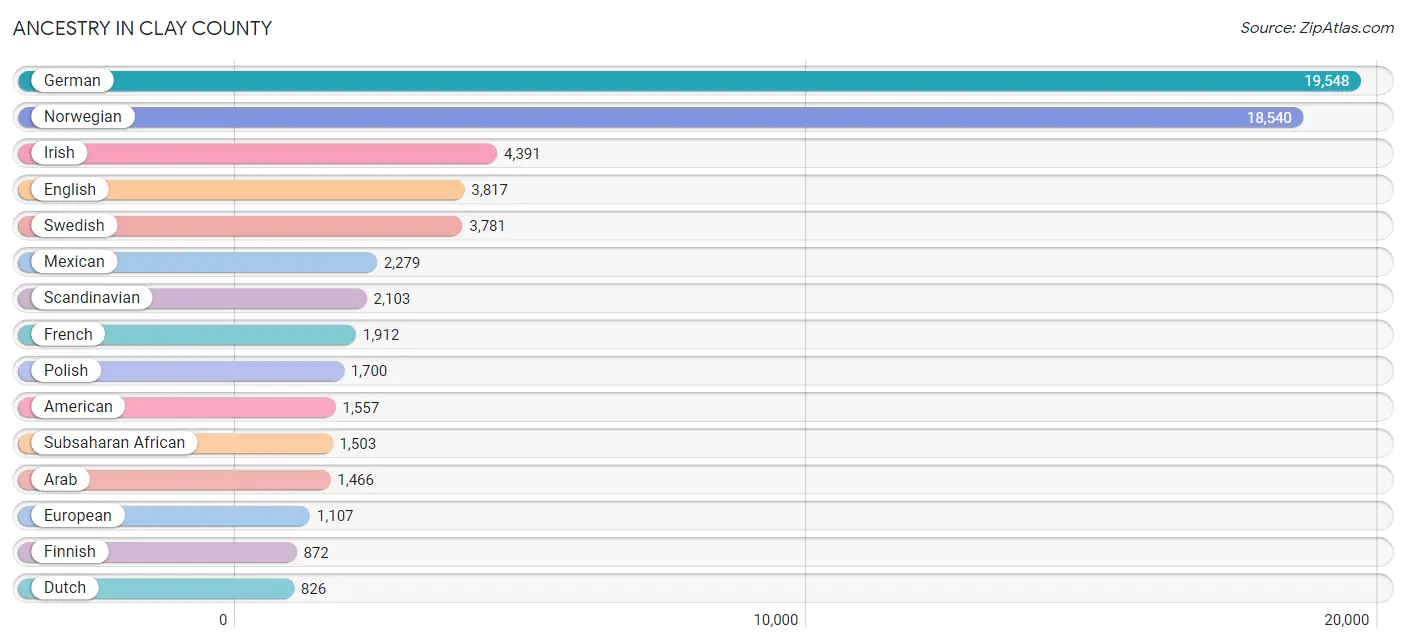
Ancestry in Clay County
The most populous ancestries reported in Clay County are German (19,548 | 29.9%), Norwegian (18,540 | 28.4%), Irish (4,391 | 6.7%), English (3,817 | 5.8%), and Swedish (3,781 | 5.8%), together accounting for 76.7% of all Clay County residents.
| Ancestry | # Population | % Population |
| African | 626 | 1.0% |
| Alaska Native | 1 | 0.0% |
| American | 1,557 | 2.4% |
| Apache | 19 | 0.0% |
| Arab | 1,466 | 2.2% |
| Argentinean | 19 | 0.0% |
| Armenian | 3 | 0.0% |
| Austrian | 40 | 0.1% |
| Bangladeshi | 293 | 0.4% |
| Barbadian | 15 | 0.0% |
| Belgian | 138 | 0.2% |
| Bhutanese | 67 | 0.1% |
| Blackfeet | 13 | 0.0% |
| Brazilian | 31 | 0.1% |
| British | 181 | 0.3% |
| Bulgarian | 16 | 0.0% |
| Burmese | 112 | 0.2% |
| Cambodian | 24 | 0.0% |
| Canadian | 28 | 0.0% |
| Celtic | 9 | 0.0% |
| Central American | 11 | 0.0% |
| Cherokee | 4 | 0.0% |
| Cheyenne | 30 | 0.1% |
| Chippewa | 544 | 0.8% |
| Colombian | 49 | 0.1% |
| Croatian | 162 | 0.3% |
| Cuban | 40 | 0.1% |
| Czech | 672 | 1.0% |
| Czechoslovakian | 265 | 0.4% |
| Danish | 769 | 1.2% |
| Dominican | 6 | 0.0% |
| Dutch | 826 | 1.3% |
| Eastern European | 28 | 0.0% |
| English | 3,817 | 5.8% |
| Ethiopian | 33 | 0.1% |
| European | 1,107 | 1.7% |
| Fijian | 2 | 0.0% |
| Filipino | 3 | 0.0% |
| Finnish | 872 | 1.3% |
| French | 1,912 | 2.9% |
| French American Indian | 31 | 0.1% |
| French Canadian | 483 | 0.7% |
| German | 19,548 | 29.9% |
| German Russian | 143 | 0.2% |
| Greek | 94 | 0.1% |
| Guatemalan | 7 | 0.0% |
| Haitian | 117 | 0.2% |
| Hungarian | 52 | 0.1% |
| Icelander | 93 | 0.1% |
| Indian (Asian) | 175 | 0.3% |
| Iranian | 1 | 0.0% |
| Iraqi | 79 | 0.1% |
| Irish | 4,391 | 6.7% |
| Iroquois | 11 | 0.0% |
| Italian | 811 | 1.2% |
| Jamaican | 6 | 0.0% |
| Japanese | 1 | 0.0% |
| Kenyan | 66 | 0.1% |
| Korean | 294 | 0.4% |
| Lebanese | 31 | 0.1% |
| Liberian | 92 | 0.1% |
| Lithuanian | 51 | 0.1% |
| Luxembourger | 2 | 0.0% |
| Mexican | 2,279 | 3.5% |
| Mexican American Indian | 9 | 0.0% |
| Native Hawaiian | 120 | 0.2% |
| Navajo | 131 | 0.2% |
| Nigerian | 72 | 0.1% |
| Northern European | 123 | 0.2% |
| Norwegian | 18,540 | 28.4% |
| Palestinian | 11 | 0.0% |
| Panamanian | 4 | 0.0% |
| Pennsylvania German | 13 | 0.0% |
| Polish | 1,700 | 2.6% |
| Portuguese | 9 | 0.0% |
| Puerto Rican | 259 | 0.4% |
| Romanian | 35 | 0.1% |
| Russian | 414 | 0.6% |
| Scandinavian | 2,103 | 3.2% |
| Scotch-Irish | 201 | 0.3% |
| Scottish | 789 | 1.2% |
| Serbian | 34 | 0.1% |
| Sioux | 364 | 0.6% |
| Slavic | 5 | 0.0% |
| Slovak | 25 | 0.0% |
| Somali | 301 | 0.5% |
| South American | 68 | 0.1% |
| Spaniard | 30 | 0.1% |
| Spanish | 116 | 0.2% |
| Sri Lankan | 236 | 0.4% |
| Subsaharan African | 1,503 | 2.3% |
| Swedish | 3,781 | 5.8% |
| Swiss | 125 | 0.2% |
| Syrian | 93 | 0.1% |
| Thai | 103 | 0.2% |
| Ugandan | 6 | 0.0% |
| Ukrainian | 117 | 0.2% |
| Welsh | 235 | 0.4% |
| Yugoslavian | 378 | 0.6% | View All 99 Rows |
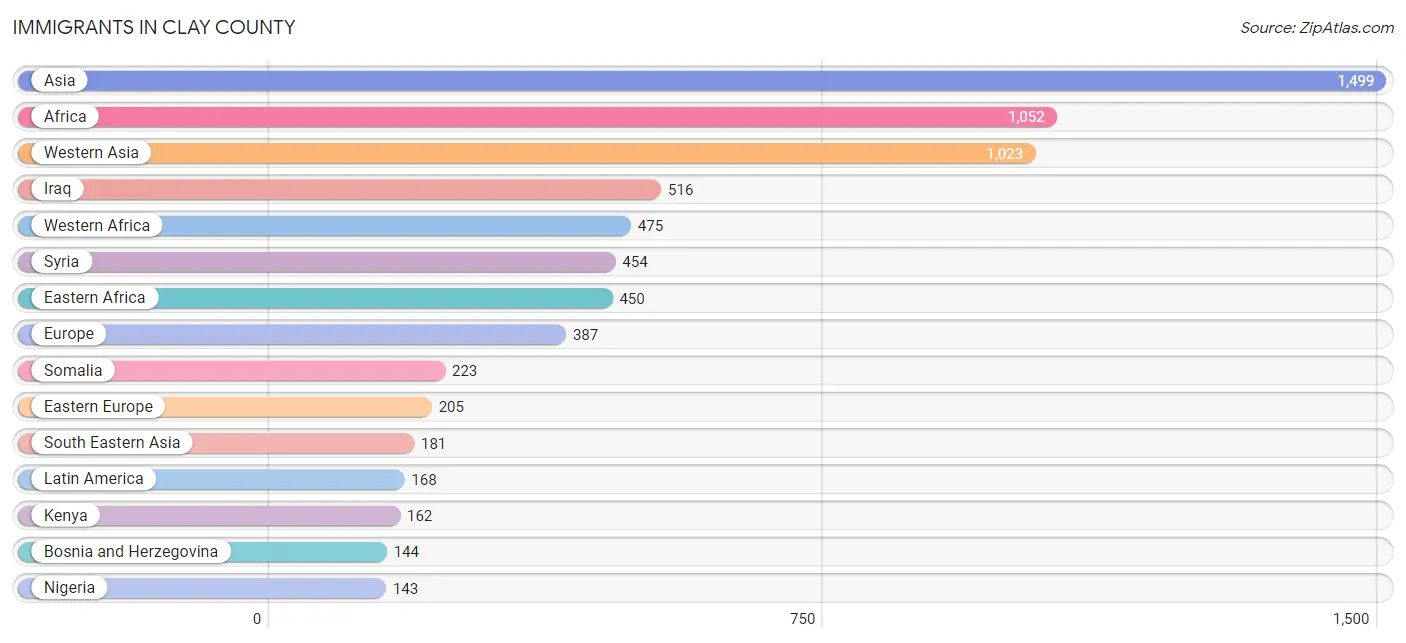
Immigrants in Clay County
The most numerous immigrant groups reported in Clay County came from Asia (1,499 | 2.3%), Africa (1,052 | 1.6%), Western Asia (1,023 | 1.6%), Iraq (516 | 0.8%), and Western Africa (475 | 0.7%), together accounting for 7.0% of all Clay County residents.
| Immigration Origin | # Population | % Population |
| Africa | 1,052 | 1.6% |
| Argentina | 18 | 0.0% |
| Asia | 1,499 | 2.3% |
| Australia | 5 | 0.0% |
| Bahamas | 8 | 0.0% |
| Bosnia and Herzegovina | 144 | 0.2% |
| Brazil | 31 | 0.1% |
| Canada | 69 | 0.1% |
| Caribbean | 17 | 0.0% |
| Central America | 84 | 0.1% |
| China | 45 | 0.1% |
| Colombia | 12 | 0.0% |
| Congo | 33 | 0.1% |
| Denmark | 2 | 0.0% |
| Eastern Africa | 450 | 0.7% |
| Eastern Asia | 109 | 0.2% |
| Eastern Europe | 205 | 0.3% |
| Ethiopia | 33 | 0.1% |
| Europe | 387 | 0.6% |
| Germany | 123 | 0.2% |
| Ghana | 113 | 0.2% |
| Haiti | 3 | 0.0% |
| Hong Kong | 19 | 0.0% |
| India | 43 | 0.1% |
| Indonesia | 2 | 0.0% |
| Iran | 1 | 0.0% |
| Iraq | 516 | 0.8% |
| Jamaica | 6 | 0.0% |
| Japan | 34 | 0.1% |
| Jordan | 29 | 0.0% |
| Kenya | 162 | 0.3% |
| Korea | 30 | 0.1% |
| Laos | 51 | 0.1% |
| Latin America | 168 | 0.3% |
| Lebanon | 3 | 0.0% |
| Liberia | 77 | 0.1% |
| Mexico | 84 | 0.1% |
| Micronesia | 17 | 0.0% |
| Middle Africa | 70 | 0.1% |
| Nepal | 68 | 0.1% |
| Netherlands | 2 | 0.0% |
| Nigeria | 143 | 0.2% |
| Northern Europe | 57 | 0.1% |
| Oceania | 22 | 0.0% |
| Pakistan | 2 | 0.0% |
| Peru | 6 | 0.0% |
| Philippines | 27 | 0.0% |
| Russia | 13 | 0.0% |
| Senegal | 26 | 0.0% |
| Somalia | 223 | 0.3% |
| South America | 67 | 0.1% |
| South Central Asia | 140 | 0.2% |
| South Eastern Asia | 181 | 0.3% |
| Syria | 454 | 0.7% |
| Taiwan | 3 | 0.0% |
| Thailand | 26 | 0.0% |
| Turkey | 21 | 0.0% |
| Uganda | 6 | 0.0% |
| Ukraine | 21 | 0.0% |
| Uzbekistan | 24 | 0.0% |
| Vietnam | 75 | 0.1% |
| Western Africa | 475 | 0.7% |
| Western Asia | 1,023 | 1.6% |
| Western Europe | 125 | 0.2% |
| Zaire | 37 | 0.1% | View All 65 Rows |
Sex and Age in Clay County
Sex and Age in Clay County
The most populous age groups in Clay County are 20 to 24 Years (3,011 | 9.3%) for men and 20 to 24 Years (3,433 | 10.4%) for women.
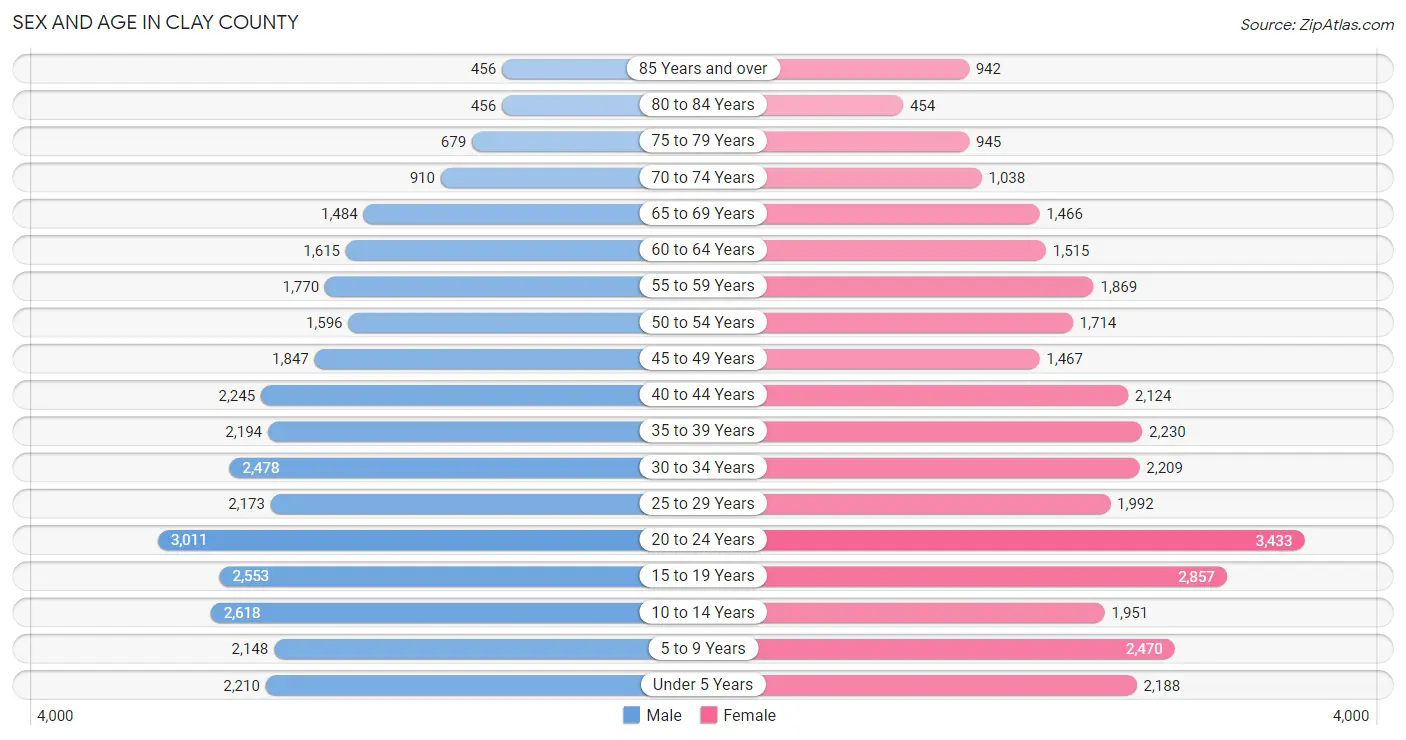
| Age Bracket | Male | Female |
| Under 5 Years | 2,210 (6.8%) | 2,188 (6.7%) |
| 5 to 9 Years | 2,148 (6.6%) | 2,470 (7.5%) |
| 10 to 14 Years | 2,618 (8.1%) | 1,951 (5.9%) |
| 15 to 19 Years | 2,553 (7.9%) | 2,857 (8.7%) |
| 20 to 24 Years | 3,011 (9.3%) | 3,433 (10.4%) |
| 25 to 29 Years | 2,173 (6.7%) | 1,992 (6.1%) |
| 30 to 34 Years | 2,478 (7.6%) | 2,209 (6.7%) |
| 35 to 39 Years | 2,194 (6.8%) | 2,230 (6.8%) |
| 40 to 44 Years | 2,245 (6.9%) | 2,124 (6.5%) |
| 45 to 49 Years | 1,847 (5.7%) | 1,467 (4.5%) |
| 50 to 54 Years | 1,596 (4.9%) | 1,714 (5.2%) |
| 55 to 59 Years | 1,770 (5.5%) | 1,869 (5.7%) |
| 60 to 64 Years | 1,615 (5.0%) | 1,515 (4.6%) |
| 65 to 69 Years | 1,484 (4.6%) | 1,466 (4.5%) |
| 70 to 74 Years | 910 (2.8%) | 1,038 (3.2%) |
| 75 to 79 Years | 679 (2.1%) | 945 (2.9%) |
| 80 to 84 Years | 456 (1.4%) | 454 (1.4%) |
| 85 Years and over | 456 (1.4%) | 942 (2.9%) |
| Total | 32,443 (100.0%) | 32,864 (100.0%) |
Families and Households in Clay County
Median Family Size in Clay County
The median family size in Clay County is 3.09 persons per family, with married-couple families (12,068 | 78.2%) accounting for the largest median family size of 3.18 persons per family. On the other hand, single male/father families (1,090 | 7.1%) represent the smallest median family size with 2.63 persons per family.
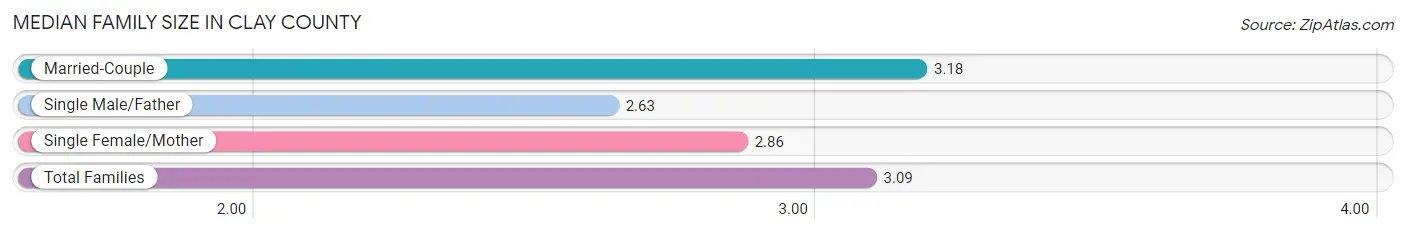
| Family Type | # Families | Family Size |
| Married-Couple | 12,068 (78.2%) | 3.18 |
| Single Male/Father | 1,090 (7.1%) | 2.63 |
| Single Female/Mother | 2,281 (14.8%) | 2.86 |
| Total Families | 15,439 (100.0%) | 3.09 |
Median Household Size in Clay County
The median household size in Clay County is 2.43 persons per household, with married-couple households (12,068 | 47.3%) accounting for the largest median household size of 3.19 persons per household. non-family households (10,073 | 39.5%) represent the smallest median household size with 1.30 persons per household.
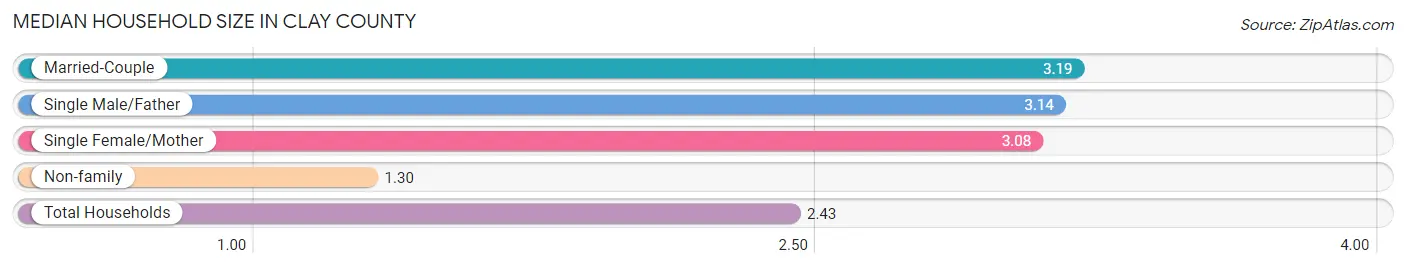
| Household Type | # Households | Household Size |
| Married-Couple | 12,068 (47.3%) | 3.19 |
| Single Male/Father | 1,090 (4.3%) | 3.14 |
| Single Female/Mother | 2,281 (8.9%) | 3.08 |
| Non-family | 10,073 (39.5%) | 1.30 |
| Total Households | 25,512 (100.0%) | 2.43 |
Household Size by Marriage Status in Clay County
Out of a total of 25,512 households in Clay County, 15,439 (60.5%) are family households, while 10,073 (39.5%) are nonfamily households. The most numerous type of family households are 2-person households, comprising 6,745, and the most common type of nonfamily households are 1-person households, comprising 8,007.
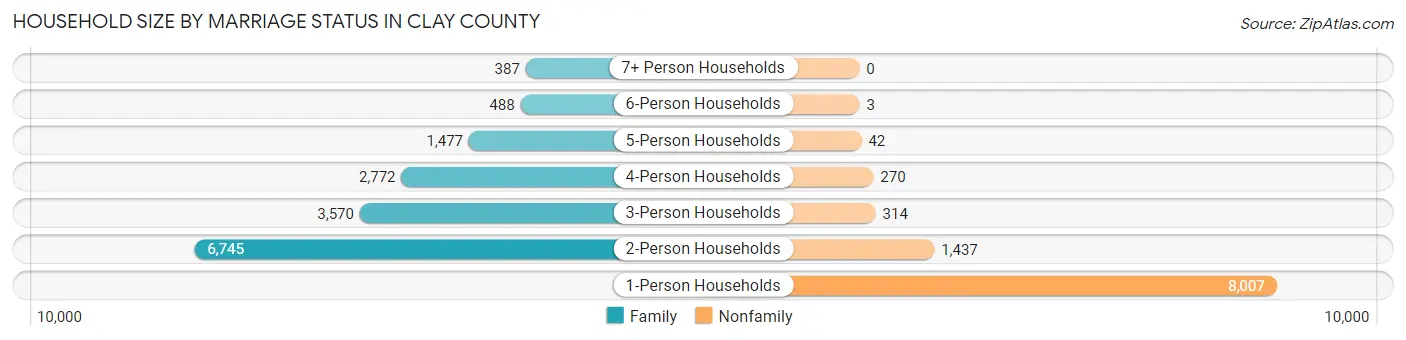
| Household Size | Family Households | Nonfamily Households |
| 1-Person Households | - | 8,007 (31.4%) |
| 2-Person Households | 6,745 (26.4%) | 1,437 (5.6%) |
| 3-Person Households | 3,570 (14.0%) | 314 (1.2%) |
| 4-Person Households | 2,772 (10.9%) | 270 (1.1%) |
| 5-Person Households | 1,477 (5.8%) | 42 (0.2%) |
| 6-Person Households | 488 (1.9%) | 3 (0.0%) |
| 7+ Person Households | 387 (1.5%) | 0 (0.0%) |
| Total | 15,439 (60.5%) | 10,073 (39.5%) |
Female Fertility in Clay County
Fertility by Age in Clay County
Average fertility rate in Clay County is 49.0 births per 1,000 women. Women in the age bracket of 20 to 34 years have the highest fertility rate with 89.0 births per 1,000 women. Women in the age bracket of 20 to 34 years acount for 83.9% of all women with births.
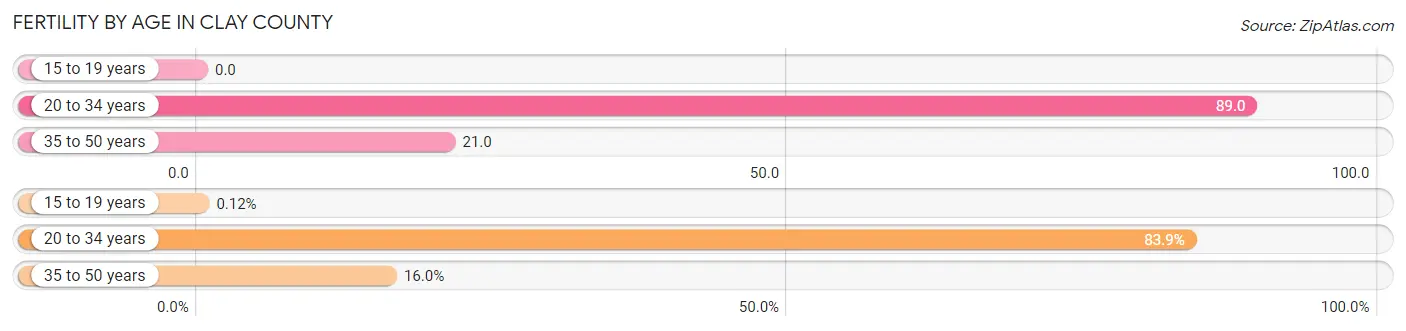
| Age Bracket | Women with Births | Births / 1,000 Women |
| 15 to 19 years | 1 (0.1%) | 0.0 |
| 20 to 34 years | 680 (83.9%) | 89.0 |
| 35 to 50 years | 130 (16.0%) | 21.0 |
| Total | 811 (100.0%) | 49.0 |
Fertility by Age by Marriage Status in Clay County
78.1% of women with births (811) in Clay County are married. The highest percentage of unmarried women with births falls into 15 to 19 years age bracket with 100.0% of them unmarried at the time of birth, while the lowest percentage of unmarried women with births belong to 35 to 50 years age bracket with 1.5% of them unmarried.
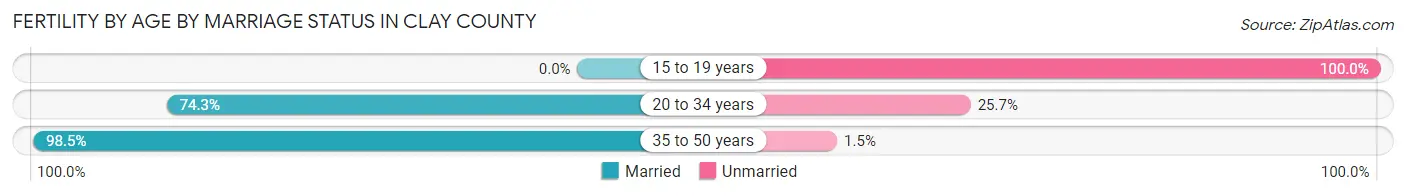
| Age Bracket | Married | Unmarried |
| 15 to 19 years | 0 (0.0%) | 1 (100.0%) |
| 20 to 34 years | 505 (74.3%) | 175 (25.7%) |
| 35 to 50 years | 128 (98.5%) | 2 (1.5%) |
| Total | 633 (78.0%) | 178 (22.0%) |
Fertility by Education in Clay County
Average fertility rate in Clay County is 49.0 births per 1,000 women. Women with the education attainment of bachelor's degree have the highest fertility rate of 92.0 births per 1,000 women, while women with the education attainment of high school diploma have the lowest fertility at 12.0 births per 1,000 women. Women with the education attainment of bachelor's degree represent 43.2% of all women with births.
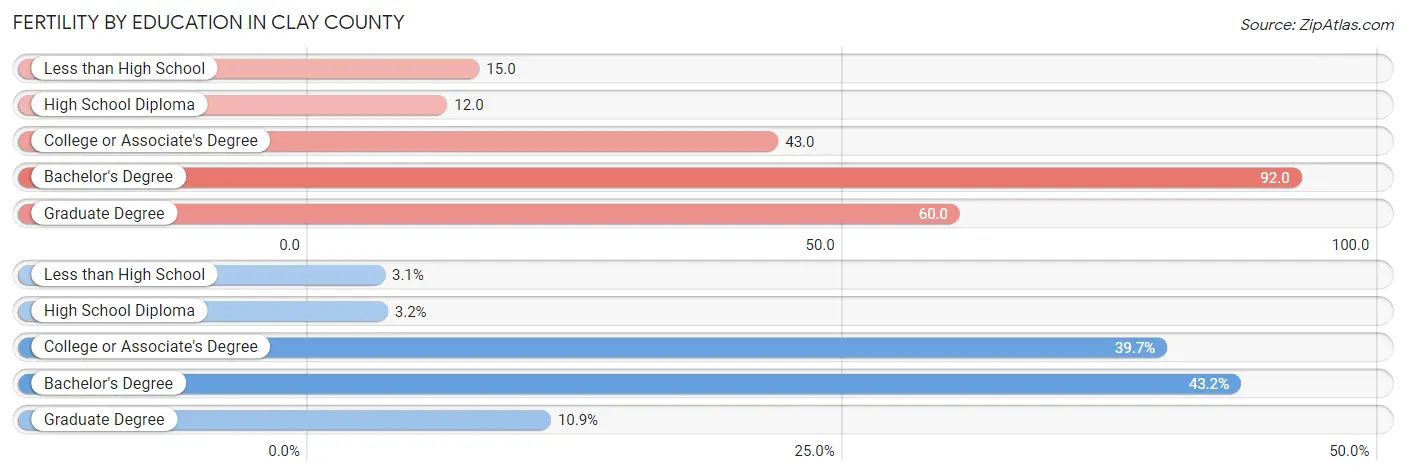
| Educational Attainment | Women with Births | Births / 1,000 Women |
| Less than High School | 25 (3.1%) | 15.0 |
| High School Diploma | 26 (3.2%) | 12.0 |
| College or Associate's Degree | 322 (39.7%) | 43.0 |
| Bachelor's Degree | 350 (43.2%) | 92.0 |
| Graduate Degree | 88 (10.8%) | 60.0 |
| Total | 811 (100.0%) | 49.0 |
Fertility by Education by Marriage Status in Clay County
22.0% of women with births in Clay County are unmarried. Women with the educational attainment of graduate degree are most likely to be married with 100.0% of them married at childbirth, while women with the educational attainment of less than high school are least likely to be married with 76.0% of them unmarried at childbirth.
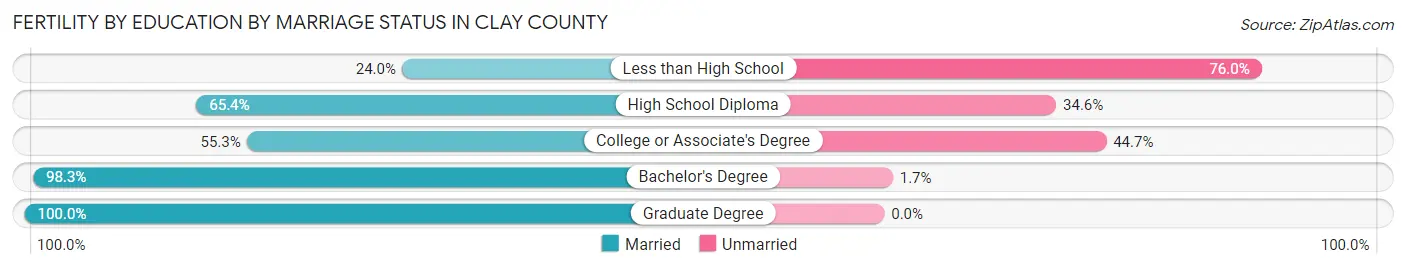
| Educational Attainment | Married | Unmarried |
| Less than High School | 6 (24.0%) | 19 (76.0%) |
| High School Diploma | 17 (65.4%) | 9 (34.6%) |
| College or Associate's Degree | 178 (55.3%) | 144 (44.7%) |
| Bachelor's Degree | 344 (98.3%) | 6 (1.7%) |
| Graduate Degree | 88 (100.0%) | 0 (0.0%) |
| Total | 633 (78.0%) | 178 (22.0%) |
Income in Clay County
Income Overview in Clay County
Per Capita Income in Clay County is $36,586, while median incomes of families and households are $103,513 and $75,006 respectively.
| Characteristic | Number | Measure |
| Per Capita Income | 65,307 | $36,586 |
| Median Family Income | 15,439 | $103,513 |
| Mean Family Income | 15,439 | $118,098 |
| Median Household Income | 25,512 | $75,006 |
| Mean Household Income | 25,512 | $92,120 |
| Income Deficit | 15,439 | $11,523 |
| Wage / Income Gap (%) | 65,307 | 32.65% |
| Wage / Income Gap ($) | 65,307 | 67.35¢ per $1 |
| Gini / Inequality Index | 65,307 | 0.44 |
Earnings by Sex in Clay County
Average Earnings in Clay County are $41,644, $50,330 for men and $33,898 for women, a difference of 32.7%.
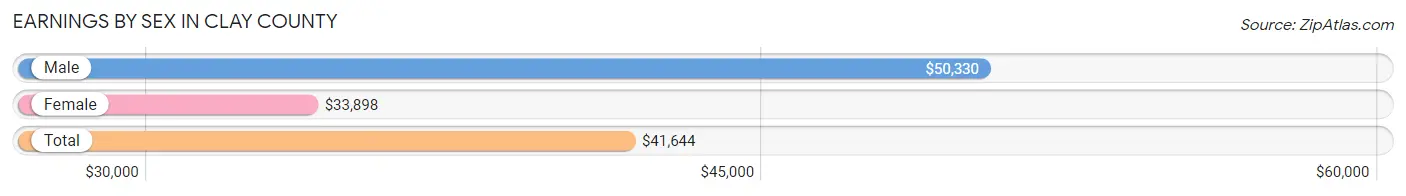
| Sex | Number | Average Earnings |
| Male | 19,322 (50.6%) | $50,330 |
| Female | 18,854 (49.4%) | $33,898 |
| Total | 38,176 (100.0%) | $41,644 |
Earnings by Sex by Income Bracket in Clay County
The most common earnings brackets in Clay County are $100,000+ for men (2,707 | 14.0%) and $55,000 to $64,999 for women (1,504 | 8.0%).
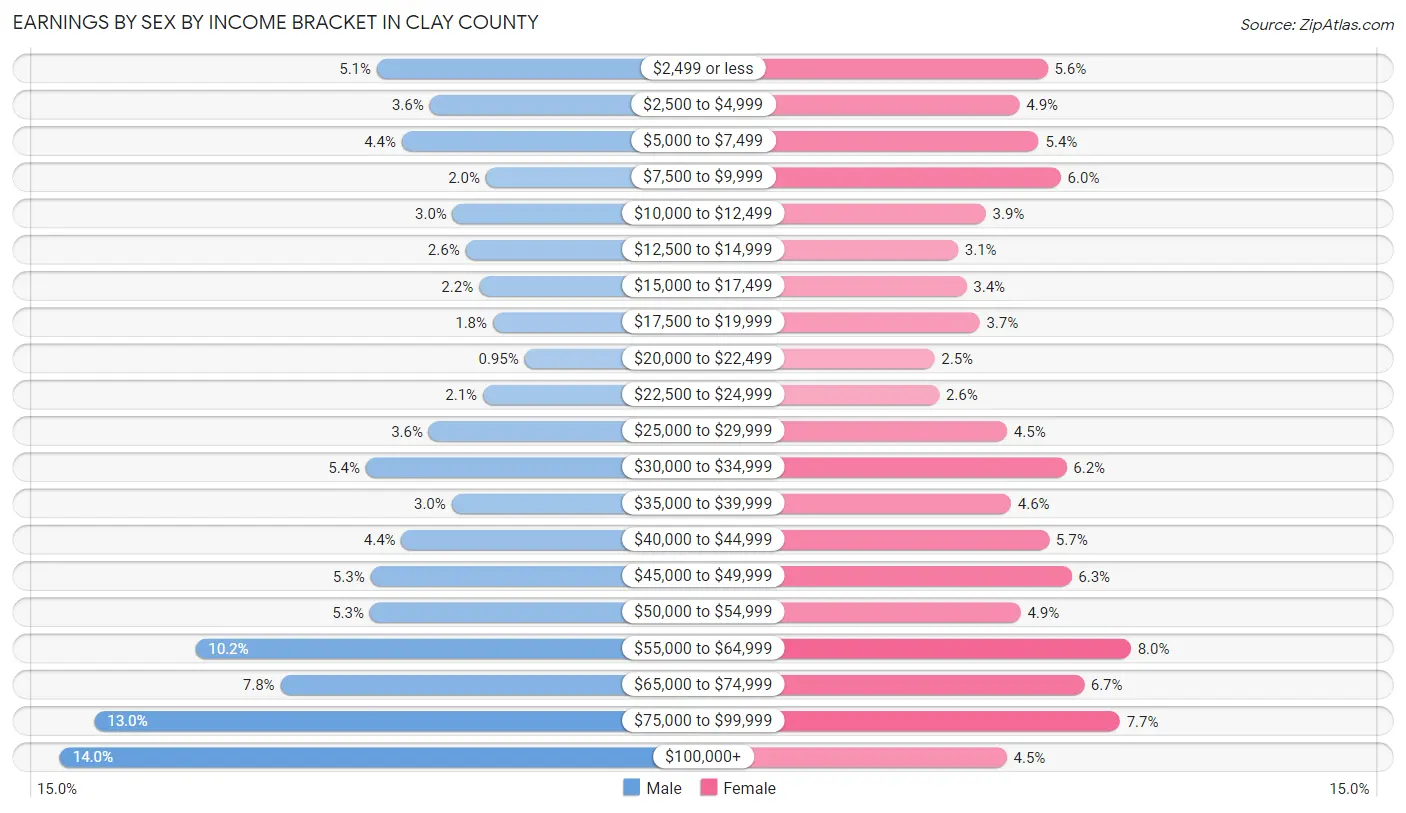
| Income | Male | Female |
| $2,499 or less | 986 (5.1%) | 1,063 (5.6%) |
| $2,500 to $4,999 | 700 (3.6%) | 914 (4.9%) |
| $5,000 to $7,499 | 851 (4.4%) | 1,017 (5.4%) |
| $7,500 to $9,999 | 395 (2.0%) | 1,134 (6.0%) |
| $10,000 to $12,499 | 574 (3.0%) | 736 (3.9%) |
| $12,500 to $14,999 | 505 (2.6%) | 588 (3.1%) |
| $15,000 to $17,499 | 431 (2.2%) | 633 (3.4%) |
| $17,500 to $19,999 | 355 (1.8%) | 704 (3.7%) |
| $20,000 to $22,499 | 184 (0.9%) | 463 (2.5%) |
| $22,500 to $24,999 | 410 (2.1%) | 488 (2.6%) |
| $25,000 to $29,999 | 703 (3.6%) | 848 (4.5%) |
| $30,000 to $34,999 | 1,046 (5.4%) | 1,163 (6.2%) |
| $35,000 to $39,999 | 579 (3.0%) | 869 (4.6%) |
| $40,000 to $44,999 | 852 (4.4%) | 1,071 (5.7%) |
| $45,000 to $49,999 | 1,020 (5.3%) | 1,189 (6.3%) |
| $50,000 to $54,999 | 1,025 (5.3%) | 921 (4.9%) |
| $55,000 to $64,999 | 1,970 (10.2%) | 1,504 (8.0%) |
| $65,000 to $74,999 | 1,509 (7.8%) | 1,255 (6.7%) |
| $75,000 to $99,999 | 2,520 (13.0%) | 1,447 (7.7%) |
| $100,000+ | 2,707 (14.0%) | 847 (4.5%) |
| Total | 19,322 (100.0%) | 18,854 (100.0%) |
Earnings by Sex by Educational Attainment in Clay County
Average earnings in Clay County are $58,654 for men and $44,833 for women, a difference of 23.6%. Men with an educational attainment of graduate degree enjoy the highest average annual earnings of $79,536, while those with less than high school education earn the least with $29,695. Women with an educational attainment of graduate degree earn the most with the average annual earnings of $65,559, while those with less than high school education have the smallest earnings of $13,064.
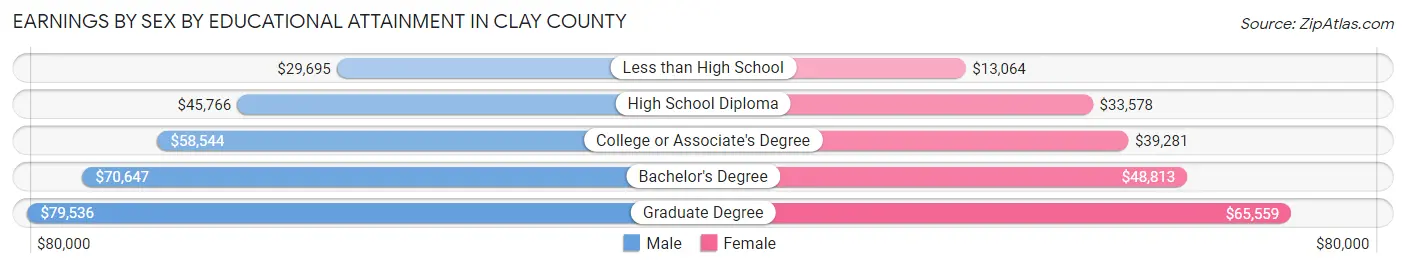
| Educational Attainment | Male Income | Female Income |
| Less than High School | $29,695 | $13,064 |
| High School Diploma | $45,766 | $33,578 |
| College or Associate's Degree | $58,544 | $39,281 |
| Bachelor's Degree | $70,647 | $48,813 |
| Graduate Degree | $79,536 | $65,559 |
| Total | $58,654 | $44,833 |
Family Income in Clay County
Family Income Brackets in Clay County
According to the Clay County family income data, there are 4,292 families falling into the $100,000 to $149,999 income range, which is the most common income bracket and makes up 27.8% of all families. Conversely, the $10,000 to $14,999 income bracket is the least frequent group with only 232 families (1.5%) belonging to this category.
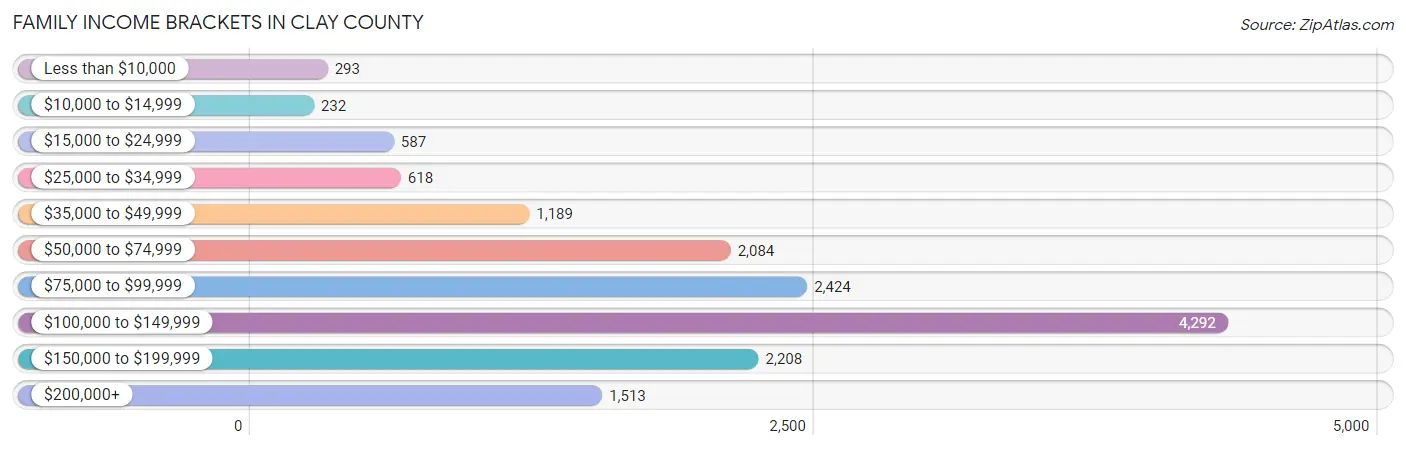
| Income Bracket | # Families | % Families |
| Less than $10,000 | 293 | 1.9% |
| $10,000 to $14,999 | 232 | 1.5% |
| $15,000 to $24,999 | 587 | 3.8% |
| $25,000 to $34,999 | 618 | 4.0% |
| $35,000 to $49,999 | 1,189 | 7.7% |
| $50,000 to $74,999 | 2,084 | 13.5% |
| $75,000 to $99,999 | 2,424 | 15.7% |
| $100,000 to $149,999 | 4,292 | 27.8% |
| $150,000 to $199,999 | 2,208 | 14.3% |
| $200,000+ | 1,513 | 9.8% |
Family Income by Famaliy Size in Clay County
6-person families (425 | 2.8%) account for the highest median family income in Clay County with $128,606 per family, while 2-person families (7,239 | 46.9%) have the highest median income of $42,590 per family member.
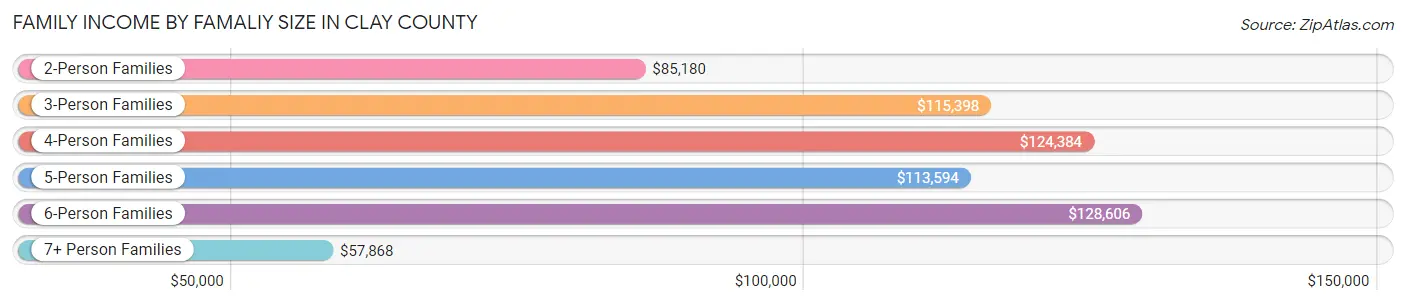
| Income Bracket | # Families | Median Income |
| 2-Person Families | 7,239 (46.9%) | $85,180 |
| 3-Person Families | 3,318 (21.5%) | $115,398 |
| 4-Person Families | 2,714 (17.6%) | $124,384 |
| 5-Person Families | 1,389 (9.0%) | $113,594 |
| 6-Person Families | 425 (2.8%) | $128,606 |
| 7+ Person Families | 354 (2.3%) | $57,868 |
| Total | 15,439 (100.0%) | $103,513 |
Family Income by Number of Earners in Clay County
The median family income in Clay County is $103,513, with families comprising 3+ earners (1,912) having the highest median family income of $159,519, while families with no earners (1,762) have the lowest median family income of $55,795, accounting for 12.4% and 11.4% of families, respectively.
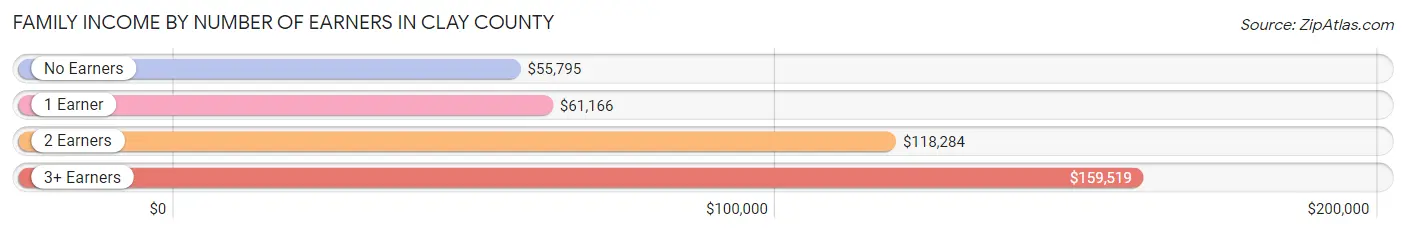
| Number of Earners | # Families | Median Income |
| No Earners | 1,762 (11.4%) | $55,795 |
| 1 Earner | 4,125 (26.7%) | $61,166 |
| 2 Earners | 7,640 (49.5%) | $118,284 |
| 3+ Earners | 1,912 (12.4%) | $159,519 |
| Total | 15,439 (100.0%) | $103,513 |
Household Income in Clay County
Household Income Brackets in Clay County
With 5,102 households falling in the category, the $100,000 to $149,999 income range is the most frequent in Clay County, accounting for 20.0% of all households. In contrast, only 1,020 households (4.0%) fall into the $10,000 to $14,999 income bracket, making it the least populous group.
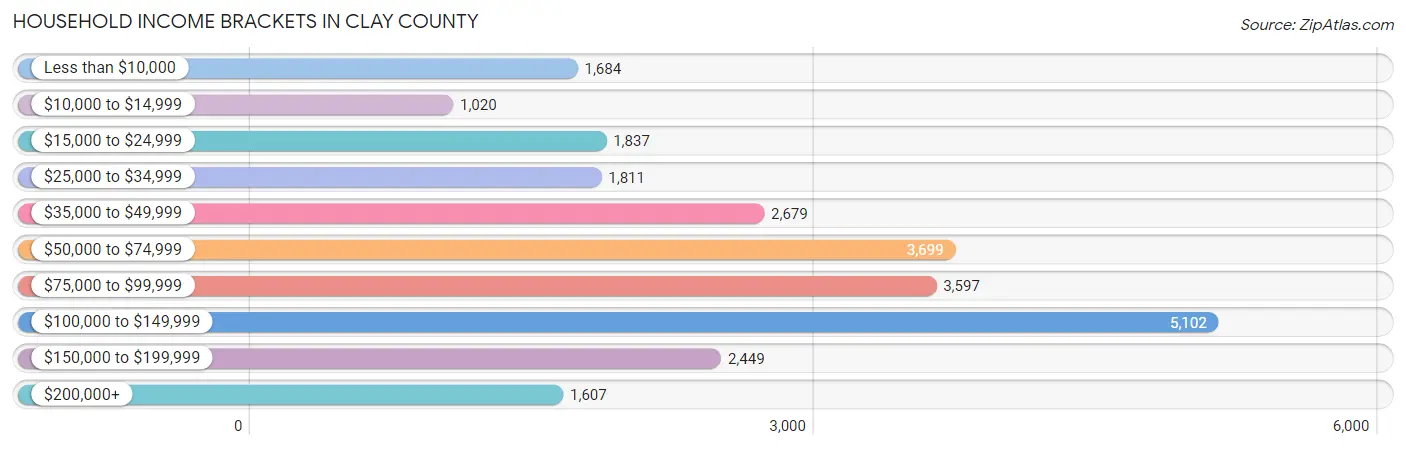
| Income Bracket | # Households | % Households |
| Less than $10,000 | 1,684 | 6.6% |
| $10,000 to $14,999 | 1,020 | 4.0% |
| $15,000 to $24,999 | 1,837 | 7.2% |
| $25,000 to $34,999 | 1,811 | 7.1% |
| $35,000 to $49,999 | 2,679 | 10.5% |
| $50,000 to $74,999 | 3,699 | 14.5% |
| $75,000 to $99,999 | 3,597 | 14.1% |
| $100,000 to $149,999 | 5,102 | 20.0% |
| $150,000 to $199,999 | 2,449 | 9.6% |
| $200,000+ | 1,607 | 6.3% |
Household Income by Householder Age in Clay County
The median household income in Clay County is $75,006, with the highest median household income of $93,473 found in the 45 to 64 years age bracket for the primary householder. A total of 8,104 households (31.8%) fall into this category. Meanwhile, the 15 to 24 years age bracket for the primary householder has the lowest median household income of $36,563, with 1,947 households (7.6%) in this group.
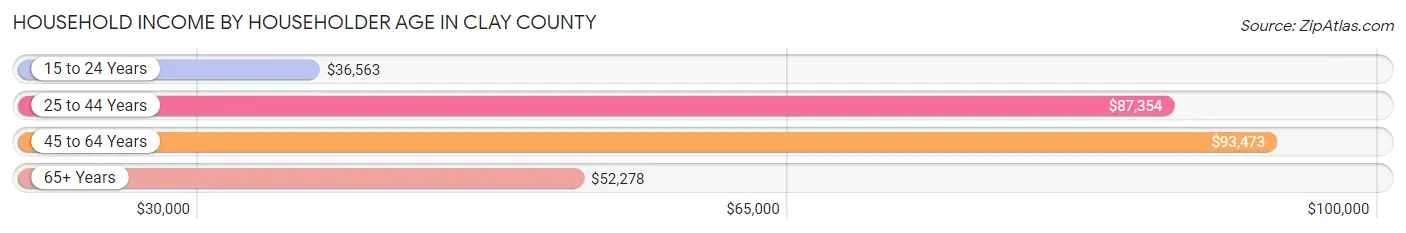
| Income Bracket | # Households | Median Income |
| 15 to 24 Years | 1,947 (7.6%) | $36,563 |
| 25 to 44 Years | 9,589 (37.6%) | $87,354 |
| 45 to 64 Years | 8,104 (31.8%) | $93,473 |
| 65+ Years | 5,872 (23.0%) | $52,278 |
| Total | 25,512 (100.0%) | $75,006 |
Poverty in Clay County
Income Below Poverty by Sex and Age in Clay County
With 13.2% poverty level for males and 16.3% for females among the residents of Clay County, 18 to 24 year old males and 18 to 24 year old females are the most vulnerable to poverty, with 1,032 males (30.9%) and 1,503 females (43.0%) in their respective age groups living below the poverty level.
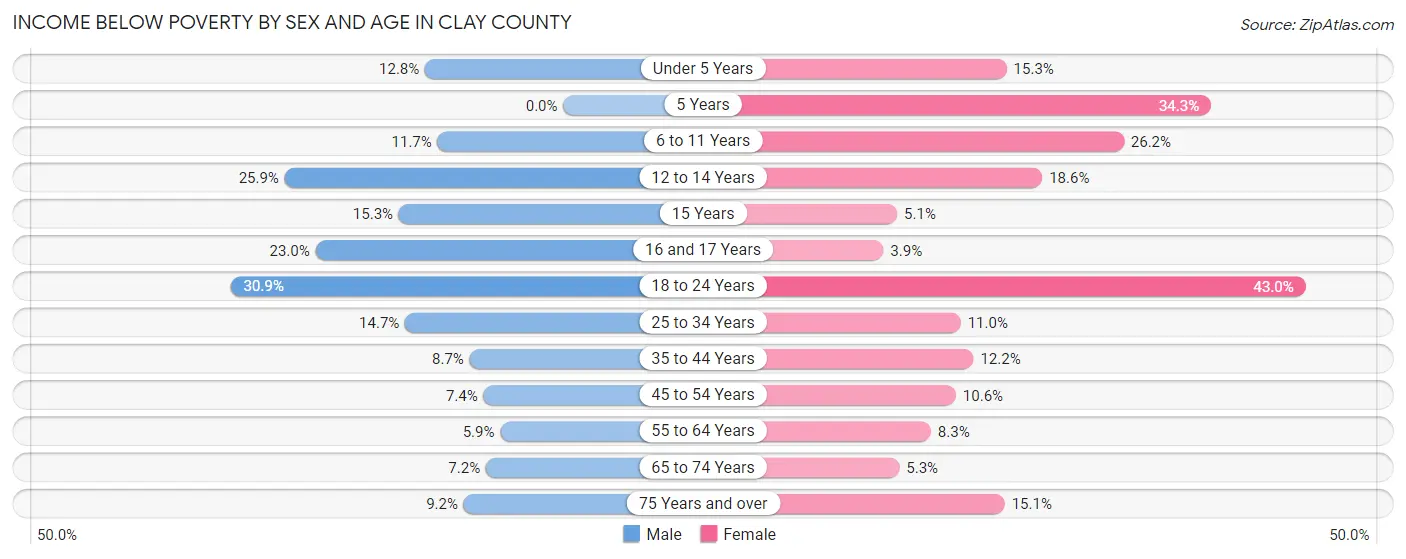
| Age Bracket | Male | Female |
| Under 5 Years | 278 (12.8%) | 324 (15.3%) |
| 5 Years | 0 (0.0%) | 160 (34.3%) |
| 6 to 11 Years | 319 (11.7%) | 684 (26.2%) |
| 12 to 14 Years | 429 (25.9%) | 242 (18.6%) |
| 15 Years | 83 (15.3%) | 24 (5.1%) |
| 16 and 17 Years | 175 (23.0%) | 29 (3.9%) |
| 18 to 24 Years | 1,032 (30.9%) | 1,503 (43.0%) |
| 25 to 34 Years | 677 (14.7%) | 464 (11.0%) |
| 35 to 44 Years | 384 (8.7%) | 529 (12.2%) |
| 45 to 54 Years | 255 (7.4%) | 337 (10.6%) |
| 55 to 64 Years | 197 (5.9%) | 280 (8.3%) |
| 65 to 74 Years | 171 (7.2%) | 131 (5.3%) |
| 75 Years and over | 143 (9.2%) | 315 (15.1%) |
| Total | 4,143 (13.2%) | 5,022 (16.3%) |
Income Above Poverty by Sex and Age in Clay County
According to the poverty statistics in Clay County, males aged 5 years and females aged 16 and 17 years are the age groups that are most secure financially, with 100.0% of males and 96.1% of females in these age groups living above the poverty line.
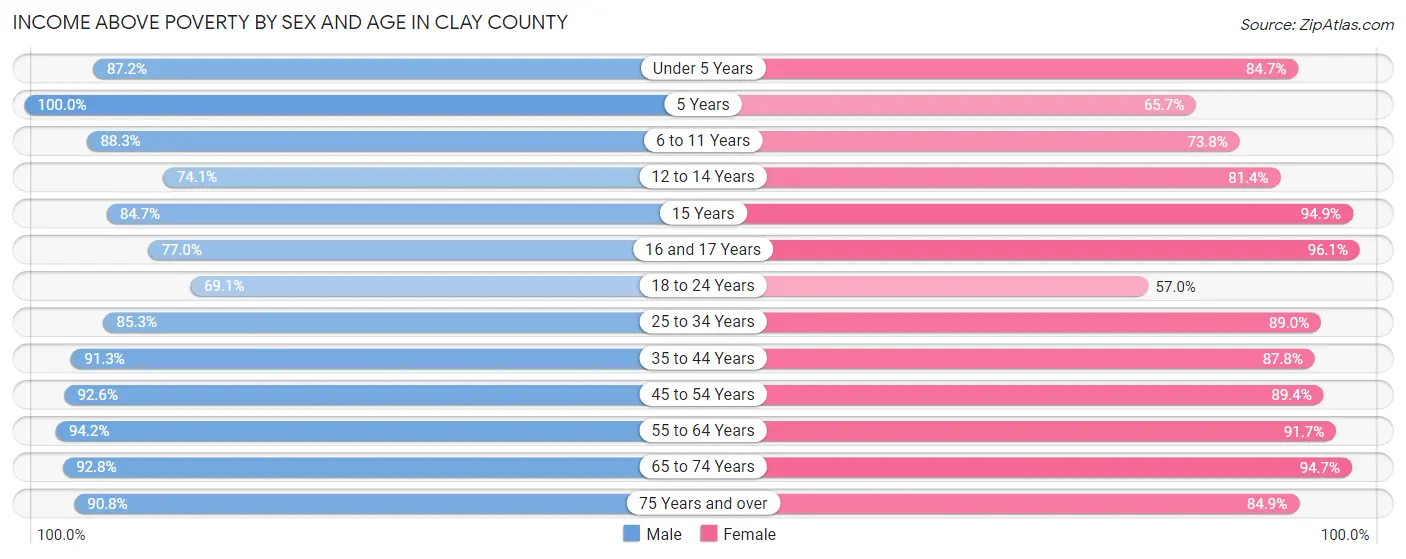
| Age Bracket | Male | Female |
| Under 5 Years | 1,888 (87.2%) | 1,794 (84.7%) |
| 5 Years | 321 (100.0%) | 307 (65.7%) |
| 6 to 11 Years | 2,415 (88.3%) | 1,929 (73.8%) |
| 12 to 14 Years | 1,230 (74.1%) | 1,059 (81.4%) |
| 15 Years | 461 (84.7%) | 443 (94.9%) |
| 16 and 17 Years | 586 (77.0%) | 722 (96.1%) |
| 18 to 24 Years | 2,309 (69.1%) | 1,989 (57.0%) |
| 25 to 34 Years | 3,935 (85.3%) | 3,737 (89.0%) |
| 35 to 44 Years | 4,035 (91.3%) | 3,800 (87.8%) |
| 45 to 54 Years | 3,188 (92.6%) | 2,844 (89.4%) |
| 55 to 64 Years | 3,173 (94.2%) | 3,104 (91.7%) |
| 65 to 74 Years | 2,212 (92.8%) | 2,322 (94.7%) |
| 75 Years and over | 1,405 (90.8%) | 1,768 (84.9%) |
| Total | 27,158 (86.8%) | 25,818 (83.7%) |
Income Below Poverty Among Married-Couple Families in Clay County
The poverty statistics for married-couple families in Clay County show that 3.3% or 399 of the total 12,068 families live below the poverty line. Families with 5 or more children have the highest poverty rate of 83.7%, comprising of 205 families. On the other hand, families with 1 or 2 children have the lowest poverty rate of 0.7%, which includes 28 families.
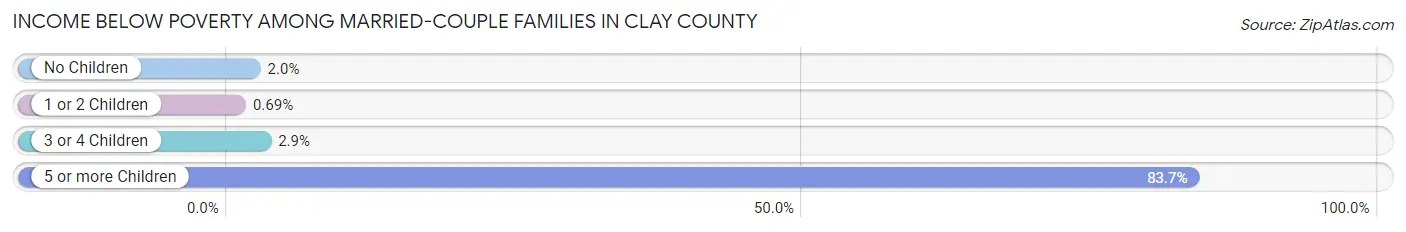
| Children | Above Poverty | Below Poverty |
| No Children | 6,283 (98.0%) | 126 (2.0%) |
| 1 or 2 Children | 4,004 (99.3%) | 28 (0.7%) |
| 3 or 4 Children | 1,342 (97.1%) | 40 (2.9%) |
| 5 or more Children | 40 (16.3%) | 205 (83.7%) |
| Total | 11,669 (96.7%) | 399 (3.3%) |
Income Below Poverty Among Single-Parent Households in Clay County
According to the poverty data in Clay County, 14.2% or 155 single-father households and 27.4% or 626 single-mother households are living below the poverty line. Among single-father households, those with no children have the highest poverty rate, with 78 households (17.6%) experiencing poverty. Likewise, among single-mother households, those with 3 or 4 children have the highest poverty rate, with 175 households (64.6%) falling below the poverty line.
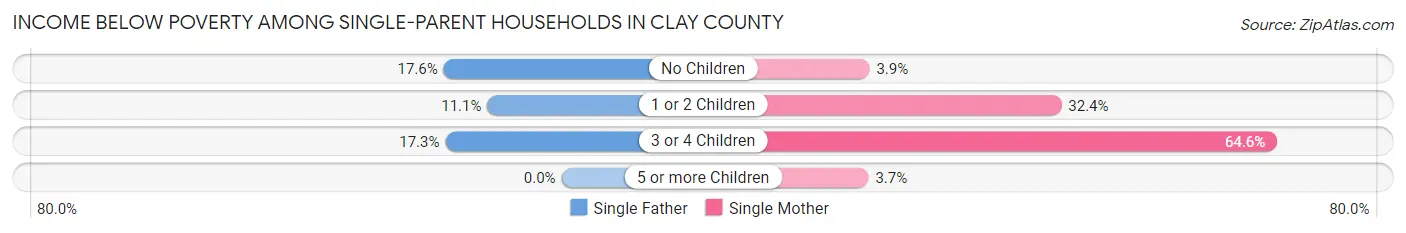
| Children | Single Father | Single Mother |
| No Children | 78 (17.6%) | 26 (3.8%) |
| 1 or 2 Children | 59 (11.1%) | 424 (32.4%) |
| 3 or 4 Children | 18 (17.3%) | 175 (64.6%) |
| 5 or more Children | 0 (0.0%) | 1 (3.7%) |
| Total | 155 (14.2%) | 626 (27.4%) |
Income Below Poverty Among Married-Couple vs Single-Parent Households in Clay County
The poverty data for Clay County shows that 399 of the married-couple family households (3.3%) and 781 of the single-parent households (23.2%) are living below the poverty level. Within the married-couple family households, those with 5 or more children have the highest poverty rate, with 205 households (83.7%) falling below the poverty line. Among the single-parent households, those with 3 or 4 children have the highest poverty rate, with 193 household (51.5%) living below poverty.
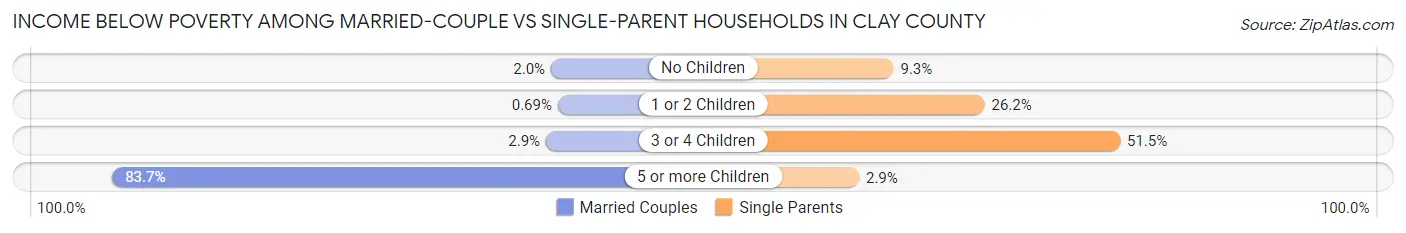
| Children | Married-Couple Families | Single-Parent Households |
| No Children | 126 (2.0%) | 104 (9.3%) |
| 1 or 2 Children | 28 (0.7%) | 483 (26.2%) |
| 3 or 4 Children | 40 (2.9%) | 193 (51.5%) |
| 5 or more Children | 205 (83.7%) | 1 (2.9%) |
| Total | 399 (3.3%) | 781 (23.2%) |
Employment Characteristics in Clay County
Employment by Class of Employer in Clay County
Among the 33,554 employed individuals in Clay County, private company employees (20,752 | 61.9%), not-for-profit organizations (4,536 | 13.5%), and local government employees (3,129 | 9.3%) make up the most common classes of employment.
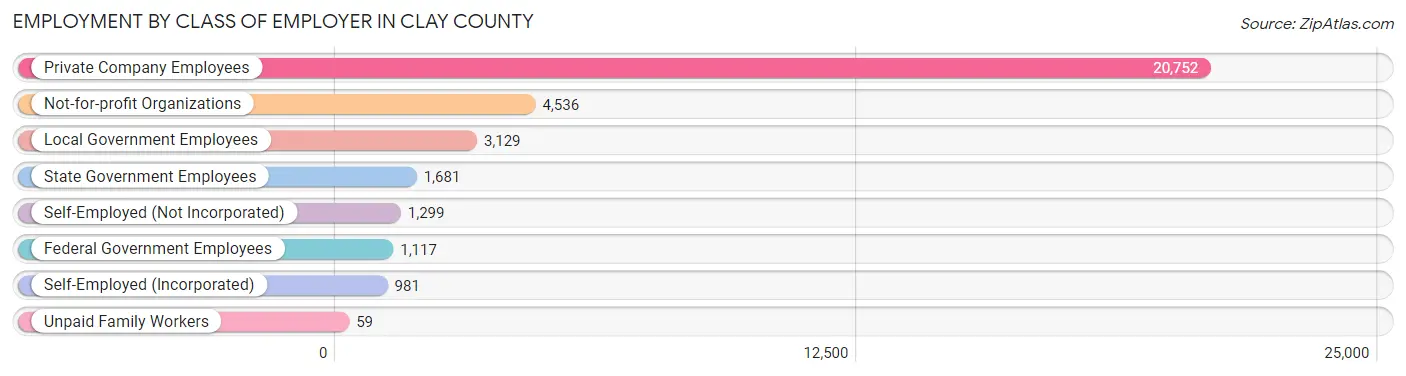
| Employer Class | # Employees | % Employees |
| Private Company Employees | 20,752 | 61.9% |
| Self-Employed (Incorporated) | 981 | 2.9% |
| Self-Employed (Not Incorporated) | 1,299 | 3.9% |
| Not-for-profit Organizations | 4,536 | 13.5% |
| Local Government Employees | 3,129 | 9.3% |
| State Government Employees | 1,681 | 5.0% |
| Federal Government Employees | 1,117 | 3.3% |
| Unpaid Family Workers | 59 | 0.2% |
| Total | 33,554 | 100.0% |
Employment Status by Age in Clay County
According to the labor force statistics for Clay County, out of the total population over 16 years of age (50,709), 70.9% or 35,953 individuals are in the labor force, with 4.0% or 1,438 of them unemployed. The age group with the highest labor force participation rate is 25 to 29 years, with 91.4% or 3,807 individuals in the labor force. Within the labor force, the 16 to 19 years age range has the highest percentage of unemployed individuals, with 9.9% or 258 of them being unemployed.
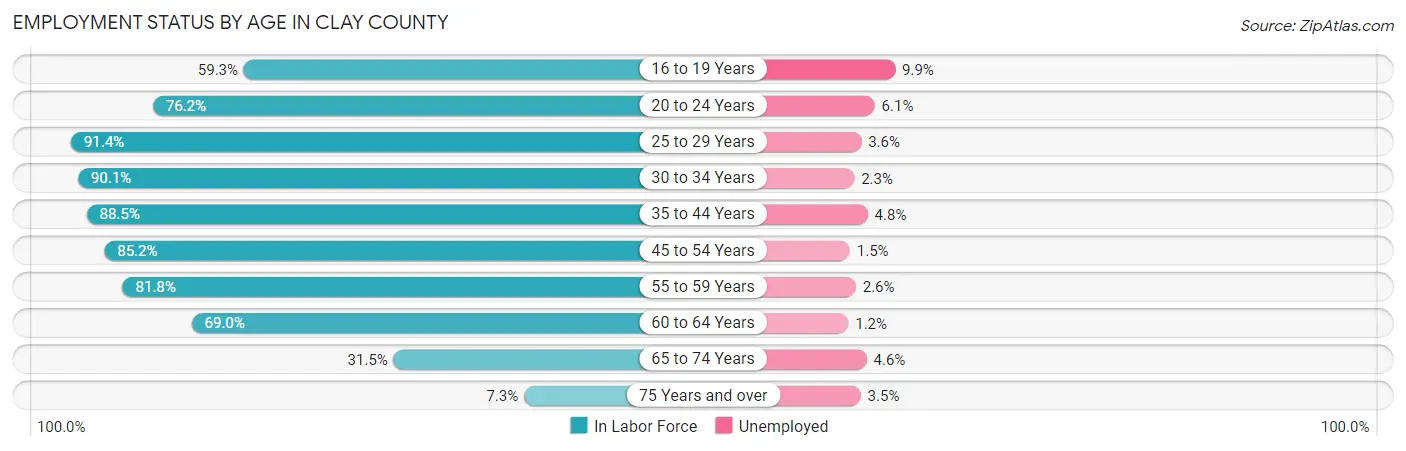
| Age Bracket | In Labor Force | Unemployed |
| 16 to 19 Years | 2,607 (59.3%) | 258 (9.9%) |
| 20 to 24 Years | 4,910 (76.2%) | 300 (6.1%) |
| 25 to 29 Years | 3,807 (91.4%) | 137 (3.6%) |
| 30 to 34 Years | 4,223 (90.1%) | 97 (2.3%) |
| 35 to 44 Years | 7,782 (88.5%) | 374 (4.8%) |
| 45 to 54 Years | 5,644 (85.2%) | 85 (1.5%) |
| 55 to 59 Years | 2,977 (81.8%) | 77 (2.6%) |
| 60 to 64 Years | 2,160 (69.0%) | 26 (1.2%) |
| 65 to 74 Years | 1,543 (31.5%) | 71 (4.6%) |
| 75 Years and over | 287 (7.3%) | 10 (3.5%) |
| Total | 35,953 (70.9%) | 1,438 (4.0%) |
Employment Status by Educational Attainment in Clay County
According to labor force statistics for Clay County, 85.7% of individuals (26,600) out of the total population between 25 and 64 years of age (31,038) are in the labor force, with 3.0% or 798 of them being unemployed. The group with the highest labor force participation rate are those with the educational attainment of bachelor's degree or higher, with 93.2% or 11,224 individuals in the labor force. Within the labor force, individuals with less than high school education have the highest percentage of unemployment, with 24.4% or 218 of them being unemployed.
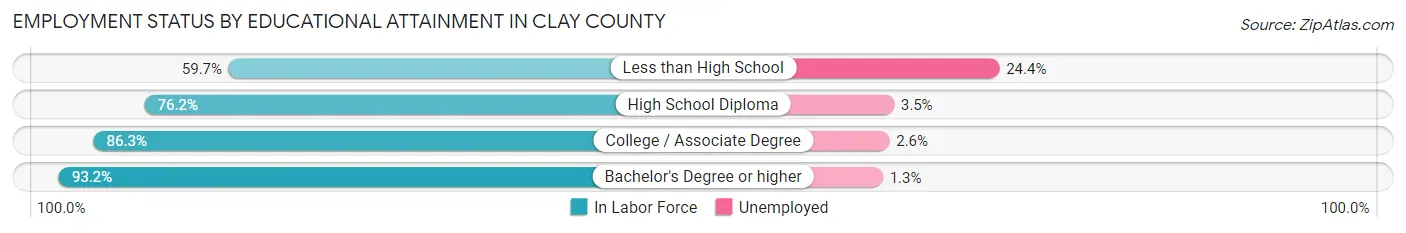
| Educational Attainment | In Labor Force | Unemployed |
| Less than High School | 893 (59.7%) | 365 (24.4%) |
| High School Diploma | 4,688 (76.2%) | 215 (3.5%) |
| College / Associate Degree | 9,793 (86.3%) | 295 (2.6%) |
| Bachelor's Degree or higher | 11,224 (93.2%) | 157 (1.3%) |
| Total | 26,600 (85.7%) | 931 (3.0%) |
Employment Occupations by Sex in Clay County
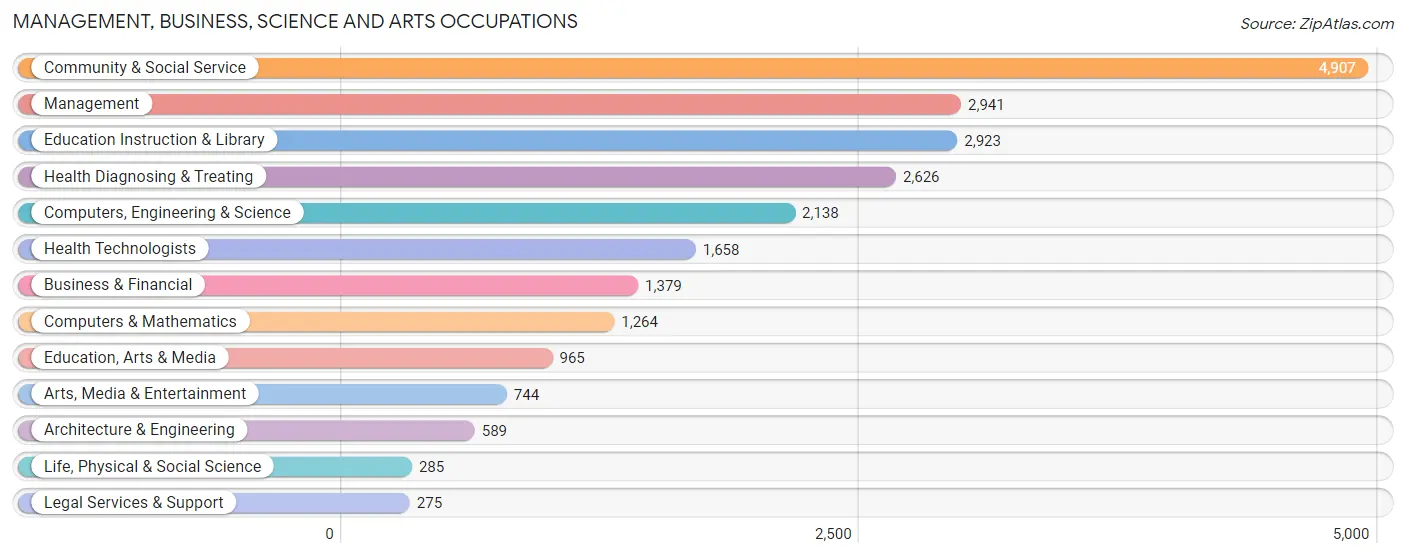
Management, Business, Science and Arts Occupations
The most common Management, Business, Science and Arts occupations in Clay County are Community & Social Service (4,907 | 14.3%), Management (2,941 | 8.6%), Education Instruction & Library (2,923 | 8.5%), Health Diagnosing & Treating (2,626 | 7.6%), and Computers, Engineering & Science (2,138 | 6.2%).
Management, Business, Science and Arts Occupations by Sex
Within the Management, Business, Science and Arts occupations in Clay County, the most male-oriented occupations are Architecture & Engineering (94.1%), Computers, Engineering & Science (73.3%), and Computers & Mathematics (68.3%), while the most female-oriented occupations are Health Technologists (86.6%), Health Diagnosing & Treating (84.1%), and Education Instruction & Library (69.0%).
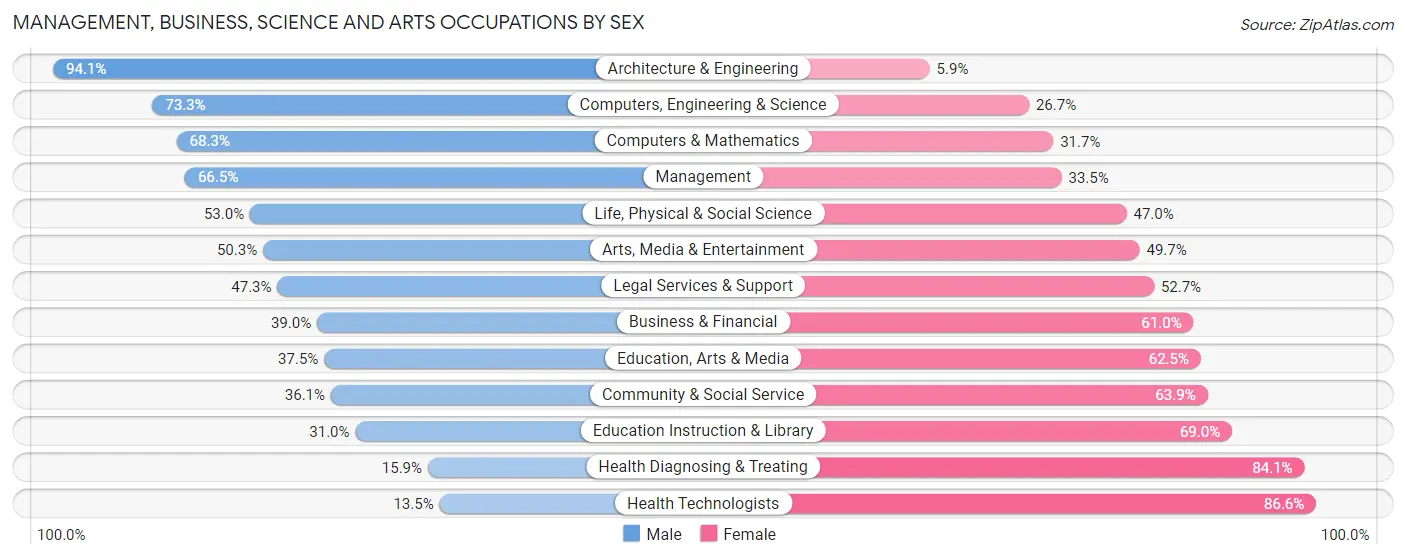
| Occupation | Male | Female |
| Management | 1,957 (66.5%) | 984 (33.5%) |
| Business & Financial | 538 (39.0%) | 841 (61.0%) |
| Computers, Engineering & Science | 1,568 (73.3%) | 570 (26.7%) |
| Computers & Mathematics | 863 (68.3%) | 401 (31.7%) |
| Architecture & Engineering | 554 (94.1%) | 35 (5.9%) |
| Life, Physical & Social Science | 151 (53.0%) | 134 (47.0%) |
| Community & Social Service | 1,772 (36.1%) | 3,135 (63.9%) |
| Education, Arts & Media | 362 (37.5%) | 603 (62.5%) |
| Legal Services & Support | 130 (47.3%) | 145 (52.7%) |
| Education Instruction & Library | 906 (31.0%) | 2,017 (69.0%) |
| Arts, Media & Entertainment | 374 (50.3%) | 370 (49.7%) |
| Health Diagnosing & Treating | 417 (15.9%) | 2,209 (84.1%) |
| Health Technologists | 223 (13.5%) | 1,435 (86.6%) |
| Total (Category) | 6,252 (44.7%) | 7,739 (55.3%) |
| Total (Overall) | 17,413 (50.6%) | 16,991 (49.4%) |
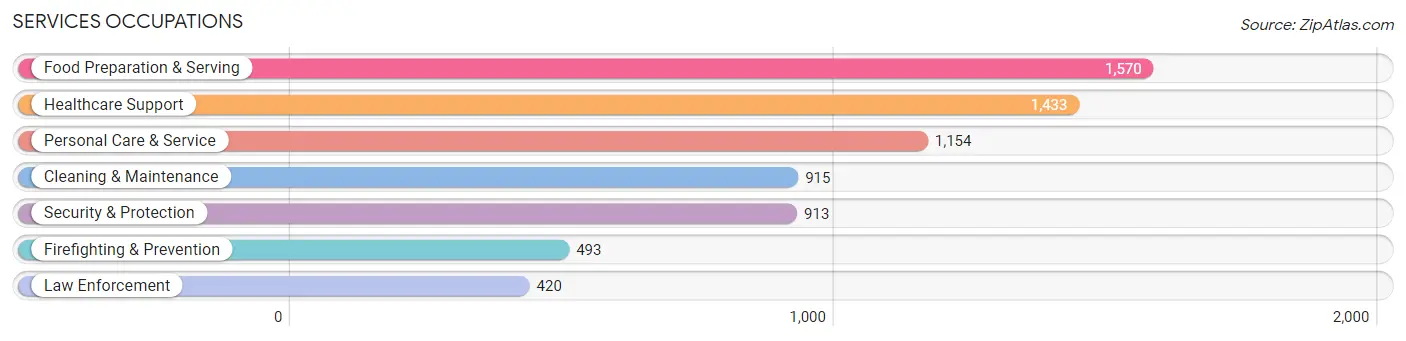
Services Occupations
The most common Services occupations in Clay County are Food Preparation & Serving (1,570 | 4.6%), Healthcare Support (1,433 | 4.2%), Personal Care & Service (1,154 | 3.4%), Cleaning & Maintenance (915 | 2.7%), and Security & Protection (913 | 2.6%).
Services Occupations by Sex
Within the Services occupations in Clay County, the most male-oriented occupations are Law Enforcement (78.3%), Security & Protection (74.8%), and Firefighting & Prevention (71.8%), while the most female-oriented occupations are Personal Care & Service (91.2%), Healthcare Support (83.1%), and Food Preparation & Serving (63.3%).
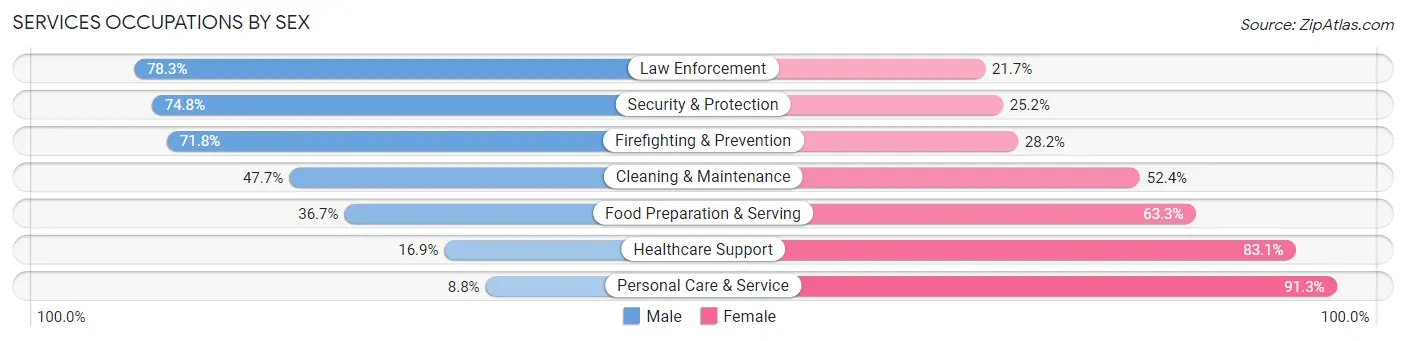
| Occupation | Male | Female |
| Healthcare Support | 242 (16.9%) | 1,191 (83.1%) |
| Security & Protection | 683 (74.8%) | 230 (25.2%) |
| Firefighting & Prevention | 354 (71.8%) | 139 (28.2%) |
| Law Enforcement | 329 (78.3%) | 91 (21.7%) |
| Food Preparation & Serving | 576 (36.7%) | 994 (63.3%) |
| Cleaning & Maintenance | 436 (47.6%) | 479 (52.3%) |
| Personal Care & Service | 101 (8.7%) | 1,053 (91.2%) |
| Total (Category) | 2,038 (34.1%) | 3,947 (65.9%) |
| Total (Overall) | 17,413 (50.6%) | 16,991 (49.4%) |
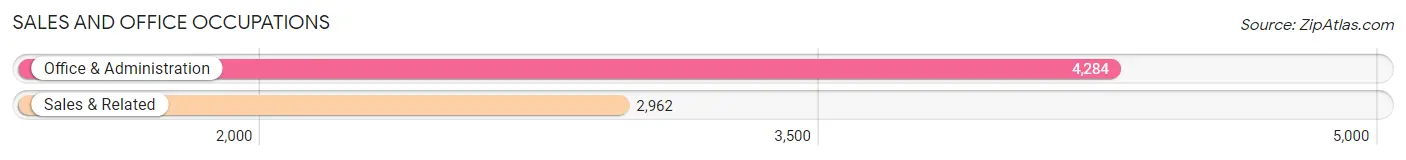
Sales and Office Occupations
The most common Sales and Office occupations in Clay County are Office & Administration (4,284 | 12.4%), and Sales & Related (2,962 | 8.6%).
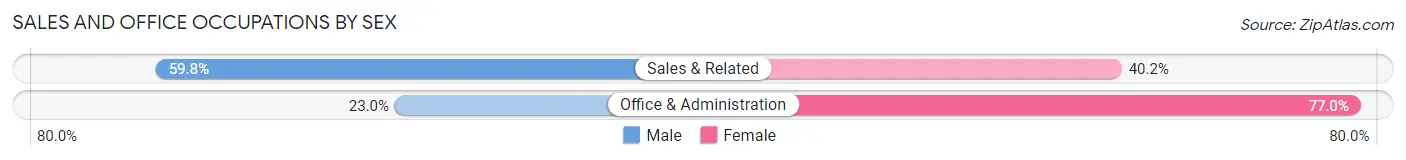
Sales and Office Occupations by Sex
| Occupation | Male | Female |
| Sales & Related | 1,772 (59.8%) | 1,190 (40.2%) |
| Office & Administration | 987 (23.0%) | 3,297 (77.0%) |
| Total (Category) | 2,759 (38.1%) | 4,487 (61.9%) |
| Total (Overall) | 17,413 (50.6%) | 16,991 (49.4%) |
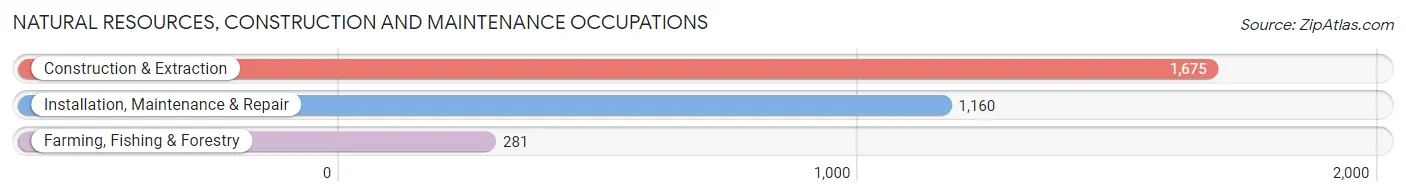
Natural Resources, Construction and Maintenance Occupations
The most common Natural Resources, Construction and Maintenance occupations in Clay County are Construction & Extraction (1,675 | 4.9%), Installation, Maintenance & Repair (1,160 | 3.4%), and Farming, Fishing & Forestry (281 | 0.8%).
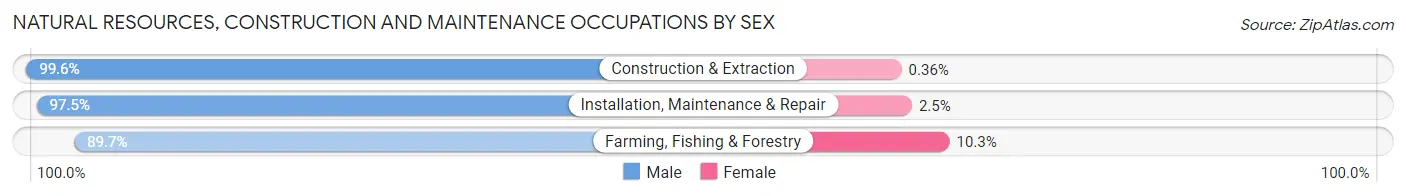
Natural Resources, Construction and Maintenance Occupations by Sex
| Occupation | Male | Female |
| Farming, Fishing & Forestry | 252 (89.7%) | 29 (10.3%) |
| Construction & Extraction | 1,669 (99.6%) | 6 (0.4%) |
| Installation, Maintenance & Repair | 1,131 (97.5%) | 29 (2.5%) |
| Total (Category) | 3,052 (98.0%) | 64 (2.1%) |
| Total (Overall) | 17,413 (50.6%) | 16,991 (49.4%) |
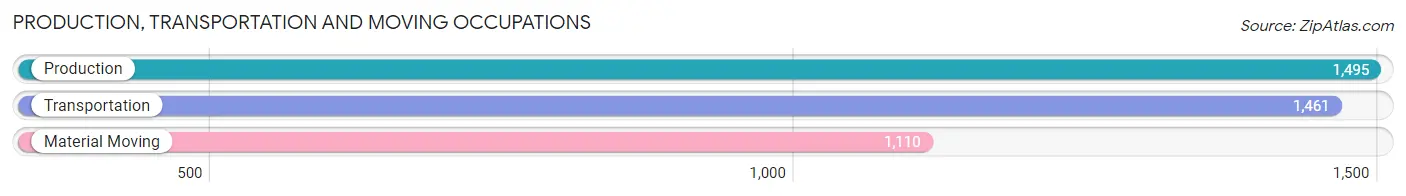
Production, Transportation and Moving Occupations
The most common Production, Transportation and Moving occupations in Clay County are Production (1,495 | 4.3%), Transportation (1,461 | 4.3%), and Material Moving (1,110 | 3.2%).
Production, Transportation and Moving Occupations by Sex
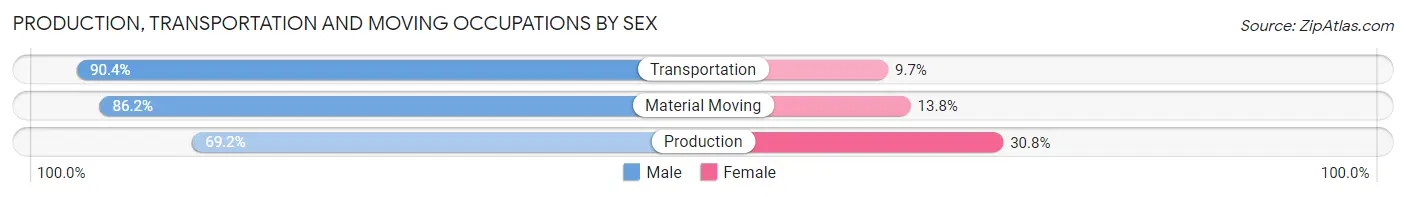
| Occupation | Male | Female |
| Production | 1,035 (69.2%) | 460 (30.8%) |
| Transportation | 1,320 (90.3%) | 141 (9.7%) |
| Material Moving | 957 (86.2%) | 153 (13.8%) |
| Total (Category) | 3,312 (81.5%) | 754 (18.5%) |
| Total (Overall) | 17,413 (50.6%) | 16,991 (49.4%) |
Employment Industries by Sex in Clay County
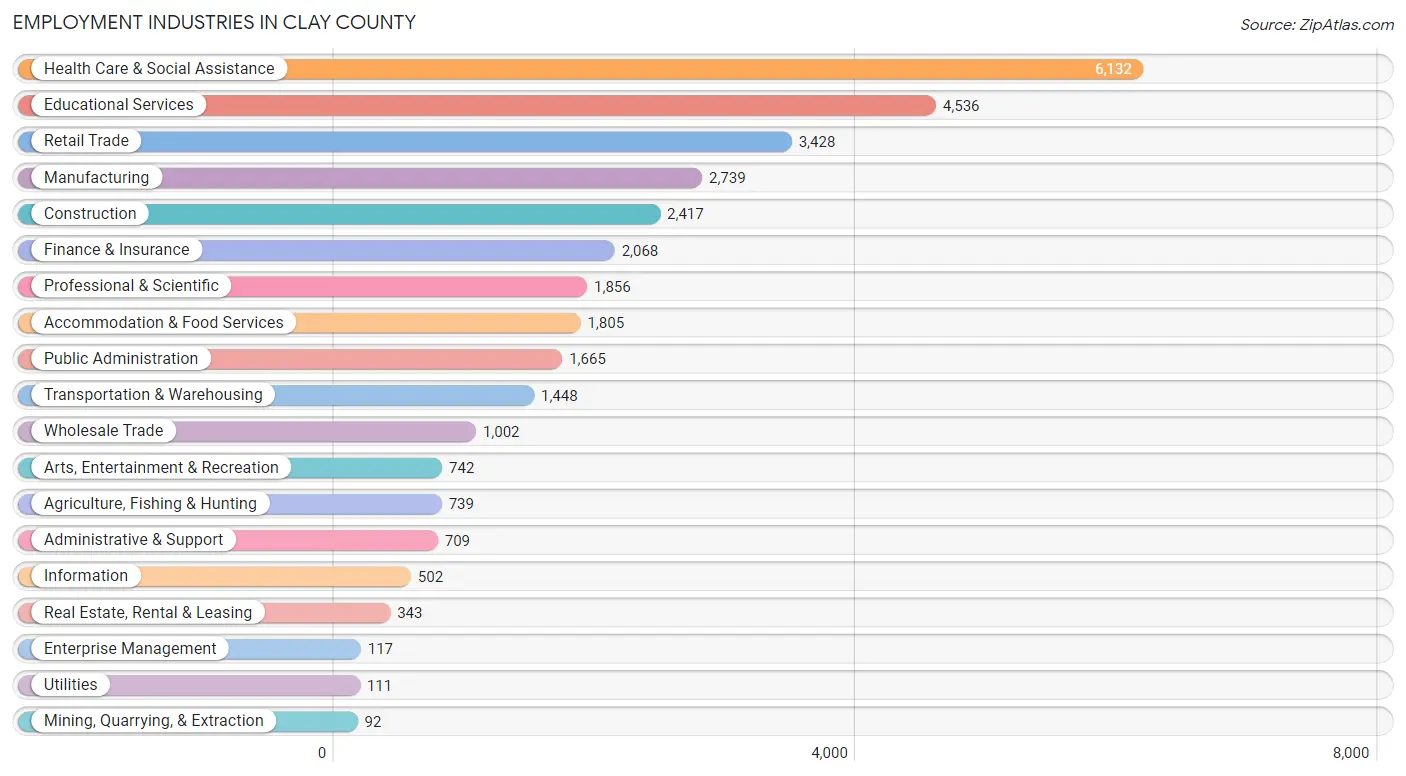
Employment Industries in Clay County
The major employment industries in Clay County include Health Care & Social Assistance (6,132 | 17.8%), Educational Services (4,536 | 13.2%), Retail Trade (3,428 | 10.0%), Manufacturing (2,739 | 8.0%), and Construction (2,417 | 7.0%).
Employment Industries by Sex in Clay County
The Clay County industries that see more men than women are Utilities (96.4%), Construction (94.6%), and Agriculture, Fishing & Hunting (92.0%), whereas the industries that tend to have a higher number of women are Health Care & Social Assistance (81.3%), Educational Services (68.3%), and Finance & Insurance (63.5%).
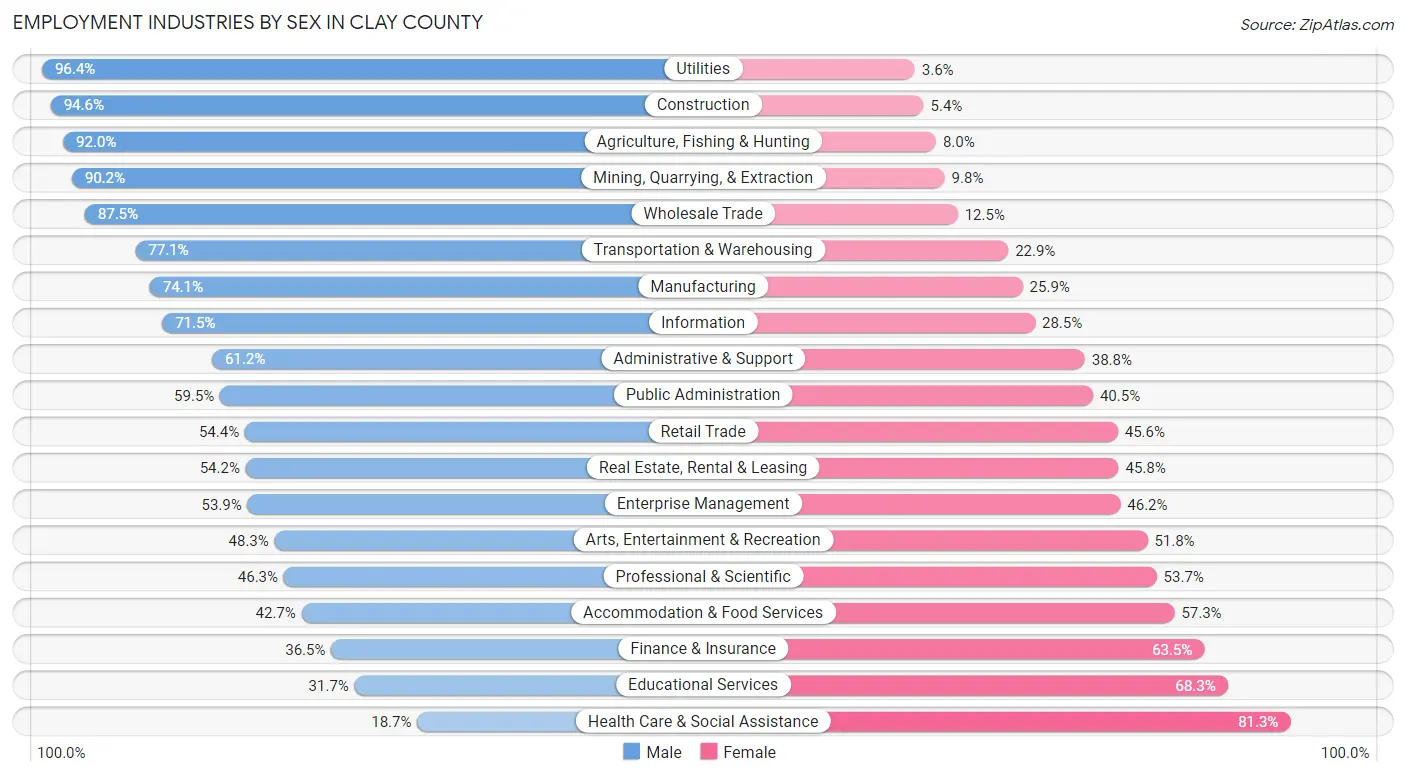
| Industry | Male | Female |
| Agriculture, Fishing & Hunting | 680 (92.0%) | 59 (8.0%) |
| Mining, Quarrying, & Extraction | 83 (90.2%) | 9 (9.8%) |
| Construction | 2,286 (94.6%) | 131 (5.4%) |
| Manufacturing | 2,029 (74.1%) | 710 (25.9%) |
| Wholesale Trade | 877 (87.5%) | 125 (12.5%) |
| Retail Trade | 1,864 (54.4%) | 1,564 (45.6%) |
| Transportation & Warehousing | 1,116 (77.1%) | 332 (22.9%) |
| Utilities | 107 (96.4%) | 4 (3.6%) |
| Information | 359 (71.5%) | 143 (28.5%) |
| Finance & Insurance | 755 (36.5%) | 1,313 (63.5%) |
| Real Estate, Rental & Leasing | 186 (54.2%) | 157 (45.8%) |
| Professional & Scientific | 860 (46.3%) | 996 (53.7%) |
| Enterprise Management | 63 (53.8%) | 54 (46.2%) |
| Administrative & Support | 434 (61.2%) | 275 (38.8%) |
| Educational Services | 1,437 (31.7%) | 3,099 (68.3%) |
| Health Care & Social Assistance | 1,147 (18.7%) | 4,985 (81.3%) |
| Arts, Entertainment & Recreation | 358 (48.2%) | 384 (51.7%) |
| Accommodation & Food Services | 770 (42.7%) | 1,035 (57.3%) |
| Public Administration | 991 (59.5%) | 674 (40.5%) |
| Total | 17,413 (50.6%) | 16,991 (49.4%) |
Education in Clay County
School Enrollment in Clay County
The most common levels of schooling among the 20,008 students in Clay County are college / undergraduate (6,656 | 33.3%), elementary school (3,795 | 19.0%), and middle school (3,579 | 17.9%).
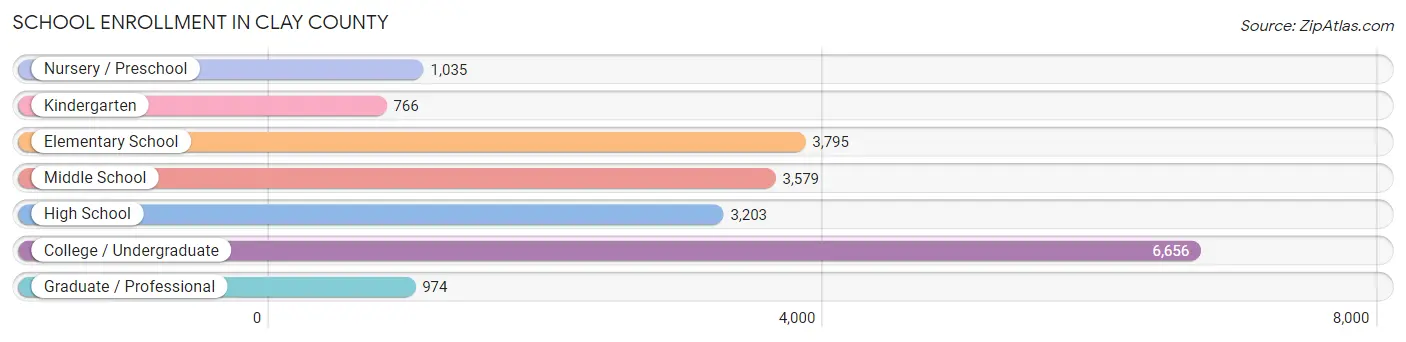
| School Level | # Students | % Students |
| Nursery / Preschool | 1,035 | 5.2% |
| Kindergarten | 766 | 3.8% |
| Elementary School | 3,795 | 19.0% |
| Middle School | 3,579 | 17.9% |
| High School | 3,203 | 16.0% |
| College / Undergraduate | 6,656 | 33.3% |
| Graduate / Professional | 974 | 4.9% |
| Total | 20,008 | 100.0% |
School Enrollment by Age by Funding Source in Clay County
Out of a total of 20,008 students who are enrolled in schools in Clay County, 3,561 (17.8%) attend a private institution, while the remaining 16,447 (82.2%) are enrolled in public schools. The age group of 20 to 24 year olds has the highest likelihood of being enrolled in private schools, with 1,204 (32.2% in the age bracket) enrolled. Conversely, the age group of 10 to 14 year olds has the lowest likelihood of being enrolled in a private school, with 3,986 (91.0% in the age bracket) attending a public institution.
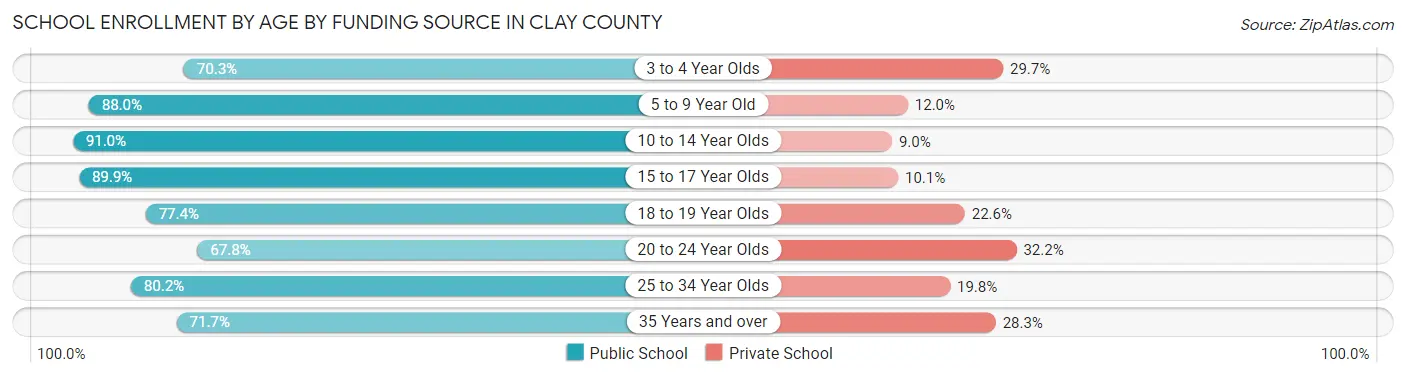
| Age Bracket | Public School | Private School |
| 3 to 4 Year Olds | 481 (70.3%) | 203 (29.7%) |
| 5 to 9 Year Old | 3,821 (88.0%) | 519 (12.0%) |
| 10 to 14 Year Olds | 3,986 (91.0%) | 394 (9.0%) |
| 15 to 17 Year Olds | 2,244 (89.9%) | 253 (10.1%) |
| 18 to 19 Year Olds | 2,005 (77.4%) | 584 (22.6%) |
| 20 to 24 Year Olds | 2,536 (67.8%) | 1,204 (32.2%) |
| 25 to 34 Year Olds | 919 (80.2%) | 227 (19.8%) |
| 35 Years and over | 453 (71.7%) | 179 (28.3%) |
| Total | 16,447 (82.2%) | 3,561 (17.8%) |
Educational Attainment by Field of Study in Clay County
Education (2,891 | 17.6%), business (2,453 | 14.9%), science & technology (1,952 | 11.9%), arts & humanities (1,732 | 10.5%), and social sciences (1,229 | 7.5%) are the most common fields of study among 16,412 individuals in Clay County who have obtained a bachelor's degree or higher.
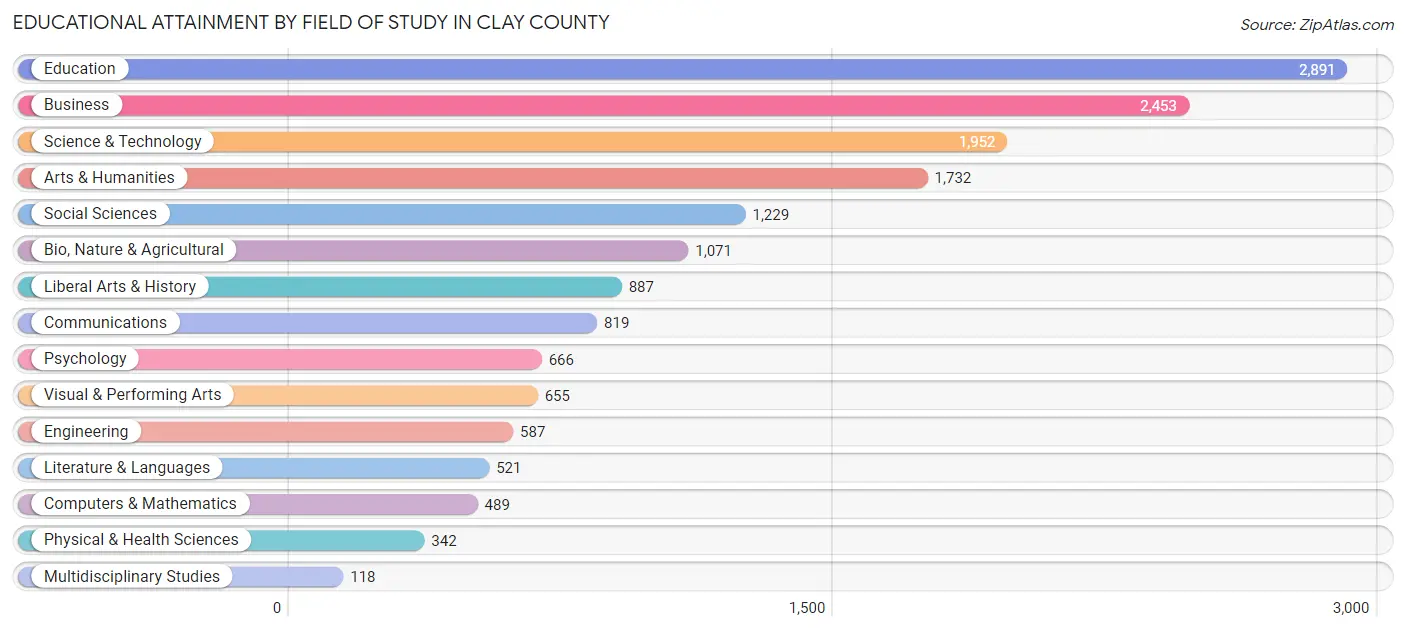
| Field of Study | # Graduates | % Graduates |
| Computers & Mathematics | 489 | 3.0% |
| Bio, Nature & Agricultural | 1,071 | 6.5% |
| Physical & Health Sciences | 342 | 2.1% |
| Psychology | 666 | 4.1% |
| Social Sciences | 1,229 | 7.5% |
| Engineering | 587 | 3.6% |
| Multidisciplinary Studies | 118 | 0.7% |
| Science & Technology | 1,952 | 11.9% |
| Business | 2,453 | 14.9% |
| Education | 2,891 | 17.6% |
| Literature & Languages | 521 | 3.2% |
| Liberal Arts & History | 887 | 5.4% |
| Visual & Performing Arts | 655 | 4.0% |
| Communications | 819 | 5.0% |
| Arts & Humanities | 1,732 | 10.5% |
| Total | 16,412 | 100.0% |
Transportation & Commute in Clay County
Vehicle Availability by Sex in Clay County
The most prevalent vehicle ownership categories in Clay County are males with 2 vehicles (7,480, accounting for 45.0%) and females with 2 vehicles (6,954, making up 47.5%).
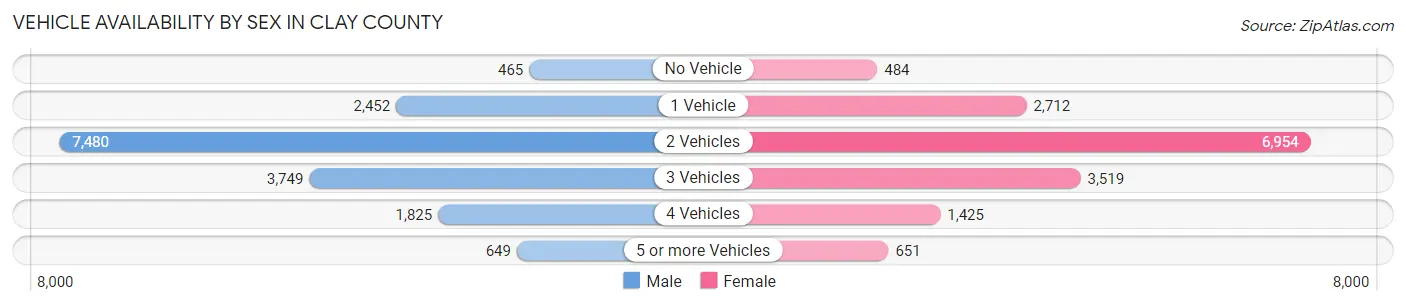
| Vehicles Available | Male | Female |
| No Vehicle | 465 (2.8%) | 484 (3.1%) |
| 1 Vehicle | 2,452 (14.7%) | 2,712 (17.2%) |
| 2 Vehicles | 7,480 (45.0%) | 6,954 (44.2%) |
| 3 Vehicles | 3,749 (22.6%) | 3,519 (22.4%) |
| 4 Vehicles | 1,825 (11.0%) | 1,425 (9.0%) |
| 5 or more Vehicles | 649 (3.9%) | 651 (4.1%) |
| Total | 16,620 (100.0%) | 15,745 (100.0%) |
Commute Time in Clay County
The most frequently occuring commute durations in Clay County are 15 to 19 minutes (7,816 commuters, 25.8%), 10 to 14 minutes (5,820 commuters, 19.2%), and 20 to 24 minutes (4,279 commuters, 14.1%).
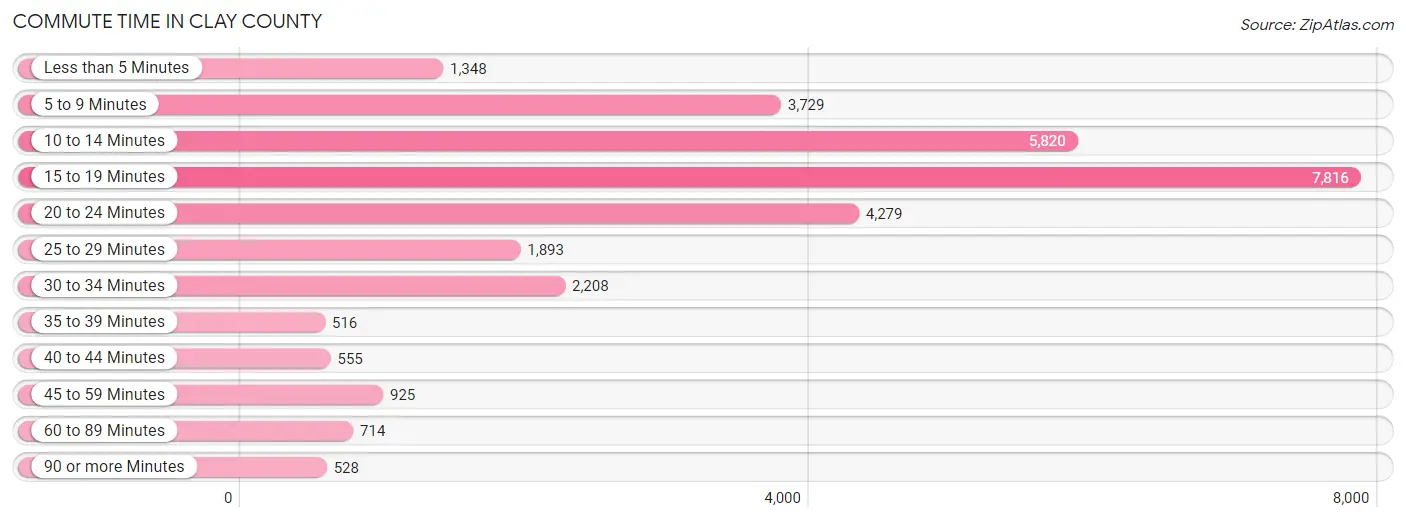
| Commute Time | # Commuters | % Commuters |
| Less than 5 Minutes | 1,348 | 4.4% |
| 5 to 9 Minutes | 3,729 | 12.3% |
| 10 to 14 Minutes | 5,820 | 19.2% |
| 15 to 19 Minutes | 7,816 | 25.8% |
| 20 to 24 Minutes | 4,279 | 14.1% |
| 25 to 29 Minutes | 1,893 | 6.2% |
| 30 to 34 Minutes | 2,208 | 7.3% |
| 35 to 39 Minutes | 516 | 1.7% |
| 40 to 44 Minutes | 555 | 1.8% |
| 45 to 59 Minutes | 925 | 3.0% |
| 60 to 89 Minutes | 714 | 2.4% |
| 90 or more Minutes | 528 | 1.7% |
Commute Time by Sex in Clay County
The most common commute times in Clay County are 15 to 19 minutes (4,449 commuters, 28.2%) for males and 15 to 19 minutes (3,367 commuters, 23.2%) for females.
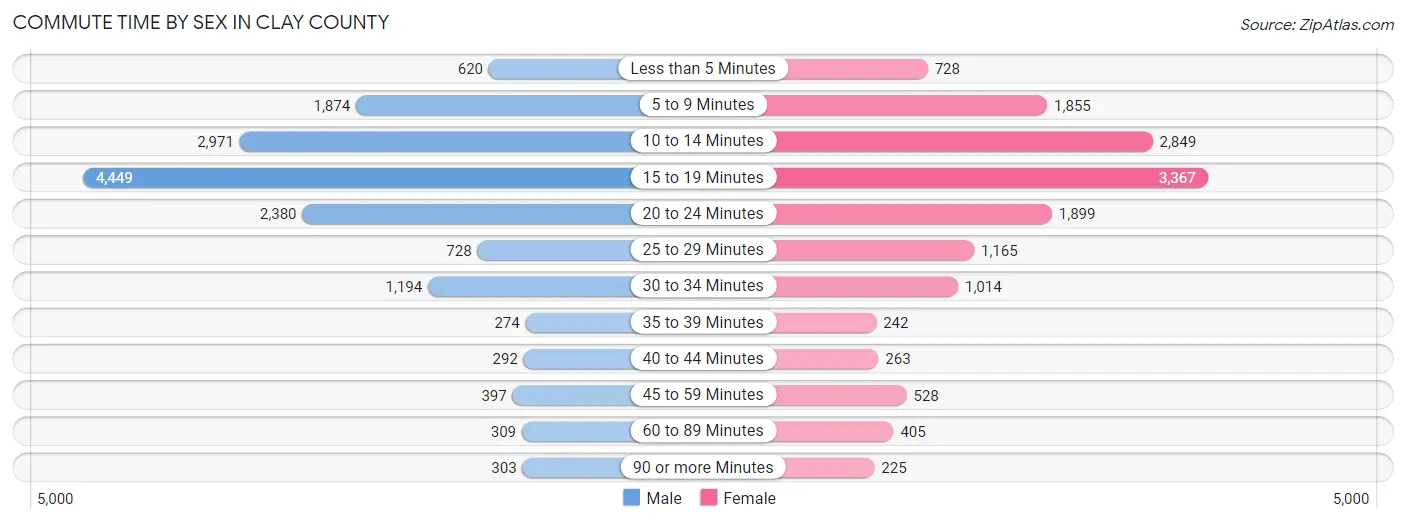
| Commute Time | Male | Female |
| Less than 5 Minutes | 620 (3.9%) | 728 (5.0%) |
| 5 to 9 Minutes | 1,874 (11.9%) | 1,855 (12.8%) |
| 10 to 14 Minutes | 2,971 (18.8%) | 2,849 (19.6%) |
| 15 to 19 Minutes | 4,449 (28.2%) | 3,367 (23.2%) |
| 20 to 24 Minutes | 2,380 (15.1%) | 1,899 (13.1%) |
| 25 to 29 Minutes | 728 (4.6%) | 1,165 (8.0%) |
| 30 to 34 Minutes | 1,194 (7.6%) | 1,014 (7.0%) |
| 35 to 39 Minutes | 274 (1.7%) | 242 (1.7%) |
| 40 to 44 Minutes | 292 (1.8%) | 263 (1.8%) |
| 45 to 59 Minutes | 397 (2.5%) | 528 (3.6%) |
| 60 to 89 Minutes | 309 (2.0%) | 405 (2.8%) |
| 90 or more Minutes | 303 (1.9%) | 225 (1.5%) |
Time of Departure to Work by Sex in Clay County
The most frequent times of departure to work in Clay County are 7:00 AM to 7:29 AM (2,706, 17.1%) for males and 7:30 AM to 7:59 AM (3,272, 22.5%) for females.
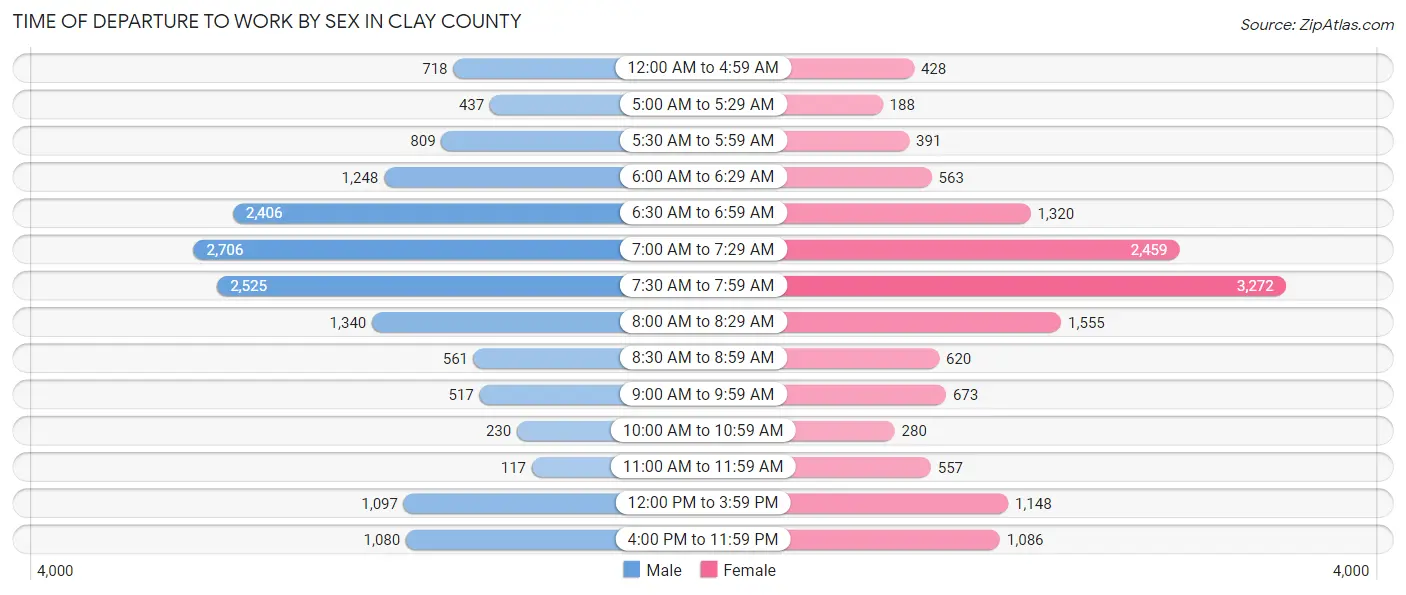
| Time of Departure | Male | Female |
| 12:00 AM to 4:59 AM | 718 (4.5%) | 428 (2.9%) |
| 5:00 AM to 5:29 AM | 437 (2.8%) | 188 (1.3%) |
| 5:30 AM to 5:59 AM | 809 (5.1%) | 391 (2.7%) |
| 6:00 AM to 6:29 AM | 1,248 (7.9%) | 563 (3.9%) |
| 6:30 AM to 6:59 AM | 2,406 (15.2%) | 1,320 (9.1%) |
| 7:00 AM to 7:29 AM | 2,706 (17.1%) | 2,459 (16.9%) |
| 7:30 AM to 7:59 AM | 2,525 (16.0%) | 3,272 (22.5%) |
| 8:00 AM to 8:29 AM | 1,340 (8.5%) | 1,555 (10.7%) |
| 8:30 AM to 8:59 AM | 561 (3.5%) | 620 (4.3%) |
| 9:00 AM to 9:59 AM | 517 (3.3%) | 673 (4.6%) |
| 10:00 AM to 10:59 AM | 230 (1.5%) | 280 (1.9%) |
| 11:00 AM to 11:59 AM | 117 (0.7%) | 557 (3.8%) |
| 12:00 PM to 3:59 PM | 1,097 (7.0%) | 1,148 (7.9%) |
| 4:00 PM to 11:59 PM | 1,080 (6.8%) | 1,086 (7.5%) |
| Total | 15,791 (100.0%) | 14,540 (100.0%) |
Housing Occupancy in Clay County
Occupancy by Ownership in Clay County
Of the total 25,512 dwellings in Clay County, owner-occupied units account for 16,854 (66.1%), while renter-occupied units make up 8,658 (33.9%).
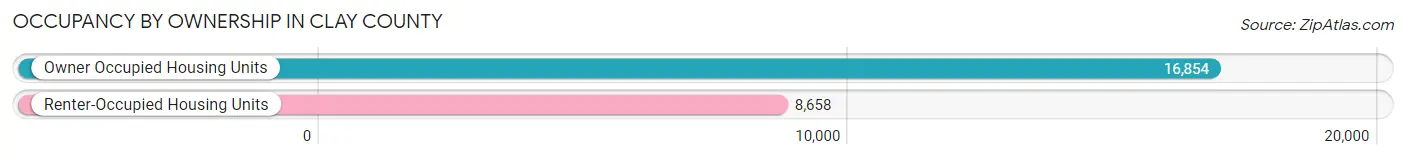
| Occupancy | # Housing Units | % Housing Units |
| Owner Occupied Housing Units | 16,854 | 66.1% |
| Renter-Occupied Housing Units | 8,658 | 33.9% |
| Total Occupied Housing Units | 25,512 | 100.0% |
Occupancy by Household Size in Clay County
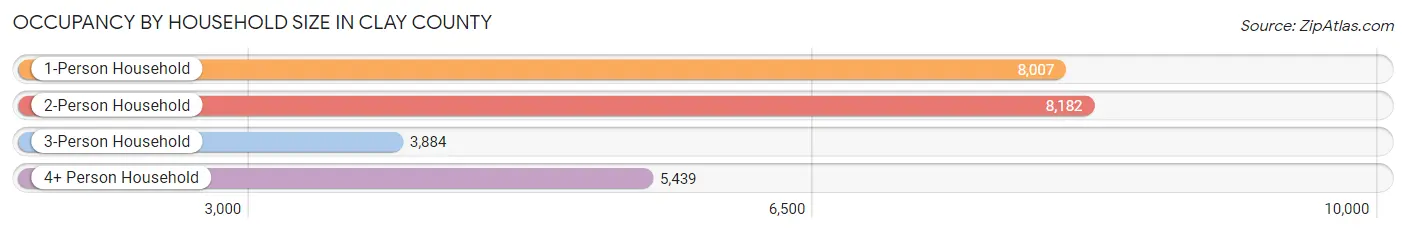
| Household Size | # Housing Units | % Housing Units |
| 1-Person Household | 8,007 | 31.4% |
| 2-Person Household | 8,182 | 32.1% |
| 3-Person Household | 3,884 | 15.2% |
| 4+ Person Household | 5,439 | 21.3% |
| Total Housing Units | 25,512 | 100.0% |
Occupancy by Ownership by Household Size in Clay County
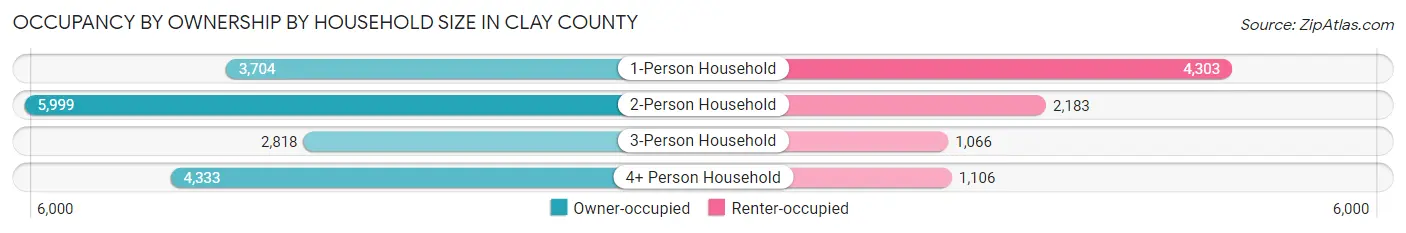
| Household Size | Owner-occupied | Renter-occupied |
| 1-Person Household | 3,704 (46.3%) | 4,303 (53.7%) |
| 2-Person Household | 5,999 (73.3%) | 2,183 (26.7%) |
| 3-Person Household | 2,818 (72.6%) | 1,066 (27.5%) |
| 4+ Person Household | 4,333 (79.7%) | 1,106 (20.3%) |
| Total Housing Units | 16,854 (66.1%) | 8,658 (33.9%) |
Occupancy by Educational Attainment in Clay County
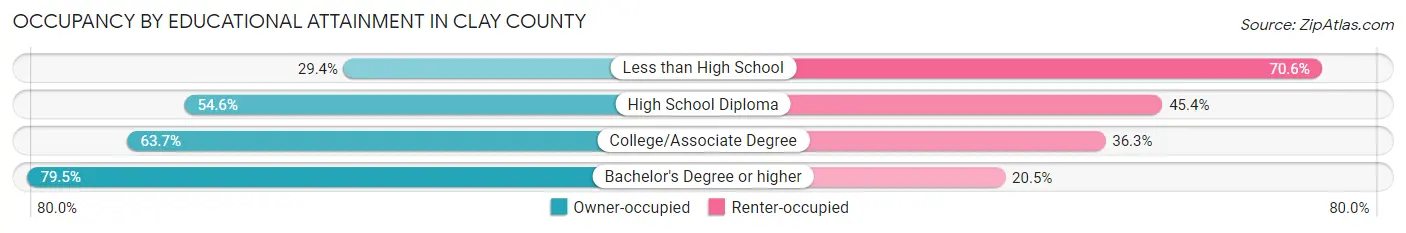
| Household Size | Owner-occupied | Renter-occupied |
| Less than High School | 325 (29.4%) | 782 (70.6%) |
| High School Diploma | 3,111 (54.6%) | 2,584 (45.4%) |
| College/Associate Degree | 5,870 (63.7%) | 3,351 (36.3%) |
| Bachelor's Degree or higher | 7,548 (79.5%) | 1,941 (20.5%) |
Occupancy by Age of Householder in Clay County
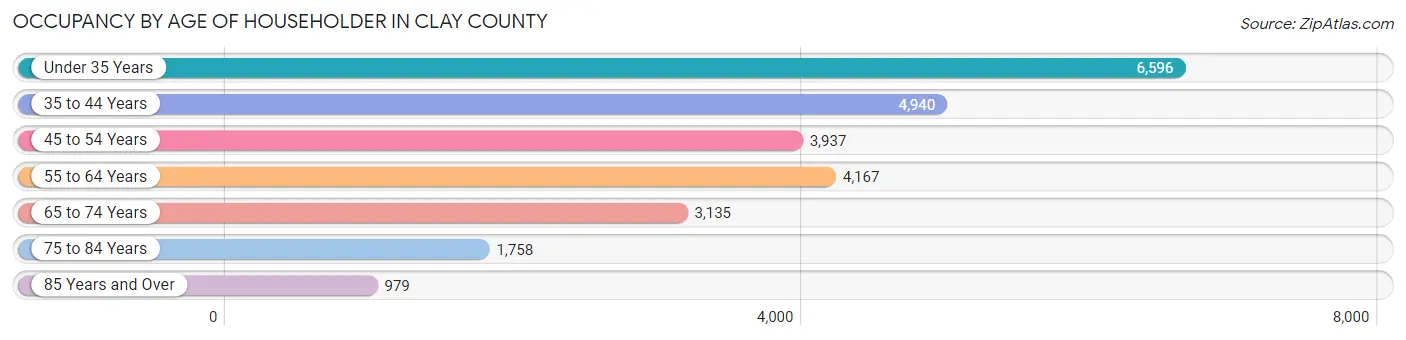
| Age Bracket | # Households | % Households |
| Under 35 Years | 6,596 | 25.9% |
| 35 to 44 Years | 4,940 | 19.4% |
| 45 to 54 Years | 3,937 | 15.4% |
| 55 to 64 Years | 4,167 | 16.3% |
| 65 to 74 Years | 3,135 | 12.3% |
| 75 to 84 Years | 1,758 | 6.9% |
| 85 Years and Over | 979 | 3.8% |
| Total | 25,512 | 100.0% |
Housing Finances in Clay County
Median Income by Occupancy in Clay County
| Occupancy Type | # Households | Median Income |
| Owner-Occupied | 16,854 (66.1%) | $99,205 |
| Renter-Occupied | 8,658 (33.9%) | $33,918 |
| Average | 25,512 (100.0%) | $75,006 |
Occupancy by Householder Income Bracket in Clay County
| Income Bracket | Owner-occupied | Renter-occupied |
| Less than $5,000 | 210 (1.3%) | 510 (5.9%) |
| $5,000 to $9,999 | 162 (1.0%) | 809 (9.3%) |
| $10,000 to $14,999 | 166 (1.0%) | 864 (10.0%) |
| $15,000 to $19,999 | 327 (1.9%) | 685 (7.9%) |
| $20,000 to $24,999 | 234 (1.4%) | 601 (6.9%) |
| $25,000 to $34,999 | 859 (5.1%) | 947 (10.9%) |
| $35,000 to $49,999 | 1,363 (8.1%) | 1,322 (15.3%) |
| $50,000 to $74,999 | 2,506 (14.9%) | 1,190 (13.7%) |
| $75,000 to $99,999 | 2,663 (15.8%) | 932 (10.8%) |
| $100,000 to $149,999 | 4,509 (26.8%) | 583 (6.7%) |
| $150,000 or more | 3,855 (22.9%) | 215 (2.5%) |
| Total | 16,854 (100.0%) | 8,658 (100.0%) |
Monthly Housing Cost Tiers in Clay County
| Monthly Cost | Owner-occupied | Renter-occupied |
| Less than $300 | 279 (1.7%) | 208 (2.4%) |
| $300 to $499 | 1,405 (8.3%) | 459 (5.3%) |
| $500 to $799 | 2,884 (17.1%) | 1,999 (23.1%) |
| $800 to $999 | 1,424 (8.5%) | 1,728 (20.0%) |
| $1,000 to $1,499 | 3,436 (20.4%) | 2,418 (27.9%) |
| $1,500 to $1,999 | 3,809 (22.6%) | 844 (9.8%) |
| $2,000 to $2,499 | 1,833 (10.9%) | 375 (4.3%) |
| $2,500 to $2,999 | 1,053 (6.2%) | 139 (1.6%) |
| $3,000 or more | 731 (4.3%) | 44 (0.5%) |
| Total | 16,854 (100.0%) | 8,658 (100.0%) |
Physical Housing Characteristics in Clay County
Housing Structures in Clay County
| Structure Type | # Housing Units | % Housing Units |
| Single Unit, Detached | 15,940 | 62.5% |
| Single Unit, Attached | 2,195 | 8.6% |
| 2 Unit Apartments | 400 | 1.6% |
| 3 or 4 Unit Apartments | 598 | 2.3% |
| 5 to 9 Unit Apartments | 827 | 3.2% |
| 10 or more Apartments | 5,056 | 19.8% |
| Mobile Home / Other | 496 | 1.9% |
| Total | 25,512 | 100.0% |
Housing Structures by Occupancy in Clay County
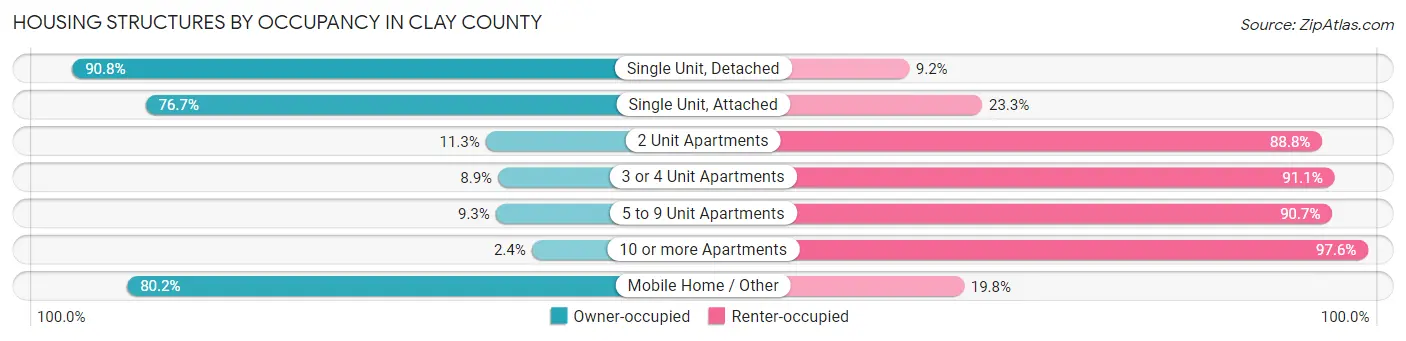
| Structure Type | Owner-occupied | Renter-occupied |
| Single Unit, Detached | 14,476 (90.8%) | 1,464 (9.2%) |
| Single Unit, Attached | 1,684 (76.7%) | 511 (23.3%) |
| 2 Unit Apartments | 45 (11.3%) | 355 (88.7%) |
| 3 or 4 Unit Apartments | 53 (8.9%) | 545 (91.1%) |
| 5 to 9 Unit Apartments | 77 (9.3%) | 750 (90.7%) |
| 10 or more Apartments | 121 (2.4%) | 4,935 (97.6%) |
| Mobile Home / Other | 398 (80.2%) | 98 (19.8%) |
| Total | 16,854 (66.1%) | 8,658 (33.9%) |
Housing Structures by Number of Rooms in Clay County
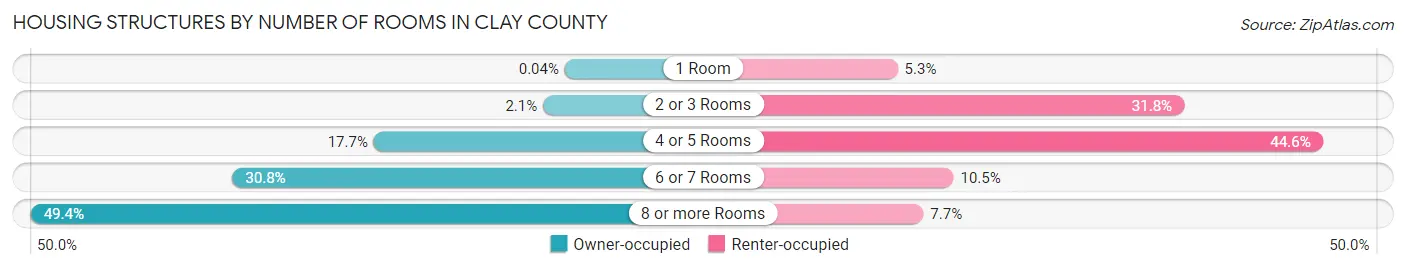
| Number of Rooms | Owner-occupied | Renter-occupied |
| 1 Room | 6 (0.0%) | 462 (5.3%) |
| 2 or 3 Rooms | 345 (2.1%) | 2,754 (31.8%) |
| 4 or 5 Rooms | 2,985 (17.7%) | 3,864 (44.6%) |
| 6 or 7 Rooms | 5,187 (30.8%) | 910 (10.5%) |
| 8 or more Rooms | 8,331 (49.4%) | 668 (7.7%) |
| Total | 16,854 (100.0%) | 8,658 (100.0%) |
Housing Structure by Heating Type in Clay County
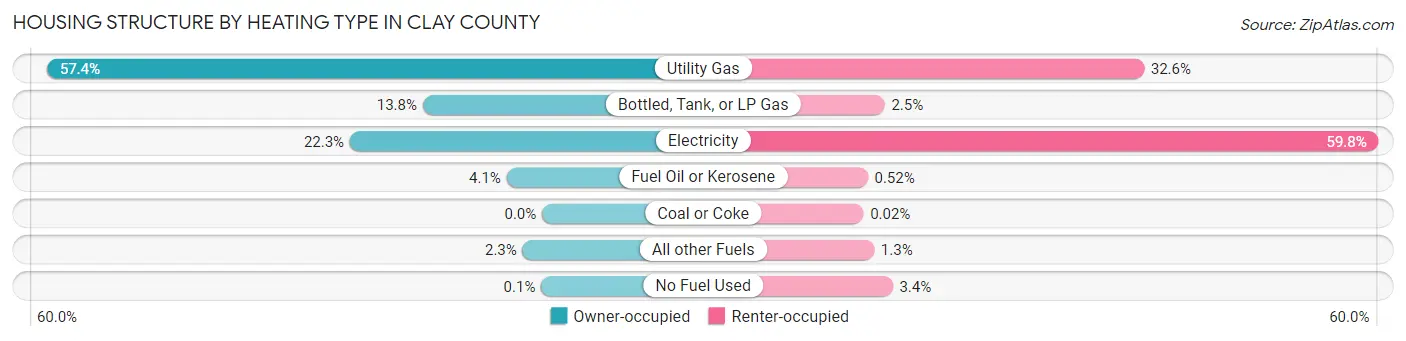
| Heating Type | Owner-occupied | Renter-occupied |
| Utility Gas | 9,678 (57.4%) | 2,818 (32.6%) |
| Bottled, Tank, or LP Gas | 2,331 (13.8%) | 215 (2.5%) |
| Electricity | 3,755 (22.3%) | 5,174 (59.8%) |
| Fuel Oil or Kerosene | 692 (4.1%) | 45 (0.5%) |
| Coal or Coke | 0 (0.0%) | 2 (0.0%) |
| All other Fuels | 381 (2.3%) | 109 (1.3%) |
| No Fuel Used | 17 (0.1%) | 295 (3.4%) |
| Total | 16,854 (100.0%) | 8,658 (100.0%) |
Household Vehicle Usage in Clay County
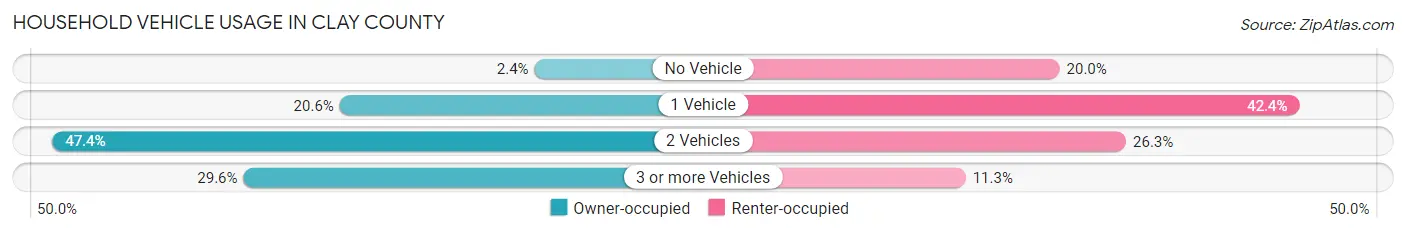
| Vehicles per Household | Owner-occupied | Renter-occupied |
| No Vehicle | 407 (2.4%) | 1,735 (20.0%) |
| 1 Vehicle | 3,470 (20.6%) | 3,673 (42.4%) |
| 2 Vehicles | 7,991 (47.4%) | 2,273 (26.3%) |
| 3 or more Vehicles | 4,986 (29.6%) | 977 (11.3%) |
| Total | 16,854 (100.0%) | 8,658 (100.0%) |
Real Estate & Mortgages in Clay County
Real Estate and Mortgage Overview in Clay County
| Characteristic | Without Mortgage | With Mortgage |
| Housing Units | 5,671 | 11,183 |
| Median Property Value | $225,900 | $247,600 |
| Median Household Income | $74,718 | $2,935 |
| Monthly Housing Costs | $638 | $729 |
| Real Estate Taxes | $2,581 | $270 |
Property Value by Mortgage Status in Clay County
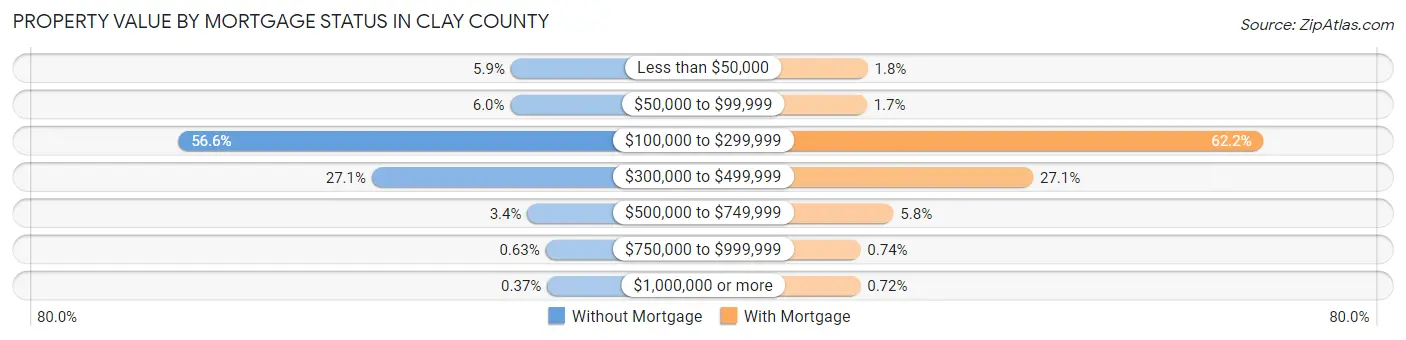
| Property Value | Without Mortgage | With Mortgage |
| Less than $50,000 | 336 (5.9%) | 206 (1.8%) |
| $50,000 to $99,999 | 339 (6.0%) | 190 (1.7%) |
| $100,000 to $299,999 | 3,209 (56.6%) | 6,953 (62.2%) |
| $300,000 to $499,999 | 1,537 (27.1%) | 3,025 (27.1%) |
| $500,000 to $749,999 | 193 (3.4%) | 645 (5.8%) |
| $750,000 to $999,999 | 36 (0.6%) | 83 (0.7%) |
| $1,000,000 or more | 21 (0.4%) | 81 (0.7%) |
| Total | 5,671 (100.0%) | 11,183 (100.0%) |
Household Income by Mortgage Status in Clay County
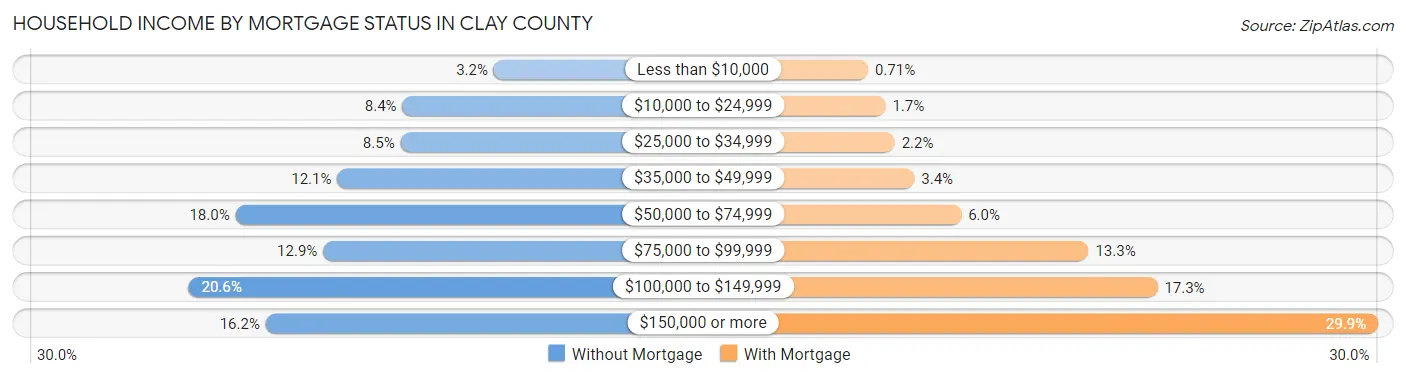
| Household Income | Without Mortgage | With Mortgage |
| Less than $10,000 | 181 (3.2%) | 79 (0.7%) |
| $10,000 to $24,999 | 477 (8.4%) | 191 (1.7%) |
| $25,000 to $34,999 | 483 (8.5%) | 250 (2.2%) |
| $35,000 to $49,999 | 688 (12.1%) | 376 (3.4%) |
| $50,000 to $74,999 | 1,018 (17.9%) | 675 (6.0%) |
| $75,000 to $99,999 | 734 (12.9%) | 1,488 (13.3%) |
| $100,000 to $149,999 | 1,170 (20.6%) | 1,929 (17.2%) |
| $150,000 or more | 920 (16.2%) | 3,339 (29.9%) |
| Total | 5,671 (100.0%) | 11,183 (100.0%) |
Property Value to Household Income Ratio in Clay County
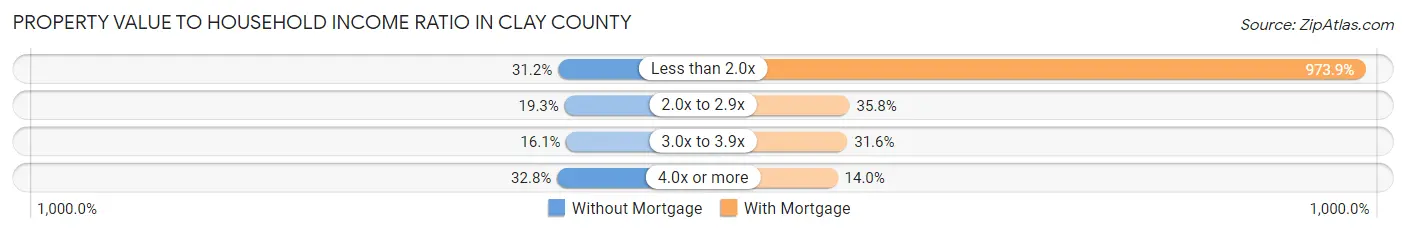
| Value-to-Income Ratio | Without Mortgage | With Mortgage |
| Less than 2.0x | 1,767 (31.2%) | 108,906 (973.9%) |
| 2.0x to 2.9x | 1,095 (19.3%) | 4,002 (35.8%) |
| 3.0x to 3.9x | 910 (16.1%) | 3,532 (31.6%) |
| 4.0x or more | 1,861 (32.8%) | 1,567 (14.0%) |
| Total | 5,671 (100.0%) | 11,183 (100.0%) |
Real Estate Taxes by Mortgage Status in Clay County
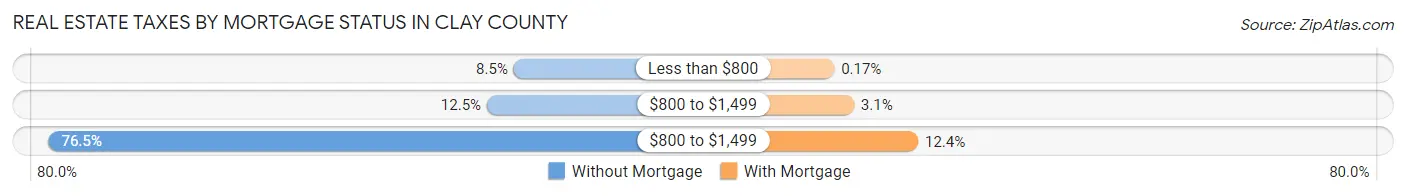
| Property Taxes | Without Mortgage | With Mortgage |
| Less than $800 | 484 (8.5%) | 19 (0.2%) |
| $800 to $1,499 | 706 (12.4%) | 341 (3.0%) |
| $800 to $1,499 | 4,338 (76.5%) | 1,389 (12.4%) |
| Total | 5,671 (100.0%) | 11,183 (100.0%) |
Health & Disability in Clay County
Health Insurance Coverage by Age in Clay County
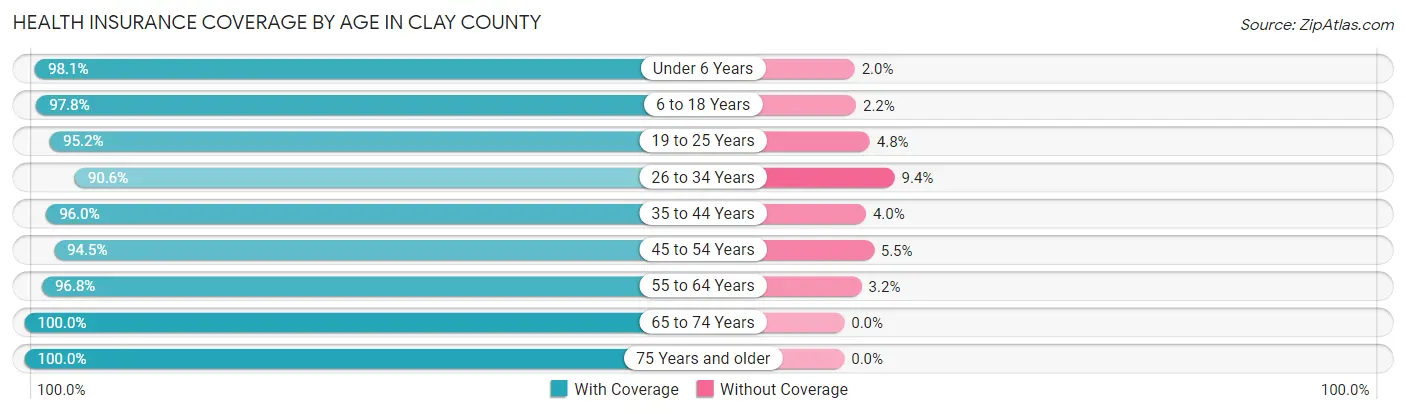
| Age Bracket | With Coverage | Without Coverage |
| Under 6 Years | 5,085 (98.1%) | 101 (1.9%) |
| 6 to 18 Years | 11,949 (97.8%) | 267 (2.2%) |
| 19 to 25 Years | 8,603 (95.2%) | 431 (4.8%) |
| 26 to 34 Years | 7,041 (90.6%) | 729 (9.4%) |
| 35 to 44 Years | 8,346 (96.0%) | 351 (4.0%) |
| 45 to 54 Years | 6,259 (94.5%) | 364 (5.5%) |
| 55 to 64 Years | 6,533 (96.8%) | 219 (3.2%) |
| 65 to 74 Years | 4,836 (100.0%) | 0 (0.0%) |
| 75 Years and older | 3,631 (100.0%) | 0 (0.0%) |
| Total | 62,283 (96.2%) | 2,462 (3.8%) |
Health Insurance Coverage by Citizenship Status in Clay County
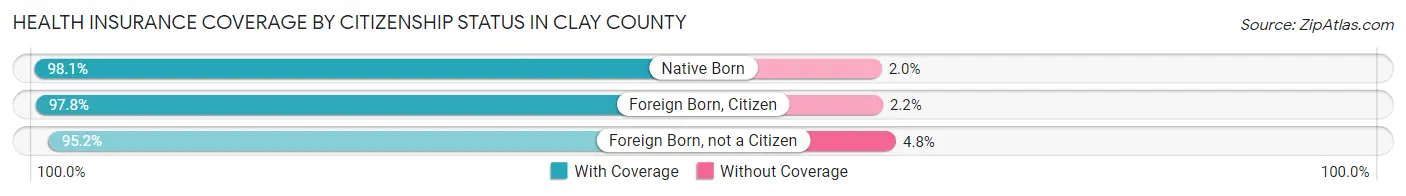
| Citizenship Status | With Coverage | Without Coverage |
| Native Born | 5,085 (98.1%) | 101 (1.9%) |
| Foreign Born, Citizen | 11,949 (97.8%) | 267 (2.2%) |
| Foreign Born, not a Citizen | 8,603 (95.2%) | 431 (4.8%) |
Health Insurance Coverage by Household Income in Clay County
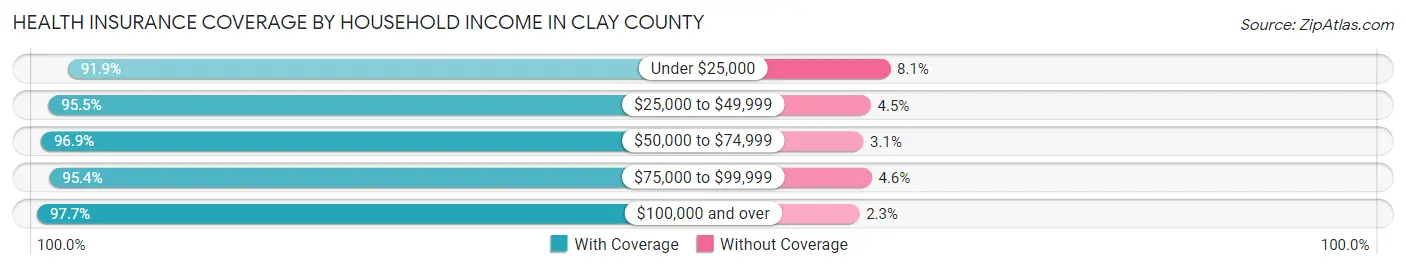
| Household Income | With Coverage | Without Coverage |
| Under $25,000 | 6,852 (91.9%) | 605 (8.1%) |
| $25,000 to $49,999 | 8,103 (95.5%) | 378 (4.5%) |
| $50,000 to $74,999 | 8,179 (96.9%) | 259 (3.1%) |
| $75,000 to $99,999 | 9,078 (95.4%) | 441 (4.6%) |
| $100,000 and over | 27,411 (97.7%) | 650 (2.3%) |
Public vs Private Health Insurance Coverage by Age in Clay County
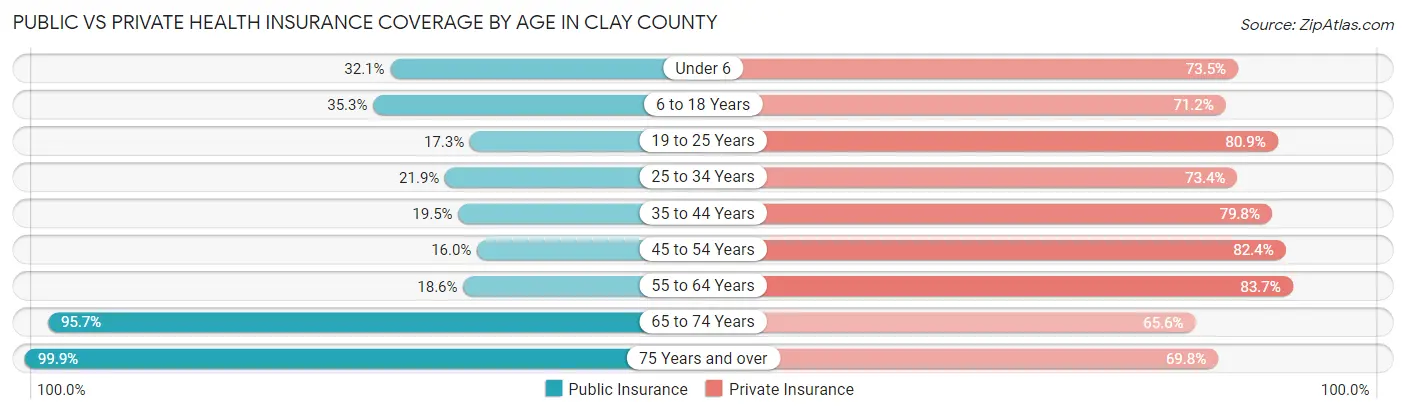
| Age Bracket | Public Insurance | Private Insurance |
| Under 6 | 1,665 (32.1%) | 3,813 (73.5%) |
| 6 to 18 Years | 4,310 (35.3%) | 8,699 (71.2%) |
| 19 to 25 Years | 1,566 (17.3%) | 7,306 (80.9%) |
| 25 to 34 Years | 1,705 (21.9%) | 5,705 (73.4%) |
| 35 to 44 Years | 1,694 (19.5%) | 6,940 (79.8%) |
| 45 to 54 Years | 1,059 (16.0%) | 5,454 (82.4%) |
| 55 to 64 Years | 1,253 (18.6%) | 5,649 (83.7%) |
| 65 to 74 Years | 4,626 (95.7%) | 3,174 (65.6%) |
| 75 Years and over | 3,629 (99.9%) | 2,535 (69.8%) |
| Total | 21,507 (33.2%) | 49,275 (76.1%) |
Disability Status by Sex by Age in Clay County
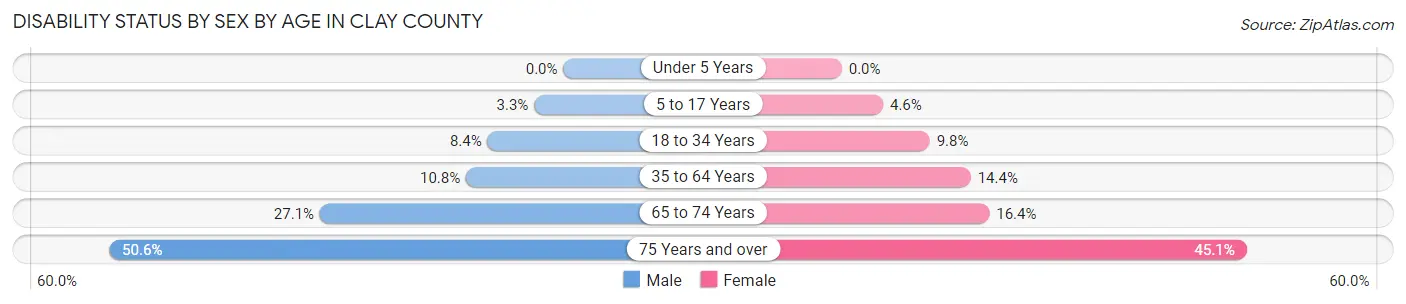
| Age Bracket | Male | Female |
| Under 5 Years | 0 (0.0%) | 0 (0.0%) |
| 5 to 17 Years | 197 (3.3%) | 259 (4.6%) |
| 18 to 34 Years | 746 (8.4%) | 906 (9.8%) |
| 35 to 64 Years | 1,212 (10.8%) | 1,564 (14.4%) |
| 65 to 74 Years | 646 (27.1%) | 403 (16.4%) |
| 75 Years and over | 783 (50.6%) | 939 (45.1%) |
Disability Class by Sex by Age in Clay County
Disability Class: Hearing Difficulty
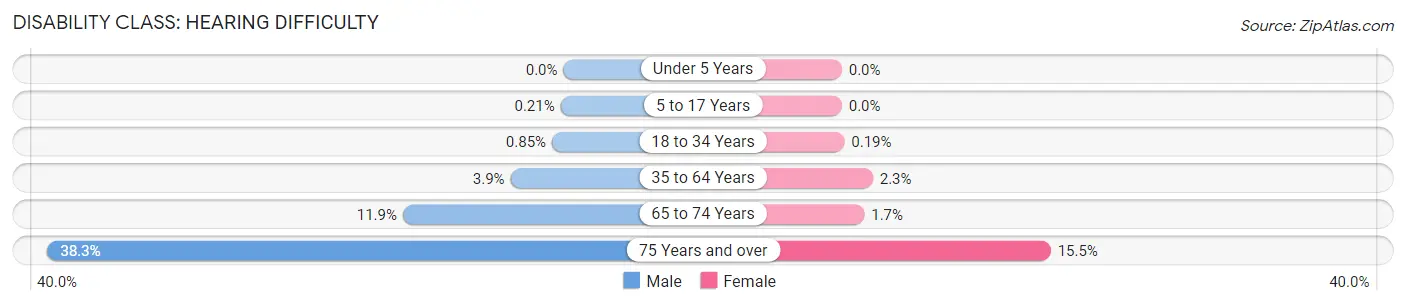
| Age Bracket | Male | Female |
| Under 5 Years | 0 (0.0%) | 0 (0.0%) |
| 5 to 17 Years | 13 (0.2%) | 0 (0.0%) |
| 18 to 34 Years | 75 (0.9%) | 18 (0.2%) |
| 35 to 64 Years | 439 (3.9%) | 251 (2.3%) |
| 65 to 74 Years | 284 (11.9%) | 41 (1.7%) |
| 75 Years and over | 593 (38.3%) | 323 (15.5%) |
Disability Class: Vision Difficulty
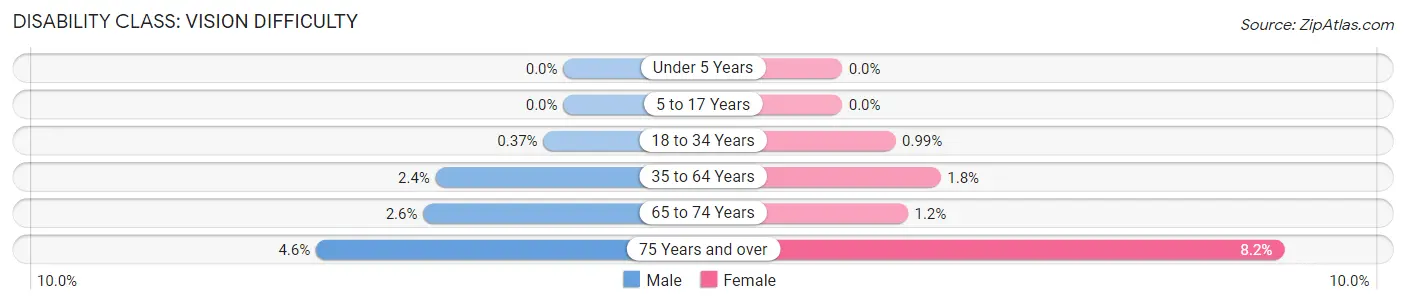
| Age Bracket | Male | Female |
| Under 5 Years | 0 (0.0%) | 0 (0.0%) |
| 5 to 17 Years | 0 (0.0%) | 0 (0.0%) |
| 18 to 34 Years | 33 (0.4%) | 92 (1.0%) |
| 35 to 64 Years | 265 (2.4%) | 199 (1.8%) |
| 65 to 74 Years | 62 (2.6%) | 30 (1.2%) |
| 75 Years and over | 71 (4.6%) | 171 (8.2%) |
Disability Class: Cognitive Difficulty
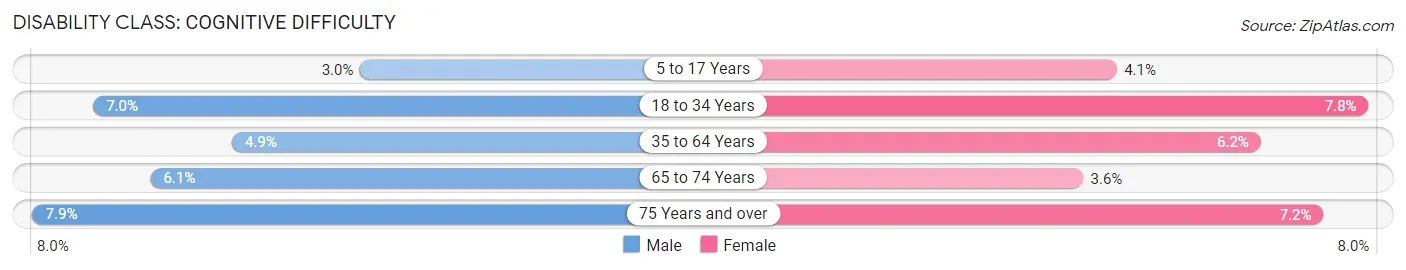
| Age Bracket | Male | Female |
| 5 to 17 Years | 184 (3.0%) | 231 (4.1%) |
| 18 to 34 Years | 617 (7.0%) | 724 (7.8%) |
| 35 to 64 Years | 550 (4.9%) | 678 (6.2%) |
| 65 to 74 Years | 146 (6.1%) | 88 (3.6%) |
| 75 Years and over | 122 (7.9%) | 149 (7.1%) |
Disability Class: Ambulatory Difficulty
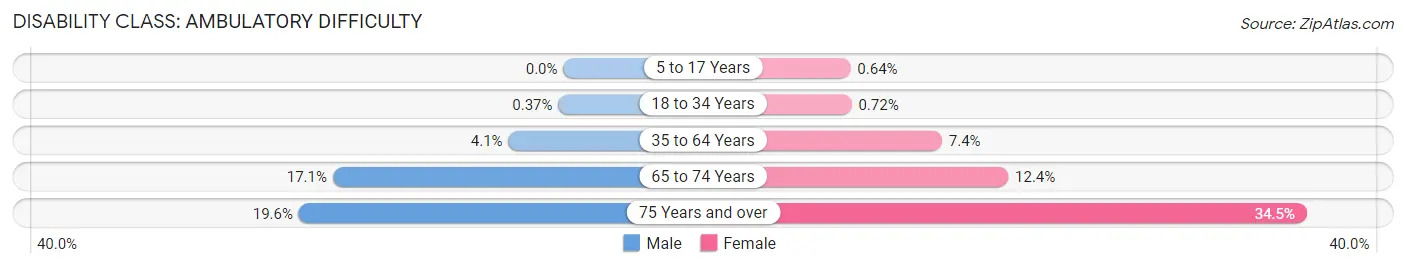
| Age Bracket | Male | Female |
| 5 to 17 Years | 0 (0.0%) | 36 (0.6%) |
| 18 to 34 Years | 33 (0.4%) | 67 (0.7%) |
| 35 to 64 Years | 456 (4.1%) | 809 (7.4%) |
| 65 to 74 Years | 408 (17.1%) | 303 (12.3%) |
| 75 Years and over | 304 (19.6%) | 719 (34.5%) |
Disability Class: Self-Care Difficulty
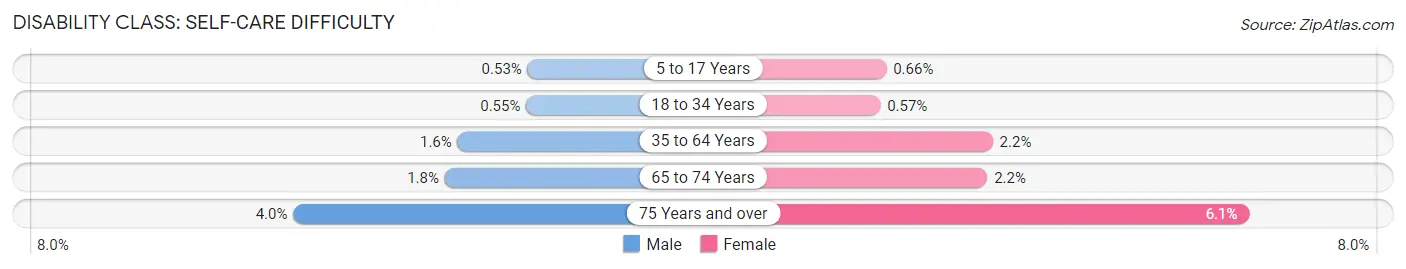
| Age Bracket | Male | Female |
| 5 to 17 Years | 32 (0.5%) | 37 (0.7%) |
| 18 to 34 Years | 49 (0.5%) | 53 (0.6%) |
| 35 to 64 Years | 176 (1.6%) | 244 (2.2%) |
| 65 to 74 Years | 42 (1.8%) | 53 (2.2%) |
| 75 Years and over | 62 (4.0%) | 126 (6.0%) |
Technology Access in Clay County
Computing Device Access in Clay County
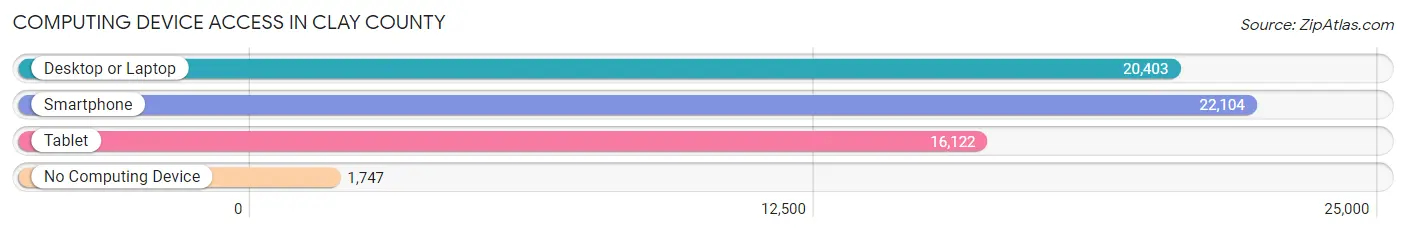
| Device Type | # Households | % Households |
| Desktop or Laptop | 20,403 | 80.0% |
| Smartphone | 22,104 | 86.6% |
| Tablet | 16,122 | 63.2% |
| No Computing Device | 1,747 | 6.9% |
| Total | 25,512 | 100.0% |
Internet Access in Clay County
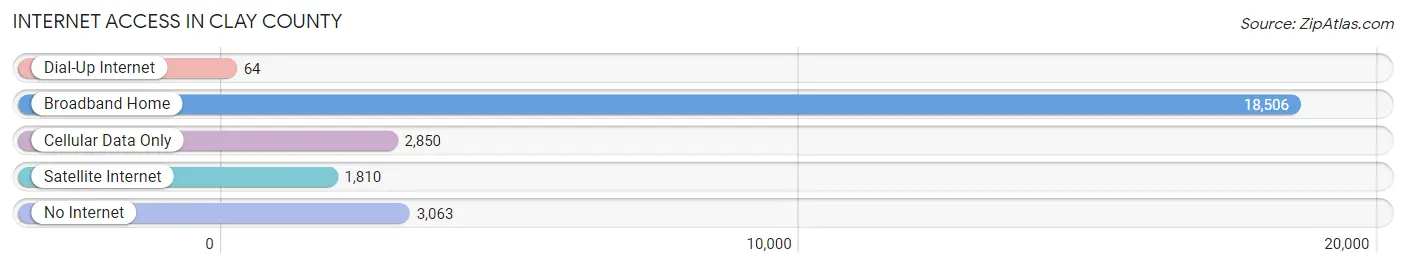
| Internet Type | # Households | % Households |
| Dial-Up Internet | 64 | 0.3% |
| Broadband Home | 18,506 | 72.5% |
| Cellular Data Only | 2,850 | 11.2% |
| Satellite Internet | 1,810 | 7.1% |
| No Internet | 3,063 | 12.0% |
| Total | 25,512 | 100.0% |
Clay County Summary
Clay County, Minnesota is located in the west-central part of the state, and is bordered by Becker, Wilkin, Norman, and Otter Tail counties. It is part of the Fargo-Moorhead metropolitan area, and is home to the cities of Moorhead, Dilworth, and Hawley. The county was established in 1862 and named after Henry Clay, a prominent statesman from Kentucky.
Geography
Clay County covers an area of 576 square miles, with a population of 63,945 as of the 2010 census. The county is located in the Red River Valley, and is mostly flat with rolling hills. The Red River of the North forms the eastern border of the county, and the Buffalo River flows through the western part of the county. The county is home to numerous lakes, including Big Cormorant Lake, Little Cormorant Lake, and Lake Lida.
The county is home to several state parks, including Maplewood State Park, which is located in the northern part of the county and is known for its hiking trails and camping sites. The county also contains the Buffalo River State Park, which is located in the western part of the county and is known for its fishing and canoeing opportunities.
Economy
Clay County has a diverse economy, with a mix of manufacturing, agriculture, and services. The county is home to several large employers, including American Crystal Sugar Company, which is the largest employer in the county, and Minnesota State University Moorhead. Other major employers include Sanford Health, CHS Inc., and the Clay County Fair.
Agriculture is a major part of the county’s economy, with corn, soybeans, and wheat being the main crops. The county is also home to several dairy farms, and is the leading producer of sugar beets in the state.
Demographics
As of the 2010 census, the population of Clay County was 63,945, with a population density of 111.3 people per square mile. The median age of the population was 36.7 years, and the median household income was $50,945. The racial makeup of the county was 90.2% White, 4.2% Hispanic or Latino, 2.2% African American, 1.2% Asian, and 1.2% Native American.
Conclusion
Clay County, Minnesota is a diverse county located in the west-central part of the state. It is home to several cities, including Moorhead, Dilworth, and Hawley, and is part of the Fargo-Moorhead metropolitan area. The county has a diverse economy, with a mix of manufacturing, agriculture, and services, and is home to several large employers. The population of the county is 63,945, with a median age of 36.7 years and a median household income of $50,945.
Common Questions
What is the Total Population of Clay County?
Total Population of Clay County is 65,307.
What is the Total Male Population of Clay County?
Total Male Population of Clay County is 32,443.
What is the Total Female Population of Clay County?
Total Female Population of Clay County is 32,864.
What is the Ratio of Males per 100 Females in Clay County?
There are 98.72 Males per 100 Females in Clay County.
What is the Ratio of Females per 100 Males in Clay County?
There are 101.30 Females per 100 Males in Clay County.
What is the Median Population Age in Clay County?
Median Population Age in Clay County is 32.8 Years.
What is the Average Family Size in Clay County
Average Family Size in Clay County is 3.1 People.
What is the Average Household Size in Clay County
Average Household Size in Clay County is 2.4 People.
What is Per Capita Income in Clay County?
Per Capita income in Clay County is $36,586.
What is the Median Family Income in Clay County?
Median Family Income in Clay County is $103,513.
What is the Median Household income in Clay County?
Median Household Income in Clay County is $75,006.
What is Income or Wage Gap in Clay County?
Income or Wage Gap in Clay County is 32.6%.
Women in Clay County earn 67.4 cents for every dollar earned by a man.
What is Family Income Deficit in Clay County?
Family Income Deficit in Clay County is $11,523.
Families that are below poverty line in Clay County earn $11,523 less on average than the poverty threshold level.
What is Inequality or Gini Index in Clay County?
Inequality or Gini Index in Clay County is 0.44.
How Large is the Labor Force in Clay County?
There are 35,953 People in the Labor Forcein in Clay County.
What is the Percentage of People in the Labor Force in Clay County?
70.9% of People are in the Labor Force in Clay County.
What is the Unemployment Rate in Clay County?
Unemployment Rate in Clay County is 4.0%.