Chippewa County, MN
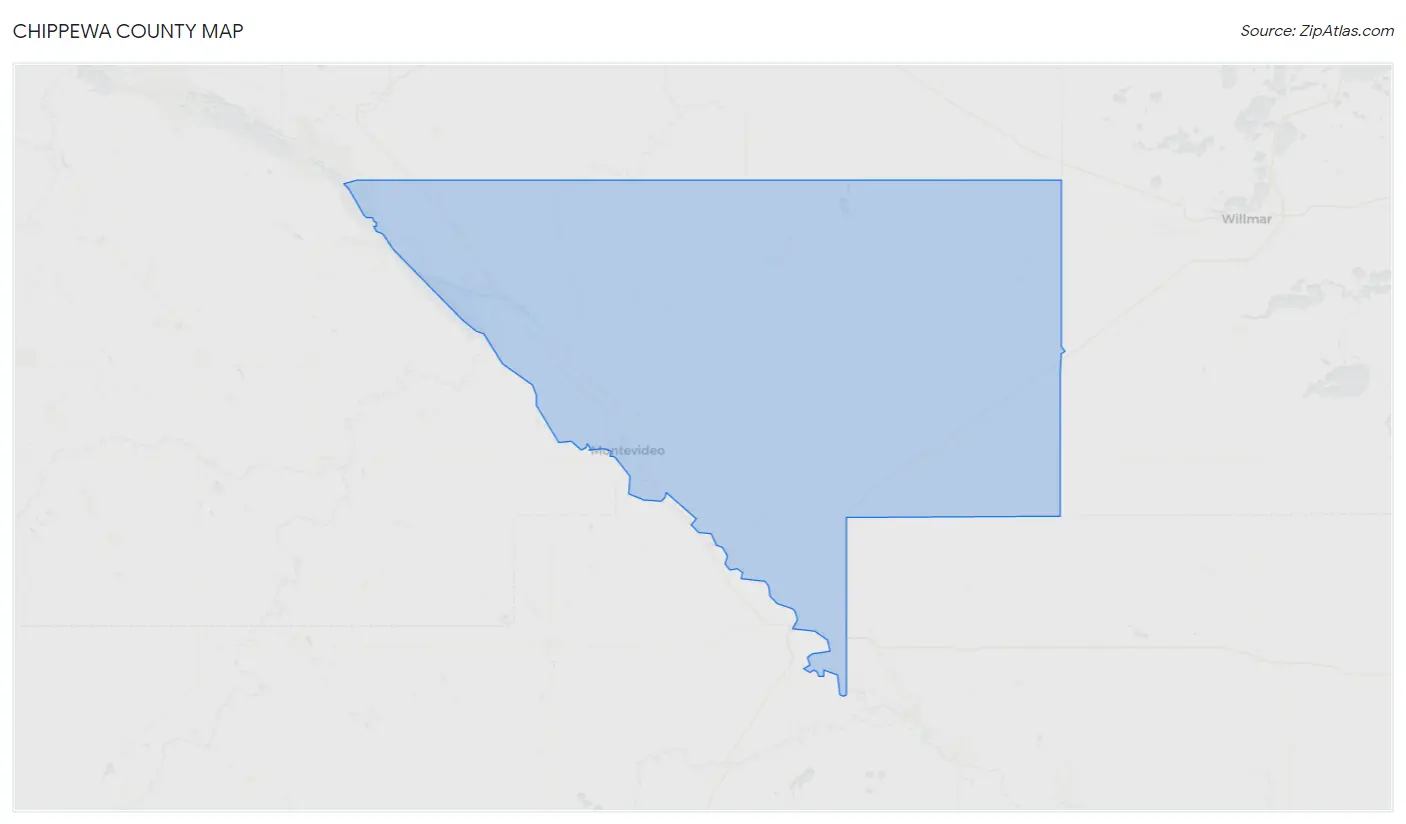
Chippewa County Map
Chippewa County Overview
12,466
TOTAL POPULATION
6,290
MALE POPULATION
6,176
FEMALE POPULATION
101.85
MALES / 100 FEMALES
98.19
FEMALES / 100 MALES
41.8
MEDIAN AGE
3.1
AVG FAMILY SIZE
2.3
AVG HOUSEHOLD SIZE
$32,772
PER CAPITA INCOME
$81,912
AVG FAMILY INCOME
$62,112
AVG HOUSEHOLD INCOME
30.3%
WAGE / INCOME GAP [ % ]
69.7¢/ $1
WAGE / INCOME GAP [ $ ]
$6,673
FAMILY INCOME DEFICIT
0.43
INEQUALITY / GINI INDEX
6,385
LABOR FORCE [ PEOPLE ]
63.8%
PERCENT IN LABOR FORCE
5.2%
UNEMPLOYMENT RATE
Chippewa County Area Codes
Race in Chippewa County
The most populous races in Chippewa County are White / Caucasian (10,807 | 86.7%), Hispanic or Latino (1,015 | 8.1%), and Some other Race (750 | 6.0%).

| Race | # Population | % Population |
| Asian | 154 | 1.2% |
| Black / African American | 142 | 1.1% |
| Hawaiian / Pacific | 191 | 1.5% |
| Hispanic or Latino | 1,015 | 8.1% |
| Native / Alaskan | 170 | 1.4% |
| White / Caucasian | 10,807 | 86.7% |
| Two or more Races | 252 | 2.0% |
| Some other Race | 750 | 6.0% |
| Total | 12,466 | 100.0% |
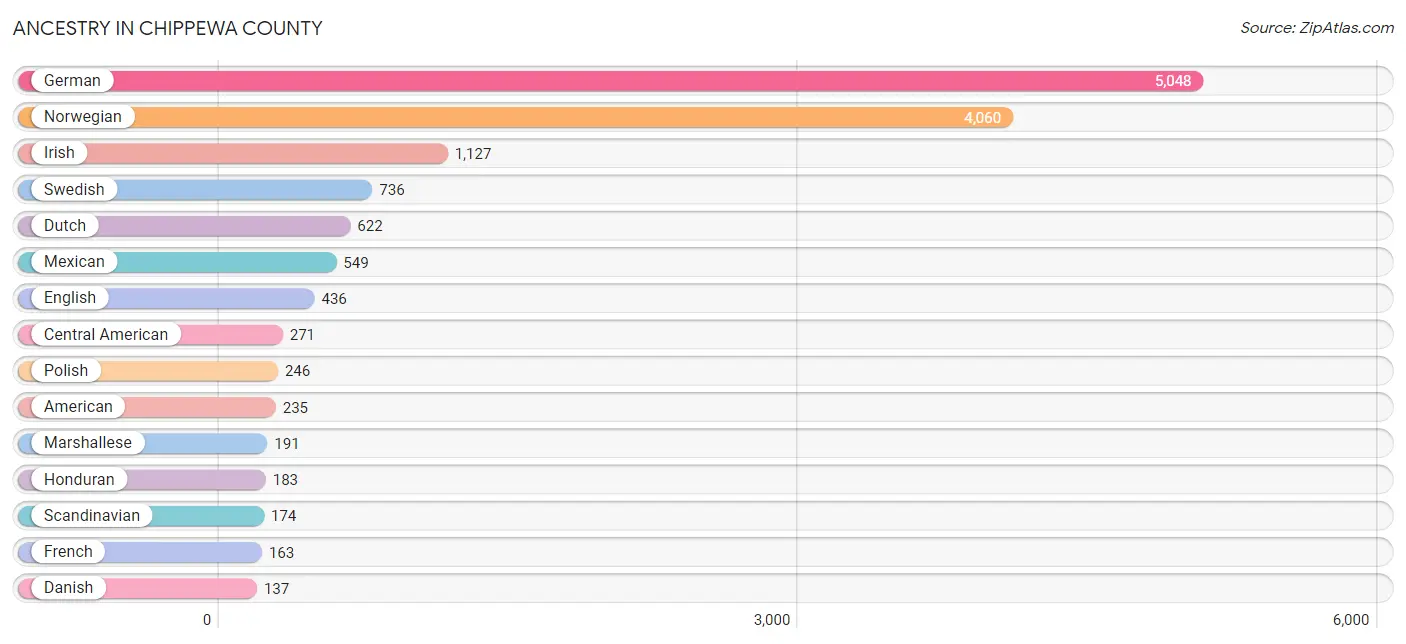
Ancestry in Chippewa County
The most populous ancestries reported in Chippewa County are German (5,048 | 40.5%), Norwegian (4,060 | 32.6%), Irish (1,127 | 9.0%), Swedish (736 | 5.9%), and Dutch (622 | 5.0%), together accounting for 93.0% of all Chippewa County residents.
| Ancestry | # Population | % Population |
| American | 235 | 1.9% |
| Arab | 1 | 0.0% |
| Austrian | 6 | 0.1% |
| Bangladeshi | 1 | 0.0% |
| Belgian | 13 | 0.1% |
| Bhutanese | 14 | 0.1% |
| Blackfeet | 1 | 0.0% |
| Bolivian | 3 | 0.0% |
| Brazilian | 6 | 0.1% |
| British | 34 | 0.3% |
| Burmese | 17 | 0.1% |
| Canadian | 16 | 0.1% |
| Central American | 271 | 2.2% |
| Cherokee | 72 | 0.6% |
| Chippewa | 68 | 0.5% |
| Croatian | 2 | 0.0% |
| Cuban | 1 | 0.0% |
| Czech | 85 | 0.7% |
| Czechoslovakian | 28 | 0.2% |
| Danish | 137 | 1.1% |
| Dutch | 622 | 5.0% |
| Eastern European | 3 | 0.0% |
| English | 436 | 3.5% |
| European | 122 | 1.0% |
| Finnish | 63 | 0.5% |
| French | 163 | 1.3% |
| French Canadian | 50 | 0.4% |
| German | 5,048 | 40.5% |
| Greek | 1 | 0.0% |
| Guatemalan | 9 | 0.1% |
| Honduran | 183 | 1.5% |
| Hungarian | 31 | 0.3% |
| Icelander | 1 | 0.0% |
| Irish | 1,127 | 9.0% |
| Italian | 82 | 0.7% |
| Korean | 8 | 0.1% |
| Latvian | 19 | 0.2% |
| Liberian | 4 | 0.0% |
| Luxembourger | 3 | 0.0% |
| Malaysian | 19 | 0.2% |
| Marshallese | 191 | 1.5% |
| Mexican | 549 | 4.4% |
| Nigerian | 5 | 0.0% |
| Northern European | 6 | 0.1% |
| Norwegian | 4,060 | 32.6% |
| Polish | 246 | 2.0% |
| Puerto Rican | 12 | 0.1% |
| Russian | 18 | 0.1% |
| Salvadoran | 79 | 0.6% |
| Scandinavian | 174 | 1.4% |
| Scotch-Irish | 20 | 0.2% |
| Scottish | 78 | 0.6% |
| Sioux | 58 | 0.5% |
| South American | 3 | 0.0% |
| Spaniard | 24 | 0.2% |
| Sri Lankan | 3 | 0.0% |
| Subsaharan African | 76 | 0.6% |
| Sudanese | 1 | 0.0% |
| Swedish | 736 | 5.9% |
| Swiss | 30 | 0.2% |
| Welsh | 5 | 0.0% | View All 61 Rows |
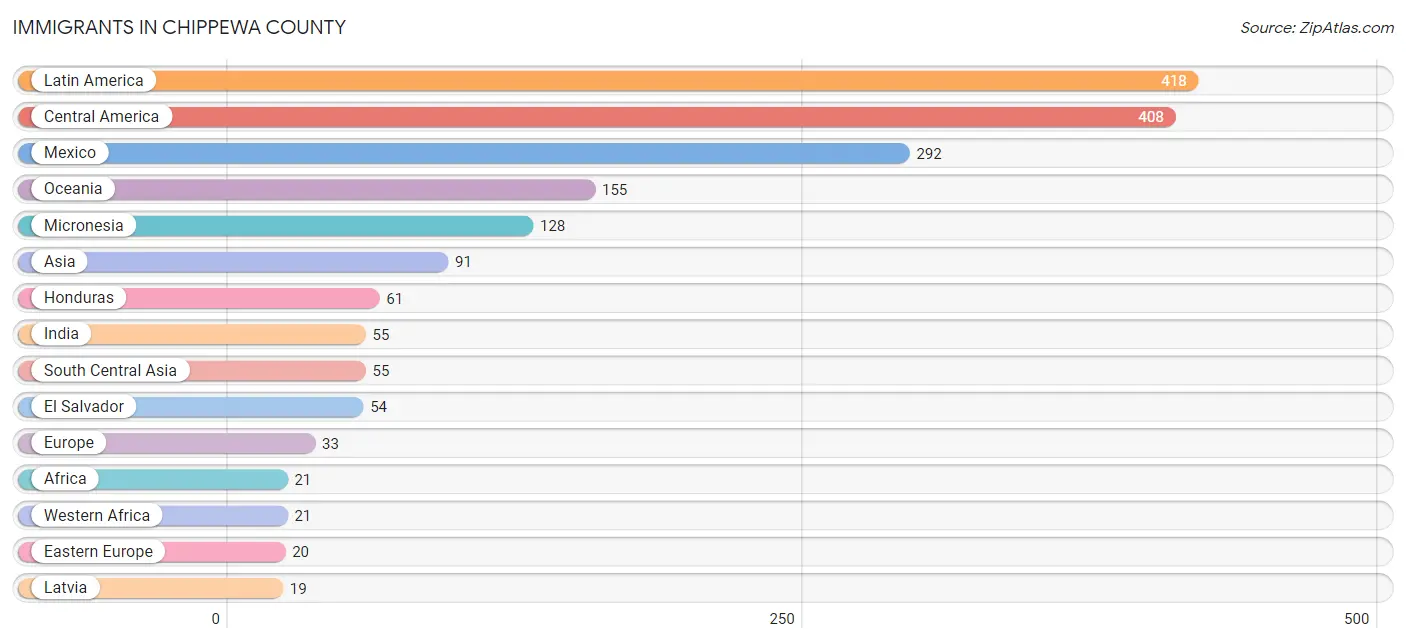
Immigrants in Chippewa County
The most numerous immigrant groups reported in Chippewa County came from Latin America (418 | 3.4%), Central America (408 | 3.3%), Mexico (292 | 2.3%), Oceania (155 | 1.2%), and Micronesia (128 | 1.0%), together accounting for 11.2% of all Chippewa County residents.
| Immigration Origin | # Population | % Population |
| Africa | 21 | 0.2% |
| Asia | 91 | 0.7% |
| Australia | 2 | 0.0% |
| Bolivia | 3 | 0.0% |
| Brazil | 6 | 0.1% |
| Canada | 12 | 0.1% |
| Caribbean | 1 | 0.0% |
| Central America | 408 | 3.3% |
| Cuba | 1 | 0.0% |
| Eastern Asia | 17 | 0.1% |
| Eastern Europe | 20 | 0.2% |
| El Salvador | 54 | 0.4% |
| England | 7 | 0.1% |
| Europe | 33 | 0.3% |
| Guatemala | 1 | 0.0% |
| Honduras | 61 | 0.5% |
| India | 55 | 0.4% |
| Korea | 17 | 0.1% |
| Laos | 7 | 0.1% |
| Latin America | 418 | 3.4% |
| Latvia | 19 | 0.2% |
| Liberia | 4 | 0.0% |
| Mexico | 292 | 2.3% |
| Micronesia | 128 | 1.0% |
| Nigeria | 5 | 0.0% |
| Northern Europe | 13 | 0.1% |
| Oceania | 155 | 1.2% |
| Philippines | 11 | 0.1% |
| Russia | 1 | 0.0% |
| Saudi Arabia | 1 | 0.0% |
| South America | 9 | 0.1% |
| South Central Asia | 55 | 0.4% |
| South Eastern Asia | 18 | 0.1% |
| Sweden | 4 | 0.0% |
| Western Africa | 21 | 0.2% |
| Western Asia | 1 | 0.0% | View All 36 Rows |
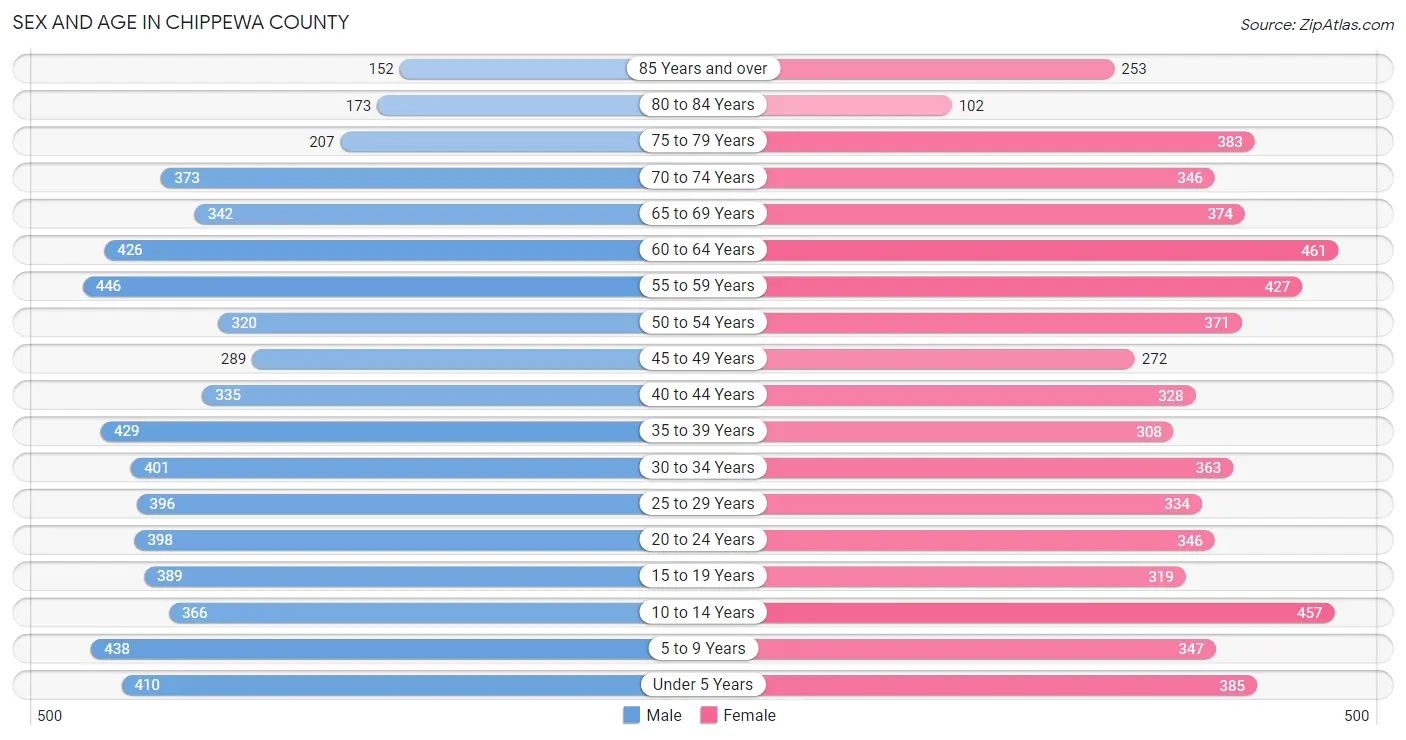
Sex and Age in Chippewa County
Sex and Age in Chippewa County
The most populous age groups in Chippewa County are 55 to 59 Years (446 | 7.1%) for men and 60 to 64 Years (461 | 7.5%) for women.
| Age Bracket | Male | Female |
| Under 5 Years | 410 (6.5%) | 385 (6.2%) |
| 5 to 9 Years | 438 (7.0%) | 347 (5.6%) |
| 10 to 14 Years | 366 (5.8%) | 457 (7.4%) |
| 15 to 19 Years | 389 (6.2%) | 319 (5.2%) |
| 20 to 24 Years | 398 (6.3%) | 346 (5.6%) |
| 25 to 29 Years | 396 (6.3%) | 334 (5.4%) |
| 30 to 34 Years | 401 (6.4%) | 363 (5.9%) |
| 35 to 39 Years | 429 (6.8%) | 308 (5.0%) |
| 40 to 44 Years | 335 (5.3%) | 328 (5.3%) |
| 45 to 49 Years | 289 (4.6%) | 272 (4.4%) |
| 50 to 54 Years | 320 (5.1%) | 371 (6.0%) |
| 55 to 59 Years | 446 (7.1%) | 427 (6.9%) |
| 60 to 64 Years | 426 (6.8%) | 461 (7.5%) |
| 65 to 69 Years | 342 (5.4%) | 374 (6.1%) |
| 70 to 74 Years | 373 (5.9%) | 346 (5.6%) |
| 75 to 79 Years | 207 (3.3%) | 383 (6.2%) |
| 80 to 84 Years | 173 (2.8%) | 102 (1.7%) |
| 85 Years and over | 152 (2.4%) | 253 (4.1%) |
| Total | 6,290 (100.0%) | 6,176 (100.0%) |
Families and Households in Chippewa County
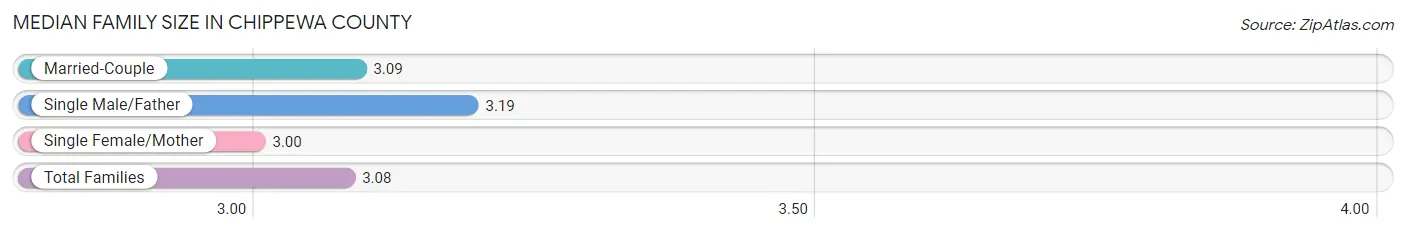
Median Family Size in Chippewa County
The median family size in Chippewa County is 3.08 persons per family, with single male/father families (226 | 7.4%) accounting for the largest median family size of 3.19 persons per family. On the other hand, single female/mother families (407 | 13.4%) represent the smallest median family size with 3.00 persons per family.
| Family Type | # Families | Family Size |
| Married-Couple | 2,413 (79.2%) | 3.09 |
| Single Male/Father | 226 (7.4%) | 3.19 |
| Single Female/Mother | 407 (13.4%) | 3.00 |
| Total Families | 3,046 (100.0%) | 3.08 |
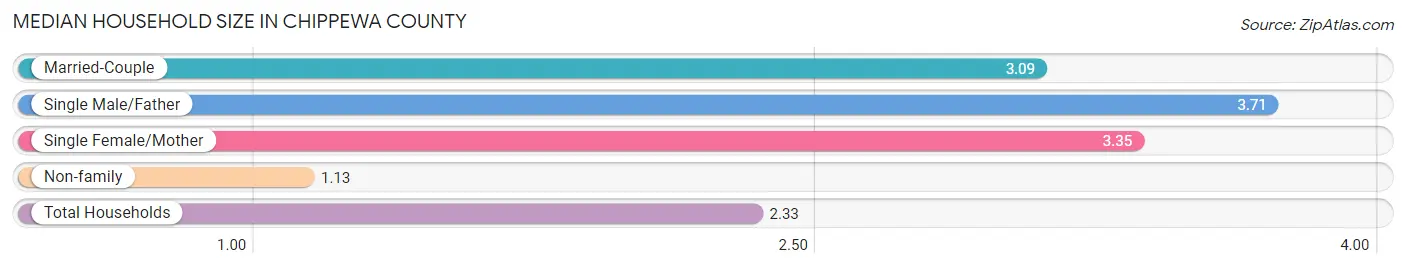
Median Household Size in Chippewa County
The median household size in Chippewa County is 2.33 persons per household, with single male/father households (226 | 4.3%) accounting for the largest median household size of 3.71 persons per household. non-family households (2,160 | 41.5%) represent the smallest median household size with 1.13 persons per household.
| Household Type | # Households | Household Size |
| Married-Couple | 2,413 (46.4%) | 3.09 |
| Single Male/Father | 226 (4.3%) | 3.71 |
| Single Female/Mother | 407 (7.8%) | 3.35 |
| Non-family | 2,160 (41.5%) | 1.13 |
| Total Households | 5,206 (100.0%) | 2.33 |
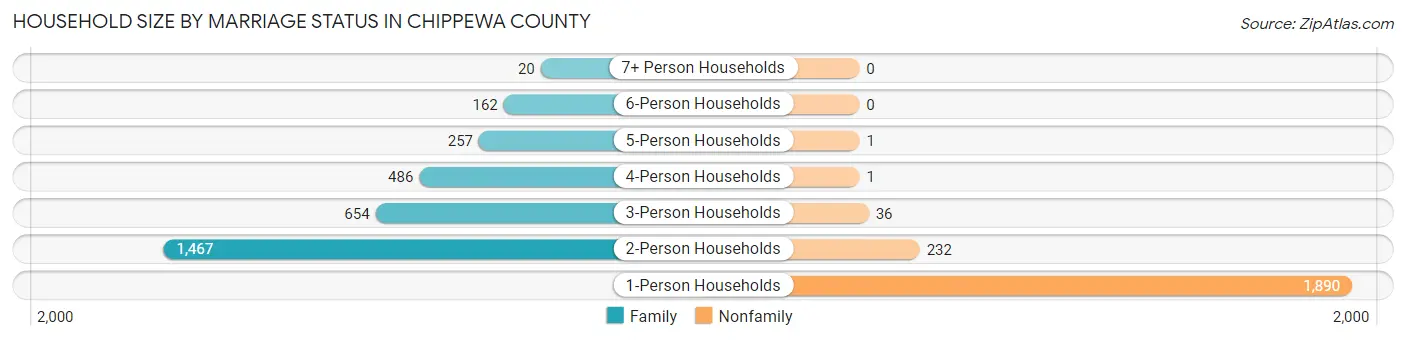
Household Size by Marriage Status in Chippewa County
Out of a total of 5,206 households in Chippewa County, 3,046 (58.5%) are family households, while 2,160 (41.5%) are nonfamily households. The most numerous type of family households are 2-person households, comprising 1,467, and the most common type of nonfamily households are 1-person households, comprising 1,890.
| Household Size | Family Households | Nonfamily Households |
| 1-Person Households | - | 1,890 (36.3%) |
| 2-Person Households | 1,467 (28.2%) | 232 (4.5%) |
| 3-Person Households | 654 (12.6%) | 36 (0.7%) |
| 4-Person Households | 486 (9.3%) | 1 (0.0%) |
| 5-Person Households | 257 (4.9%) | 1 (0.0%) |
| 6-Person Households | 162 (3.1%) | 0 (0.0%) |
| 7+ Person Households | 20 (0.4%) | 0 (0.0%) |
| Total | 3,046 (58.5%) | 2,160 (41.5%) |
Female Fertility in Chippewa County
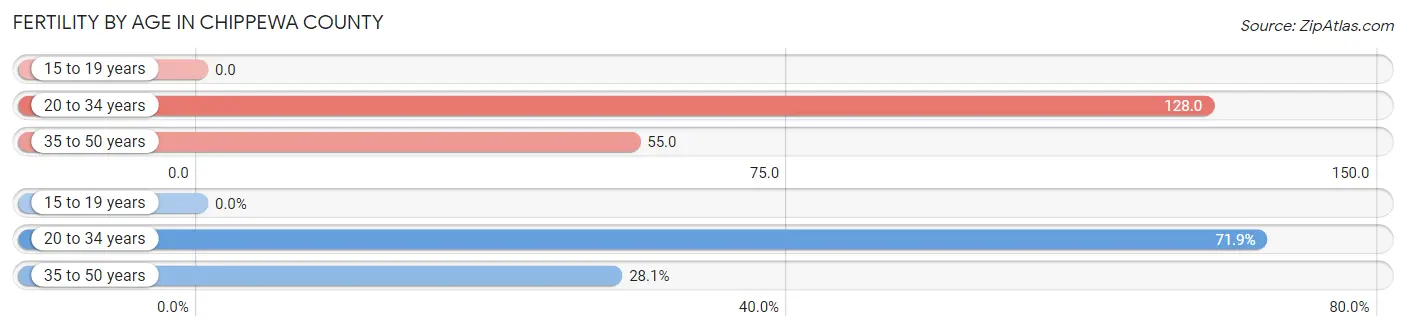
Fertility by Age in Chippewa County
Average fertility rate in Chippewa County is 80.0 births per 1,000 women. Women in the age bracket of 20 to 34 years have the highest fertility rate with 128.0 births per 1,000 women. Women in the age bracket of 20 to 34 years acount for 71.9% of all women with births.
| Age Bracket | Women with Births | Births / 1,000 Women |
| 15 to 19 years | 0 (0.0%) | 0.0 |
| 20 to 34 years | 133 (71.9%) | 128.0 |
| 35 to 50 years | 52 (28.1%) | 55.0 |
| Total | 185 (100.0%) | 80.0 |
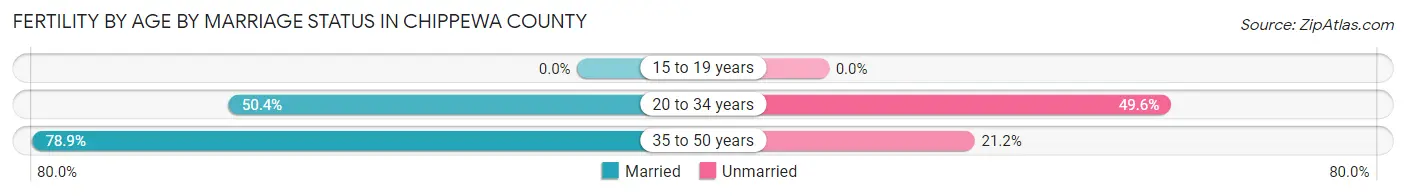
Fertility by Age by Marriage Status in Chippewa County
58.4% of women with births (185) in Chippewa County are married. The highest percentage of unmarried women with births falls into 20 to 34 years age bracket with 49.6% of them unmarried at the time of birth, while the lowest percentage of unmarried women with births belong to 35 to 50 years age bracket with 21.2% of them unmarried.
| Age Bracket | Married | Unmarried |
| 15 to 19 years | 0 (0.0%) | 0 (0.0%) |
| 20 to 34 years | 67 (50.4%) | 66 (49.6%) |
| 35 to 50 years | 41 (78.8%) | 11 (21.1%) |
| Total | 108 (58.4%) | 77 (41.6%) |
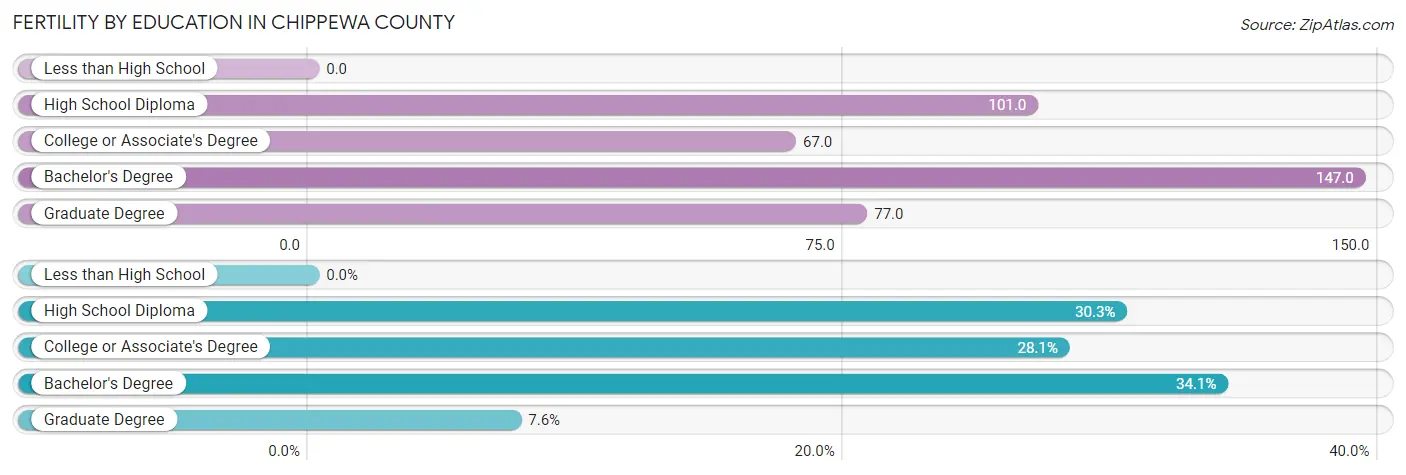
Fertility by Education in Chippewa County
| Educational Attainment | Women with Births | Births / 1,000 Women |
| Less than High School | 0 (0.0%) | 0.0 |
| High School Diploma | 56 (30.3%) | 101.0 |
| College or Associate's Degree | 52 (28.1%) | 67.0 |
| Bachelor's Degree | 63 (34.1%) | 147.0 |
| Graduate Degree | 14 (7.6%) | 77.0 |
| Total | 185 (100.0%) | 80.0 |
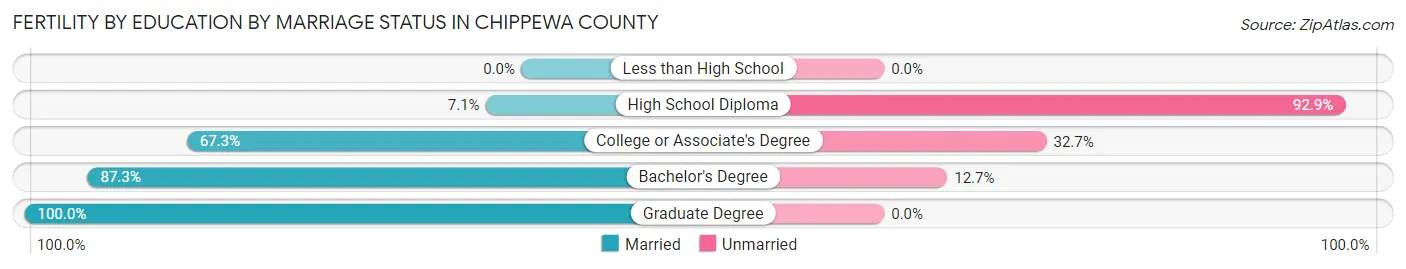
Fertility by Education by Marriage Status in Chippewa County
41.6% of women with births in Chippewa County are unmarried. Women with the educational attainment of graduate degree are most likely to be married with 100.0% of them married at childbirth, while women with the educational attainment of high school diploma are least likely to be married with 92.9% of them unmarried at childbirth.
| Educational Attainment | Married | Unmarried |
| Less than High School | 0 (0.0%) | 0 (0.0%) |
| High School Diploma | 4 (7.1%) | 52 (92.9%) |
| College or Associate's Degree | 35 (67.3%) | 17 (32.7%) |
| Bachelor's Degree | 55 (87.3%) | 8 (12.7%) |
| Graduate Degree | 14 (100.0%) | 0 (0.0%) |
| Total | 108 (58.4%) | 77 (41.6%) |
Income in Chippewa County
Income Overview in Chippewa County
Per Capita Income in Chippewa County is $32,772, while median incomes of families and households are $81,912 and $62,112 respectively.
| Characteristic | Number | Measure |
| Per Capita Income | 12,466 | $32,772 |
| Median Family Income | 3,046 | $81,912 |
| Mean Family Income | 3,046 | $98,795 |
| Median Household Income | 5,206 | $62,112 |
| Mean Household Income | 5,206 | $76,829 |
| Income Deficit | 3,046 | $6,673 |
| Wage / Income Gap (%) | 12,466 | 30.27% |
| Wage / Income Gap ($) | 12,466 | 69.73¢ per $1 |
| Gini / Inequality Index | 12,466 | 0.43 |
Earnings by Sex in Chippewa County
Average Earnings in Chippewa County are $35,363, $41,541 for men and $28,966 for women, a difference of 30.3%.

| Sex | Number | Average Earnings |
| Male | 3,734 (54.0%) | $41,541 |
| Female | 3,176 (46.0%) | $28,966 |
| Total | 6,910 (100.0%) | $35,363 |
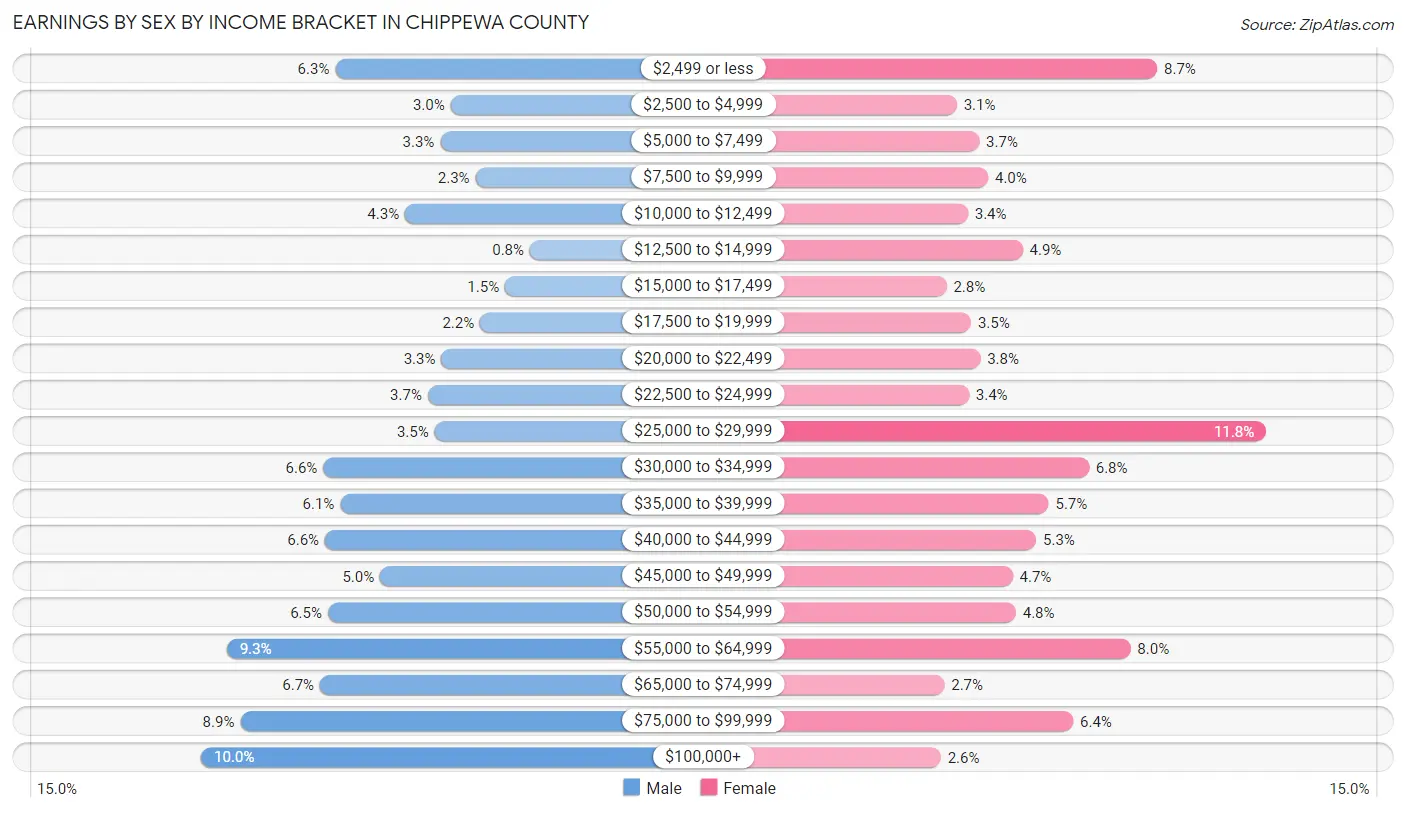
Earnings by Sex by Income Bracket in Chippewa County
The most common earnings brackets in Chippewa County are $100,000+ for men (375 | 10.0%) and $25,000 to $29,999 for women (374 | 11.8%).
| Income | Male | Female |
| $2,499 or less | 234 (6.3%) | 277 (8.7%) |
| $2,500 to $4,999 | 113 (3.0%) | 98 (3.1%) |
| $5,000 to $7,499 | 124 (3.3%) | 118 (3.7%) |
| $7,500 to $9,999 | 87 (2.3%) | 126 (4.0%) |
| $10,000 to $12,499 | 161 (4.3%) | 108 (3.4%) |
| $12,500 to $14,999 | 30 (0.8%) | 157 (4.9%) |
| $15,000 to $17,499 | 56 (1.5%) | 89 (2.8%) |
| $17,500 to $19,999 | 82 (2.2%) | 111 (3.5%) |
| $20,000 to $22,499 | 123 (3.3%) | 119 (3.7%) |
| $22,500 to $24,999 | 137 (3.7%) | 109 (3.4%) |
| $25,000 to $29,999 | 130 (3.5%) | 374 (11.8%) |
| $30,000 to $34,999 | 247 (6.6%) | 216 (6.8%) |
| $35,000 to $39,999 | 229 (6.1%) | 180 (5.7%) |
| $40,000 to $44,999 | 245 (6.6%) | 169 (5.3%) |
| $45,000 to $49,999 | 187 (5.0%) | 148 (4.7%) |
| $50,000 to $54,999 | 242 (6.5%) | 151 (4.8%) |
| $55,000 to $64,999 | 348 (9.3%) | 253 (8.0%) |
| $65,000 to $74,999 | 250 (6.7%) | 87 (2.7%) |
| $75,000 to $99,999 | 334 (8.9%) | 202 (6.4%) |
| $100,000+ | 375 (10.0%) | 84 (2.6%) |
| Total | 3,734 (100.0%) | 3,176 (100.0%) |
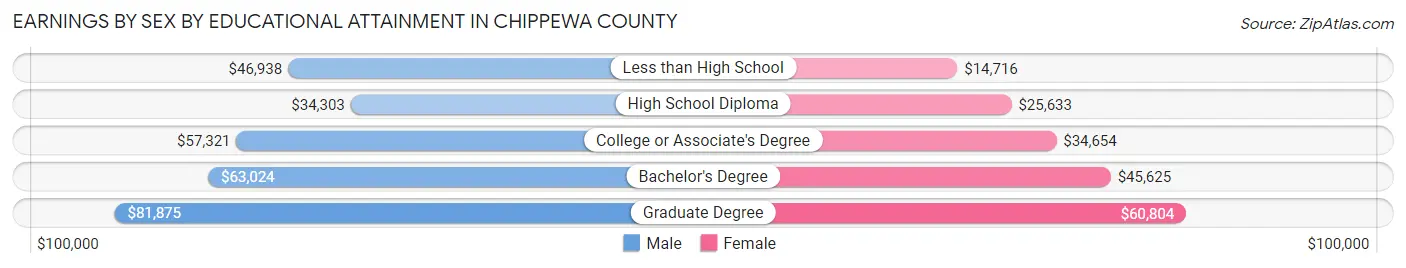
Earnings by Sex by Educational Attainment in Chippewa County
Average earnings in Chippewa County are $48,766 for men and $32,038 for women, a difference of 34.3%. Men with an educational attainment of graduate degree enjoy the highest average annual earnings of $81,875, while those with high school diploma education earn the least with $34,303. Women with an educational attainment of graduate degree earn the most with the average annual earnings of $60,804, while those with less than high school education have the smallest earnings of $14,716.
| Educational Attainment | Male Income | Female Income |
| Less than High School | $46,938 | $14,716 |
| High School Diploma | $34,303 | $25,633 |
| College or Associate's Degree | $57,321 | $34,654 |
| Bachelor's Degree | $63,024 | $45,625 |
| Graduate Degree | $81,875 | $60,804 |
| Total | $48,766 | $32,038 |
Family Income in Chippewa County
Family Income Brackets in Chippewa County
According to the Chippewa County family income data, there are 640 families falling into the $100,000 to $149,999 income range, which is the most common income bracket and makes up 21.0% of all families. Conversely, the $10,000 to $14,999 income bracket is the least frequent group with only 12 families (0.4%) belonging to this category.

| Income Bracket | # Families | % Families |
| Less than $10,000 | 43 | 1.4% |
| $10,000 to $14,999 | 12 | 0.4% |
| $15,000 to $24,999 | 195 | 6.4% |
| $25,000 to $34,999 | 222 | 7.3% |
| $35,000 to $49,999 | 326 | 10.7% |
| $50,000 to $74,999 | 545 | 17.9% |
| $75,000 to $99,999 | 487 | 16.0% |
| $100,000 to $149,999 | 640 | 21.0% |
| $150,000 to $199,999 | 381 | 12.5% |
| $200,000+ | 198 | 6.5% |
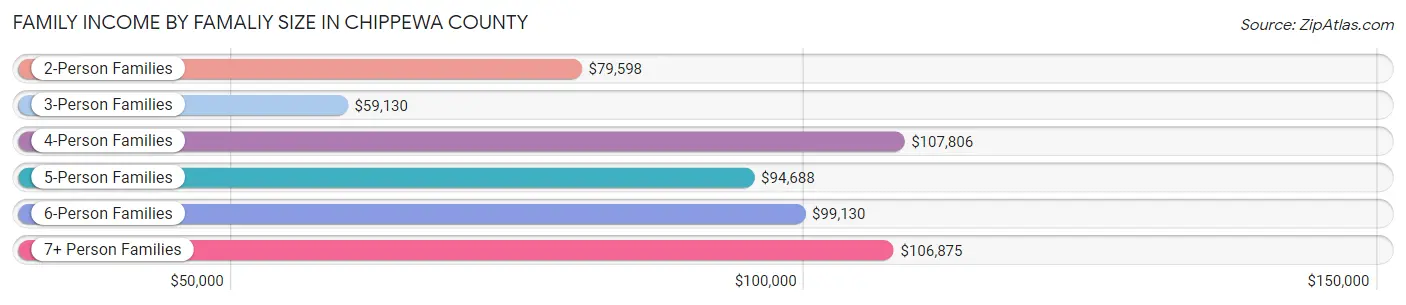
Family Income by Famaliy Size in Chippewa County
4-person families (517 | 17.0%) account for the highest median family income in Chippewa County with $107,806 per family, while 2-person families (1,586 | 52.1%) have the highest median income of $39,799 per family member.
| Income Bracket | # Families | Median Income |
| 2-Person Families | 1,586 (52.1%) | $79,598 |
| 3-Person Families | 558 (18.3%) | $59,130 |
| 4-Person Families | 517 (17.0%) | $107,806 |
| 5-Person Families | 273 (9.0%) | $94,688 |
| 6-Person Families | 92 (3.0%) | $99,130 |
| 7+ Person Families | 20 (0.7%) | $106,875 |
| Total | 3,046 (100.0%) | $81,912 |
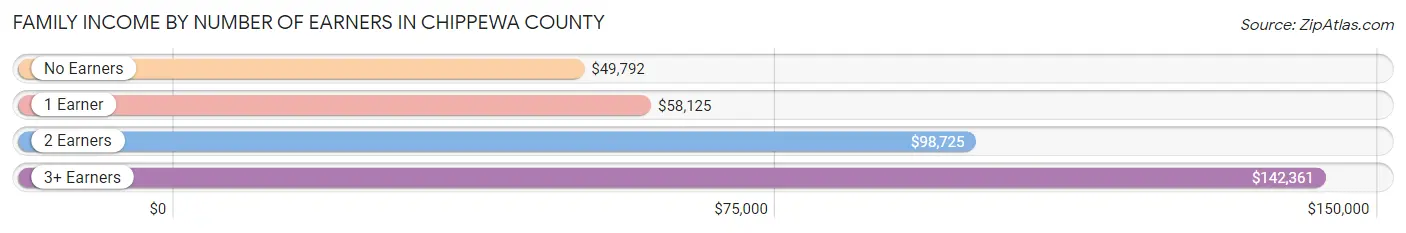
Family Income by Number of Earners in Chippewa County
The median family income in Chippewa County is $81,912, with families comprising 3+ earners (383) having the highest median family income of $142,361, while families with no earners (449) have the lowest median family income of $49,792, accounting for 12.6% and 14.7% of families, respectively.
| Number of Earners | # Families | Median Income |
| No Earners | 449 (14.7%) | $49,792 |
| 1 Earner | 855 (28.1%) | $58,125 |
| 2 Earners | 1,359 (44.6%) | $98,725 |
| 3+ Earners | 383 (12.6%) | $142,361 |
| Total | 3,046 (100.0%) | $81,912 |
Household Income in Chippewa County
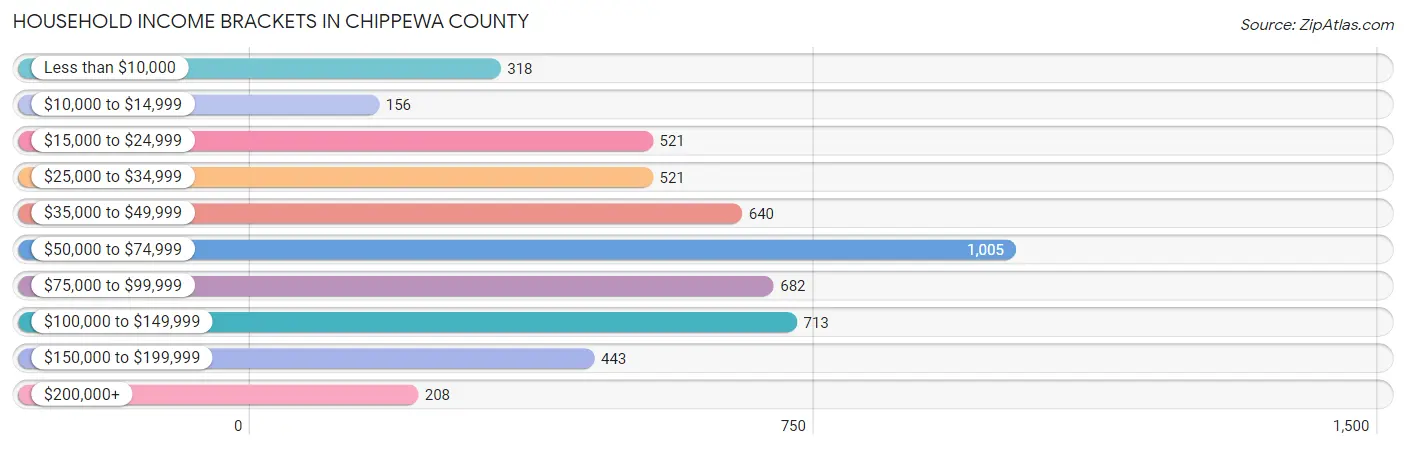
Household Income Brackets in Chippewa County
With 1,005 households falling in the category, the $50,000 to $74,999 income range is the most frequent in Chippewa County, accounting for 19.3% of all households. In contrast, only 156 households (3.0%) fall into the $10,000 to $14,999 income bracket, making it the least populous group.
| Income Bracket | # Households | % Households |
| Less than $10,000 | 318 | 6.1% |
| $10,000 to $14,999 | 156 | 3.0% |
| $15,000 to $24,999 | 521 | 10.0% |
| $25,000 to $34,999 | 521 | 10.0% |
| $35,000 to $49,999 | 640 | 12.3% |
| $50,000 to $74,999 | 1,005 | 19.3% |
| $75,000 to $99,999 | 682 | 13.1% |
| $100,000 to $149,999 | 713 | 13.7% |
| $150,000 to $199,999 | 443 | 8.5% |
| $200,000+ | 208 | 4.0% |
Household Income by Householder Age in Chippewa County
The median household income in Chippewa County is $62,112, with the highest median household income of $72,019 found in the 45 to 64 years age bracket for the primary householder. A total of 1,763 households (33.9%) fall into this category. Meanwhile, the 15 to 24 years age bracket for the primary householder has the lowest median household income of $19,271, with 309 households (5.9%) in this group.
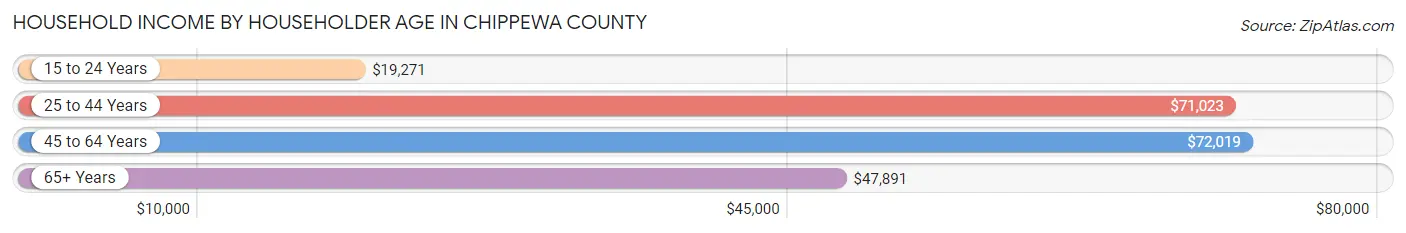
| Income Bracket | # Households | Median Income |
| 15 to 24 Years | 309 (5.9%) | $19,271 |
| 25 to 44 Years | 1,425 (27.4%) | $71,023 |
| 45 to 64 Years | 1,763 (33.9%) | $72,019 |
| 65+ Years | 1,709 (32.8%) | $47,891 |
| Total | 5,206 (100.0%) | $62,112 |
Poverty in Chippewa County
Income Below Poverty by Sex and Age in Chippewa County
With 8.8% poverty level for males and 13.7% for females among the residents of Chippewa County, 16 and 17 year old males and 12 to 14 year old females are the most vulnerable to poverty, with 100 males (39.2%) and 89 females (30.6%) in their respective age groups living below the poverty level.
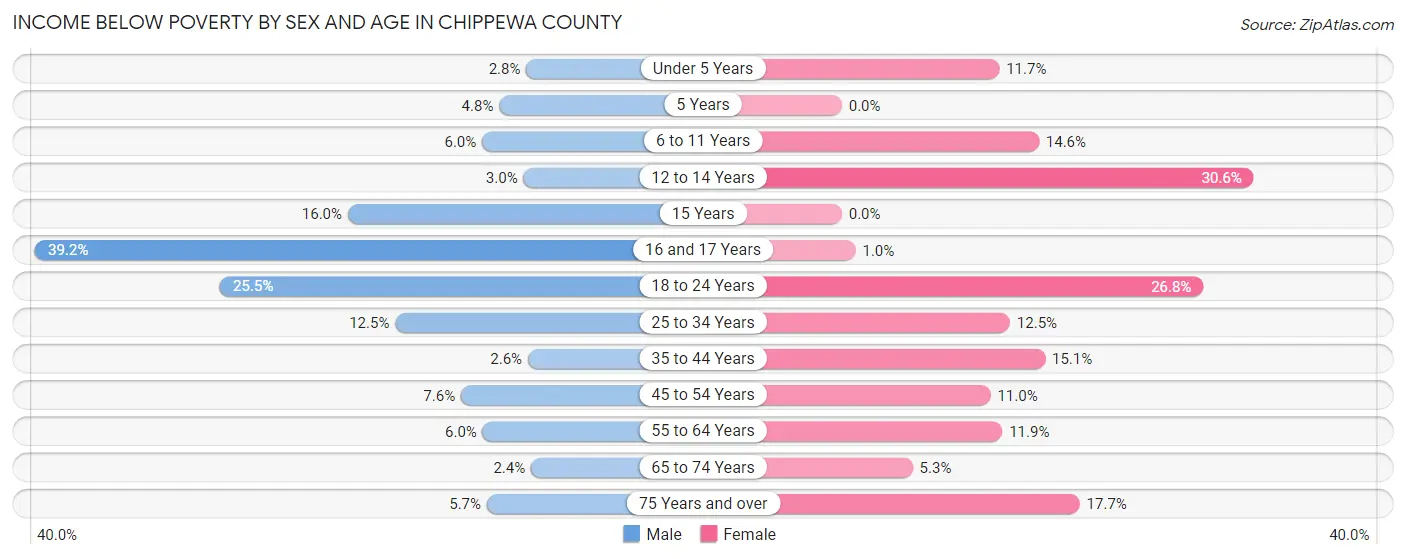
| Age Bracket | Male | Female |
| Under 5 Years | 11 (2.8%) | 45 (11.7%) |
| 5 Years | 4 (4.8%) | 0 (0.0%) |
| 6 to 11 Years | 27 (6.0%) | 61 (14.6%) |
| 12 to 14 Years | 8 (3.0%) | 89 (30.6%) |
| 15 Years | 4 (16.0%) | 0 (0.0%) |
| 16 and 17 Years | 100 (39.2%) | 2 (1.0%) |
| 18 to 24 Years | 129 (25.5%) | 117 (26.8%) |
| 25 to 34 Years | 98 (12.5%) | 87 (12.5%) |
| 35 to 44 Years | 20 (2.6%) | 96 (15.1%) |
| 45 to 54 Years | 46 (7.6%) | 71 (11.0%) |
| 55 to 64 Years | 52 (6.0%) | 103 (11.9%) |
| 65 to 74 Years | 16 (2.4%) | 36 (5.3%) |
| 75 Years and over | 27 (5.7%) | 119 (17.7%) |
| Total | 542 (8.8%) | 826 (13.7%) |
Income Above Poverty by Sex and Age in Chippewa County
According to the poverty statistics in Chippewa County, males aged 65 to 74 years and females aged 5 years are the age groups that are most secure financially, with 97.6% of males and 100.0% of females in these age groups living above the poverty line.
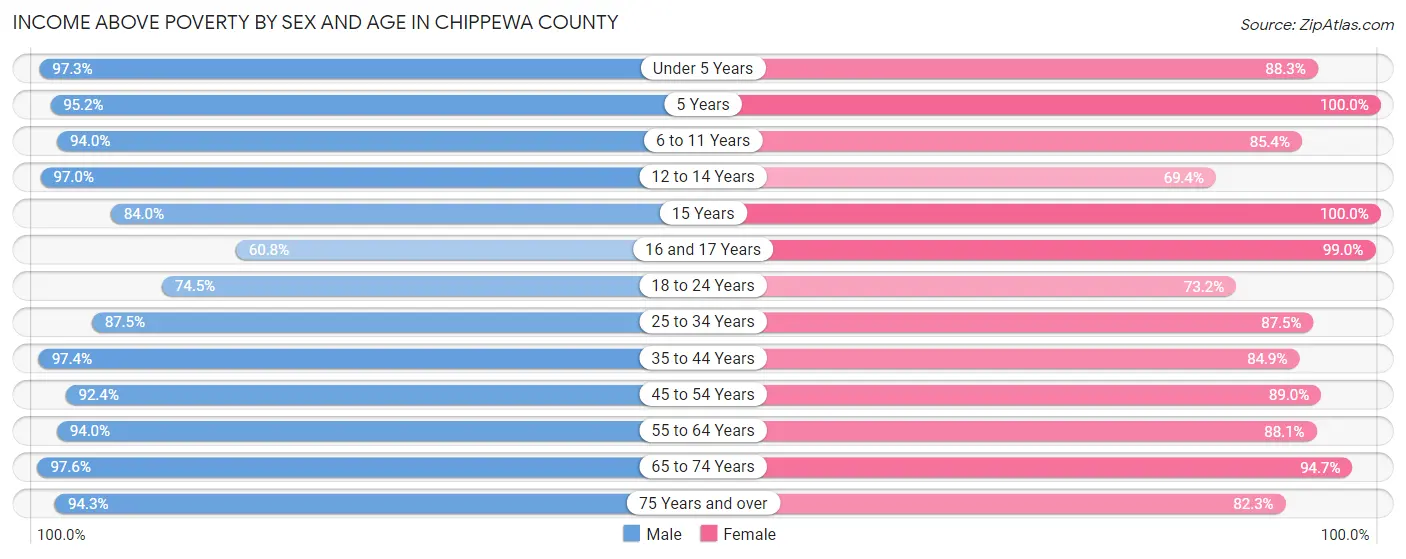
| Age Bracket | Male | Female |
| Under 5 Years | 389 (97.3%) | 340 (88.3%) |
| 5 Years | 80 (95.2%) | 93 (100.0%) |
| 6 to 11 Years | 421 (94.0%) | 356 (85.4%) |
| 12 to 14 Years | 262 (97.0%) | 202 (69.4%) |
| 15 Years | 21 (84.0%) | 30 (100.0%) |
| 16 and 17 Years | 155 (60.8%) | 194 (99.0%) |
| 18 to 24 Years | 377 (74.5%) | 319 (73.2%) |
| 25 to 34 Years | 687 (87.5%) | 610 (87.5%) |
| 35 to 44 Years | 740 (97.4%) | 540 (84.9%) |
| 45 to 54 Years | 559 (92.4%) | 572 (89.0%) |
| 55 to 64 Years | 816 (94.0%) | 762 (88.1%) |
| 65 to 74 Years | 651 (97.6%) | 648 (94.7%) |
| 75 Years and over | 448 (94.3%) | 555 (82.3%) |
| Total | 5,606 (91.2%) | 5,221 (86.3%) |
Income Below Poverty Among Married-Couple Families in Chippewa County
The poverty statistics for married-couple families in Chippewa County show that 1.9% or 46 of the total 2,413 families live below the poverty line. Families with 1 or 2 children have the highest poverty rate of 3.3%, comprising of 23 families. On the other hand, families with 5 or more children have the lowest poverty rate of 0.0%, which includes 0 families.
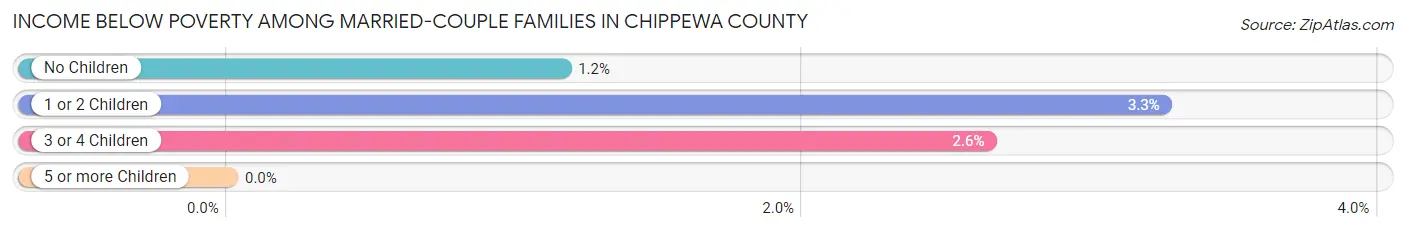
| Children | Above Poverty | Below Poverty |
| No Children | 1,447 (98.8%) | 17 (1.2%) |
| 1 or 2 Children | 685 (96.8%) | 23 (3.3%) |
| 3 or 4 Children | 221 (97.4%) | 6 (2.6%) |
| 5 or more Children | 14 (100.0%) | 0 (0.0%) |
| Total | 2,367 (98.1%) | 46 (1.9%) |
Income Below Poverty Among Single-Parent Households in Chippewa County
According to the poverty data in Chippewa County, 21.7% or 49 single-father households and 31.7% or 129 single-mother households are living below the poverty line. Among single-father households, those with 1 or 2 children have the highest poverty rate, with 36 households (24.7%) experiencing poverty. Likewise, among single-mother households, those with 3 or 4 children have the highest poverty rate, with 63 households (94.0%) falling below the poverty line.
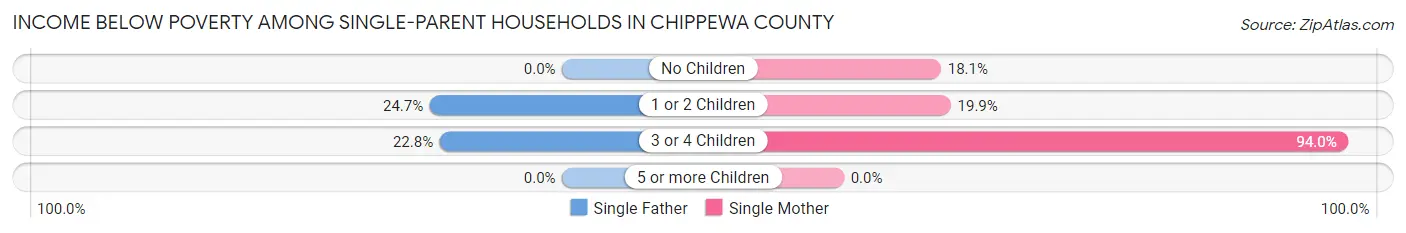
| Children | Single Father | Single Mother |
| No Children | 0 (0.0%) | 17 (18.1%) |
| 1 or 2 Children | 36 (24.7%) | 49 (19.9%) |
| 3 or 4 Children | 13 (22.8%) | 63 (94.0%) |
| 5 or more Children | 0 (0.0%) | 0 (0.0%) |
| Total | 49 (21.7%) | 129 (31.7%) |
Income Below Poverty Among Married-Couple vs Single-Parent Households in Chippewa County
The poverty data for Chippewa County shows that 46 of the married-couple family households (1.9%) and 178 of the single-parent households (28.1%) are living below the poverty level. Within the married-couple family households, those with 1 or 2 children have the highest poverty rate, with 23 households (3.3%) falling below the poverty line. Among the single-parent households, those with 3 or 4 children have the highest poverty rate, with 76 household (61.3%) living below poverty.
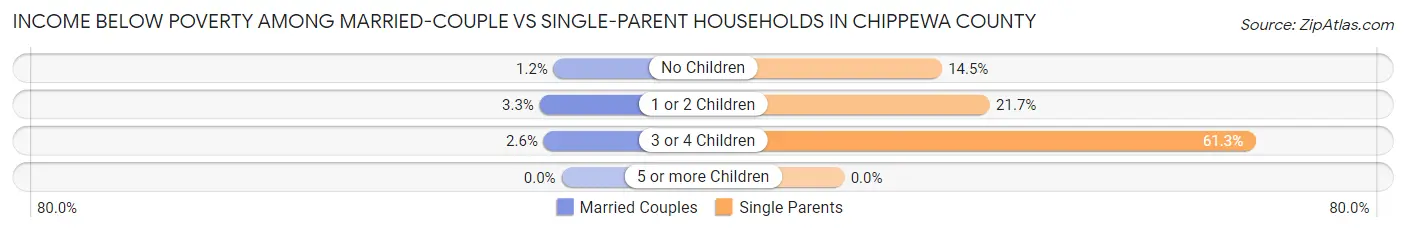
| Children | Married-Couple Families | Single-Parent Households |
| No Children | 17 (1.2%) | 17 (14.5%) |
| 1 or 2 Children | 23 (3.3%) | 85 (21.7%) |
| 3 or 4 Children | 6 (2.6%) | 76 (61.3%) |
| 5 or more Children | 0 (0.0%) | 0 (0.0%) |
| Total | 46 (1.9%) | 178 (28.1%) |
Employment Characteristics in Chippewa County
Employment by Class of Employer in Chippewa County
Among the 5,806 employed individuals in Chippewa County, private company employees (3,477 | 59.9%), local government employees (804 | 13.9%), and self-employed (not incorporated) (537 | 9.2%) make up the most common classes of employment.
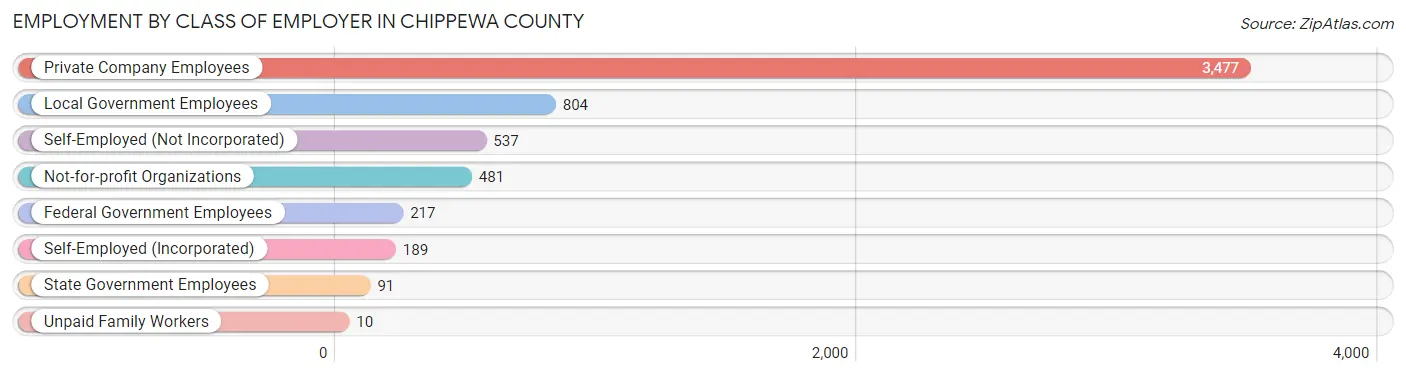
| Employer Class | # Employees | % Employees |
| Private Company Employees | 3,477 | 59.9% |
| Self-Employed (Incorporated) | 189 | 3.3% |
| Self-Employed (Not Incorporated) | 537 | 9.2% |
| Not-for-profit Organizations | 481 | 8.3% |
| Local Government Employees | 804 | 13.9% |
| State Government Employees | 91 | 1.6% |
| Federal Government Employees | 217 | 3.7% |
| Unpaid Family Workers | 10 | 0.2% |
| Total | 5,806 | 100.0% |
Employment Status by Age in Chippewa County
According to the labor force statistics for Chippewa County, out of the total population over 16 years of age (10,008), 63.8% or 6,385 individuals are in the labor force, with 5.2% or 332 of them unemployed. The age group with the highest labor force participation rate is 35 to 44 years, with 90.1% or 1,261 individuals in the labor force. Within the labor force, the 16 to 19 years age range has the highest percentage of unemployed individuals, with 24.0% or 70 of them being unemployed.
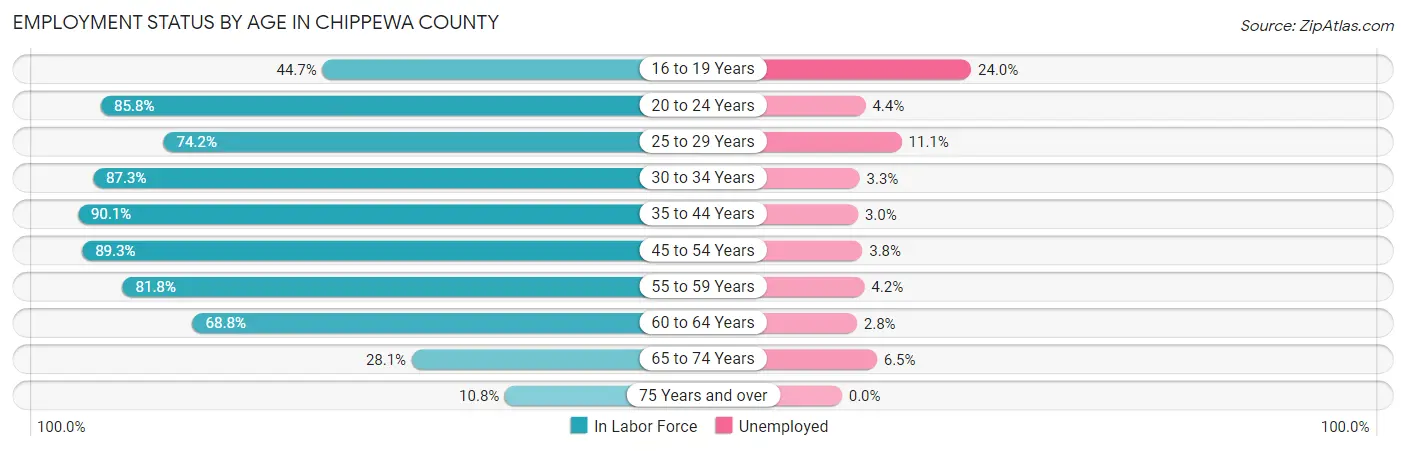
| Age Bracket | In Labor Force | Unemployed |
| 16 to 19 Years | 292 (44.7%) | 70 (24.0%) |
| 20 to 24 Years | 638 (85.8%) | 28 (4.4%) |
| 25 to 29 Years | 542 (74.2%) | 60 (11.1%) |
| 30 to 34 Years | 667 (87.3%) | 22 (3.3%) |
| 35 to 44 Years | 1,261 (90.1%) | 38 (3.0%) |
| 45 to 54 Years | 1,118 (89.3%) | 42 (3.8%) |
| 55 to 59 Years | 714 (81.8%) | 30 (4.2%) |
| 60 to 64 Years | 610 (68.8%) | 17 (2.8%) |
| 65 to 74 Years | 403 (28.1%) | 26 (6.5%) |
| 75 Years and over | 137 (10.8%) | 0 (0.0%) |
| Total | 6,385 (63.8%) | 332 (5.2%) |
Employment Status by Educational Attainment in Chippewa County
According to labor force statistics for Chippewa County, 83.2% of individuals (4,914) out of the total population between 25 and 64 years of age (5,906) are in the labor force, with 4.3% or 211 of them being unemployed. The group with the highest labor force participation rate are those with the educational attainment of college / associate degree, with 87.0% or 2,209 individuals in the labor force. Within the labor force, individuals with less than high school education have the highest percentage of unemployment, with 15.5% or 55 of them being unemployed.
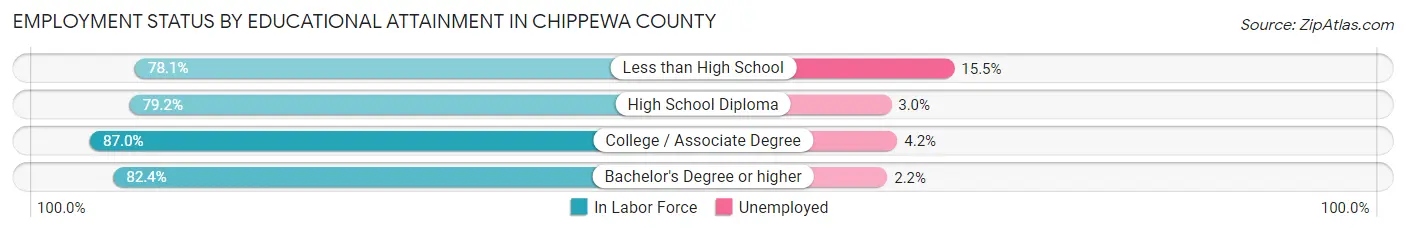
| Educational Attainment | In Labor Force | Unemployed |
| Less than High School | 354 (78.1%) | 70 (15.5%) |
| High School Diploma | 1,300 (79.2%) | 49 (3.0%) |
| College / Associate Degree | 2,209 (87.0%) | 107 (4.2%) |
| Bachelor's Degree or higher | 1,048 (82.4%) | 28 (2.2%) |
| Total | 4,914 (83.2%) | 254 (4.3%) |
Employment Occupations by Sex in Chippewa County
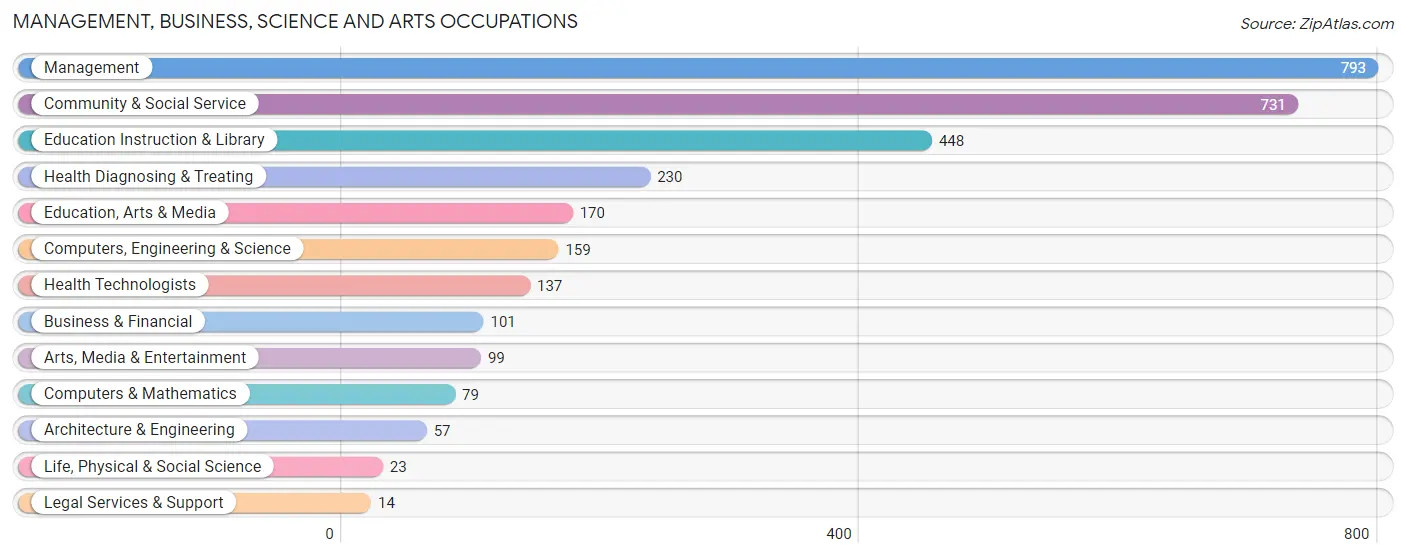
Management, Business, Science and Arts Occupations
The most common Management, Business, Science and Arts occupations in Chippewa County are Management (793 | 13.1%), Community & Social Service (731 | 12.1%), Education Instruction & Library (448 | 7.4%), Health Diagnosing & Treating (230 | 3.8%), and Education, Arts & Media (170 | 2.8%).
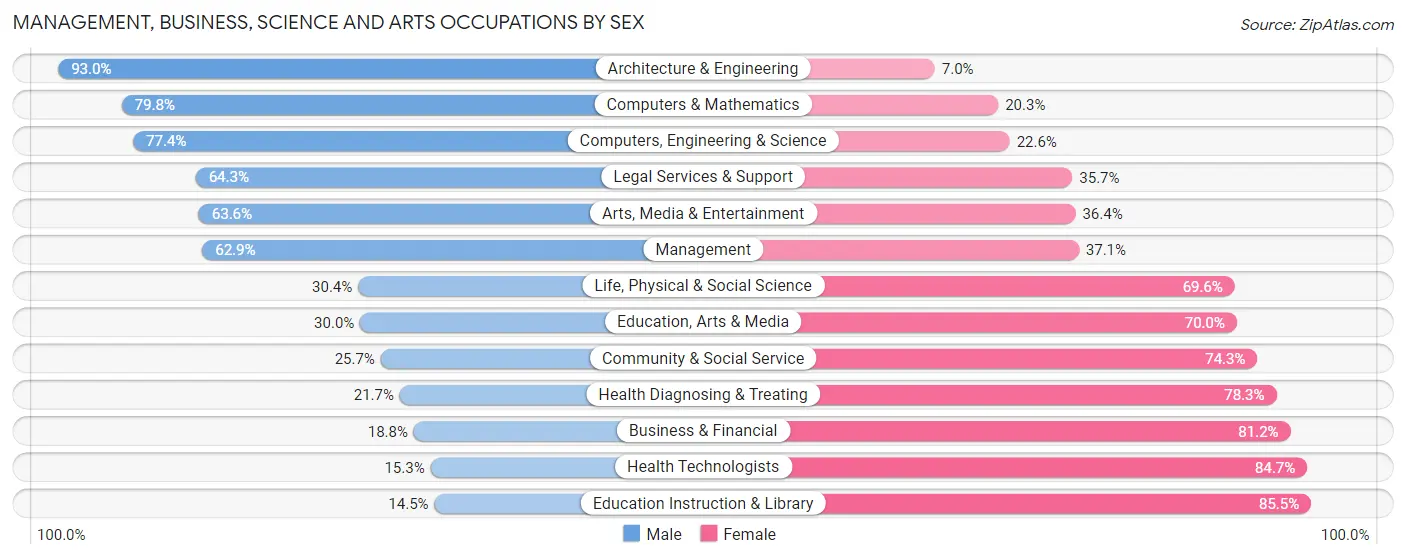
Management, Business, Science and Arts Occupations by Sex
Within the Management, Business, Science and Arts occupations in Chippewa County, the most male-oriented occupations are Architecture & Engineering (93.0%), Computers & Mathematics (79.7%), and Computers, Engineering & Science (77.4%), while the most female-oriented occupations are Education Instruction & Library (85.5%), Health Technologists (84.7%), and Business & Financial (81.2%).
| Occupation | Male | Female |
| Management | 499 (62.9%) | 294 (37.1%) |
| Business & Financial | 19 (18.8%) | 82 (81.2%) |
| Computers, Engineering & Science | 123 (77.4%) | 36 (22.6%) |
| Computers & Mathematics | 63 (79.7%) | 16 (20.3%) |
| Architecture & Engineering | 53 (93.0%) | 4 (7.0%) |
| Life, Physical & Social Science | 7 (30.4%) | 16 (69.6%) |
| Community & Social Service | 188 (25.7%) | 543 (74.3%) |
| Education, Arts & Media | 51 (30.0%) | 119 (70.0%) |
| Legal Services & Support | 9 (64.3%) | 5 (35.7%) |
| Education Instruction & Library | 65 (14.5%) | 383 (85.5%) |
| Arts, Media & Entertainment | 63 (63.6%) | 36 (36.4%) |
| Health Diagnosing & Treating | 50 (21.7%) | 180 (78.3%) |
| Health Technologists | 21 (15.3%) | 116 (84.7%) |
| Total (Category) | 879 (43.6%) | 1,135 (56.4%) |
| Total (Overall) | 3,159 (52.2%) | 2,889 (47.8%) |
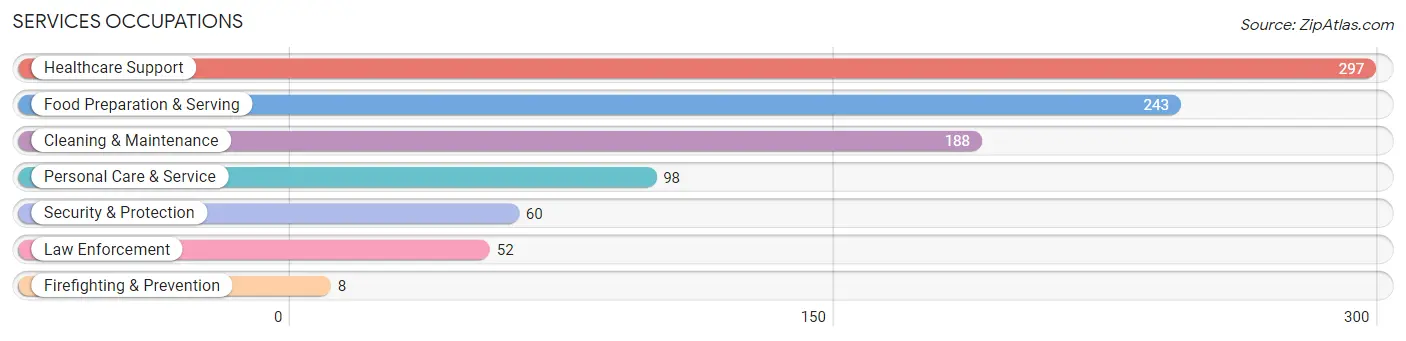
Services Occupations
The most common Services occupations in Chippewa County are Healthcare Support (297 | 4.9%), Food Preparation & Serving (243 | 4.0%), Cleaning & Maintenance (188 | 3.1%), Personal Care & Service (98 | 1.6%), and Security & Protection (60 | 1.0%).
Services Occupations by Sex
Within the Services occupations in Chippewa County, the most male-oriented occupations are Law Enforcement (96.2%), Security & Protection (95.0%), and Firefighting & Prevention (87.5%), while the most female-oriented occupations are Personal Care & Service (96.9%), Healthcare Support (67.7%), and Food Preparation & Serving (48.1%).
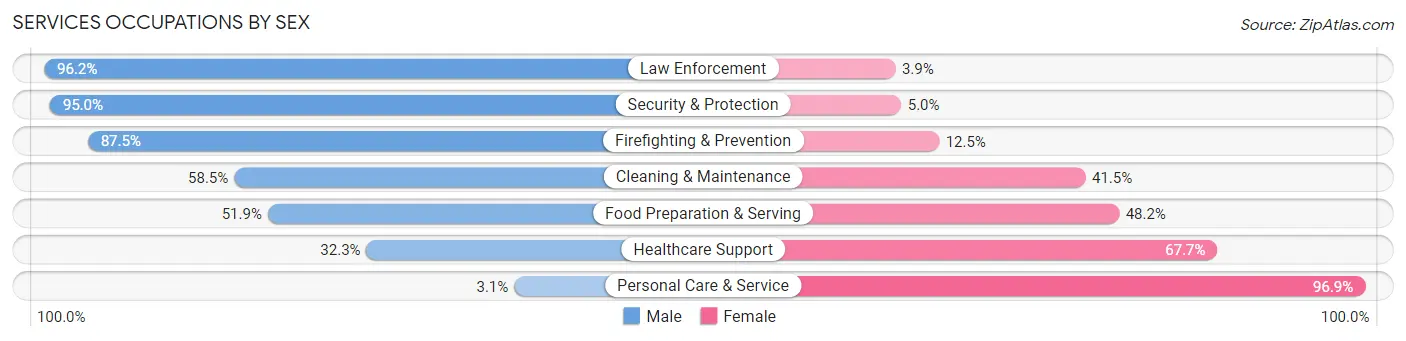
| Occupation | Male | Female |
| Healthcare Support | 96 (32.3%) | 201 (67.7%) |
| Security & Protection | 57 (95.0%) | 3 (5.0%) |
| Firefighting & Prevention | 7 (87.5%) | 1 (12.5%) |
| Law Enforcement | 50 (96.2%) | 2 (3.8%) |
| Food Preparation & Serving | 126 (51.8%) | 117 (48.1%) |
| Cleaning & Maintenance | 110 (58.5%) | 78 (41.5%) |
| Personal Care & Service | 3 (3.1%) | 95 (96.9%) |
| Total (Category) | 392 (44.2%) | 494 (55.8%) |
| Total (Overall) | 3,159 (52.2%) | 2,889 (47.8%) |
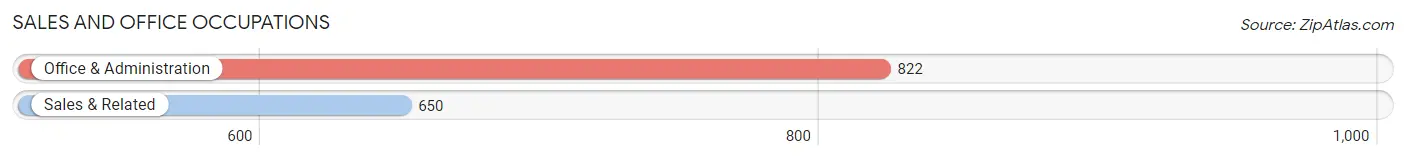
Sales and Office Occupations
The most common Sales and Office occupations in Chippewa County are Office & Administration (822 | 13.6%), and Sales & Related (650 | 10.7%).
Sales and Office Occupations by Sex
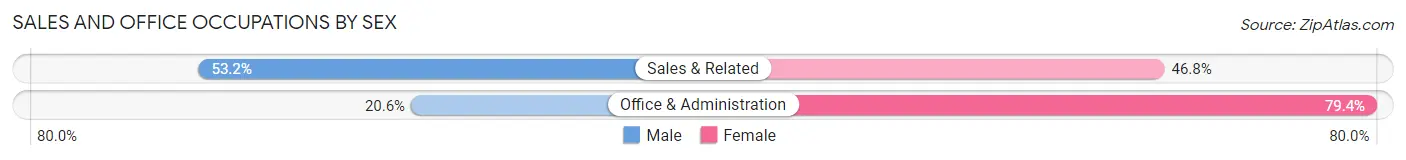
| Occupation | Male | Female |
| Sales & Related | 346 (53.2%) | 304 (46.8%) |
| Office & Administration | 169 (20.6%) | 653 (79.4%) |
| Total (Category) | 515 (35.0%) | 957 (65.0%) |
| Total (Overall) | 3,159 (52.2%) | 2,889 (47.8%) |
Natural Resources, Construction and Maintenance Occupations
The most common Natural Resources, Construction and Maintenance occupations in Chippewa County are Construction & Extraction (349 | 5.8%), Installation, Maintenance & Repair (176 | 2.9%), and Farming, Fishing & Forestry (88 | 1.5%).
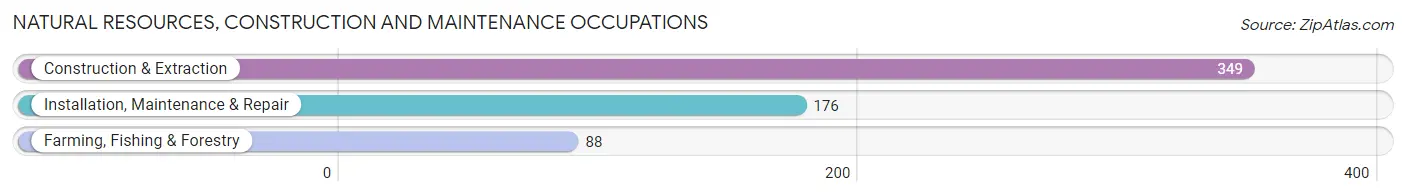
Natural Resources, Construction and Maintenance Occupations by Sex

| Occupation | Male | Female |
| Farming, Fishing & Forestry | 64 (72.7%) | 24 (27.3%) |
| Construction & Extraction | 334 (95.7%) | 15 (4.3%) |
| Installation, Maintenance & Repair | 176 (100.0%) | 0 (0.0%) |
| Total (Category) | 574 (93.6%) | 39 (6.4%) |
| Total (Overall) | 3,159 (52.2%) | 2,889 (47.8%) |
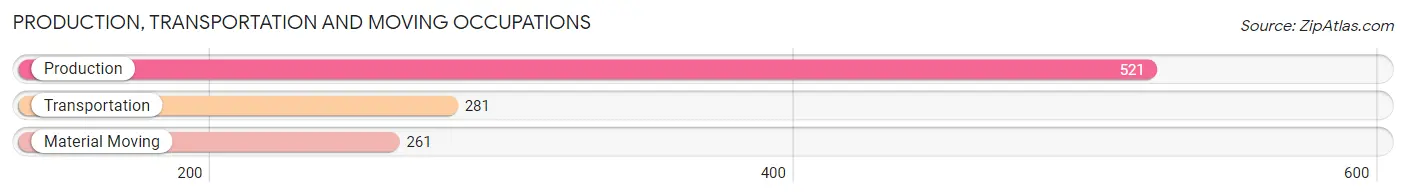
Production, Transportation and Moving Occupations
The most common Production, Transportation and Moving occupations in Chippewa County are Production (521 | 8.6%), Transportation (281 | 4.6%), and Material Moving (261 | 4.3%).
Production, Transportation and Moving Occupations by Sex
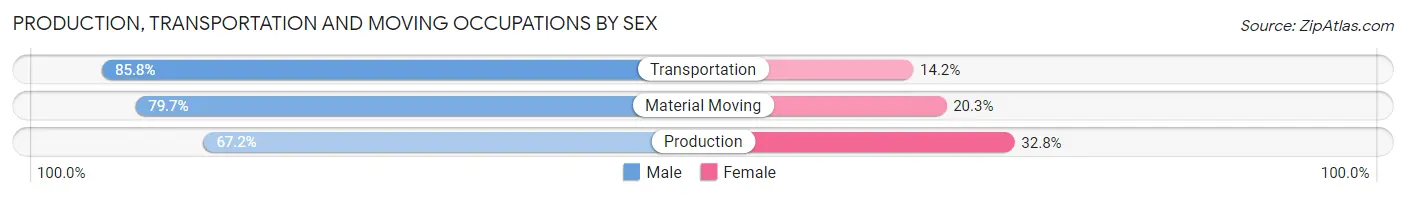
| Occupation | Male | Female |
| Production | 350 (67.2%) | 171 (32.8%) |
| Transportation | 241 (85.8%) | 40 (14.2%) |
| Material Moving | 208 (79.7%) | 53 (20.3%) |
| Total (Category) | 799 (75.2%) | 264 (24.8%) |
| Total (Overall) | 3,159 (52.2%) | 2,889 (47.8%) |
Employment Industries by Sex in Chippewa County
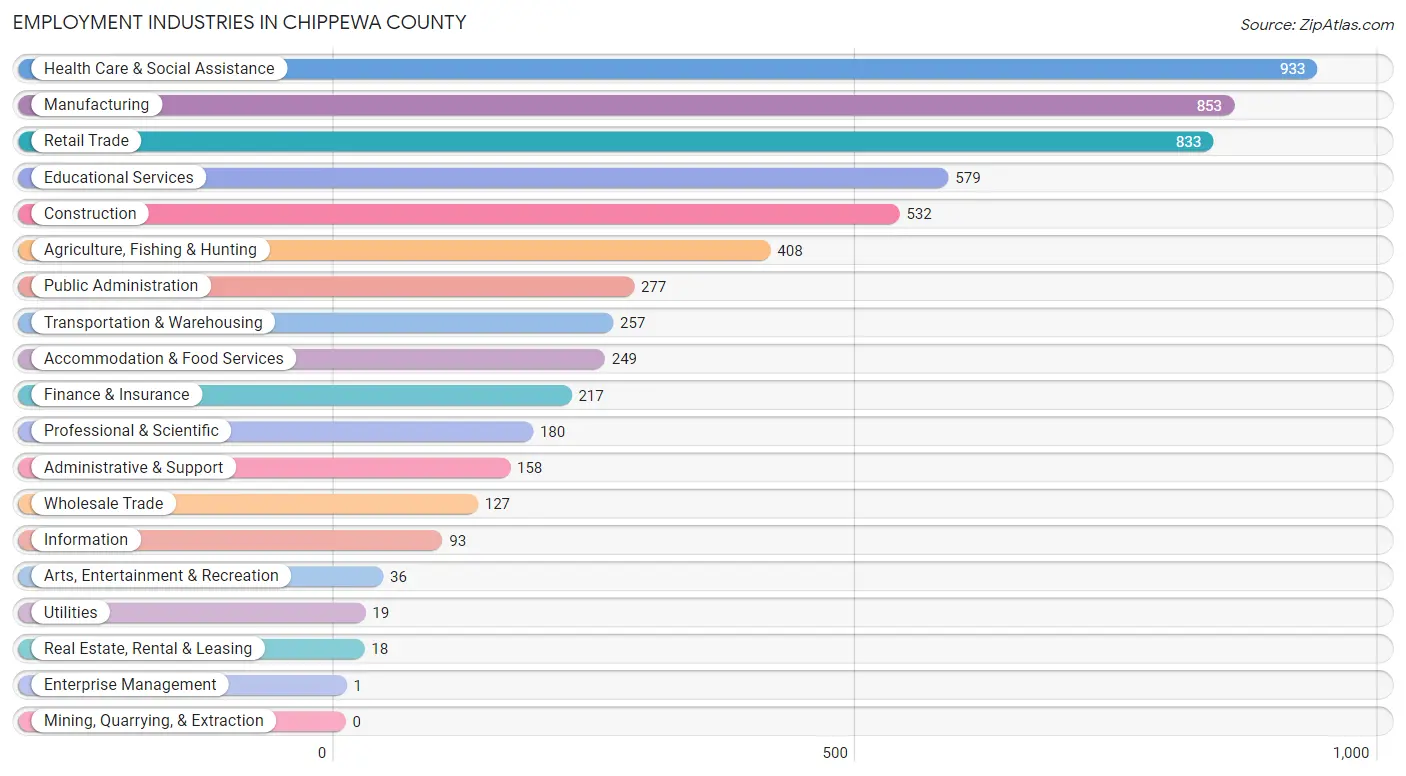
Employment Industries in Chippewa County
The major employment industries in Chippewa County include Health Care & Social Assistance (933 | 15.4%), Manufacturing (853 | 14.1%), Retail Trade (833 | 13.8%), Educational Services (579 | 9.6%), and Construction (532 | 8.8%).
Employment Industries by Sex in Chippewa County
The Chippewa County industries that see more men than women are Utilities (100.0%), Construction (93.6%), and Agriculture, Fishing & Hunting (84.3%), whereas the industries that tend to have a higher number of women are Enterprise Management (100.0%), Educational Services (86.0%), and Health Care & Social Assistance (82.2%).

| Industry | Male | Female |
| Agriculture, Fishing & Hunting | 344 (84.3%) | 64 (15.7%) |
| Mining, Quarrying, & Extraction | 0 (0.0%) | 0 (0.0%) |
| Construction | 498 (93.6%) | 34 (6.4%) |
| Manufacturing | 600 (70.3%) | 253 (29.7%) |
| Wholesale Trade | 81 (63.8%) | 46 (36.2%) |
| Retail Trade | 481 (57.7%) | 352 (42.3%) |
| Transportation & Warehousing | 176 (68.5%) | 81 (31.5%) |
| Utilities | 19 (100.0%) | 0 (0.0%) |
| Information | 42 (45.2%) | 51 (54.8%) |
| Finance & Insurance | 69 (31.8%) | 148 (68.2%) |
| Real Estate, Rental & Leasing | 15 (83.3%) | 3 (16.7%) |
| Professional & Scientific | 93 (51.7%) | 87 (48.3%) |
| Enterprise Management | 0 (0.0%) | 1 (100.0%) |
| Administrative & Support | 100 (63.3%) | 58 (36.7%) |
| Educational Services | 81 (14.0%) | 498 (86.0%) |
| Health Care & Social Assistance | 166 (17.8%) | 767 (82.2%) |
| Arts, Entertainment & Recreation | 8 (22.2%) | 28 (77.8%) |
| Accommodation & Food Services | 91 (36.5%) | 158 (63.4%) |
| Public Administration | 141 (50.9%) | 136 (49.1%) |
| Total | 3,159 (52.2%) | 2,889 (47.8%) |
Education in Chippewa County
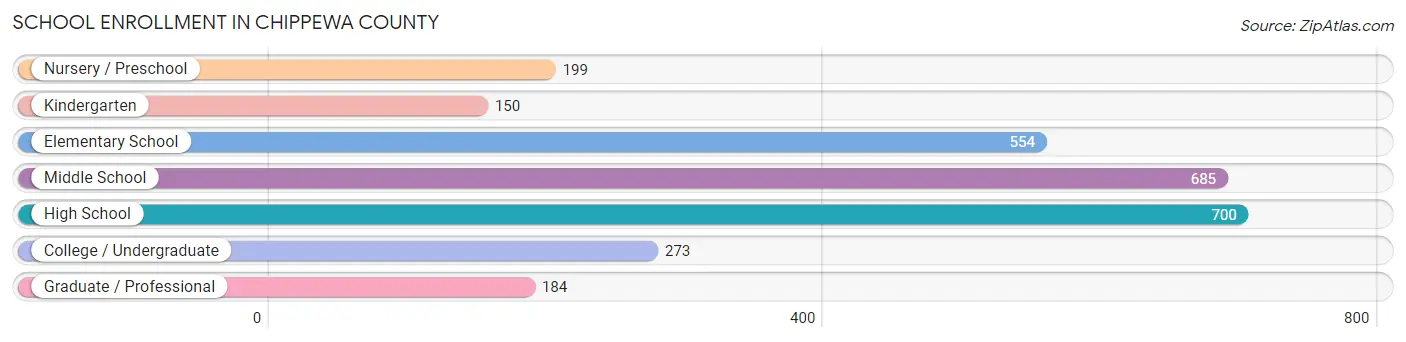
School Enrollment in Chippewa County
The most common levels of schooling among the 2,745 students in Chippewa County are high school (700 | 25.5%), middle school (685 | 24.9%), and elementary school (554 | 20.2%).
| School Level | # Students | % Students |
| Nursery / Preschool | 199 | 7.2% |
| Kindergarten | 150 | 5.5% |
| Elementary School | 554 | 20.2% |
| Middle School | 685 | 24.9% |
| High School | 700 | 25.5% |
| College / Undergraduate | 273 | 10.0% |
| Graduate / Professional | 184 | 6.7% |
| Total | 2,745 | 100.0% |
School Enrollment by Age by Funding Source in Chippewa County
Out of a total of 2,745 students who are enrolled in schools in Chippewa County, 187 (6.8%) attend a private institution, while the remaining 2,558 (93.2%) are enrolled in public schools. The age group of 25 to 34 year olds has the highest likelihood of being enrolled in private schools, with 11 (22.0% in the age bracket) enrolled. Conversely, the age group of 18 to 19 year olds has the lowest likelihood of being enrolled in a private school, with 167 (98.2% in the age bracket) attending a public institution.

| Age Bracket | Public School | Private School |
| 3 to 4 Year Olds | 100 (84.0%) | 19 (16.0%) |
| 5 to 9 Year Old | 698 (94.6%) | 40 (5.4%) |
| 10 to 14 Year Olds | 740 (91.6%) | 68 (8.4%) |
| 15 to 17 Year Olds | 488 (96.8%) | 16 (3.2%) |
| 18 to 19 Year Olds | 167 (98.2%) | 3 (1.8%) |
| 20 to 24 Year Olds | 237 (94.4%) | 14 (5.6%) |
| 25 to 34 Year Olds | 39 (78.0%) | 11 (22.0%) |
| 35 Years and over | 88 (83.8%) | 17 (16.2%) |
| Total | 2,558 (93.2%) | 187 (6.8%) |
Educational Attainment by Field of Study in Chippewa County
Education (431 | 22.3%), business (306 | 15.8%), bio, nature & agricultural (211 | 10.9%), social sciences (184 | 9.5%), and science & technology (168 | 8.7%) are the most common fields of study among 1,935 individuals in Chippewa County who have obtained a bachelor's degree or higher.
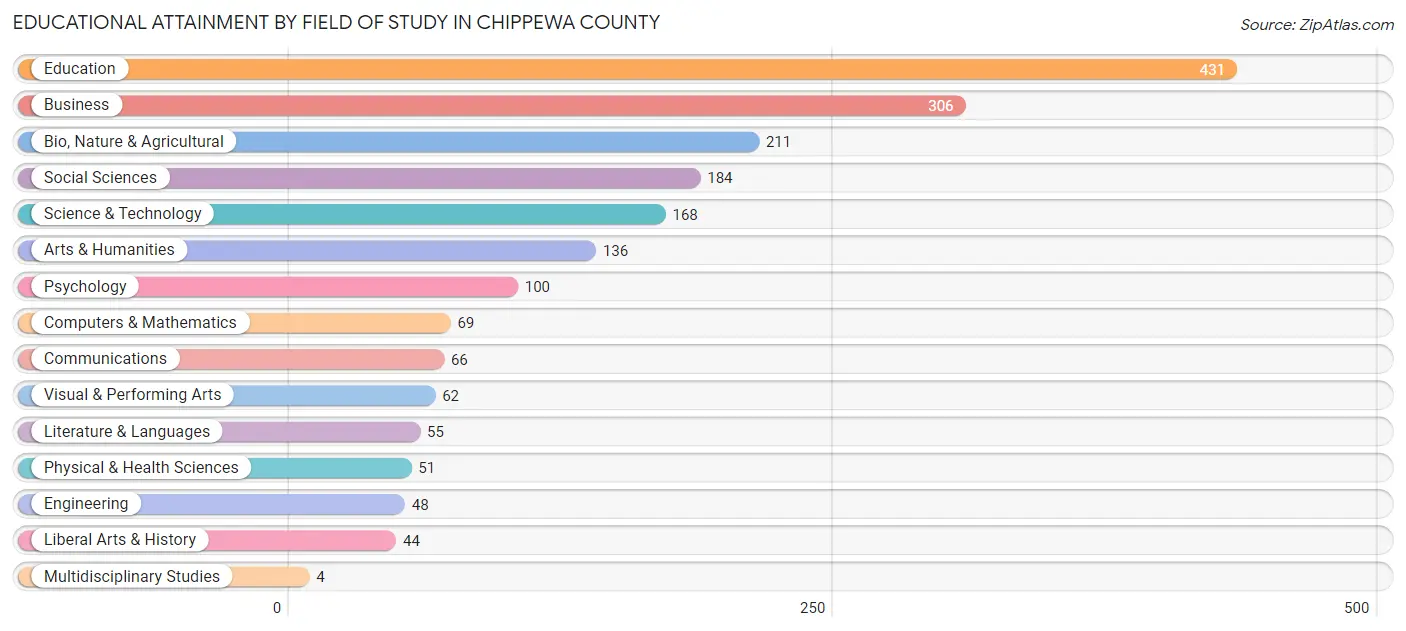
| Field of Study | # Graduates | % Graduates |
| Computers & Mathematics | 69 | 3.6% |
| Bio, Nature & Agricultural | 211 | 10.9% |
| Physical & Health Sciences | 51 | 2.6% |
| Psychology | 100 | 5.2% |
| Social Sciences | 184 | 9.5% |
| Engineering | 48 | 2.5% |
| Multidisciplinary Studies | 4 | 0.2% |
| Science & Technology | 168 | 8.7% |
| Business | 306 | 15.8% |
| Education | 431 | 22.3% |
| Literature & Languages | 55 | 2.8% |
| Liberal Arts & History | 44 | 2.3% |
| Visual & Performing Arts | 62 | 3.2% |
| Communications | 66 | 3.4% |
| Arts & Humanities | 136 | 7.0% |
| Total | 1,935 | 100.0% |
Transportation & Commute in Chippewa County
Vehicle Availability by Sex in Chippewa County
The most prevalent vehicle ownership categories in Chippewa County are males with 2 vehicles (1,185, accounting for 38.8%) and females with 2 vehicles (855, making up 43.3%).

| Vehicles Available | Male | Female |
| No Vehicle | 23 (0.7%) | 79 (2.9%) |
| 1 Vehicle | 501 (16.4%) | 431 (15.8%) |
| 2 Vehicles | 1,185 (38.8%) | 855 (31.2%) |
| 3 Vehicles | 810 (26.5%) | 841 (30.7%) |
| 4 Vehicles | 363 (11.9%) | 398 (14.5%) |
| 5 or more Vehicles | 172 (5.6%) | 133 (4.9%) |
| Total | 3,054 (100.0%) | 2,737 (100.0%) |
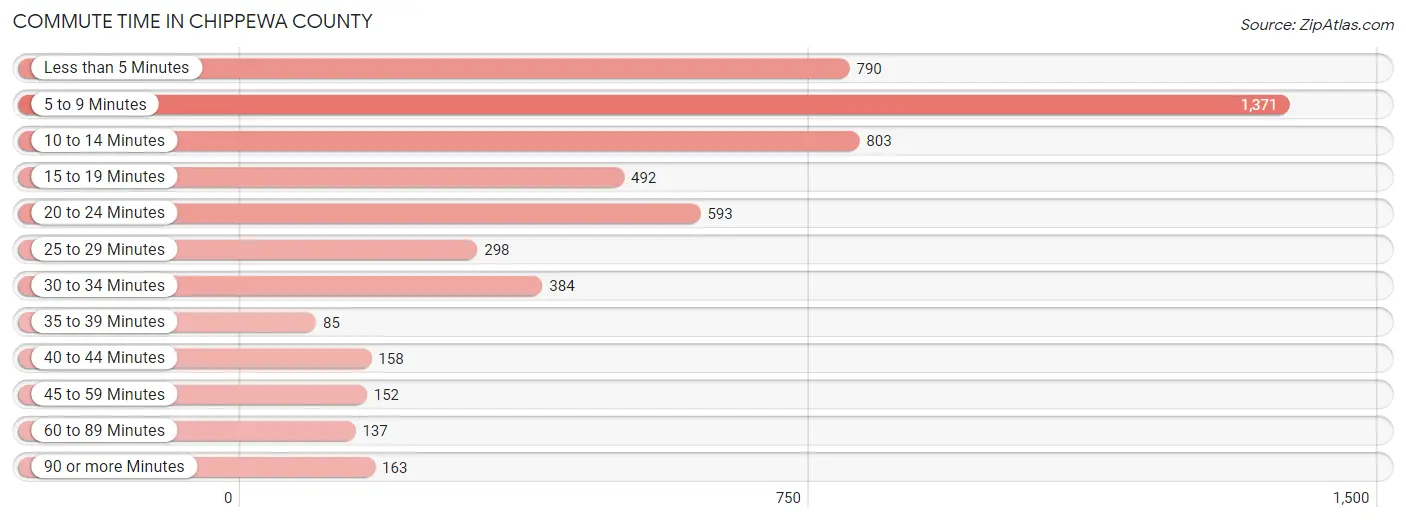
Commute Time in Chippewa County
The most frequently occuring commute durations in Chippewa County are 5 to 9 minutes (1,371 commuters, 25.3%), 10 to 14 minutes (803 commuters, 14.8%), and less than 5 minutes (790 commuters, 14.6%).
| Commute Time | # Commuters | % Commuters |
| Less than 5 Minutes | 790 | 14.6% |
| 5 to 9 Minutes | 1,371 | 25.3% |
| 10 to 14 Minutes | 803 | 14.8% |
| 15 to 19 Minutes | 492 | 9.1% |
| 20 to 24 Minutes | 593 | 10.9% |
| 25 to 29 Minutes | 298 | 5.5% |
| 30 to 34 Minutes | 384 | 7.1% |
| 35 to 39 Minutes | 85 | 1.6% |
| 40 to 44 Minutes | 158 | 2.9% |
| 45 to 59 Minutes | 152 | 2.8% |
| 60 to 89 Minutes | 137 | 2.5% |
| 90 or more Minutes | 163 | 3.0% |
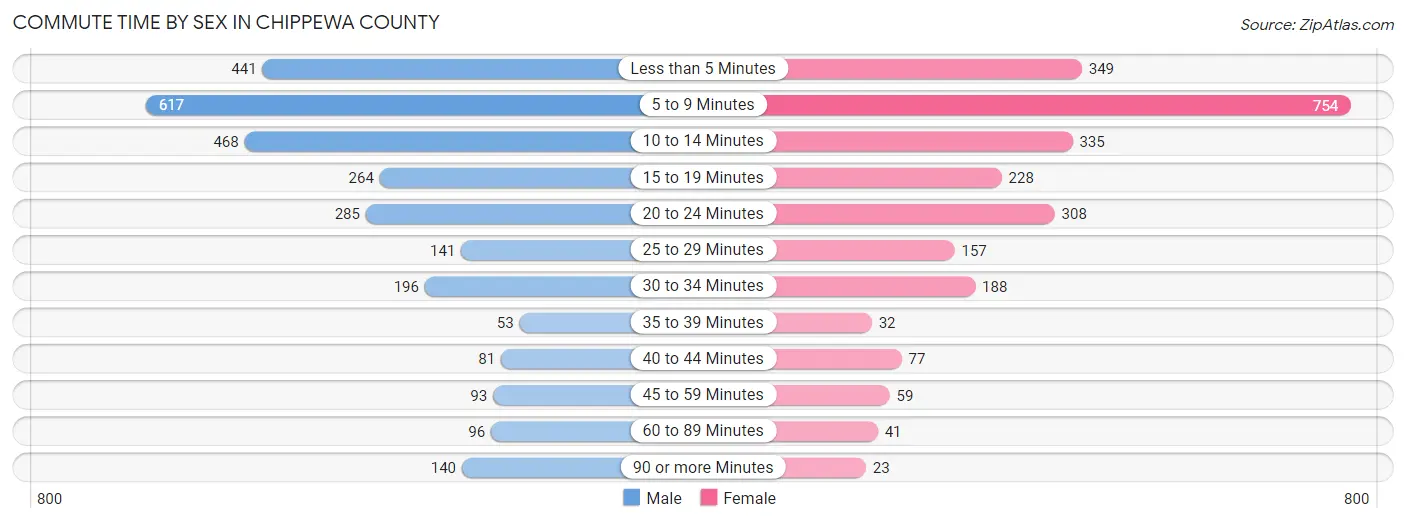
Commute Time by Sex in Chippewa County
The most common commute times in Chippewa County are 5 to 9 minutes (617 commuters, 21.5%) for males and 5 to 9 minutes (754 commuters, 29.6%) for females.
| Commute Time | Male | Female |
| Less than 5 Minutes | 441 (15.3%) | 349 (13.7%) |
| 5 to 9 Minutes | 617 (21.5%) | 754 (29.6%) |
| 10 to 14 Minutes | 468 (16.3%) | 335 (13.1%) |
| 15 to 19 Minutes | 264 (9.2%) | 228 (8.9%) |
| 20 to 24 Minutes | 285 (9.9%) | 308 (12.1%) |
| 25 to 29 Minutes | 141 (4.9%) | 157 (6.1%) |
| 30 to 34 Minutes | 196 (6.8%) | 188 (7.4%) |
| 35 to 39 Minutes | 53 (1.8%) | 32 (1.3%) |
| 40 to 44 Minutes | 81 (2.8%) | 77 (3.0%) |
| 45 to 59 Minutes | 93 (3.2%) | 59 (2.3%) |
| 60 to 89 Minutes | 96 (3.3%) | 41 (1.6%) |
| 90 or more Minutes | 140 (4.9%) | 23 (0.9%) |
Time of Departure to Work by Sex in Chippewa County
The most frequent times of departure to work in Chippewa County are 7:00 AM to 7:29 AM (504, 17.5%) for males and 7:00 AM to 7:29 AM (638, 25.0%) for females.

| Time of Departure | Male | Female |
| 12:00 AM to 4:59 AM | 125 (4.3%) | 9 (0.4%) |
| 5:00 AM to 5:29 AM | 188 (6.5%) | 72 (2.8%) |
| 5:30 AM to 5:59 AM | 326 (11.3%) | 43 (1.7%) |
| 6:00 AM to 6:29 AM | 317 (11.0%) | 185 (7.2%) |
| 6:30 AM to 6:59 AM | 454 (15.8%) | 219 (8.6%) |
| 7:00 AM to 7:29 AM | 504 (17.5%) | 638 (25.0%) |
| 7:30 AM to 7:59 AM | 359 (12.5%) | 560 (22.0%) |
| 8:00 AM to 8:29 AM | 174 (6.0%) | 223 (8.7%) |
| 8:30 AM to 8:59 AM | 73 (2.5%) | 72 (2.8%) |
| 9:00 AM to 9:59 AM | 19 (0.7%) | 149 (5.8%) |
| 10:00 AM to 10:59 AM | 38 (1.3%) | 72 (2.8%) |
| 11:00 AM to 11:59 AM | 1 (0.0%) | 23 (0.9%) |
| 12:00 PM to 3:59 PM | 140 (4.9%) | 99 (3.9%) |
| 4:00 PM to 11:59 PM | 157 (5.5%) | 187 (7.3%) |
| Total | 2,875 (100.0%) | 2,551 (100.0%) |
Housing Occupancy in Chippewa County
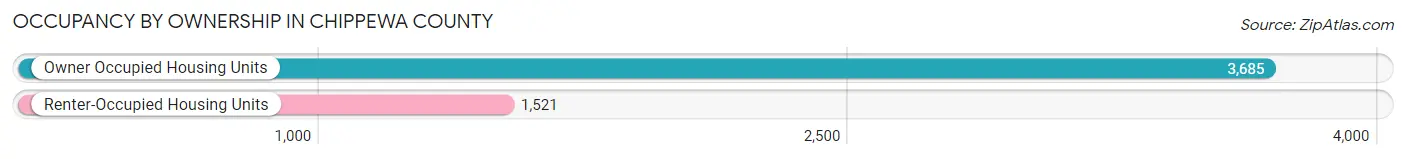
Occupancy by Ownership in Chippewa County
Of the total 5,206 dwellings in Chippewa County, owner-occupied units account for 3,685 (70.8%), while renter-occupied units make up 1,521 (29.2%).
| Occupancy | # Housing Units | % Housing Units |
| Owner Occupied Housing Units | 3,685 | 70.8% |
| Renter-Occupied Housing Units | 1,521 | 29.2% |
| Total Occupied Housing Units | 5,206 | 100.0% |
Occupancy by Household Size in Chippewa County
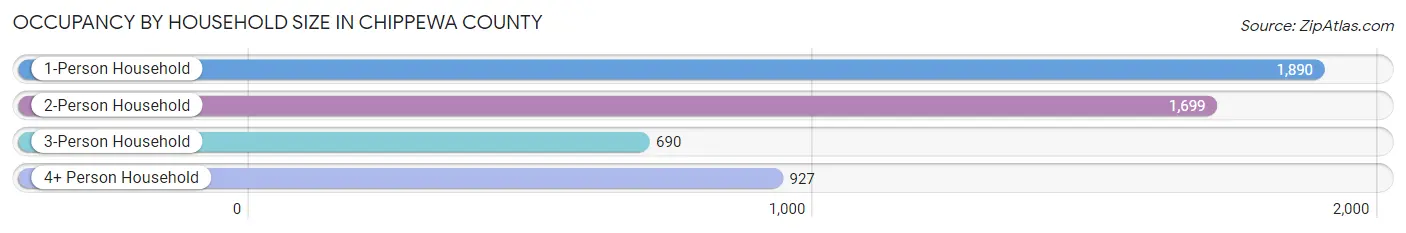
| Household Size | # Housing Units | % Housing Units |
| 1-Person Household | 1,890 | 36.3% |
| 2-Person Household | 1,699 | 32.6% |
| 3-Person Household | 690 | 13.3% |
| 4+ Person Household | 927 | 17.8% |
| Total Housing Units | 5,206 | 100.0% |
Occupancy by Ownership by Household Size in Chippewa County

| Household Size | Owner-occupied | Renter-occupied |
| 1-Person Household | 1,076 (56.9%) | 814 (43.1%) |
| 2-Person Household | 1,463 (86.1%) | 236 (13.9%) |
| 3-Person Household | 436 (63.2%) | 254 (36.8%) |
| 4+ Person Household | 710 (76.6%) | 217 (23.4%) |
| Total Housing Units | 3,685 (70.8%) | 1,521 (29.2%) |
Occupancy by Educational Attainment in Chippewa County
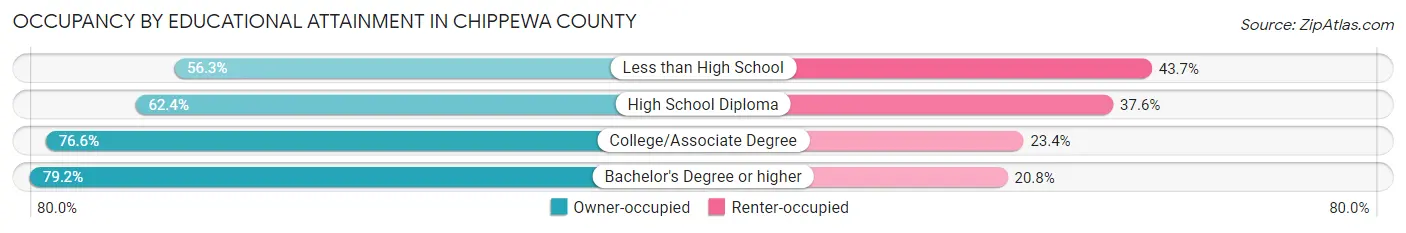
| Household Size | Owner-occupied | Renter-occupied |
| Less than High School | 206 (56.3%) | 160 (43.7%) |
| High School Diploma | 1,134 (62.4%) | 683 (37.6%) |
| College/Associate Degree | 1,460 (76.6%) | 445 (23.4%) |
| Bachelor's Degree or higher | 885 (79.2%) | 233 (20.8%) |
Occupancy by Age of Householder in Chippewa County

| Age Bracket | # Households | % Households |
| Under 35 Years | 982 | 18.9% |
| 35 to 44 Years | 752 | 14.4% |
| 45 to 54 Years | 683 | 13.1% |
| 55 to 64 Years | 1,080 | 20.7% |
| 65 to 74 Years | 844 | 16.2% |
| 75 to 84 Years | 579 | 11.1% |
| 85 Years and Over | 286 | 5.5% |
| Total | 5,206 | 100.0% |
Housing Finances in Chippewa County
Median Income by Occupancy in Chippewa County
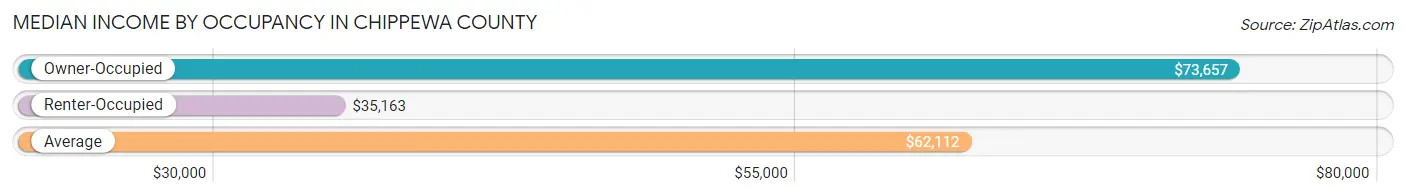
| Occupancy Type | # Households | Median Income |
| Owner-Occupied | 3,685 (70.8%) | $73,657 |
| Renter-Occupied | 1,521 (29.2%) | $35,163 |
| Average | 5,206 (100.0%) | $62,112 |
Occupancy by Householder Income Bracket in Chippewa County
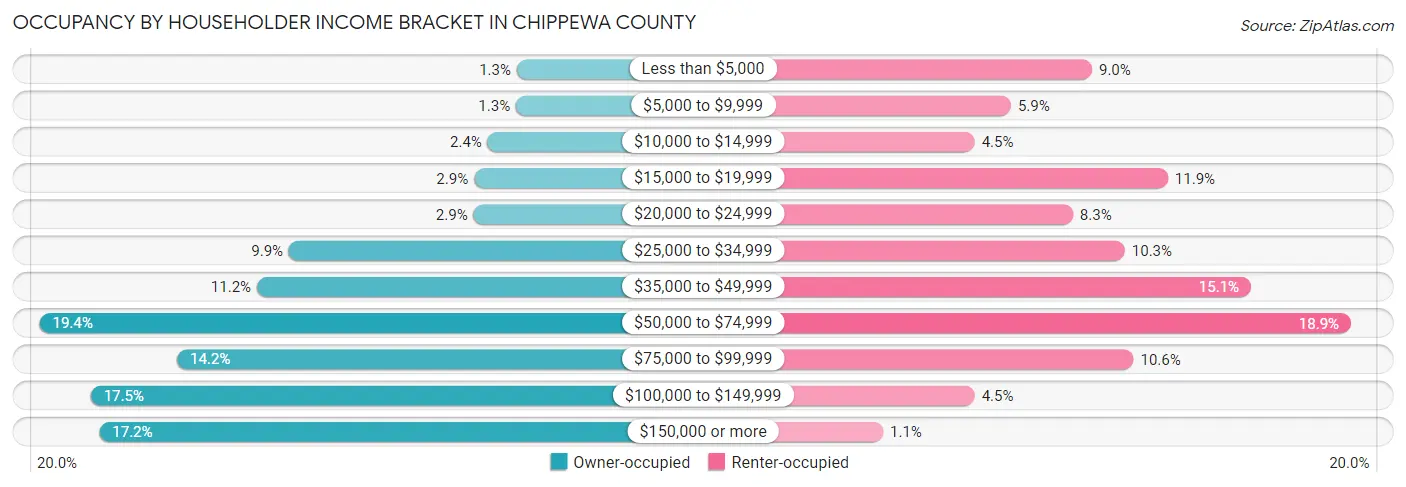
| Income Bracket | Owner-occupied | Renter-occupied |
| Less than $5,000 | 46 (1.3%) | 137 (9.0%) |
| $5,000 to $9,999 | 47 (1.3%) | 90 (5.9%) |
| $10,000 to $14,999 | 87 (2.4%) | 69 (4.5%) |
| $15,000 to $19,999 | 106 (2.9%) | 181 (11.9%) |
| $20,000 to $24,999 | 107 (2.9%) | 126 (8.3%) |
| $25,000 to $34,999 | 366 (9.9%) | 156 (10.3%) |
| $35,000 to $49,999 | 411 (11.2%) | 229 (15.1%) |
| $50,000 to $74,999 | 716 (19.4%) | 287 (18.9%) |
| $75,000 to $99,999 | 523 (14.2%) | 161 (10.6%) |
| $100,000 to $149,999 | 644 (17.5%) | 69 (4.5%) |
| $150,000 or more | 632 (17.2%) | 16 (1.1%) |
| Total | 3,685 (100.0%) | 1,521 (100.0%) |
Monthly Housing Cost Tiers in Chippewa County
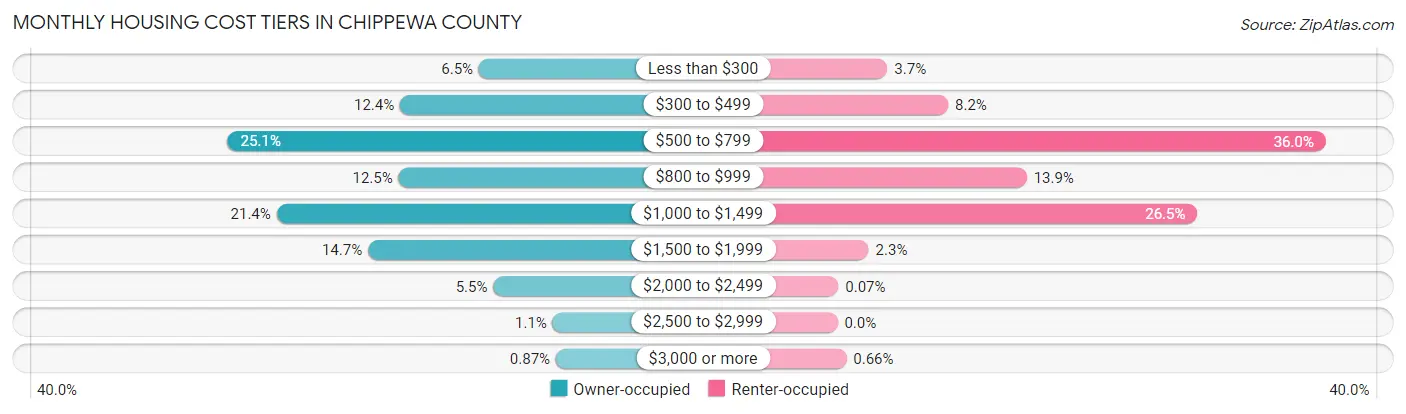
| Monthly Cost | Owner-occupied | Renter-occupied |
| Less than $300 | 241 (6.5%) | 56 (3.7%) |
| $300 to $499 | 455 (12.3%) | 124 (8.2%) |
| $500 to $799 | 923 (25.1%) | 547 (36.0%) |
| $800 to $999 | 459 (12.5%) | 212 (13.9%) |
| $1,000 to $1,499 | 790 (21.4%) | 403 (26.5%) |
| $1,500 to $1,999 | 542 (14.7%) | 35 (2.3%) |
| $2,000 to $2,499 | 202 (5.5%) | 1 (0.1%) |
| $2,500 to $2,999 | 41 (1.1%) | 0 (0.0%) |
| $3,000 or more | 32 (0.9%) | 10 (0.7%) |
| Total | 3,685 (100.0%) | 1,521 (100.0%) |
Physical Housing Characteristics in Chippewa County
Housing Structures in Chippewa County
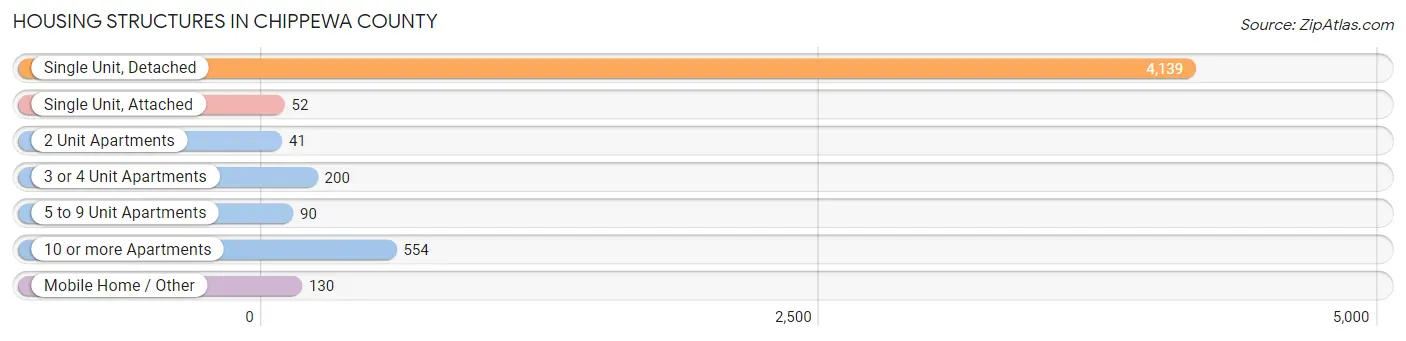
| Structure Type | # Housing Units | % Housing Units |
| Single Unit, Detached | 4,139 | 79.5% |
| Single Unit, Attached | 52 | 1.0% |
| 2 Unit Apartments | 41 | 0.8% |
| 3 or 4 Unit Apartments | 200 | 3.8% |
| 5 to 9 Unit Apartments | 90 | 1.7% |
| 10 or more Apartments | 554 | 10.6% |
| Mobile Home / Other | 130 | 2.5% |
| Total | 5,206 | 100.0% |
Housing Structures by Occupancy in Chippewa County
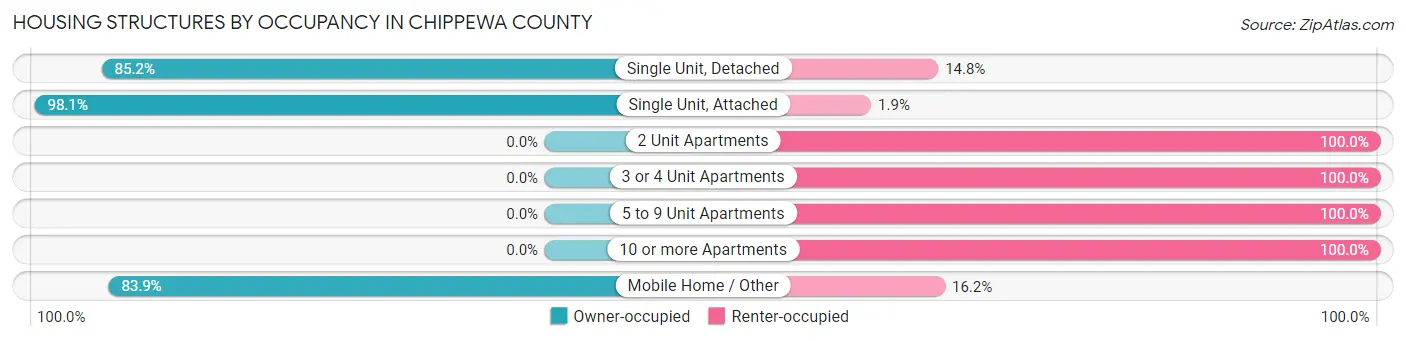
| Structure Type | Owner-occupied | Renter-occupied |
| Single Unit, Detached | 3,525 (85.2%) | 614 (14.8%) |
| Single Unit, Attached | 51 (98.1%) | 1 (1.9%) |
| 2 Unit Apartments | 0 (0.0%) | 41 (100.0%) |
| 3 or 4 Unit Apartments | 0 (0.0%) | 200 (100.0%) |
| 5 to 9 Unit Apartments | 0 (0.0%) | 90 (100.0%) |
| 10 or more Apartments | 0 (0.0%) | 554 (100.0%) |
| Mobile Home / Other | 109 (83.9%) | 21 (16.2%) |
| Total | 3,685 (70.8%) | 1,521 (29.2%) |
Housing Structures by Number of Rooms in Chippewa County

| Number of Rooms | Owner-occupied | Renter-occupied |
| 1 Room | 2 (0.1%) | 21 (1.4%) |
| 2 or 3 Rooms | 31 (0.8%) | 239 (15.7%) |
| 4 or 5 Rooms | 808 (21.9%) | 697 (45.8%) |
| 6 or 7 Rooms | 1,440 (39.1%) | 399 (26.2%) |
| 8 or more Rooms | 1,404 (38.1%) | 165 (10.8%) |
| Total | 3,685 (100.0%) | 1,521 (100.0%) |
Housing Structure by Heating Type in Chippewa County
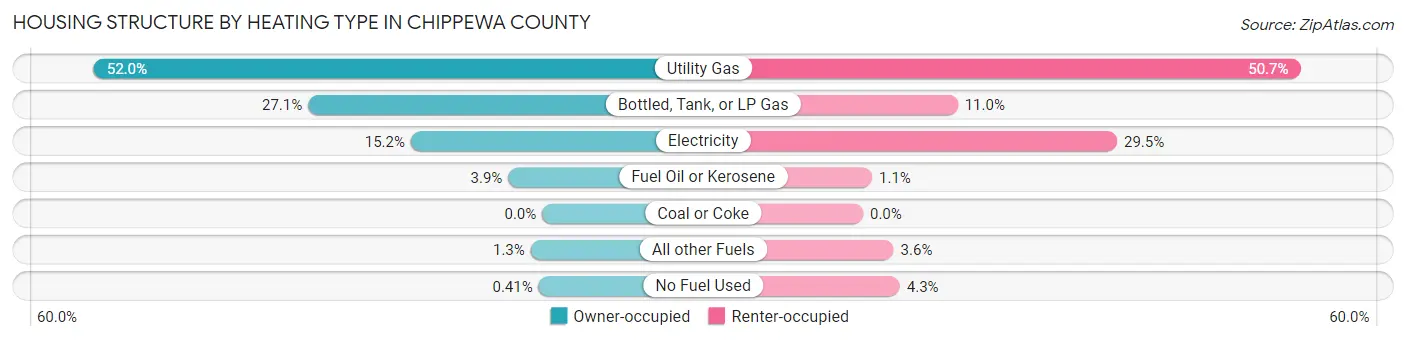
| Heating Type | Owner-occupied | Renter-occupied |
| Utility Gas | 1,915 (52.0%) | 771 (50.7%) |
| Bottled, Tank, or LP Gas | 1,000 (27.1%) | 167 (11.0%) |
| Electricity | 561 (15.2%) | 448 (29.4%) |
| Fuel Oil or Kerosene | 145 (3.9%) | 16 (1.1%) |
| Coal or Coke | 0 (0.0%) | 0 (0.0%) |
| All other Fuels | 49 (1.3%) | 54 (3.5%) |
| No Fuel Used | 15 (0.4%) | 65 (4.3%) |
| Total | 3,685 (100.0%) | 1,521 (100.0%) |
Household Vehicle Usage in Chippewa County
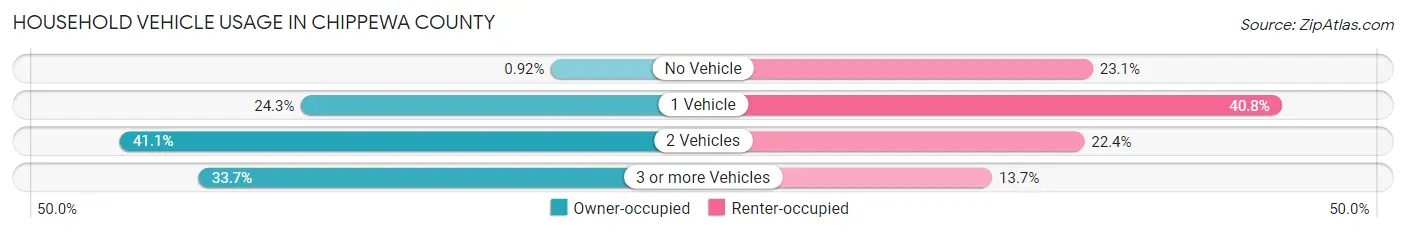
| Vehicles per Household | Owner-occupied | Renter-occupied |
| No Vehicle | 34 (0.9%) | 352 (23.1%) |
| 1 Vehicle | 894 (24.3%) | 620 (40.8%) |
| 2 Vehicles | 1,514 (41.1%) | 340 (22.4%) |
| 3 or more Vehicles | 1,243 (33.7%) | 209 (13.7%) |
| Total | 3,685 (100.0%) | 1,521 (100.0%) |
Real Estate & Mortgages in Chippewa County
Real Estate and Mortgage Overview in Chippewa County
| Characteristic | Without Mortgage | With Mortgage |
| Housing Units | 1,485 | 2,200 |
| Median Property Value | $132,600 | $140,600 |
| Median Household Income | $67,633 | $434 |
| Monthly Housing Costs | $525 | $32 |
| Real Estate Taxes | $1,400 | $72 |
Property Value by Mortgage Status in Chippewa County
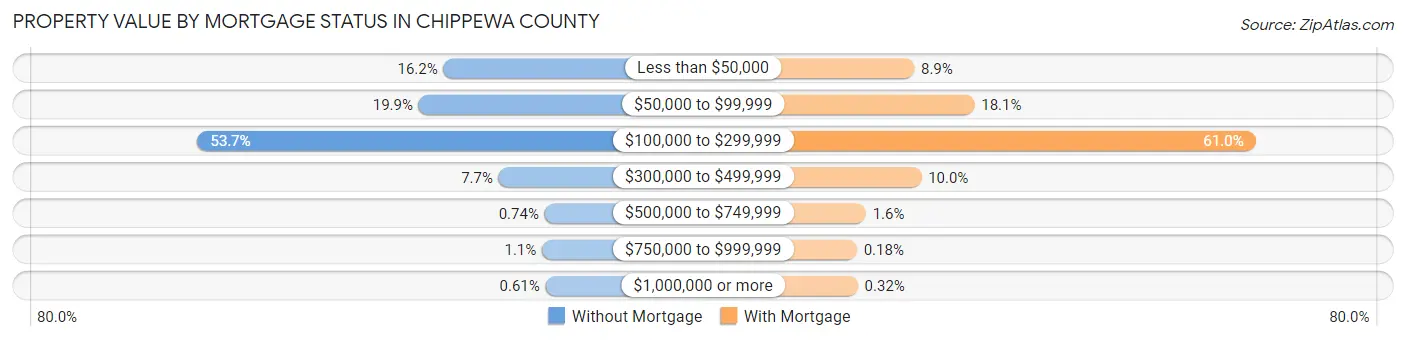
| Property Value | Without Mortgage | With Mortgage |
| Less than $50,000 | 240 (16.2%) | 196 (8.9%) |
| $50,000 to $99,999 | 296 (19.9%) | 398 (18.1%) |
| $100,000 to $299,999 | 797 (53.7%) | 1,341 (61.0%) |
| $300,000 to $499,999 | 115 (7.7%) | 220 (10.0%) |
| $500,000 to $749,999 | 11 (0.7%) | 34 (1.5%) |
| $750,000 to $999,999 | 17 (1.1%) | 4 (0.2%) |
| $1,000,000 or more | 9 (0.6%) | 7 (0.3%) |
| Total | 1,485 (100.0%) | 2,200 (100.0%) |
Household Income by Mortgage Status in Chippewa County
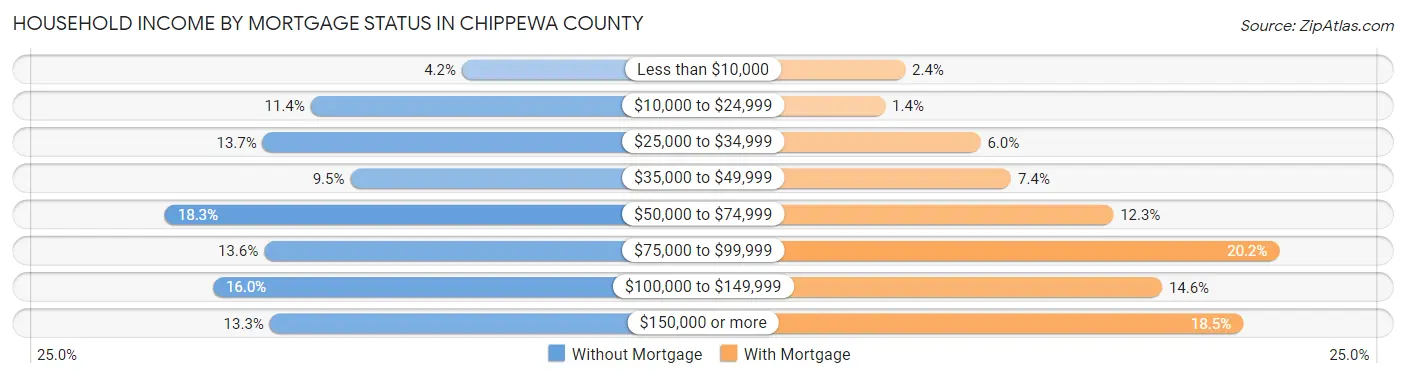
| Household Income | Without Mortgage | With Mortgage |
| Less than $10,000 | 62 (4.2%) | 52 (2.4%) |
| $10,000 to $24,999 | 169 (11.4%) | 31 (1.4%) |
| $25,000 to $34,999 | 203 (13.7%) | 131 (5.9%) |
| $35,000 to $49,999 | 141 (9.5%) | 163 (7.4%) |
| $50,000 to $74,999 | 272 (18.3%) | 270 (12.3%) |
| $75,000 to $99,999 | 202 (13.6%) | 444 (20.2%) |
| $100,000 to $149,999 | 238 (16.0%) | 321 (14.6%) |
| $150,000 or more | 198 (13.3%) | 406 (18.4%) |
| Total | 1,485 (100.0%) | 2,200 (100.0%) |
Property Value to Household Income Ratio in Chippewa County
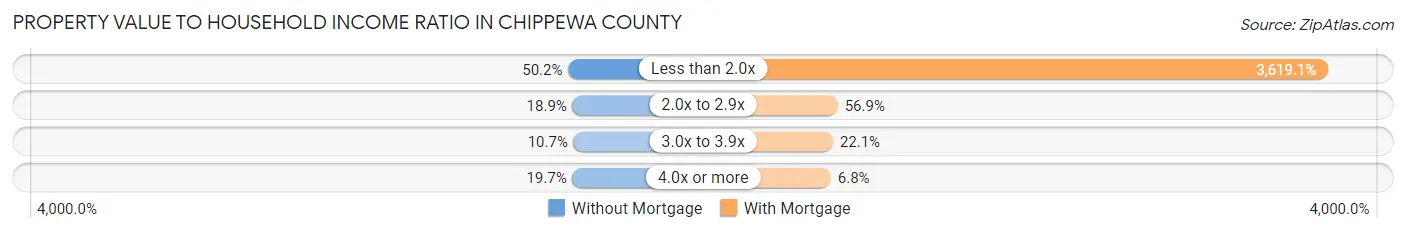
| Value-to-Income Ratio | Without Mortgage | With Mortgage |
| Less than 2.0x | 745 (50.2%) | 79,620 (3,619.1%) |
| 2.0x to 2.9x | 280 (18.9%) | 1,251 (56.9%) |
| 3.0x to 3.9x | 159 (10.7%) | 486 (22.1%) |
| 4.0x or more | 293 (19.7%) | 150 (6.8%) |
| Total | 1,485 (100.0%) | 2,200 (100.0%) |
Real Estate Taxes by Mortgage Status in Chippewa County
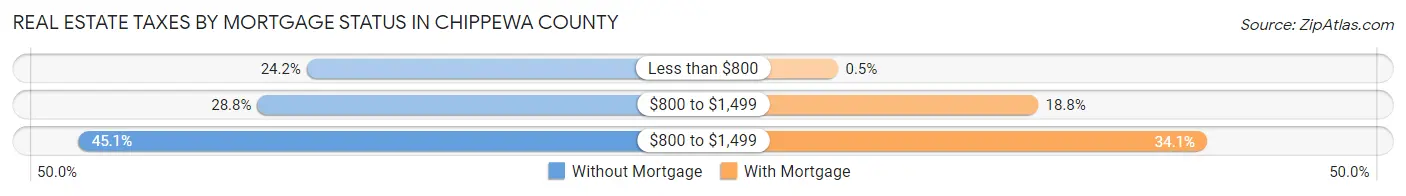
| Property Taxes | Without Mortgage | With Mortgage |
| Less than $800 | 360 (24.2%) | 11 (0.5%) |
| $800 to $1,499 | 427 (28.7%) | 413 (18.8%) |
| $800 to $1,499 | 669 (45.1%) | 751 (34.1%) |
| Total | 1,485 (100.0%) | 2,200 (100.0%) |
Health & Disability in Chippewa County
Health Insurance Coverage by Age in Chippewa County
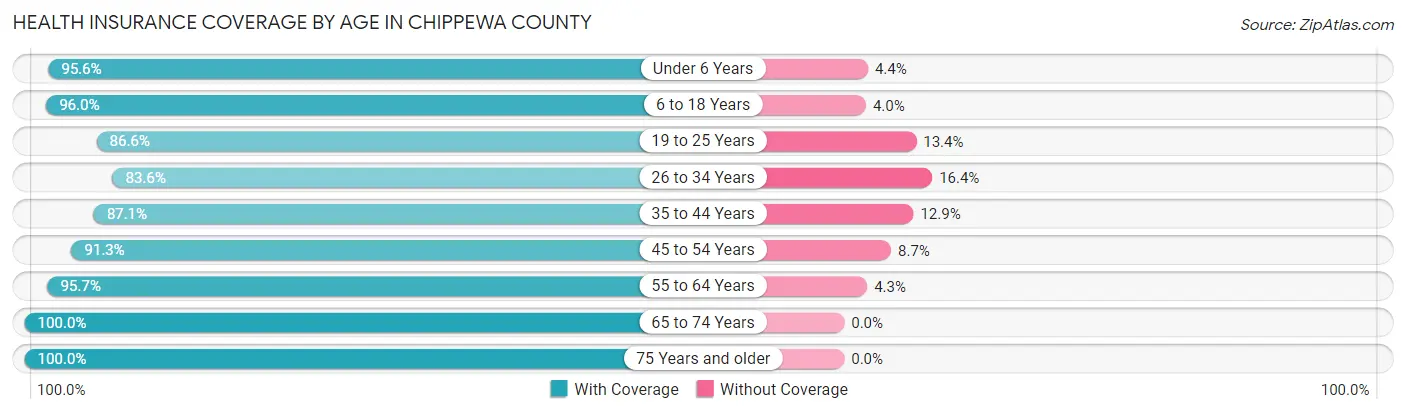
| Age Bracket | With Coverage | Without Coverage |
| Under 6 Years | 929 (95.6%) | 43 (4.4%) |
| 6 to 18 Years | 1,969 (96.0%) | 83 (4.0%) |
| 19 to 25 Years | 838 (86.6%) | 130 (13.4%) |
| 26 to 34 Years | 1,117 (83.6%) | 219 (16.4%) |
| 35 to 44 Years | 1,215 (87.1%) | 180 (12.9%) |
| 45 to 54 Years | 1,139 (91.3%) | 109 (8.7%) |
| 55 to 64 Years | 1,659 (95.7%) | 74 (4.3%) |
| 65 to 74 Years | 1,351 (100.0%) | 0 (0.0%) |
| 75 Years and older | 1,149 (100.0%) | 0 (0.0%) |
| Total | 11,366 (93.1%) | 838 (6.9%) |
Health Insurance Coverage by Citizenship Status in Chippewa County
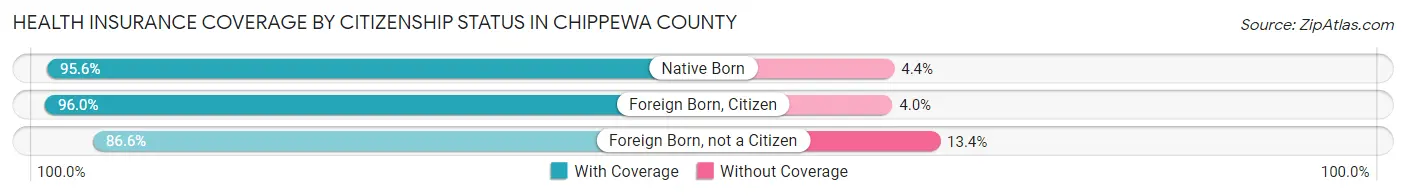
| Citizenship Status | With Coverage | Without Coverage |
| Native Born | 929 (95.6%) | 43 (4.4%) |
| Foreign Born, Citizen | 1,969 (96.0%) | 83 (4.0%) |
| Foreign Born, not a Citizen | 838 (86.6%) | 130 (13.4%) |
Health Insurance Coverage by Household Income in Chippewa County
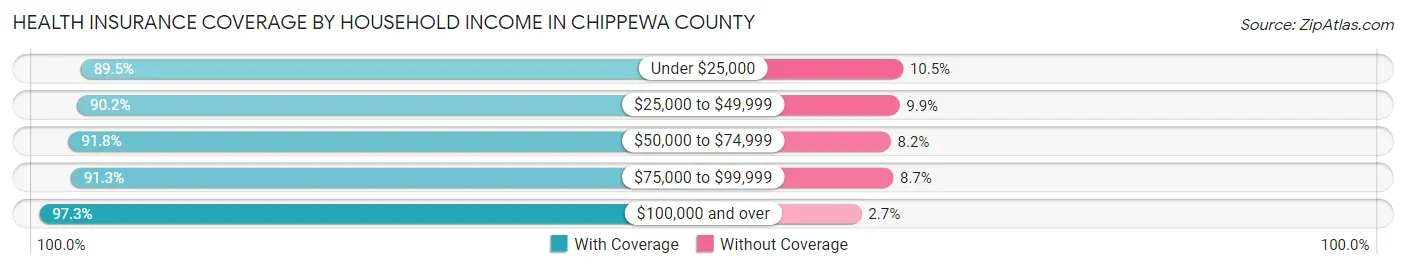
| Household Income | With Coverage | Without Coverage |
| Under $25,000 | 1,284 (89.5%) | 151 (10.5%) |
| $25,000 to $49,999 | 2,069 (90.1%) | 226 (9.9%) |
| $50,000 to $74,999 | 1,946 (91.8%) | 174 (8.2%) |
| $75,000 to $99,999 | 1,782 (91.3%) | 169 (8.7%) |
| $100,000 and over | 4,190 (97.3%) | 118 (2.7%) |
Public vs Private Health Insurance Coverage by Age in Chippewa County
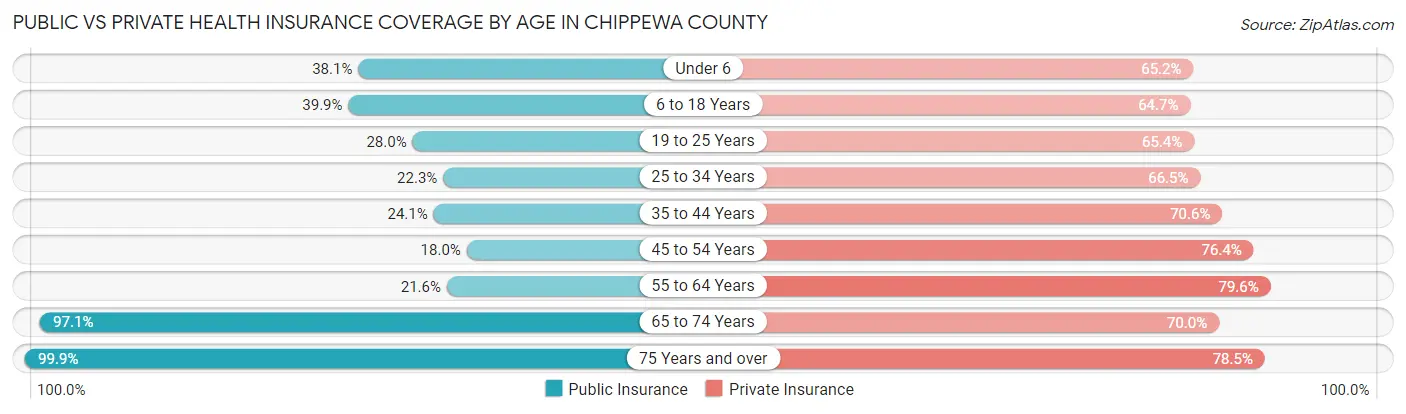
| Age Bracket | Public Insurance | Private Insurance |
| Under 6 | 370 (38.1%) | 634 (65.2%) |
| 6 to 18 Years | 819 (39.9%) | 1,327 (64.7%) |
| 19 to 25 Years | 271 (28.0%) | 633 (65.4%) |
| 25 to 34 Years | 298 (22.3%) | 889 (66.5%) |
| 35 to 44 Years | 336 (24.1%) | 985 (70.6%) |
| 45 to 54 Years | 224 (17.9%) | 954 (76.4%) |
| 55 to 64 Years | 375 (21.6%) | 1,379 (79.6%) |
| 65 to 74 Years | 1,312 (97.1%) | 946 (70.0%) |
| 75 Years and over | 1,148 (99.9%) | 902 (78.5%) |
| Total | 5,153 (42.2%) | 8,649 (70.9%) |
Disability Status by Sex by Age in Chippewa County
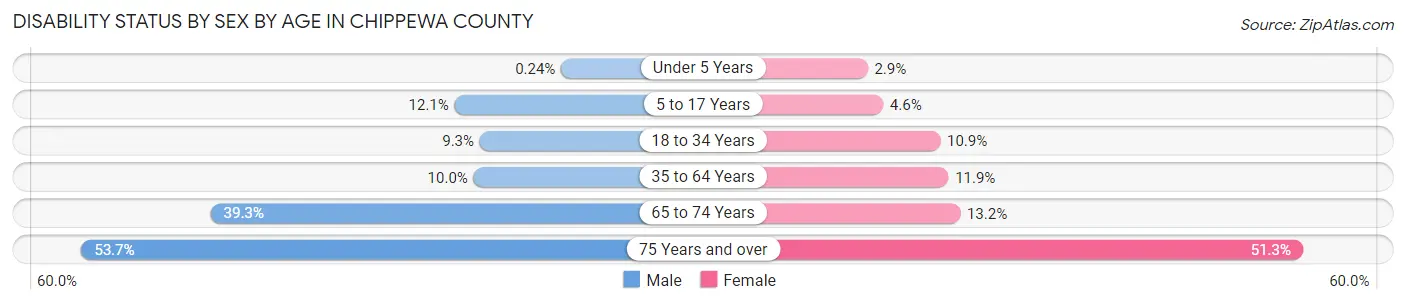
| Age Bracket | Male | Female |
| Under 5 Years | 1 (0.2%) | 11 (2.9%) |
| 5 to 17 Years | 131 (12.1%) | 47 (4.6%) |
| 18 to 34 Years | 120 (9.3%) | 124 (10.9%) |
| 35 to 64 Years | 223 (10.0%) | 254 (11.8%) |
| 65 to 74 Years | 262 (39.3%) | 90 (13.2%) |
| 75 Years and over | 255 (53.7%) | 346 (51.3%) |
Disability Class by Sex by Age in Chippewa County
Disability Class: Hearing Difficulty

| Age Bracket | Male | Female |
| Under 5 Years | 1 (0.2%) | 11 (2.9%) |
| 5 to 17 Years | 10 (0.9%) | 0 (0.0%) |
| 18 to 34 Years | 53 (4.1%) | 90 (7.9%) |
| 35 to 64 Years | 84 (3.8%) | 27 (1.3%) |
| 65 to 74 Years | 102 (15.3%) | 47 (6.9%) |
| 75 Years and over | 188 (39.6%) | 100 (14.8%) |
Disability Class: Vision Difficulty

| Age Bracket | Male | Female |
| Under 5 Years | 0 (0.0%) | 0 (0.0%) |
| 5 to 17 Years | 0 (0.0%) | 4 (0.4%) |
| 18 to 34 Years | 8 (0.6%) | 0 (0.0%) |
| 35 to 64 Years | 32 (1.4%) | 5 (0.2%) |
| 65 to 74 Years | 28 (4.2%) | 10 (1.5%) |
| 75 Years and over | 35 (7.4%) | 105 (15.6%) |
Disability Class: Cognitive Difficulty

| Age Bracket | Male | Female |
| 5 to 17 Years | 89 (8.2%) | 40 (3.9%) |
| 18 to 34 Years | 56 (4.3%) | 31 (2.7%) |
| 35 to 64 Years | 38 (1.7%) | 146 (6.8%) |
| 65 to 74 Years | 118 (17.7%) | 16 (2.3%) |
| 75 Years and over | 22 (4.6%) | 56 (8.3%) |
Disability Class: Ambulatory Difficulty
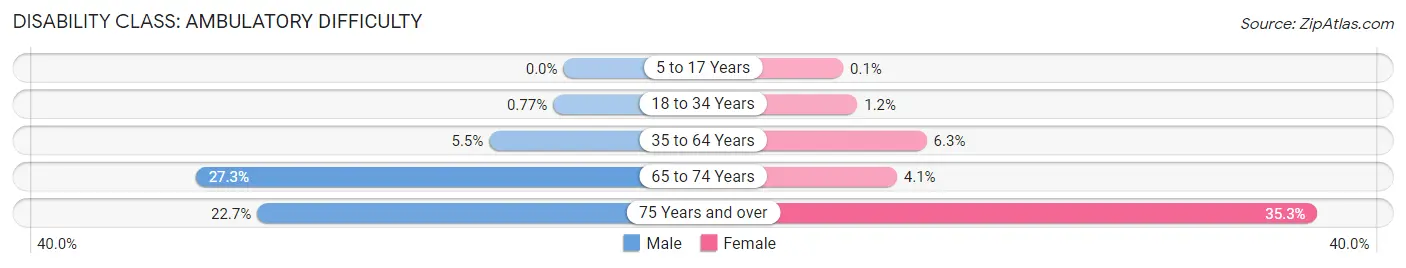
| Age Bracket | Male | Female |
| 5 to 17 Years | 0 (0.0%) | 1 (0.1%) |
| 18 to 34 Years | 10 (0.8%) | 13 (1.1%) |
| 35 to 64 Years | 123 (5.5%) | 135 (6.3%) |
| 65 to 74 Years | 182 (27.3%) | 28 (4.1%) |
| 75 Years and over | 108 (22.7%) | 238 (35.3%) |
Disability Class: Self-Care Difficulty
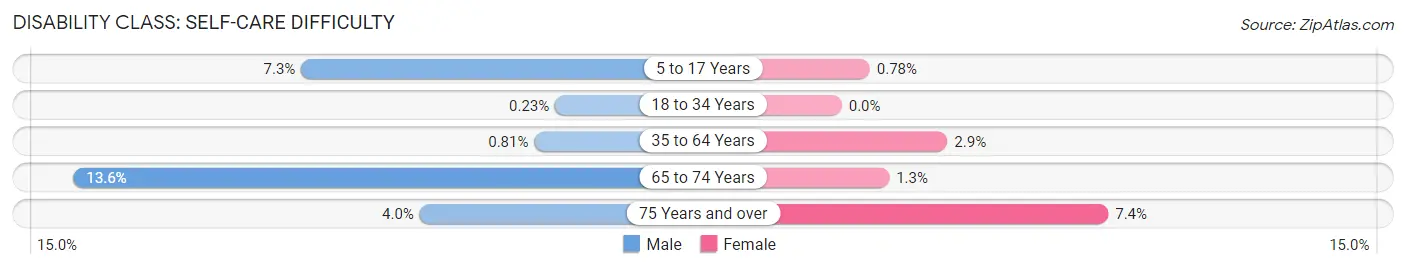
| Age Bracket | Male | Female |
| 5 to 17 Years | 79 (7.3%) | 8 (0.8%) |
| 18 to 34 Years | 3 (0.2%) | 0 (0.0%) |
| 35 to 64 Years | 18 (0.8%) | 63 (2.9%) |
| 65 to 74 Years | 91 (13.6%) | 9 (1.3%) |
| 75 Years and over | 19 (4.0%) | 50 (7.4%) |
Technology Access in Chippewa County
Computing Device Access in Chippewa County
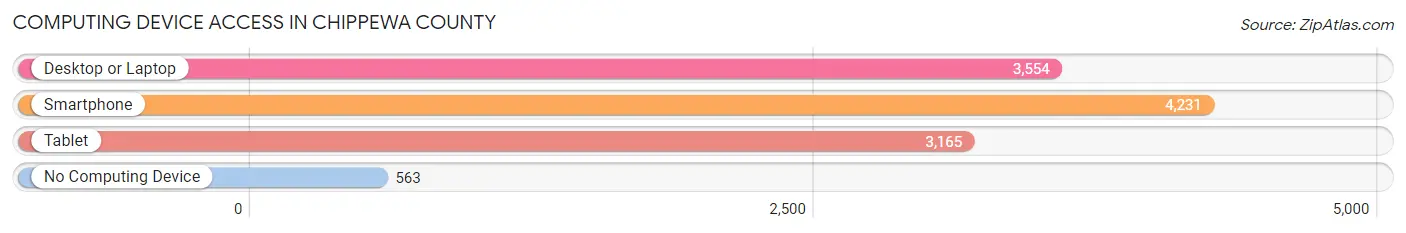
| Device Type | # Households | % Households |
| Desktop or Laptop | 3,554 | 68.3% |
| Smartphone | 4,231 | 81.3% |
| Tablet | 3,165 | 60.8% |
| No Computing Device | 563 | 10.8% |
| Total | 5,206 | 100.0% |
Internet Access in Chippewa County
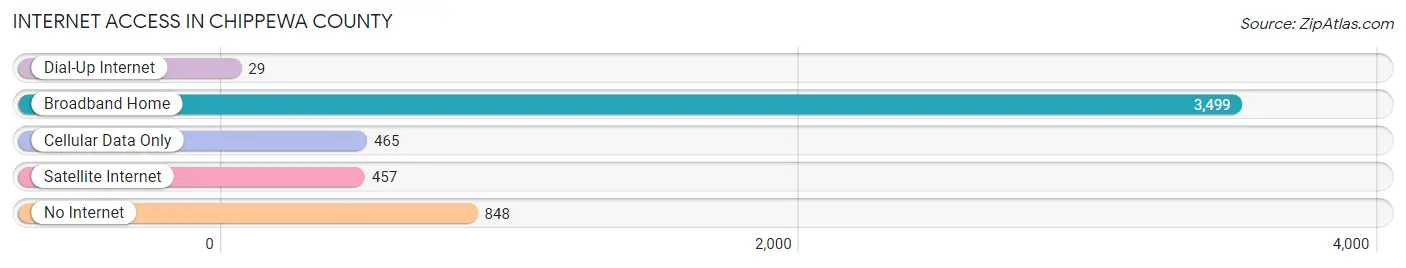
| Internet Type | # Households | % Households |
| Dial-Up Internet | 29 | 0.6% |
| Broadband Home | 3,499 | 67.2% |
| Cellular Data Only | 465 | 8.9% |
| Satellite Internet | 457 | 8.8% |
| No Internet | 848 | 16.3% |
| Total | 5,206 | 100.0% |
Chippewa County Summary
Chippewa County is located in the west-central part of Minnesota, and is bordered by Kandiyohi County to the north, Swift County to the east, Lac qui Parle County to the south, and Big Stone County to the west. The county seat is Montevideo, and the county has a total area of 576 square miles. As of the 2010 census, the population was 12,441.
History
Chippewa County was established in 1858 and was named after the Chippewa Indians who lived in the area. The county was originally part of the Dakota Territory, and was later part of the Minnesota Territory. The first settlers arrived in the area in the late 1850s, and the county was officially organized in 1858.
The county was initially populated by farmers, and the first crops grown in the area were wheat and oats. The county was also home to several sawmills, which provided lumber for the growing population.
In the late 19th century, the county experienced a population boom due to the arrival of immigrants from Norway, Sweden, and Germany. These immigrants brought with them their own culture and traditions, which still influence the county today.
Geography
Chippewa County is located in the west-central part of Minnesota, and is bordered by Kandiyohi County to the north, Swift County to the east, Lac qui Parle County to the south, and Big Stone County to the west. The county has a total area of 576 square miles, and is mostly rural.
The terrain of the county is mostly flat, with some rolling hills in the northern part of the county. The county is drained by the Chippewa River, which flows through the county from north to south. The county is also home to several small lakes, including Lake Minnewaska, Lake Lillian, and Lake Chippewa.
Economy
The economy of Chippewa County is largely based on agriculture. The county is home to several large farms, which produce a variety of crops, including corn, soybeans, wheat, and oats. The county is also home to several dairy farms, which produce milk and other dairy products.
In addition to agriculture, the county is also home to several manufacturing companies, which produce a variety of products, including furniture, plastics, and automotive parts. The county is also home to several retail stores, which provide goods and services to the local population.
Demographics
As of the 2010 census, the population of Chippewa County was 12,441. The population is largely white (96.3%), with small percentages of African Americans (1.2%), Native Americans (0.7%), Asians (0.4%), and other races (1.4%).
The median household income in the county is $45,945, and the median family income is $54,945. The per capita income in the county is $21,945. The unemployment rate in the county is 4.2%.
Conclusion
Chippewa County is located in the west-central part of Minnesota, and is bordered by Kandiyohi County to the north, Swift County to the east, Lac qui Parle County to the south, and Big Stone County to the west. The county has a total area of 576 square miles, and is mostly rural. The population of Chippewa County is largely white, and the median household income is $45,945. The economy of the county is largely based on agriculture, and the county is also home to several manufacturing companies and retail stores.
Common Questions
What is the Total Population of Chippewa County?
Total Population of Chippewa County is 12,466.
What is the Total Male Population of Chippewa County?
Total Male Population of Chippewa County is 6,290.
What is the Total Female Population of Chippewa County?
Total Female Population of Chippewa County is 6,176.
What is the Ratio of Males per 100 Females in Chippewa County?
There are 101.85 Males per 100 Females in Chippewa County.
What is the Ratio of Females per 100 Males in Chippewa County?
There are 98.19 Females per 100 Males in Chippewa County.
What is the Median Population Age in Chippewa County?
Median Population Age in Chippewa County is 41.8 Years.
What is the Average Family Size in Chippewa County
Average Family Size in Chippewa County is 3.1 People.
What is the Average Household Size in Chippewa County
Average Household Size in Chippewa County is 2.3 People.
What is Per Capita Income in Chippewa County?
Per Capita income in Chippewa County is $32,772.
What is the Median Family Income in Chippewa County?
Median Family Income in Chippewa County is $81,912.
What is the Median Household income in Chippewa County?
Median Household Income in Chippewa County is $62,112.
What is Income or Wage Gap in Chippewa County?
Income or Wage Gap in Chippewa County is 30.3%.
Women in Chippewa County earn 69.7 cents for every dollar earned by a man.
What is Family Income Deficit in Chippewa County?
Family Income Deficit in Chippewa County is $6,673.
Families that are below poverty line in Chippewa County earn $6,673 less on average than the poverty threshold level.
What is Inequality or Gini Index in Chippewa County?
Inequality or Gini Index in Chippewa County is 0.43.
How Large is the Labor Force in Chippewa County?
There are 6,385 People in the Labor Forcein in Chippewa County.
What is the Percentage of People in the Labor Force in Chippewa County?
63.8% of People are in the Labor Force in Chippewa County.
What is the Unemployment Rate in Chippewa County?
Unemployment Rate in Chippewa County is 5.2%.