Cass County, MN
Cass County Map

Cass County Overview
30,288
TOTAL POPULATION
15,590
MALE POPULATION
14,698
FEMALE POPULATION
106.07
MALES / 100 FEMALES
94.28
FEMALES / 100 MALES
49.0
MEDIAN AGE
2.9
AVG FAMILY SIZE
2.4
AVG HOUSEHOLD SIZE
$34,505
PER CAPITA INCOME
$76,195
AVG FAMILY INCOME
$61,970
AVG HOUSEHOLD INCOME
29.2%
WAGE / INCOME GAP [ % ]
70.8¢/ $1
WAGE / INCOME GAP [ $ ]
$10,396
FAMILY INCOME DEFICIT
0.43
INEQUALITY / GINI INDEX
13,887
LABOR FORCE [ PEOPLE ]
56.1%
PERCENT IN LABOR FORCE
6.4%
UNEMPLOYMENT RATE
Cass County Area Codes
Race in Cass County
The most populous races in Cass County are White / Caucasian (24,693 | 81.5%), Native / Alaskan (2,846 | 9.4%), and Two or more Races (2,201 | 7.3%).

| Race | # Population | % Population |
| Asian | 158 | 0.5% |
| Black / African American | 144 | 0.5% |
| Hawaiian / Pacific | 2 | 0.0% |
| Hispanic or Latino | 742 | 2.5% |
| Native / Alaskan | 2,846 | 9.4% |
| White / Caucasian | 24,693 | 81.5% |
| Two or more Races | 2,201 | 7.3% |
| Some other Race | 244 | 0.8% |
| Total | 30,288 | 100.0% |
Ancestry in Cass County
The most populous ancestries reported in Cass County are German (8,770 | 29.0%), Norwegian (3,953 | 13.1%), Chippewa (3,047 | 10.1%), Irish (2,462 | 8.1%), and Swedish (2,228 | 7.4%), together accounting for 67.6% of all Cass County residents.

| Ancestry | # Population | % Population |
| African | 31 | 0.1% |
| American | 1,178 | 3.9% |
| Arab | 32 | 0.1% |
| Austrian | 32 | 0.1% |
| Bangladeshi | 53 | 0.2% |
| Belgian | 30 | 0.1% |
| Bhutanese | 38 | 0.1% |
| Blackfeet | 8 | 0.0% |
| Brazilian | 2 | 0.0% |
| British | 63 | 0.2% |
| Burmese | 39 | 0.1% |
| Cambodian | 4 | 0.0% |
| Canadian | 21 | 0.1% |
| Celtic | 11 | 0.0% |
| Central American | 11 | 0.0% |
| Central American Indian | 4 | 0.0% |
| Cherokee | 68 | 0.2% |
| Chickasaw | 1 | 0.0% |
| Chilean | 4 | 0.0% |
| Chippewa | 3,047 | 10.1% |
| Choctaw | 8 | 0.0% |
| Colombian | 36 | 0.1% |
| Colville | 13 | 0.0% |
| Cree | 10 | 0.0% |
| Croatian | 35 | 0.1% |
| Cuban | 31 | 0.1% |
| Czech | 334 | 1.1% |
| Czechoslovakian | 38 | 0.1% |
| Danish | 363 | 1.2% |
| Dutch | 465 | 1.5% |
| Eastern European | 42 | 0.1% |
| Ecuadorian | 21 | 0.1% |
| English | 2,197 | 7.2% |
| Ethiopian | 36 | 0.1% |
| European | 327 | 1.1% |
| Finnish | 358 | 1.2% |
| French | 720 | 2.4% |
| French American Indian | 15 | 0.1% |
| French Canadian | 308 | 1.0% |
| German | 8,770 | 29.0% |
| German Russian | 9 | 0.0% |
| Greek | 36 | 0.1% |
| Guatemalan | 4 | 0.0% |
| Hungarian | 79 | 0.3% |
| Icelander | 2 | 0.0% |
| Indian (Asian) | 40 | 0.1% |
| Irish | 2,462 | 8.1% |
| Italian | 436 | 1.4% |
| Kenyan | 7 | 0.0% |
| Korean | 114 | 0.4% |
| Lebanese | 16 | 0.1% |
| Lithuanian | 32 | 0.1% |
| Luxembourger | 10 | 0.0% |
| Macedonian | 2 | 0.0% |
| Mexican | 586 | 1.9% |
| Mexican American Indian | 7 | 0.0% |
| Native Hawaiian | 21 | 0.1% |
| Navajo | 2 | 0.0% |
| Northern European | 72 | 0.2% |
| Norwegian | 3,953 | 13.1% |
| Osage | 8 | 0.0% |
| Pakistani | 11 | 0.0% |
| Panamanian | 7 | 0.0% |
| Pennsylvania German | 10 | 0.0% |
| Polish | 1,156 | 3.8% |
| Portuguese | 11 | 0.0% |
| Potawatomi | 2 | 0.0% |
| Pueblo | 2 | 0.0% |
| Puerto Rican | 17 | 0.1% |
| Romanian | 29 | 0.1% |
| Russian | 107 | 0.4% |
| Samoan | 2 | 0.0% |
| Scandinavian | 472 | 1.6% |
| Scotch-Irish | 163 | 0.5% |
| Scottish | 363 | 1.2% |
| Seminole | 7 | 0.0% |
| Serbian | 26 | 0.1% |
| Sioux | 96 | 0.3% |
| Slavic | 5 | 0.0% |
| Slovak | 31 | 0.1% |
| Slovene | 30 | 0.1% |
| South American | 67 | 0.2% |
| Spaniard | 2 | 0.0% |
| Spanish | 28 | 0.1% |
| Sri Lankan | 3 | 0.0% |
| Subsaharan African | 74 | 0.2% |
| Swedish | 2,228 | 7.4% |
| Swiss | 128 | 0.4% |
| Syrian | 12 | 0.0% |
| Thai | 11 | 0.0% |
| Tlingit-Haida | 1 | 0.0% |
| Tongan | 2 | 0.0% |
| Turkish | 18 | 0.1% |
| Ukrainian | 45 | 0.2% |
| Uruguayan | 6 | 0.0% |
| Vietnamese | 6 | 0.0% |
| Welsh | 119 | 0.4% |
| Yugoslavian | 8 | 0.0% |
| Yup'ik | 3 | 0.0% | View All 99 Rows |
Immigrants in Cass County
The most numerous immigrant groups reported in Cass County came from Europe (148 | 0.5%), Asia (107 | 0.4%), Canada (74 | 0.2%), Western Europe (74 | 0.2%), and Latin America (69 | 0.2%), together accounting for 1.5% of all Cass County residents.

| Immigration Origin | # Population | % Population |
| Africa | 12 | 0.0% |
| Asia | 107 | 0.4% |
| Austria | 3 | 0.0% |
| Bosnia and Herzegovina | 1 | 0.0% |
| Brazil | 2 | 0.0% |
| Canada | 74 | 0.2% |
| Caribbean | 5 | 0.0% |
| Central America | 43 | 0.1% |
| China | 10 | 0.0% |
| Colombia | 5 | 0.0% |
| Eastern Africa | 12 | 0.0% |
| Eastern Asia | 18 | 0.1% |
| Eastern Europe | 20 | 0.1% |
| England | 45 | 0.2% |
| Ethiopia | 1 | 0.0% |
| Europe | 148 | 0.5% |
| France | 3 | 0.0% |
| Germany | 33 | 0.1% |
| Guatemala | 4 | 0.0% |
| Guyana | 8 | 0.0% |
| Iraq | 6 | 0.0% |
| Jamaica | 5 | 0.0% |
| Japan | 1 | 0.0% |
| Kenya | 7 | 0.0% |
| Korea | 7 | 0.0% |
| Laos | 5 | 0.0% |
| Latin America | 69 | 0.2% |
| Mexico | 32 | 0.1% |
| Moldova | 5 | 0.0% |
| Netherlands | 28 | 0.1% |
| Northern Europe | 54 | 0.2% |
| Pakistan | 2 | 0.0% |
| Panama | 7 | 0.0% |
| Philippines | 54 | 0.2% |
| Poland | 3 | 0.0% |
| Romania | 8 | 0.0% |
| Russia | 3 | 0.0% |
| Scotland | 4 | 0.0% |
| South America | 21 | 0.1% |
| South Central Asia | 2 | 0.0% |
| South Eastern Asia | 69 | 0.2% |
| Sweden | 5 | 0.0% |
| Switzerland | 7 | 0.0% |
| Thailand | 10 | 0.0% |
| Turkey | 12 | 0.0% |
| Uganda | 4 | 0.0% |
| Uruguay | 6 | 0.0% |
| Western Asia | 18 | 0.1% |
| Western Europe | 74 | 0.2% | View All 49 Rows |
Sex and Age in Cass County
Sex and Age in Cass County
The most populous age groups in Cass County are 65 to 69 Years (1,441 | 9.2%) for men and 60 to 64 Years (1,393 | 9.5%) for women.

| Age Bracket | Male | Female |
| Under 5 Years | 832 (5.3%) | 656 (4.5%) |
| 5 to 9 Years | 945 (6.1%) | 763 (5.2%) |
| 10 to 14 Years | 964 (6.2%) | 986 (6.7%) |
| 15 to 19 Years | 884 (5.7%) | 773 (5.3%) |
| 20 to 24 Years | 663 (4.3%) | 611 (4.2%) |
| 25 to 29 Years | 744 (4.8%) | 700 (4.8%) |
| 30 to 34 Years | 657 (4.2%) | 712 (4.8%) |
| 35 to 39 Years | 755 (4.8%) | 724 (4.9%) |
| 40 to 44 Years | 809 (5.2%) | 700 (4.8%) |
| 45 to 49 Years | 777 (5.0%) | 724 (4.9%) |
| 50 to 54 Years | 929 (6.0%) | 849 (5.8%) |
| 55 to 59 Years | 1,231 (7.9%) | 1,147 (7.8%) |
| 60 to 64 Years | 1,357 (8.7%) | 1,393 (9.5%) |
| 65 to 69 Years | 1,441 (9.2%) | 1,264 (8.6%) |
| 70 to 74 Years | 1,086 (7.0%) | 1,051 (7.1%) |
| 75 to 79 Years | 773 (5.0%) | 795 (5.4%) |
| 80 to 84 Years | 490 (3.1%) | 475 (3.2%) |
| 85 Years and over | 253 (1.6%) | 375 (2.5%) |
| Total | 15,590 (100.0%) | 14,698 (100.0%) |
Families and Households in Cass County
Median Family Size in Cass County
The median family size in Cass County is 2.91 persons per family, with single female/mother families (1,002 | 12.3%) accounting for the largest median family size of 3.47 persons per family. On the other hand, married-couple families (6,462 | 79.6%) represent the smallest median family size with 2.80 persons per family.

| Family Type | # Families | Family Size |
| Married-Couple | 6,462 (79.6%) | 2.80 |
| Single Male/Father | 658 (8.1%) | 3.18 |
| Single Female/Mother | 1,002 (12.3%) | 3.47 |
| Total Families | 8,122 (100.0%) | 2.91 |
Median Household Size in Cass County
The median household size in Cass County is 2.39 persons per household, with single female/mother households (1,002 | 8.0%) accounting for the largest median household size of 3.95 persons per household. non-family households (4,360 | 34.9%) represent the smallest median household size with 1.19 persons per household.

| Household Type | # Households | Household Size |
| Married-Couple | 6,462 (51.8%) | 2.82 |
| Single Male/Father | 658 (5.3%) | 3.74 |
| Single Female/Mother | 1,002 (8.0%) | 3.95 |
| Non-family | 4,360 (34.9%) | 1.19 |
| Total Households | 12,482 (100.0%) | 2.39 |
Household Size by Marriage Status in Cass County
Out of a total of 12,482 households in Cass County, 8,122 (65.1%) are family households, while 4,360 (34.9%) are nonfamily households. The most numerous type of family households are 2-person households, comprising 4,751, and the most common type of nonfamily households are 1-person households, comprising 3,579.

| Household Size | Family Households | Nonfamily Households |
| 1-Person Households | - | 3,579 (28.7%) |
| 2-Person Households | 4,751 (38.1%) | 717 (5.7%) |
| 3-Person Households | 1,208 (9.7%) | 48 (0.4%) |
| 4-Person Households | 1,021 (8.2%) | 9 (0.1%) |
| 5-Person Households | 673 (5.4%) | 7 (0.1%) |
| 6-Person Households | 271 (2.2%) | 0 (0.0%) |
| 7+ Person Households | 198 (1.6%) | 0 (0.0%) |
| Total | 8,122 (65.1%) | 4,360 (34.9%) |
Female Fertility in Cass County
Fertility by Age in Cass County
Average fertility rate in Cass County is 80.0 births per 1,000 women. Women in the age bracket of 20 to 34 years have the highest fertility rate with 176.0 births per 1,000 women. Women in the age bracket of 20 to 34 years acount for 86.7% of all women with births.

| Age Bracket | Women with Births | Births / 1,000 Women |
| 15 to 19 years | 2 (0.5%) | 3.0 |
| 20 to 34 years | 357 (86.7%) | 176.0 |
| 35 to 50 years | 53 (12.9%) | 23.0 |
| Total | 412 (100.0%) | 80.0 |
Fertility by Age by Marriage Status in Cass County
53.9% of women with births (412) in Cass County are married. The highest percentage of unmarried women with births falls into 15 to 19 years age bracket with 100.0% of them unmarried at the time of birth, while the lowest percentage of unmarried women with births belong to 35 to 50 years age bracket with 17.0% of them unmarried.

| Age Bracket | Married | Unmarried |
| 15 to 19 years | 0 (0.0%) | 2 (100.0%) |
| 20 to 34 years | 178 (49.9%) | 179 (50.1%) |
| 35 to 50 years | 44 (83.0%) | 9 (17.0%) |
| Total | 222 (53.9%) | 190 (46.1%) |
Fertility by Education in Cass County
Average fertility rate in Cass County is 80.0 births per 1,000 women. Women with the education attainment of bachelor's degree have the highest fertility rate of 95.0 births per 1,000 women, while women with the education attainment of less than high school have the lowest fertility at 56.0 births per 1,000 women. Women with the education attainment of college or associate's degree represent 37.9% of all women with births.

| Educational Attainment | Women with Births | Births / 1,000 Women |
| Less than High School | 49 (11.9%) | 56.0 |
| High School Diploma | 101 (24.5%) | 87.0 |
| College or Associate's Degree | 156 (37.9%) | 83.0 |
| Bachelor's Degree | 84 (20.4%) | 95.0 |
| Graduate Degree | 22 (5.3%) | 68.0 |
| Total | 412 (100.0%) | 80.0 |
Fertility by Education by Marriage Status in Cass County
46.1% of women with births in Cass County are unmarried. Women with the educational attainment of graduate degree are most likely to be married with 100.0% of them married at childbirth, while women with the educational attainment of high school diploma are least likely to be married with 87.1% of them unmarried at childbirth.

| Educational Attainment | Married | Unmarried |
| Less than High School | 12 (24.5%) | 37 (75.5%) |
| High School Diploma | 13 (12.9%) | 88 (87.1%) |
| College or Associate's Degree | 122 (78.2%) | 34 (21.8%) |
| Bachelor's Degree | 53 (63.1%) | 31 (36.9%) |
| Graduate Degree | 22 (100.0%) | 0 (0.0%) |
| Total | 222 (53.9%) | 190 (46.1%) |
Income in Cass County
Income Overview in Cass County
Per Capita Income in Cass County is $34,505, while median incomes of families and households are $76,195 and $61,970 respectively.
| Characteristic | Number | Measure |
| Per Capita Income | 30,288 | $34,505 |
| Median Family Income | 8,122 | $76,195 |
| Mean Family Income | 8,122 | $95,948 |
| Median Household Income | 12,482 | $61,970 |
| Mean Household Income | 12,482 | $81,800 |
| Income Deficit | 8,122 | $10,396 |
| Wage / Income Gap (%) | 30,288 | 29.17% |
| Wage / Income Gap ($) | 30,288 | 70.83¢ per $1 |
| Gini / Inequality Index | 30,288 | 0.43 |
Earnings by Sex in Cass County
Average Earnings in Cass County are $34,246, $40,083 for men and $28,389 for women, a difference of 29.2%.

| Sex | Number | Average Earnings |
| Male | 7,968 (53.1%) | $40,083 |
| Female | 7,043 (46.9%) | $28,389 |
| Total | 15,011 (100.0%) | $34,246 |
Earnings by Sex by Income Bracket in Cass County
The most common earnings brackets in Cass County are $100,000+ for men (913 | 11.5%) and $2,499 or less for women (568 | 8.1%).

| Income | Male | Female |
| $2,499 or less | 427 (5.4%) | 568 (8.1%) |
| $2,500 to $4,999 | 336 (4.2%) | 380 (5.4%) |
| $5,000 to $7,499 | 306 (3.8%) | 363 (5.1%) |
| $7,500 to $9,999 | 221 (2.8%) | 245 (3.5%) |
| $10,000 to $12,499 | 255 (3.2%) | 283 (4.0%) |
| $12,500 to $14,999 | 212 (2.7%) | 300 (4.3%) |
| $15,000 to $17,499 | 176 (2.2%) | 278 (4.0%) |
| $17,500 to $19,999 | 288 (3.6%) | 180 (2.6%) |
| $20,000 to $22,499 | 178 (2.2%) | 305 (4.3%) |
| $22,500 to $24,999 | 199 (2.5%) | 315 (4.5%) |
| $25,000 to $29,999 | 366 (4.6%) | 465 (6.6%) |
| $30,000 to $34,999 | 538 (6.8%) | 516 (7.3%) |
| $35,000 to $39,999 | 472 (5.9%) | 439 (6.2%) |
| $40,000 to $44,999 | 505 (6.3%) | 404 (5.7%) |
| $45,000 to $49,999 | 401 (5.0%) | 342 (4.9%) |
| $50,000 to $54,999 | 340 (4.3%) | 282 (4.0%) |
| $55,000 to $64,999 | 677 (8.5%) | 465 (6.6%) |
| $65,000 to $74,999 | 433 (5.4%) | 283 (4.0%) |
| $75,000 to $99,999 | 725 (9.1%) | 391 (5.6%) |
| $100,000+ | 913 (11.5%) | 239 (3.4%) |
| Total | 7,968 (100.0%) | 7,043 (100.0%) |
Earnings by Sex by Educational Attainment in Cass County
Average earnings in Cass County are $44,329 for men and $32,196 for women, a difference of 27.4%. Men with an educational attainment of graduate degree enjoy the highest average annual earnings of $76,250, while those with less than high school education earn the least with $33,214. Women with an educational attainment of graduate degree earn the most with the average annual earnings of $53,750, while those with less than high school education have the smallest earnings of $20,000.

| Educational Attainment | Male Income | Female Income |
| Less than High School | $33,214 | $20,000 |
| High School Diploma | $39,650 | $25,712 |
| College or Associate's Degree | $44,479 | $30,053 |
| Bachelor's Degree | $59,929 | $41,968 |
| Graduate Degree | $76,250 | $53,750 |
| Total | $44,329 | $32,196 |
Family Income in Cass County
Family Income Brackets in Cass County
According to the Cass County family income data, there are 1,681 families falling into the $50,000 to $74,999 income range, which is the most common income bracket and makes up 20.7% of all families. Conversely, the $10,000 to $14,999 income bracket is the least frequent group with only 130 families (1.6%) belonging to this category.
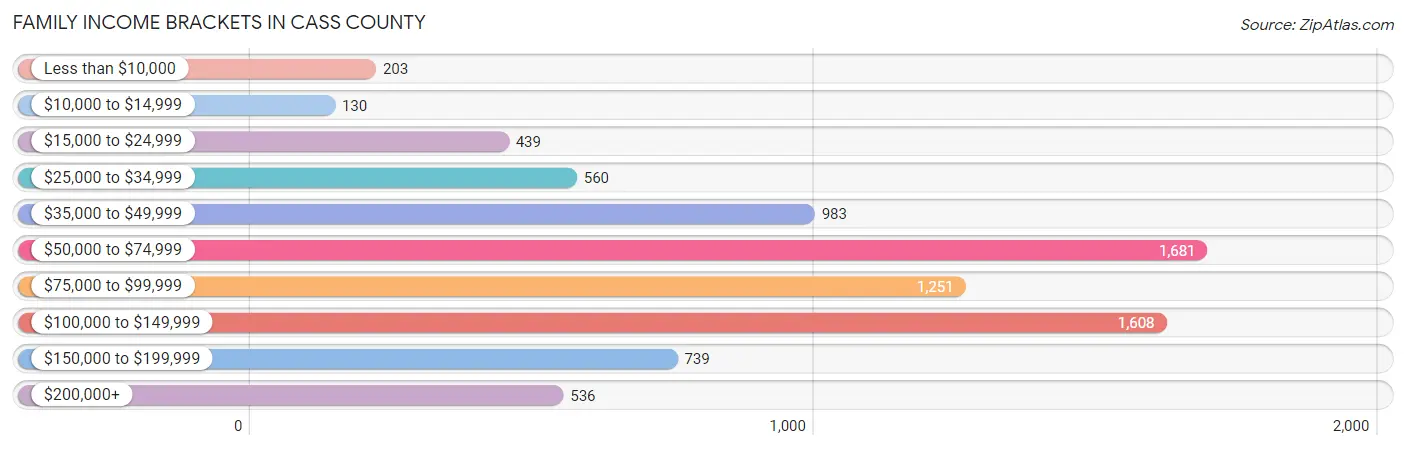
| Income Bracket | # Families | % Families |
| Less than $10,000 | 203 | 2.5% |
| $10,000 to $14,999 | 130 | 1.6% |
| $15,000 to $24,999 | 439 | 5.4% |
| $25,000 to $34,999 | 560 | 6.9% |
| $35,000 to $49,999 | 983 | 12.1% |
| $50,000 to $74,999 | 1,681 | 20.7% |
| $75,000 to $99,999 | 1,251 | 15.4% |
| $100,000 to $149,999 | 1,608 | 19.8% |
| $150,000 to $199,999 | 739 | 9.1% |
| $200,000+ | 536 | 6.6% |
Family Income by Famaliy Size in Cass County
6-person families (189 | 2.3%) account for the highest median family income in Cass County with $97,614 per family, while 2-person families (4,998 | 61.5%) have the highest median income of $35,908 per family member.
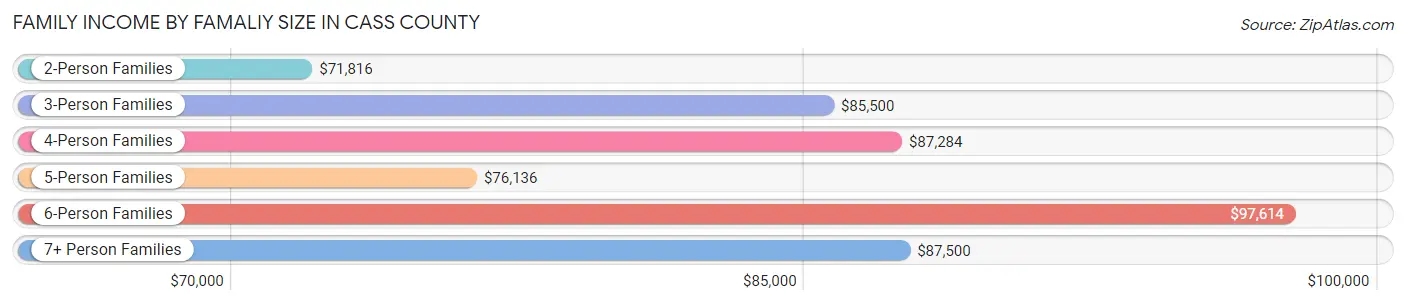
| Income Bracket | # Families | Median Income |
| 2-Person Families | 4,998 (61.5%) | $71,816 |
| 3-Person Families | 1,156 (14.2%) | $85,500 |
| 4-Person Families | 1,047 (12.9%) | $87,284 |
| 5-Person Families | 588 (7.2%) | $76,136 |
| 6-Person Families | 189 (2.3%) | $97,614 |
| 7+ Person Families | 144 (1.8%) | $87,500 |
| Total | 8,122 (100.0%) | $76,195 |
Family Income by Number of Earners in Cass County
The median family income in Cass County is $76,195, with families comprising 3+ earners (631) having the highest median family income of $121,375, while families with 1 earner (2,522) have the lowest median family income of $57,681, accounting for 7.8% and 31.0% of families, respectively.

| Number of Earners | # Families | Median Income |
| No Earners | 1,963 (24.2%) | $58,708 |
| 1 Earner | 2,522 (31.0%) | $57,681 |
| 2 Earners | 3,006 (37.0%) | $98,631 |
| 3+ Earners | 631 (7.8%) | $121,375 |
| Total | 8,122 (100.0%) | $76,195 |
Household Income in Cass County
Household Income Brackets in Cass County
With 2,571 households falling in the category, the $50,000 to $74,999 income range is the most frequent in Cass County, accounting for 20.6% of all households. In contrast, only 499 households (4.0%) fall into the $10,000 to $14,999 income bracket, making it the least populous group.

| Income Bracket | # Households | % Households |
| Less than $10,000 | 587 | 4.7% |
| $10,000 to $14,999 | 499 | 4.0% |
| $15,000 to $24,999 | 986 | 7.9% |
| $25,000 to $34,999 | 1,061 | 8.5% |
| $35,000 to $49,999 | 1,660 | 13.3% |
| $50,000 to $74,999 | 2,571 | 20.6% |
| $75,000 to $99,999 | 1,623 | 13.0% |
| $100,000 to $149,999 | 2,035 | 16.3% |
| $150,000 to $199,999 | 861 | 6.9% |
| $200,000+ | 599 | 4.8% |
Household Income by Householder Age in Cass County
The median household income in Cass County is $61,970, with the highest median household income of $72,440 found in the 45 to 64 years age bracket for the primary householder. A total of 4,658 households (37.3%) fall into this category. Meanwhile, the 15 to 24 years age bracket for the primary householder has the lowest median household income of $43,359, with 302 households (2.4%) in this group.

| Income Bracket | # Households | Median Income |
| 15 to 24 Years | 302 (2.4%) | $43,359 |
| 25 to 44 Years | 2,589 (20.7%) | $69,266 |
| 45 to 64 Years | 4,658 (37.3%) | $72,440 |
| 65+ Years | 4,933 (39.5%) | $54,116 |
| Total | 12,482 (100.0%) | $61,970 |
Poverty in Cass County
Income Below Poverty by Sex and Age in Cass County
With 11.4% poverty level for males and 13.2% for females among the residents of Cass County, under 5 year old males and 5 year old females are the most vulnerable to poverty, with 245 males (30.4%) and 67 females (47.5%) in their respective age groups living below the poverty level.

| Age Bracket | Male | Female |
| Under 5 Years | 245 (30.4%) | 156 (24.0%) |
| 5 Years | 36 (21.8%) | 67 (47.5%) |
| 6 to 11 Years | 209 (18.6%) | 215 (23.6%) |
| 12 to 14 Years | 53 (9.4%) | 99 (15.5%) |
| 15 Years | 17 (8.5%) | 19 (10.3%) |
| 16 and 17 Years | 41 (10.4%) | 29 (8.9%) |
| 18 to 24 Years | 64 (6.7%) | 176 (20.8%) |
| 25 to 34 Years | 133 (9.5%) | 267 (18.9%) |
| 35 to 44 Years | 173 (11.1%) | 103 (7.2%) |
| 45 to 54 Years | 122 (7.2%) | 138 (8.8%) |
| 55 to 64 Years | 319 (12.4%) | 274 (10.9%) |
| 65 to 74 Years | 228 (9.1%) | 182 (7.9%) |
| 75 Years and over | 109 (7.6%) | 179 (11.5%) |
| Total | 1,749 (11.4%) | 1,904 (13.2%) |
Income Above Poverty by Sex and Age in Cass County
According to the poverty statistics in Cass County, males aged 18 to 24 years and females aged 35 to 44 years are the age groups that are most secure financially, with 93.3% of males and 92.8% of females in these age groups living above the poverty line.

| Age Bracket | Male | Female |
| Under 5 Years | 562 (69.6%) | 495 (76.0%) |
| 5 Years | 129 (78.2%) | 74 (52.5%) |
| 6 to 11 Years | 914 (81.4%) | 697 (76.4%) |
| 12 to 14 Years | 510 (90.6%) | 538 (84.5%) |
| 15 Years | 183 (91.5%) | 166 (89.7%) |
| 16 and 17 Years | 354 (89.6%) | 296 (91.1%) |
| 18 to 24 Years | 886 (93.3%) | 668 (79.1%) |
| 25 to 34 Years | 1,263 (90.5%) | 1,145 (81.1%) |
| 35 to 44 Years | 1,389 (88.9%) | 1,321 (92.8%) |
| 45 to 54 Years | 1,582 (92.8%) | 1,435 (91.2%) |
| 55 to 64 Years | 2,253 (87.6%) | 2,250 (89.1%) |
| 65 to 74 Years | 2,277 (90.9%) | 2,119 (92.1%) |
| 75 Years and over | 1,333 (92.4%) | 1,375 (88.5%) |
| Total | 13,635 (88.6%) | 12,579 (86.9%) |
Income Below Poverty Among Married-Couple Families in Cass County
The poverty statistics for married-couple families in Cass County show that 3.9% or 250 of the total 6,462 families live below the poverty line. Families with 5 or more children have the highest poverty rate of 11.9%, comprising of 8 families. On the other hand, families with 1 or 2 children have the lowest poverty rate of 2.0%, which includes 24 families.

| Children | Above Poverty | Below Poverty |
| No Children | 4,551 (96.0%) | 190 (4.0%) |
| 1 or 2 Children | 1,194 (98.0%) | 24 (2.0%) |
| 3 or 4 Children | 408 (93.6%) | 28 (6.4%) |
| 5 or more Children | 59 (88.1%) | 8 (11.9%) |
| Total | 6,212 (96.1%) | 250 (3.9%) |
Income Below Poverty Among Single-Parent Households in Cass County
According to the poverty data in Cass County, 18.4% or 121 single-father households and 26.7% or 267 single-mother households are living below the poverty line. Among single-father households, those with 5 or more children have the highest poverty rate, with 13 households (46.4%) experiencing poverty. Likewise, among single-mother households, those with 5 or more children have the highest poverty rate, with 36 households (85.7%) falling below the poverty line.

| Children | Single Father | Single Mother |
| No Children | 27 (15.0%) | 13 (4.5%) |
| 1 or 2 Children | 33 (9.9%) | 108 (24.8%) |
| 3 or 4 Children | 48 (41.0%) | 110 (46.6%) |
| 5 or more Children | 13 (46.4%) | 36 (85.7%) |
| Total | 121 (18.4%) | 267 (26.7%) |
Income Below Poverty Among Married-Couple vs Single-Parent Households in Cass County
The poverty data for Cass County shows that 250 of the married-couple family households (3.9%) and 388 of the single-parent households (23.4%) are living below the poverty level. Within the married-couple family households, those with 5 or more children have the highest poverty rate, with 8 households (11.9%) falling below the poverty line. Among the single-parent households, those with 5 or more children have the highest poverty rate, with 49 household (70.0%) living below poverty.

| Children | Married-Couple Families | Single-Parent Households |
| No Children | 190 (4.0%) | 40 (8.5%) |
| 1 or 2 Children | 24 (2.0%) | 141 (18.4%) |
| 3 or 4 Children | 28 (6.4%) | 158 (44.8%) |
| 5 or more Children | 8 (11.9%) | 49 (70.0%) |
| Total | 250 (3.9%) | 388 (23.4%) |
Employment Characteristics in Cass County
Employment by Class of Employer in Cass County
Among the 12,703 employed individuals in Cass County, private company employees (7,612 | 59.9%), local government employees (1,283 | 10.1%), and not-for-profit organizations (1,153 | 9.1%) make up the most common classes of employment.

| Employer Class | # Employees | % Employees |
| Private Company Employees | 7,612 | 59.9% |
| Self-Employed (Incorporated) | 751 | 5.9% |
| Self-Employed (Not Incorporated) | 1,088 | 8.6% |
| Not-for-profit Organizations | 1,153 | 9.1% |
| Local Government Employees | 1,283 | 10.1% |
| State Government Employees | 497 | 3.9% |
| Federal Government Employees | 296 | 2.3% |
| Unpaid Family Workers | 23 | 0.2% |
| Total | 12,703 | 100.0% |
Employment Status by Age in Cass County
According to the labor force statistics for Cass County, out of the total population over 16 years of age (24,754), 56.1% or 13,887 individuals are in the labor force, with 6.4% or 889 of them unemployed. The age group with the highest labor force participation rate is 35 to 44 years, with 87.9% or 2,626 individuals in the labor force. Within the labor force, the 16 to 19 years age range has the highest percentage of unemployed individuals, with 13.9% or 95 of them being unemployed.

| Age Bracket | In Labor Force | Unemployed |
| 16 to 19 Years | 684 (53.9%) | 95 (13.9%) |
| 20 to 24 Years | 1,091 (85.6%) | 95 (8.7%) |
| 25 to 29 Years | 1,256 (87.0%) | 118 (9.4%) |
| 30 to 34 Years | 1,194 (87.2%) | 75 (6.3%) |
| 35 to 44 Years | 2,626 (87.9%) | 186 (7.1%) |
| 45 to 54 Years | 2,653 (80.9%) | 117 (4.4%) |
| 55 to 59 Years | 1,660 (69.8%) | 68 (4.1%) |
| 60 to 64 Years | 1,471 (53.5%) | 69 (4.7%) |
| 65 to 74 Years | 1,051 (21.7%) | 53 (5.0%) |
| 75 Years and over | 205 (6.5%) | 9 (4.4%) |
| Total | 13,887 (56.1%) | 889 (6.4%) |
Employment Status by Educational Attainment in Cass County
According to labor force statistics for Cass County, 76.4% of individuals (10,855) out of the total population between 25 and 64 years of age (14,208) are in the labor force, with 5.8% or 630 of them being unemployed. The group with the highest labor force participation rate are those with the educational attainment of bachelor's degree or higher, with 82.2% or 2,773 individuals in the labor force. Within the labor force, individuals with less than high school education have the highest percentage of unemployment, with 9.5% or 57 of them being unemployed.

| Educational Attainment | In Labor Force | Unemployed |
| Less than High School | 602 (65.6%) | 87 (9.5%) |
| High School Diploma | 3,077 (72.4%) | 344 (8.1%) |
| College / Associate Degree | 4,409 (77.8%) | 306 (5.4%) |
| Bachelor's Degree or higher | 2,773 (82.2%) | 105 (3.1%) |
| Total | 10,855 (76.4%) | 824 (5.8%) |
Employment Occupations by Sex in Cass County
Management, Business, Science and Arts Occupations
The most common Management, Business, Science and Arts occupations in Cass County are Management (1,410 | 10.9%), Community & Social Service (1,309 | 10.1%), Education Instruction & Library (777 | 6.0%), Health Diagnosing & Treating (570 | 4.4%), and Business & Financial (465 | 3.6%).

Management, Business, Science and Arts Occupations by Sex
Within the Management, Business, Science and Arts occupations in Cass County, the most male-oriented occupations are Architecture & Engineering (93.9%), Computers, Engineering & Science (81.9%), and Life, Physical & Social Science (72.1%), while the most female-oriented occupations are Education Instruction & Library (82.0%), Health Diagnosing & Treating (80.9%), and Health Technologists (78.4%).

| Occupation | Male | Female |
| Management | 865 (61.4%) | 545 (38.7%) |
| Business & Financial | 176 (37.9%) | 289 (62.2%) |
| Computers, Engineering & Science | 281 (81.9%) | 62 (18.1%) |
| Computers & Mathematics | 95 (70.4%) | 40 (29.6%) |
| Architecture & Engineering | 155 (93.9%) | 10 (6.1%) |
| Life, Physical & Social Science | 31 (72.1%) | 12 (27.9%) |
| Community & Social Service | 372 (28.4%) | 937 (71.6%) |
| Education, Arts & Media | 119 (38.1%) | 193 (61.9%) |
| Legal Services & Support | 38 (52.0%) | 35 (47.9%) |
| Education Instruction & Library | 140 (18.0%) | 637 (82.0%) |
| Arts, Media & Entertainment | 75 (51.0%) | 72 (49.0%) |
| Health Diagnosing & Treating | 109 (19.1%) | 461 (80.9%) |
| Health Technologists | 80 (21.6%) | 291 (78.4%) |
| Total (Category) | 1,803 (44.0%) | 2,294 (56.0%) |
| Total (Overall) | 6,767 (52.1%) | 6,220 (47.9%) |
Services Occupations
The most common Services occupations in Cass County are Food Preparation & Serving (769 | 5.9%), Healthcare Support (676 | 5.2%), Cleaning & Maintenance (577 | 4.4%), Personal Care & Service (308 | 2.4%), and Security & Protection (242 | 1.9%).

Services Occupations by Sex
Within the Services occupations in Cass County, the most male-oriented occupations are Law Enforcement (82.5%), Security & Protection (80.6%), and Firefighting & Prevention (78.4%), while the most female-oriented occupations are Healthcare Support (85.4%), Personal Care & Service (73.7%), and Food Preparation & Serving (65.3%).

| Occupation | Male | Female |
| Healthcare Support | 99 (14.6%) | 577 (85.4%) |
| Security & Protection | 195 (80.6%) | 47 (19.4%) |
| Firefighting & Prevention | 91 (78.4%) | 25 (21.5%) |
| Law Enforcement | 104 (82.5%) | 22 (17.5%) |
| Food Preparation & Serving | 267 (34.7%) | 502 (65.3%) |
| Cleaning & Maintenance | 286 (49.6%) | 291 (50.4%) |
| Personal Care & Service | 81 (26.3%) | 227 (73.7%) |
| Total (Category) | 928 (36.1%) | 1,644 (63.9%) |
| Total (Overall) | 6,767 (52.1%) | 6,220 (47.9%) |
Sales and Office Occupations
The most common Sales and Office occupations in Cass County are Office & Administration (1,503 | 11.6%), and Sales & Related (1,396 | 10.7%).

Sales and Office Occupations by Sex

| Occupation | Male | Female |
| Sales & Related | 757 (54.2%) | 639 (45.8%) |
| Office & Administration | 311 (20.7%) | 1,192 (79.3%) |
| Total (Category) | 1,068 (36.8%) | 1,831 (63.2%) |
| Total (Overall) | 6,767 (52.1%) | 6,220 (47.9%) |
Natural Resources, Construction and Maintenance Occupations
The most common Natural Resources, Construction and Maintenance occupations in Cass County are Construction & Extraction (971 | 7.5%), Installation, Maintenance & Repair (406 | 3.1%), and Farming, Fishing & Forestry (179 | 1.4%).

Natural Resources, Construction and Maintenance Occupations by Sex

| Occupation | Male | Female |
| Farming, Fishing & Forestry | 160 (89.4%) | 19 (10.6%) |
| Construction & Extraction | 943 (97.1%) | 28 (2.9%) |
| Installation, Maintenance & Repair | 397 (97.8%) | 9 (2.2%) |
| Total (Category) | 1,500 (96.4%) | 56 (3.6%) |
| Total (Overall) | 6,767 (52.1%) | 6,220 (47.9%) |
Production, Transportation and Moving Occupations
The most common Production, Transportation and Moving occupations in Cass County are Production (781 | 6.0%), Transportation (564 | 4.3%), and Material Moving (518 | 4.0%).

Production, Transportation and Moving Occupations by Sex

| Occupation | Male | Female |
| Production | 569 (72.9%) | 212 (27.1%) |
| Transportation | 493 (87.4%) | 71 (12.6%) |
| Material Moving | 406 (78.4%) | 112 (21.6%) |
| Total (Category) | 1,468 (78.8%) | 395 (21.2%) |
| Total (Overall) | 6,767 (52.1%) | 6,220 (47.9%) |
Employment Industries by Sex in Cass County
Employment Industries in Cass County
The major employment industries in Cass County include Health Care & Social Assistance (2,030 | 15.6%), Retail Trade (1,767 | 13.6%), Manufacturing (1,301 | 10.0%), Construction (1,297 | 10.0%), and Accommodation & Food Services (1,149 | 8.8%).

Employment Industries by Sex in Cass County
The Cass County industries that see more men than women are Enterprise Management (100.0%), Mining, Quarrying, & Extraction (96.7%), and Construction (92.1%), whereas the industries that tend to have a higher number of women are Health Care & Social Assistance (82.2%), Educational Services (73.8%), and Finance & Insurance (72.3%).

| Industry | Male | Female |
| Agriculture, Fishing & Hunting | 298 (87.1%) | 44 (12.9%) |
| Mining, Quarrying, & Extraction | 29 (96.7%) | 1 (3.3%) |
| Construction | 1,194 (92.1%) | 103 (7.9%) |
| Manufacturing | 987 (75.9%) | 314 (24.1%) |
| Wholesale Trade | 212 (78.2%) | 59 (21.8%) |
| Retail Trade | 940 (53.2%) | 827 (46.8%) |
| Transportation & Warehousing | 320 (77.1%) | 95 (22.9%) |
| Utilities | 60 (80.0%) | 15 (20.0%) |
| Information | 81 (34.6%) | 153 (65.4%) |
| Finance & Insurance | 128 (27.7%) | 334 (72.3%) |
| Real Estate, Rental & Leasing | 109 (63.4%) | 63 (36.6%) |
| Professional & Scientific | 243 (48.7%) | 256 (51.3%) |
| Enterprise Management | 1 (100.0%) | 0 (0.0%) |
| Administrative & Support | 267 (63.3%) | 155 (36.7%) |
| Educational Services | 253 (26.2%) | 714 (73.8%) |
| Health Care & Social Assistance | 362 (17.8%) | 1,668 (82.2%) |
| Arts, Entertainment & Recreation | 171 (48.4%) | 182 (51.6%) |
| Accommodation & Food Services | 528 (46.0%) | 621 (54.0%) |
| Public Administration | 365 (53.4%) | 318 (46.6%) |
| Total | 6,767 (52.1%) | 6,220 (47.9%) |
Education in Cass County
School Enrollment in Cass County
The most common levels of schooling among the 5,961 students in Cass County are high school (1,649 | 27.7%), middle school (1,430 | 24.0%), and elementary school (1,375 | 23.1%).

| School Level | # Students | % Students |
| Nursery / Preschool | 438 | 7.3% |
| Kindergarten | 267 | 4.5% |
| Elementary School | 1,375 | 23.1% |
| Middle School | 1,430 | 24.0% |
| High School | 1,649 | 27.7% |
| College / Undergraduate | 637 | 10.7% |
| Graduate / Professional | 165 | 2.8% |
| Total | 5,961 | 100.0% |
School Enrollment by Age by Funding Source in Cass County
Out of a total of 5,961 students who are enrolled in schools in Cass County, 841 (14.1%) attend a private institution, while the remaining 5,120 (85.9%) are enrolled in public schools. The age group of 35 years and over has the highest likelihood of being enrolled in private schools, with 73 (27.8% in the age bracket) enrolled. Conversely, the age group of 3 to 4 year olds has the lowest likelihood of being enrolled in a private school, with 298 (93.7% in the age bracket) attending a public institution.

| Age Bracket | Public School | Private School |
| 3 to 4 Year Olds | 298 (93.7%) | 20 (6.3%) |
| 5 to 9 Year Old | 1,347 (86.1%) | 218 (13.9%) |
| 10 to 14 Year Olds | 1,571 (83.3%) | 314 (16.7%) |
| 15 to 17 Year Olds | 977 (91.0%) | 96 (8.9%) |
| 18 to 19 Year Olds | 356 (91.5%) | 33 (8.5%) |
| 20 to 24 Year Olds | 226 (84.3%) | 42 (15.7%) |
| 25 to 34 Year Olds | 157 (78.5%) | 43 (21.5%) |
| 35 Years and over | 190 (72.2%) | 73 (27.8%) |
| Total | 5,120 (85.9%) | 841 (14.1%) |
Educational Attainment by Field of Study in Cass County
Education (1,212 | 20.0%), business (1,062 | 17.5%), science & technology (629 | 10.4%), arts & humanities (482 | 8.0%), and bio, nature & agricultural (455 | 7.5%) are the most common fields of study among 6,058 individuals in Cass County who have obtained a bachelor's degree or higher.

| Field of Study | # Graduates | % Graduates |
| Computers & Mathematics | 227 | 3.7% |
| Bio, Nature & Agricultural | 455 | 7.5% |
| Physical & Health Sciences | 175 | 2.9% |
| Psychology | 289 | 4.8% |
| Social Sciences | 403 | 6.7% |
| Engineering | 220 | 3.6% |
| Multidisciplinary Studies | 5 | 0.1% |
| Science & Technology | 629 | 10.4% |
| Business | 1,062 | 17.5% |
| Education | 1,212 | 20.0% |
| Literature & Languages | 191 | 3.2% |
| Liberal Arts & History | 271 | 4.5% |
| Visual & Performing Arts | 196 | 3.2% |
| Communications | 241 | 4.0% |
| Arts & Humanities | 482 | 8.0% |
| Total | 6,058 | 100.0% |
Transportation & Commute in Cass County
Vehicle Availability by Sex in Cass County
The most prevalent vehicle ownership categories in Cass County are males with 2 vehicles (2,639, accounting for 39.8%) and females with 2 vehicles (2,293, making up 43.9%).

| Vehicles Available | Male | Female |
| No Vehicle | 125 (1.9%) | 142 (2.4%) |
| 1 Vehicle | 971 (14.6%) | 876 (14.6%) |
| 2 Vehicles | 2,639 (39.8%) | 2,293 (38.2%) |
| 3 Vehicles | 1,638 (24.7%) | 1,663 (27.7%) |
| 4 Vehicles | 844 (12.7%) | 773 (12.9%) |
| 5 or more Vehicles | 414 (6.2%) | 263 (4.4%) |
| Total | 6,631 (100.0%) | 6,010 (100.0%) |
Commute Time in Cass County
The most frequently occuring commute durations in Cass County are 20 to 24 minutes (1,700 commuters, 14.9%), 5 to 9 minutes (1,695 commuters, 14.8%), and 15 to 19 minutes (1,522 commuters, 13.3%).

| Commute Time | # Commuters | % Commuters |
| Less than 5 Minutes | 865 | 7.6% |
| 5 to 9 Minutes | 1,695 | 14.8% |
| 10 to 14 Minutes | 1,464 | 12.8% |
| 15 to 19 Minutes | 1,522 | 13.3% |
| 20 to 24 Minutes | 1,700 | 14.9% |
| 25 to 29 Minutes | 680 | 5.9% |
| 30 to 34 Minutes | 1,223 | 10.7% |
| 35 to 39 Minutes | 304 | 2.7% |
| 40 to 44 Minutes | 396 | 3.5% |
| 45 to 59 Minutes | 809 | 7.1% |
| 60 to 89 Minutes | 498 | 4.3% |
| 90 or more Minutes | 285 | 2.5% |
Commute Time by Sex in Cass County
The most common commute times in Cass County are 20 to 24 minutes (947 commuters, 15.5%) for males and 5 to 9 minutes (883 commuters, 16.6%) for females.

| Commute Time | Male | Female |
| Less than 5 Minutes | 595 (9.8%) | 270 (5.1%) |
| 5 to 9 Minutes | 812 (13.3%) | 883 (16.6%) |
| 10 to 14 Minutes | 783 (12.8%) | 681 (12.8%) |
| 15 to 19 Minutes | 743 (12.2%) | 779 (14.6%) |
| 20 to 24 Minutes | 947 (15.5%) | 753 (14.1%) |
| 25 to 29 Minutes | 280 (4.6%) | 400 (7.5%) |
| 30 to 34 Minutes | 740 (12.1%) | 483 (9.0%) |
| 35 to 39 Minutes | 116 (1.9%) | 188 (3.5%) |
| 40 to 44 Minutes | 212 (3.5%) | 184 (3.5%) |
| 45 to 59 Minutes | 379 (6.2%) | 430 (8.1%) |
| 60 to 89 Minutes | 298 (4.9%) | 200 (3.7%) |
| 90 or more Minutes | 200 (3.3%) | 85 (1.6%) |
Time of Departure to Work by Sex in Cass County
The most frequent times of departure to work in Cass County are 7:00 AM to 7:29 AM (975, 16.0%) for males and 7:30 AM to 7:59 AM (1,090, 20.4%) for females.
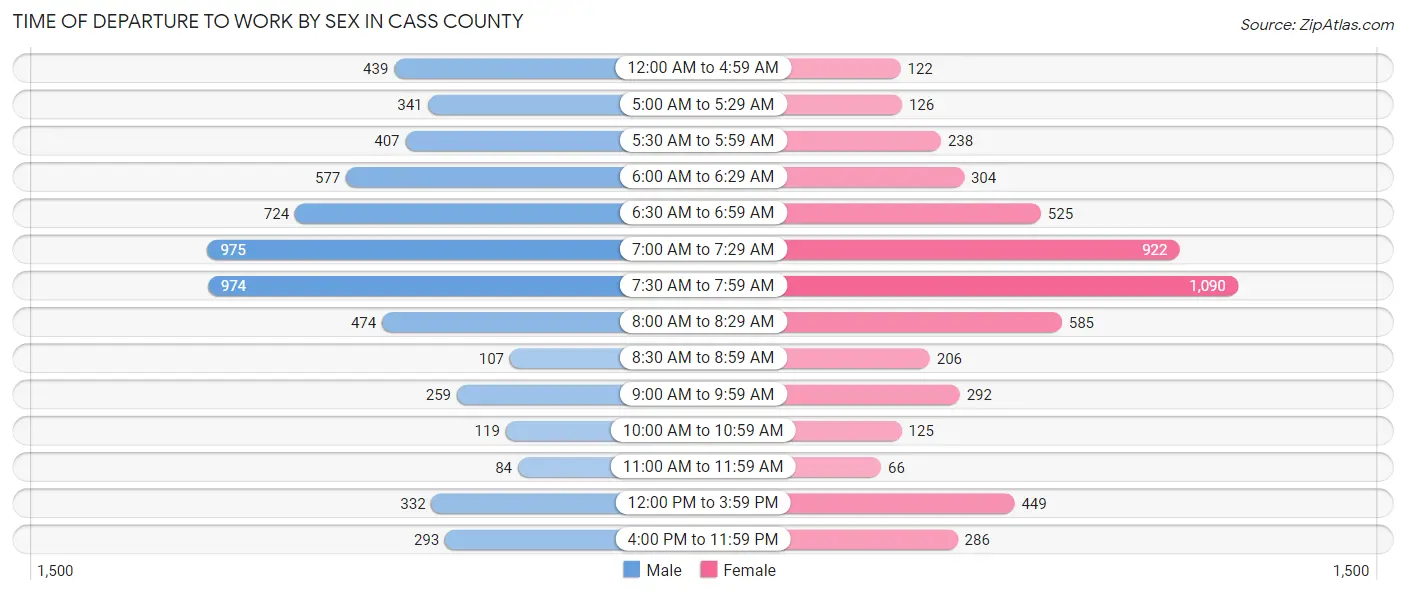
| Time of Departure | Male | Female |
| 12:00 AM to 4:59 AM | 439 (7.2%) | 122 (2.3%) |
| 5:00 AM to 5:29 AM | 341 (5.6%) | 126 (2.4%) |
| 5:30 AM to 5:59 AM | 407 (6.7%) | 238 (4.5%) |
| 6:00 AM to 6:29 AM | 577 (9.5%) | 304 (5.7%) |
| 6:30 AM to 6:59 AM | 724 (11.9%) | 525 (9.8%) |
| 7:00 AM to 7:29 AM | 975 (16.0%) | 922 (17.3%) |
| 7:30 AM to 7:59 AM | 974 (16.0%) | 1,090 (20.4%) |
| 8:00 AM to 8:29 AM | 474 (7.8%) | 585 (11.0%) |
| 8:30 AM to 8:59 AM | 107 (1.8%) | 206 (3.9%) |
| 9:00 AM to 9:59 AM | 259 (4.2%) | 292 (5.5%) |
| 10:00 AM to 10:59 AM | 119 (1.9%) | 125 (2.3%) |
| 11:00 AM to 11:59 AM | 84 (1.4%) | 66 (1.2%) |
| 12:00 PM to 3:59 PM | 332 (5.4%) | 449 (8.4%) |
| 4:00 PM to 11:59 PM | 293 (4.8%) | 286 (5.4%) |
| Total | 6,105 (100.0%) | 5,336 (100.0%) |
Housing Occupancy in Cass County
Occupancy by Ownership in Cass County
Of the total 12,482 dwellings in Cass County, owner-occupied units account for 10,496 (84.1%), while renter-occupied units make up 1,986 (15.9%).

| Occupancy | # Housing Units | % Housing Units |
| Owner Occupied Housing Units | 10,496 | 84.1% |
| Renter-Occupied Housing Units | 1,986 | 15.9% |
| Total Occupied Housing Units | 12,482 | 100.0% |
Occupancy by Household Size in Cass County

| Household Size | # Housing Units | % Housing Units |
| 1-Person Household | 3,579 | 28.7% |
| 2-Person Household | 5,468 | 43.8% |
| 3-Person Household | 1,256 | 10.1% |
| 4+ Person Household | 2,179 | 17.5% |
| Total Housing Units | 12,482 | 100.0% |
Occupancy by Ownership by Household Size in Cass County

| Household Size | Owner-occupied | Renter-occupied |
| 1-Person Household | 2,747 (76.7%) | 832 (23.3%) |
| 2-Person Household | 5,010 (91.6%) | 458 (8.4%) |
| 3-Person Household | 1,009 (80.3%) | 247 (19.7%) |
| 4+ Person Household | 1,730 (79.4%) | 449 (20.6%) |
| Total Housing Units | 10,496 (84.1%) | 1,986 (15.9%) |
Occupancy by Educational Attainment in Cass County

| Household Size | Owner-occupied | Renter-occupied |
| Less than High School | 442 (69.8%) | 191 (30.2%) |
| High School Diploma | 3,083 (81.6%) | 696 (18.4%) |
| College/Associate Degree | 4,047 (83.7%) | 786 (16.3%) |
| Bachelor's Degree or higher | 2,924 (90.3%) | 313 (9.7%) |
Occupancy by Age of Householder in Cass County

| Age Bracket | # Households | % Households |
| Under 35 Years | 1,421 | 11.4% |
| 35 to 44 Years | 1,470 | 11.8% |
| 45 to 54 Years | 1,753 | 14.0% |
| 55 to 64 Years | 2,905 | 23.3% |
| 65 to 74 Years | 2,967 | 23.8% |
| 75 to 84 Years | 1,599 | 12.8% |
| 85 Years and Over | 367 | 2.9% |
| Total | 12,482 | 100.0% |
Housing Finances in Cass County
Median Income by Occupancy in Cass County

| Occupancy Type | # Households | Median Income |
| Owner-Occupied | 10,496 (84.1%) | $68,846 |
| Renter-Occupied | 1,986 (15.9%) | $37,500 |
| Average | 12,482 (100.0%) | $61,970 |
Occupancy by Householder Income Bracket in Cass County

| Income Bracket | Owner-occupied | Renter-occupied |
| Less than $5,000 | 252 (2.4%) | 80 (4.0%) |
| $5,000 to $9,999 | 190 (1.8%) | 66 (3.3%) |
| $10,000 to $14,999 | 278 (2.6%) | 216 (10.9%) |
| $15,000 to $19,999 | 369 (3.5%) | 118 (5.9%) |
| $20,000 to $24,999 | 328 (3.1%) | 175 (8.8%) |
| $25,000 to $34,999 | 835 (8.0%) | 229 (11.5%) |
| $35,000 to $49,999 | 1,277 (12.2%) | 384 (19.3%) |
| $50,000 to $74,999 | 2,191 (20.9%) | 380 (19.1%) |
| $75,000 to $99,999 | 1,502 (14.3%) | 118 (5.9%) |
| $100,000 to $149,999 | 1,862 (17.7%) | 171 (8.6%) |
| $150,000 or more | 1,412 (13.5%) | 49 (2.5%) |
| Total | 10,496 (100.0%) | 1,986 (100.0%) |
Monthly Housing Cost Tiers in Cass County

| Monthly Cost | Owner-occupied | Renter-occupied |
| Less than $300 | 827 (7.9%) | 118 (5.9%) |
| $300 to $499 | 1,699 (16.2%) | 166 (8.4%) |
| $500 to $799 | 2,156 (20.5%) | 429 (21.6%) |
| $800 to $999 | 958 (9.1%) | 361 (18.2%) |
| $1,000 to $1,499 | 2,116 (20.2%) | 443 (22.3%) |
| $1,500 to $1,999 | 1,325 (12.6%) | 190 (9.6%) |
| $2,000 to $2,499 | 791 (7.5%) | 9 (0.4%) |
| $2,500 to $2,999 | 280 (2.7%) | 6 (0.3%) |
| $3,000 or more | 344 (3.3%) | 4 (0.2%) |
| Total | 10,496 (100.0%) | 1,986 (100.0%) |
Physical Housing Characteristics in Cass County
Housing Structures in Cass County

| Structure Type | # Housing Units | % Housing Units |
| Single Unit, Detached | 10,330 | 82.8% |
| Single Unit, Attached | 286 | 2.3% |
| 2 Unit Apartments | 69 | 0.5% |
| 3 or 4 Unit Apartments | 164 | 1.3% |
| 5 to 9 Unit Apartments | 97 | 0.8% |
| 10 or more Apartments | 466 | 3.7% |
| Mobile Home / Other | 1,070 | 8.6% |
| Total | 12,482 | 100.0% |
Housing Structures by Occupancy in Cass County

| Structure Type | Owner-occupied | Renter-occupied |
| Single Unit, Detached | 9,365 (90.7%) | 965 (9.3%) |
| Single Unit, Attached | 158 (55.2%) | 128 (44.8%) |
| 2 Unit Apartments | 28 (40.6%) | 41 (59.4%) |
| 3 or 4 Unit Apartments | 18 (11.0%) | 146 (89.0%) |
| 5 to 9 Unit Apartments | 28 (28.9%) | 69 (71.1%) |
| 10 or more Apartments | 40 (8.6%) | 426 (91.4%) |
| Mobile Home / Other | 859 (80.3%) | 211 (19.7%) |
| Total | 10,496 (84.1%) | 1,986 (15.9%) |
Housing Structures by Number of Rooms in Cass County

| Number of Rooms | Owner-occupied | Renter-occupied |
| 1 Room | 65 (0.6%) | 71 (3.6%) |
| 2 or 3 Rooms | 658 (6.3%) | 466 (23.5%) |
| 4 or 5 Rooms | 3,209 (30.6%) | 905 (45.6%) |
| 6 or 7 Rooms | 3,359 (32.0%) | 340 (17.1%) |
| 8 or more Rooms | 3,205 (30.5%) | 204 (10.3%) |
| Total | 10,496 (100.0%) | 1,986 (100.0%) |
Housing Structure by Heating Type in Cass County

| Heating Type | Owner-occupied | Renter-occupied |
| Utility Gas | 1,862 (17.7%) | 356 (17.9%) |
| Bottled, Tank, or LP Gas | 4,576 (43.6%) | 702 (35.3%) |
| Electricity | 2,366 (22.5%) | 707 (35.6%) |
| Fuel Oil or Kerosene | 223 (2.1%) | 67 (3.4%) |
| Coal or Coke | 0 (0.0%) | 0 (0.0%) |
| All other Fuels | 1,429 (13.6%) | 125 (6.3%) |
| No Fuel Used | 40 (0.4%) | 29 (1.5%) |
| Total | 10,496 (100.0%) | 1,986 (100.0%) |
Household Vehicle Usage in Cass County

| Vehicles per Household | Owner-occupied | Renter-occupied |
| No Vehicle | 270 (2.6%) | 288 (14.5%) |
| 1 Vehicle | 2,531 (24.1%) | 961 (48.4%) |
| 2 Vehicles | 4,437 (42.3%) | 514 (25.9%) |
| 3 or more Vehicles | 3,258 (31.0%) | 223 (11.2%) |
| Total | 10,496 (100.0%) | 1,986 (100.0%) |
Real Estate & Mortgages in Cass County
Real Estate and Mortgage Overview in Cass County
| Characteristic | Without Mortgage | With Mortgage |
| Housing Units | 4,867 | 5,629 |
| Median Property Value | $235,800 | $244,700 |
| Median Household Income | $55,371 | $934 |
| Monthly Housing Costs | $497 | $341 |
| Real Estate Taxes | $1,462 | $189 |
Property Value by Mortgage Status in Cass County

| Property Value | Without Mortgage | With Mortgage |
| Less than $50,000 | 439 (9.0%) | 185 (3.3%) |
| $50,000 to $99,999 | 500 (10.3%) | 476 (8.5%) |
| $100,000 to $299,999 | 2,212 (45.5%) | 2,808 (49.9%) |
| $300,000 to $499,999 | 954 (19.6%) | 1,372 (24.4%) |
| $500,000 to $749,999 | 442 (9.1%) | 557 (9.9%) |
| $750,000 to $999,999 | 158 (3.3%) | 120 (2.1%) |
| $1,000,000 or more | 162 (3.3%) | 111 (2.0%) |
| Total | 4,867 (100.0%) | 5,629 (100.0%) |
Household Income by Mortgage Status in Cass County

| Household Income | Without Mortgage | With Mortgage |
| Less than $10,000 | 319 (6.6%) | 95 (1.7%) |
| $10,000 to $24,999 | 626 (12.9%) | 123 (2.2%) |
| $25,000 to $34,999 | 542 (11.1%) | 349 (6.2%) |
| $35,000 to $49,999 | 643 (13.2%) | 293 (5.2%) |
| $50,000 to $74,999 | 1,075 (22.1%) | 634 (11.3%) |
| $75,000 to $99,999 | 597 (12.3%) | 1,116 (19.8%) |
| $100,000 to $149,999 | 587 (12.1%) | 905 (16.1%) |
| $150,000 or more | 478 (9.8%) | 1,275 (22.7%) |
| Total | 4,867 (100.0%) | 5,629 (100.0%) |
Property Value to Household Income Ratio in Cass County

| Value-to-Income Ratio | Without Mortgage | With Mortgage |
| Less than 2.0x | 1,138 (23.4%) | 82,872 (1,472.2%) |
| 2.0x to 2.9x | 711 (14.6%) | 1,496 (26.6%) |
| 3.0x to 3.9x | 589 (12.1%) | 1,328 (23.6%) |
| 4.0x or more | 2,365 (48.6%) | 1,005 (17.8%) |
| Total | 4,867 (100.0%) | 5,629 (100.0%) |
Real Estate Taxes by Mortgage Status in Cass County

| Property Taxes | Without Mortgage | With Mortgage |
| Less than $800 | 1,049 (21.5%) | 21 (0.4%) |
| $800 to $1,499 | 1,285 (26.4%) | 1,265 (22.5%) |
| $800 to $1,499 | 2,198 (45.2%) | 1,624 (28.8%) |
| Total | 4,867 (100.0%) | 5,629 (100.0%) |
Health & Disability in Cass County
Health Insurance Coverage by Age in Cass County

| Age Bracket | With Coverage | Without Coverage |
| Under 6 Years | 1,621 (90.2%) | 176 (9.8%) |
| 6 to 18 Years | 4,472 (92.6%) | 356 (7.4%) |
| 19 to 25 Years | 1,549 (85.4%) | 264 (14.6%) |
| 26 to 34 Years | 2,019 (83.2%) | 407 (16.8%) |
| 35 to 44 Years | 2,588 (86.9%) | 391 (13.1%) |
| 45 to 54 Years | 2,980 (91.0%) | 295 (9.0%) |
| 55 to 64 Years | 4,686 (91.9%) | 410 (8.1%) |
| 65 to 74 Years | 4,792 (99.7%) | 14 (0.3%) |
| 75 Years and older | 2,992 (99.9%) | 4 (0.1%) |
| Total | 27,699 (92.3%) | 2,317 (7.7%) |
Health Insurance Coverage by Citizenship Status in Cass County

| Citizenship Status | With Coverage | Without Coverage |
| Native Born | 1,621 (90.2%) | 176 (9.8%) |
| Foreign Born, Citizen | 4,472 (92.6%) | 356 (7.4%) |
| Foreign Born, not a Citizen | 1,549 (85.4%) | 264 (14.6%) |
Health Insurance Coverage by Household Income in Cass County

| Household Income | With Coverage | Without Coverage |
| Under $25,000 | 2,907 (90.8%) | 295 (9.2%) |
| $25,000 to $49,999 | 5,424 (92.8%) | 421 (7.2%) |
| $50,000 to $74,999 | 5,567 (89.5%) | 652 (10.5%) |
| $75,000 to $99,999 | 3,884 (90.8%) | 395 (9.2%) |
| $100,000 and over | 9,772 (94.8%) | 537 (5.2%) |
Public vs Private Health Insurance Coverage by Age in Cass County

| Age Bracket | Public Insurance | Private Insurance |
| Under 6 | 1,064 (59.2%) | 719 (40.0%) |
| 6 to 18 Years | 2,537 (52.5%) | 2,199 (45.6%) |
| 19 to 25 Years | 558 (30.8%) | 1,062 (58.6%) |
| 25 to 34 Years | 848 (34.9%) | 1,287 (53.0%) |
| 35 to 44 Years | 949 (31.9%) | 1,759 (59.1%) |
| 45 to 54 Years | 974 (29.7%) | 2,168 (66.2%) |
| 55 to 64 Years | 1,379 (27.1%) | 3,609 (70.8%) |
| 65 to 74 Years | 4,656 (96.9%) | 3,230 (67.2%) |
| 75 Years and over | 2,984 (99.6%) | 2,208 (73.7%) |
| Total | 15,949 (53.1%) | 18,241 (60.8%) |
Disability Status by Sex by Age in Cass County

| Age Bracket | Male | Female |
| Under 5 Years | 3 (0.4%) | 0 (0.0%) |
| 5 to 17 Years | 130 (5.2%) | 92 (4.1%) |
| 18 to 34 Years | 187 (8.0%) | 213 (9.3%) |
| 35 to 64 Years | 904 (15.5%) | 797 (14.4%) |
| 65 to 74 Years | 665 (26.6%) | 421 (18.3%) |
| 75 Years and over | 623 (43.2%) | 492 (31.7%) |
Disability Class by Sex by Age in Cass County
Disability Class: Hearing Difficulty

| Age Bracket | Male | Female |
| Under 5 Years | 3 (0.4%) | 0 (0.0%) |
| 5 to 17 Years | 12 (0.5%) | 12 (0.5%) |
| 18 to 34 Years | 37 (1.6%) | 21 (0.9%) |
| 35 to 64 Years | 376 (6.5%) | 140 (2.5%) |
| 65 to 74 Years | 400 (16.0%) | 123 (5.3%) |
| 75 Years and over | 466 (32.3%) | 205 (13.2%) |
Disability Class: Vision Difficulty

| Age Bracket | Male | Female |
| Under 5 Years | 0 (0.0%) | 0 (0.0%) |
| 5 to 17 Years | 19 (0.8%) | 22 (1.0%) |
| 18 to 34 Years | 9 (0.4%) | 38 (1.7%) |
| 35 to 64 Years | 82 (1.4%) | 137 (2.5%) |
| 65 to 74 Years | 99 (4.0%) | 70 (3.0%) |
| 75 Years and over | 66 (4.6%) | 104 (6.7%) |
Disability Class: Cognitive Difficulty

| Age Bracket | Male | Female |
| 5 to 17 Years | 108 (4.3%) | 70 (3.1%) |
| 18 to 34 Years | 123 (5.3%) | 153 (6.7%) |
| 35 to 64 Years | 374 (6.4%) | 321 (5.8%) |
| 65 to 74 Years | 117 (4.7%) | 80 (3.5%) |
| 75 Years and over | 125 (8.7%) | 76 (4.9%) |
Disability Class: Ambulatory Difficulty

| Age Bracket | Male | Female |
| 5 to 17 Years | 5 (0.2%) | 4 (0.2%) |
| 18 to 34 Years | 25 (1.1%) | 30 (1.3%) |
| 35 to 64 Years | 386 (6.6%) | 437 (7.9%) |
| 65 to 74 Years | 294 (11.7%) | 280 (12.2%) |
| 75 Years and over | 265 (18.4%) | 303 (19.5%) |
Disability Class: Self-Care Difficulty

| Age Bracket | Male | Female |
| 5 to 17 Years | 16 (0.6%) | 4 (0.2%) |
| 18 to 34 Years | 26 (1.1%) | 35 (1.5%) |
| 35 to 64 Years | 208 (3.6%) | 202 (3.7%) |
| 65 to 74 Years | 84 (3.4%) | 95 (4.1%) |
| 75 Years and over | 66 (4.6%) | 90 (5.8%) |
Technology Access in Cass County
Computing Device Access in Cass County

| Device Type | # Households | % Households |
| Desktop or Laptop | 9,318 | 74.7% |
| Smartphone | 10,470 | 83.9% |
| Tablet | 7,215 | 57.8% |
| No Computing Device | 961 | 7.7% |
| Total | 12,482 | 100.0% |
Internet Access in Cass County

| Internet Type | # Households | % Households |
| Dial-Up Internet | 62 | 0.5% |
| Broadband Home | 8,027 | 64.3% |
| Cellular Data Only | 1,853 | 14.8% |
| Satellite Internet | 986 | 7.9% |
| No Internet | 1,791 | 14.3% |
| Total | 12,482 | 100.0% |
Cass County Summary
Cass County, Minnesota is located in the north-central part of the state and is part of the Brainerd Micropolitan Statistical Area. It is bordered by Aitkin County to the north, Crow Wing County to the east, Morrison County to the south, and Todd and Wadena Counties to the west. The county seat is Walker, and the largest city is Pine River. As of the 2010 census, the population of Cass County was 28,567.
History
Cass County was established in 1851 and was named after Lewis Cass, a prominent politician and military leader in the early 19th century. The county was originally part of Aitkin County, but was split off in 1857. The first settlers in the area were mostly of Scandinavian descent, and the county was heavily forested. Logging was the primary industry in the early years, and the county was home to several sawmills.
In the late 19th century, the county began to diversify its economy. Agriculture became an important industry, and the county was home to several dairy farms. The county also became a popular tourist destination, with resorts and campgrounds springing up along the many lakes in the area.
Geography
Cass County covers an area of 1,092 square miles and is located in the north-central part of Minnesota. It is bordered by Aitkin County to the north, Crow Wing County to the east, Morrison County to the south, and Todd and Wadena Counties to the west. The county is mostly forested, with the majority of the land being used for timber production. The county is home to several lakes, including Leech Lake, Cass Lake, and Lake Winnibigoshish.
Economy
Cass County’s economy is largely based on tourism and natural resources. The county is home to several resorts and campgrounds, and is a popular destination for fishing, hunting, and other outdoor activities. The county is also home to several timber companies, and the logging industry is still an important part of the local economy. Agriculture is also an important industry, with dairy farms and other agricultural operations scattered throughout the county.
Demographics
As of the 2010 census, the population of Cass County was 28,567. The population is largely white (94.3%), with small percentages of Native American (2.2%), African American (0.7%), Asian (0.5%), and other races (2.3%). The median household income is $45,845, and the median age is 44.7. The county is home to several small towns and cities, including Walker (the county seat), Pine River, Backus, and Hackensack.
Common Questions
What is the Total Population of Cass County?
Total Population of Cass County is 30,288.
What is the Total Male Population of Cass County?
Total Male Population of Cass County is 15,590.
What is the Total Female Population of Cass County?
Total Female Population of Cass County is 14,698.
What is the Ratio of Males per 100 Females in Cass County?
There are 106.07 Males per 100 Females in Cass County.
What is the Ratio of Females per 100 Males in Cass County?
There are 94.28 Females per 100 Males in Cass County.
What is the Median Population Age in Cass County?
Median Population Age in Cass County is 49.0 Years.
What is the Average Family Size in Cass County
Average Family Size in Cass County is 2.9 People.
What is the Average Household Size in Cass County
Average Household Size in Cass County is 2.4 People.
What is Per Capita Income in Cass County?
Per Capita income in Cass County is $34,505.
What is the Median Family Income in Cass County?
Median Family Income in Cass County is $76,195.
What is the Median Household income in Cass County?
Median Household Income in Cass County is $61,970.
What is Income or Wage Gap in Cass County?
Income or Wage Gap in Cass County is 29.2%.
Women in Cass County earn 70.8 cents for every dollar earned by a man.
What is Family Income Deficit in Cass County?
Family Income Deficit in Cass County is $10,396.
Families that are below poverty line in Cass County earn $10,396 less on average than the poverty threshold level.
What is Inequality or Gini Index in Cass County?
Inequality or Gini Index in Cass County is 0.43.
How Large is the Labor Force in Cass County?
There are 13,887 People in the Labor Forcein in Cass County.
What is the Percentage of People in the Labor Force in Cass County?
56.1% of People are in the Labor Force in Cass County.
What is the Unemployment Rate in Cass County?
Unemployment Rate in Cass County is 6.4%.