Carver County, MN
Carver County Overview
107,216
TOTAL POPULATION
53,641
MALE POPULATION
53,575
FEMALE POPULATION
100.12
MALES / 100 FEMALES
99.88
FEMALES / 100 MALES
38.5
MEDIAN AGE
3.1
AVG FAMILY SIZE
2.7
AVG HOUSEHOLD SIZE
$55,216
PER CAPITA INCOME
$141,884
AVG FAMILY INCOME
$116,308
AVG HOUSEHOLD INCOME
34.3%
WAGE / INCOME GAP [ % ]
65.7¢/ $1
WAGE / INCOME GAP [ $ ]
$13,009
FAMILY INCOME DEFICIT
0.42
INEQUALITY / GINI INDEX
60,394
LABOR FORCE [ PEOPLE ]
73.0%
PERCENT IN LABOR FORCE
3.1%
UNEMPLOYMENT RATE
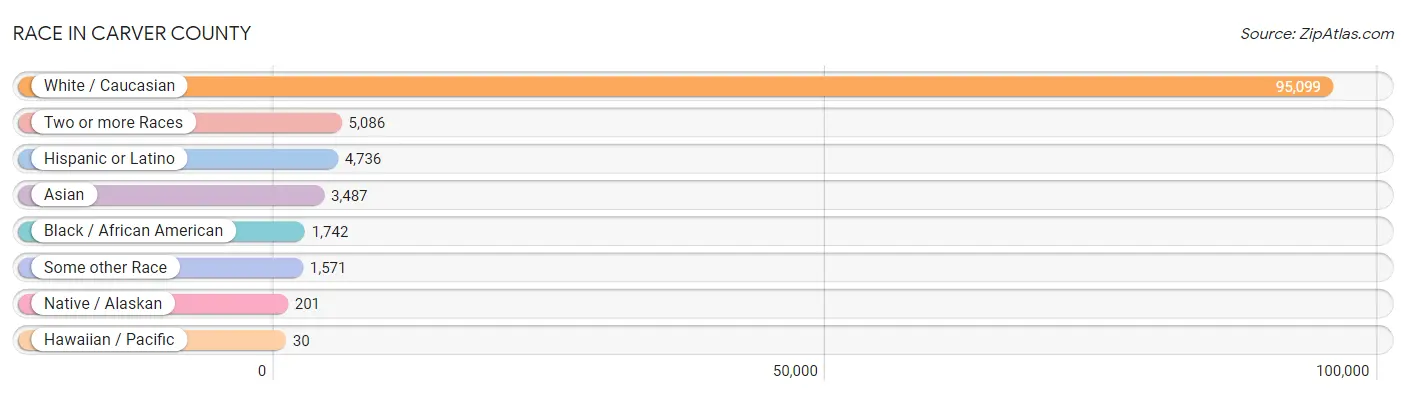
Race in Carver County
The most populous races in Carver County are White / Caucasian (95,099 | 88.7%), Two or more Races (5,086 | 4.7%), and Hispanic or Latino (4,736 | 4.4%).
| Race | # Population | % Population |
| Asian | 3,487 | 3.3% |
| Black / African American | 1,742 | 1.6% |
| Hawaiian / Pacific | 30 | 0.0% |
| Hispanic or Latino | 4,736 | 4.4% |
| Native / Alaskan | 201 | 0.2% |
| White / Caucasian | 95,099 | 88.7% |
| Two or more Races | 5,086 | 4.7% |
| Some other Race | 1,571 | 1.5% |
| Total | 107,216 | 100.0% |
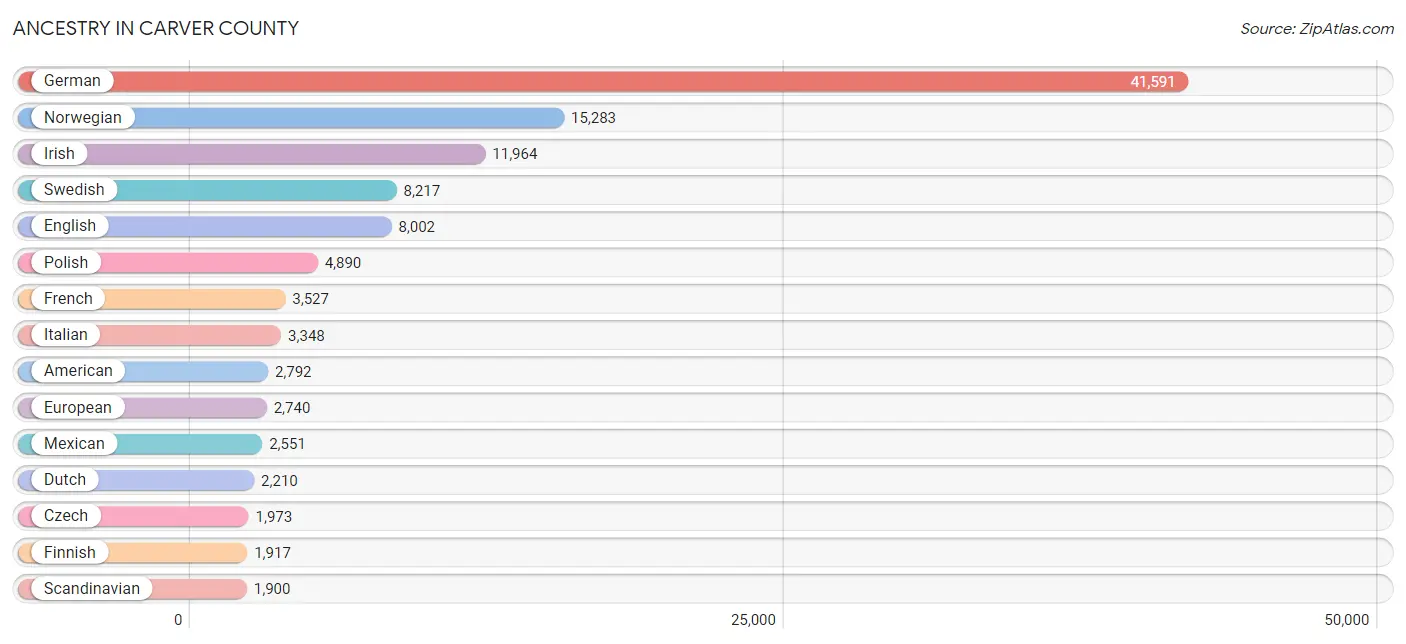
Ancestry in Carver County
The most populous ancestries reported in Carver County are German (41,591 | 38.8%), Norwegian (15,283 | 14.2%), Irish (11,964 | 11.2%), Swedish (8,217 | 7.7%), and English (8,002 | 7.5%), together accounting for 79.3% of all Carver County residents.
| Ancestry | # Population | % Population |
| African | 210 | 0.2% |
| Aleut | 6 | 0.0% |
| American | 2,792 | 2.6% |
| Apache | 8 | 0.0% |
| Arab | 103 | 0.1% |
| Armenian | 43 | 0.0% |
| Australian | 16 | 0.0% |
| Austrian | 348 | 0.3% |
| Bangladeshi | 235 | 0.2% |
| Belgian | 407 | 0.4% |
| Bhutanese | 131 | 0.1% |
| Blackfeet | 6 | 0.0% |
| Bolivian | 36 | 0.0% |
| Brazilian | 170 | 0.2% |
| British | 485 | 0.4% |
| Bulgarian | 50 | 0.1% |
| Burmese | 563 | 0.5% |
| Cajun | 3 | 0.0% |
| Cambodian | 16 | 0.0% |
| Canadian | 227 | 0.2% |
| Celtic | 13 | 0.0% |
| Central American | 779 | 0.7% |
| Central American Indian | 16 | 0.0% |
| Cherokee | 23 | 0.0% |
| Chilean | 1 | 0.0% |
| Chippewa | 169 | 0.2% |
| Colombian | 59 | 0.1% |
| Croatian | 145 | 0.1% |
| Cuban | 93 | 0.1% |
| Czech | 1,973 | 1.8% |
| Czechoslovakian | 392 | 0.4% |
| Danish | 1,192 | 1.1% |
| Dominican | 32 | 0.0% |
| Dutch | 2,210 | 2.1% |
| Eastern European | 273 | 0.3% |
| Ecuadorian | 4 | 0.0% |
| English | 8,002 | 7.5% |
| Estonian | 6 | 0.0% |
| Ethiopian | 5 | 0.0% |
| European | 2,740 | 2.6% |
| Filipino | 10 | 0.0% |
| Finnish | 1,917 | 1.8% |
| French | 3,527 | 3.3% |
| French American Indian | 17 | 0.0% |
| French Canadian | 735 | 0.7% |
| German | 41,591 | 38.8% |
| German Russian | 18 | 0.0% |
| Ghanaian | 62 | 0.1% |
| Greek | 194 | 0.2% |
| Guamanian / Chamorro | 10 | 0.0% |
| Guatemalan | 215 | 0.2% |
| Guyanese | 6 | 0.0% |
| Honduran | 383 | 0.4% |
| Hungarian | 174 | 0.2% |
| Icelander | 103 | 0.1% |
| Indian (Asian) | 455 | 0.4% |
| Iranian | 17 | 0.0% |
| Irish | 11,964 | 11.2% |
| Israeli | 6 | 0.0% |
| Italian | 3,348 | 3.1% |
| Jamaican | 99 | 0.1% |
| Japanese | 384 | 0.4% |
| Kenyan | 110 | 0.1% |
| Korean | 424 | 0.4% |
| Laotian | 14 | 0.0% |
| Latvian | 104 | 0.1% |
| Lebanese | 67 | 0.1% |
| Liberian | 14 | 0.0% |
| Lithuanian | 149 | 0.1% |
| Luxembourger | 66 | 0.1% |
| Malaysian | 198 | 0.2% |
| Mexican | 2,551 | 2.4% |
| Mexican American Indian | 38 | 0.0% |
| Native Hawaiian | 91 | 0.1% |
| Navajo | 7 | 0.0% |
| New Zealander | 23 | 0.0% |
| Nicaraguan | 26 | 0.0% |
| Nigerian | 314 | 0.3% |
| Northern European | 359 | 0.3% |
| Norwegian | 15,283 | 14.2% |
| Osage | 4 | 0.0% |
| Pakistani | 83 | 0.1% |
| Panamanian | 78 | 0.1% |
| Paraguayan | 45 | 0.0% |
| Pennsylvania German | 24 | 0.0% |
| Peruvian | 118 | 0.1% |
| Polish | 4,890 | 4.6% |
| Portuguese | 68 | 0.1% |
| Puerto Rican | 303 | 0.3% |
| Romanian | 320 | 0.3% |
| Russian | 484 | 0.4% |
| Salvadoran | 77 | 0.1% |
| Samoan | 23 | 0.0% |
| Scandinavian | 1,900 | 1.8% |
| Scotch-Irish | 384 | 0.4% |
| Scottish | 929 | 0.9% |
| Serbian | 4 | 0.0% |
| Sioux | 164 | 0.2% |
| Slavic | 6 | 0.0% |
| Slovak | 100 | 0.1% |
| Slovene | 114 | 0.1% |
| South African | 9 | 0.0% |
| South American | 472 | 0.4% |
| Spaniard | 297 | 0.3% |
| Spanish | 76 | 0.1% |
| Sri Lankan | 635 | 0.6% |
| Subsaharan African | 885 | 0.8% |
| Swedish | 8,217 | 7.7% |
| Swiss | 317 | 0.3% |
| Syrian | 4 | 0.0% |
| Thai | 1,430 | 1.3% |
| Turkish | 32 | 0.0% |
| Ukrainian | 259 | 0.2% |
| Venezuelan | 209 | 0.2% |
| Welsh | 424 | 0.4% |
| West Indian | 15 | 0.0% |
| Yugoslavian | 39 | 0.0% | View All 117 Rows |
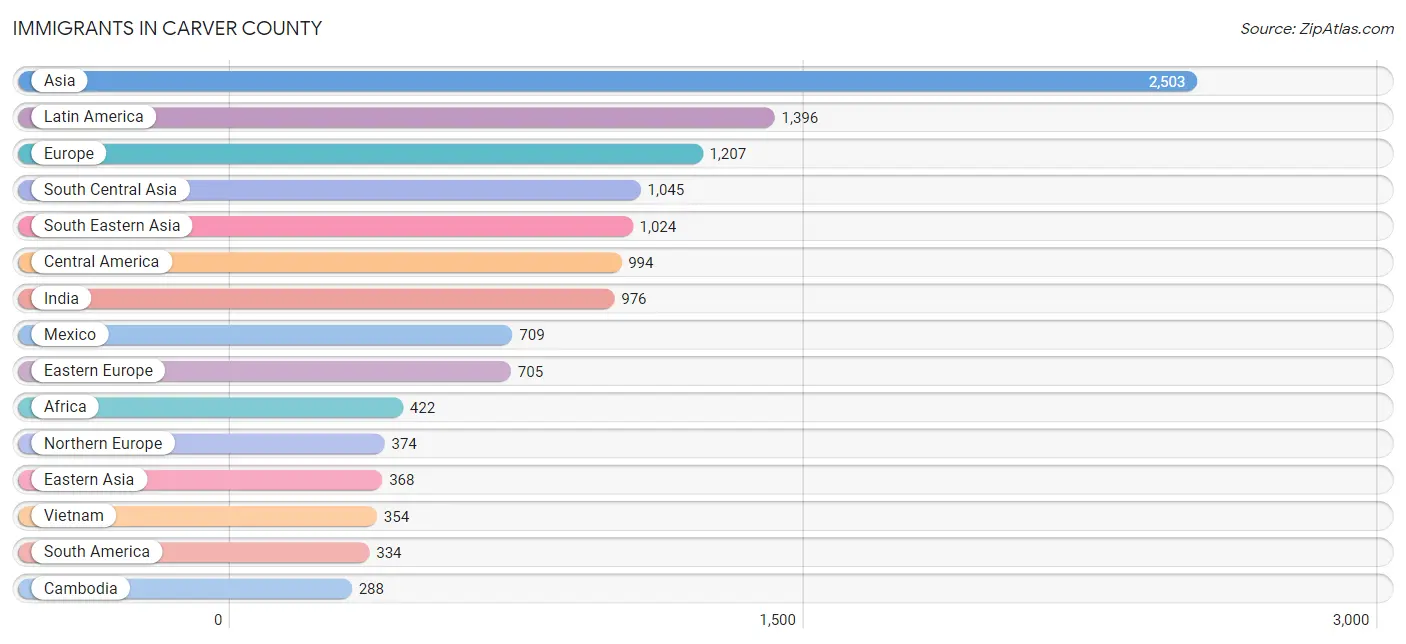
Immigrants in Carver County
The most numerous immigrant groups reported in Carver County came from Asia (2,503 | 2.3%), Latin America (1,396 | 1.3%), Europe (1,207 | 1.1%), South Central Asia (1,045 | 1.0%), and South Eastern Asia (1,024 | 1.0%), together accounting for 6.7% of all Carver County residents.
| Immigration Origin | # Population | % Population |
| Africa | 422 | 0.4% |
| Asia | 2,503 | 2.3% |
| Australia | 53 | 0.1% |
| Austria | 20 | 0.0% |
| Barbados | 18 | 0.0% |
| Belarus | 109 | 0.1% |
| Bolivia | 7 | 0.0% |
| Bosnia and Herzegovina | 39 | 0.0% |
| Brazil | 139 | 0.1% |
| Bulgaria | 41 | 0.0% |
| Cambodia | 288 | 0.3% |
| Canada | 180 | 0.2% |
| Caribbean | 68 | 0.1% |
| Central America | 994 | 0.9% |
| China | 174 | 0.2% |
| Colombia | 54 | 0.1% |
| Congo | 5 | 0.0% |
| Croatia | 22 | 0.0% |
| Czechoslovakia | 18 | 0.0% |
| Denmark | 6 | 0.0% |
| Dominican Republic | 21 | 0.0% |
| Eastern Africa | 149 | 0.1% |
| Eastern Asia | 368 | 0.3% |
| Eastern Europe | 705 | 0.7% |
| Ecuador | 7 | 0.0% |
| El Salvador | 77 | 0.1% |
| England | 114 | 0.1% |
| Eritrea | 9 | 0.0% |
| Ethiopia | 73 | 0.1% |
| Europe | 1,207 | 1.1% |
| France | 14 | 0.0% |
| Germany | 53 | 0.1% |
| Ghana | 62 | 0.1% |
| Greece | 2 | 0.0% |
| Guatemala | 70 | 0.1% |
| Guyana | 5 | 0.0% |
| Honduras | 138 | 0.1% |
| Hong Kong | 10 | 0.0% |
| India | 976 | 0.9% |
| Indonesia | 5 | 0.0% |
| Iran | 17 | 0.0% |
| Iraq | 8 | 0.0% |
| Ireland | 20 | 0.0% |
| Jamaica | 21 | 0.0% |
| Kazakhstan | 25 | 0.0% |
| Kenya | 53 | 0.1% |
| Korea | 194 | 0.2% |
| Laos | 78 | 0.1% |
| Latin America | 1,396 | 1.3% |
| Latvia | 4 | 0.0% |
| Lebanon | 11 | 0.0% |
| Liberia | 6 | 0.0% |
| Lithuania | 5 | 0.0% |
| Malaysia | 5 | 0.0% |
| Mexico | 709 | 0.7% |
| Middle Africa | 5 | 0.0% |
| Netherlands | 4 | 0.0% |
| Nigeria | 133 | 0.1% |
| Northern Africa | 12 | 0.0% |
| Northern Europe | 374 | 0.4% |
| Norway | 6 | 0.0% |
| Oceania | 67 | 0.1% |
| Pakistan | 27 | 0.0% |
| Peru | 49 | 0.1% |
| Philippines | 187 | 0.2% |
| Poland | 164 | 0.2% |
| Romania | 50 | 0.1% |
| Russia | 112 | 0.1% |
| Singapore | 10 | 0.0% |
| South Africa | 55 | 0.1% |
| South America | 334 | 0.3% |
| South Central Asia | 1,045 | 1.0% |
| South Eastern Asia | 1,024 | 1.0% |
| Southern Europe | 24 | 0.0% |
| Spain | 22 | 0.0% |
| St. Vincent and the Grenadines | 3 | 0.0% |
| Switzerland | 13 | 0.0% |
| Thailand | 97 | 0.1% |
| Uganda | 2 | 0.0% |
| Ukraine | 139 | 0.1% |
| Uruguay | 10 | 0.0% |
| Venezuela | 24 | 0.0% |
| Vietnam | 354 | 0.3% |
| Western Africa | 201 | 0.2% |
| Western Asia | 66 | 0.1% |
| Western Europe | 104 | 0.1% | View All 86 Rows |
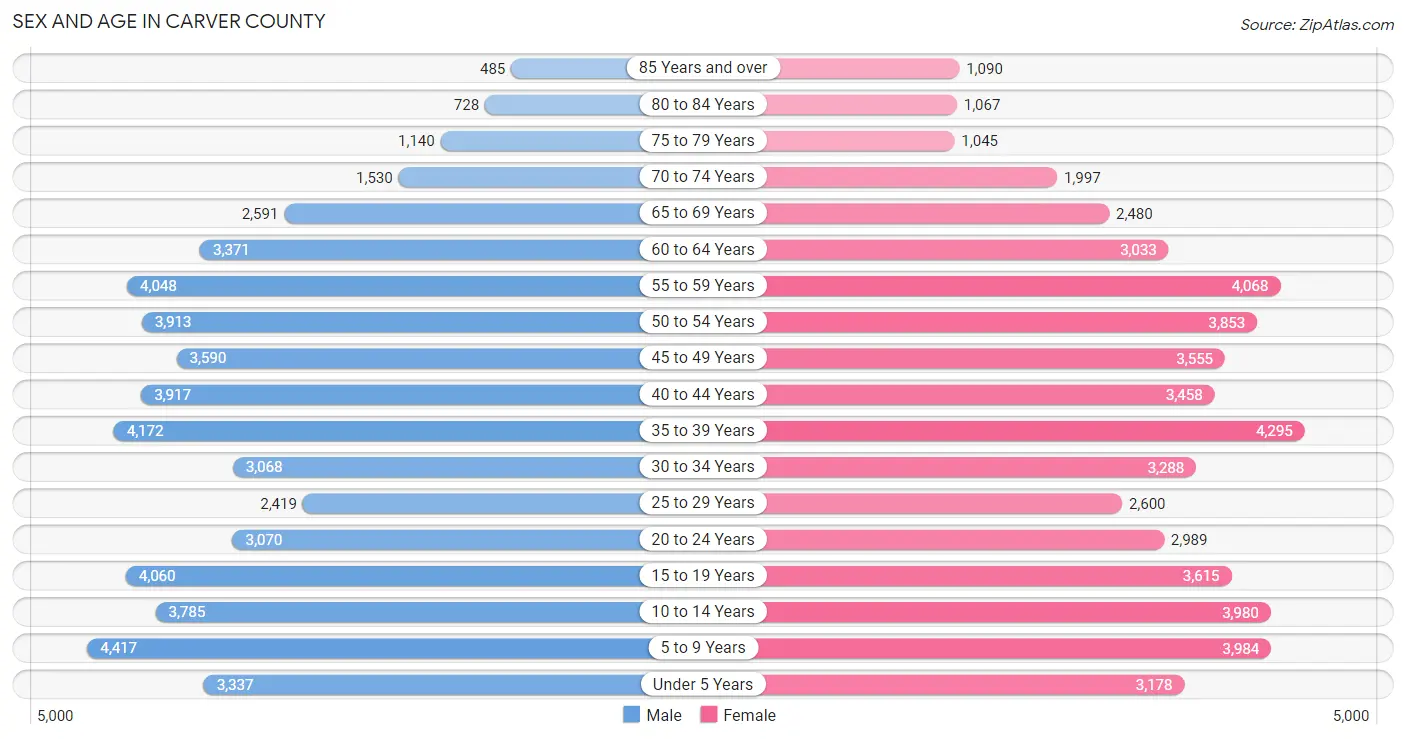
Sex and Age in Carver County
Sex and Age in Carver County
The most populous age groups in Carver County are 5 to 9 Years (4,417 | 8.2%) for men and 35 to 39 Years (4,295 | 8.0%) for women.
| Age Bracket | Male | Female |
| Under 5 Years | 3,337 (6.2%) | 3,178 (5.9%) |
| 5 to 9 Years | 4,417 (8.2%) | 3,984 (7.4%) |
| 10 to 14 Years | 3,785 (7.1%) | 3,980 (7.4%) |
| 15 to 19 Years | 4,060 (7.6%) | 3,615 (6.8%) |
| 20 to 24 Years | 3,070 (5.7%) | 2,989 (5.6%) |
| 25 to 29 Years | 2,419 (4.5%) | 2,600 (4.9%) |
| 30 to 34 Years | 3,068 (5.7%) | 3,288 (6.1%) |
| 35 to 39 Years | 4,172 (7.8%) | 4,295 (8.0%) |
| 40 to 44 Years | 3,917 (7.3%) | 3,458 (6.5%) |
| 45 to 49 Years | 3,590 (6.7%) | 3,555 (6.6%) |
| 50 to 54 Years | 3,913 (7.3%) | 3,853 (7.2%) |
| 55 to 59 Years | 4,048 (7.5%) | 4,068 (7.6%) |
| 60 to 64 Years | 3,371 (6.3%) | 3,033 (5.7%) |
| 65 to 69 Years | 2,591 (4.8%) | 2,480 (4.6%) |
| 70 to 74 Years | 1,530 (2.9%) | 1,997 (3.7%) |
| 75 to 79 Years | 1,140 (2.1%) | 1,045 (1.9%) |
| 80 to 84 Years | 728 (1.4%) | 1,067 (2.0%) |
| 85 Years and over | 485 (0.9%) | 1,090 (2.0%) |
| Total | 53,641 (100.0%) | 53,575 (100.0%) |
Families and Households in Carver County
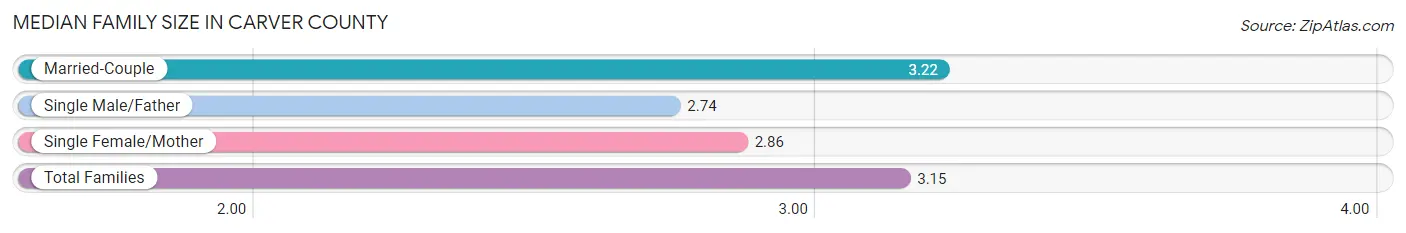
Median Family Size in Carver County
The median family size in Carver County is 3.15 persons per family, with married-couple families (24,273 | 83.9%) accounting for the largest median family size of 3.22 persons per family. On the other hand, single male/father families (1,483 | 5.1%) represent the smallest median family size with 2.74 persons per family.
| Family Type | # Families | Family Size |
| Married-Couple | 24,273 (83.9%) | 3.22 |
| Single Male/Father | 1,483 (5.1%) | 2.74 |
| Single Female/Mother | 3,182 (11.0%) | 2.86 |
| Total Families | 28,938 (100.0%) | 3.15 |
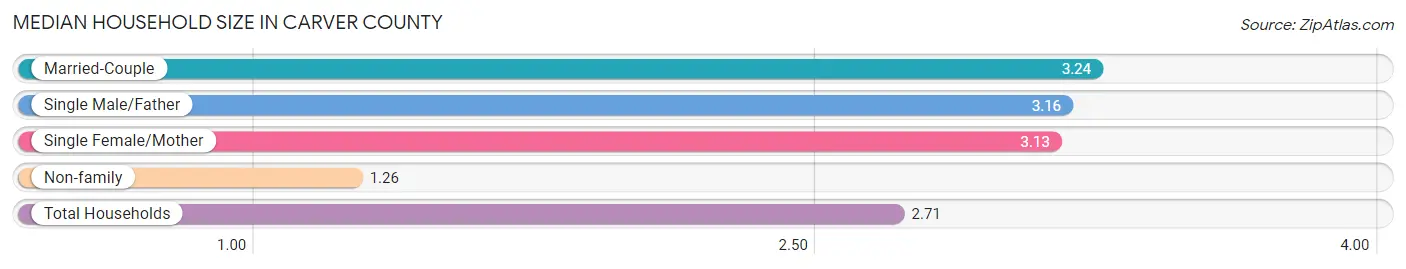
Median Household Size in Carver County
The median household size in Carver County is 2.71 persons per household, with married-couple households (24,273 | 61.8%) accounting for the largest median household size of 3.24 persons per household. non-family households (10,355 | 26.4%) represent the smallest median household size with 1.26 persons per household.
| Household Type | # Households | Household Size |
| Married-Couple | 24,273 (61.8%) | 3.24 |
| Single Male/Father | 1,483 (3.8%) | 3.16 |
| Single Female/Mother | 3,182 (8.1%) | 3.13 |
| Non-family | 10,355 (26.4%) | 1.26 |
| Total Households | 39,293 (100.0%) | 2.71 |
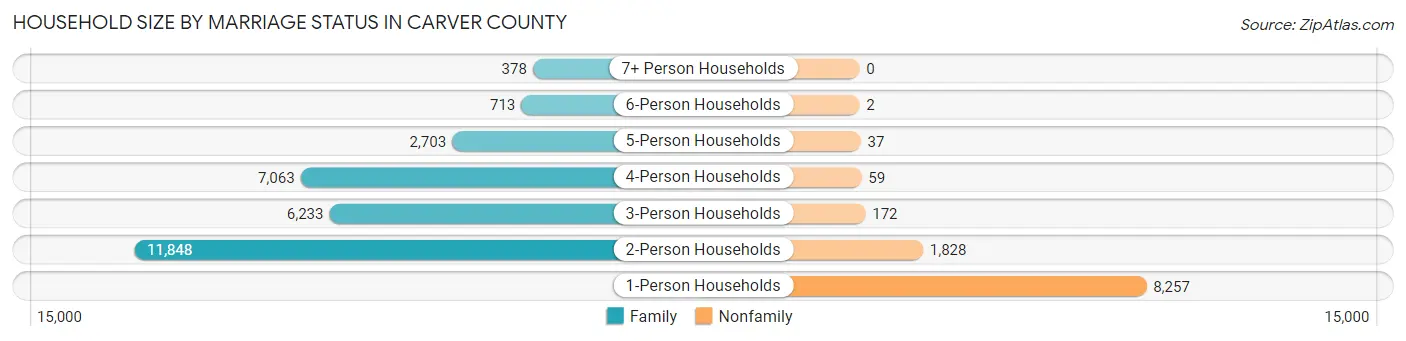
Household Size by Marriage Status in Carver County
Out of a total of 39,293 households in Carver County, 28,938 (73.7%) are family households, while 10,355 (26.4%) are nonfamily households. The most numerous type of family households are 2-person households, comprising 11,848, and the most common type of nonfamily households are 1-person households, comprising 8,257.
| Household Size | Family Households | Nonfamily Households |
| 1-Person Households | - | 8,257 (21.0%) |
| 2-Person Households | 11,848 (30.1%) | 1,828 (4.6%) |
| 3-Person Households | 6,233 (15.9%) | 172 (0.4%) |
| 4-Person Households | 7,063 (18.0%) | 59 (0.2%) |
| 5-Person Households | 2,703 (6.9%) | 37 (0.1%) |
| 6-Person Households | 713 (1.8%) | 2 (0.0%) |
| 7+ Person Households | 378 (1.0%) | 0 (0.0%) |
| Total | 28,938 (73.7%) | 10,355 (26.4%) |
Female Fertility in Carver County
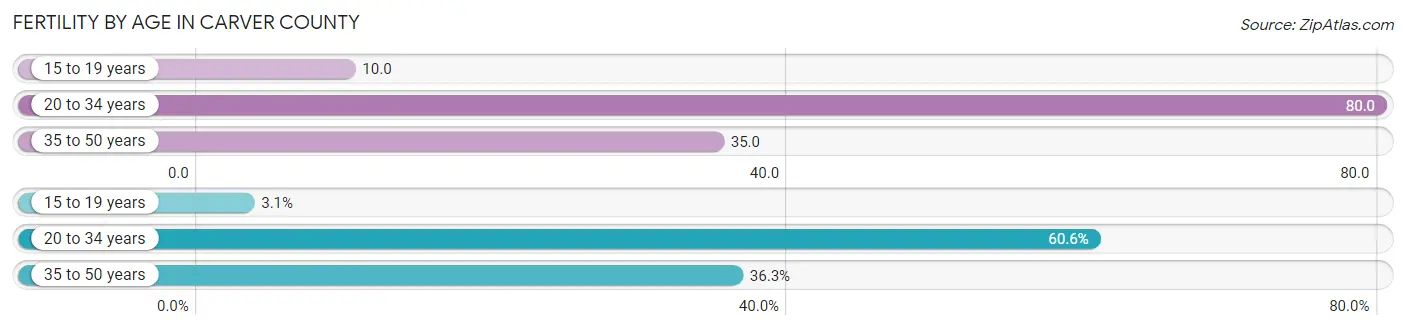
Fertility by Age in Carver County
Average fertility rate in Carver County is 48.0 births per 1,000 women. Women in the age bracket of 20 to 34 years have the highest fertility rate with 80.0 births per 1,000 women. Women in the age bracket of 20 to 34 years acount for 60.6% of all women with births.
| Age Bracket | Women with Births | Births / 1,000 Women |
| 15 to 19 years | 37 (3.1%) | 10.0 |
| 20 to 34 years | 714 (60.6%) | 80.0 |
| 35 to 50 years | 428 (36.3%) | 35.0 |
| Total | 1,179 (100.0%) | 48.0 |
Fertility by Age by Marriage Status in Carver County
90.8% of women with births (1,179) in Carver County are married. The highest percentage of unmarried women with births falls into 35 to 50 years age bracket with 12.4% of them unmarried at the time of birth, while the lowest percentage of unmarried women with births belong to 15 to 19 years age bracket with 0.0% of them unmarried.
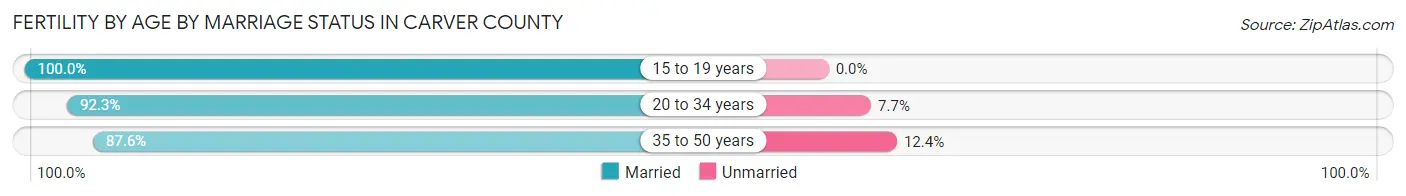
| Age Bracket | Married | Unmarried |
| 15 to 19 years | 37 (100.0%) | 0 (0.0%) |
| 20 to 34 years | 659 (92.3%) | 55 (7.7%) |
| 35 to 50 years | 375 (87.6%) | 53 (12.4%) |
| Total | 1,071 (90.8%) | 108 (9.2%) |
Fertility by Education in Carver County
Average fertility rate in Carver County is 48.0 births per 1,000 women. Women with the education attainment of graduate degree have the highest fertility rate of 77.0 births per 1,000 women, while women with the education attainment of less than high school have the lowest fertility at 22.0 births per 1,000 women. Women with the education attainment of college or associate's degree represent 30.4% of all women with births.

| Educational Attainment | Women with Births | Births / 1,000 Women |
| Less than High School | 79 (6.7%) | 22.0 |
| High School Diploma | 95 (8.1%) | 32.0 |
| College or Associate's Degree | 359 (30.4%) | 58.0 |
| Bachelor's Degree | 342 (29.0%) | 44.0 |
| Graduate Degree | 304 (25.8%) | 77.0 |
| Total | 1,179 (100.0%) | 48.0 |
Fertility by Education by Marriage Status in Carver County
9.2% of women with births in Carver County are unmarried. Women with the educational attainment of graduate degree are most likely to be married with 100.0% of them married at childbirth, while women with the educational attainment of high school diploma are least likely to be married with 44.2% of them unmarried at childbirth.
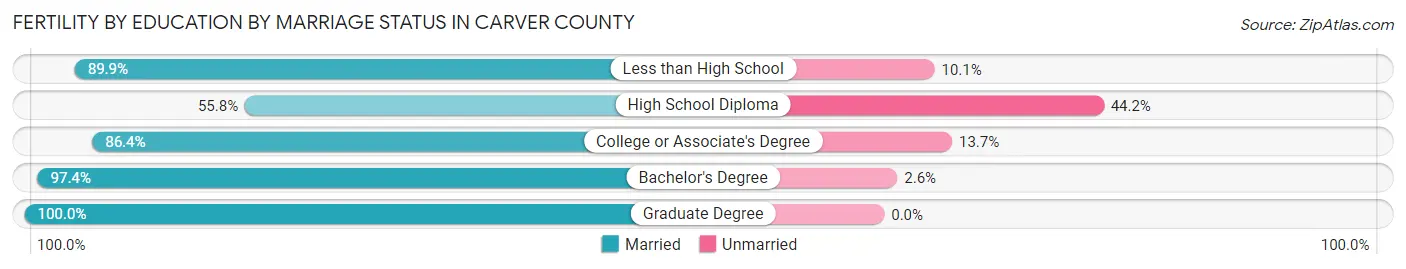
| Educational Attainment | Married | Unmarried |
| Less than High School | 71 (89.9%) | 8 (10.1%) |
| High School Diploma | 53 (55.8%) | 42 (44.2%) |
| College or Associate's Degree | 310 (86.4%) | 49 (13.7%) |
| Bachelor's Degree | 333 (97.4%) | 9 (2.6%) |
| Graduate Degree | 304 (100.0%) | 0 (0.0%) |
| Total | 1,071 (90.8%) | 108 (9.2%) |
Income in Carver County
Income Overview in Carver County
Per Capita Income in Carver County is $55,216, while median incomes of families and households are $141,884 and $116,308 respectively.
| Characteristic | Number | Measure |
| Per Capita Income | 107,216 | $55,216 |
| Median Family Income | 28,938 | $141,884 |
| Mean Family Income | 28,938 | $170,034 |
| Median Household Income | 39,293 | $116,308 |
| Mean Household Income | 39,293 | $146,881 |
| Income Deficit | 28,938 | $13,009 |
| Wage / Income Gap (%) | 107,216 | 34.28% |
| Wage / Income Gap ($) | 107,216 | 65.72¢ per $1 |
| Gini / Inequality Index | 107,216 | 0.42 |
Earnings by Sex in Carver County
Average Earnings in Carver County are $59,443, $72,005 for men and $47,322 for women, a difference of 34.3%.
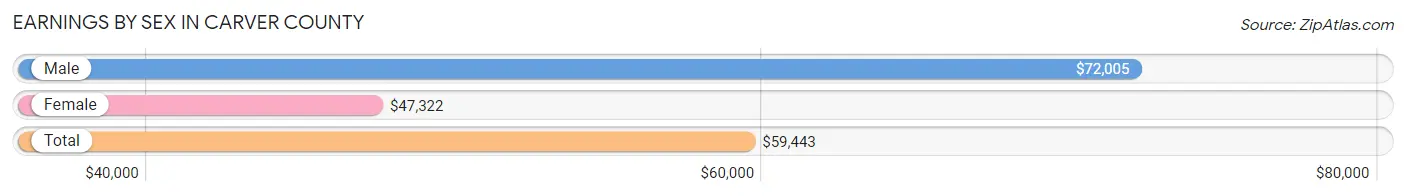
| Sex | Number | Average Earnings |
| Male | 33,435 (53.2%) | $72,005 |
| Female | 29,379 (46.8%) | $47,322 |
| Total | 62,814 (100.0%) | $59,443 |
Earnings by Sex by Income Bracket in Carver County
The most common earnings brackets in Carver County are $100,000+ for men (11,177 | 33.4%) and $100,000+ for women (4,784 | 16.3%).
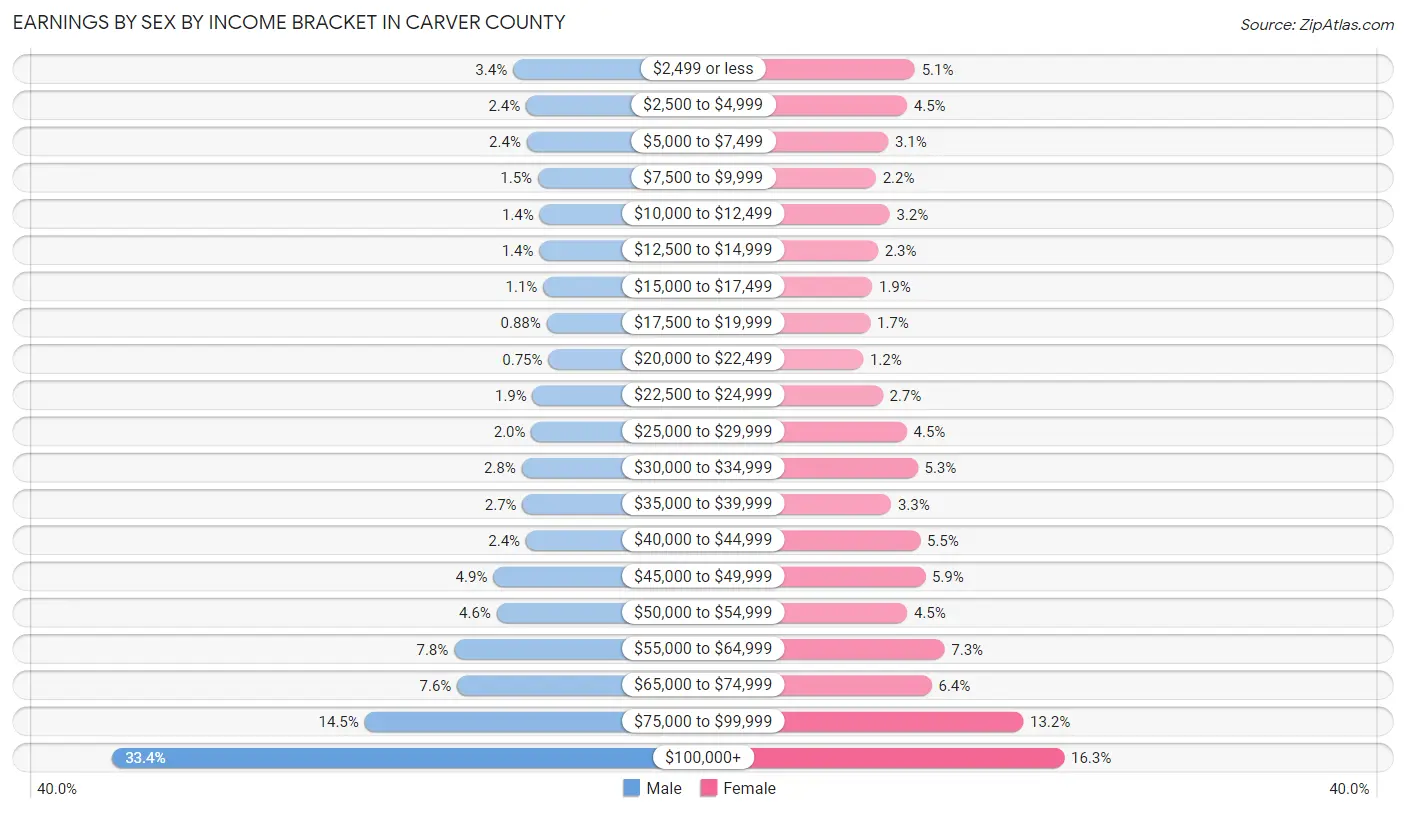
| Income | Male | Female |
| $2,499 or less | 1,136 (3.4%) | 1,494 (5.1%) |
| $2,500 to $4,999 | 809 (2.4%) | 1,321 (4.5%) |
| $5,000 to $7,499 | 794 (2.4%) | 908 (3.1%) |
| $7,500 to $9,999 | 511 (1.5%) | 637 (2.2%) |
| $10,000 to $12,499 | 472 (1.4%) | 940 (3.2%) |
| $12,500 to $14,999 | 477 (1.4%) | 682 (2.3%) |
| $15,000 to $17,499 | 380 (1.1%) | 556 (1.9%) |
| $17,500 to $19,999 | 293 (0.9%) | 512 (1.7%) |
| $20,000 to $22,499 | 251 (0.7%) | 355 (1.2%) |
| $22,500 to $24,999 | 644 (1.9%) | 788 (2.7%) |
| $25,000 to $29,999 | 677 (2.0%) | 1,316 (4.5%) |
| $30,000 to $34,999 | 922 (2.8%) | 1,557 (5.3%) |
| $35,000 to $39,999 | 900 (2.7%) | 973 (3.3%) |
| $40,000 to $44,999 | 814 (2.4%) | 1,613 (5.5%) |
| $45,000 to $49,999 | 1,632 (4.9%) | 1,721 (5.9%) |
| $50,000 to $54,999 | 1,546 (4.6%) | 1,326 (4.5%) |
| $55,000 to $64,999 | 2,610 (7.8%) | 2,148 (7.3%) |
| $65,000 to $74,999 | 2,534 (7.6%) | 1,866 (6.4%) |
| $75,000 to $99,999 | 4,856 (14.5%) | 3,882 (13.2%) |
| $100,000+ | 11,177 (33.4%) | 4,784 (16.3%) |
| Total | 33,435 (100.0%) | 29,379 (100.0%) |
Earnings by Sex by Educational Attainment in Carver County
Average earnings in Carver County are $81,392 for men and $54,811 for women, a difference of 32.7%. Men with an educational attainment of graduate degree enjoy the highest average annual earnings of $138,079, while those with less than high school education earn the least with $52,083. Women with an educational attainment of graduate degree earn the most with the average annual earnings of $87,039, while those with less than high school education have the smallest earnings of $30,519.
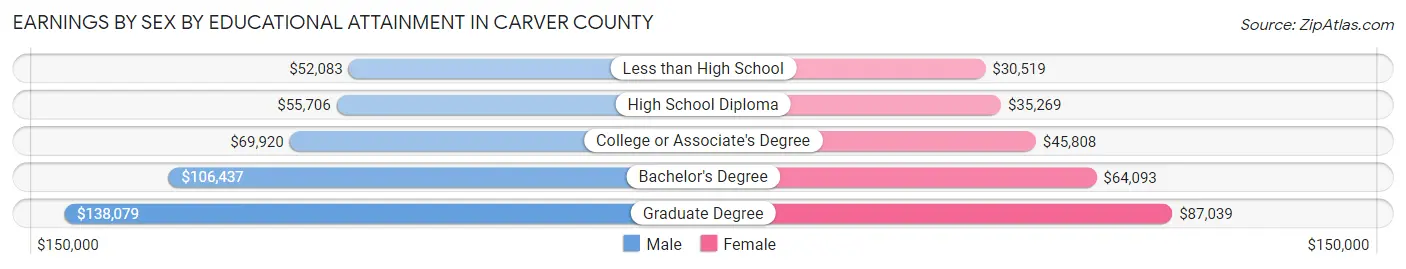
| Educational Attainment | Male Income | Female Income |
| Less than High School | $52,083 | $30,519 |
| High School Diploma | $55,706 | $35,269 |
| College or Associate's Degree | $69,920 | $45,808 |
| Bachelor's Degree | $106,437 | $64,093 |
| Graduate Degree | $138,079 | $87,039 |
| Total | $81,392 | $54,811 |
Family Income in Carver County
Family Income Brackets in Carver County
According to the Carver County family income data, there are 8,218 families falling into the $200,000+ income range, which is the most common income bracket and makes up 28.4% of all families. Conversely, the $10,000 to $14,999 income bracket is the least frequent group with only 87 families (0.3%) belonging to this category.
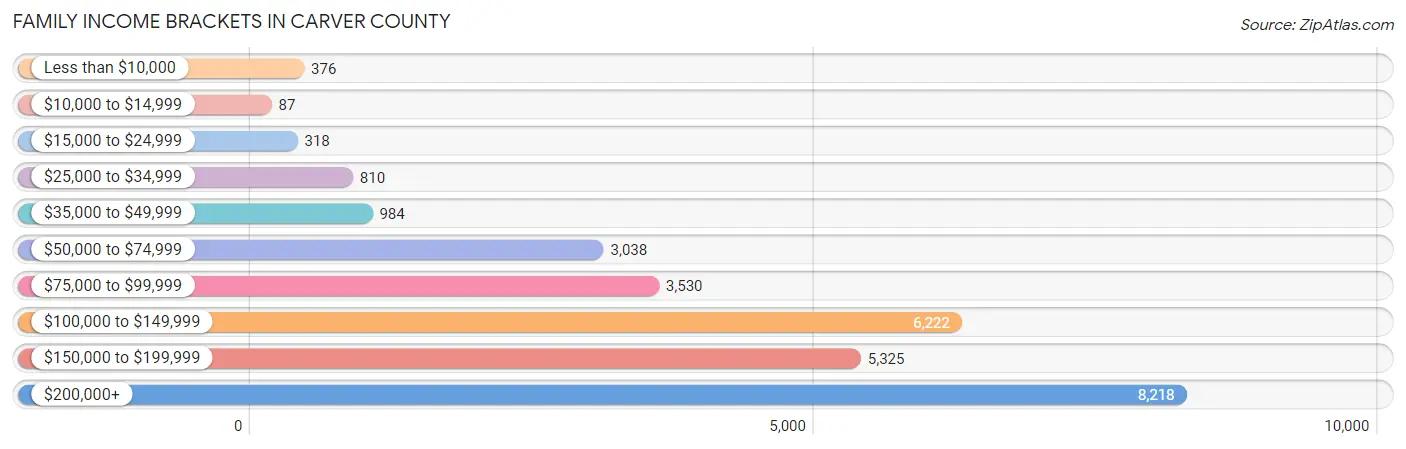
| Income Bracket | # Families | % Families |
| Less than $10,000 | 376 | 1.3% |
| $10,000 to $14,999 | 87 | 0.3% |
| $15,000 to $24,999 | 318 | 1.1% |
| $25,000 to $34,999 | 810 | 2.8% |
| $35,000 to $49,999 | 984 | 3.4% |
| $50,000 to $74,999 | 3,038 | 10.5% |
| $75,000 to $99,999 | 3,530 | 12.2% |
| $100,000 to $149,999 | 6,222 | 21.5% |
| $150,000 to $199,999 | 5,325 | 18.4% |
| $200,000+ | 8,218 | 28.4% |
Family Income by Famaliy Size in Carver County
5-person families (2,538 | 8.8%) account for the highest median family income in Carver County with $182,411 per family, while 2-person families (12,567 | 43.4%) have the highest median income of $53,445 per family member.
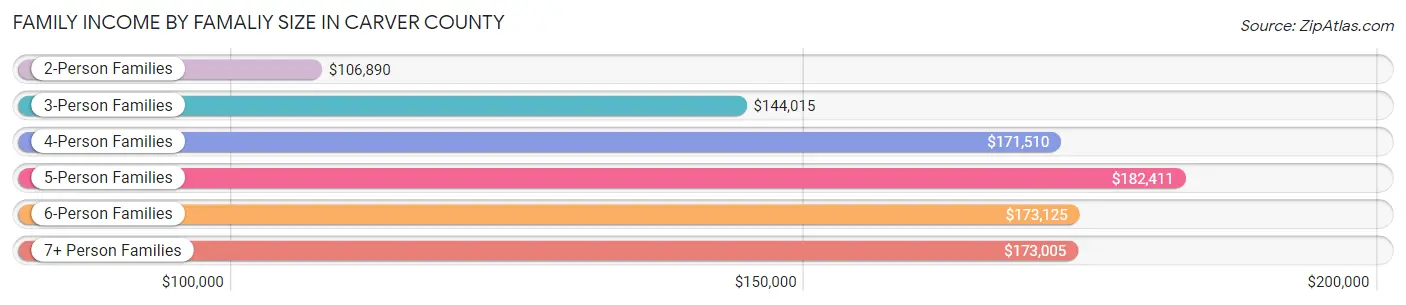
| Income Bracket | # Families | Median Income |
| 2-Person Families | 12,567 (43.4%) | $106,890 |
| 3-Person Families | 6,046 (20.9%) | $144,015 |
| 4-Person Families | 6,766 (23.4%) | $171,510 |
| 5-Person Families | 2,538 (8.8%) | $182,411 |
| 6-Person Families | 756 (2.6%) | $173,125 |
| 7+ Person Families | 265 (0.9%) | $173,005 |
| Total | 28,938 (100.0%) | $141,884 |
Family Income by Number of Earners in Carver County
The median family income in Carver County is $141,884, with families comprising 3+ earners (4,203) having the highest median family income of $179,340, while families with no earners (3,254) have the lowest median family income of $71,250, accounting for 14.5% and 11.2% of families, respectively.
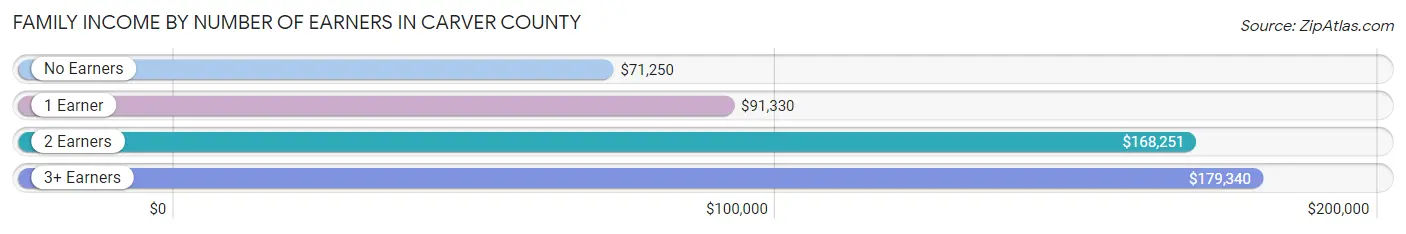
| Number of Earners | # Families | Median Income |
| No Earners | 3,254 (11.2%) | $71,250 |
| 1 Earner | 6,959 (24.0%) | $91,330 |
| 2 Earners | 14,522 (50.2%) | $168,251 |
| 3+ Earners | 4,203 (14.5%) | $179,340 |
| Total | 28,938 (100.0%) | $141,884 |
Household Income in Carver County
Household Income Brackets in Carver County
With 8,920 households falling in the category, the $200,000+ income range is the most frequent in Carver County, accounting for 22.7% of all households. In contrast, only 511 households (1.3%) fall into the $10,000 to $14,999 income bracket, making it the least populous group.
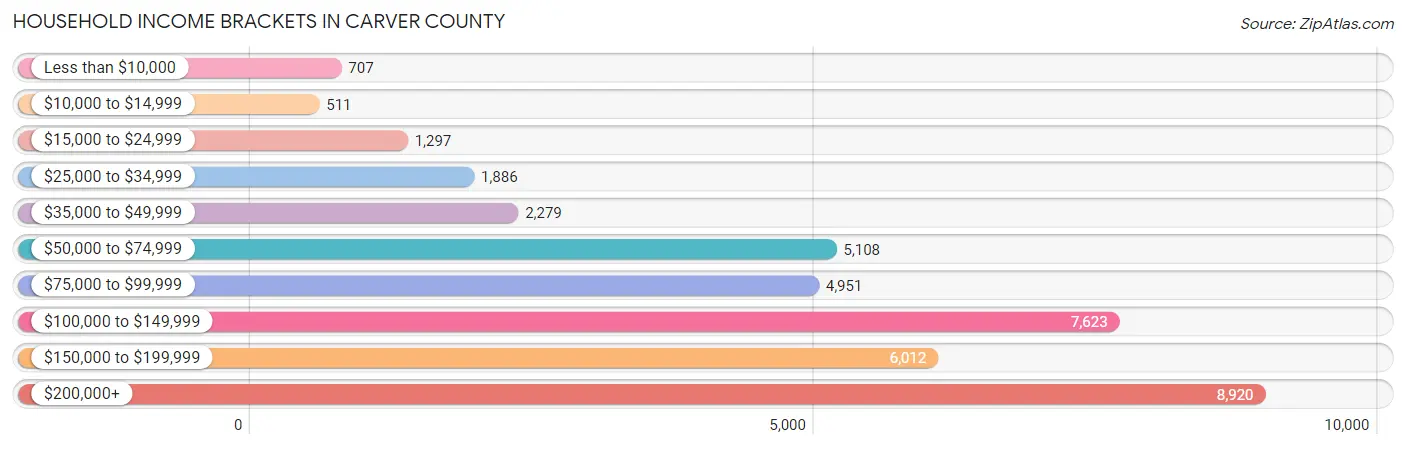
| Income Bracket | # Households | % Households |
| Less than $10,000 | 707 | 1.8% |
| $10,000 to $14,999 | 511 | 1.3% |
| $15,000 to $24,999 | 1,297 | 3.3% |
| $25,000 to $34,999 | 1,886 | 4.8% |
| $35,000 to $49,999 | 2,279 | 5.8% |
| $50,000 to $74,999 | 5,108 | 13.0% |
| $75,000 to $99,999 | 4,951 | 12.6% |
| $100,000 to $149,999 | 7,623 | 19.4% |
| $150,000 to $199,999 | 6,012 | 15.3% |
| $200,000+ | 8,920 | 22.7% |
Household Income by Householder Age in Carver County
The median household income in Carver County is $116,308, with the highest median household income of $142,733 found in the 45 to 64 years age bracket for the primary householder. A total of 16,847 households (42.9%) fall into this category. Meanwhile, the 15 to 24 years age bracket for the primary householder has the lowest median household income of $57,308, with 946 households (2.4%) in this group.
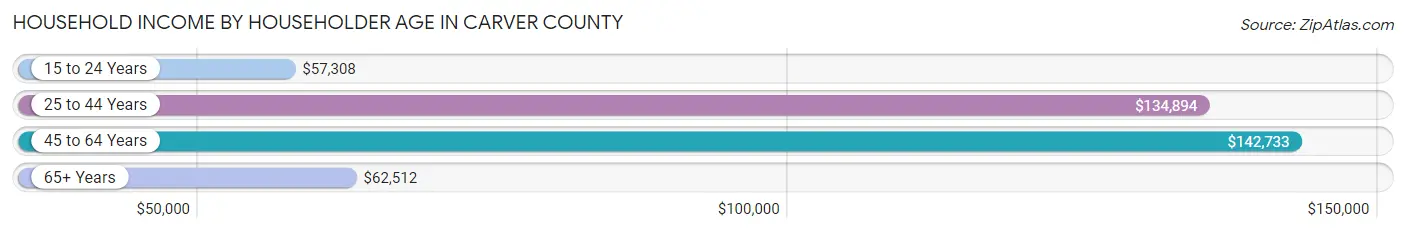
| Income Bracket | # Households | Median Income |
| 15 to 24 Years | 946 (2.4%) | $57,308 |
| 25 to 44 Years | 13,102 (33.3%) | $134,894 |
| 45 to 64 Years | 16,847 (42.9%) | $142,733 |
| 65+ Years | 8,398 (21.4%) | $62,512 |
| Total | 39,293 (100.0%) | $116,308 |
Poverty in Carver County
Income Below Poverty by Sex and Age in Carver County
With 2.8% poverty level for males and 4.8% for females among the residents of Carver County, 18 to 24 year old males and 18 to 24 year old females are the most vulnerable to poverty, with 248 males (5.8%) and 400 females (10.1%) in their respective age groups living below the poverty level.

| Age Bracket | Male | Female |
| Under 5 Years | 113 (3.5%) | 132 (4.2%) |
| 5 Years | 10 (1.5%) | 52 (5.3%) |
| 6 to 11 Years | 116 (2.1%) | 184 (4.3%) |
| 12 to 14 Years | 33 (1.6%) | 70 (3.0%) |
| 15 Years | 6 (0.7%) | 90 (9.2%) |
| 16 and 17 Years | 81 (4.6%) | 106 (7.2%) |
| 18 to 24 Years | 248 (5.8%) | 400 (10.1%) |
| 25 to 34 Years | 63 (1.1%) | 288 (4.9%) |
| 35 to 44 Years | 174 (2.1%) | 264 (3.4%) |
| 45 to 54 Years | 131 (1.8%) | 223 (3.0%) |
| 55 to 64 Years | 289 (3.9%) | 300 (4.2%) |
| 65 to 74 Years | 118 (2.9%) | 183 (4.1%) |
| 75 Years and over | 104 (4.4%) | 234 (7.6%) |
| Total | 1,486 (2.8%) | 2,526 (4.8%) |
Income Above Poverty by Sex and Age in Carver County
According to the poverty statistics in Carver County, males aged 15 years and females aged 12 to 14 years are the age groups that are most secure financially, with 99.3% of males and 97.0% of females in these age groups living above the poverty line.
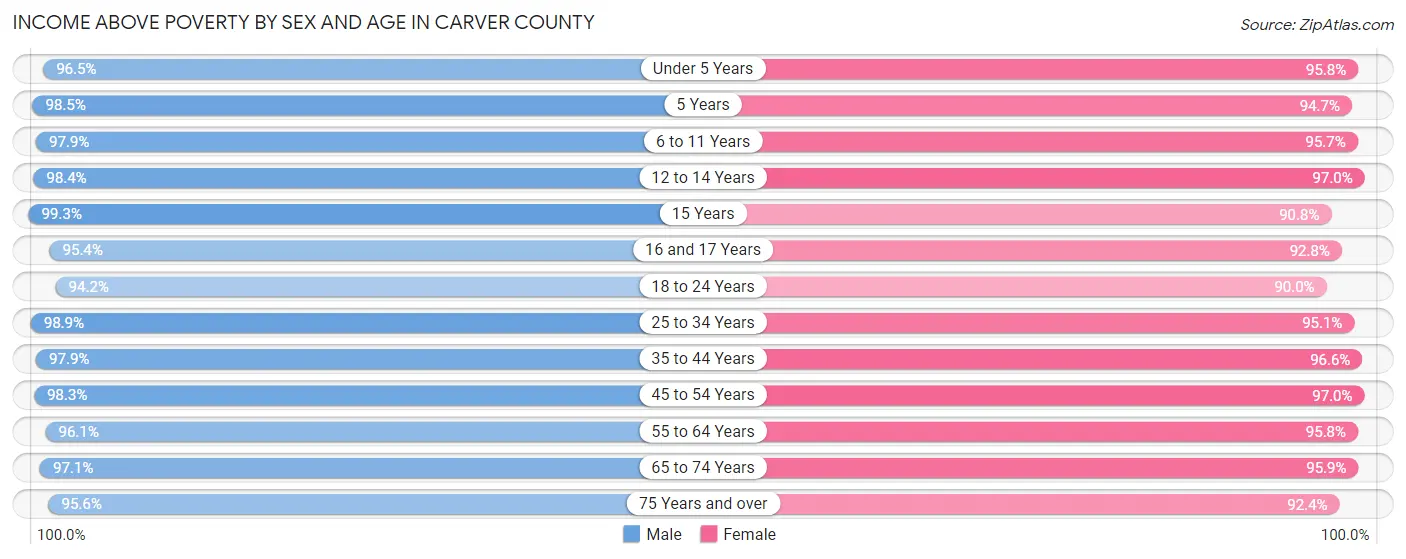
| Age Bracket | Male | Female |
| Under 5 Years | 3,149 (96.5%) | 3,019 (95.8%) |
| 5 Years | 670 (98.5%) | 922 (94.7%) |
| 6 to 11 Years | 5,341 (97.9%) | 4,124 (95.7%) |
| 12 to 14 Years | 1,979 (98.4%) | 2,292 (97.0%) |
| 15 Years | 816 (99.3%) | 892 (90.8%) |
| 16 and 17 Years | 1,661 (95.4%) | 1,363 (92.8%) |
| 18 to 24 Years | 4,059 (94.2%) | 3,581 (89.9%) |
| 25 to 34 Years | 5,398 (98.9%) | 5,590 (95.1%) |
| 35 to 44 Years | 7,912 (97.9%) | 7,489 (96.6%) |
| 45 to 54 Years | 7,360 (98.3%) | 7,185 (97.0%) |
| 55 to 64 Years | 7,129 (96.1%) | 6,801 (95.8%) |
| 65 to 74 Years | 3,995 (97.1%) | 4,249 (95.9%) |
| 75 Years and over | 2,231 (95.6%) | 2,830 (92.4%) |
| Total | 51,700 (97.2%) | 50,337 (95.2%) |
Income Below Poverty Among Married-Couple Families in Carver County
The poverty statistics for married-couple families in Carver County show that 1.0% or 253 of the total 24,273 families live below the poverty line. Families with no children have the highest poverty rate of 1.5%, comprising of 189 families. On the other hand, families with 5 or more children have the lowest poverty rate of 0.0%, which includes 0 families.
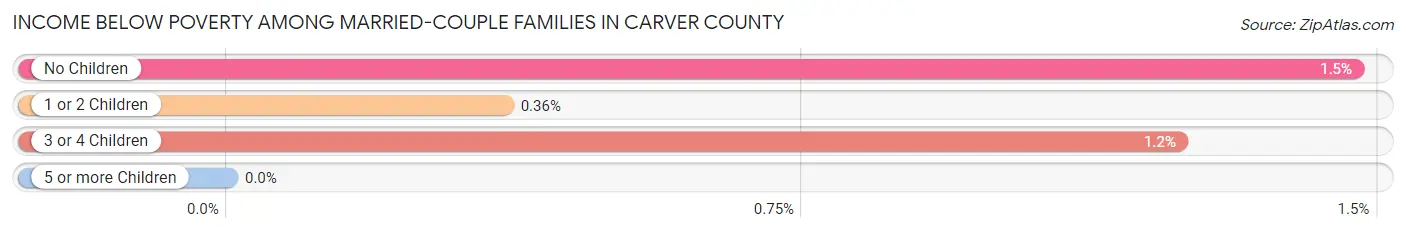
| Children | Above Poverty | Below Poverty |
| No Children | 12,626 (98.5%) | 189 (1.5%) |
| 1 or 2 Children | 8,645 (99.6%) | 31 (0.4%) |
| 3 or 4 Children | 2,625 (98.8%) | 33 (1.2%) |
| 5 or more Children | 124 (100.0%) | 0 (0.0%) |
| Total | 24,020 (99.0%) | 253 (1.0%) |
Income Below Poverty Among Single-Parent Households in Carver County
According to the poverty data in Carver County, 5.4% or 80 single-father households and 11.8% or 375 single-mother households are living below the poverty line. Among single-father households, those with 3 or 4 children have the highest poverty rate, with 20 households (9.2%) experiencing poverty. Likewise, among single-mother households, those with 5 or more children have the highest poverty rate, with 4 households (100.0%) falling below the poverty line.
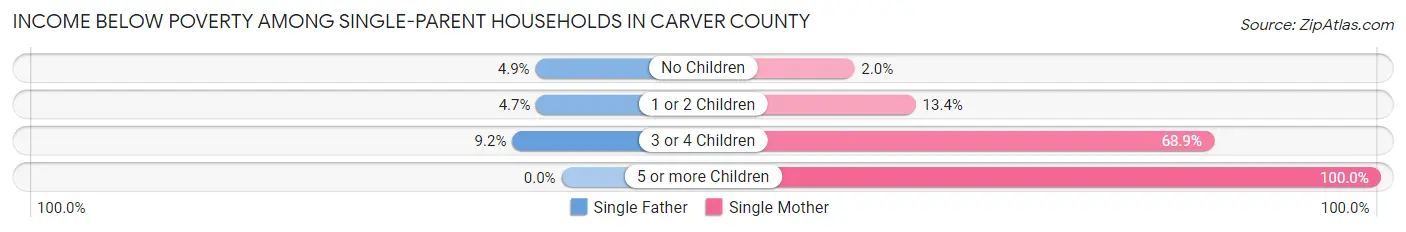
| Children | Single Father | Single Mother |
| No Children | 22 (4.9%) | 24 (2.0%) |
| 1 or 2 Children | 38 (4.7%) | 245 (13.4%) |
| 3 or 4 Children | 20 (9.2%) | 102 (68.9%) |
| 5 or more Children | 0 (0.0%) | 4 (100.0%) |
| Total | 80 (5.4%) | 375 (11.8%) |
Income Below Poverty Among Married-Couple vs Single-Parent Households in Carver County
The poverty data for Carver County shows that 253 of the married-couple family households (1.0%) and 455 of the single-parent households (9.8%) are living below the poverty level. Within the married-couple family households, those with no children have the highest poverty rate, with 189 households (1.5%) falling below the poverty line. Among the single-parent households, those with 5 or more children have the highest poverty rate, with 4 household (100.0%) living below poverty.
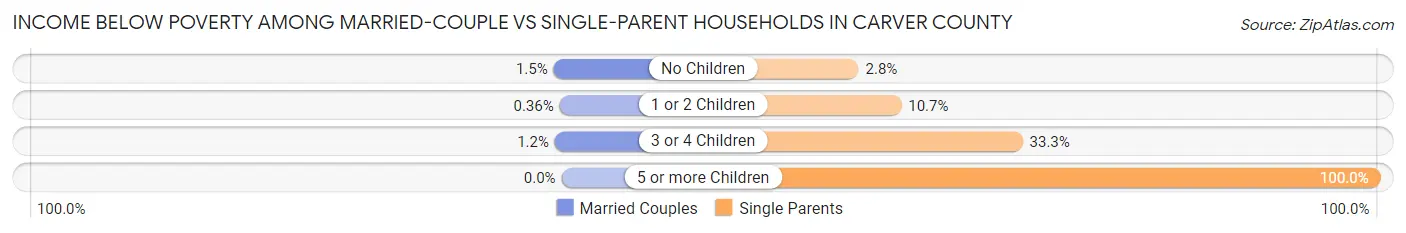
| Children | Married-Couple Families | Single-Parent Households |
| No Children | 189 (1.5%) | 46 (2.8%) |
| 1 or 2 Children | 31 (0.4%) | 283 (10.7%) |
| 3 or 4 Children | 33 (1.2%) | 122 (33.3%) |
| 5 or more Children | 0 (0.0%) | 4 (100.0%) |
| Total | 253 (1.0%) | 455 (9.8%) |
Employment Characteristics in Carver County
Employment by Class of Employer in Carver County
Among the 58,029 employed individuals in Carver County, private company employees (42,115 | 72.6%), not-for-profit organizations (4,792 | 8.3%), and local government employees (4,029 | 6.9%) make up the most common classes of employment.
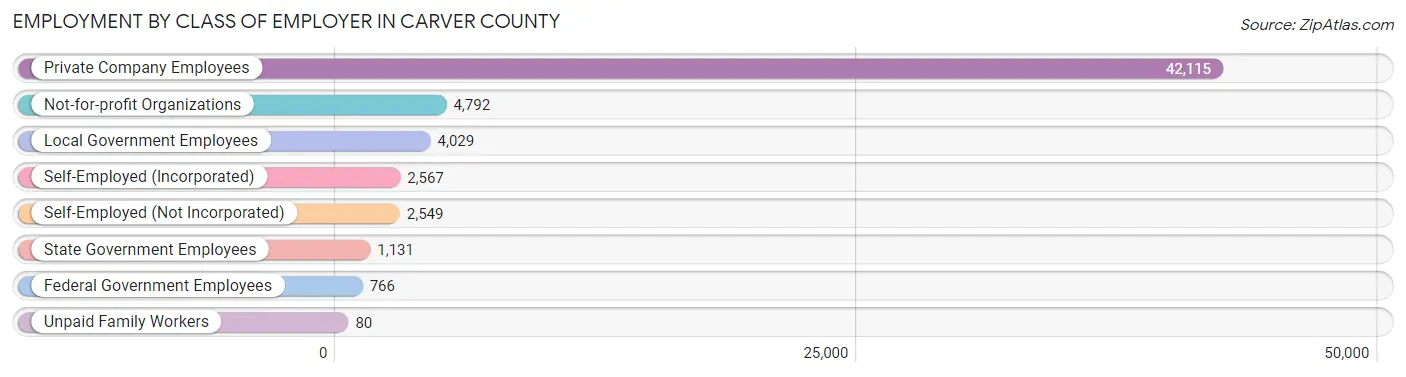
| Employer Class | # Employees | % Employees |
| Private Company Employees | 42,115 | 72.6% |
| Self-Employed (Incorporated) | 2,567 | 4.4% |
| Self-Employed (Not Incorporated) | 2,549 | 4.4% |
| Not-for-profit Organizations | 4,792 | 8.3% |
| Local Government Employees | 4,029 | 6.9% |
| State Government Employees | 1,131 | 1.9% |
| Federal Government Employees | 766 | 1.3% |
| Unpaid Family Workers | 80 | 0.1% |
| Total | 58,029 | 100.0% |
Employment Status by Age in Carver County
According to the labor force statistics for Carver County, out of the total population over 16 years of age (82,731), 73.0% or 60,394 individuals are in the labor force, with 3.1% or 1,872 of them unemployed. The age group with the highest labor force participation rate is 30 to 34 years, with 92.4% or 5,873 individuals in the labor force. Within the labor force, the 20 to 24 years age range has the highest percentage of unemployed individuals, with 7.9% or 369 of them being unemployed.
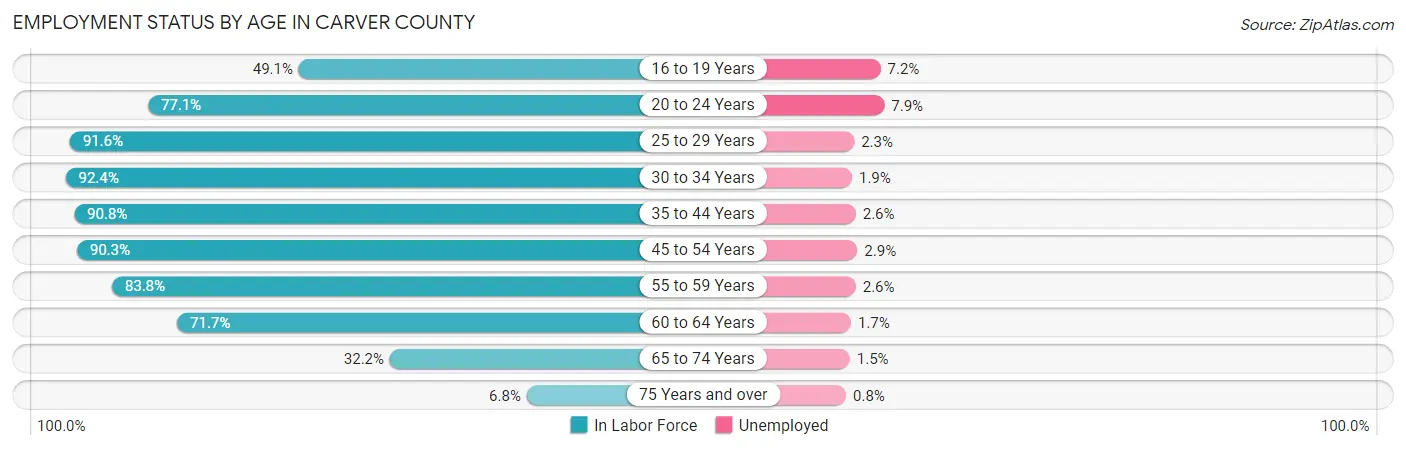
| Age Bracket | In Labor Force | Unemployed |
| 16 to 19 Years | 2,883 (49.1%) | 208 (7.2%) |
| 20 to 24 Years | 4,671 (77.1%) | 369 (7.9%) |
| 25 to 29 Years | 4,597 (91.6%) | 106 (2.3%) |
| 30 to 34 Years | 5,873 (92.4%) | 112 (1.9%) |
| 35 to 44 Years | 14,385 (90.8%) | 374 (2.6%) |
| 45 to 54 Years | 13,465 (90.3%) | 390 (2.9%) |
| 55 to 59 Years | 6,801 (83.8%) | 177 (2.6%) |
| 60 to 64 Years | 4,592 (71.7%) | 78 (1.7%) |
| 65 to 74 Years | 2,769 (32.2%) | 42 (1.5%) |
| 75 Years and over | 378 (6.8%) | 3 (0.8%) |
| Total | 60,394 (73.0%) | 1,872 (3.1%) |
Employment Status by Educational Attainment in Carver County
According to labor force statistics for Carver County, 87.8% of individuals (49,737) out of the total population between 25 and 64 years of age (56,648) are in the labor force, with 2.5% or 1,243 of them being unemployed. The group with the highest labor force participation rate are those with the educational attainment of bachelor's degree or higher, with 90.2% or 27,162 individuals in the labor force. Within the labor force, individuals with high school diploma education have the highest percentage of unemployment, with 5.1% or 360 of them being unemployed.
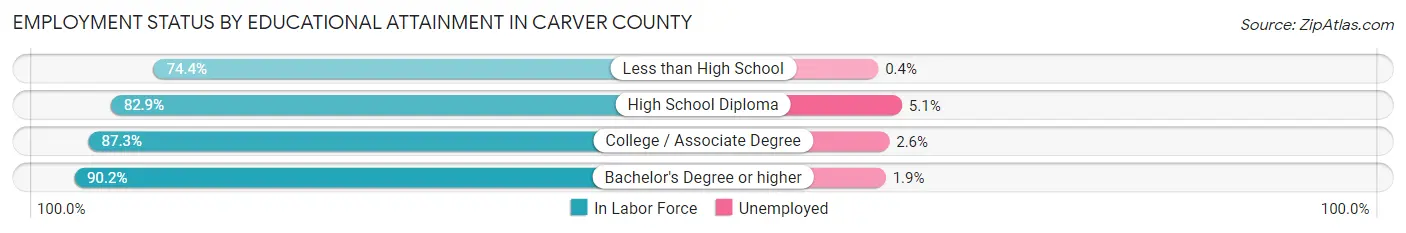
| Educational Attainment | In Labor Force | Unemployed |
| Less than High School | 1,437 (74.4%) | 8 (0.4%) |
| High School Diploma | 7,053 (82.9%) | 434 (5.1%) |
| College / Associate Degree | 14,052 (87.3%) | 418 (2.6%) |
| Bachelor's Degree or higher | 27,162 (90.2%) | 572 (1.9%) |
| Total | 49,737 (87.8%) | 1,416 (2.5%) |
Employment Occupations by Sex in Carver County
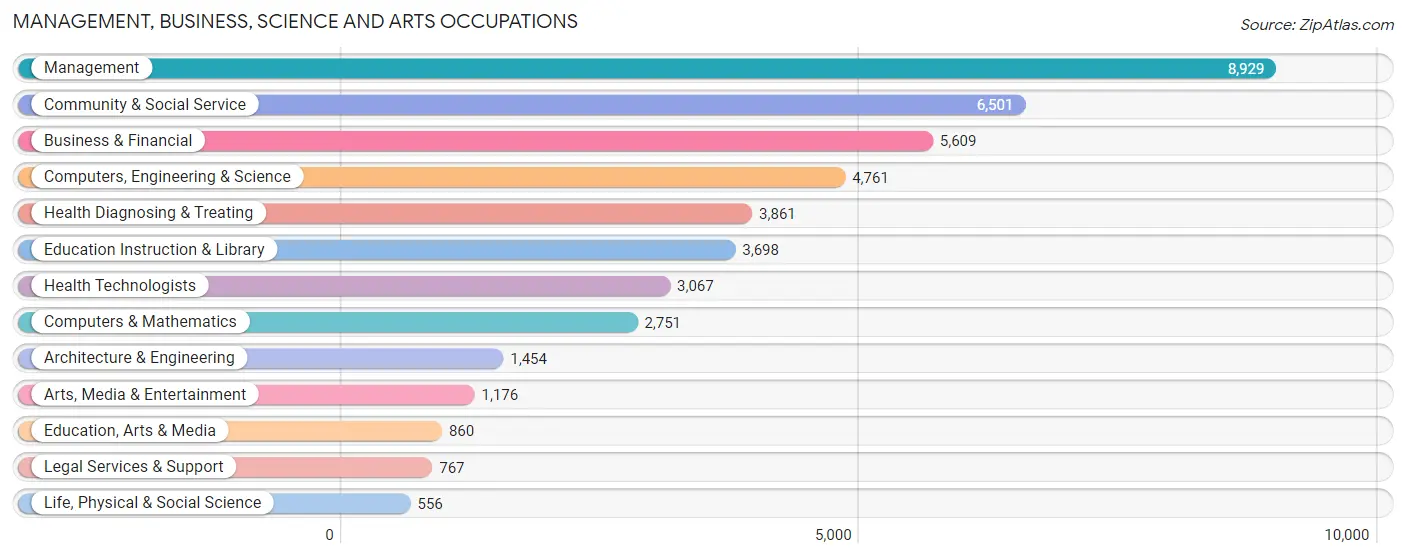
Management, Business, Science and Arts Occupations
The most common Management, Business, Science and Arts occupations in Carver County are Management (8,929 | 15.2%), Community & Social Service (6,501 | 11.1%), Business & Financial (5,609 | 9.6%), Computers, Engineering & Science (4,761 | 8.1%), and Health Diagnosing & Treating (3,861 | 6.6%).
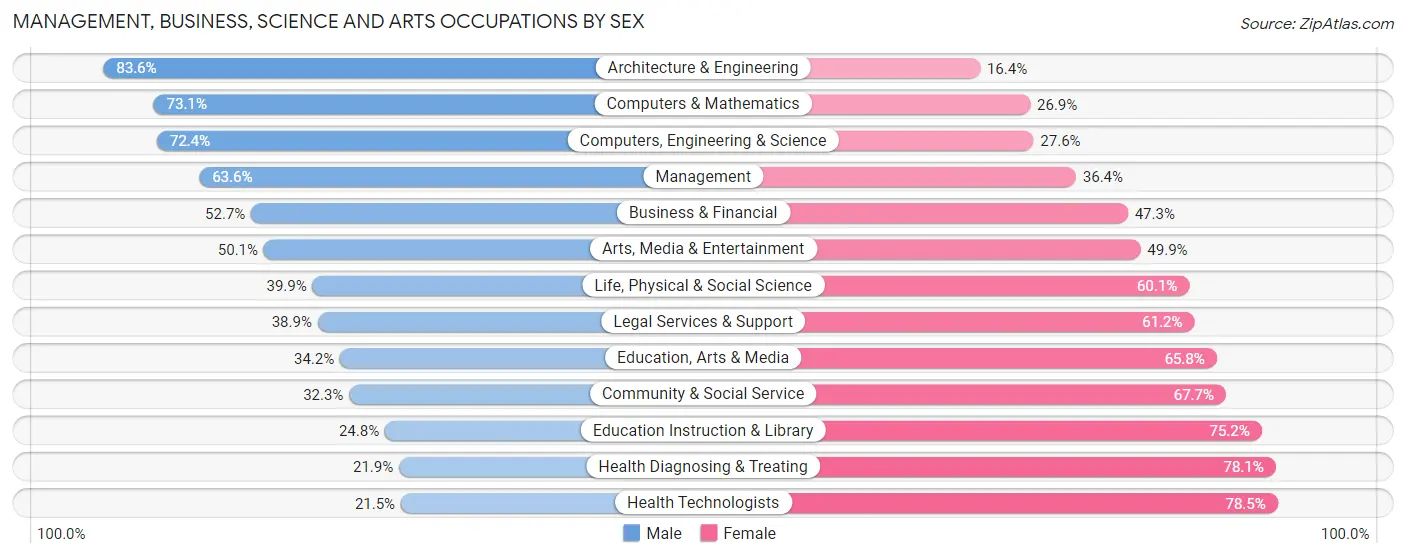
Management, Business, Science and Arts Occupations by Sex
Within the Management, Business, Science and Arts occupations in Carver County, the most male-oriented occupations are Architecture & Engineering (83.6%), Computers & Mathematics (73.1%), and Computers, Engineering & Science (72.4%), while the most female-oriented occupations are Health Technologists (78.5%), Health Diagnosing & Treating (78.1%), and Education Instruction & Library (75.2%).
| Occupation | Male | Female |
| Management | 5,675 (63.6%) | 3,254 (36.4%) |
| Business & Financial | 2,958 (52.7%) | 2,651 (47.3%) |
| Computers, Engineering & Science | 3,448 (72.4%) | 1,313 (27.6%) |
| Computers & Mathematics | 2,011 (73.1%) | 740 (26.9%) |
| Architecture & Engineering | 1,215 (83.6%) | 239 (16.4%) |
| Life, Physical & Social Science | 222 (39.9%) | 334 (60.1%) |
| Community & Social Service | 2,099 (32.3%) | 4,402 (67.7%) |
| Education, Arts & Media | 294 (34.2%) | 566 (65.8%) |
| Legal Services & Support | 298 (38.9%) | 469 (61.2%) |
| Education Instruction & Library | 918 (24.8%) | 2,780 (75.2%) |
| Arts, Media & Entertainment | 589 (50.1%) | 587 (49.9%) |
| Health Diagnosing & Treating | 845 (21.9%) | 3,016 (78.1%) |
| Health Technologists | 659 (21.5%) | 2,408 (78.5%) |
| Total (Category) | 15,025 (50.7%) | 14,636 (49.3%) |
| Total (Overall) | 31,247 (53.4%) | 27,294 (46.6%) |
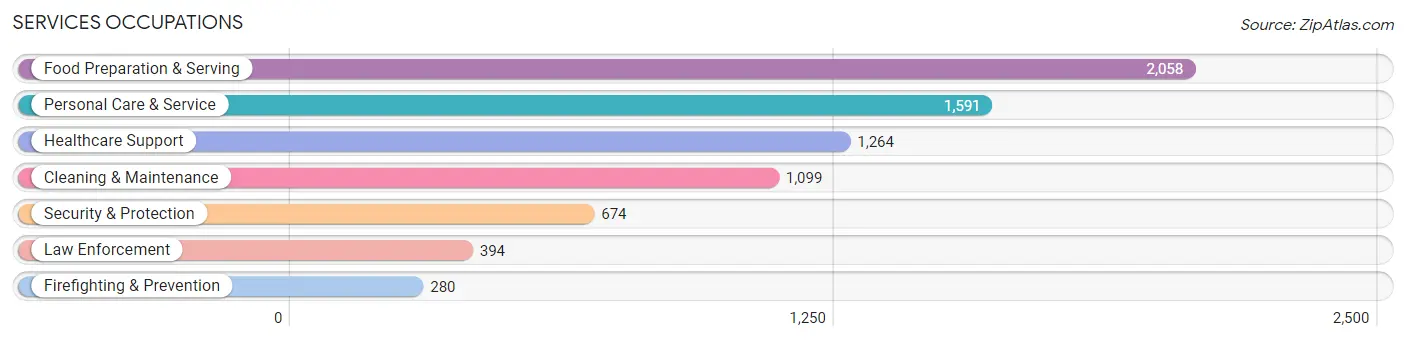
Services Occupations
The most common Services occupations in Carver County are Food Preparation & Serving (2,058 | 3.5%), Personal Care & Service (1,591 | 2.7%), Healthcare Support (1,264 | 2.2%), Cleaning & Maintenance (1,099 | 1.9%), and Security & Protection (674 | 1.1%).
Services Occupations by Sex
Within the Services occupations in Carver County, the most male-oriented occupations are Law Enforcement (82.2%), Cleaning & Maintenance (71.4%), and Security & Protection (68.8%), while the most female-oriented occupations are Healthcare Support (83.8%), Personal Care & Service (81.2%), and Food Preparation & Serving (63.8%).
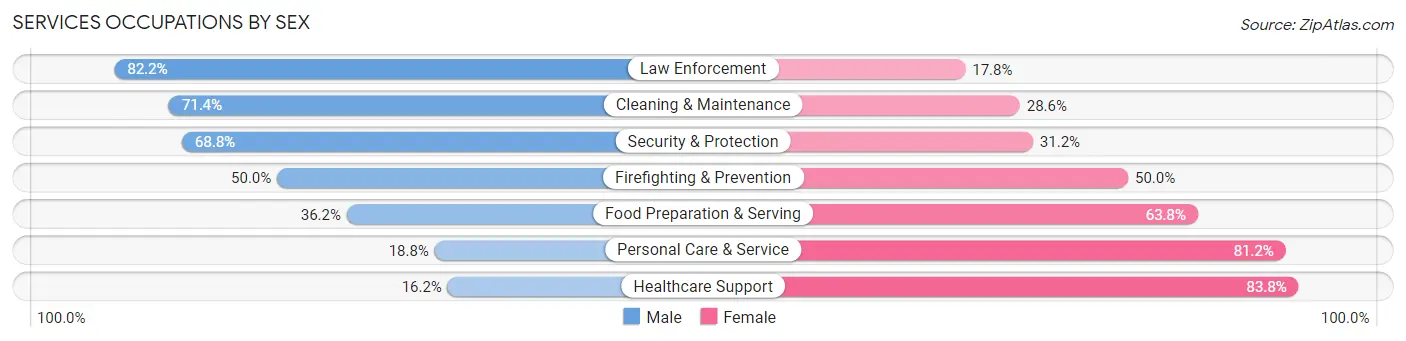
| Occupation | Male | Female |
| Healthcare Support | 205 (16.2%) | 1,059 (83.8%) |
| Security & Protection | 464 (68.8%) | 210 (31.2%) |
| Firefighting & Prevention | 140 (50.0%) | 140 (50.0%) |
| Law Enforcement | 324 (82.2%) | 70 (17.8%) |
| Food Preparation & Serving | 745 (36.2%) | 1,313 (63.8%) |
| Cleaning & Maintenance | 785 (71.4%) | 314 (28.6%) |
| Personal Care & Service | 299 (18.8%) | 1,292 (81.2%) |
| Total (Category) | 2,498 (37.4%) | 4,188 (62.6%) |
| Total (Overall) | 31,247 (53.4%) | 27,294 (46.6%) |
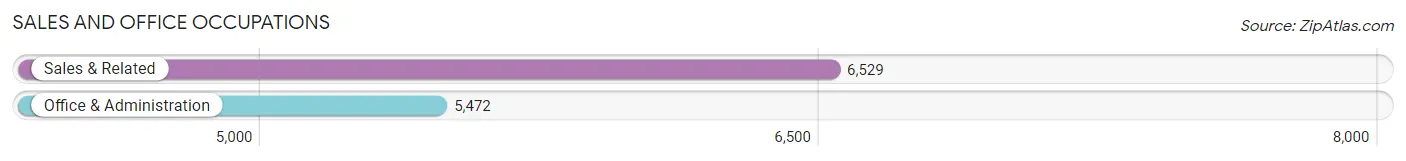
Sales and Office Occupations
The most common Sales and Office occupations in Carver County are Sales & Related (6,529 | 11.2%), and Office & Administration (5,472 | 9.3%).
Sales and Office Occupations by Sex
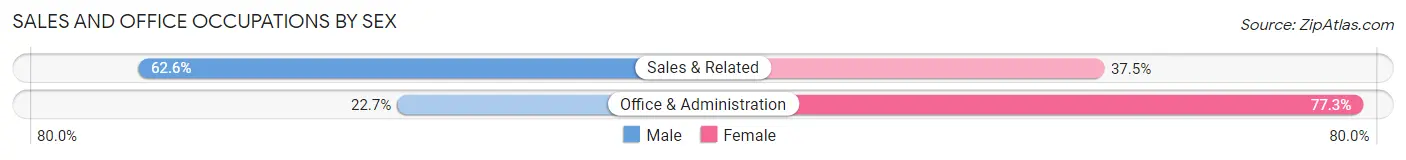
| Occupation | Male | Female |
| Sales & Related | 4,084 (62.5%) | 2,445 (37.4%) |
| Office & Administration | 1,242 (22.7%) | 4,230 (77.3%) |
| Total (Category) | 5,326 (44.4%) | 6,675 (55.6%) |
| Total (Overall) | 31,247 (53.4%) | 27,294 (46.6%) |
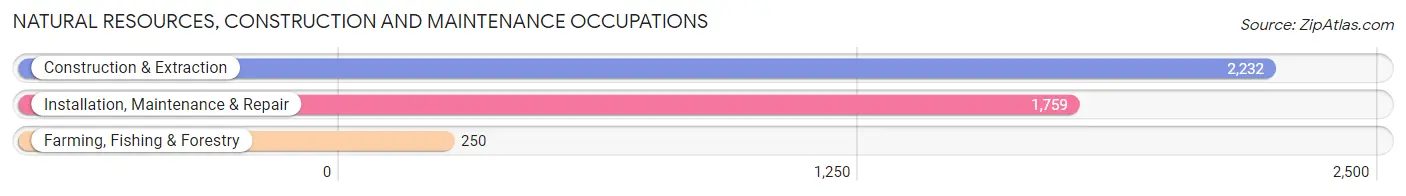
Natural Resources, Construction and Maintenance Occupations
The most common Natural Resources, Construction and Maintenance occupations in Carver County are Construction & Extraction (2,232 | 3.8%), Installation, Maintenance & Repair (1,759 | 3.0%), and Farming, Fishing & Forestry (250 | 0.4%).
Natural Resources, Construction and Maintenance Occupations by Sex
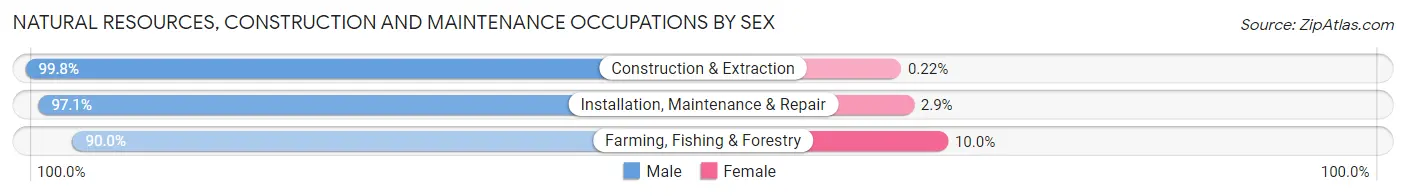
| Occupation | Male | Female |
| Farming, Fishing & Forestry | 225 (90.0%) | 25 (10.0%) |
| Construction & Extraction | 2,227 (99.8%) | 5 (0.2%) |
| Installation, Maintenance & Repair | 1,708 (97.1%) | 51 (2.9%) |
| Total (Category) | 4,160 (98.1%) | 81 (1.9%) |
| Total (Overall) | 31,247 (53.4%) | 27,294 (46.6%) |
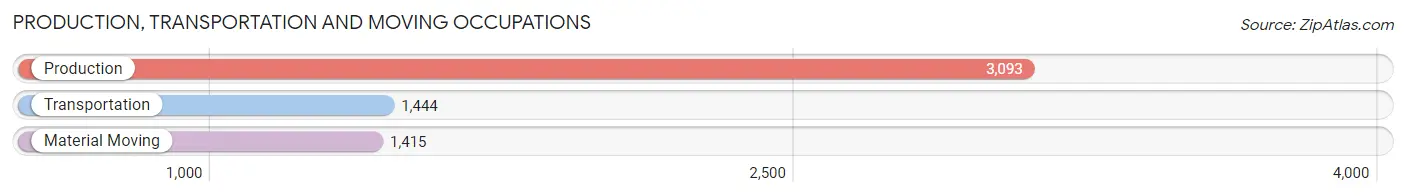
Production, Transportation and Moving Occupations
The most common Production, Transportation and Moving occupations in Carver County are Production (3,093 | 5.3%), Transportation (1,444 | 2.5%), and Material Moving (1,415 | 2.4%).
Production, Transportation and Moving Occupations by Sex
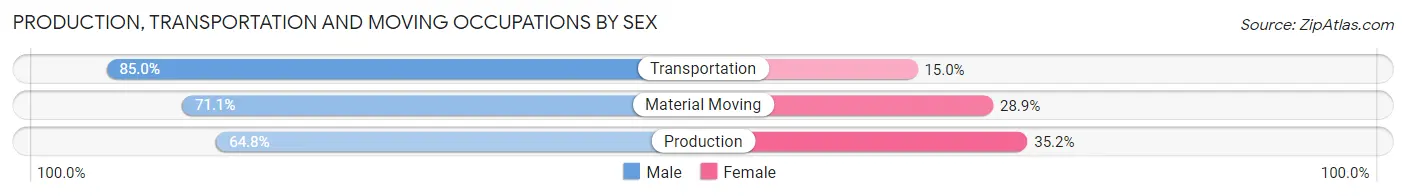
| Occupation | Male | Female |
| Production | 2,005 (64.8%) | 1,088 (35.2%) |
| Transportation | 1,227 (85.0%) | 217 (15.0%) |
| Material Moving | 1,006 (71.1%) | 409 (28.9%) |
| Total (Category) | 4,238 (71.2%) | 1,714 (28.8%) |
| Total (Overall) | 31,247 (53.4%) | 27,294 (46.6%) |
Employment Industries by Sex in Carver County
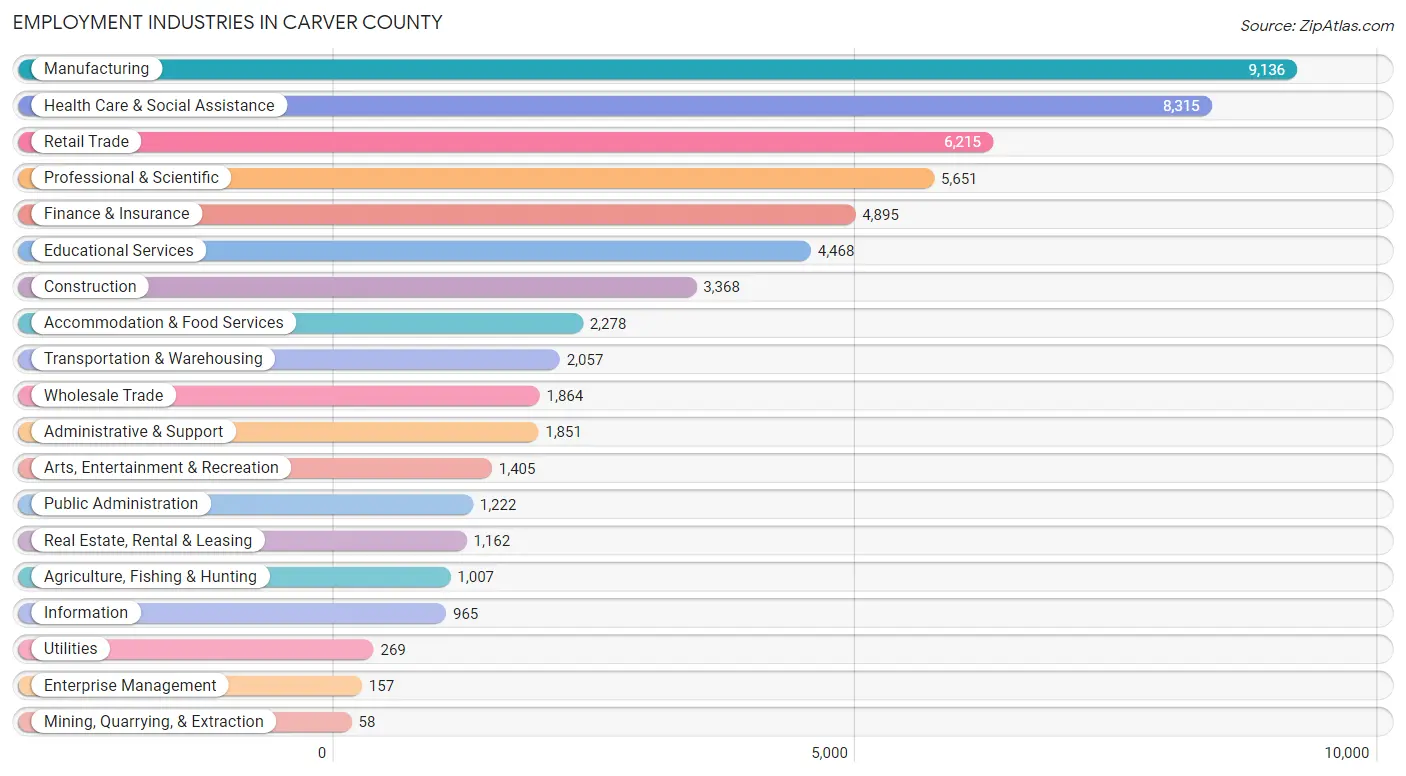
Employment Industries in Carver County
The major employment industries in Carver County include Manufacturing (9,136 | 15.6%), Health Care & Social Assistance (8,315 | 14.2%), Retail Trade (6,215 | 10.6%), Professional & Scientific (5,651 | 9.7%), and Finance & Insurance (4,895 | 8.4%).
Employment Industries by Sex in Carver County
The Carver County industries that see more men than women are Mining, Quarrying, & Extraction (100.0%), Construction (94.6%), and Wholesale Trade (75.8%), whereas the industries that tend to have a higher number of women are Health Care & Social Assistance (76.4%), Educational Services (71.4%), and Accommodation & Food Services (63.0%).
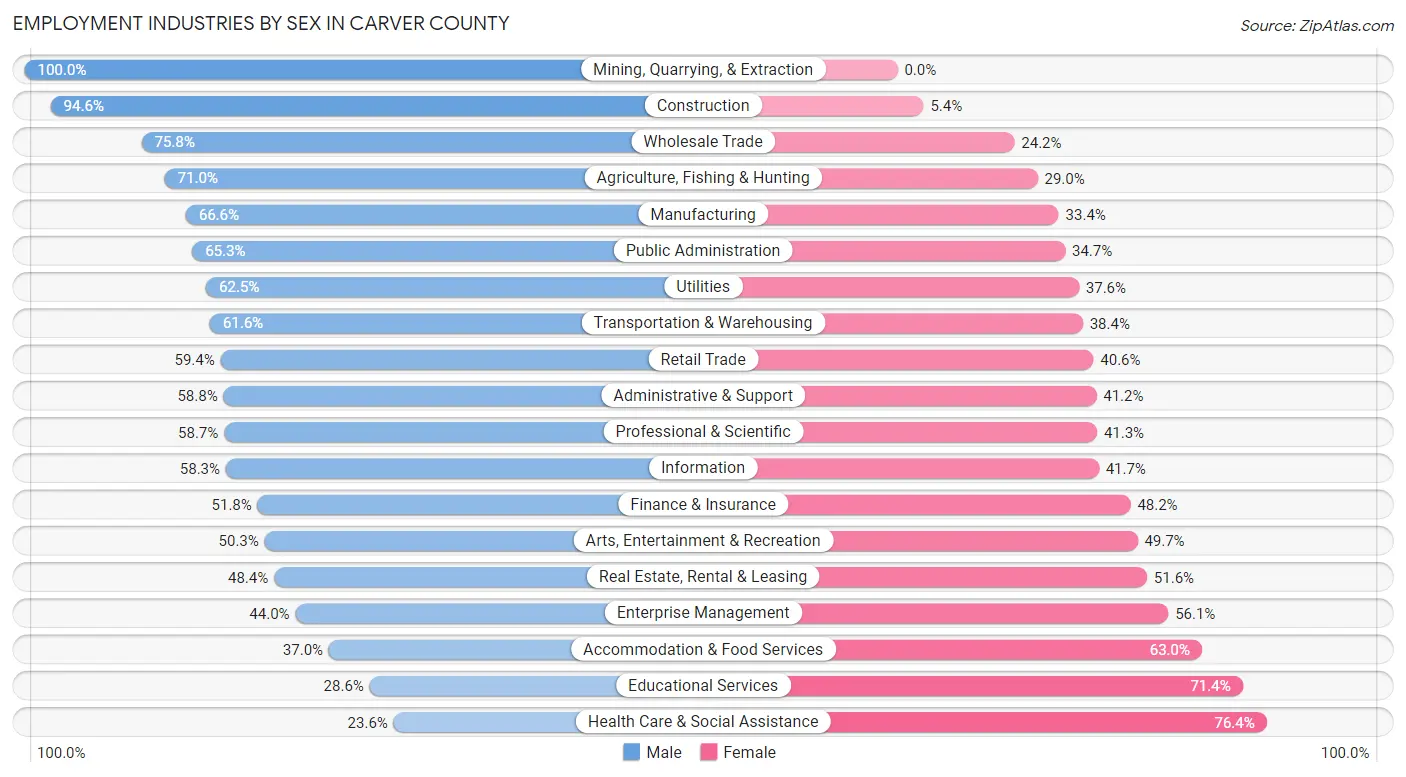
| Industry | Male | Female |
| Agriculture, Fishing & Hunting | 715 (71.0%) | 292 (29.0%) |
| Mining, Quarrying, & Extraction | 58 (100.0%) | 0 (0.0%) |
| Construction | 3,186 (94.6%) | 182 (5.4%) |
| Manufacturing | 6,087 (66.6%) | 3,049 (33.4%) |
| Wholesale Trade | 1,413 (75.8%) | 451 (24.2%) |
| Retail Trade | 3,694 (59.4%) | 2,521 (40.6%) |
| Transportation & Warehousing | 1,268 (61.6%) | 789 (38.4%) |
| Utilities | 168 (62.5%) | 101 (37.6%) |
| Information | 563 (58.3%) | 402 (41.7%) |
| Finance & Insurance | 2,534 (51.8%) | 2,361 (48.2%) |
| Real Estate, Rental & Leasing | 562 (48.4%) | 600 (51.6%) |
| Professional & Scientific | 3,317 (58.7%) | 2,334 (41.3%) |
| Enterprise Management | 69 (44.0%) | 88 (56.0%) |
| Administrative & Support | 1,089 (58.8%) | 762 (41.2%) |
| Educational Services | 1,277 (28.6%) | 3,191 (71.4%) |
| Health Care & Social Assistance | 1,963 (23.6%) | 6,352 (76.4%) |
| Arts, Entertainment & Recreation | 707 (50.3%) | 698 (49.7%) |
| Accommodation & Food Services | 843 (37.0%) | 1,435 (63.0%) |
| Public Administration | 798 (65.3%) | 424 (34.7%) |
| Total | 31,247 (53.4%) | 27,294 (46.6%) |
Education in Carver County
School Enrollment in Carver County
The most common levels of schooling among the 28,624 students in Carver County are high school (7,151 | 25.0%), elementary school (6,887 | 24.1%), and middle school (5,972 | 20.9%).
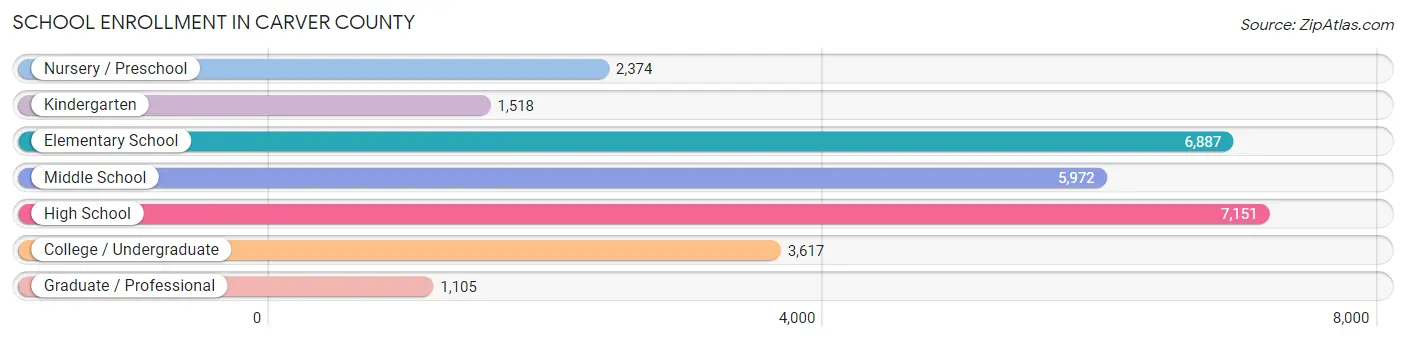
| School Level | # Students | % Students |
| Nursery / Preschool | 2,374 | 8.3% |
| Kindergarten | 1,518 | 5.3% |
| Elementary School | 6,887 | 24.1% |
| Middle School | 5,972 | 20.9% |
| High School | 7,151 | 25.0% |
| College / Undergraduate | 3,617 | 12.6% |
| Graduate / Professional | 1,105 | 3.9% |
| Total | 28,624 | 100.0% |
School Enrollment by Age by Funding Source in Carver County
Out of a total of 28,624 students who are enrolled in schools in Carver County, 5,381 (18.8%) attend a private institution, while the remaining 23,243 (81.2%) are enrolled in public schools. The age group of 20 to 24 year olds has the highest likelihood of being enrolled in private schools, with 909 (41.1% in the age bracket) enrolled. Conversely, the age group of 15 to 17 year olds has the lowest likelihood of being enrolled in a private school, with 4,304 (88.6% in the age bracket) attending a public institution.
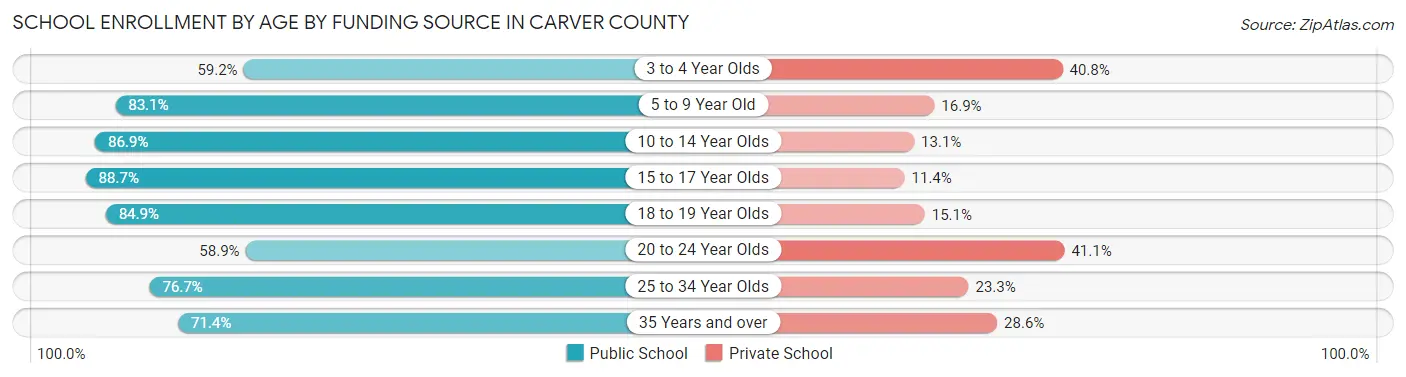
| Age Bracket | Public School | Private School |
| 3 to 4 Year Olds | 1,016 (59.2%) | 699 (40.8%) |
| 5 to 9 Year Old | 6,690 (83.1%) | 1,361 (16.9%) |
| 10 to 14 Year Olds | 6,677 (86.9%) | 1,009 (13.1%) |
| 15 to 17 Year Olds | 4,304 (88.6%) | 551 (11.4%) |
| 18 to 19 Year Olds | 1,758 (84.9%) | 313 (15.1%) |
| 20 to 24 Year Olds | 1,301 (58.9%) | 909 (41.1%) |
| 25 to 34 Year Olds | 792 (76.7%) | 240 (23.3%) |
| 35 Years and over | 717 (71.4%) | 287 (28.6%) |
| Total | 23,243 (81.2%) | 5,381 (18.8%) |
Educational Attainment by Field of Study in Carver County
Business (9,320 | 24.0%), education (4,694 | 12.1%), science & technology (3,487 | 9.0%), engineering (3,117 | 8.0%), and social sciences (2,552 | 6.6%) are the most common fields of study among 38,778 individuals in Carver County who have obtained a bachelor's degree or higher.
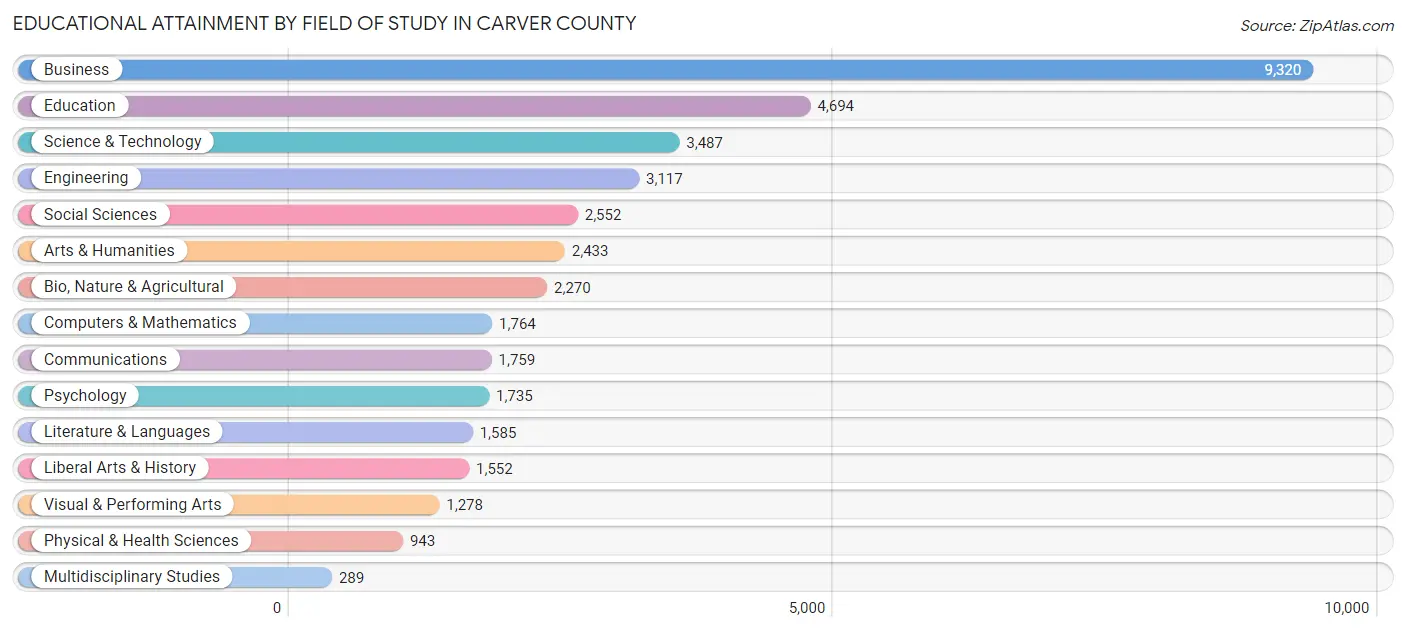
| Field of Study | # Graduates | % Graduates |
| Computers & Mathematics | 1,764 | 4.5% |
| Bio, Nature & Agricultural | 2,270 | 5.9% |
| Physical & Health Sciences | 943 | 2.4% |
| Psychology | 1,735 | 4.5% |
| Social Sciences | 2,552 | 6.6% |
| Engineering | 3,117 | 8.0% |
| Multidisciplinary Studies | 289 | 0.7% |
| Science & Technology | 3,487 | 9.0% |
| Business | 9,320 | 24.0% |
| Education | 4,694 | 12.1% |
| Literature & Languages | 1,585 | 4.1% |
| Liberal Arts & History | 1,552 | 4.0% |
| Visual & Performing Arts | 1,278 | 3.3% |
| Communications | 1,759 | 4.5% |
| Arts & Humanities | 2,433 | 6.3% |
| Total | 38,778 | 100.0% |
Transportation & Commute in Carver County
Vehicle Availability by Sex in Carver County
The most prevalent vehicle ownership categories in Carver County are males with 2 vehicles (14,983, accounting for 48.4%) and females with 2 vehicles (11,996, making up 56.0%).
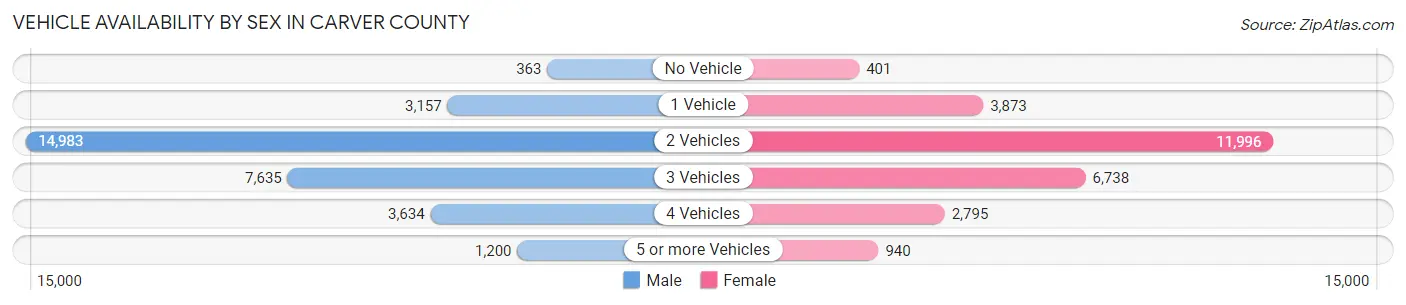
| Vehicles Available | Male | Female |
| No Vehicle | 363 (1.2%) | 401 (1.5%) |
| 1 Vehicle | 3,157 (10.2%) | 3,873 (14.5%) |
| 2 Vehicles | 14,983 (48.4%) | 11,996 (44.9%) |
| 3 Vehicles | 7,635 (24.6%) | 6,738 (25.2%) |
| 4 Vehicles | 3,634 (11.7%) | 2,795 (10.4%) |
| 5 or more Vehicles | 1,200 (3.9%) | 940 (3.5%) |
| Total | 30,972 (100.0%) | 26,743 (100.0%) |
Commute Time in Carver County
The most frequently occuring commute durations in Carver County are 30 to 34 minutes (7,048 commuters, 14.9%), 15 to 19 minutes (6,739 commuters, 14.3%), and 20 to 24 minutes (6,729 commuters, 14.3%).
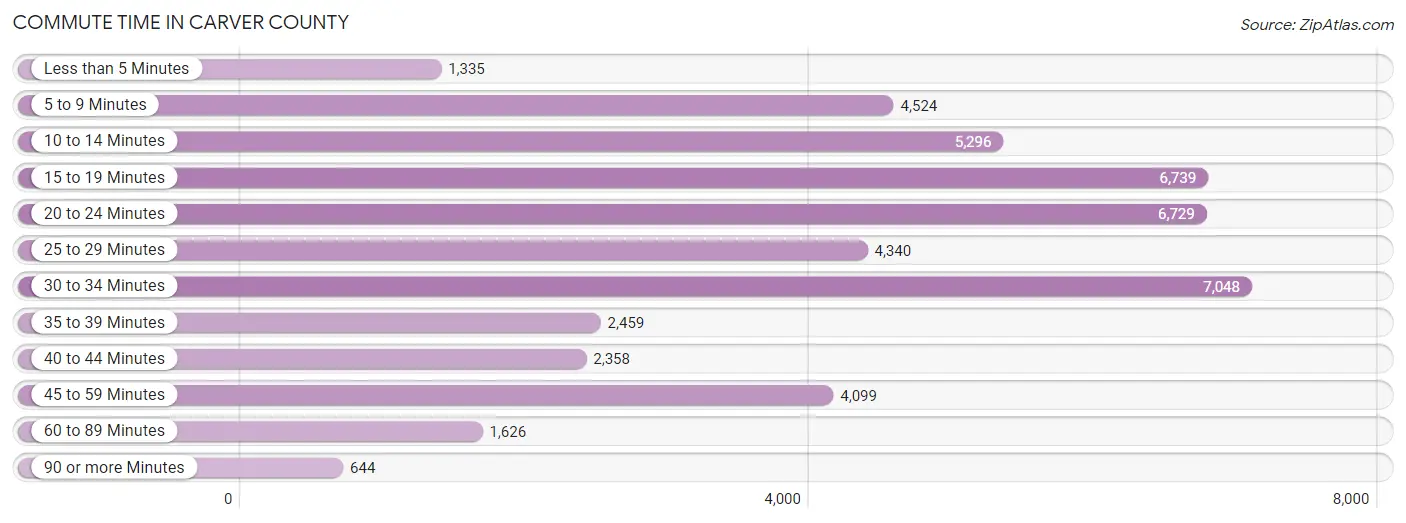
| Commute Time | # Commuters | % Commuters |
| Less than 5 Minutes | 1,335 | 2.8% |
| 5 to 9 Minutes | 4,524 | 9.6% |
| 10 to 14 Minutes | 5,296 | 11.2% |
| 15 to 19 Minutes | 6,739 | 14.3% |
| 20 to 24 Minutes | 6,729 | 14.3% |
| 25 to 29 Minutes | 4,340 | 9.2% |
| 30 to 34 Minutes | 7,048 | 14.9% |
| 35 to 39 Minutes | 2,459 | 5.2% |
| 40 to 44 Minutes | 2,358 | 5.0% |
| 45 to 59 Minutes | 4,099 | 8.7% |
| 60 to 89 Minutes | 1,626 | 3.5% |
| 90 or more Minutes | 644 | 1.4% |
Commute Time by Sex in Carver County
The most common commute times in Carver County are 30 to 34 minutes (4,217 commuters, 16.3%) for males and 15 to 19 minutes (3,364 commuters, 15.7%) for females.
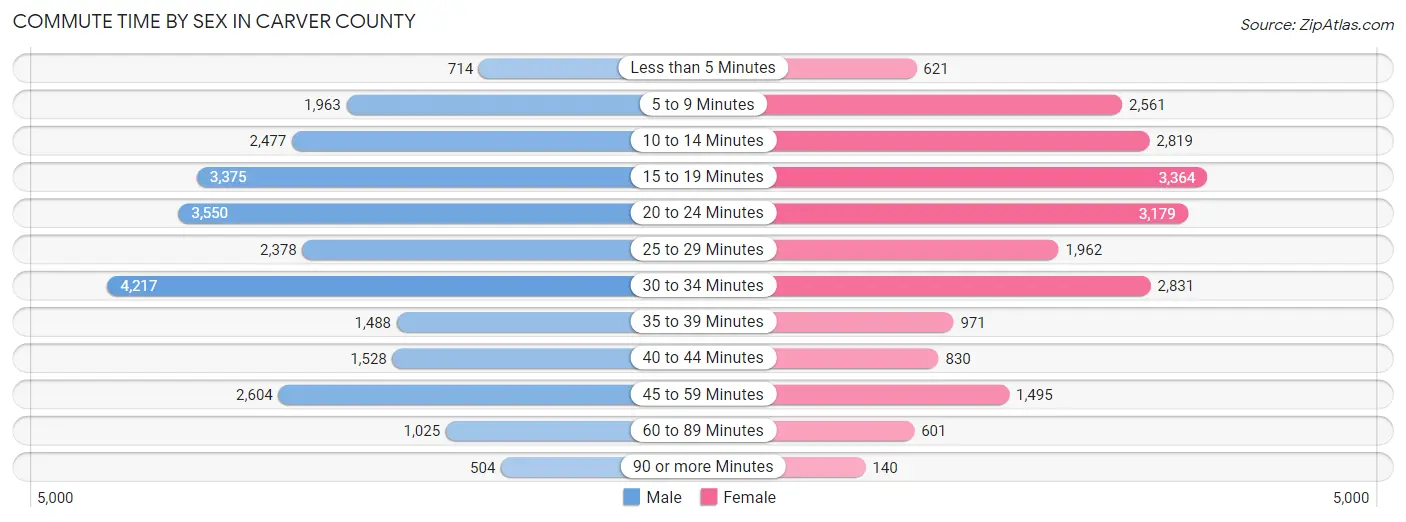
| Commute Time | Male | Female |
| Less than 5 Minutes | 714 (2.8%) | 621 (2.9%) |
| 5 to 9 Minutes | 1,963 (7.6%) | 2,561 (12.0%) |
| 10 to 14 Minutes | 2,477 (9.6%) | 2,819 (13.2%) |
| 15 to 19 Minutes | 3,375 (13.1%) | 3,364 (15.7%) |
| 20 to 24 Minutes | 3,550 (13.8%) | 3,179 (14.9%) |
| 25 to 29 Minutes | 2,378 (9.2%) | 1,962 (9.2%) |
| 30 to 34 Minutes | 4,217 (16.3%) | 2,831 (13.3%) |
| 35 to 39 Minutes | 1,488 (5.8%) | 971 (4.5%) |
| 40 to 44 Minutes | 1,528 (5.9%) | 830 (3.9%) |
| 45 to 59 Minutes | 2,604 (10.1%) | 1,495 (7.0%) |
| 60 to 89 Minutes | 1,025 (4.0%) | 601 (2.8%) |
| 90 or more Minutes | 504 (1.9%) | 140 (0.7%) |
Time of Departure to Work by Sex in Carver County
The most frequent times of departure to work in Carver County are 7:00 AM to 7:29 AM (4,046, 15.7%) for males and 7:00 AM to 7:29 AM (3,720, 17.4%) for females.
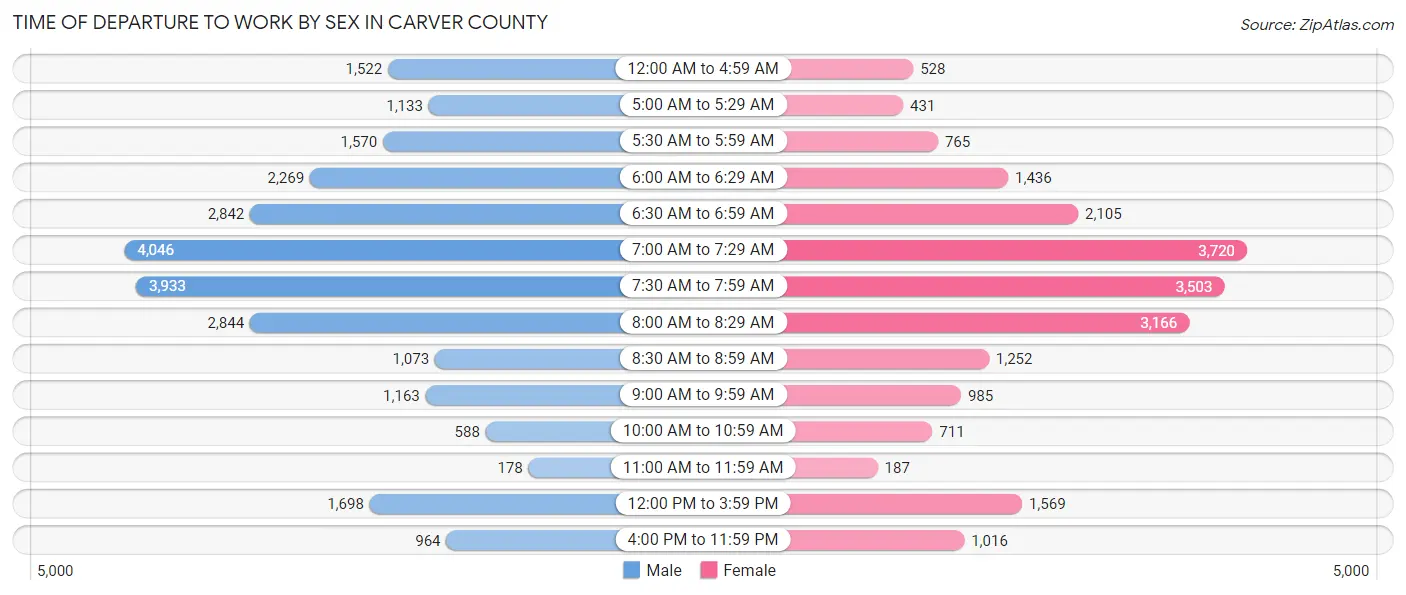
| Time of Departure | Male | Female |
| 12:00 AM to 4:59 AM | 1,522 (5.9%) | 528 (2.5%) |
| 5:00 AM to 5:29 AM | 1,133 (4.4%) | 431 (2.0%) |
| 5:30 AM to 5:59 AM | 1,570 (6.1%) | 765 (3.6%) |
| 6:00 AM to 6:29 AM | 2,269 (8.8%) | 1,436 (6.7%) |
| 6:30 AM to 6:59 AM | 2,842 (11.0%) | 2,105 (9.9%) |
| 7:00 AM to 7:29 AM | 4,046 (15.7%) | 3,720 (17.4%) |
| 7:30 AM to 7:59 AM | 3,933 (15.2%) | 3,503 (16.4%) |
| 8:00 AM to 8:29 AM | 2,844 (11.0%) | 3,166 (14.8%) |
| 8:30 AM to 8:59 AM | 1,073 (4.2%) | 1,252 (5.9%) |
| 9:00 AM to 9:59 AM | 1,163 (4.5%) | 985 (4.6%) |
| 10:00 AM to 10:59 AM | 588 (2.3%) | 711 (3.3%) |
| 11:00 AM to 11:59 AM | 178 (0.7%) | 187 (0.9%) |
| 12:00 PM to 3:59 PM | 1,698 (6.6%) | 1,569 (7.3%) |
| 4:00 PM to 11:59 PM | 964 (3.7%) | 1,016 (4.8%) |
| Total | 25,823 (100.0%) | 21,374 (100.0%) |
Housing Occupancy in Carver County
Occupancy by Ownership in Carver County
Of the total 39,293 dwellings in Carver County, owner-occupied units account for 32,215 (82.0%), while renter-occupied units make up 7,078 (18.0%).
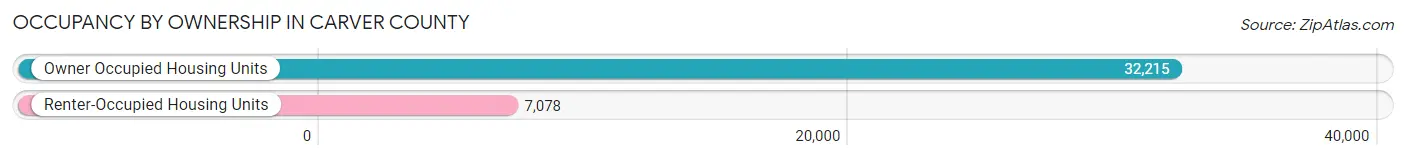
| Occupancy | # Housing Units | % Housing Units |
| Owner Occupied Housing Units | 32,215 | 82.0% |
| Renter-Occupied Housing Units | 7,078 | 18.0% |
| Total Occupied Housing Units | 39,293 | 100.0% |
Occupancy by Household Size in Carver County
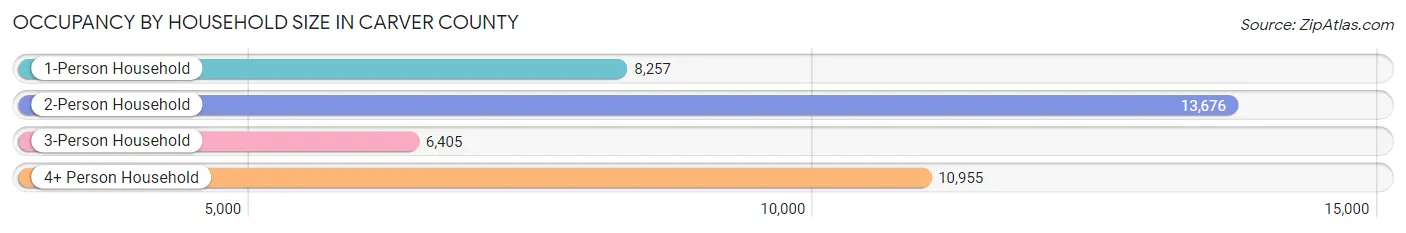
| Household Size | # Housing Units | % Housing Units |
| 1-Person Household | 8,257 | 21.0% |
| 2-Person Household | 13,676 | 34.8% |
| 3-Person Household | 6,405 | 16.3% |
| 4+ Person Household | 10,955 | 27.9% |
| Total Housing Units | 39,293 | 100.0% |
Occupancy by Ownership by Household Size in Carver County
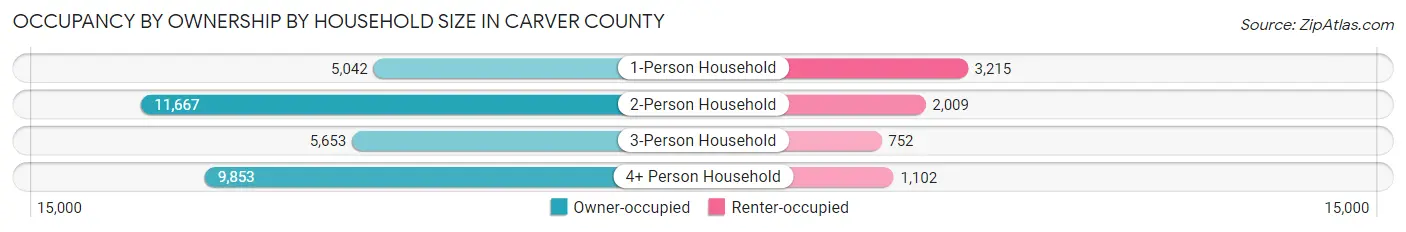
| Household Size | Owner-occupied | Renter-occupied |
| 1-Person Household | 5,042 (61.1%) | 3,215 (38.9%) |
| 2-Person Household | 11,667 (85.3%) | 2,009 (14.7%) |
| 3-Person Household | 5,653 (88.3%) | 752 (11.7%) |
| 4+ Person Household | 9,853 (89.9%) | 1,102 (10.1%) |
| Total Housing Units | 32,215 (82.0%) | 7,078 (18.0%) |
Occupancy by Educational Attainment in Carver County
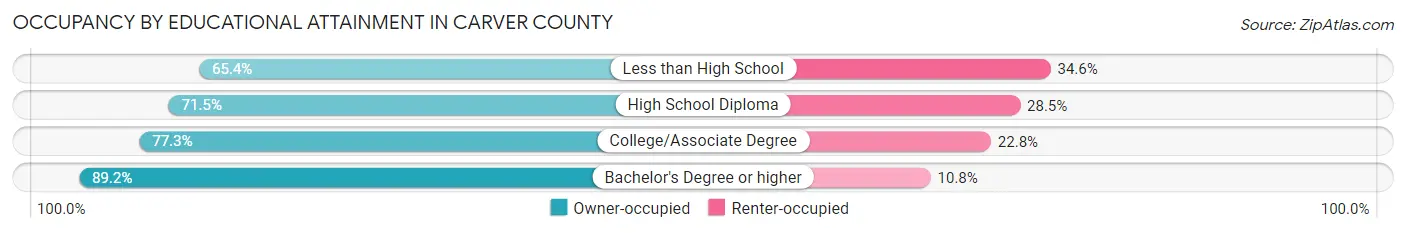
| Household Size | Owner-occupied | Renter-occupied |
| Less than High School | 861 (65.4%) | 455 (34.6%) |
| High School Diploma | 4,501 (71.5%) | 1,798 (28.5%) |
| College/Associate Degree | 9,085 (77.2%) | 2,675 (22.8%) |
| Bachelor's Degree or higher | 17,768 (89.2%) | 2,150 (10.8%) |
Occupancy by Age of Householder in Carver County
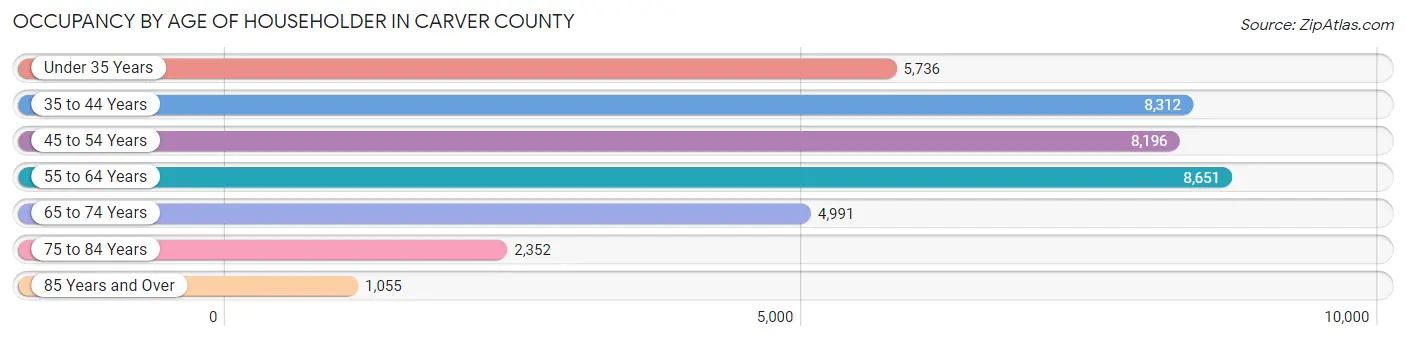
| Age Bracket | # Households | % Households |
| Under 35 Years | 5,736 | 14.6% |
| 35 to 44 Years | 8,312 | 21.1% |
| 45 to 54 Years | 8,196 | 20.9% |
| 55 to 64 Years | 8,651 | 22.0% |
| 65 to 74 Years | 4,991 | 12.7% |
| 75 to 84 Years | 2,352 | 6.0% |
| 85 Years and Over | 1,055 | 2.7% |
| Total | 39,293 | 100.0% |
Housing Finances in Carver County
Median Income by Occupancy in Carver County
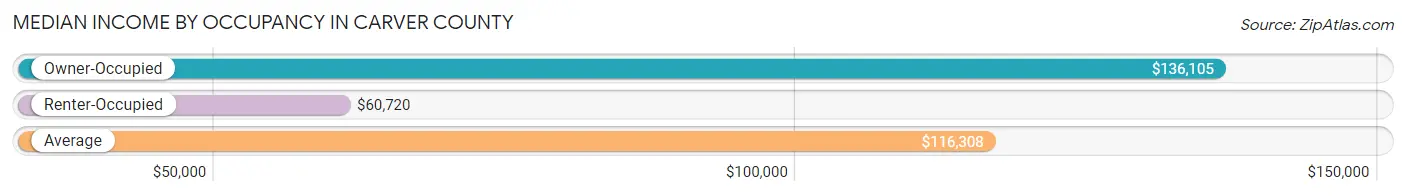
| Occupancy Type | # Households | Median Income |
| Owner-Occupied | 32,215 (82.0%) | $136,105 |
| Renter-Occupied | 7,078 (18.0%) | $60,720 |
| Average | 39,293 (100.0%) | $116,308 |
Occupancy by Householder Income Bracket in Carver County
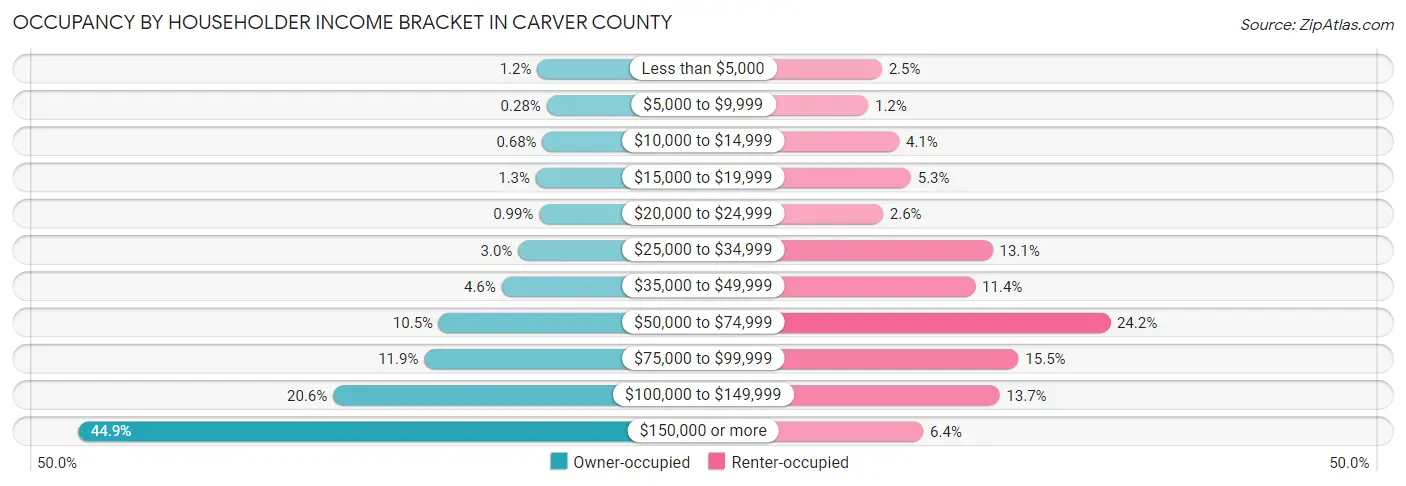
| Income Bracket | Owner-occupied | Renter-occupied |
| Less than $5,000 | 376 (1.2%) | 176 (2.5%) |
| $5,000 to $9,999 | 89 (0.3%) | 84 (1.2%) |
| $10,000 to $14,999 | 218 (0.7%) | 293 (4.1%) |
| $15,000 to $19,999 | 423 (1.3%) | 372 (5.3%) |
| $20,000 to $24,999 | 319 (1.0%) | 184 (2.6%) |
| $25,000 to $34,999 | 962 (3.0%) | 924 (13.1%) |
| $35,000 to $49,999 | 1,473 (4.6%) | 806 (11.4%) |
| $50,000 to $74,999 | 3,394 (10.5%) | 1,715 (24.2%) |
| $75,000 to $99,999 | 3,847 (11.9%) | 1,098 (15.5%) |
| $100,000 to $149,999 | 6,642 (20.6%) | 970 (13.7%) |
| $150,000 or more | 14,472 (44.9%) | 456 (6.4%) |
| Total | 32,215 (100.0%) | 7,078 (100.0%) |
Monthly Housing Cost Tiers in Carver County
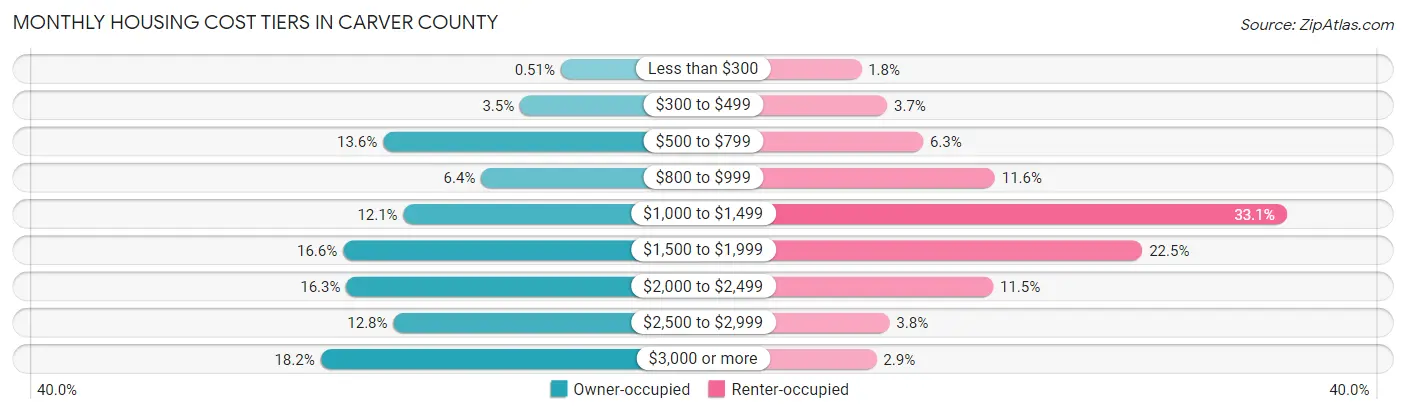
| Monthly Cost | Owner-occupied | Renter-occupied |
| Less than $300 | 164 (0.5%) | 124 (1.8%) |
| $300 to $499 | 1,132 (3.5%) | 259 (3.7%) |
| $500 to $799 | 4,380 (13.6%) | 446 (6.3%) |
| $800 to $999 | 2,053 (6.4%) | 820 (11.6%) |
| $1,000 to $1,499 | 3,897 (12.1%) | 2,341 (33.1%) |
| $1,500 to $1,999 | 5,333 (16.6%) | 1,589 (22.5%) |
| $2,000 to $2,499 | 5,254 (16.3%) | 811 (11.5%) |
| $2,500 to $2,999 | 4,136 (12.8%) | 271 (3.8%) |
| $3,000 or more | 5,866 (18.2%) | 203 (2.9%) |
| Total | 32,215 (100.0%) | 7,078 (100.0%) |
Physical Housing Characteristics in Carver County
Housing Structures in Carver County
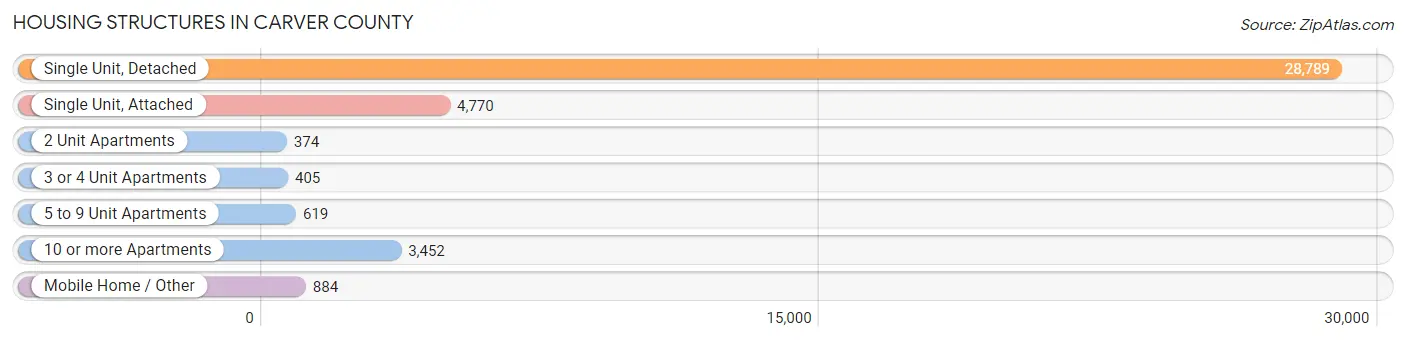
| Structure Type | # Housing Units | % Housing Units |
| Single Unit, Detached | 28,789 | 73.3% |
| Single Unit, Attached | 4,770 | 12.1% |
| 2 Unit Apartments | 374 | 0.9% |
| 3 or 4 Unit Apartments | 405 | 1.0% |
| 5 to 9 Unit Apartments | 619 | 1.6% |
| 10 or more Apartments | 3,452 | 8.8% |
| Mobile Home / Other | 884 | 2.2% |
| Total | 39,293 | 100.0% |
Housing Structures by Occupancy in Carver County
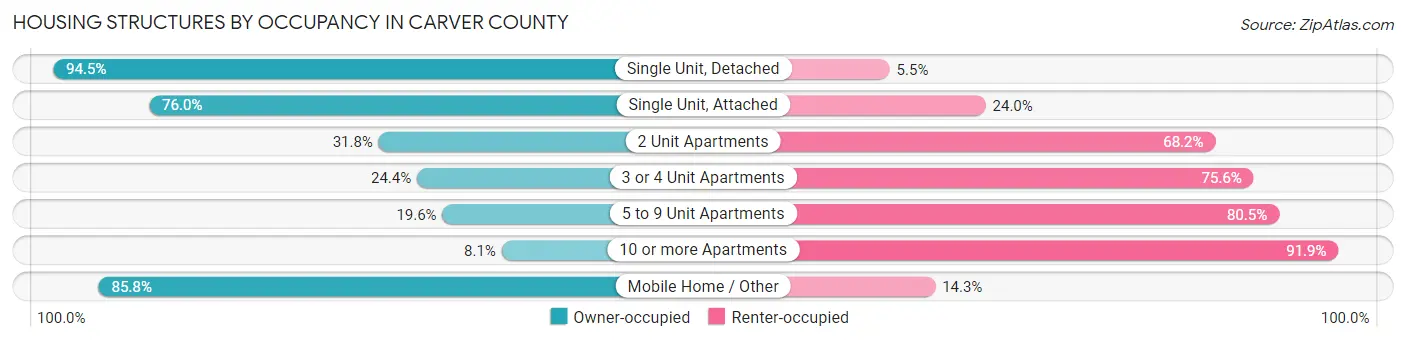
| Structure Type | Owner-occupied | Renter-occupied |
| Single Unit, Detached | 27,210 (94.5%) | 1,579 (5.5%) |
| Single Unit, Attached | 3,627 (76.0%) | 1,143 (24.0%) |
| 2 Unit Apartments | 119 (31.8%) | 255 (68.2%) |
| 3 or 4 Unit Apartments | 99 (24.4%) | 306 (75.6%) |
| 5 to 9 Unit Apartments | 121 (19.6%) | 498 (80.4%) |
| 10 or more Apartments | 281 (8.1%) | 3,171 (91.9%) |
| Mobile Home / Other | 758 (85.8%) | 126 (14.2%) |
| Total | 32,215 (82.0%) | 7,078 (18.0%) |
Housing Structures by Number of Rooms in Carver County
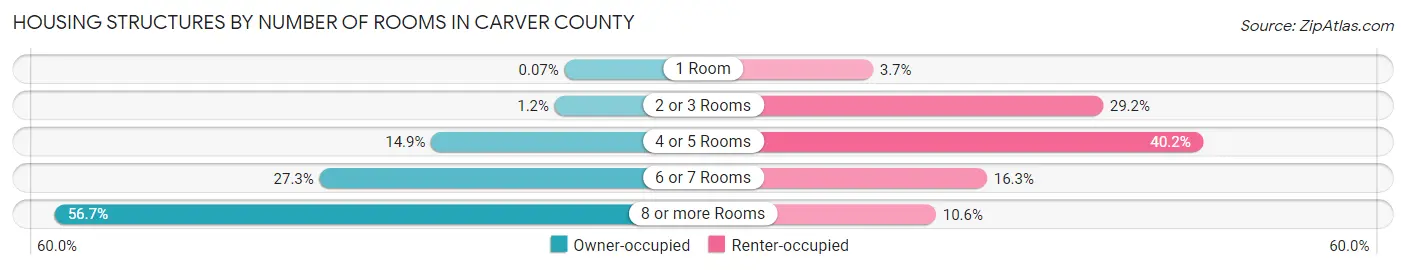
| Number of Rooms | Owner-occupied | Renter-occupied |
| 1 Room | 24 (0.1%) | 258 (3.6%) |
| 2 or 3 Rooms | 371 (1.1%) | 2,065 (29.2%) |
| 4 or 5 Rooms | 4,788 (14.9%) | 2,848 (40.2%) |
| 6 or 7 Rooms | 8,782 (27.3%) | 1,154 (16.3%) |
| 8 or more Rooms | 18,250 (56.7%) | 753 (10.6%) |
| Total | 32,215 (100.0%) | 7,078 (100.0%) |
Housing Structure by Heating Type in Carver County
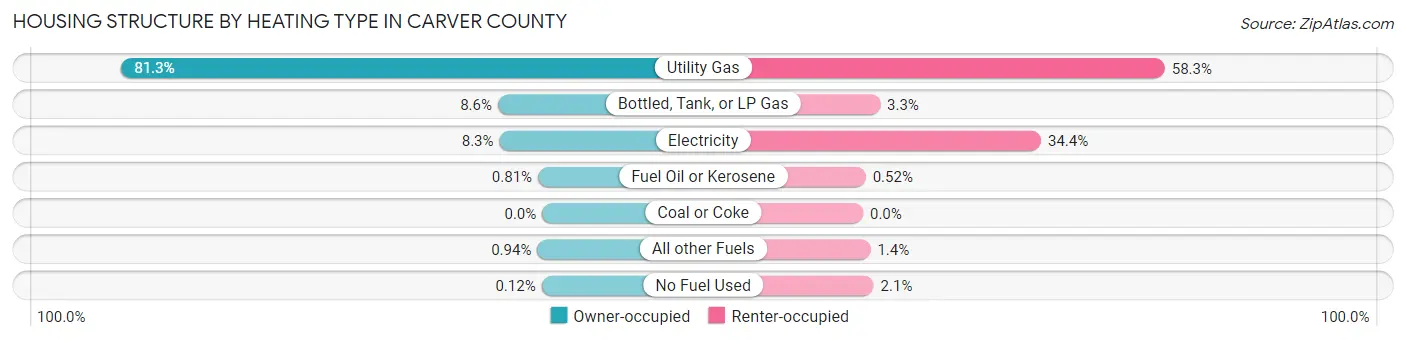
| Heating Type | Owner-occupied | Renter-occupied |
| Utility Gas | 26,195 (81.3%) | 4,127 (58.3%) |
| Bottled, Tank, or LP Gas | 2,757 (8.6%) | 233 (3.3%) |
| Electricity | 2,660 (8.3%) | 2,435 (34.4%) |
| Fuel Oil or Kerosene | 260 (0.8%) | 37 (0.5%) |
| Coal or Coke | 0 (0.0%) | 0 (0.0%) |
| All other Fuels | 304 (0.9%) | 101 (1.4%) |
| No Fuel Used | 39 (0.1%) | 145 (2.1%) |
| Total | 32,215 (100.0%) | 7,078 (100.0%) |
Household Vehicle Usage in Carver County
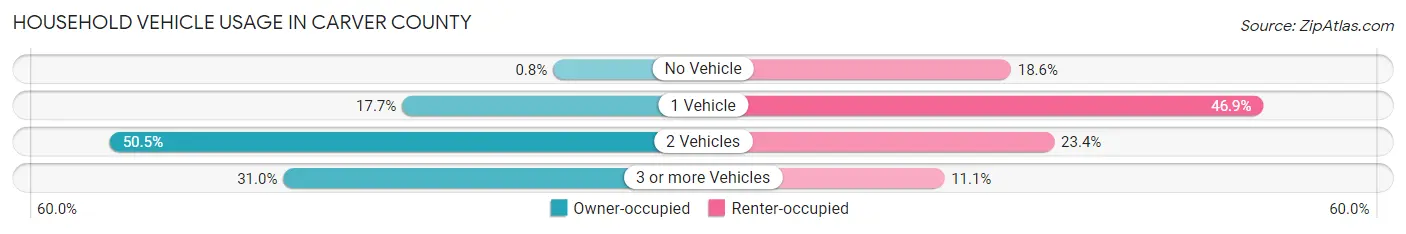
| Vehicles per Household | Owner-occupied | Renter-occupied |
| No Vehicle | 258 (0.8%) | 1,315 (18.6%) |
| 1 Vehicle | 5,705 (17.7%) | 3,317 (46.9%) |
| 2 Vehicles | 16,255 (50.5%) | 1,659 (23.4%) |
| 3 or more Vehicles | 9,997 (31.0%) | 787 (11.1%) |
| Total | 32,215 (100.0%) | 7,078 (100.0%) |
Real Estate & Mortgages in Carver County
Real Estate and Mortgage Overview in Carver County
| Characteristic | Without Mortgage | With Mortgage |
| Housing Units | 8,906 | 23,309 |
| Median Property Value | $358,000 | $418,400 |
| Median Household Income | $86,773 | $11,871 |
| Monthly Housing Costs | $751 | $5,789 |
| Real Estate Taxes | $3,795 | $107 |
Property Value by Mortgage Status in Carver County
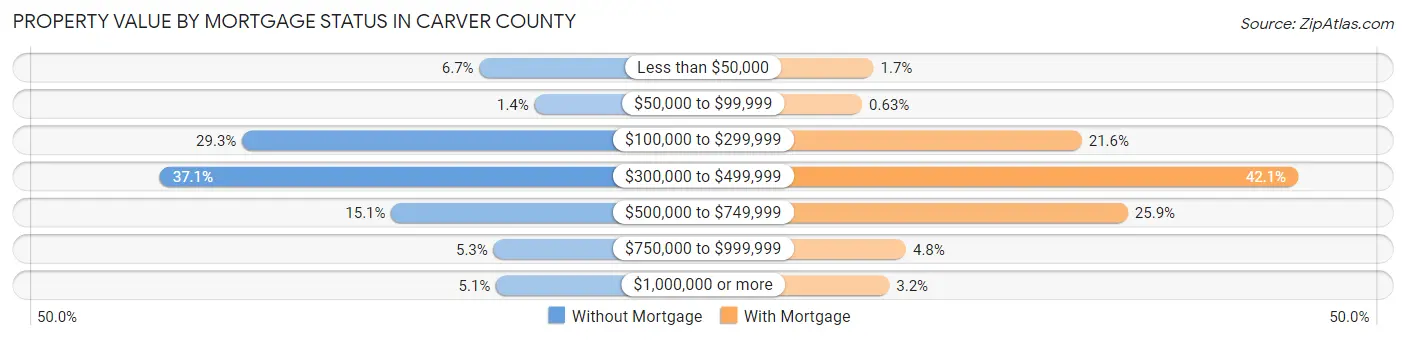
| Property Value | Without Mortgage | With Mortgage |
| Less than $50,000 | 595 (6.7%) | 402 (1.7%) |
| $50,000 to $99,999 | 127 (1.4%) | 148 (0.6%) |
| $100,000 to $299,999 | 2,608 (29.3%) | 5,022 (21.5%) |
| $300,000 to $499,999 | 3,306 (37.1%) | 9,819 (42.1%) |
| $500,000 to $749,999 | 1,342 (15.1%) | 6,046 (25.9%) |
| $750,000 to $999,999 | 475 (5.3%) | 1,122 (4.8%) |
| $1,000,000 or more | 453 (5.1%) | 750 (3.2%) |
| Total | 8,906 (100.0%) | 23,309 (100.0%) |
Household Income by Mortgage Status in Carver County
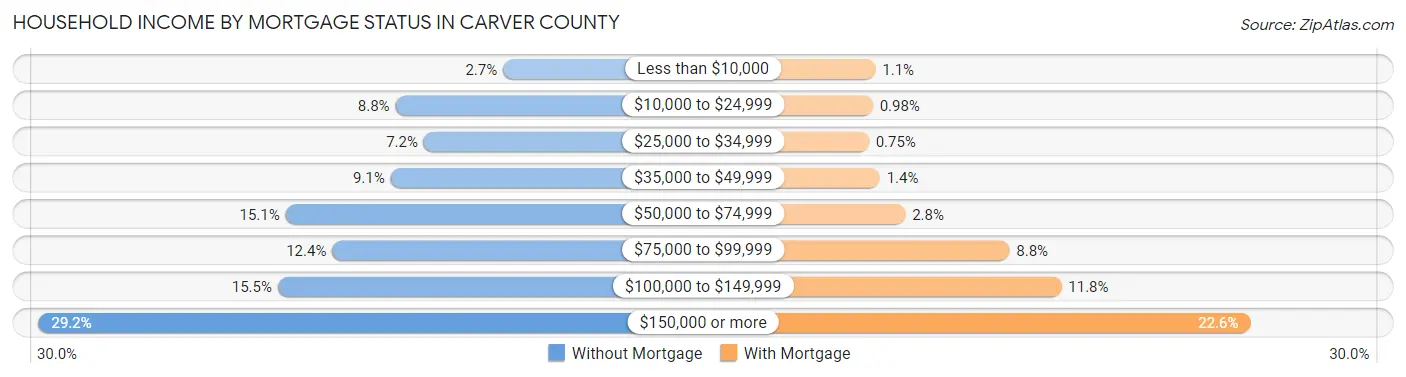
| Household Income | Without Mortgage | With Mortgage |
| Less than $10,000 | 237 (2.7%) | 264 (1.1%) |
| $10,000 to $24,999 | 785 (8.8%) | 228 (1.0%) |
| $25,000 to $34,999 | 640 (7.2%) | 175 (0.7%) |
| $35,000 to $49,999 | 810 (9.1%) | 322 (1.4%) |
| $50,000 to $74,999 | 1,344 (15.1%) | 663 (2.8%) |
| $75,000 to $99,999 | 1,106 (12.4%) | 2,050 (8.8%) |
| $100,000 to $149,999 | 1,383 (15.5%) | 2,741 (11.8%) |
| $150,000 or more | 2,601 (29.2%) | 5,259 (22.6%) |
| Total | 8,906 (100.0%) | 23,309 (100.0%) |
Property Value to Household Income Ratio in Carver County
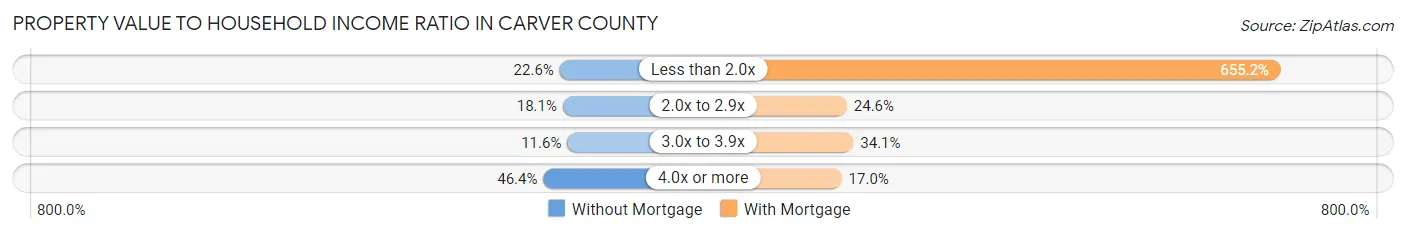
| Value-to-Income Ratio | Without Mortgage | With Mortgage |
| Less than 2.0x | 2,013 (22.6%) | 152,728 (655.2%) |
| 2.0x to 2.9x | 1,612 (18.1%) | 5,736 (24.6%) |
| 3.0x to 3.9x | 1,036 (11.6%) | 7,941 (34.1%) |
| 4.0x or more | 4,131 (46.4%) | 3,969 (17.0%) |
| Total | 8,906 (100.0%) | 23,309 (100.0%) |
Real Estate Taxes by Mortgage Status in Carver County
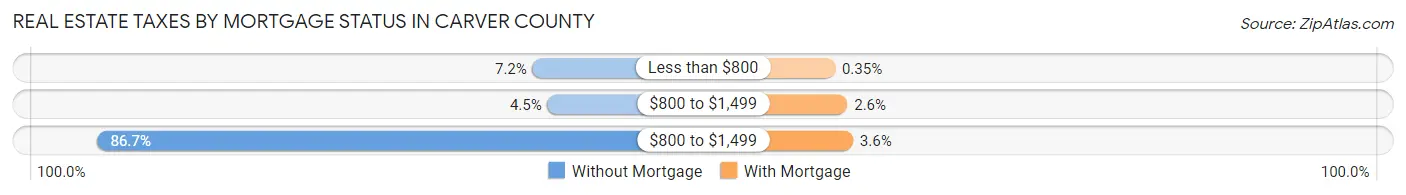
| Property Taxes | Without Mortgage | With Mortgage |
| Less than $800 | 642 (7.2%) | 82 (0.4%) |
| $800 to $1,499 | 400 (4.5%) | 607 (2.6%) |
| $800 to $1,499 | 7,720 (86.7%) | 845 (3.6%) |
| Total | 8,906 (100.0%) | 23,309 (100.0%) |
Health & Disability in Carver County
Health Insurance Coverage by Age in Carver County
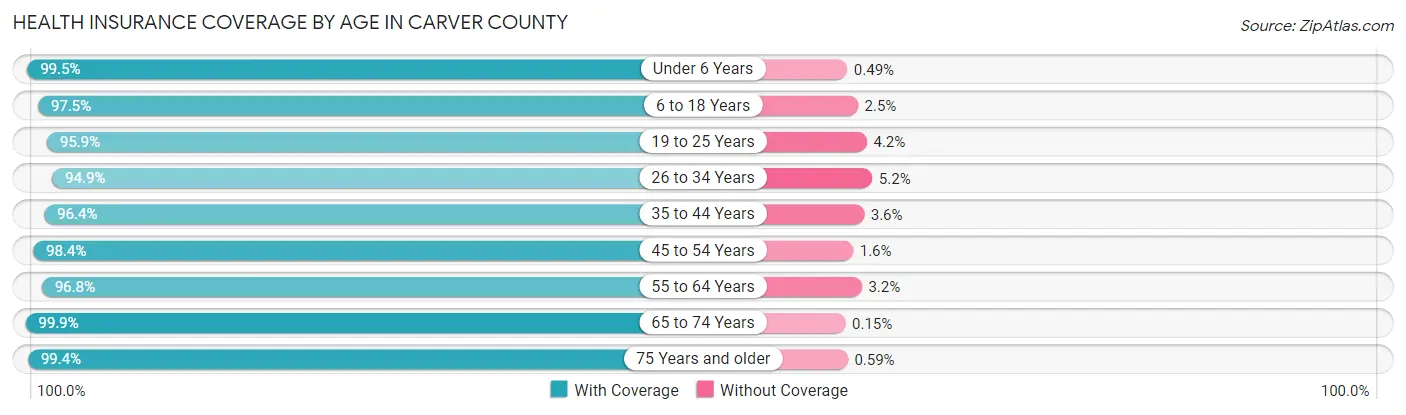
| Age Bracket | With Coverage | Without Coverage |
| Under 6 Years | 8,159 (99.5%) | 40 (0.5%) |
| 6 to 18 Years | 20,742 (97.5%) | 527 (2.5%) |
| 19 to 25 Years | 7,715 (95.9%) | 334 (4.2%) |
| 26 to 34 Years | 9,686 (94.9%) | 526 (5.1%) |
| 35 to 44 Years | 15,253 (96.4%) | 575 (3.6%) |
| 45 to 54 Years | 14,664 (98.4%) | 235 (1.6%) |
| 55 to 64 Years | 14,055 (96.8%) | 464 (3.2%) |
| 65 to 74 Years | 8,532 (99.9%) | 13 (0.2%) |
| 75 Years and older | 5,367 (99.4%) | 32 (0.6%) |
| Total | 104,173 (97.4%) | 2,746 (2.6%) |
Health Insurance Coverage by Citizenship Status in Carver County
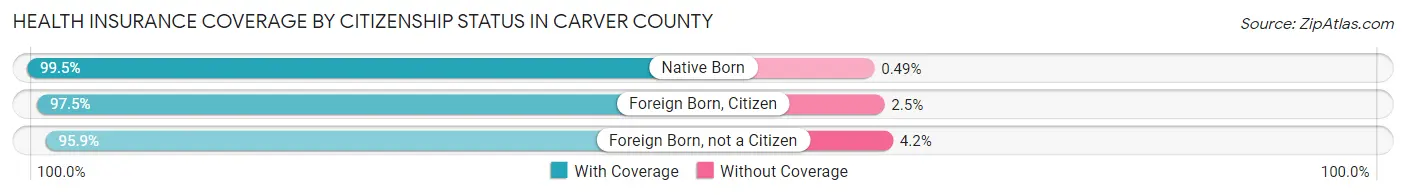
| Citizenship Status | With Coverage | Without Coverage |
| Native Born | 8,159 (99.5%) | 40 (0.5%) |
| Foreign Born, Citizen | 20,742 (97.5%) | 527 (2.5%) |
| Foreign Born, not a Citizen | 7,715 (95.9%) | 334 (4.2%) |
Health Insurance Coverage by Household Income in Carver County

| Household Income | With Coverage | Without Coverage |
| Under $25,000 | 3,424 (94.1%) | 215 (5.9%) |
| $25,000 to $49,999 | 6,626 (94.6%) | 376 (5.4%) |
| $50,000 to $74,999 | 9,977 (94.6%) | 569 (5.4%) |
| $75,000 to $99,999 | 12,164 (95.3%) | 596 (4.7%) |
| $100,000 and over | 71,346 (98.6%) | 986 (1.4%) |
Public vs Private Health Insurance Coverage by Age in Carver County
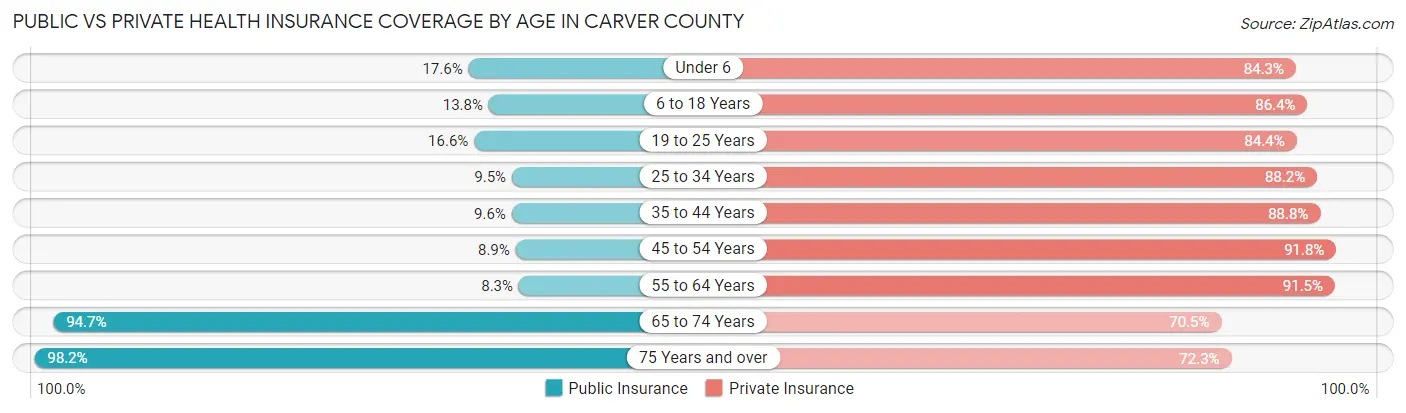
| Age Bracket | Public Insurance | Private Insurance |
| Under 6 | 1,444 (17.6%) | 6,910 (84.3%) |
| 6 to 18 Years | 2,944 (13.8%) | 18,380 (86.4%) |
| 19 to 25 Years | 1,333 (16.6%) | 6,794 (84.4%) |
| 25 to 34 Years | 974 (9.5%) | 9,008 (88.2%) |
| 35 to 44 Years | 1,518 (9.6%) | 14,054 (88.8%) |
| 45 to 54 Years | 1,320 (8.9%) | 13,671 (91.8%) |
| 55 to 64 Years | 1,199 (8.3%) | 13,286 (91.5%) |
| 65 to 74 Years | 8,090 (94.7%) | 6,020 (70.5%) |
| 75 Years and over | 5,301 (98.2%) | 3,904 (72.3%) |
| Total | 24,123 (22.6%) | 92,027 (86.1%) |
Disability Status by Sex by Age in Carver County
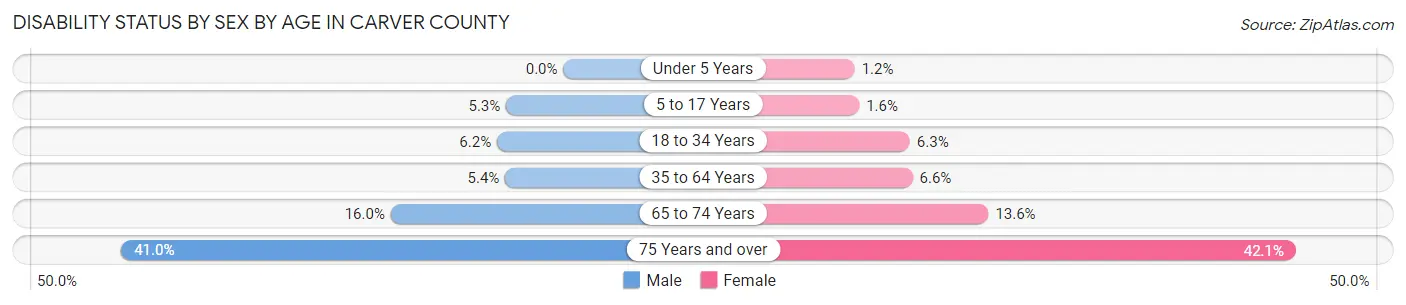
| Age Bracket | Male | Female |
| Under 5 Years | 0 (0.0%) | 38 (1.2%) |
| 5 to 17 Years | 572 (5.3%) | 169 (1.6%) |
| 18 to 34 Years | 616 (6.2%) | 634 (6.3%) |
| 35 to 64 Years | 1,241 (5.4%) | 1,462 (6.6%) |
| 65 to 74 Years | 659 (16.0%) | 603 (13.6%) |
| 75 Years and over | 958 (41.0%) | 1,291 (42.1%) |
Disability Class by Sex by Age in Carver County
Disability Class: Hearing Difficulty
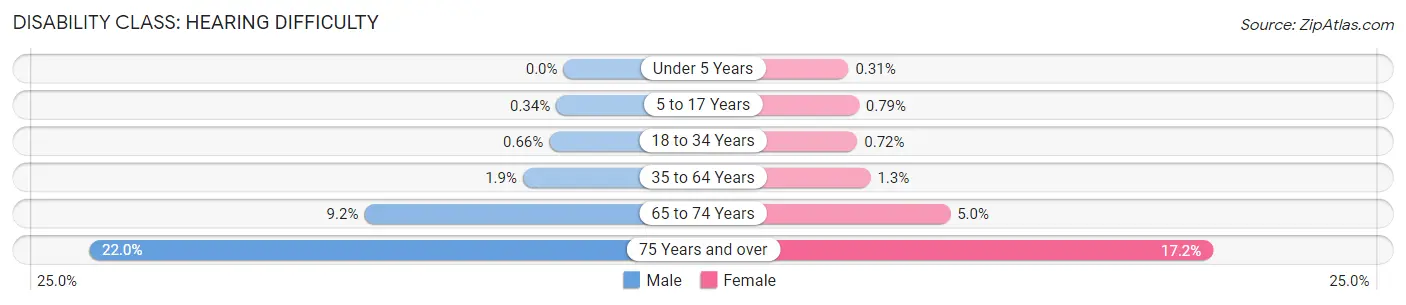
| Age Bracket | Male | Female |
| Under 5 Years | 0 (0.0%) | 10 (0.3%) |
| 5 to 17 Years | 37 (0.3%) | 82 (0.8%) |
| 18 to 34 Years | 66 (0.7%) | 72 (0.7%) |
| 35 to 64 Years | 432 (1.9%) | 296 (1.3%) |
| 65 to 74 Years | 380 (9.2%) | 223 (5.0%) |
| 75 Years and over | 514 (22.0%) | 528 (17.2%) |
Disability Class: Vision Difficulty
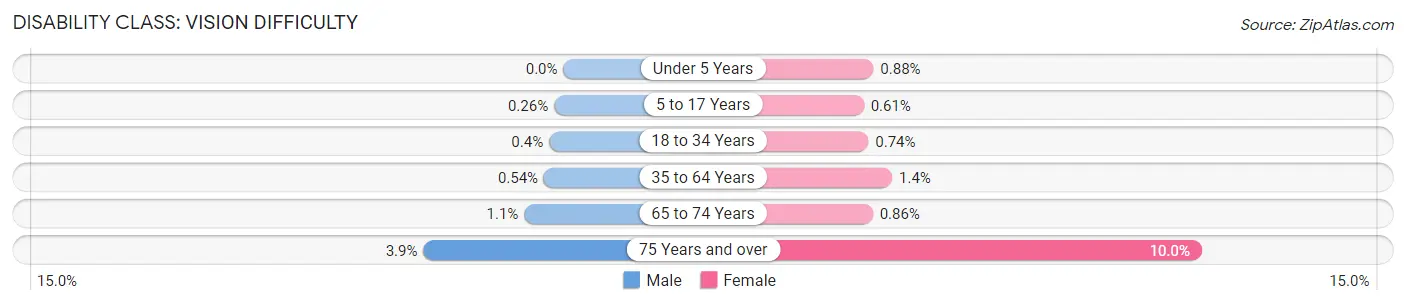
| Age Bracket | Male | Female |
| Under 5 Years | 0 (0.0%) | 28 (0.9%) |
| 5 to 17 Years | 28 (0.3%) | 64 (0.6%) |
| 18 to 34 Years | 40 (0.4%) | 74 (0.7%) |
| 35 to 64 Years | 123 (0.5%) | 312 (1.4%) |
| 65 to 74 Years | 45 (1.1%) | 38 (0.9%) |
| 75 Years and over | 91 (3.9%) | 307 (10.0%) |
Disability Class: Cognitive Difficulty
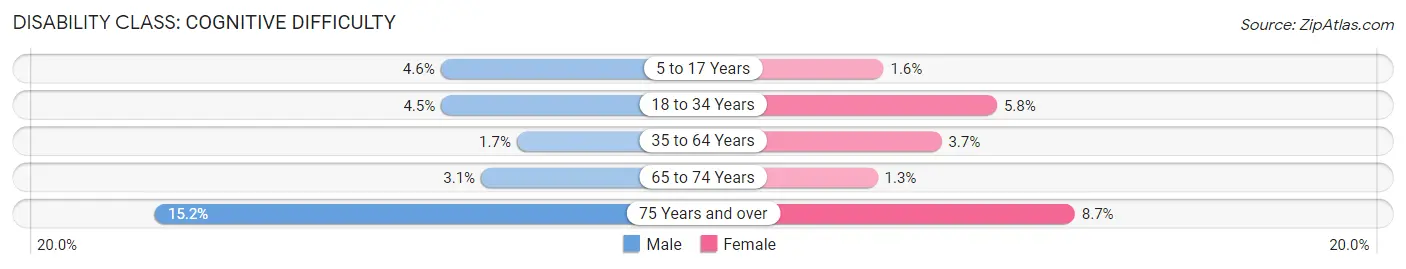
| Age Bracket | Male | Female |
| 5 to 17 Years | 491 (4.6%) | 161 (1.5%) |
| 18 to 34 Years | 454 (4.5%) | 578 (5.8%) |
| 35 to 64 Years | 398 (1.7%) | 823 (3.7%) |
| 65 to 74 Years | 126 (3.1%) | 59 (1.3%) |
| 75 Years and over | 354 (15.2%) | 265 (8.6%) |
Disability Class: Ambulatory Difficulty
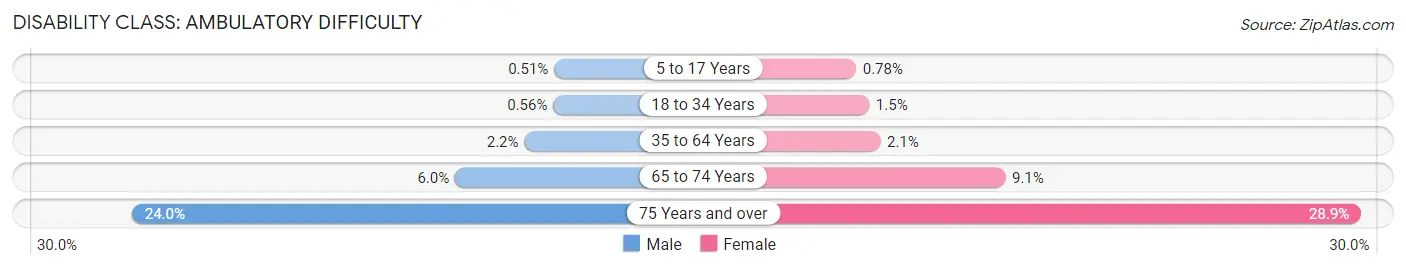
| Age Bracket | Male | Female |
| 5 to 17 Years | 55 (0.5%) | 81 (0.8%) |
| 18 to 34 Years | 56 (0.6%) | 151 (1.5%) |
| 35 to 64 Years | 499 (2.2%) | 475 (2.1%) |
| 65 to 74 Years | 248 (6.0%) | 403 (9.1%) |
| 75 Years and over | 561 (24.0%) | 886 (28.9%) |
Disability Class: Self-Care Difficulty
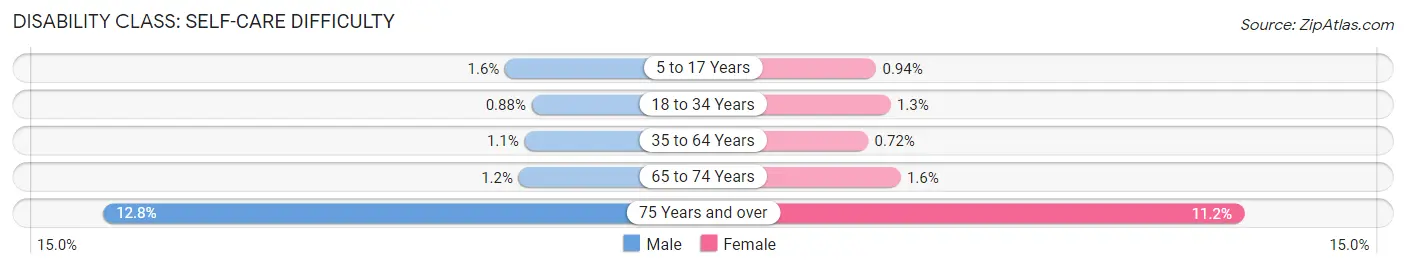
| Age Bracket | Male | Female |
| 5 to 17 Years | 174 (1.6%) | 98 (0.9%) |
| 18 to 34 Years | 88 (0.9%) | 134 (1.3%) |
| 35 to 64 Years | 248 (1.1%) | 161 (0.7%) |
| 65 to 74 Years | 51 (1.2%) | 72 (1.6%) |
| 75 Years and over | 299 (12.8%) | 343 (11.2%) |
Technology Access in Carver County
Computing Device Access in Carver County
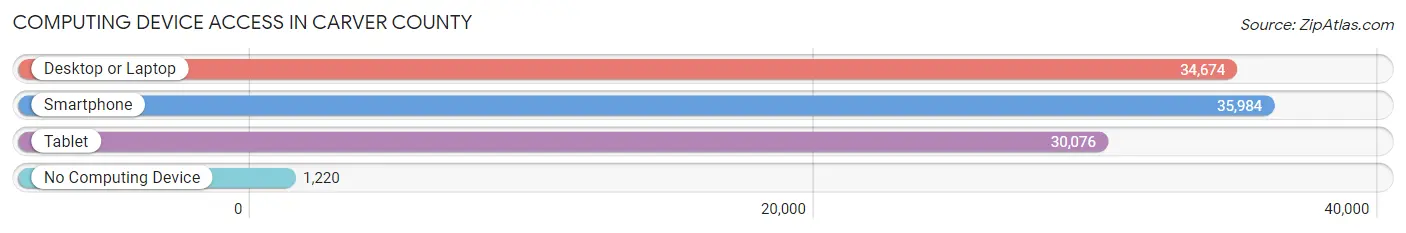
| Device Type | # Households | % Households |
| Desktop or Laptop | 34,674 | 88.2% |
| Smartphone | 35,984 | 91.6% |
| Tablet | 30,076 | 76.5% |
| No Computing Device | 1,220 | 3.1% |
| Total | 39,293 | 100.0% |
Internet Access in Carver County
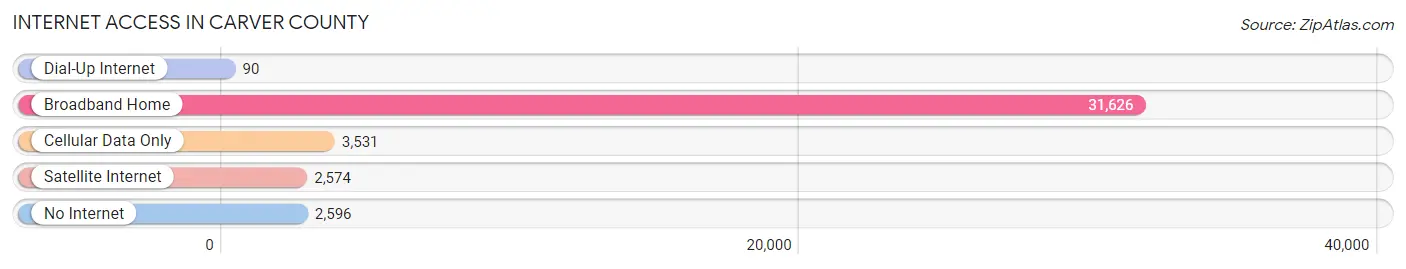
| Internet Type | # Households | % Households |
| Dial-Up Internet | 90 | 0.2% |
| Broadband Home | 31,626 | 80.5% |
| Cellular Data Only | 3,531 | 9.0% |
| Satellite Internet | 2,574 | 6.6% |
| No Internet | 2,596 | 6.6% |
| Total | 39,293 | 100.0% |
Carver County Summary
Carver County is located in the south-central part of Minnesota, and is part of the Twin Cities metropolitan area. It is bordered by Hennepin County to the north, Scott County to the east, Sibley County to the south, and McLeod County to the west. The county seat is Chaska, and the largest city is Chanhassen. Carver County was established in 1855 and named after explorer Jonathan Carver.
Geography
Carver County covers an area of 545 square miles, making it the fourth-largest county in Minnesota. The terrain is mostly flat, with some rolling hills in the western part of the county. The Minnesota River forms the eastern border of the county, and the Crow River flows through the center of the county. The county is home to several lakes, including Lake Waconia, Lake Minnetonka, and Lake Bavaria.
The climate of Carver County is typical of the Upper Midwest, with cold winters and hot, humid summers. The average annual temperature is around 40 degrees Fahrenheit, and the average annual precipitation is around 30 inches.
Demographics
As of the 2010 census, Carver County had a population of 91,042. The population was spread out, with 24.7% under the age of 18, 8.2% from 18 to 24, 28.2% from 25 to 44, 25.3% from 45 to 64, and 13.6% who were 65 years of age or older. The median age was 37.4 years.
The racial makeup of the county was 92.2% White, 2.7% African American, 0.3% Native American, 2.7% Asian, 0.1% Pacific Islander, 0.9% from other races, and 1.2% from two or more races. Hispanic or Latino of any race were 2.9% of the population.
The median household income in Carver County was $76,845 in 2017, and the median family income was $90,945. The per capita income was $37,845. About 4.2% of families and 6.2% of the population were below the poverty line, including 8.2% of those under age 18 and 4.3% of those age 65 or over.
Economy
Carver County is home to several major employers, including Cargill, General Mills, and UnitedHealth Group. The county is also home to several smaller businesses, including several wineries and breweries.
Agriculture is an important part of the economy in Carver County. The county is home to several large farms, and the main crops grown in the county are corn, soybeans, and hay.
The county is also home to several tourist attractions, including the Minnesota Landscape Arboretum, the Carver County Historical Society, and the Minnesota Zoo.
History
Carver County was established in 1855 and named after explorer Jonathan Carver. The county was originally home to the Dakota people, and the first white settlers arrived in the area in the early 1800s.
The county was initially an agricultural area, and the first railroad line was built in 1867. The county continued to grow throughout the late 19th and early 20th centuries, and the population reached 10,000 by 1920.
In the 1950s, the county began to experience rapid growth due to the expansion of the Twin Cities metropolitan area. The population of the county more than doubled between 1950 and 1970, and the county has continued to grow since then.
Common Questions
What is the Total Population of Carver County?
Total Population of Carver County is 107,216.
What is the Total Male Population of Carver County?
Total Male Population of Carver County is 53,641.
What is the Total Female Population of Carver County?
Total Female Population of Carver County is 53,575.
What is the Ratio of Males per 100 Females in Carver County?
There are 100.12 Males per 100 Females in Carver County.
What is the Ratio of Females per 100 Males in Carver County?
There are 99.88 Females per 100 Males in Carver County.
What is the Median Population Age in Carver County?
Median Population Age in Carver County is 38.5 Years.
What is the Average Family Size in Carver County
Average Family Size in Carver County is 3.1 People.
What is the Average Household Size in Carver County
Average Household Size in Carver County is 2.7 People.
What is Per Capita Income in Carver County?
Per Capita income in Carver County is $55,216.
What is the Median Family Income in Carver County?
Median Family Income in Carver County is $141,884.
What is the Median Household income in Carver County?
Median Household Income in Carver County is $116,308.
What is Income or Wage Gap in Carver County?
Income or Wage Gap in Carver County is 34.3%.
Women in Carver County earn 65.7 cents for every dollar earned by a man.
What is Family Income Deficit in Carver County?
Family Income Deficit in Carver County is $13,009.
Families that are below poverty line in Carver County earn $13,009 less on average than the poverty threshold level.
What is Inequality or Gini Index in Carver County?
Inequality or Gini Index in Carver County is 0.42.
How Large is the Labor Force in Carver County?
There are 60,394 People in the Labor Forcein in Carver County.
What is the Percentage of People in the Labor Force in Carver County?
73.0% of People are in the Labor Force in Carver County.
What is the Unemployment Rate in Carver County?
Unemployment Rate in Carver County is 3.1%.