Blue Earth County, MN
Blue Earth County Overview
69,022
TOTAL POPULATION
34,934
MALE POPULATION
34,088
FEMALE POPULATION
102.48
MALES / 100 FEMALES
97.58
FEMALES / 100 MALES
31.4
MEDIAN AGE
2.9
AVG FAMILY SIZE
2.4
AVG HOUSEHOLD SIZE
$35,182
PER CAPITA INCOME
$91,033
AVG FAMILY INCOME
$70,906
AVG HOUSEHOLD INCOME
28.8%
WAGE / INCOME GAP [ % ]
71.2¢/ $1
WAGE / INCOME GAP [ $ ]
$8,244
FAMILY INCOME DEFICIT
0.43
INEQUALITY / GINI INDEX
40,361
LABOR FORCE [ PEOPLE ]
70.9%
PERCENT IN LABOR FORCE
3.7%
UNEMPLOYMENT RATE
Blue Earth County Area Codes
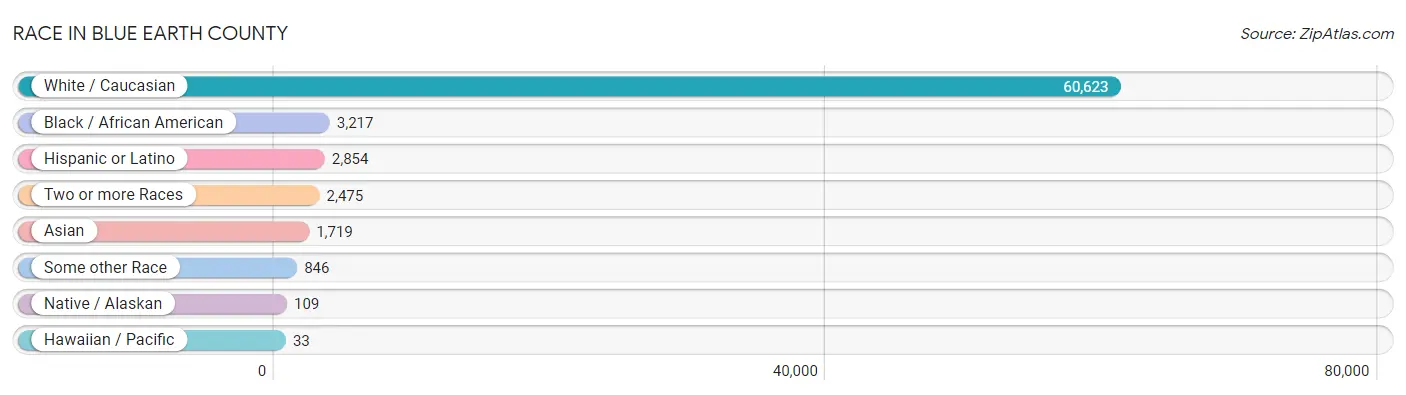
Race in Blue Earth County
The most populous races in Blue Earth County are White / Caucasian (60,623 | 87.8%), Black / African American (3,217 | 4.7%), and Hispanic or Latino (2,854 | 4.1%).
| Race | # Population | % Population |
| Asian | 1,719 | 2.5% |
| Black / African American | 3,217 | 4.7% |
| Hawaiian / Pacific | 33 | 0.1% |
| Hispanic or Latino | 2,854 | 4.1% |
| Native / Alaskan | 109 | 0.2% |
| White / Caucasian | 60,623 | 87.8% |
| Two or more Races | 2,475 | 3.6% |
| Some other Race | 846 | 1.2% |
| Total | 69,022 | 100.0% |
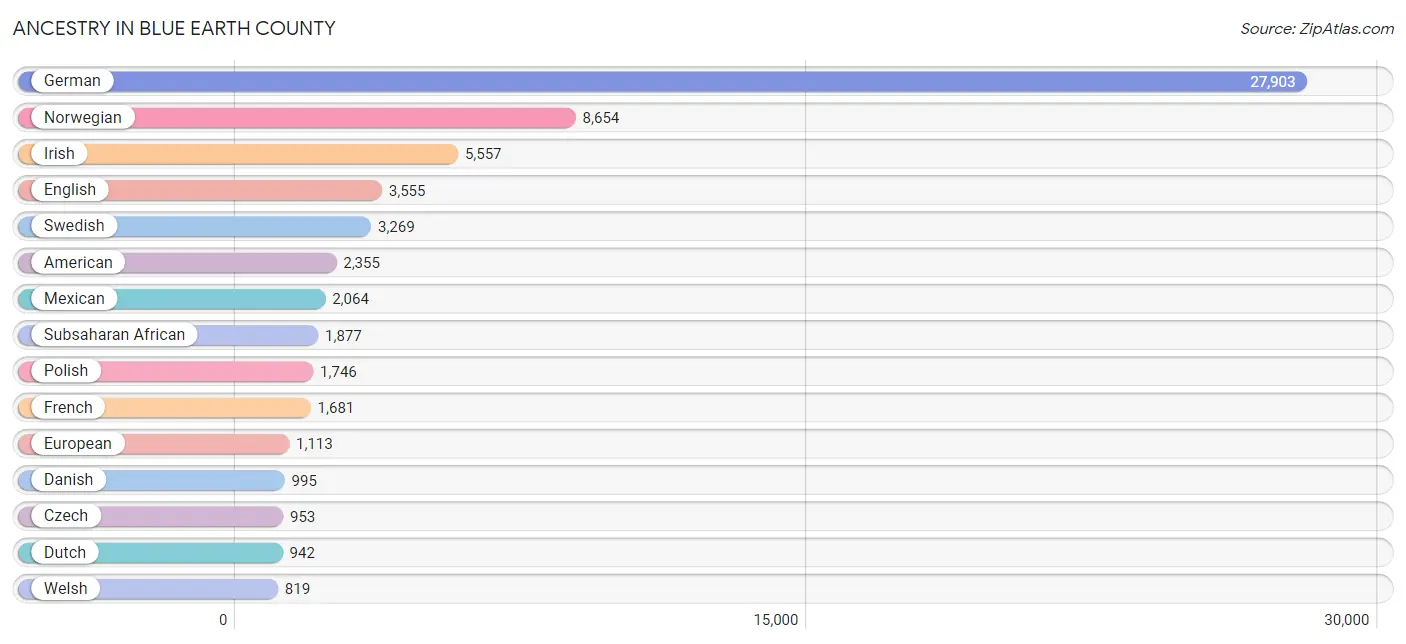
Ancestry in Blue Earth County
The most populous ancestries reported in Blue Earth County are German (27,903 | 40.4%), Norwegian (8,654 | 12.5%), Irish (5,557 | 8.1%), English (3,555 | 5.1%), and Swedish (3,269 | 4.7%), together accounting for 70.9% of all Blue Earth County residents.
| Ancestry | # Population | % Population |
| African | 337 | 0.5% |
| Albanian | 10 | 0.0% |
| American | 2,355 | 3.4% |
| Apache | 1 | 0.0% |
| Arab | 551 | 0.8% |
| Argentinean | 22 | 0.0% |
| Armenian | 17 | 0.0% |
| Australian | 6 | 0.0% |
| Austrian | 133 | 0.2% |
| Bangladeshi | 88 | 0.1% |
| Belgian | 247 | 0.4% |
| Bhutanese | 91 | 0.1% |
| Blackfeet | 18 | 0.0% |
| Brazilian | 12 | 0.0% |
| British | 134 | 0.2% |
| Bulgarian | 2 | 0.0% |
| Burmese | 471 | 0.7% |
| Canadian | 22 | 0.0% |
| Central American | 262 | 0.4% |
| Central American Indian | 17 | 0.0% |
| Cherokee | 19 | 0.0% |
| Chippewa | 101 | 0.2% |
| Choctaw | 2 | 0.0% |
| Colombian | 7 | 0.0% |
| Comanche | 14 | 0.0% |
| Costa Rican | 49 | 0.1% |
| Creek | 11 | 0.0% |
| Croatian | 69 | 0.1% |
| Crow | 12 | 0.0% |
| Cuban | 9 | 0.0% |
| Czech | 953 | 1.4% |
| Czechoslovakian | 45 | 0.1% |
| Danish | 995 | 1.4% |
| Delaware | 20 | 0.0% |
| Dutch | 942 | 1.4% |
| Eastern European | 66 | 0.1% |
| English | 3,555 | 5.1% |
| Estonian | 80 | 0.1% |
| Ethiopian | 89 | 0.1% |
| European | 1,113 | 1.6% |
| Fijian | 33 | 0.1% |
| Filipino | 21 | 0.0% |
| Finnish | 391 | 0.6% |
| French | 1,681 | 2.4% |
| French American Indian | 4 | 0.0% |
| French Canadian | 328 | 0.5% |
| German | 27,903 | 40.4% |
| German Russian | 2 | 0.0% |
| Ghanaian | 156 | 0.2% |
| Greek | 54 | 0.1% |
| Guatemalan | 24 | 0.0% |
| Honduran | 159 | 0.2% |
| Hungarian | 119 | 0.2% |
| Icelander | 12 | 0.0% |
| Indian (Asian) | 245 | 0.4% |
| Indonesian | 9 | 0.0% |
| Inupiat | 16 | 0.0% |
| Irish | 5,557 | 8.1% |
| Italian | 548 | 0.8% |
| Japanese | 24 | 0.0% |
| Kenyan | 15 | 0.0% |
| Korean | 346 | 0.5% |
| Laotian | 3 | 0.0% |
| Latvian | 3 | 0.0% |
| Lebanese | 223 | 0.3% |
| Liberian | 62 | 0.1% |
| Lithuanian | 70 | 0.1% |
| Luxembourger | 71 | 0.1% |
| Malaysian | 3 | 0.0% |
| Mexican | 2,064 | 3.0% |
| Mexican American Indian | 5 | 0.0% |
| Moroccan | 49 | 0.1% |
| Native Hawaiian | 31 | 0.0% |
| Navajo | 19 | 0.0% |
| Nigerian | 175 | 0.3% |
| Northern European | 126 | 0.2% |
| Norwegian | 8,654 | 12.5% |
| Osage | 14 | 0.0% |
| Pakistani | 3 | 0.0% |
| Palestinian | 12 | 0.0% |
| Pennsylvania German | 16 | 0.0% |
| Peruvian | 11 | 0.0% |
| Polish | 1,746 | 2.5% |
| Portuguese | 22 | 0.0% |
| Potawatomi | 10 | 0.0% |
| Puerto Rican | 106 | 0.2% |
| Romanian | 45 | 0.1% |
| Russian | 404 | 0.6% |
| Salvadoran | 30 | 0.0% |
| Samoan | 80 | 0.1% |
| Scandinavian | 757 | 1.1% |
| Scotch-Irish | 294 | 0.4% |
| Scottish | 697 | 1.0% |
| Senegalese | 6 | 0.0% |
| Serbian | 35 | 0.1% |
| Sioux | 57 | 0.1% |
| Slavic | 20 | 0.0% |
| Slovak | 17 | 0.0% |
| Slovene | 22 | 0.0% |
| Somali | 353 | 0.5% |
| South African | 4 | 0.0% |
| South American | 65 | 0.1% |
| Spaniard | 164 | 0.2% |
| Spanish | 18 | 0.0% |
| Sri Lankan | 360 | 0.5% |
| Subsaharan African | 1,877 | 2.7% |
| Sudanese | 565 | 0.8% |
| Swedish | 3,269 | 4.7% |
| Swiss | 264 | 0.4% |
| Syrian | 53 | 0.1% |
| Thai | 120 | 0.2% |
| Tlingit-Haida | 11 | 0.0% |
| Tongan | 43 | 0.1% |
| Turkish | 28 | 0.0% |
| Ukrainian | 46 | 0.1% |
| Venezuelan | 25 | 0.0% |
| Vietnamese | 136 | 0.2% |
| Welsh | 819 | 1.2% |
| West Indian | 21 | 0.0% |
| Yugoslavian | 35 | 0.1% | View All 120 Rows |
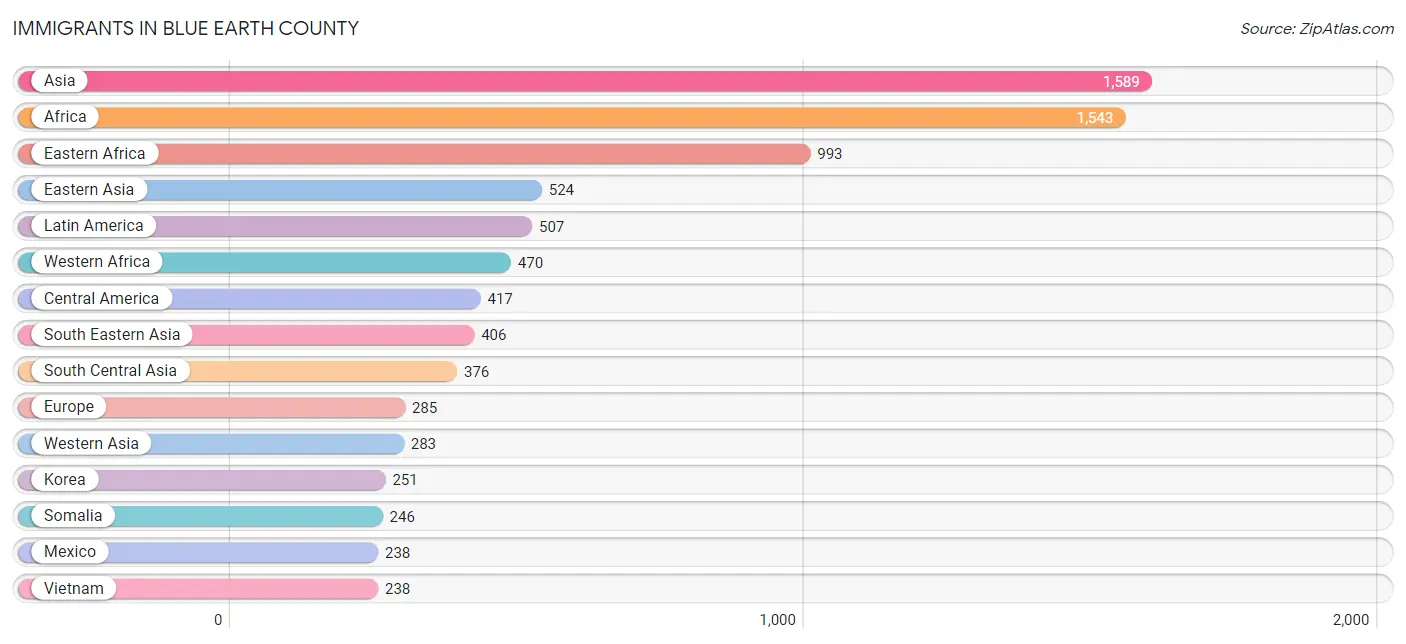
Immigrants in Blue Earth County
The most numerous immigrant groups reported in Blue Earth County came from Asia (1,589 | 2.3%), Africa (1,543 | 2.2%), Eastern Africa (993 | 1.4%), Eastern Asia (524 | 0.8%), and Latin America (507 | 0.7%), together accounting for 7.5% of all Blue Earth County residents.
| Immigration Origin | # Population | % Population |
| Africa | 1,543 | 2.2% |
| Albania | 10 | 0.0% |
| Argentina | 22 | 0.0% |
| Asia | 1,589 | 2.3% |
| Australia | 4 | 0.0% |
| Bangladesh | 136 | 0.2% |
| Brazil | 4 | 0.0% |
| Cambodia | 20 | 0.0% |
| Canada | 157 | 0.2% |
| Caribbean | 33 | 0.1% |
| Central America | 417 | 0.6% |
| China | 216 | 0.3% |
| Colombia | 6 | 0.0% |
| Costa Rica | 23 | 0.0% |
| Denmark | 11 | 0.0% |
| Dominica | 33 | 0.1% |
| Eastern Africa | 993 | 1.4% |
| Eastern Asia | 524 | 0.8% |
| Eastern Europe | 92 | 0.1% |
| El Salvador | 5 | 0.0% |
| England | 5 | 0.0% |
| Ethiopia | 223 | 0.3% |
| Europe | 285 | 0.4% |
| Germany | 85 | 0.1% |
| Ghana | 141 | 0.2% |
| Greece | 3 | 0.0% |
| Guatemala | 17 | 0.0% |
| Honduras | 134 | 0.2% |
| Hong Kong | 7 | 0.0% |
| India | 88 | 0.1% |
| Iraq | 44 | 0.1% |
| Italy | 3 | 0.0% |
| Japan | 57 | 0.1% |
| Kenya | 199 | 0.3% |
| Korea | 251 | 0.4% |
| Latin America | 507 | 0.7% |
| Lebanon | 19 | 0.0% |
| Liberia | 48 | 0.1% |
| Mexico | 238 | 0.3% |
| Moldova | 3 | 0.0% |
| Morocco | 24 | 0.0% |
| Nepal | 113 | 0.2% |
| Netherlands | 4 | 0.0% |
| Nigeria | 237 | 0.3% |
| Northern Africa | 43 | 0.1% |
| Northern Europe | 56 | 0.1% |
| Norway | 5 | 0.0% |
| Oceania | 4 | 0.0% |
| Pakistan | 39 | 0.1% |
| Philippines | 136 | 0.2% |
| Poland | 2 | 0.0% |
| Russia | 47 | 0.1% |
| Saudi Arabia | 192 | 0.3% |
| Scotland | 1 | 0.0% |
| Senegal | 6 | 0.0% |
| Serbia | 4 | 0.0% |
| Somalia | 246 | 0.4% |
| South Africa | 2 | 0.0% |
| South America | 57 | 0.1% |
| South Central Asia | 376 | 0.5% |
| South Eastern Asia | 406 | 0.6% |
| Southern Europe | 33 | 0.1% |
| Spain | 27 | 0.0% |
| Sudan | 19 | 0.0% |
| Sweden | 17 | 0.0% |
| Taiwan | 77 | 0.1% |
| Thailand | 12 | 0.0% |
| Turkey | 28 | 0.0% |
| Ukraine | 11 | 0.0% |
| Venezuela | 25 | 0.0% |
| Vietnam | 238 | 0.3% |
| Western Africa | 470 | 0.7% |
| Western Asia | 283 | 0.4% |
| Western Europe | 89 | 0.1% | View All 74 Rows |
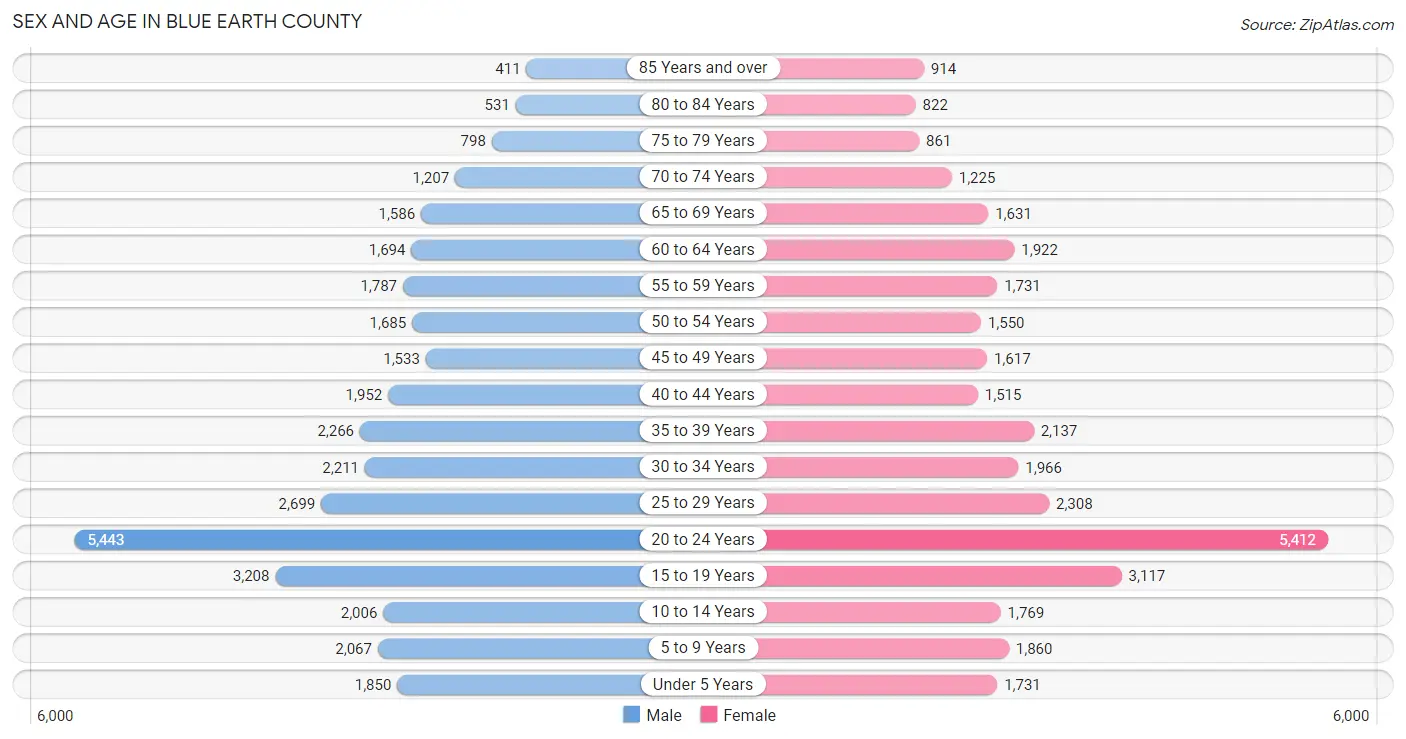
Sex and Age in Blue Earth County
Sex and Age in Blue Earth County
The most populous age groups in Blue Earth County are 20 to 24 Years (5,443 | 15.6%) for men and 20 to 24 Years (5,412 | 15.9%) for women.
| Age Bracket | Male | Female |
| Under 5 Years | 1,850 (5.3%) | 1,731 (5.1%) |
| 5 to 9 Years | 2,067 (5.9%) | 1,860 (5.5%) |
| 10 to 14 Years | 2,006 (5.7%) | 1,769 (5.2%) |
| 15 to 19 Years | 3,208 (9.2%) | 3,117 (9.1%) |
| 20 to 24 Years | 5,443 (15.6%) | 5,412 (15.9%) |
| 25 to 29 Years | 2,699 (7.7%) | 2,308 (6.8%) |
| 30 to 34 Years | 2,211 (6.3%) | 1,966 (5.8%) |
| 35 to 39 Years | 2,266 (6.5%) | 2,137 (6.3%) |
| 40 to 44 Years | 1,952 (5.6%) | 1,515 (4.4%) |
| 45 to 49 Years | 1,533 (4.4%) | 1,617 (4.7%) |
| 50 to 54 Years | 1,685 (4.8%) | 1,550 (4.5%) |
| 55 to 59 Years | 1,787 (5.1%) | 1,731 (5.1%) |
| 60 to 64 Years | 1,694 (4.9%) | 1,922 (5.6%) |
| 65 to 69 Years | 1,586 (4.5%) | 1,631 (4.8%) |
| 70 to 74 Years | 1,207 (3.5%) | 1,225 (3.6%) |
| 75 to 79 Years | 798 (2.3%) | 861 (2.5%) |
| 80 to 84 Years | 531 (1.5%) | 822 (2.4%) |
| 85 Years and over | 411 (1.2%) | 914 (2.7%) |
| Total | 34,934 (100.0%) | 34,088 (100.0%) |
Families and Households in Blue Earth County
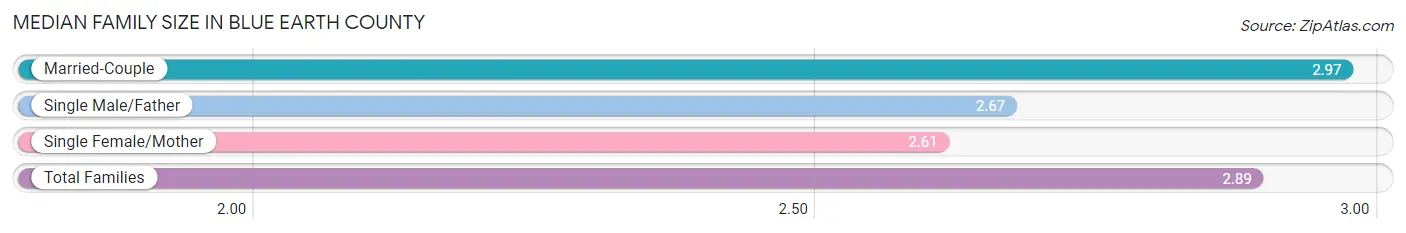
Median Family Size in Blue Earth County
The median family size in Blue Earth County is 2.89 persons per family, with married-couple families (11,824 | 76.2%) accounting for the largest median family size of 2.97 persons per family. On the other hand, single female/mother families (2,430 | 15.7%) represent the smallest median family size with 2.61 persons per family.
| Family Type | # Families | Family Size |
| Married-Couple | 11,824 (76.2%) | 2.97 |
| Single Male/Father | 1,253 (8.1%) | 2.67 |
| Single Female/Mother | 2,430 (15.7%) | 2.61 |
| Total Families | 15,507 (100.0%) | 2.89 |
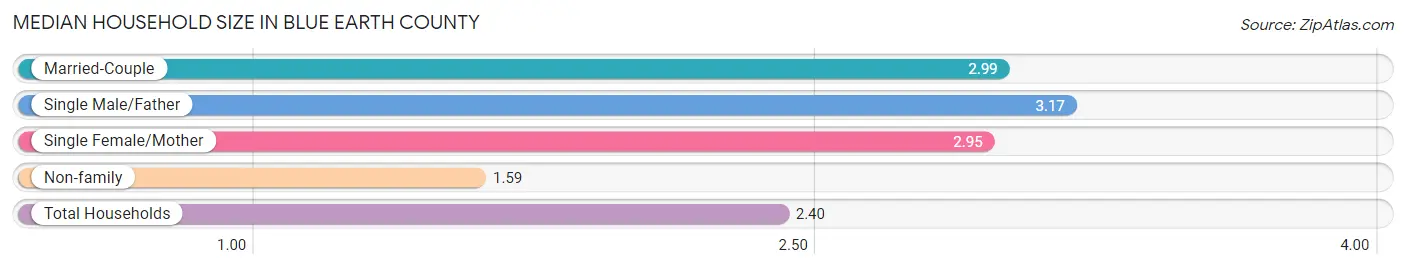
Median Household Size in Blue Earth County
The median household size in Blue Earth County is 2.40 persons per household, with single male/father households (1,253 | 4.6%) accounting for the largest median household size of 3.17 persons per household. non-family households (11,603 | 42.8%) represent the smallest median household size with 1.59 persons per household.
| Household Type | # Households | Household Size |
| Married-Couple | 11,824 (43.6%) | 2.99 |
| Single Male/Father | 1,253 (4.6%) | 3.17 |
| Single Female/Mother | 2,430 (9.0%) | 2.95 |
| Non-family | 11,603 (42.8%) | 1.59 |
| Total Households | 27,110 (100.0%) | 2.40 |
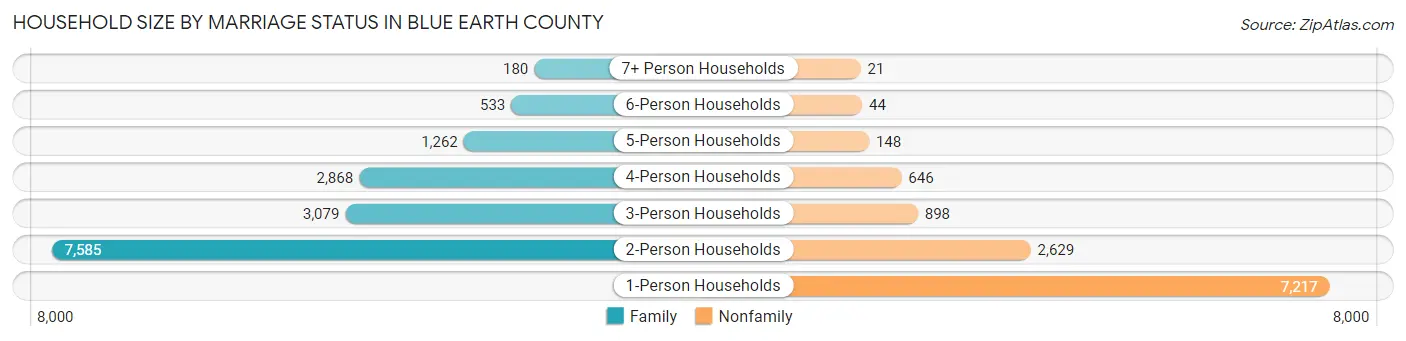
Household Size by Marriage Status in Blue Earth County
Out of a total of 27,110 households in Blue Earth County, 15,507 (57.2%) are family households, while 11,603 (42.8%) are nonfamily households. The most numerous type of family households are 2-person households, comprising 7,585, and the most common type of nonfamily households are 1-person households, comprising 7,217.
| Household Size | Family Households | Nonfamily Households |
| 1-Person Households | - | 7,217 (26.6%) |
| 2-Person Households | 7,585 (28.0%) | 2,629 (9.7%) |
| 3-Person Households | 3,079 (11.4%) | 898 (3.3%) |
| 4-Person Households | 2,868 (10.6%) | 646 (2.4%) |
| 5-Person Households | 1,262 (4.7%) | 148 (0.5%) |
| 6-Person Households | 533 (2.0%) | 44 (0.2%) |
| 7+ Person Households | 180 (0.7%) | 21 (0.1%) |
| Total | 15,507 (57.2%) | 11,603 (42.8%) |
Female Fertility in Blue Earth County
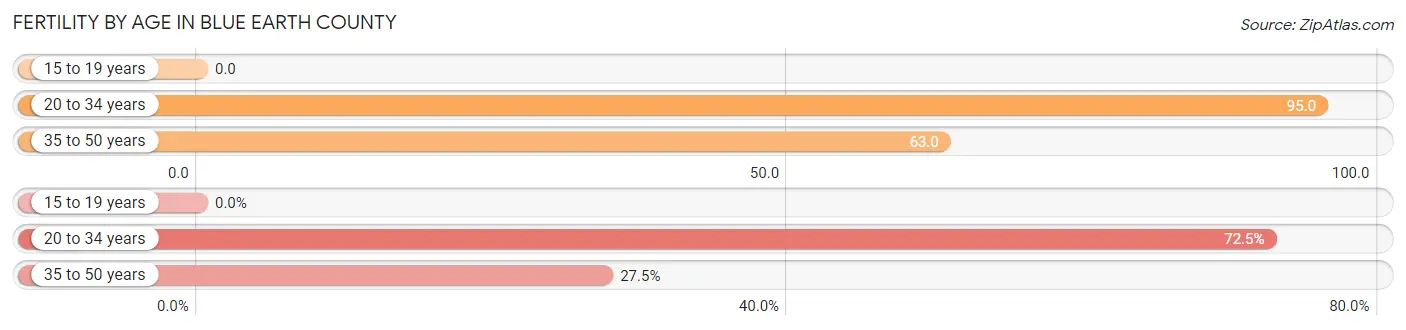
Fertility by Age in Blue Earth County
Average fertility rate in Blue Earth County is 69.0 births per 1,000 women. Women in the age bracket of 20 to 34 years have the highest fertility rate with 95.0 births per 1,000 women. Women in the age bracket of 20 to 34 years acount for 72.5% of all women with births.
| Age Bracket | Women with Births | Births / 1,000 Women |
| 15 to 19 years | 0 (0.0%) | 0.0 |
| 20 to 34 years | 920 (72.5%) | 95.0 |
| 35 to 50 years | 349 (27.5%) | 63.0 |
| Total | 1,269 (100.0%) | 69.0 |
Fertility by Age by Marriage Status in Blue Earth County
72.3% of women with births (1,269) in Blue Earth County are married. The highest percentage of unmarried women with births falls into 20 to 34 years age bracket with 31.1% of them unmarried at the time of birth, while the lowest percentage of unmarried women with births belong to 35 to 50 years age bracket with 18.9% of them unmarried.
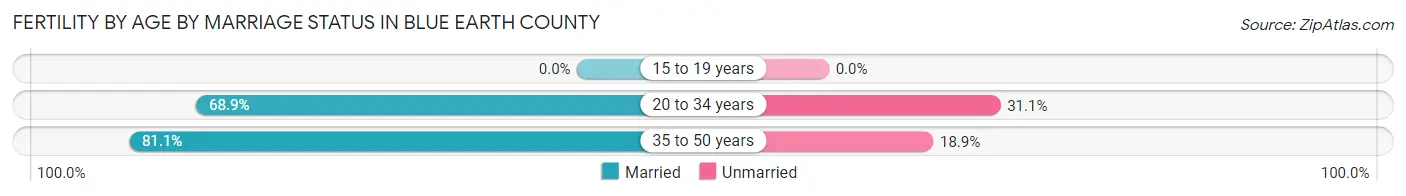
| Age Bracket | Married | Unmarried |
| 15 to 19 years | 0 (0.0%) | 0 (0.0%) |
| 20 to 34 years | 634 (68.9%) | 286 (31.1%) |
| 35 to 50 years | 283 (81.1%) | 66 (18.9%) |
| Total | 917 (72.3%) | 352 (27.7%) |
Fertility by Education in Blue Earth County
Average fertility rate in Blue Earth County is 69.0 births per 1,000 women. Women with the education attainment of less than high school have the highest fertility rate of 135.0 births per 1,000 women, while women with the education attainment of college or associate's degree have the lowest fertility at 32.0 births per 1,000 women. Women with the education attainment of bachelor's degree represent 24.7% of all women with births.
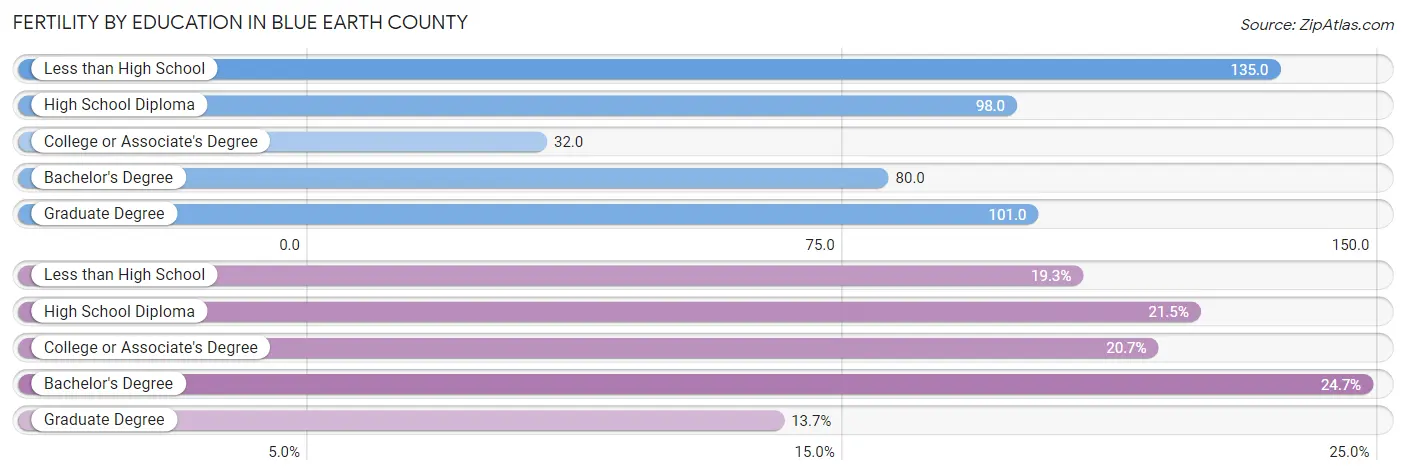
| Educational Attainment | Women with Births | Births / 1,000 Women |
| Less than High School | 245 (19.3%) | 135.0 |
| High School Diploma | 273 (21.5%) | 98.0 |
| College or Associate's Degree | 263 (20.7%) | 32.0 |
| Bachelor's Degree | 314 (24.7%) | 80.0 |
| Graduate Degree | 174 (13.7%) | 101.0 |
| Total | 1,269 (100.0%) | 69.0 |
Fertility by Education by Marriage Status in Blue Earth County
27.7% of women with births in Blue Earth County are unmarried. Women with the educational attainment of less than high school are most likely to be married with 91.4% of them married at childbirth, while women with the educational attainment of high school diploma are least likely to be married with 74.0% of them unmarried at childbirth.
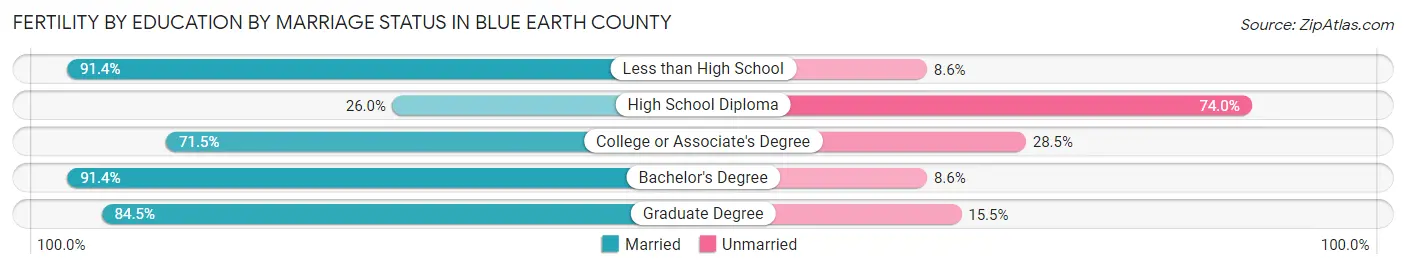
| Educational Attainment | Married | Unmarried |
| Less than High School | 224 (91.4%) | 21 (8.6%) |
| High School Diploma | 71 (26.0%) | 202 (74.0%) |
| College or Associate's Degree | 188 (71.5%) | 75 (28.5%) |
| Bachelor's Degree | 287 (91.4%) | 27 (8.6%) |
| Graduate Degree | 147 (84.5%) | 27 (15.5%) |
| Total | 917 (72.3%) | 352 (27.7%) |
Income in Blue Earth County
Income Overview in Blue Earth County
Per Capita Income in Blue Earth County is $35,182, while median incomes of families and households are $91,033 and $70,906 respectively.
| Characteristic | Number | Measure |
| Per Capita Income | 69,022 | $35,182 |
| Median Family Income | 15,507 | $91,033 |
| Mean Family Income | 15,507 | $109,157 |
| Median Household Income | 27,110 | $70,906 |
| Mean Household Income | 27,110 | $87,952 |
| Income Deficit | 15,507 | $8,244 |
| Wage / Income Gap (%) | 69,022 | 28.83% |
| Wage / Income Gap ($) | 69,022 | 71.17¢ per $1 |
| Gini / Inequality Index | 69,022 | 0.43 |
Earnings by Sex in Blue Earth County
Average Earnings in Blue Earth County are $33,341, $38,501 for men and $27,400 for women, a difference of 28.8%.
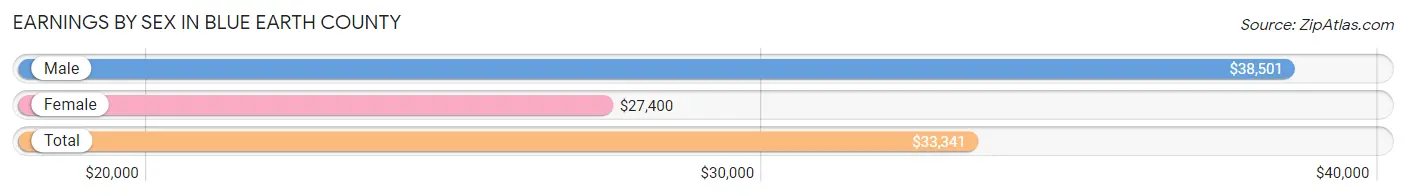
| Sex | Number | Average Earnings |
| Male | 22,506 (51.6%) | $38,501 |
| Female | 21,079 (48.4%) | $27,400 |
| Total | 43,585 (100.0%) | $33,341 |
Earnings by Sex by Income Bracket in Blue Earth County
The most common earnings brackets in Blue Earth County are $100,000+ for men (2,385 | 10.6%) and $75,000 to $99,999 for women (1,452 | 6.9%).
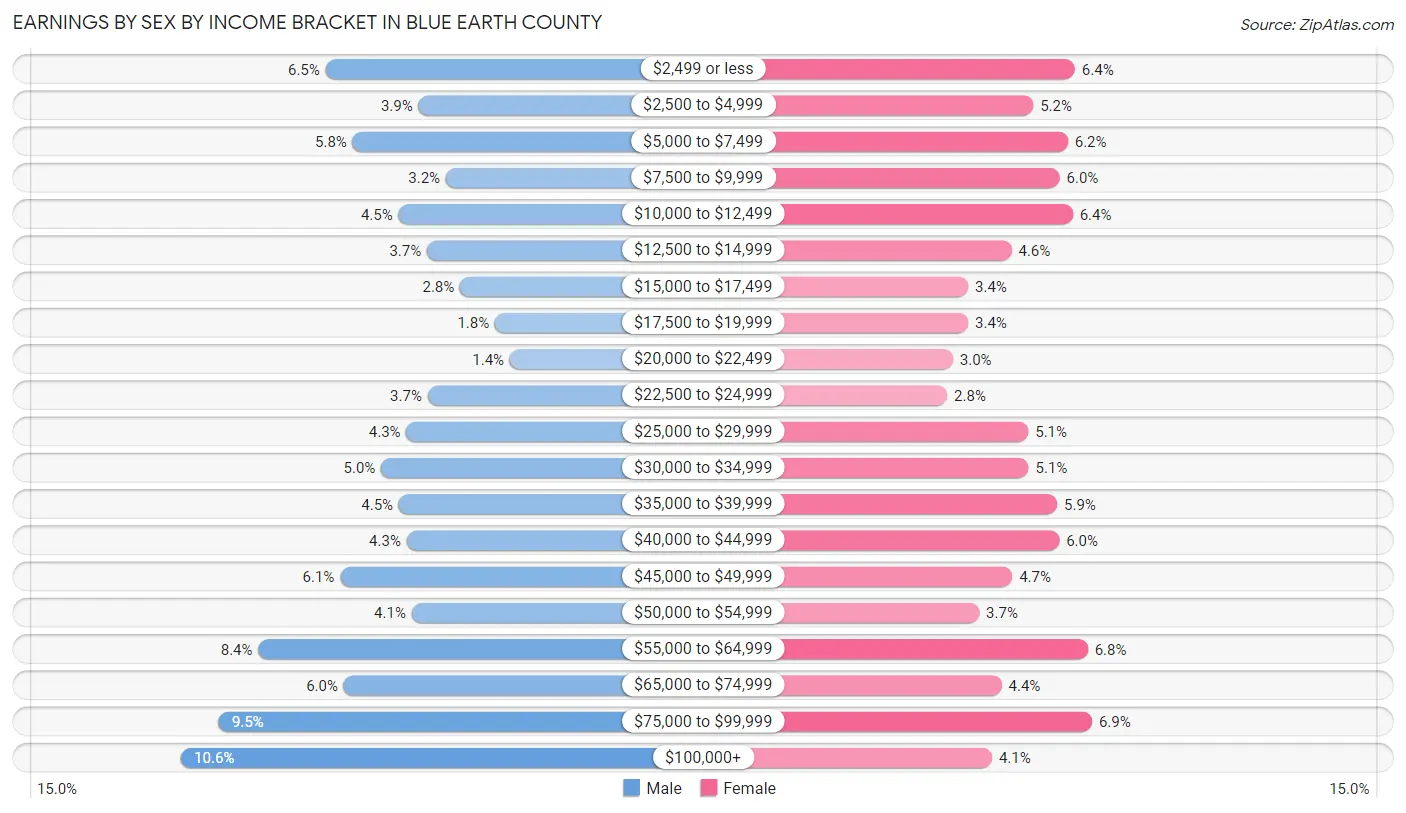
| Income | Male | Female |
| $2,499 or less | 1,473 (6.5%) | 1,351 (6.4%) |
| $2,500 to $4,999 | 884 (3.9%) | 1,105 (5.2%) |
| $5,000 to $7,499 | 1,301 (5.8%) | 1,310 (6.2%) |
| $7,500 to $9,999 | 712 (3.2%) | 1,261 (6.0%) |
| $10,000 to $12,499 | 1,011 (4.5%) | 1,339 (6.4%) |
| $12,500 to $14,999 | 830 (3.7%) | 977 (4.6%) |
| $15,000 to $17,499 | 622 (2.8%) | 719 (3.4%) |
| $17,500 to $19,999 | 400 (1.8%) | 718 (3.4%) |
| $20,000 to $22,499 | 307 (1.4%) | 628 (3.0%) |
| $22,500 to $24,999 | 826 (3.7%) | 594 (2.8%) |
| $25,000 to $29,999 | 960 (4.3%) | 1,074 (5.1%) |
| $30,000 to $34,999 | 1,121 (5.0%) | 1,077 (5.1%) |
| $35,000 to $39,999 | 1,008 (4.5%) | 1,246 (5.9%) |
| $40,000 to $44,999 | 958 (4.3%) | 1,258 (6.0%) |
| $45,000 to $49,999 | 1,380 (6.1%) | 981 (4.6%) |
| $50,000 to $54,999 | 927 (4.1%) | 785 (3.7%) |
| $55,000 to $64,999 | 1,897 (8.4%) | 1,428 (6.8%) |
| $65,000 to $74,999 | 1,356 (6.0%) | 916 (4.3%) |
| $75,000 to $99,999 | 2,148 (9.5%) | 1,452 (6.9%) |
| $100,000+ | 2,385 (10.6%) | 860 (4.1%) |
| Total | 22,506 (100.0%) | 21,079 (100.0%) |
Earnings by Sex by Educational Attainment in Blue Earth County
Average earnings in Blue Earth County are $51,965 for men and $41,897 for women, a difference of 19.4%. Men with an educational attainment of graduate degree enjoy the highest average annual earnings of $86,637, while those with less than high school education earn the least with $40,000. Women with an educational attainment of graduate degree earn the most with the average annual earnings of $65,570, while those with less than high school education have the smallest earnings of $22,514.
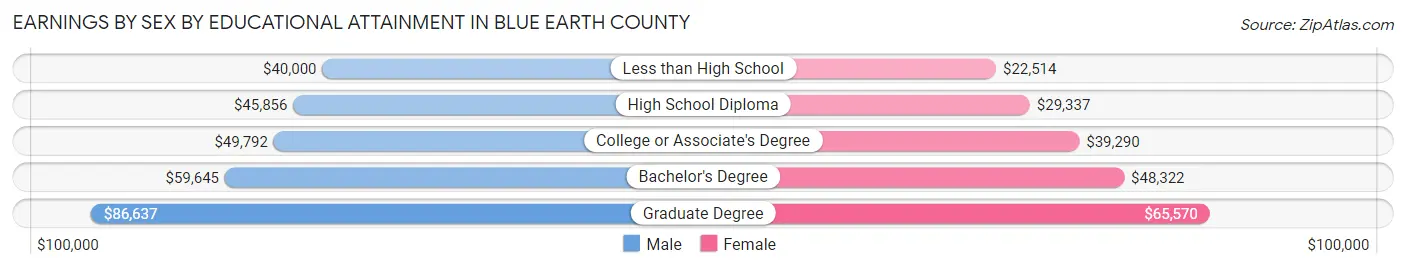
| Educational Attainment | Male Income | Female Income |
| Less than High School | $40,000 | $22,514 |
| High School Diploma | $45,856 | $29,337 |
| College or Associate's Degree | $49,792 | $39,290 |
| Bachelor's Degree | $59,645 | $48,322 |
| Graduate Degree | $86,637 | $65,570 |
| Total | $51,965 | $41,897 |
Family Income in Blue Earth County
Family Income Brackets in Blue Earth County
According to the Blue Earth County family income data, there are 3,629 families falling into the $100,000 to $149,999 income range, which is the most common income bracket and makes up 23.4% of all families. Conversely, the less than $10,000 income bracket is the least frequent group with only 295 families (1.9%) belonging to this category.
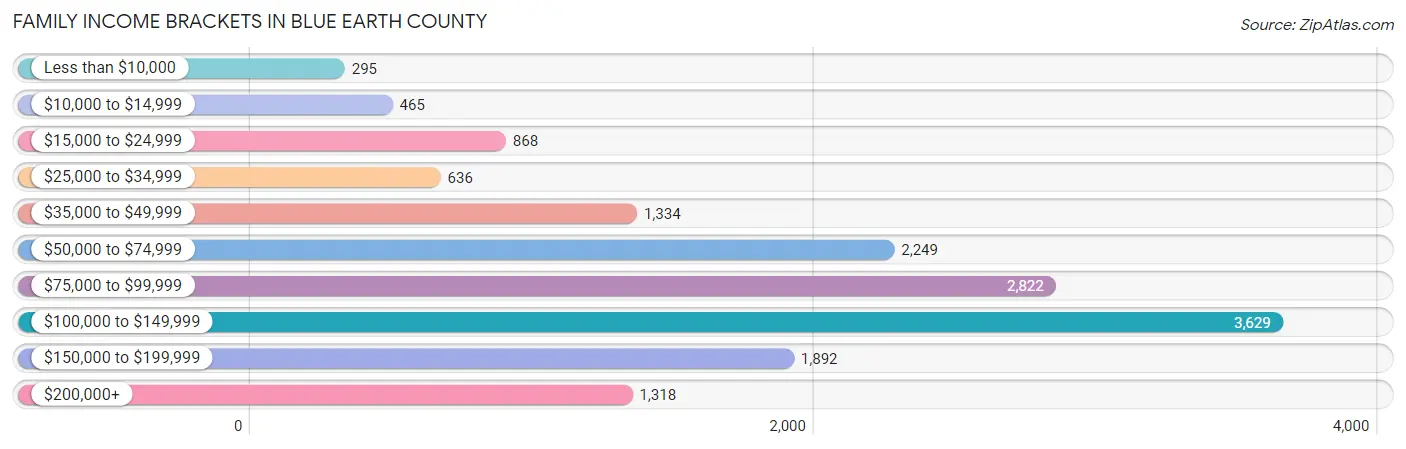
| Income Bracket | # Families | % Families |
| Less than $10,000 | 295 | 1.9% |
| $10,000 to $14,999 | 465 | 3.0% |
| $15,000 to $24,999 | 868 | 5.6% |
| $25,000 to $34,999 | 636 | 4.1% |
| $35,000 to $49,999 | 1,334 | 8.6% |
| $50,000 to $74,999 | 2,249 | 14.5% |
| $75,000 to $99,999 | 2,822 | 18.2% |
| $100,000 to $149,999 | 3,629 | 23.4% |
| $150,000 to $199,999 | 1,892 | 12.2% |
| $200,000+ | 1,318 | 8.5% |
Family Income by Famaliy Size in Blue Earth County
4-person families (2,590 | 16.7%) account for the highest median family income in Blue Earth County with $119,000 per family, while 2-person families (8,286 | 53.4%) have the highest median income of $40,122 per family member.
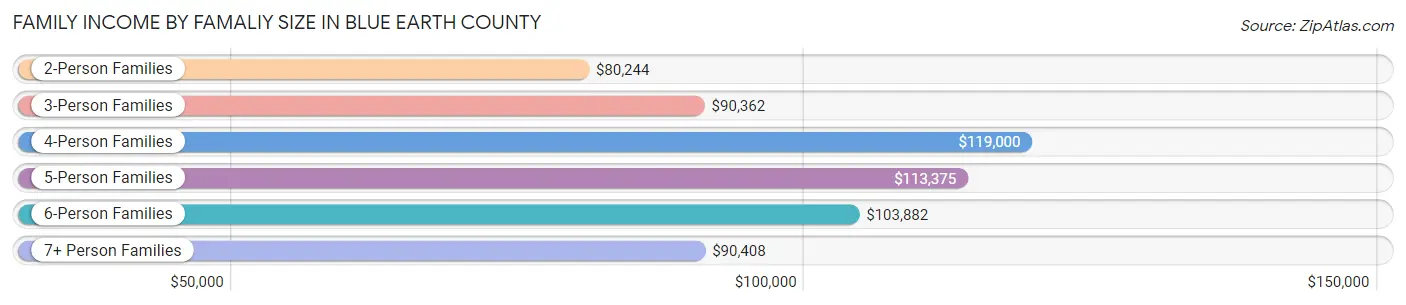
| Income Bracket | # Families | Median Income |
| 2-Person Families | 8,286 (53.4%) | $80,244 |
| 3-Person Families | 2,905 (18.7%) | $90,362 |
| 4-Person Families | 2,590 (16.7%) | $119,000 |
| 5-Person Families | 1,143 (7.4%) | $113,375 |
| 6-Person Families | 439 (2.8%) | $103,882 |
| 7+ Person Families | 144 (0.9%) | $90,408 |
| Total | 15,507 (100.0%) | $91,033 |
Family Income by Number of Earners in Blue Earth County
The median family income in Blue Earth County is $91,033, with families comprising 3+ earners (1,526) having the highest median family income of $133,450, while families with 1 earner (4,107) have the lowest median family income of $57,912, accounting for 9.8% and 26.5% of families, respectively.
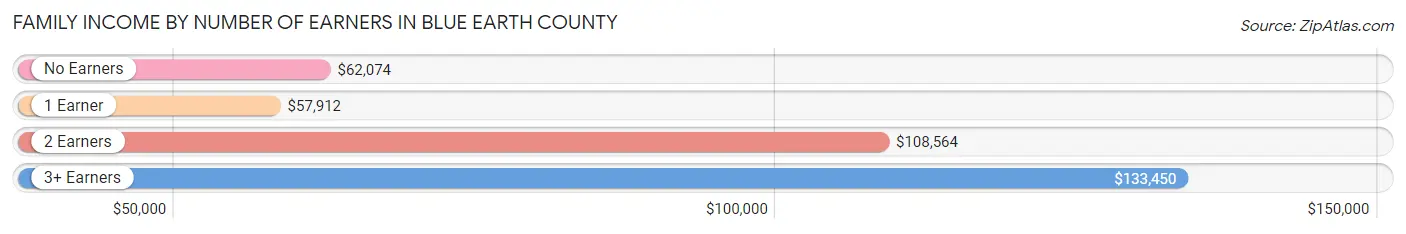
| Number of Earners | # Families | Median Income |
| No Earners | 2,211 (14.3%) | $62,074 |
| 1 Earner | 4,107 (26.5%) | $57,912 |
| 2 Earners | 7,663 (49.4%) | $108,564 |
| 3+ Earners | 1,526 (9.8%) | $133,450 |
| Total | 15,507 (100.0%) | $91,033 |
Household Income in Blue Earth County
Household Income Brackets in Blue Earth County
With 4,690 households falling in the category, the $100,000 to $149,999 income range is the most frequent in Blue Earth County, accounting for 17.3% of all households. In contrast, only 1,057 households (3.9%) fall into the $10,000 to $14,999 income bracket, making it the least populous group.
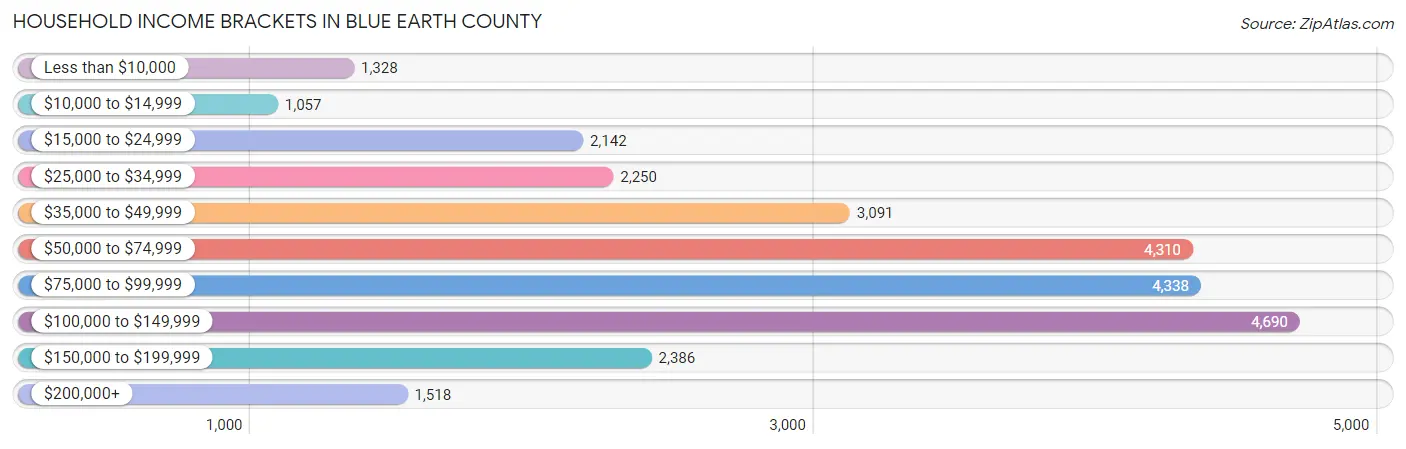
| Income Bracket | # Households | % Households |
| Less than $10,000 | 1,328 | 4.9% |
| $10,000 to $14,999 | 1,057 | 3.9% |
| $15,000 to $24,999 | 2,142 | 7.9% |
| $25,000 to $34,999 | 2,250 | 8.3% |
| $35,000 to $49,999 | 3,091 | 11.4% |
| $50,000 to $74,999 | 4,310 | 15.9% |
| $75,000 to $99,999 | 4,338 | 16.0% |
| $100,000 to $149,999 | 4,690 | 17.3% |
| $150,000 to $199,999 | 2,386 | 8.8% |
| $200,000+ | 1,518 | 5.6% |
Household Income by Householder Age in Blue Earth County
The median household income in Blue Earth County is $70,906, with the highest median household income of $89,871 found in the 45 to 64 years age bracket for the primary householder. A total of 7,738 households (28.5%) fall into this category. Meanwhile, the 15 to 24 years age bracket for the primary householder has the lowest median household income of $34,948, with 4,548 households (16.8%) in this group.
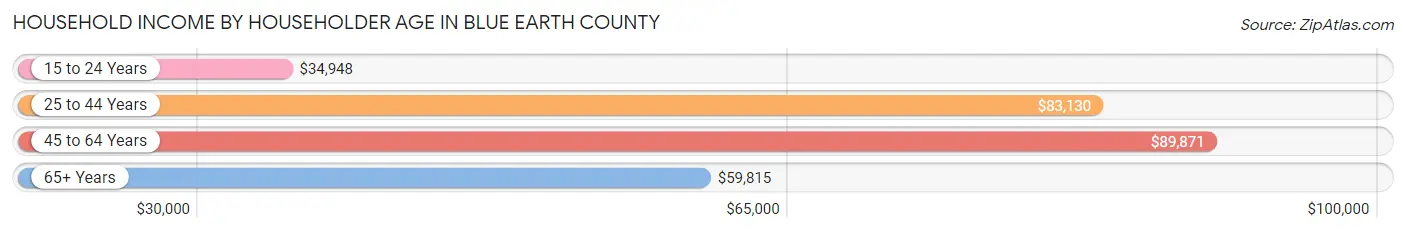
| Income Bracket | # Households | Median Income |
| 15 to 24 Years | 4,548 (16.8%) | $34,948 |
| 25 to 44 Years | 8,975 (33.1%) | $83,130 |
| 45 to 64 Years | 7,738 (28.5%) | $89,871 |
| 65+ Years | 5,849 (21.6%) | $59,815 |
| Total | 27,110 (100.0%) | $70,906 |
Poverty in Blue Earth County
Income Below Poverty by Sex and Age in Blue Earth County
With 14.9% poverty level for males and 17.9% for females among the residents of Blue Earth County, 18 to 24 year old males and 18 to 24 year old females are the most vulnerable to poverty, with 2,548 males (42.0%) and 2,907 females (46.3%) in their respective age groups living below the poverty level.
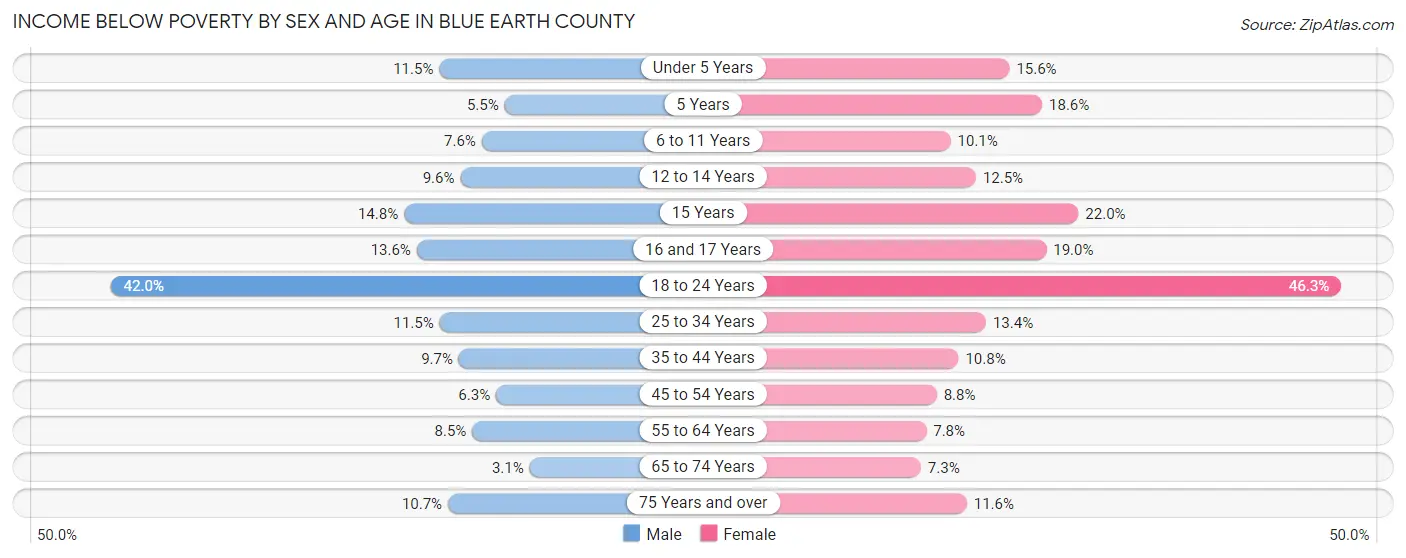
| Age Bracket | Male | Female |
| Under 5 Years | 212 (11.5%) | 269 (15.6%) |
| 5 Years | 25 (5.5%) | 66 (18.6%) |
| 6 to 11 Years | 174 (7.6%) | 217 (10.1%) |
| 12 to 14 Years | 116 (9.6%) | 128 (12.4%) |
| 15 Years | 63 (14.8%) | 85 (22.0%) |
| 16 and 17 Years | 115 (13.6%) | 112 (19.0%) |
| 18 to 24 Years | 2,548 (42.0%) | 2,907 (46.3%) |
| 25 to 34 Years | 559 (11.5%) | 572 (13.4%) |
| 35 to 44 Years | 407 (9.7%) | 395 (10.8%) |
| 45 to 54 Years | 200 (6.2%) | 279 (8.8%) |
| 55 to 64 Years | 294 (8.5%) | 286 (7.8%) |
| 65 to 74 Years | 87 (3.1%) | 206 (7.3%) |
| 75 Years and over | 177 (10.7%) | 257 (11.6%) |
| Total | 4,977 (14.9%) | 5,779 (17.9%) |
Income Above Poverty by Sex and Age in Blue Earth County
According to the poverty statistics in Blue Earth County, males aged 65 to 74 years and females aged 65 to 74 years are the age groups that are most secure financially, with 96.9% of males and 92.7% of females in these age groups living above the poverty line.
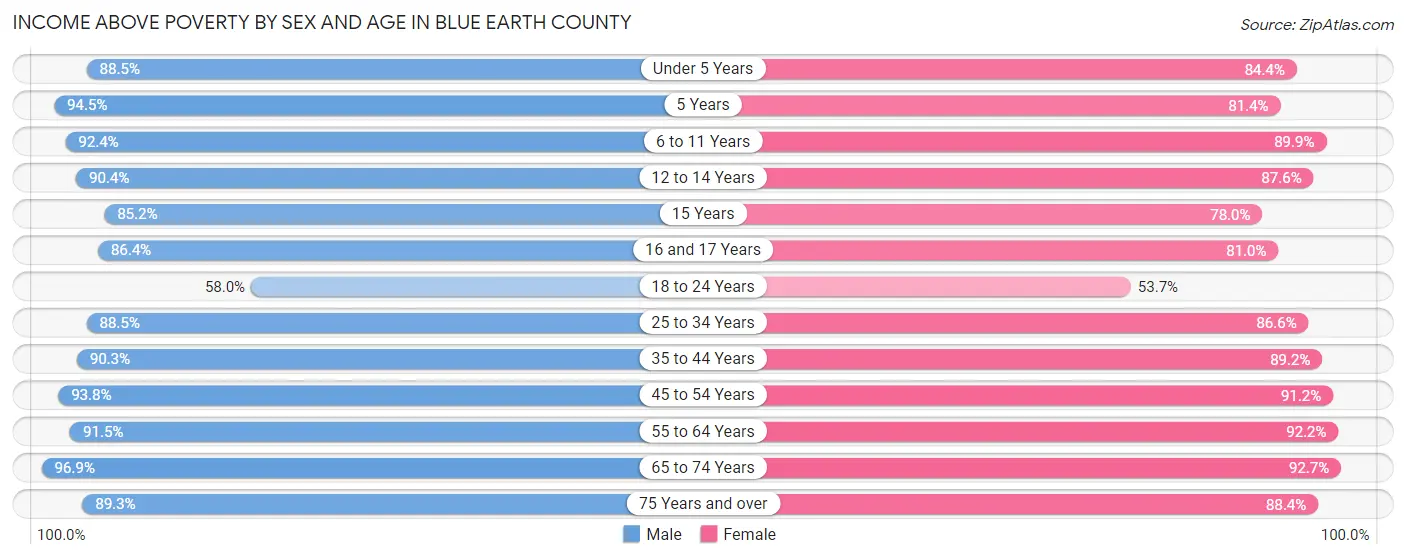
| Age Bracket | Male | Female |
| Under 5 Years | 1,629 (88.5%) | 1,460 (84.4%) |
| 5 Years | 433 (94.5%) | 289 (81.4%) |
| 6 to 11 Years | 2,123 (92.4%) | 1,933 (89.9%) |
| 12 to 14 Years | 1,098 (90.4%) | 900 (87.5%) |
| 15 Years | 363 (85.2%) | 302 (78.0%) |
| 16 and 17 Years | 730 (86.4%) | 478 (81.0%) |
| 18 to 24 Years | 3,517 (58.0%) | 3,366 (53.7%) |
| 25 to 34 Years | 4,306 (88.5%) | 3,702 (86.6%) |
| 35 to 44 Years | 3,789 (90.3%) | 3,251 (89.2%) |
| 45 to 54 Years | 2,999 (93.8%) | 2,888 (91.2%) |
| 55 to 64 Years | 3,181 (91.5%) | 3,363 (92.2%) |
| 65 to 74 Years | 2,680 (96.9%) | 2,599 (92.7%) |
| 75 Years and over | 1,475 (89.3%) | 1,959 (88.4%) |
| Total | 28,323 (85.1%) | 26,490 (82.1%) |
Income Below Poverty Among Married-Couple Families in Blue Earth County
The poverty statistics for married-couple families in Blue Earth County show that 2.8% or 332 of the total 11,824 families live below the poverty line. Families with 3 or 4 children have the highest poverty rate of 4.2%, comprising of 48 families. On the other hand, families with 5 or more children have the lowest poverty rate of 0.0%, which includes 0 families.
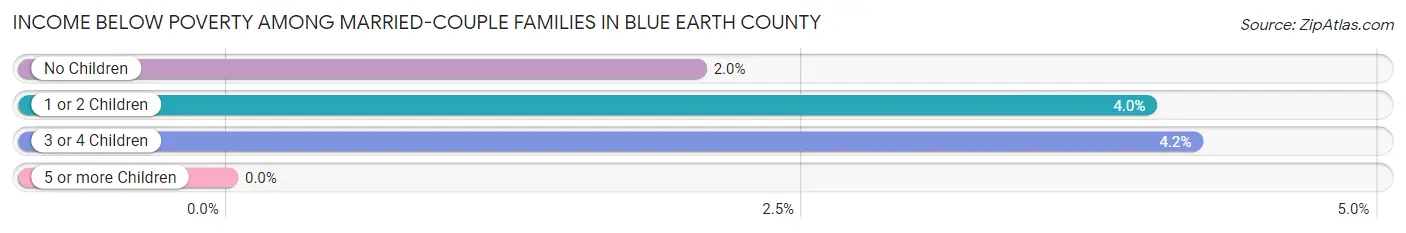
| Children | Above Poverty | Below Poverty |
| No Children | 6,980 (98.0%) | 145 (2.0%) |
| 1 or 2 Children | 3,336 (96.0%) | 139 (4.0%) |
| 3 or 4 Children | 1,094 (95.8%) | 48 (4.2%) |
| 5 or more Children | 82 (100.0%) | 0 (0.0%) |
| Total | 11,492 (97.2%) | 332 (2.8%) |
Income Below Poverty Among Single-Parent Households in Blue Earth County
According to the poverty data in Blue Earth County, 18.9% or 237 single-father households and 34.0% or 826 single-mother households are living below the poverty line. Among single-father households, those with 5 or more children have the highest poverty rate, with 7 households (100.0%) experiencing poverty. Likewise, among single-mother households, those with 3 or 4 children have the highest poverty rate, with 94 households (49.2%) falling below the poverty line.
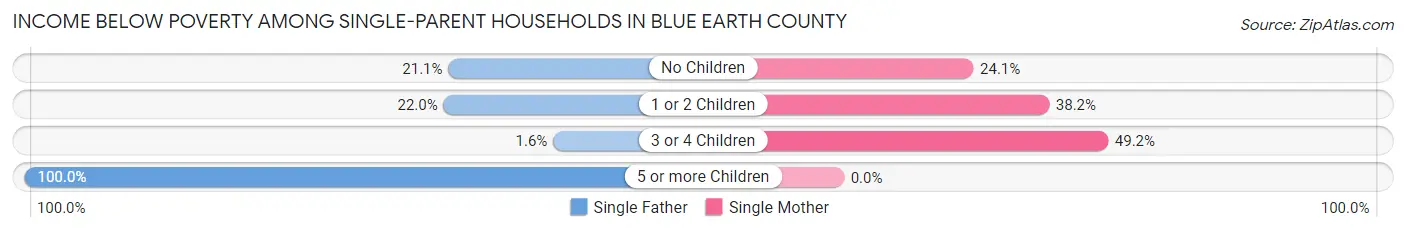
| Children | Single Father | Single Mother |
| No Children | 102 (21.1%) | 203 (24.1%) |
| 1 or 2 Children | 125 (22.0%) | 529 (38.2%) |
| 3 or 4 Children | 3 (1.5%) | 94 (49.2%) |
| 5 or more Children | 7 (100.0%) | 0 (0.0%) |
| Total | 237 (18.9%) | 826 (34.0%) |
Income Below Poverty Among Married-Couple vs Single-Parent Households in Blue Earth County
The poverty data for Blue Earth County shows that 332 of the married-couple family households (2.8%) and 1,063 of the single-parent households (28.9%) are living below the poverty level. Within the married-couple family households, those with 3 or 4 children have the highest poverty rate, with 48 households (4.2%) falling below the poverty line. Among the single-parent households, those with 5 or more children have the highest poverty rate, with 7 household (35.0%) living below poverty.
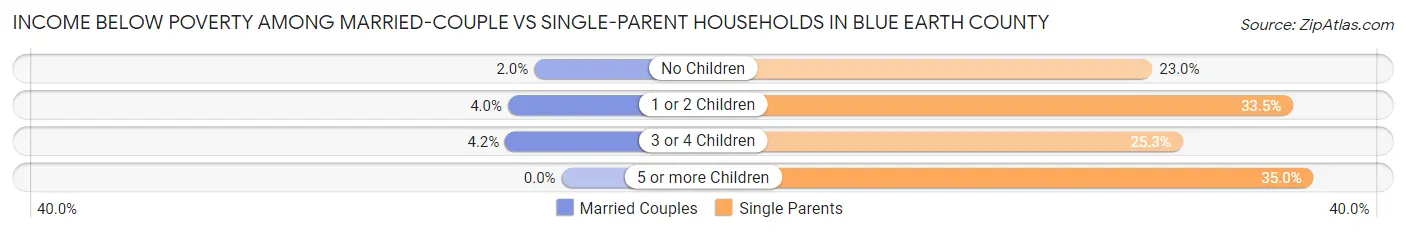
| Children | Married-Couple Families | Single-Parent Households |
| No Children | 145 (2.0%) | 305 (23.0%) |
| 1 or 2 Children | 139 (4.0%) | 654 (33.5%) |
| 3 or 4 Children | 48 (4.2%) | 97 (25.3%) |
| 5 or more Children | 0 (0.0%) | 7 (35.0%) |
| Total | 332 (2.8%) | 1,063 (28.9%) |
Employment Characteristics in Blue Earth County
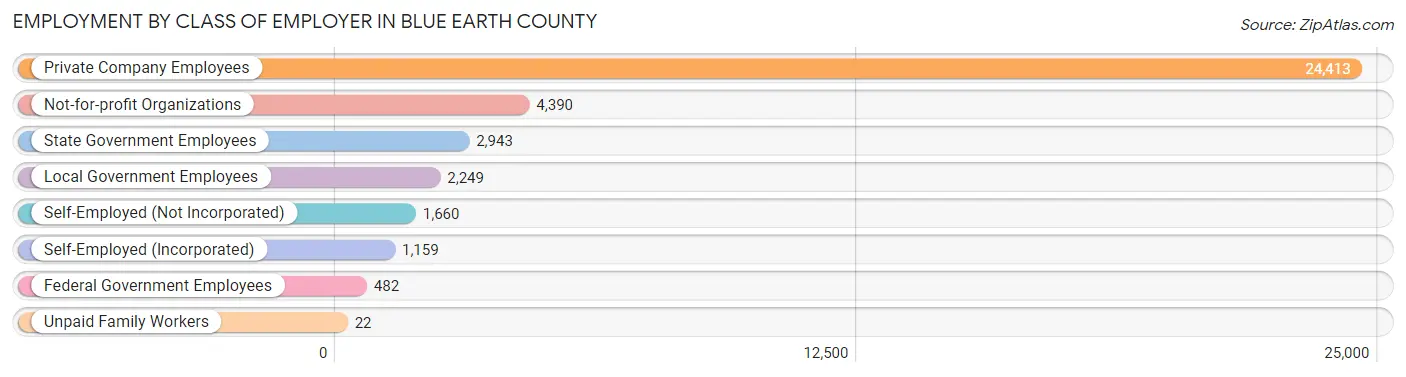
Employment by Class of Employer in Blue Earth County
Among the 37,318 employed individuals in Blue Earth County, private company employees (24,413 | 65.4%), not-for-profit organizations (4,390 | 11.8%), and state government employees (2,943 | 7.9%) make up the most common classes of employment.
| Employer Class | # Employees | % Employees |
| Private Company Employees | 24,413 | 65.4% |
| Self-Employed (Incorporated) | 1,159 | 3.1% |
| Self-Employed (Not Incorporated) | 1,660 | 4.4% |
| Not-for-profit Organizations | 4,390 | 11.8% |
| Local Government Employees | 2,249 | 6.0% |
| State Government Employees | 2,943 | 7.9% |
| Federal Government Employees | 482 | 1.3% |
| Unpaid Family Workers | 22 | 0.1% |
| Total | 37,318 | 100.0% |
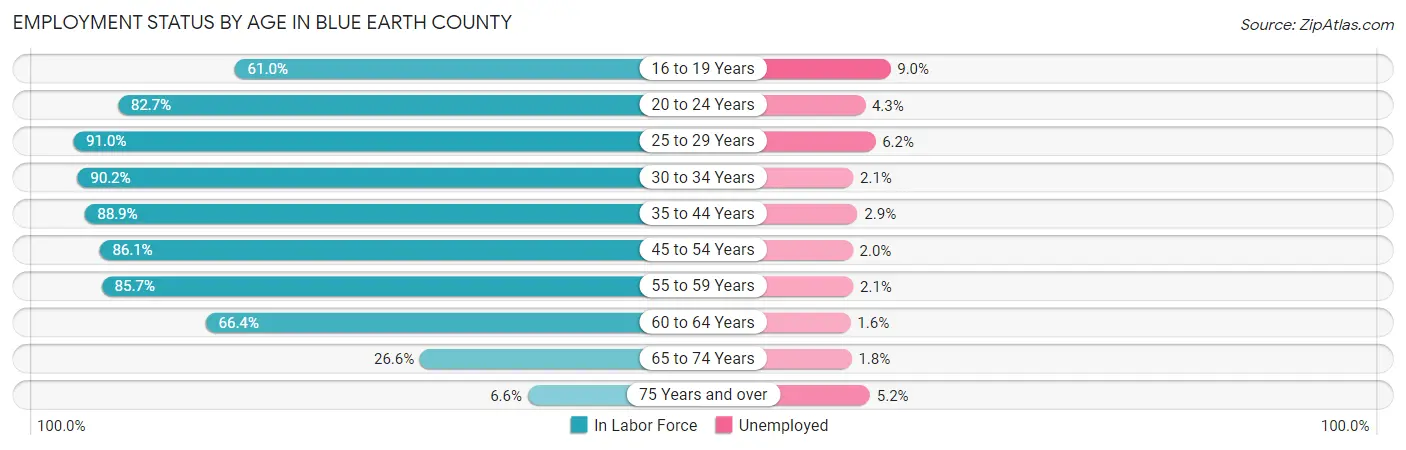
Employment Status by Age in Blue Earth County
According to the labor force statistics for Blue Earth County, out of the total population over 16 years of age (56,926), 70.9% or 40,361 individuals are in the labor force, with 3.7% or 1,493 of them unemployed. The age group with the highest labor force participation rate is 25 to 29 years, with 91.0% or 4,556 individuals in the labor force. Within the labor force, the 16 to 19 years age range has the highest percentage of unemployed individuals, with 9.0% or 303 of them being unemployed.
| Age Bracket | In Labor Force | Unemployed |
| 16 to 19 Years | 3,362 (61.0%) | 303 (9.0%) |
| 20 to 24 Years | 8,977 (82.7%) | 386 (4.3%) |
| 25 to 29 Years | 4,556 (91.0%) | 282 (6.2%) |
| 30 to 34 Years | 3,768 (90.2%) | 79 (2.1%) |
| 35 to 44 Years | 6,996 (88.9%) | 203 (2.9%) |
| 45 to 54 Years | 5,497 (86.1%) | 110 (2.0%) |
| 55 to 59 Years | 3,015 (85.7%) | 63 (2.1%) |
| 60 to 64 Years | 2,401 (66.4%) | 38 (1.6%) |
| 65 to 74 Years | 1,503 (26.6%) | 27 (1.8%) |
| 75 Years and over | 286 (6.6%) | 15 (5.2%) |
| Total | 40,361 (70.9%) | 1,493 (3.7%) |
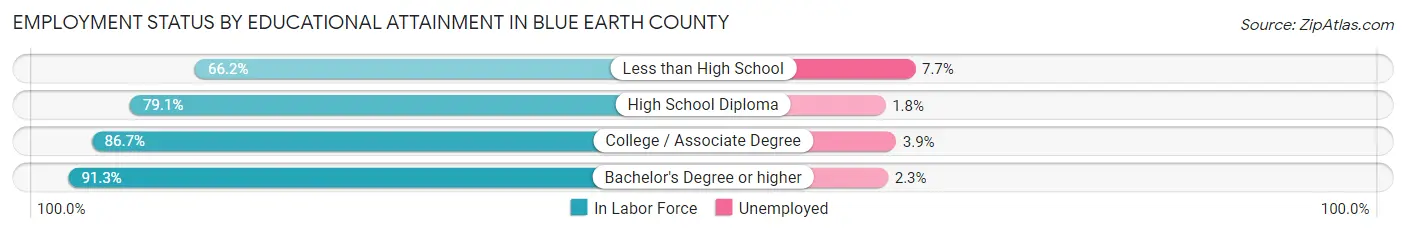
Employment Status by Educational Attainment in Blue Earth County
According to labor force statistics for Blue Earth County, 85.8% of individuals (26,232) out of the total population between 25 and 64 years of age (30,573) are in the labor force, with 3.0% or 787 of them being unemployed. The group with the highest labor force participation rate are those with the educational attainment of bachelor's degree or higher, with 91.3% or 10,324 individuals in the labor force. Within the labor force, individuals with less than high school education have the highest percentage of unemployment, with 7.7% or 71 of them being unemployed.
| Educational Attainment | In Labor Force | Unemployed |
| Less than High School | 923 (66.2%) | 107 (7.7%) |
| High School Diploma | 5,279 (79.1%) | 120 (1.8%) |
| College / Associate Degree | 9,708 (86.7%) | 437 (3.9%) |
| Bachelor's Degree or higher | 10,324 (91.3%) | 260 (2.3%) |
| Total | 26,232 (85.8%) | 917 (3.0%) |
Employment Occupations by Sex in Blue Earth County
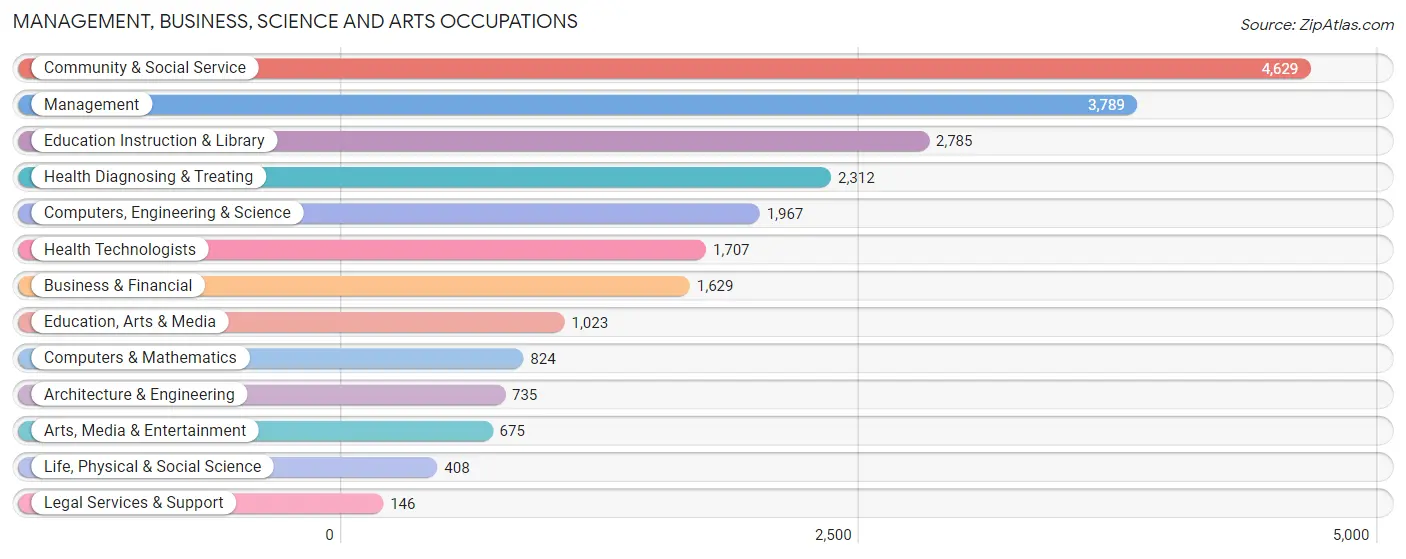
Management, Business, Science and Arts Occupations
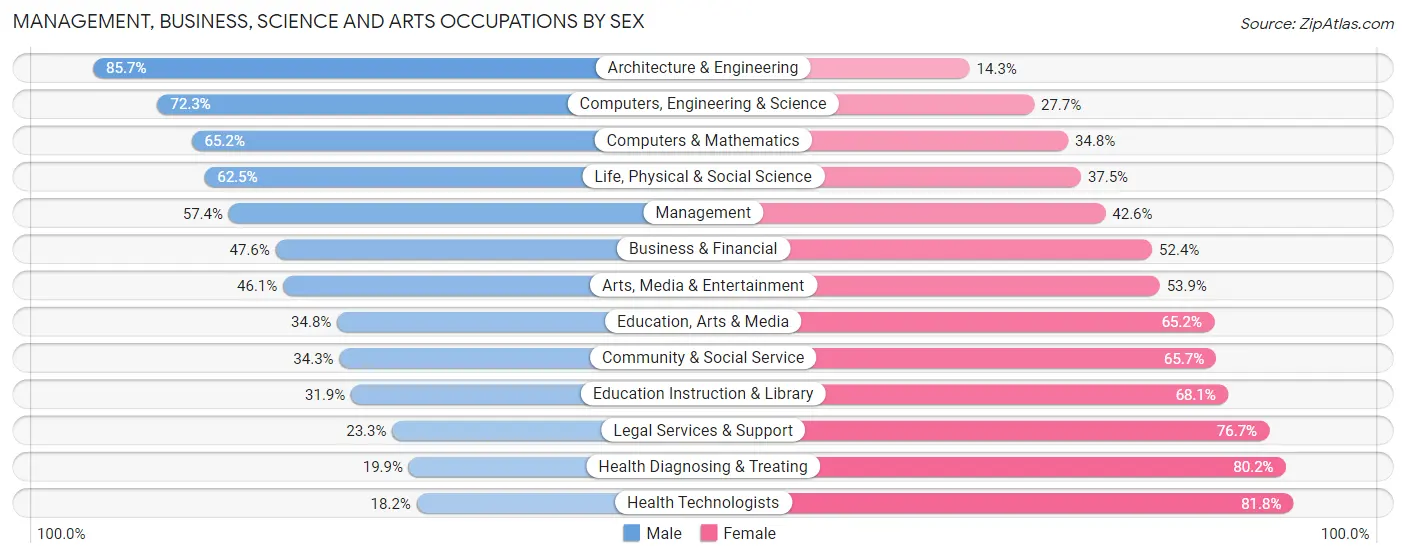
The most common Management, Business, Science and Arts occupations in Blue Earth County are Community & Social Service (4,629 | 11.9%), Management (3,789 | 9.8%), Education Instruction & Library (2,785 | 7.2%), Health Diagnosing & Treating (2,312 | 6.0%), and Computers, Engineering & Science (1,967 | 5.1%).
Management, Business, Science and Arts Occupations by Sex
Within the Management, Business, Science and Arts occupations in Blue Earth County, the most male-oriented occupations are Architecture & Engineering (85.7%), Computers, Engineering & Science (72.3%), and Computers & Mathematics (65.2%), while the most female-oriented occupations are Health Technologists (81.8%), Health Diagnosing & Treating (80.1%), and Legal Services & Support (76.7%).
| Occupation | Male | Female |
| Management | 2,175 (57.4%) | 1,614 (42.6%) |
| Business & Financial | 776 (47.6%) | 853 (52.4%) |
| Computers, Engineering & Science | 1,422 (72.3%) | 545 (27.7%) |
| Computers & Mathematics | 537 (65.2%) | 287 (34.8%) |
| Architecture & Engineering | 630 (85.7%) | 105 (14.3%) |
| Life, Physical & Social Science | 255 (62.5%) | 153 (37.5%) |
| Community & Social Service | 1,589 (34.3%) | 3,040 (65.7%) |
| Education, Arts & Media | 356 (34.8%) | 667 (65.2%) |
| Legal Services & Support | 34 (23.3%) | 112 (76.7%) |
| Education Instruction & Library | 888 (31.9%) | 1,897 (68.1%) |
| Arts, Media & Entertainment | 311 (46.1%) | 364 (53.9%) |
| Health Diagnosing & Treating | 459 (19.9%) | 1,853 (80.1%) |
| Health Technologists | 311 (18.2%) | 1,396 (81.8%) |
| Total (Category) | 6,421 (44.8%) | 7,905 (55.2%) |
| Total (Overall) | 20,173 (52.0%) | 18,628 (48.0%) |
Services Occupations
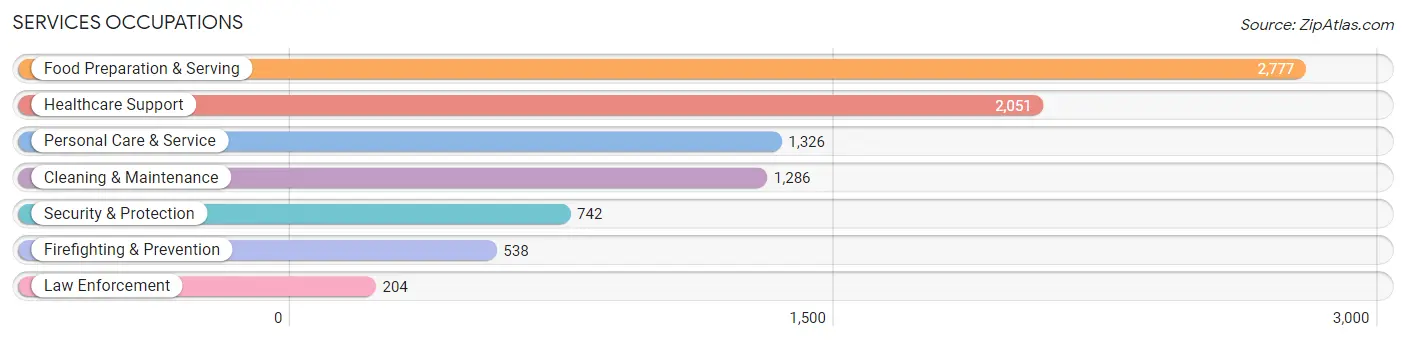
The most common Services occupations in Blue Earth County are Food Preparation & Serving (2,777 | 7.2%), Healthcare Support (2,051 | 5.3%), Personal Care & Service (1,326 | 3.4%), Cleaning & Maintenance (1,286 | 3.3%), and Security & Protection (742 | 1.9%).
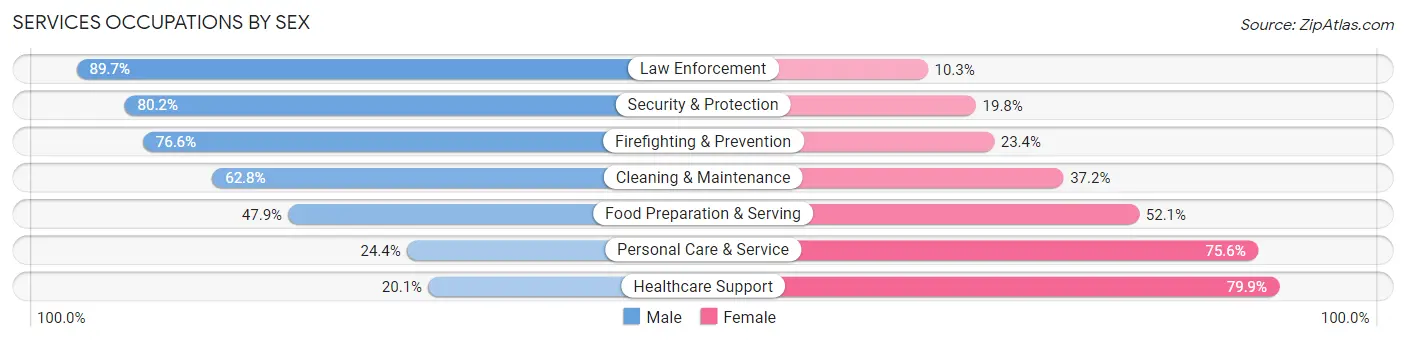
Services Occupations by Sex
Within the Services occupations in Blue Earth County, the most male-oriented occupations are Law Enforcement (89.7%), Security & Protection (80.2%), and Firefighting & Prevention (76.6%), while the most female-oriented occupations are Healthcare Support (79.9%), Personal Care & Service (75.6%), and Food Preparation & Serving (52.1%).
| Occupation | Male | Female |
| Healthcare Support | 413 (20.1%) | 1,638 (79.9%) |
| Security & Protection | 595 (80.2%) | 147 (19.8%) |
| Firefighting & Prevention | 412 (76.6%) | 126 (23.4%) |
| Law Enforcement | 183 (89.7%) | 21 (10.3%) |
| Food Preparation & Serving | 1,329 (47.9%) | 1,448 (52.1%) |
| Cleaning & Maintenance | 808 (62.8%) | 478 (37.2%) |
| Personal Care & Service | 323 (24.4%) | 1,003 (75.6%) |
| Total (Category) | 3,468 (42.4%) | 4,714 (57.6%) |
| Total (Overall) | 20,173 (52.0%) | 18,628 (48.0%) |
Sales and Office Occupations
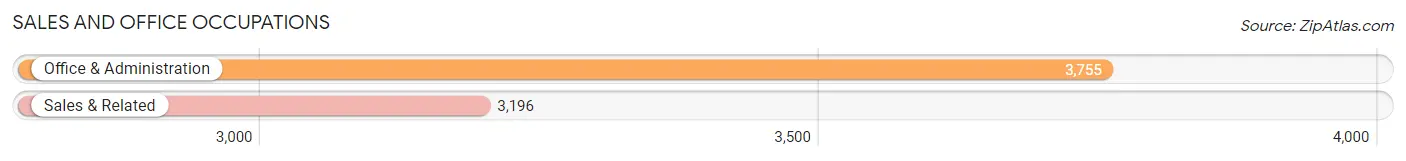
The most common Sales and Office occupations in Blue Earth County are Office & Administration (3,755 | 9.7%), and Sales & Related (3,196 | 8.2%).
Sales and Office Occupations by Sex
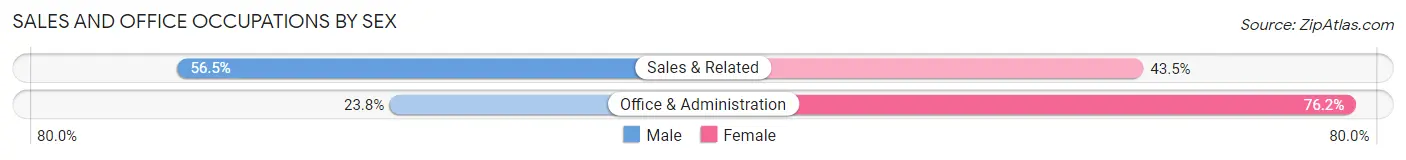
| Occupation | Male | Female |
| Sales & Related | 1,805 (56.5%) | 1,391 (43.5%) |
| Office & Administration | 893 (23.8%) | 2,862 (76.2%) |
| Total (Category) | 2,698 (38.8%) | 4,253 (61.2%) |
| Total (Overall) | 20,173 (52.0%) | 18,628 (48.0%) |
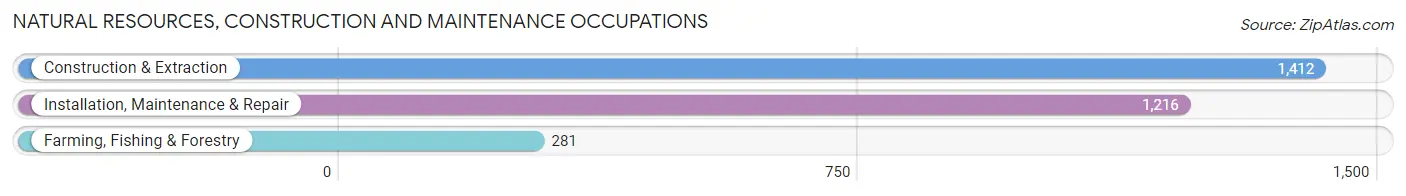
Natural Resources, Construction and Maintenance Occupations
The most common Natural Resources, Construction and Maintenance occupations in Blue Earth County are Construction & Extraction (1,412 | 3.6%), Installation, Maintenance & Repair (1,216 | 3.1%), and Farming, Fishing & Forestry (281 | 0.7%).
Natural Resources, Construction and Maintenance Occupations by Sex
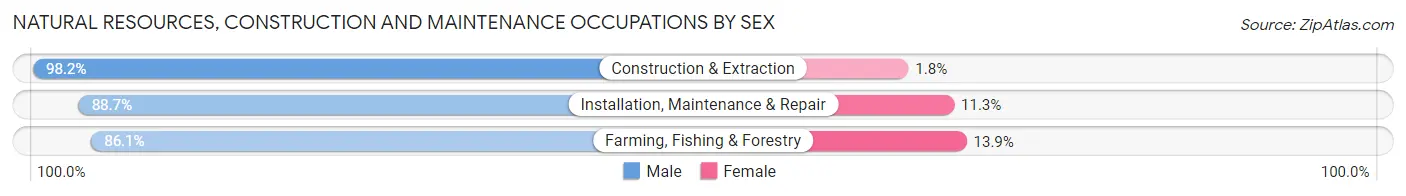
| Occupation | Male | Female |
| Farming, Fishing & Forestry | 242 (86.1%) | 39 (13.9%) |
| Construction & Extraction | 1,387 (98.2%) | 25 (1.8%) |
| Installation, Maintenance & Repair | 1,079 (88.7%) | 137 (11.3%) |
| Total (Category) | 2,708 (93.1%) | 201 (6.9%) |
| Total (Overall) | 20,173 (52.0%) | 18,628 (48.0%) |
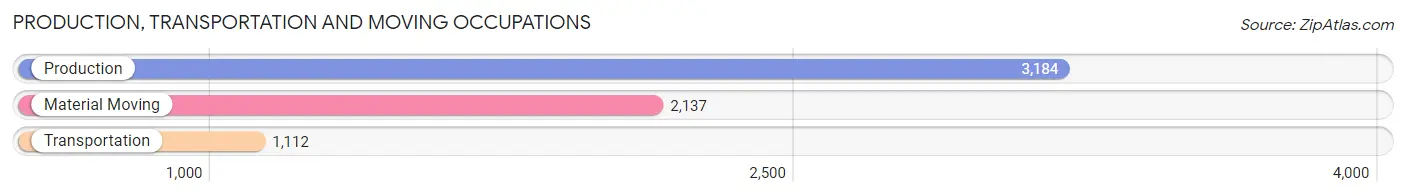
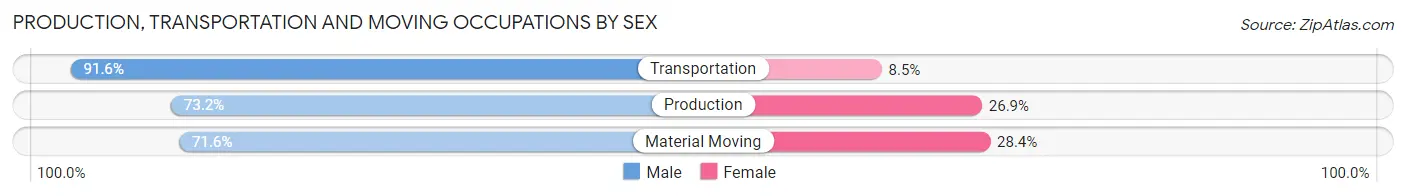
Production, Transportation and Moving Occupations
The most common Production, Transportation and Moving occupations in Blue Earth County are Production (3,184 | 8.2%), Material Moving (2,137 | 5.5%), and Transportation (1,112 | 2.9%).
Production, Transportation and Moving Occupations by Sex
| Occupation | Male | Female |
| Production | 2,329 (73.2%) | 855 (26.9%) |
| Transportation | 1,018 (91.5%) | 94 (8.5%) |
| Material Moving | 1,531 (71.6%) | 606 (28.4%) |
| Total (Category) | 4,878 (75.8%) | 1,555 (24.2%) |
| Total (Overall) | 20,173 (52.0%) | 18,628 (48.0%) |
Employment Industries by Sex in Blue Earth County
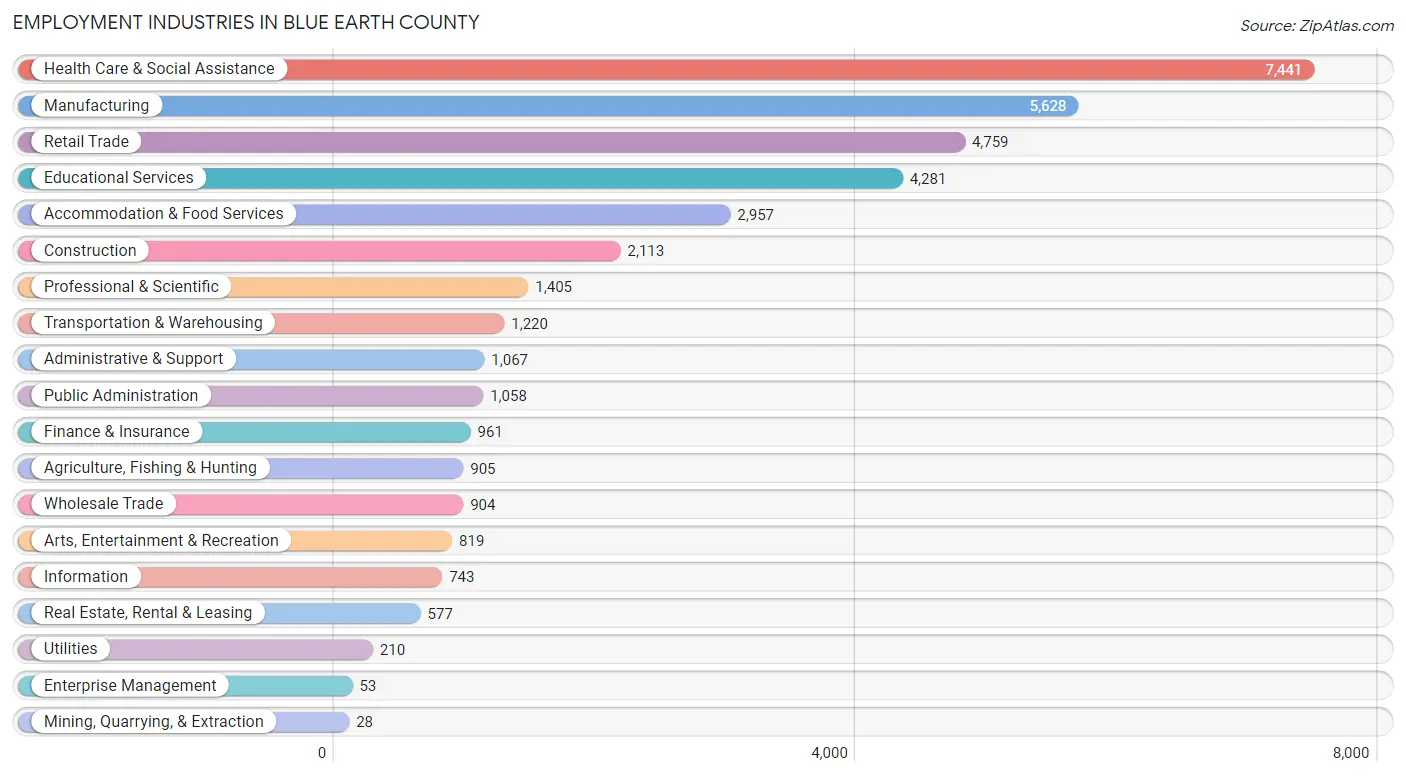
Employment Industries in Blue Earth County
The major employment industries in Blue Earth County include Health Care & Social Assistance (7,441 | 19.2%), Manufacturing (5,628 | 14.5%), Retail Trade (4,759 | 12.3%), Educational Services (4,281 | 11.0%), and Accommodation & Food Services (2,957 | 7.6%).
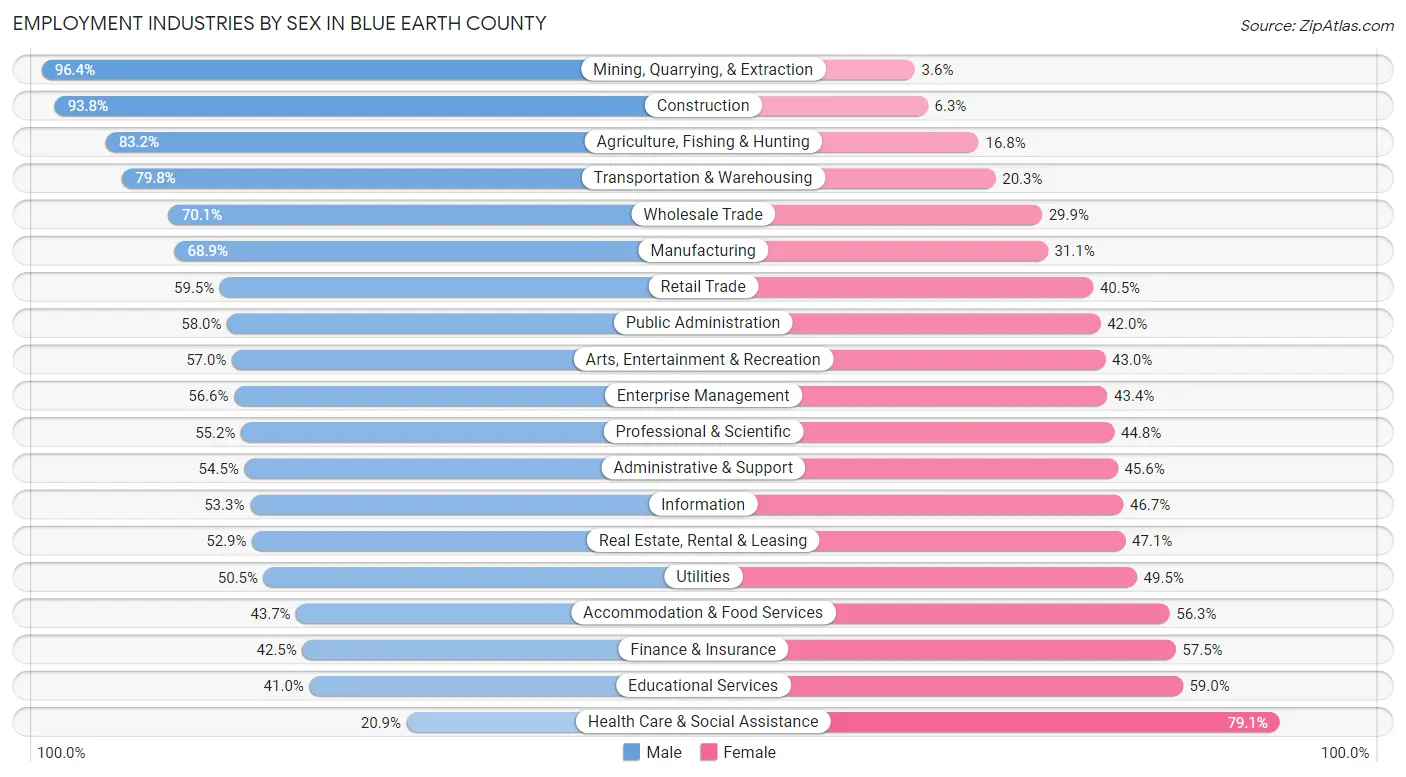
Employment Industries by Sex in Blue Earth County
The Blue Earth County industries that see more men than women are Mining, Quarrying, & Extraction (96.4%), Construction (93.8%), and Agriculture, Fishing & Hunting (83.2%), whereas the industries that tend to have a higher number of women are Health Care & Social Assistance (79.1%), Educational Services (59.0%), and Finance & Insurance (57.5%).
| Industry | Male | Female |
| Agriculture, Fishing & Hunting | 753 (83.2%) | 152 (16.8%) |
| Mining, Quarrying, & Extraction | 27 (96.4%) | 1 (3.6%) |
| Construction | 1,981 (93.8%) | 132 (6.2%) |
| Manufacturing | 3,880 (68.9%) | 1,748 (31.1%) |
| Wholesale Trade | 634 (70.1%) | 270 (29.9%) |
| Retail Trade | 2,833 (59.5%) | 1,926 (40.5%) |
| Transportation & Warehousing | 973 (79.7%) | 247 (20.3%) |
| Utilities | 106 (50.5%) | 104 (49.5%) |
| Information | 396 (53.3%) | 347 (46.7%) |
| Finance & Insurance | 408 (42.5%) | 553 (57.5%) |
| Real Estate, Rental & Leasing | 305 (52.9%) | 272 (47.1%) |
| Professional & Scientific | 775 (55.2%) | 630 (44.8%) |
| Enterprise Management | 30 (56.6%) | 23 (43.4%) |
| Administrative & Support | 581 (54.4%) | 486 (45.6%) |
| Educational Services | 1,755 (41.0%) | 2,526 (59.0%) |
| Health Care & Social Assistance | 1,554 (20.9%) | 5,887 (79.1%) |
| Arts, Entertainment & Recreation | 467 (57.0%) | 352 (43.0%) |
| Accommodation & Food Services | 1,293 (43.7%) | 1,664 (56.3%) |
| Public Administration | 614 (58.0%) | 444 (42.0%) |
| Total | 20,173 (52.0%) | 18,628 (48.0%) |
Education in Blue Earth County
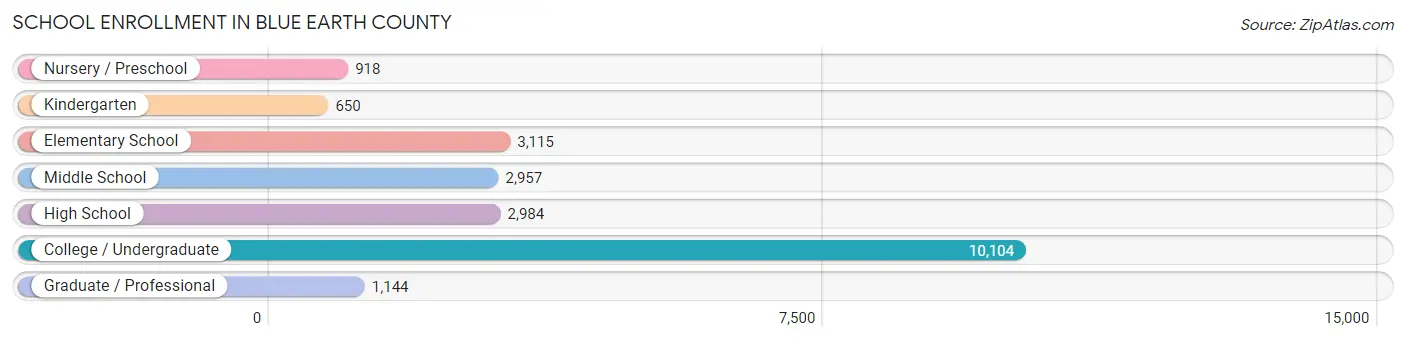
School Enrollment in Blue Earth County
The most common levels of schooling among the 21,872 students in Blue Earth County are college / undergraduate (10,104 | 46.2%), elementary school (3,115 | 14.2%), and high school (2,984 | 13.6%).
| School Level | # Students | % Students |
| Nursery / Preschool | 918 | 4.2% |
| Kindergarten | 650 | 3.0% |
| Elementary School | 3,115 | 14.2% |
| Middle School | 2,957 | 13.5% |
| High School | 2,984 | 13.6% |
| College / Undergraduate | 10,104 | 46.2% |
| Graduate / Professional | 1,144 | 5.2% |
| Total | 21,872 | 100.0% |
School Enrollment by Age by Funding Source in Blue Earth County
Out of a total of 21,872 students who are enrolled in schools in Blue Earth County, 2,362 (10.8%) attend a private institution, while the remaining 19,510 (89.2%) are enrolled in public schools. The age group of 3 to 4 year olds has the highest likelihood of being enrolled in private schools, with 203 (32.2% in the age bracket) enrolled. Conversely, the age group of 15 to 17 year olds has the lowest likelihood of being enrolled in a private school, with 2,125 (95.6% in the age bracket) attending a public institution.
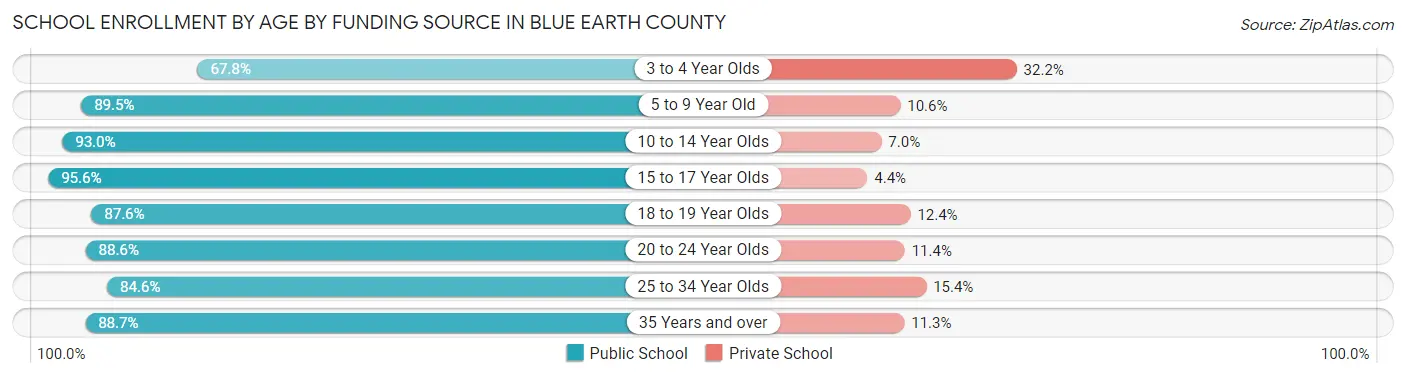
| Age Bracket | Public School | Private School |
| 3 to 4 Year Olds | 427 (67.8%) | 203 (32.2%) |
| 5 to 9 Year Old | 3,161 (89.4%) | 373 (10.5%) |
| 10 to 14 Year Olds | 3,464 (93.0%) | 262 (7.0%) |
| 15 to 17 Year Olds | 2,125 (95.6%) | 98 (4.4%) |
| 18 to 19 Year Olds | 3,301 (87.6%) | 469 (12.4%) |
| 20 to 24 Year Olds | 5,619 (88.6%) | 721 (11.4%) |
| 25 to 34 Year Olds | 826 (84.6%) | 150 (15.4%) |
| 35 Years and over | 597 (88.7%) | 76 (11.3%) |
| Total | 19,510 (89.2%) | 2,362 (10.8%) |
Educational Attainment by Field of Study in Blue Earth County
Business (2,726 | 17.4%), education (2,319 | 14.8%), science & technology (1,783 | 11.4%), arts & humanities (1,573 | 10.0%), and social sciences (1,133 | 7.2%) are the most common fields of study among 15,704 individuals in Blue Earth County who have obtained a bachelor's degree or higher.
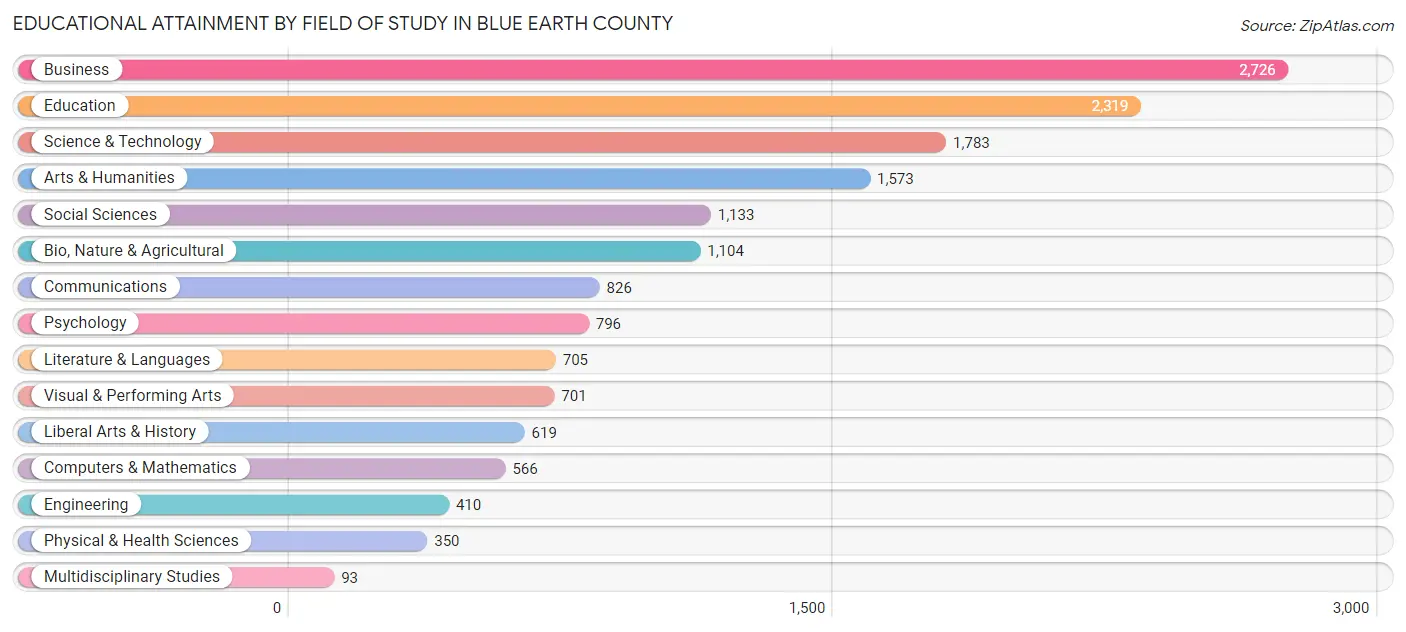
| Field of Study | # Graduates | % Graduates |
| Computers & Mathematics | 566 | 3.6% |
| Bio, Nature & Agricultural | 1,104 | 7.0% |
| Physical & Health Sciences | 350 | 2.2% |
| Psychology | 796 | 5.1% |
| Social Sciences | 1,133 | 7.2% |
| Engineering | 410 | 2.6% |
| Multidisciplinary Studies | 93 | 0.6% |
| Science & Technology | 1,783 | 11.4% |
| Business | 2,726 | 17.4% |
| Education | 2,319 | 14.8% |
| Literature & Languages | 705 | 4.5% |
| Liberal Arts & History | 619 | 3.9% |
| Visual & Performing Arts | 701 | 4.5% |
| Communications | 826 | 5.3% |
| Arts & Humanities | 1,573 | 10.0% |
| Total | 15,704 | 100.0% |
Transportation & Commute in Blue Earth County
Vehicle Availability by Sex in Blue Earth County
The most prevalent vehicle ownership categories in Blue Earth County are males with 2 vehicles (8,286, accounting for 44.1%) and females with 2 vehicles (7,342, making up 47.9%).
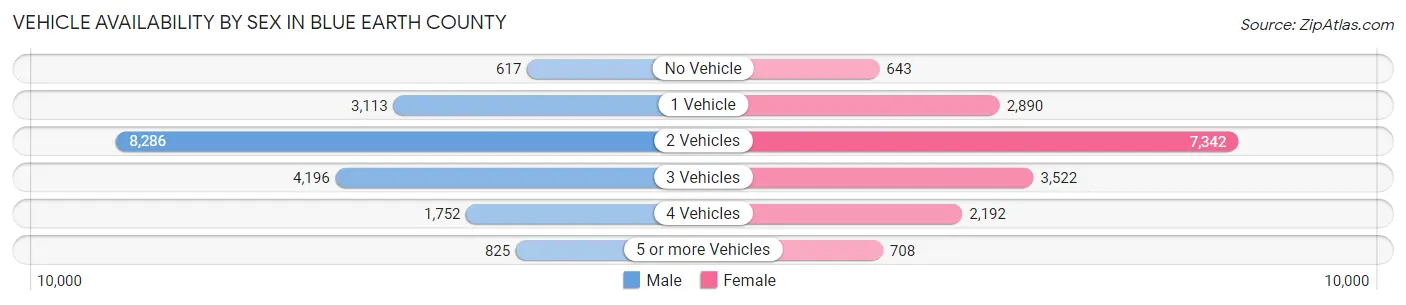
| Vehicles Available | Male | Female |
| No Vehicle | 617 (3.3%) | 643 (3.7%) |
| 1 Vehicle | 3,113 (16.6%) | 2,890 (16.7%) |
| 2 Vehicles | 8,286 (44.1%) | 7,342 (42.4%) |
| 3 Vehicles | 4,196 (22.3%) | 3,522 (20.4%) |
| 4 Vehicles | 1,752 (9.3%) | 2,192 (12.7%) |
| 5 or more Vehicles | 825 (4.4%) | 708 (4.1%) |
| Total | 18,789 (100.0%) | 17,297 (100.0%) |
Commute Time in Blue Earth County
The most frequently occuring commute durations in Blue Earth County are 10 to 14 minutes (9,891 commuters, 28.9%), 5 to 9 minutes (6,586 commuters, 19.2%), and 15 to 19 minutes (6,208 commuters, 18.1%).
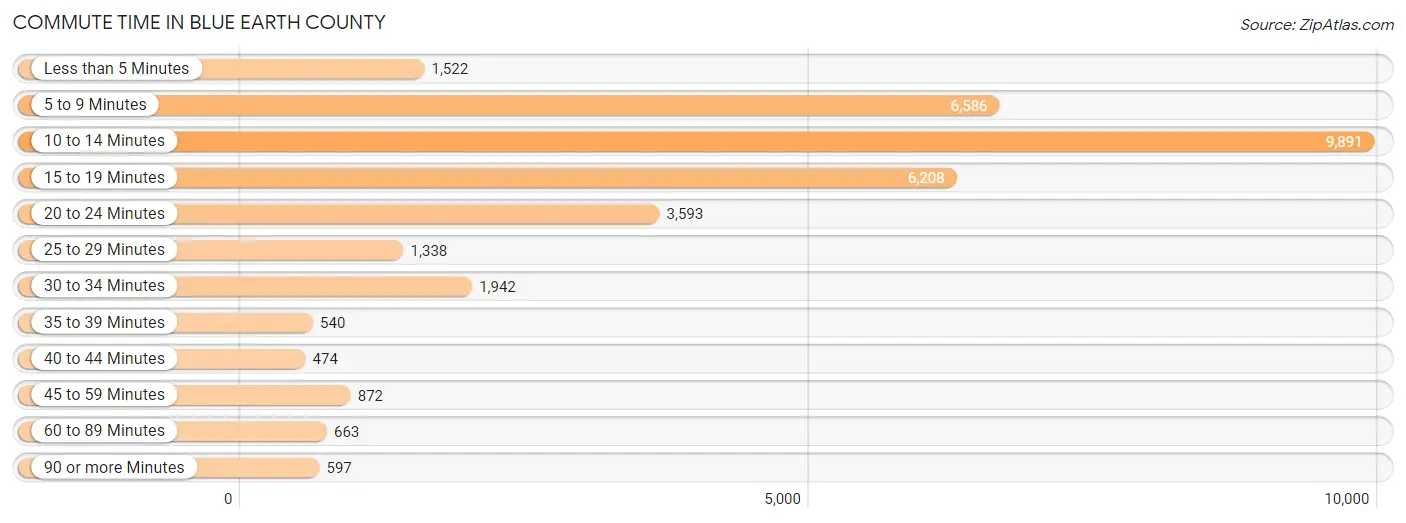
| Commute Time | # Commuters | % Commuters |
| Less than 5 Minutes | 1,522 | 4.4% |
| 5 to 9 Minutes | 6,586 | 19.2% |
| 10 to 14 Minutes | 9,891 | 28.9% |
| 15 to 19 Minutes | 6,208 | 18.1% |
| 20 to 24 Minutes | 3,593 | 10.5% |
| 25 to 29 Minutes | 1,338 | 3.9% |
| 30 to 34 Minutes | 1,942 | 5.7% |
| 35 to 39 Minutes | 540 | 1.6% |
| 40 to 44 Minutes | 474 | 1.4% |
| 45 to 59 Minutes | 872 | 2.5% |
| 60 to 89 Minutes | 663 | 1.9% |
| 90 or more Minutes | 597 | 1.7% |
Commute Time by Sex in Blue Earth County
The most common commute times in Blue Earth County are 10 to 14 minutes (4,925 commuters, 27.2%) for males and 10 to 14 minutes (4,966 commuters, 30.8%) for females.
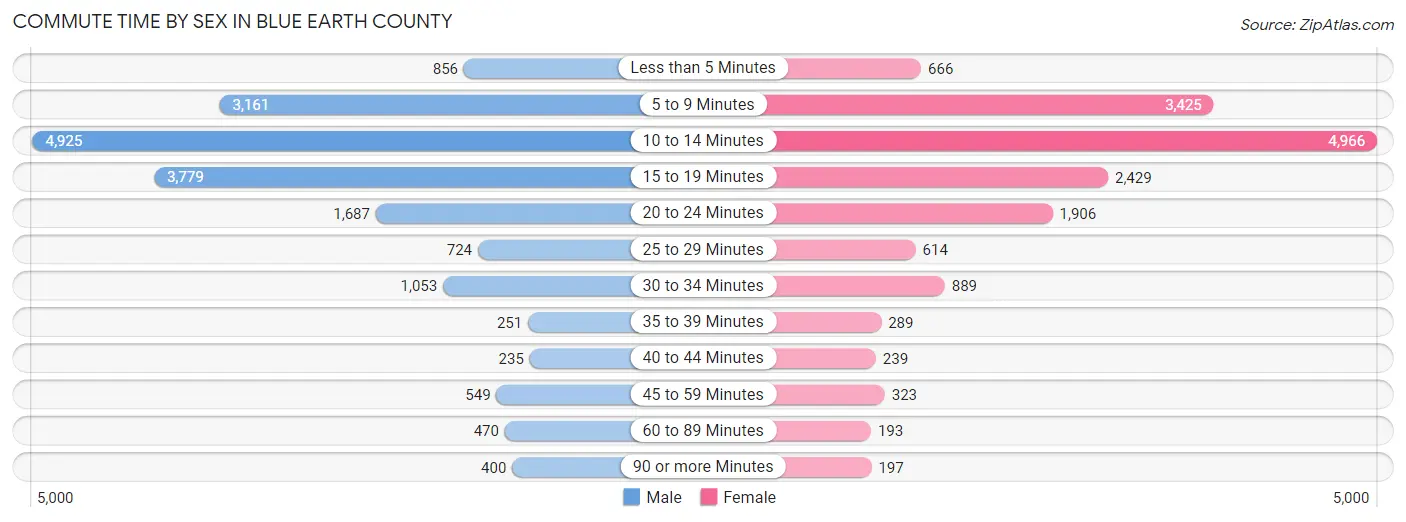
| Commute Time | Male | Female |
| Less than 5 Minutes | 856 (4.7%) | 666 (4.1%) |
| 5 to 9 Minutes | 3,161 (17.5%) | 3,425 (21.2%) |
| 10 to 14 Minutes | 4,925 (27.2%) | 4,966 (30.8%) |
| 15 to 19 Minutes | 3,779 (20.9%) | 2,429 (15.0%) |
| 20 to 24 Minutes | 1,687 (9.3%) | 1,906 (11.8%) |
| 25 to 29 Minutes | 724 (4.0%) | 614 (3.8%) |
| 30 to 34 Minutes | 1,053 (5.8%) | 889 (5.5%) |
| 35 to 39 Minutes | 251 (1.4%) | 289 (1.8%) |
| 40 to 44 Minutes | 235 (1.3%) | 239 (1.5%) |
| 45 to 59 Minutes | 549 (3.0%) | 323 (2.0%) |
| 60 to 89 Minutes | 470 (2.6%) | 193 (1.2%) |
| 90 or more Minutes | 400 (2.2%) | 197 (1.2%) |
Time of Departure to Work by Sex in Blue Earth County
The most frequent times of departure to work in Blue Earth County are 7:30 AM to 7:59 AM (2,909, 16.1%) for males and 7:30 AM to 7:59 AM (2,828, 17.5%) for females.
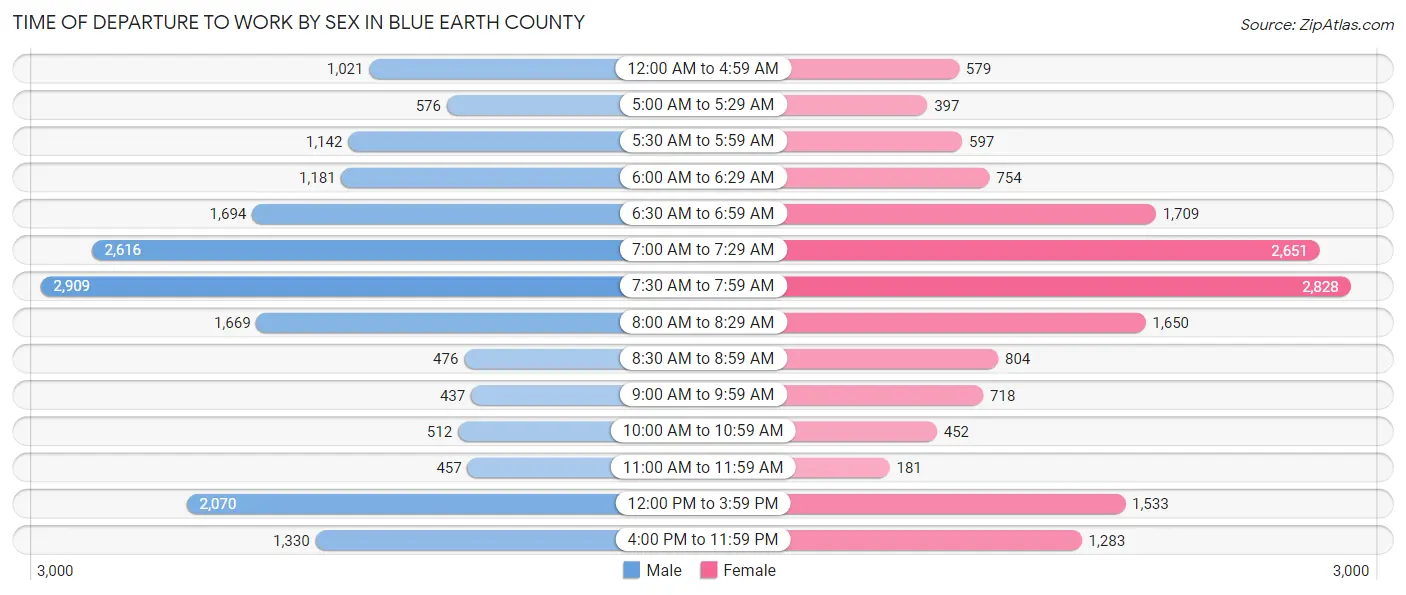
| Time of Departure | Male | Female |
| 12:00 AM to 4:59 AM | 1,021 (5.6%) | 579 (3.6%) |
| 5:00 AM to 5:29 AM | 576 (3.2%) | 397 (2.5%) |
| 5:30 AM to 5:59 AM | 1,142 (6.3%) | 597 (3.7%) |
| 6:00 AM to 6:29 AM | 1,181 (6.5%) | 754 (4.7%) |
| 6:30 AM to 6:59 AM | 1,694 (9.4%) | 1,709 (10.6%) |
| 7:00 AM to 7:29 AM | 2,616 (14.5%) | 2,651 (16.4%) |
| 7:30 AM to 7:59 AM | 2,909 (16.1%) | 2,828 (17.5%) |
| 8:00 AM to 8:29 AM | 1,669 (9.2%) | 1,650 (10.2%) |
| 8:30 AM to 8:59 AM | 476 (2.6%) | 804 (5.0%) |
| 9:00 AM to 9:59 AM | 437 (2.4%) | 718 (4.4%) |
| 10:00 AM to 10:59 AM | 512 (2.8%) | 452 (2.8%) |
| 11:00 AM to 11:59 AM | 457 (2.5%) | 181 (1.1%) |
| 12:00 PM to 3:59 PM | 2,070 (11.4%) | 1,533 (9.5%) |
| 4:00 PM to 11:59 PM | 1,330 (7.3%) | 1,283 (8.0%) |
| Total | 18,090 (100.0%) | 16,136 (100.0%) |
Housing Occupancy in Blue Earth County
Occupancy by Ownership in Blue Earth County
Of the total 27,110 dwellings in Blue Earth County, owner-occupied units account for 16,635 (61.4%), while renter-occupied units make up 10,475 (38.6%).
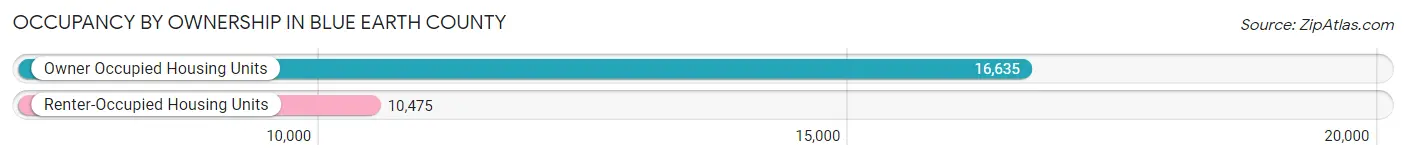
| Occupancy | # Housing Units | % Housing Units |
| Owner Occupied Housing Units | 16,635 | 61.4% |
| Renter-Occupied Housing Units | 10,475 | 38.6% |
| Total Occupied Housing Units | 27,110 | 100.0% |
Occupancy by Household Size in Blue Earth County
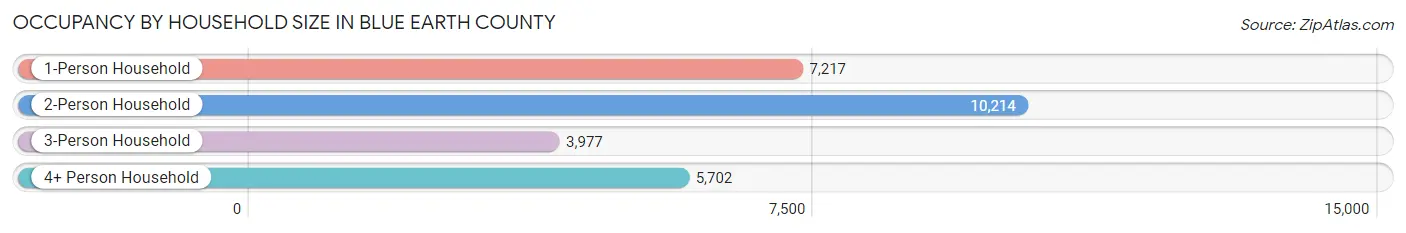
| Household Size | # Housing Units | % Housing Units |
| 1-Person Household | 7,217 | 26.6% |
| 2-Person Household | 10,214 | 37.7% |
| 3-Person Household | 3,977 | 14.7% |
| 4+ Person Household | 5,702 | 21.0% |
| Total Housing Units | 27,110 | 100.0% |
Occupancy by Ownership by Household Size in Blue Earth County
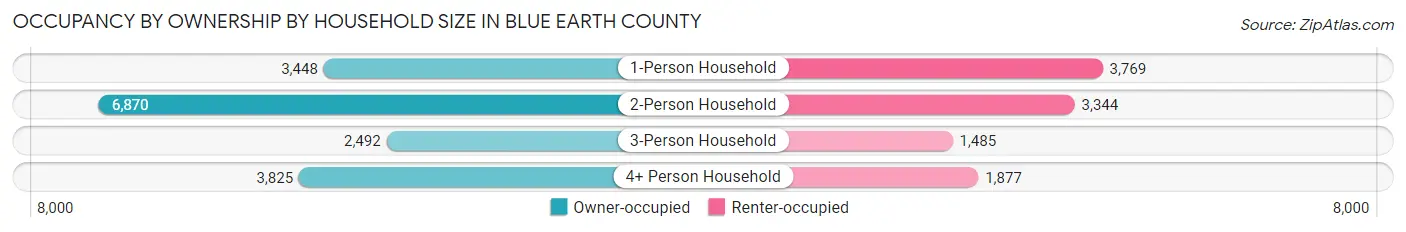
| Household Size | Owner-occupied | Renter-occupied |
| 1-Person Household | 3,448 (47.8%) | 3,769 (52.2%) |
| 2-Person Household | 6,870 (67.3%) | 3,344 (32.7%) |
| 3-Person Household | 2,492 (62.7%) | 1,485 (37.3%) |
| 4+ Person Household | 3,825 (67.1%) | 1,877 (32.9%) |
| Total Housing Units | 16,635 (61.4%) | 10,475 (38.6%) |
Occupancy by Educational Attainment in Blue Earth County
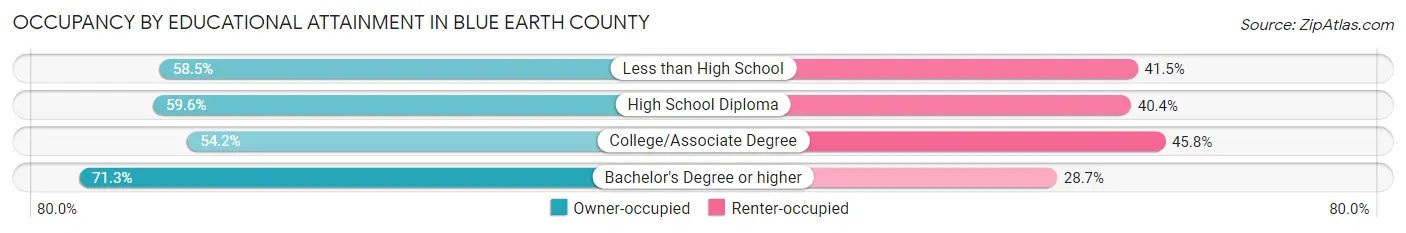
| Household Size | Owner-occupied | Renter-occupied |
| Less than High School | 525 (58.5%) | 372 (41.5%) |
| High School Diploma | 3,773 (59.6%) | 2,557 (40.4%) |
| College/Associate Degree | 5,837 (54.2%) | 4,935 (45.8%) |
| Bachelor's Degree or higher | 6,500 (71.3%) | 2,611 (28.7%) |
Occupancy by Age of Householder in Blue Earth County
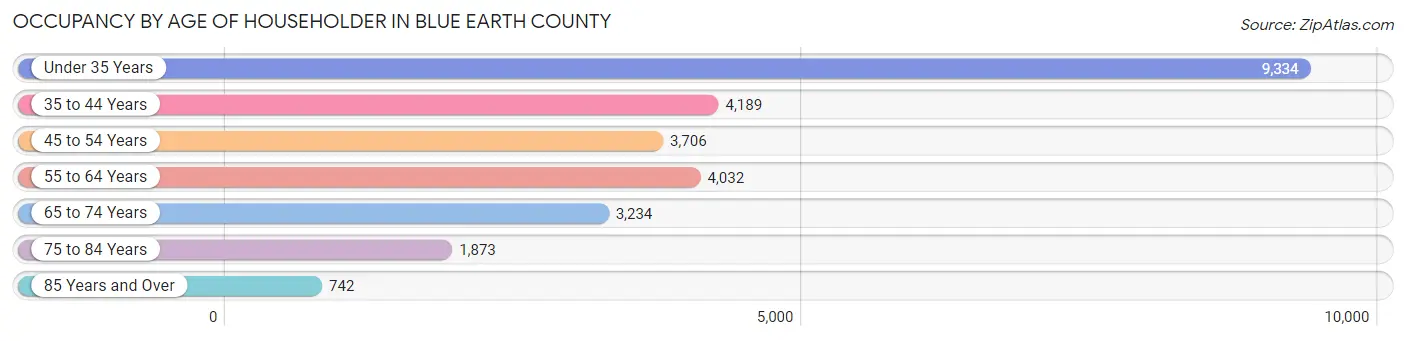
| Age Bracket | # Households | % Households |
| Under 35 Years | 9,334 | 34.4% |
| 35 to 44 Years | 4,189 | 15.4% |
| 45 to 54 Years | 3,706 | 13.7% |
| 55 to 64 Years | 4,032 | 14.9% |
| 65 to 74 Years | 3,234 | 11.9% |
| 75 to 84 Years | 1,873 | 6.9% |
| 85 Years and Over | 742 | 2.7% |
| Total | 27,110 | 100.0% |
Housing Finances in Blue Earth County
Median Income by Occupancy in Blue Earth County
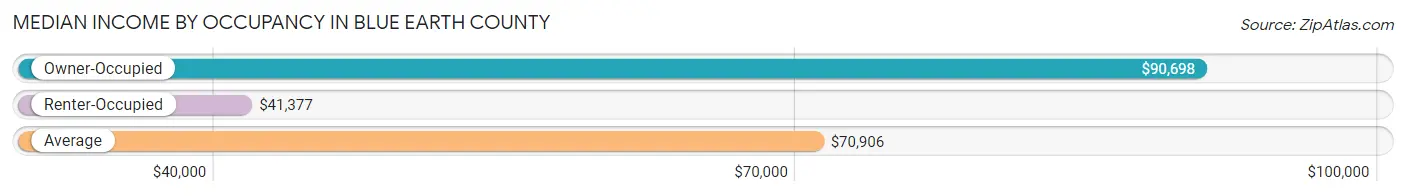
| Occupancy Type | # Households | Median Income |
| Owner-Occupied | 16,635 (61.4%) | $90,698 |
| Renter-Occupied | 10,475 (38.6%) | $41,377 |
| Average | 27,110 (100.0%) | $70,906 |
Occupancy by Householder Income Bracket in Blue Earth County
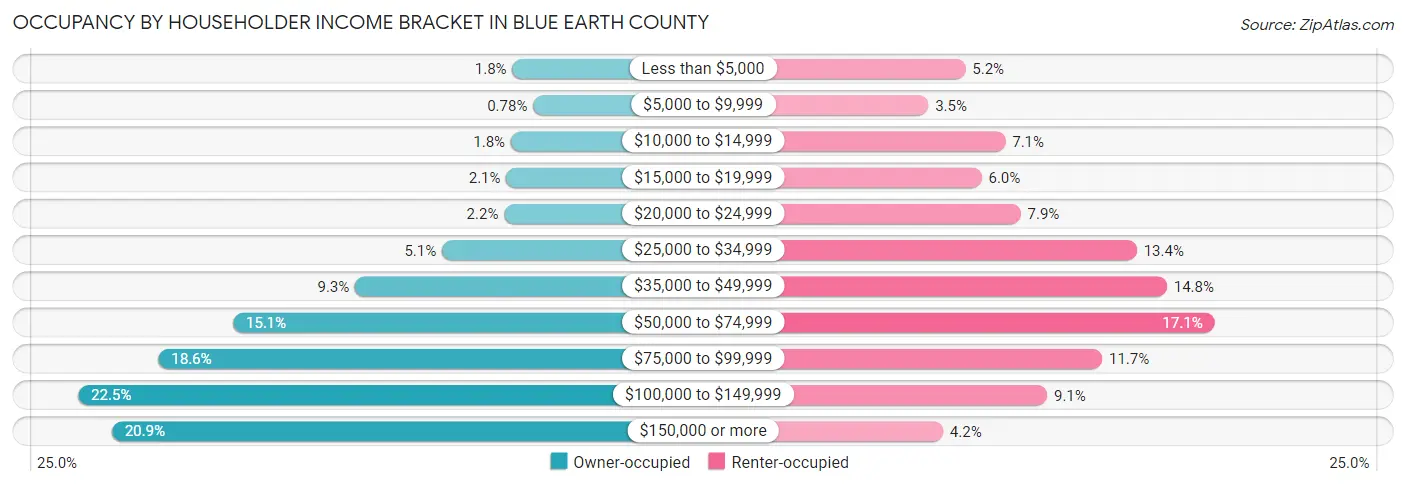
| Income Bracket | Owner-occupied | Renter-occupied |
| Less than $5,000 | 294 (1.8%) | 548 (5.2%) |
| $5,000 to $9,999 | 130 (0.8%) | 362 (3.5%) |
| $10,000 to $14,999 | 306 (1.8%) | 747 (7.1%) |
| $15,000 to $19,999 | 342 (2.1%) | 628 (6.0%) |
| $20,000 to $24,999 | 360 (2.2%) | 823 (7.9%) |
| $25,000 to $34,999 | 852 (5.1%) | 1,403 (13.4%) |
| $35,000 to $49,999 | 1,541 (9.3%) | 1,552 (14.8%) |
| $50,000 to $74,999 | 2,508 (15.1%) | 1,791 (17.1%) |
| $75,000 to $99,999 | 3,099 (18.6%) | 1,230 (11.7%) |
| $100,000 to $149,999 | 3,734 (22.5%) | 955 (9.1%) |
| $150,000 or more | 3,469 (20.8%) | 436 (4.2%) |
| Total | 16,635 (100.0%) | 10,475 (100.0%) |
Monthly Housing Cost Tiers in Blue Earth County
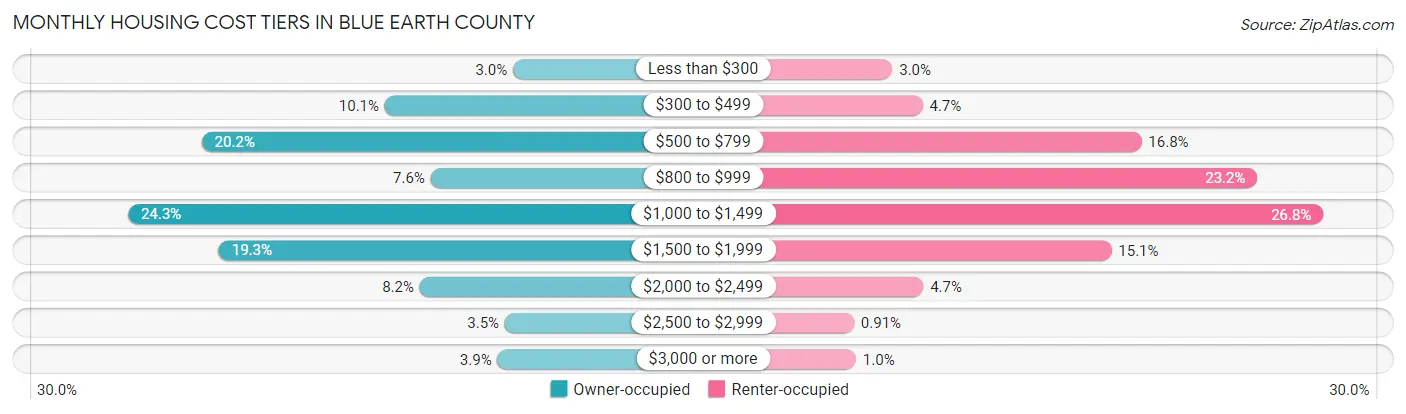
| Monthly Cost | Owner-occupied | Renter-occupied |
| Less than $300 | 502 (3.0%) | 317 (3.0%) |
| $300 to $499 | 1,680 (10.1%) | 492 (4.7%) |
| $500 to $799 | 3,364 (20.2%) | 1,759 (16.8%) |
| $800 to $999 | 1,260 (7.6%) | 2,429 (23.2%) |
| $1,000 to $1,499 | 4,041 (24.3%) | 2,810 (26.8%) |
| $1,500 to $1,999 | 3,206 (19.3%) | 1,585 (15.1%) |
| $2,000 to $2,499 | 1,359 (8.2%) | 496 (4.7%) |
| $2,500 to $2,999 | 577 (3.5%) | 95 (0.9%) |
| $3,000 or more | 646 (3.9%) | 107 (1.0%) |
| Total | 16,635 (100.0%) | 10,475 (100.0%) |
Physical Housing Characteristics in Blue Earth County
Housing Structures in Blue Earth County
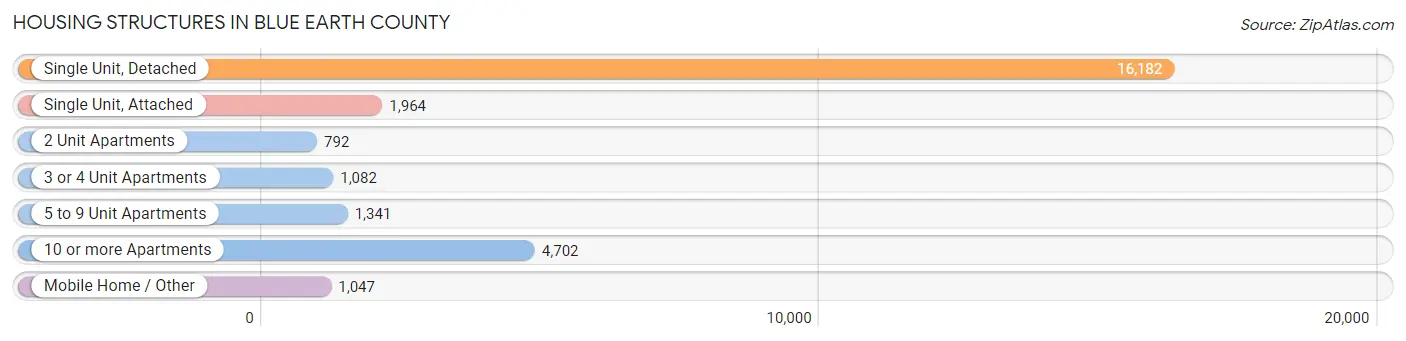
| Structure Type | # Housing Units | % Housing Units |
| Single Unit, Detached | 16,182 | 59.7% |
| Single Unit, Attached | 1,964 | 7.2% |
| 2 Unit Apartments | 792 | 2.9% |
| 3 or 4 Unit Apartments | 1,082 | 4.0% |
| 5 to 9 Unit Apartments | 1,341 | 5.0% |
| 10 or more Apartments | 4,702 | 17.3% |
| Mobile Home / Other | 1,047 | 3.9% |
| Total | 27,110 | 100.0% |
Housing Structures by Occupancy in Blue Earth County
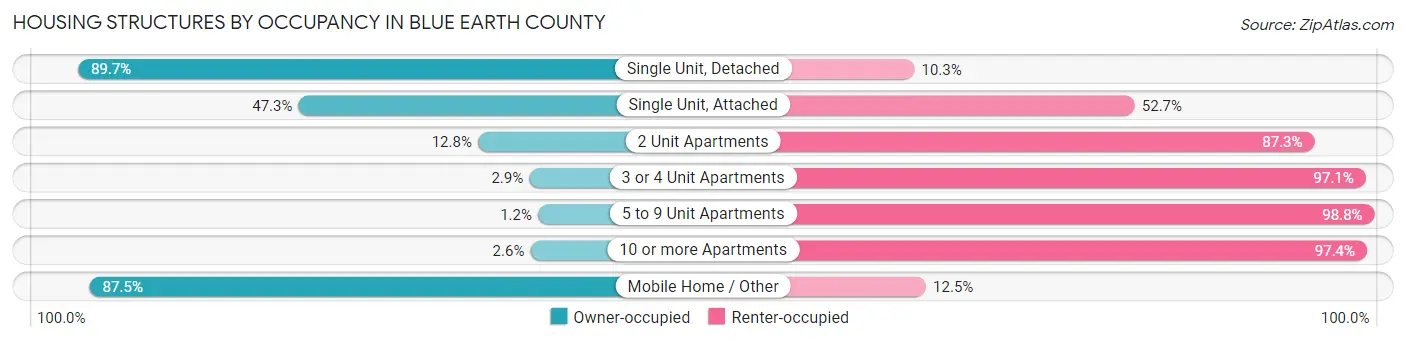
| Structure Type | Owner-occupied | Renter-occupied |
| Single Unit, Detached | 14,518 (89.7%) | 1,664 (10.3%) |
| Single Unit, Attached | 929 (47.3%) | 1,035 (52.7%) |
| 2 Unit Apartments | 101 (12.8%) | 691 (87.3%) |
| 3 or 4 Unit Apartments | 31 (2.9%) | 1,051 (97.1%) |
| 5 to 9 Unit Apartments | 16 (1.2%) | 1,325 (98.8%) |
| 10 or more Apartments | 124 (2.6%) | 4,578 (97.4%) |
| Mobile Home / Other | 916 (87.5%) | 131 (12.5%) |
| Total | 16,635 (61.4%) | 10,475 (38.6%) |
Housing Structures by Number of Rooms in Blue Earth County
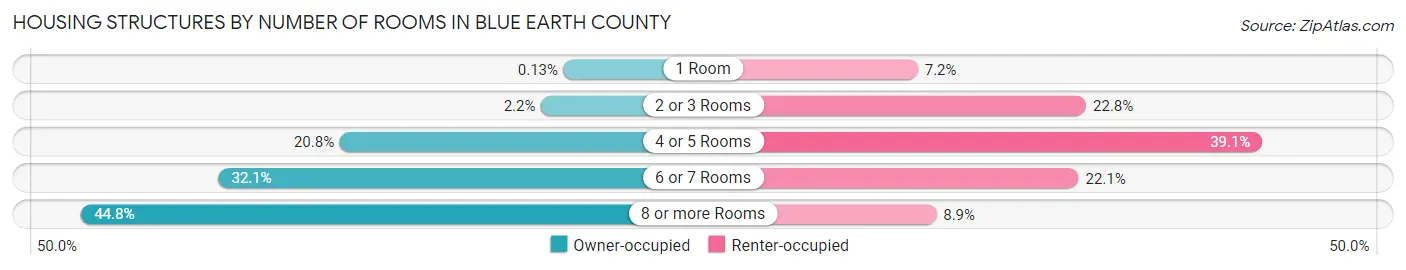
| Number of Rooms | Owner-occupied | Renter-occupied |
| 1 Room | 22 (0.1%) | 754 (7.2%) |
| 2 or 3 Rooms | 367 (2.2%) | 2,385 (22.8%) |
| 4 or 5 Rooms | 3,465 (20.8%) | 4,091 (39.1%) |
| 6 or 7 Rooms | 5,335 (32.1%) | 2,312 (22.1%) |
| 8 or more Rooms | 7,446 (44.8%) | 933 (8.9%) |
| Total | 16,635 (100.0%) | 10,475 (100.0%) |
Housing Structure by Heating Type in Blue Earth County
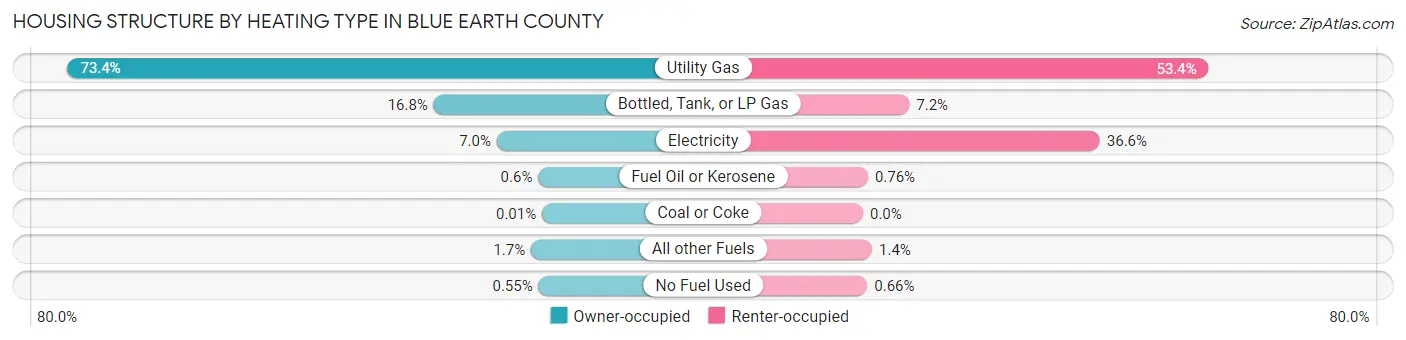
| Heating Type | Owner-occupied | Renter-occupied |
| Utility Gas | 12,205 (73.4%) | 5,594 (53.4%) |
| Bottled, Tank, or LP Gas | 2,788 (16.8%) | 750 (7.2%) |
| Electricity | 1,164 (7.0%) | 3,835 (36.6%) |
| Fuel Oil or Kerosene | 100 (0.6%) | 80 (0.8%) |
| Coal or Coke | 2 (0.0%) | 0 (0.0%) |
| All other Fuels | 285 (1.7%) | 147 (1.4%) |
| No Fuel Used | 91 (0.5%) | 69 (0.7%) |
| Total | 16,635 (100.0%) | 10,475 (100.0%) |
Household Vehicle Usage in Blue Earth County
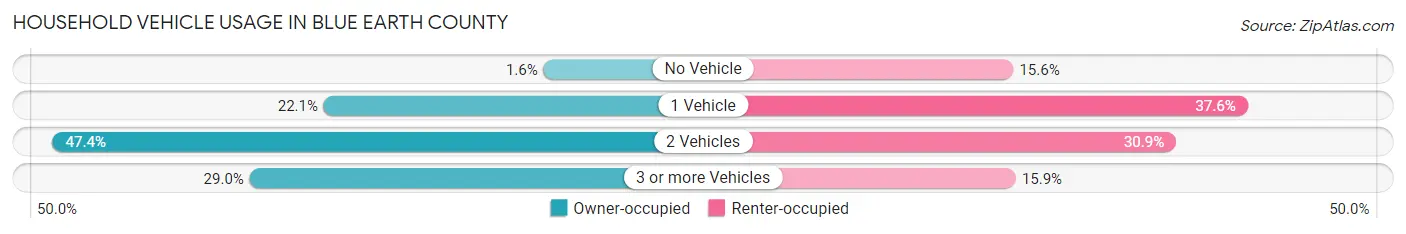
| Vehicles per Household | Owner-occupied | Renter-occupied |
| No Vehicle | 259 (1.6%) | 1,638 (15.6%) |
| 1 Vehicle | 3,671 (22.1%) | 3,938 (37.6%) |
| 2 Vehicles | 7,882 (47.4%) | 3,237 (30.9%) |
| 3 or more Vehicles | 4,823 (29.0%) | 1,662 (15.9%) |
| Total | 16,635 (100.0%) | 10,475 (100.0%) |
Real Estate & Mortgages in Blue Earth County
Real Estate and Mortgage Overview in Blue Earth County
| Characteristic | Without Mortgage | With Mortgage |
| Housing Units | 6,418 | 10,217 |
| Median Property Value | $226,000 | $246,000 |
| Median Household Income | $73,624 | $2,451 |
| Monthly Housing Costs | $587 | $641 |
| Real Estate Taxes | $2,313 | $151 |
Property Value by Mortgage Status in Blue Earth County
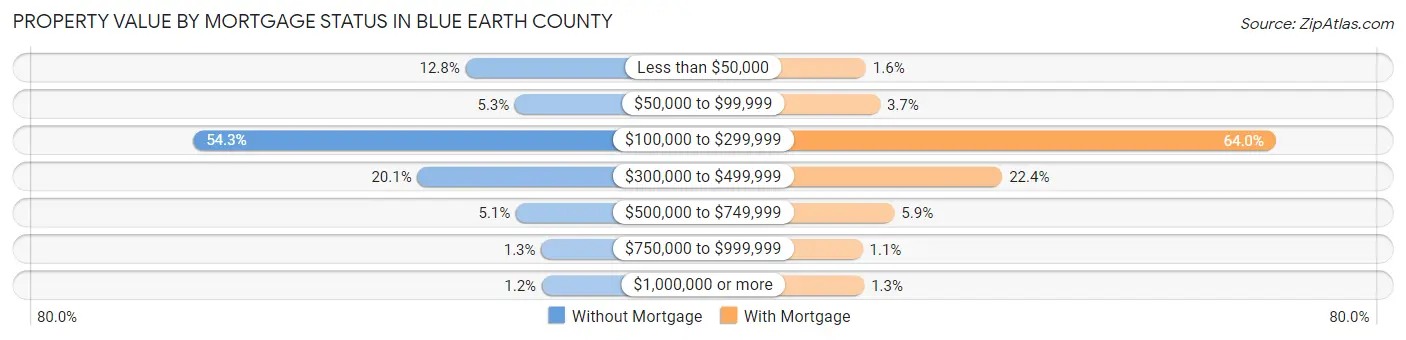
| Property Value | Without Mortgage | With Mortgage |
| Less than $50,000 | 822 (12.8%) | 161 (1.6%) |
| $50,000 to $99,999 | 337 (5.2%) | 380 (3.7%) |
| $100,000 to $299,999 | 3,485 (54.3%) | 6,543 (64.0%) |
| $300,000 to $499,999 | 1,292 (20.1%) | 2,284 (22.4%) |
| $500,000 to $749,999 | 327 (5.1%) | 605 (5.9%) |
| $750,000 to $999,999 | 80 (1.3%) | 109 (1.1%) |
| $1,000,000 or more | 75 (1.2%) | 135 (1.3%) |
| Total | 6,418 (100.0%) | 10,217 (100.0%) |
Household Income by Mortgage Status in Blue Earth County
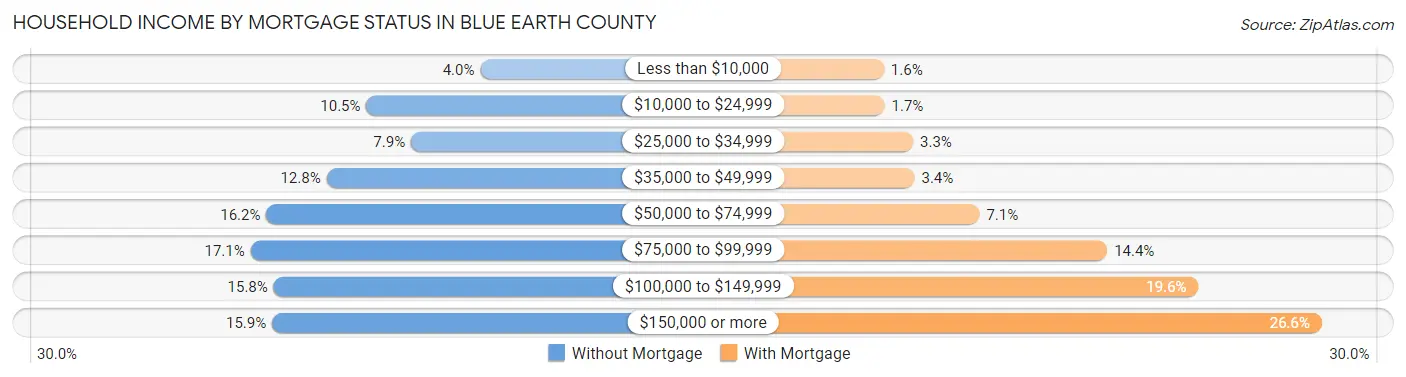
| Household Income | Without Mortgage | With Mortgage |
| Less than $10,000 | 254 (4.0%) | 166 (1.6%) |
| $10,000 to $24,999 | 672 (10.5%) | 170 (1.7%) |
| $25,000 to $34,999 | 508 (7.9%) | 336 (3.3%) |
| $35,000 to $49,999 | 818 (12.8%) | 344 (3.4%) |
| $50,000 to $74,999 | 1,039 (16.2%) | 723 (7.1%) |
| $75,000 to $99,999 | 1,097 (17.1%) | 1,469 (14.4%) |
| $100,000 to $149,999 | 1,012 (15.8%) | 2,002 (19.6%) |
| $150,000 or more | 1,018 (15.9%) | 2,722 (26.6%) |
| Total | 6,418 (100.0%) | 10,217 (100.0%) |
Property Value to Household Income Ratio in Blue Earth County
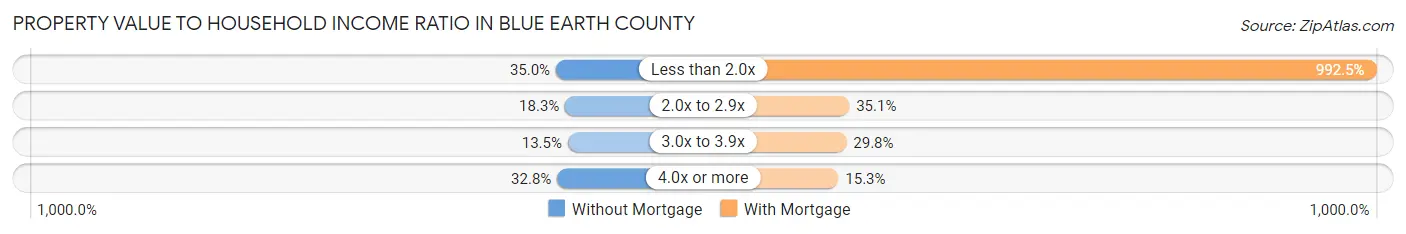
| Value-to-Income Ratio | Without Mortgage | With Mortgage |
| Less than 2.0x | 2,249 (35.0%) | 101,402 (992.5%) |
| 2.0x to 2.9x | 1,173 (18.3%) | 3,583 (35.1%) |
| 3.0x to 3.9x | 869 (13.5%) | 3,048 (29.8%) |
| 4.0x or more | 2,104 (32.8%) | 1,565 (15.3%) |
| Total | 6,418 (100.0%) | 10,217 (100.0%) |
Real Estate Taxes by Mortgage Status in Blue Earth County
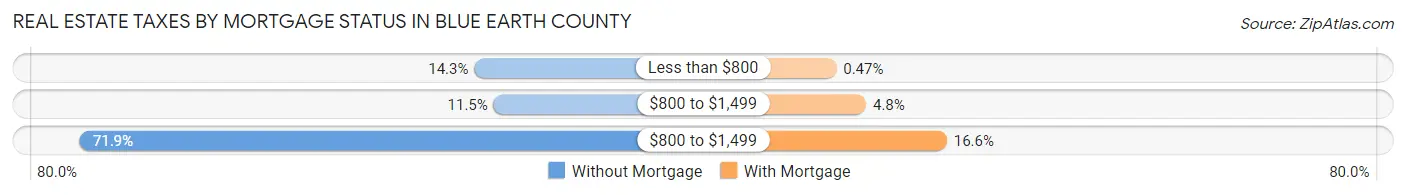
| Property Taxes | Without Mortgage | With Mortgage |
| Less than $800 | 917 (14.3%) | 48 (0.5%) |
| $800 to $1,499 | 736 (11.5%) | 492 (4.8%) |
| $800 to $1,499 | 4,616 (71.9%) | 1,698 (16.6%) |
| Total | 6,418 (100.0%) | 10,217 (100.0%) |
Health & Disability in Blue Earth County
Health Insurance Coverage by Age in Blue Earth County
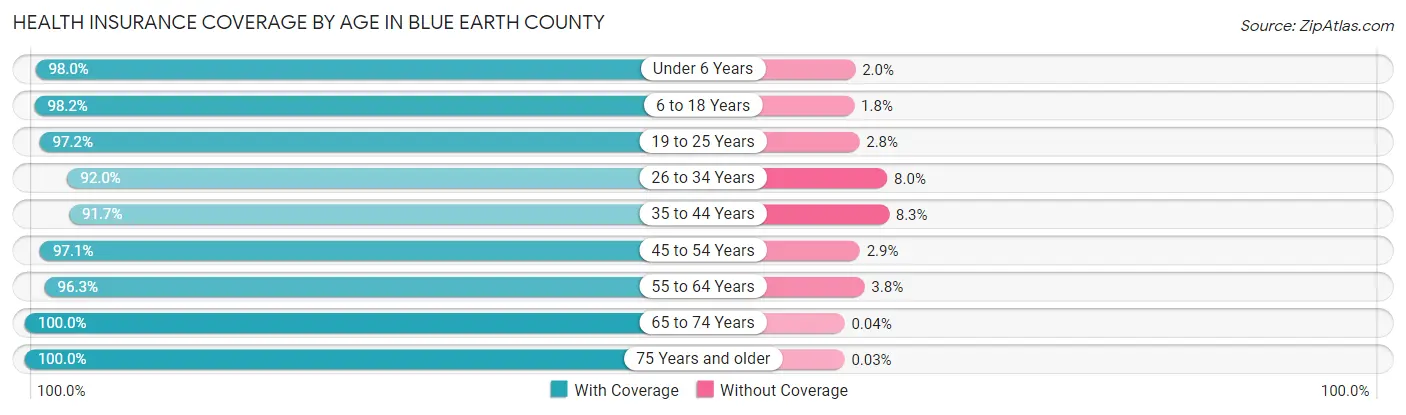
| Age Bracket | With Coverage | Without Coverage |
| Under 6 Years | 4,306 (98.0%) | 89 (2.0%) |
| 6 to 18 Years | 10,784 (98.2%) | 202 (1.8%) |
| 19 to 25 Years | 13,751 (97.2%) | 394 (2.8%) |
| 26 to 34 Years | 7,398 (92.0%) | 642 (8.0%) |
| 35 to 44 Years | 7,173 (91.7%) | 648 (8.3%) |
| 45 to 54 Years | 6,175 (97.1%) | 183 (2.9%) |
| 55 to 64 Years | 6,857 (96.3%) | 267 (3.7%) |
| 65 to 74 Years | 5,570 (100.0%) | 2 (0.0%) |
| 75 Years and older | 3,867 (100.0%) | 1 (0.0%) |
| Total | 65,881 (96.5%) | 2,428 (3.5%) |
Health Insurance Coverage by Citizenship Status in Blue Earth County
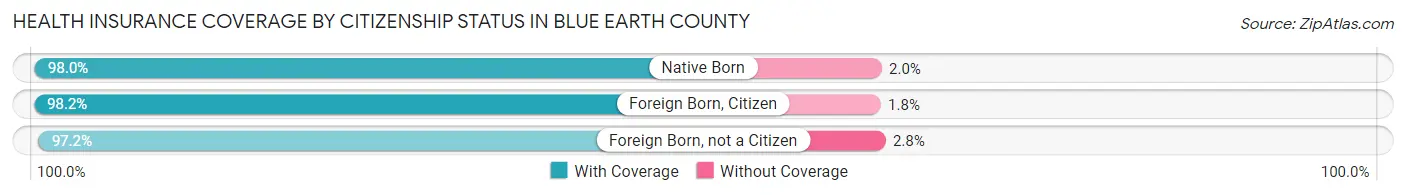
| Citizenship Status | With Coverage | Without Coverage |
| Native Born | 4,306 (98.0%) | 89 (2.0%) |
| Foreign Born, Citizen | 10,784 (98.2%) | 202 (1.8%) |
| Foreign Born, not a Citizen | 13,751 (97.2%) | 394 (2.8%) |
Health Insurance Coverage by Household Income in Blue Earth County
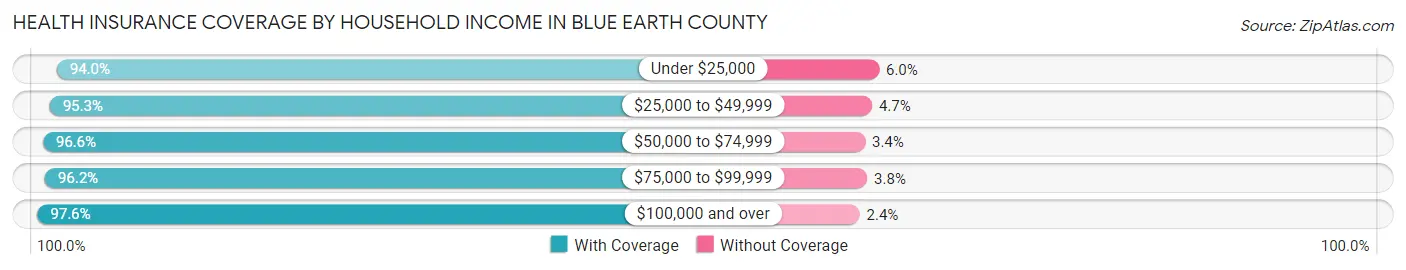
| Household Income | With Coverage | Without Coverage |
| Under $25,000 | 6,782 (94.0%) | 436 (6.0%) |
| $25,000 to $49,999 | 9,739 (95.3%) | 481 (4.7%) |
| $50,000 to $74,999 | 9,757 (96.6%) | 345 (3.4%) |
| $75,000 to $99,999 | 11,245 (96.2%) | 446 (3.8%) |
| $100,000 and over | 25,088 (97.6%) | 616 (2.4%) |
Public vs Private Health Insurance Coverage by Age in Blue Earth County
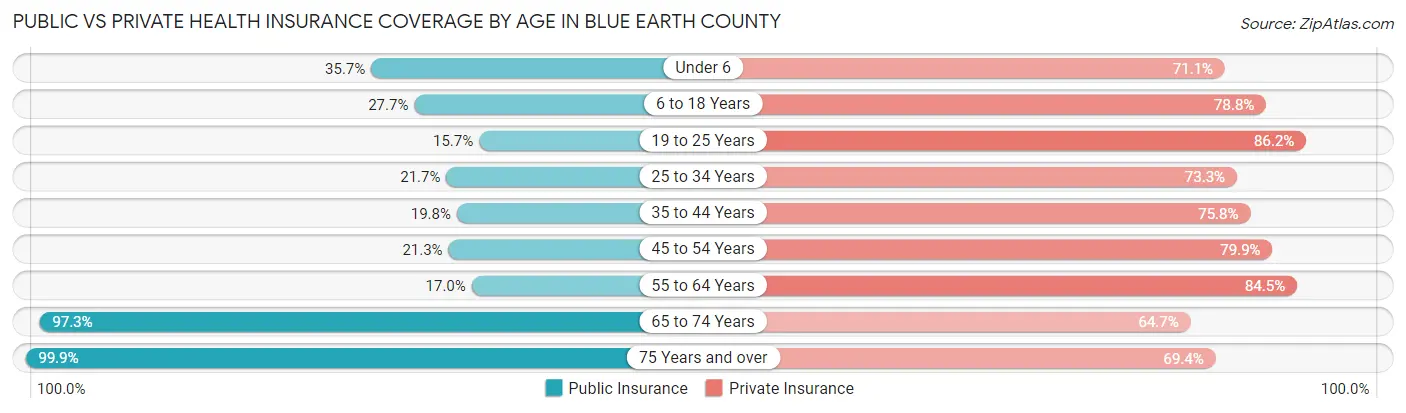
| Age Bracket | Public Insurance | Private Insurance |
| Under 6 | 1,568 (35.7%) | 3,125 (71.1%) |
| 6 to 18 Years | 3,041 (27.7%) | 8,653 (78.8%) |
| 19 to 25 Years | 2,213 (15.7%) | 12,191 (86.2%) |
| 25 to 34 Years | 1,747 (21.7%) | 5,896 (73.3%) |
| 35 to 44 Years | 1,547 (19.8%) | 5,929 (75.8%) |
| 45 to 54 Years | 1,356 (21.3%) | 5,081 (79.9%) |
| 55 to 64 Years | 1,213 (17.0%) | 6,020 (84.5%) |
| 65 to 74 Years | 5,419 (97.3%) | 3,607 (64.7%) |
| 75 Years and over | 3,863 (99.9%) | 2,684 (69.4%) |
| Total | 21,967 (32.2%) | 53,186 (77.9%) |
Disability Status by Sex by Age in Blue Earth County
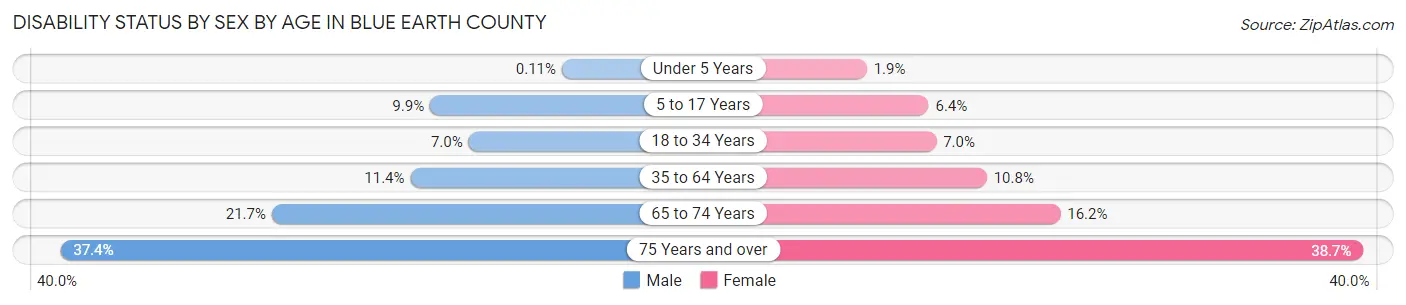
| Age Bracket | Male | Female |
| Under 5 Years | 2 (0.1%) | 32 (1.8%) |
| 5 to 17 Years | 530 (9.9%) | 297 (6.4%) |
| 18 to 34 Years | 859 (7.0%) | 828 (7.0%) |
| 35 to 64 Years | 1,232 (11.4%) | 1,125 (10.8%) |
| 65 to 74 Years | 599 (21.6%) | 455 (16.2%) |
| 75 Years and over | 617 (37.3%) | 858 (38.7%) |
Disability Class by Sex by Age in Blue Earth County
Disability Class: Hearing Difficulty
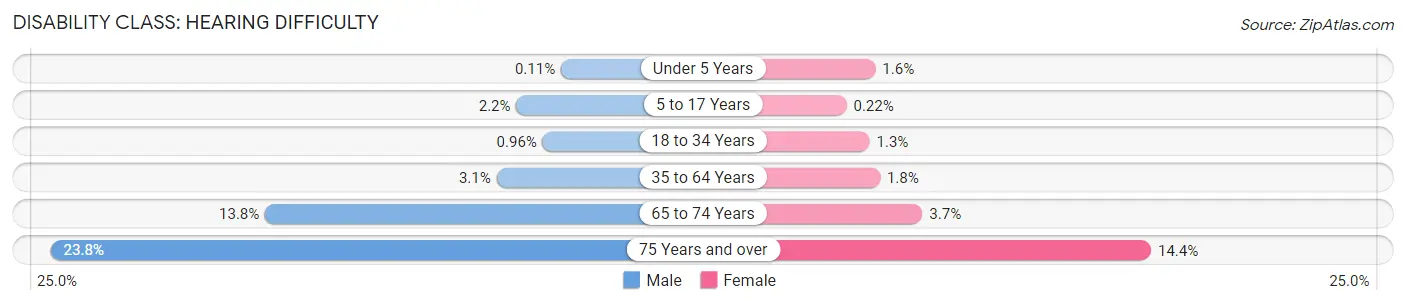
| Age Bracket | Male | Female |
| Under 5 Years | 2 (0.1%) | 27 (1.6%) |
| 5 to 17 Years | 117 (2.2%) | 10 (0.2%) |
| 18 to 34 Years | 117 (1.0%) | 153 (1.3%) |
| 35 to 64 Years | 336 (3.1%) | 185 (1.8%) |
| 65 to 74 Years | 383 (13.8%) | 105 (3.7%) |
| 75 Years and over | 393 (23.8%) | 318 (14.3%) |
Disability Class: Vision Difficulty
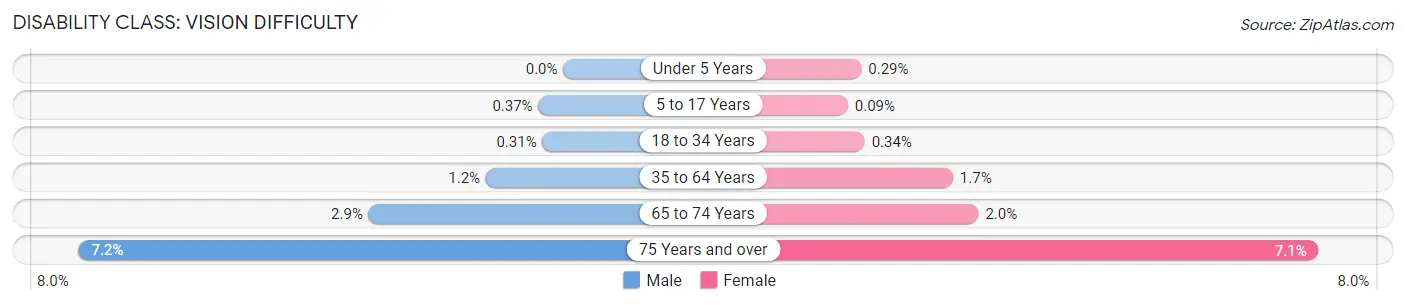
| Age Bracket | Male | Female |
| Under 5 Years | 0 (0.0%) | 5 (0.3%) |
| 5 to 17 Years | 20 (0.4%) | 4 (0.1%) |
| 18 to 34 Years | 38 (0.3%) | 40 (0.3%) |
| 35 to 64 Years | 125 (1.1%) | 173 (1.7%) |
| 65 to 74 Years | 80 (2.9%) | 57 (2.0%) |
| 75 Years and over | 119 (7.2%) | 157 (7.1%) |
Disability Class: Cognitive Difficulty
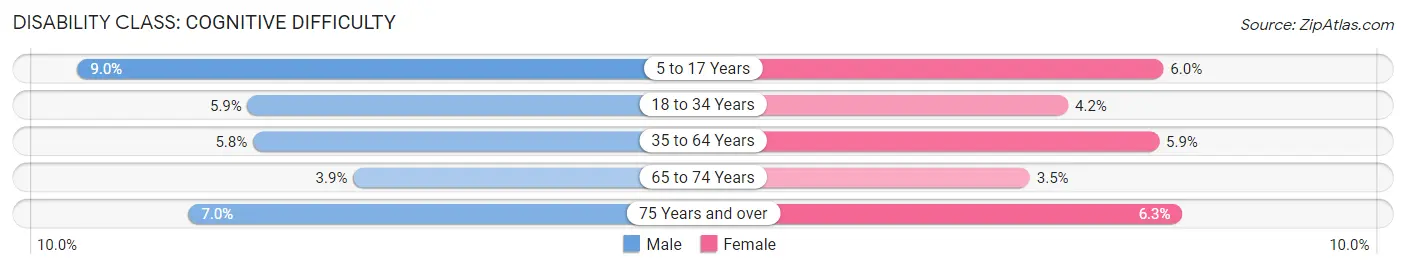
| Age Bracket | Male | Female |
| 5 to 17 Years | 483 (9.0%) | 275 (6.0%) |
| 18 to 34 Years | 715 (5.9%) | 496 (4.2%) |
| 35 to 64 Years | 625 (5.8%) | 616 (5.9%) |
| 65 to 74 Years | 108 (3.9%) | 98 (3.5%) |
| 75 Years and over | 115 (7.0%) | 140 (6.3%) |
Disability Class: Ambulatory Difficulty
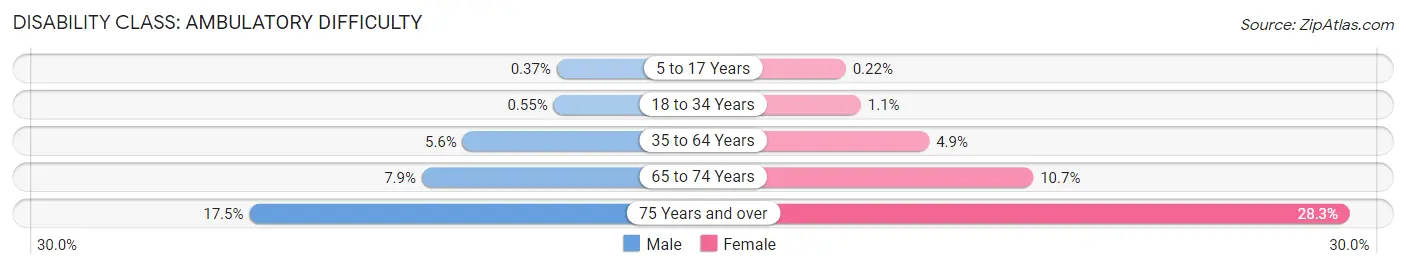
| Age Bracket | Male | Female |
| 5 to 17 Years | 20 (0.4%) | 10 (0.2%) |
| 18 to 34 Years | 67 (0.5%) | 125 (1.1%) |
| 35 to 64 Years | 608 (5.6%) | 509 (4.9%) |
| 65 to 74 Years | 218 (7.9%) | 299 (10.7%) |
| 75 Years and over | 289 (17.5%) | 627 (28.3%) |
Disability Class: Self-Care Difficulty
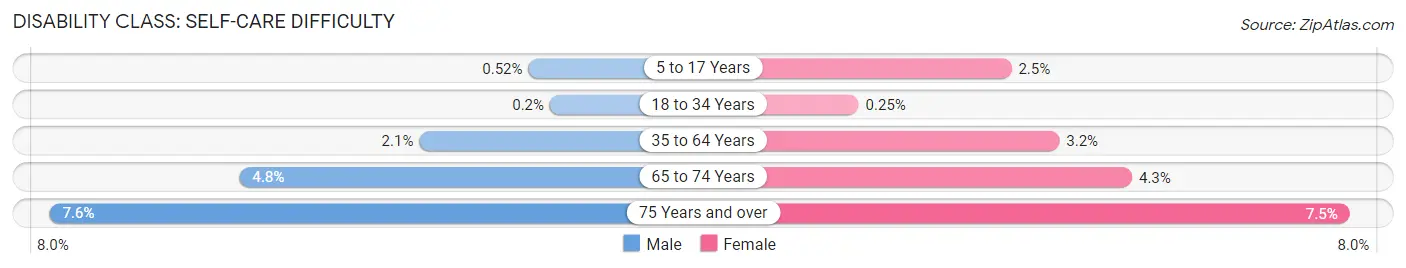
| Age Bracket | Male | Female |
| 5 to 17 Years | 28 (0.5%) | 116 (2.5%) |
| 18 to 34 Years | 24 (0.2%) | 29 (0.3%) |
| 35 to 64 Years | 232 (2.1%) | 338 (3.2%) |
| 65 to 74 Years | 133 (4.8%) | 121 (4.3%) |
| 75 Years and over | 126 (7.6%) | 167 (7.5%) |
Technology Access in Blue Earth County
Computing Device Access in Blue Earth County
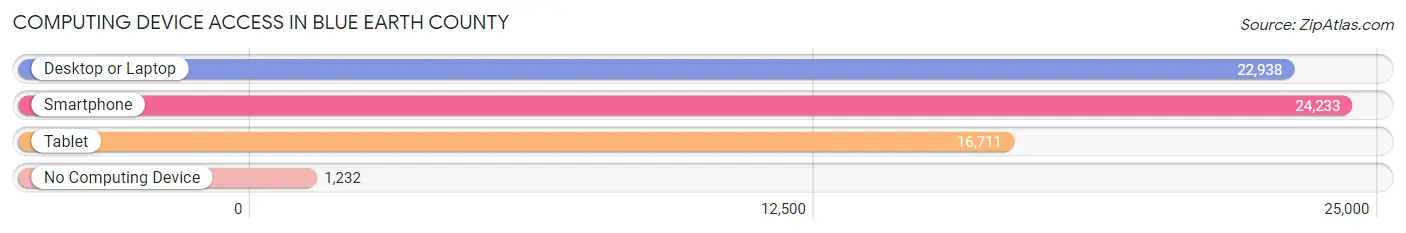
| Device Type | # Households | % Households |
| Desktop or Laptop | 22,938 | 84.6% |
| Smartphone | 24,233 | 89.4% |
| Tablet | 16,711 | 61.6% |
| No Computing Device | 1,232 | 4.5% |
| Total | 27,110 | 100.0% |
Internet Access in Blue Earth County
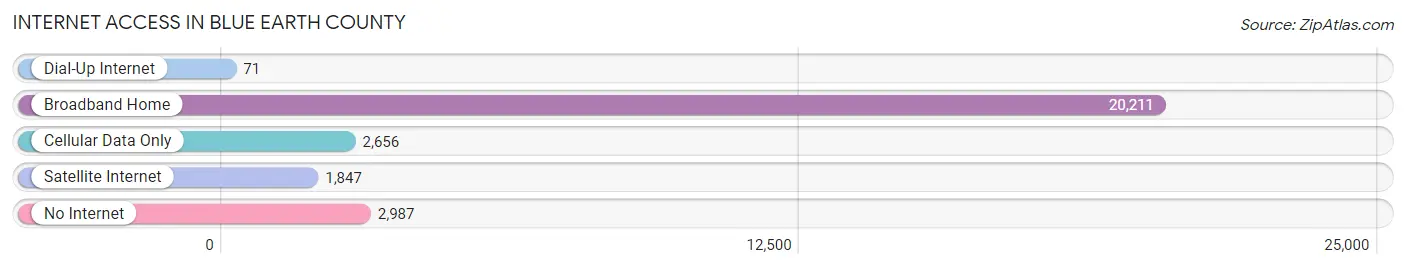
| Internet Type | # Households | % Households |
| Dial-Up Internet | 71 | 0.3% |
| Broadband Home | 20,211 | 74.6% |
| Cellular Data Only | 2,656 | 9.8% |
| Satellite Internet | 1,847 | 6.8% |
| No Internet | 2,987 | 11.0% |
| Total | 27,110 | 100.0% |
Blue Earth County Summary
Introduction
Blue Earth County is located in the south-central region of Minnesota, and is part of the Mankato-North Mankato Metropolitan Statistical Area. The county was established in 1853 and is named after the Blue Earth River, which flows through the county. The county seat is Mankato, which is the largest city in the county. Blue Earth County has a population of 64,013, according to the 2010 census.
Geography
Blue Earth County is located in the south-central region of Minnesota, and is bordered by Nicollet County to the north, Le Sueur County to the east, Waseca County to the south, and Faribault County to the west. The county covers an area of 576 square miles, and is home to several lakes, including Lake Crystal, Lake Elysian, and Lake Washington. The Blue Earth River flows through the county, and is a major tributary of the Minnesota River. The county is mostly flat, with some rolling hills in the western part of the county.
Demographics
According to the 2010 census, Blue Earth County has a population of 64,013. The population is spread out, with 24.7% under the age of 18, 10.2% from 18 to 24, 28.2% from 25 to 44, 22.7% from 45 to 64, and 14.2% who are 65 years of age or older. The median age is 36.4 years. The gender makeup of the county is 49.7% male and 50.3% female.
The racial makeup of the county is 91.2% White, 3.2% African American, 0.7% Native American, 1.7% Asian, 0.1% Pacific Islander, 1.3% from other races, and 2.0% from two or more races. Hispanic or Latino of any race were 4.2% of the population.
Economy
Blue Earth County has a diverse economy, with a mix of manufacturing, retail, and service industries. The county is home to several large employers, including 3M, Mayo Clinic Health System, and Mankato Clinic. The county also has a strong agricultural sector, with corn, soybeans, and hay being the main crops.
The county has a strong tourism industry, with several attractions, including the Minnesota Valley National Wildlife Refuge, the Blue Earth County Historical Society, and the Mankato Riverfront Park. The county also has several wineries, breweries, and distilleries, as well as several golf courses.
Conclusion
Blue Earth County is located in the south-central region of Minnesota, and is part of the Mankato-North Mankato Metropolitan Statistical Area. The county has a population of 64,013, according to the 2010 census, and is home to several large employers, including 3M, Mayo Clinic Health System, and Mankato Clinic. The county also has a strong agricultural sector, with corn, soybeans, and hay being the main crops. The county has a strong tourism industry, with several attractions, including the Minnesota Valley National Wildlife Refuge, the Blue Earth County Historical Society, and the Mankato Riverfront Park.
Common Questions
What is the Total Population of Blue Earth County?
Total Population of Blue Earth County is 69,022.
What is the Total Male Population of Blue Earth County?
Total Male Population of Blue Earth County is 34,934.
What is the Total Female Population of Blue Earth County?
Total Female Population of Blue Earth County is 34,088.
What is the Ratio of Males per 100 Females in Blue Earth County?
There are 102.48 Males per 100 Females in Blue Earth County.
What is the Ratio of Females per 100 Males in Blue Earth County?
There are 97.58 Females per 100 Males in Blue Earth County.
What is the Median Population Age in Blue Earth County?
Median Population Age in Blue Earth County is 31.4 Years.
What is the Average Family Size in Blue Earth County
Average Family Size in Blue Earth County is 2.9 People.
What is the Average Household Size in Blue Earth County
Average Household Size in Blue Earth County is 2.4 People.
What is Per Capita Income in Blue Earth County?
Per Capita income in Blue Earth County is $35,182.
What is the Median Family Income in Blue Earth County?
Median Family Income in Blue Earth County is $91,033.
What is the Median Household income in Blue Earth County?
Median Household Income in Blue Earth County is $70,906.
What is Income or Wage Gap in Blue Earth County?
Income or Wage Gap in Blue Earth County is 28.8%.
Women in Blue Earth County earn 71.2 cents for every dollar earned by a man.
What is Family Income Deficit in Blue Earth County?
Family Income Deficit in Blue Earth County is $8,244.
Families that are below poverty line in Blue Earth County earn $8,244 less on average than the poverty threshold level.
What is Inequality or Gini Index in Blue Earth County?
Inequality or Gini Index in Blue Earth County is 0.43.
How Large is the Labor Force in Blue Earth County?
There are 40,361 People in the Labor Forcein in Blue Earth County.
What is the Percentage of People in the Labor Force in Blue Earth County?
70.9% of People are in the Labor Force in Blue Earth County.
What is the Unemployment Rate in Blue Earth County?
Unemployment Rate in Blue Earth County is 3.7%.