Benton County, MN
Benton County Map
Benton County Overview
41,300
TOTAL POPULATION
20,822
MALE POPULATION
20,478
FEMALE POPULATION
101.68
MALES / 100 FEMALES
98.35
FEMALES / 100 MALES
36.2
MEDIAN AGE
3.1
AVG FAMILY SIZE
2.5
AVG HOUSEHOLD SIZE
$35,885
PER CAPITA INCOME
$90,316
AVG FAMILY INCOME
$70,346
AVG HOUSEHOLD INCOME
29.2%
WAGE / INCOME GAP [ % ]
70.8¢/ $1
WAGE / INCOME GAP [ $ ]
$11,364
FAMILY INCOME DEFICIT
0.39
INEQUALITY / GINI INDEX
23,334
LABOR FORCE [ PEOPLE ]
73.3%
PERCENT IN LABOR FORCE
3.7%
UNEMPLOYMENT RATE
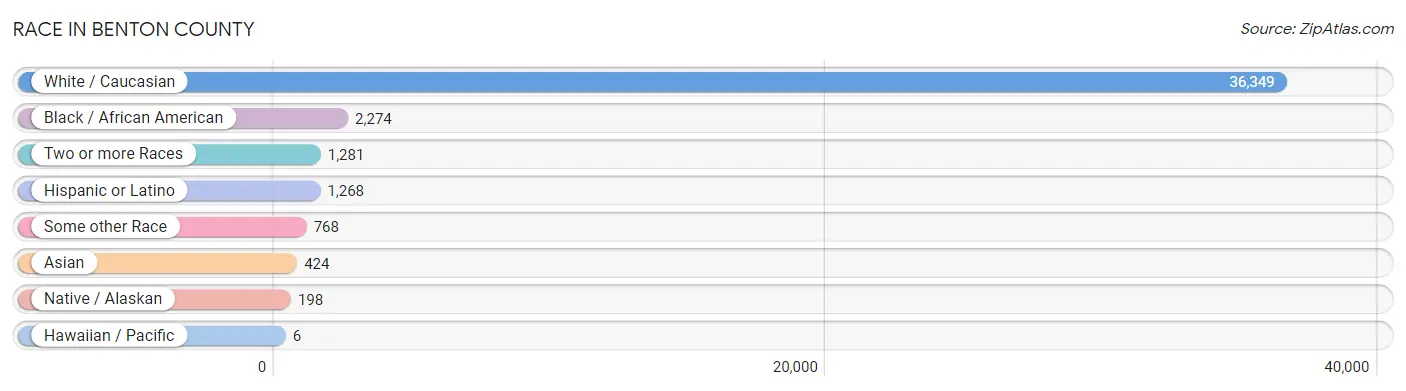
Race in Benton County
The most populous races in Benton County are White / Caucasian (36,349 | 88.0%), Black / African American (2,274 | 5.5%), and Two or more Races (1,281 | 3.1%).
| Race | # Population | % Population |
| Asian | 424 | 1.0% |
| Black / African American | 2,274 | 5.5% |
| Hawaiian / Pacific | 6 | 0.0% |
| Hispanic or Latino | 1,268 | 3.1% |
| Native / Alaskan | 198 | 0.5% |
| White / Caucasian | 36,349 | 88.0% |
| Two or more Races | 1,281 | 3.1% |
| Some other Race | 768 | 1.9% |
| Total | 41,300 | 100.0% |
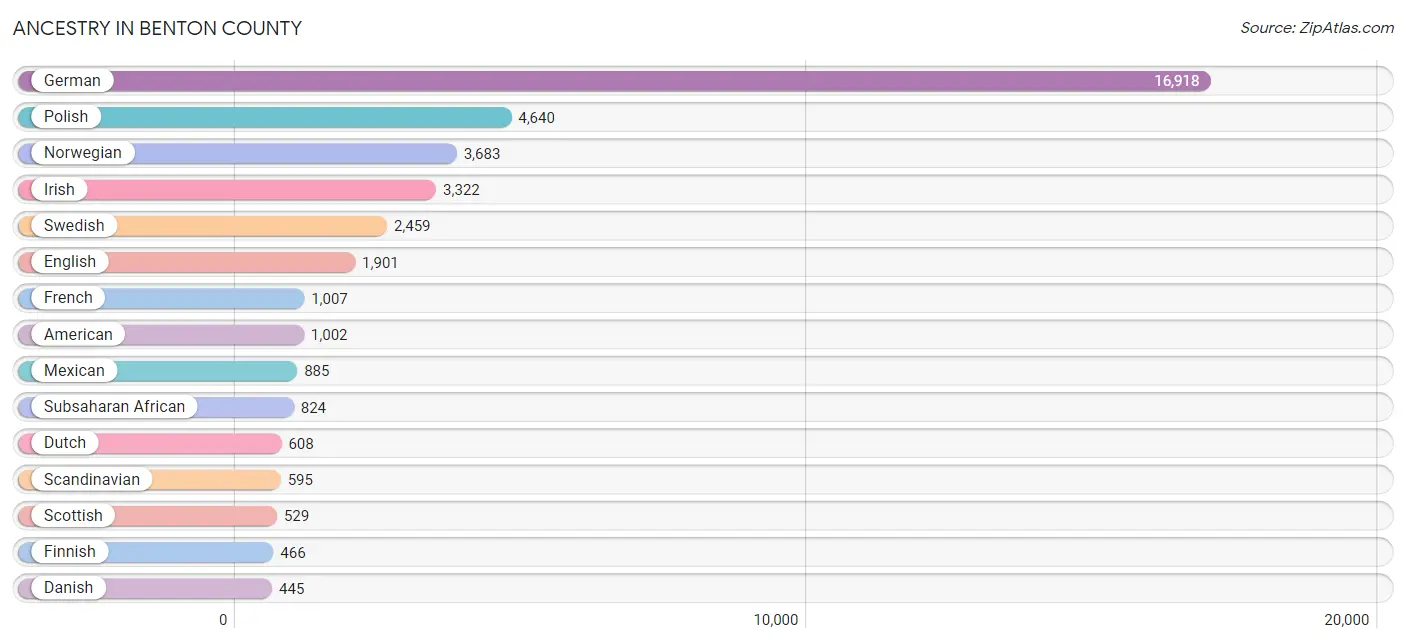
Ancestry in Benton County
The most populous ancestries reported in Benton County are German (16,918 | 41.0%), Polish (4,640 | 11.2%), Norwegian (3,683 | 8.9%), Irish (3,322 | 8.0%), and Swedish (2,459 | 5.9%), together accounting for 75.1% of all Benton County residents.
| Ancestry | # Population | % Population |
| African | 320 | 0.8% |
| American | 1,002 | 2.4% |
| Arab | 171 | 0.4% |
| Armenian | 36 | 0.1% |
| Austrian | 156 | 0.4% |
| Bangladeshi | 75 | 0.2% |
| Belgian | 55 | 0.1% |
| Bhutanese | 7 | 0.0% |
| Bolivian | 3 | 0.0% |
| British | 60 | 0.2% |
| Burmese | 49 | 0.1% |
| Canadian | 17 | 0.0% |
| Central American | 124 | 0.3% |
| Central American Indian | 71 | 0.2% |
| Cherokee | 84 | 0.2% |
| Chilean | 2 | 0.0% |
| Chippewa | 359 | 0.9% |
| Choctaw | 13 | 0.0% |
| Colombian | 16 | 0.0% |
| Croatian | 32 | 0.1% |
| Cuban | 30 | 0.1% |
| Czech | 424 | 1.0% |
| Czechoslovakian | 14 | 0.0% |
| Danish | 445 | 1.1% |
| Dutch | 608 | 1.5% |
| Eastern European | 38 | 0.1% |
| English | 1,901 | 4.6% |
| European | 399 | 1.0% |
| Finnish | 466 | 1.1% |
| French | 1,007 | 2.4% |
| French American Indian | 3 | 0.0% |
| French Canadian | 412 | 1.0% |
| German | 16,918 | 41.0% |
| German Russian | 4 | 0.0% |
| Greek | 9 | 0.0% |
| Guamanian / Chamorro | 6 | 0.0% |
| Guatemalan | 102 | 0.3% |
| Hungarian | 77 | 0.2% |
| Indian (Asian) | 145 | 0.4% |
| Iraqi | 118 | 0.3% |
| Irish | 3,322 | 8.0% |
| Iroquois | 3 | 0.0% |
| Italian | 399 | 1.0% |
| Japanese | 48 | 0.1% |
| Jordanian | 10 | 0.0% |
| Korean | 132 | 0.3% |
| Laotian | 67 | 0.2% |
| Lebanese | 1 | 0.0% |
| Lithuanian | 24 | 0.1% |
| Luxembourger | 16 | 0.0% |
| Malaysian | 74 | 0.2% |
| Mexican | 885 | 2.1% |
| Mexican American Indian | 8 | 0.0% |
| Native Hawaiian | 30 | 0.1% |
| Navajo | 1 | 0.0% |
| Nicaraguan | 12 | 0.0% |
| Nigerian | 83 | 0.2% |
| Northern European | 28 | 0.1% |
| Norwegian | 3,683 | 8.9% |
| Paraguayan | 10 | 0.0% |
| Pennsylvania German | 2 | 0.0% |
| Polish | 4,640 | 11.2% |
| Portuguese | 57 | 0.1% |
| Puerto Rican | 94 | 0.2% |
| Russian | 152 | 0.4% |
| Salvadoran | 10 | 0.0% |
| Scandinavian | 595 | 1.4% |
| Scotch-Irish | 58 | 0.1% |
| Scottish | 529 | 1.3% |
| Seminole | 7 | 0.0% |
| Serbian | 18 | 0.0% |
| Sioux | 64 | 0.2% |
| Slavic | 8 | 0.0% |
| Slovak | 19 | 0.1% |
| Slovene | 53 | 0.1% |
| Somali | 422 | 1.0% |
| South American | 71 | 0.2% |
| Spaniard | 5 | 0.0% |
| Spanish | 19 | 0.1% |
| Sri Lankan | 108 | 0.3% |
| Subsaharan African | 824 | 2.0% |
| Sudanese | 32 | 0.1% |
| Swedish | 2,459 | 5.9% |
| Swiss | 160 | 0.4% |
| Thai | 52 | 0.1% |
| Ukrainian | 20 | 0.1% |
| Welsh | 36 | 0.1% |
| Yugoslavian | 110 | 0.3% | View All 88 Rows |
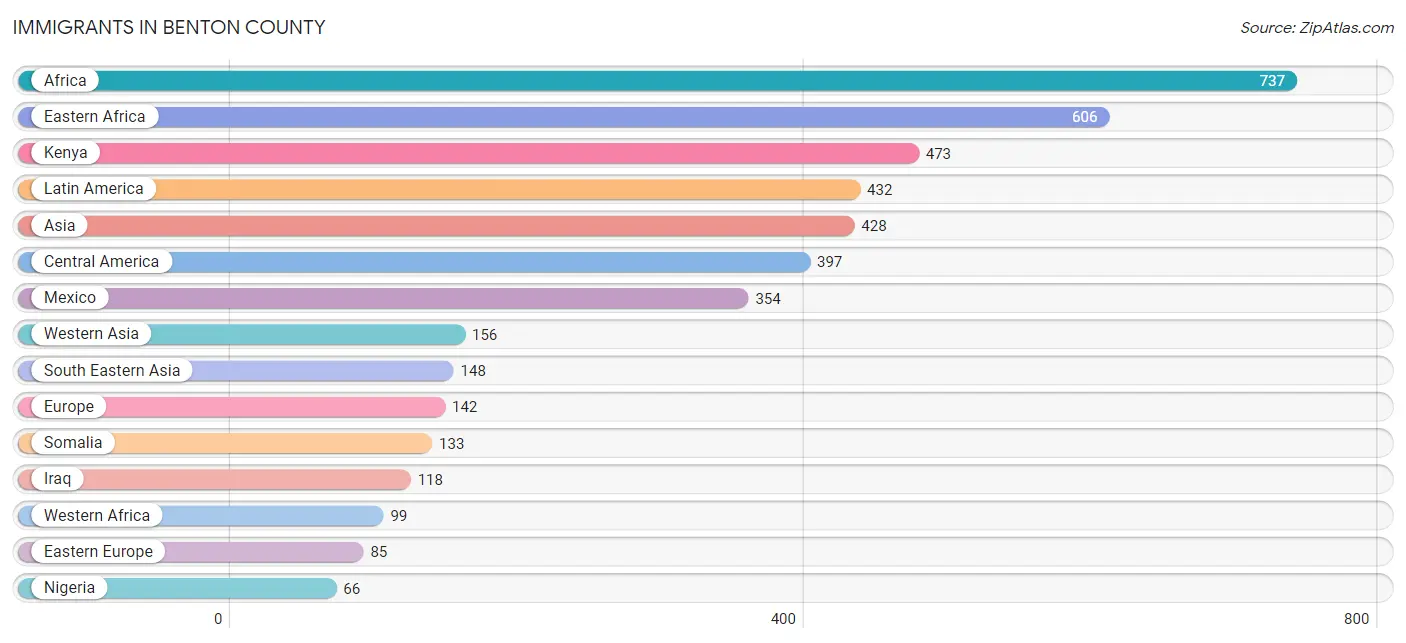
Immigrants in Benton County
The most numerous immigrant groups reported in Benton County came from Africa (737 | 1.8%), Eastern Africa (606 | 1.5%), Kenya (473 | 1.1%), Latin America (432 | 1.1%), and Asia (428 | 1.0%), together accounting for 6.5% of all Benton County residents.
| Immigration Origin | # Population | % Population |
| Africa | 737 | 1.8% |
| Asia | 428 | 1.0% |
| Bosnia and Herzegovina | 12 | 0.0% |
| Brazil | 19 | 0.1% |
| Cambodia | 13 | 0.0% |
| Canada | 19 | 0.1% |
| Central America | 397 | 1.0% |
| China | 29 | 0.1% |
| Colombia | 16 | 0.0% |
| Denmark | 3 | 0.0% |
| Eastern Africa | 606 | 1.5% |
| Eastern Asia | 62 | 0.2% |
| Eastern Europe | 85 | 0.2% |
| England | 4 | 0.0% |
| Europe | 142 | 0.3% |
| Germany | 25 | 0.1% |
| Guatemala | 43 | 0.1% |
| Iraq | 118 | 0.3% |
| Ireland | 10 | 0.0% |
| Japan | 7 | 0.0% |
| Kazakhstan | 10 | 0.0% |
| Kenya | 473 | 1.1% |
| Korea | 26 | 0.1% |
| Laos | 44 | 0.1% |
| Latin America | 432 | 1.1% |
| Lebanon | 19 | 0.1% |
| Lithuania | 10 | 0.0% |
| Malaysia | 12 | 0.0% |
| Mexico | 354 | 0.9% |
| Nigeria | 66 | 0.2% |
| Northern Africa | 32 | 0.1% |
| Northern Europe | 32 | 0.1% |
| Oceania | 2 | 0.0% |
| Pakistan | 52 | 0.1% |
| Philippines | 8 | 0.0% |
| Russia | 47 | 0.1% |
| Serbia | 9 | 0.0% |
| Somalia | 133 | 0.3% |
| South America | 35 | 0.1% |
| South Central Asia | 62 | 0.2% |
| South Eastern Asia | 148 | 0.4% |
| Sudan | 32 | 0.1% |
| Thailand | 5 | 0.0% |
| Vietnam | 66 | 0.2% |
| Western Africa | 99 | 0.2% |
| Western Asia | 156 | 0.4% |
| Western Europe | 25 | 0.1% |
| Yemen | 19 | 0.1% | View All 48 Rows |
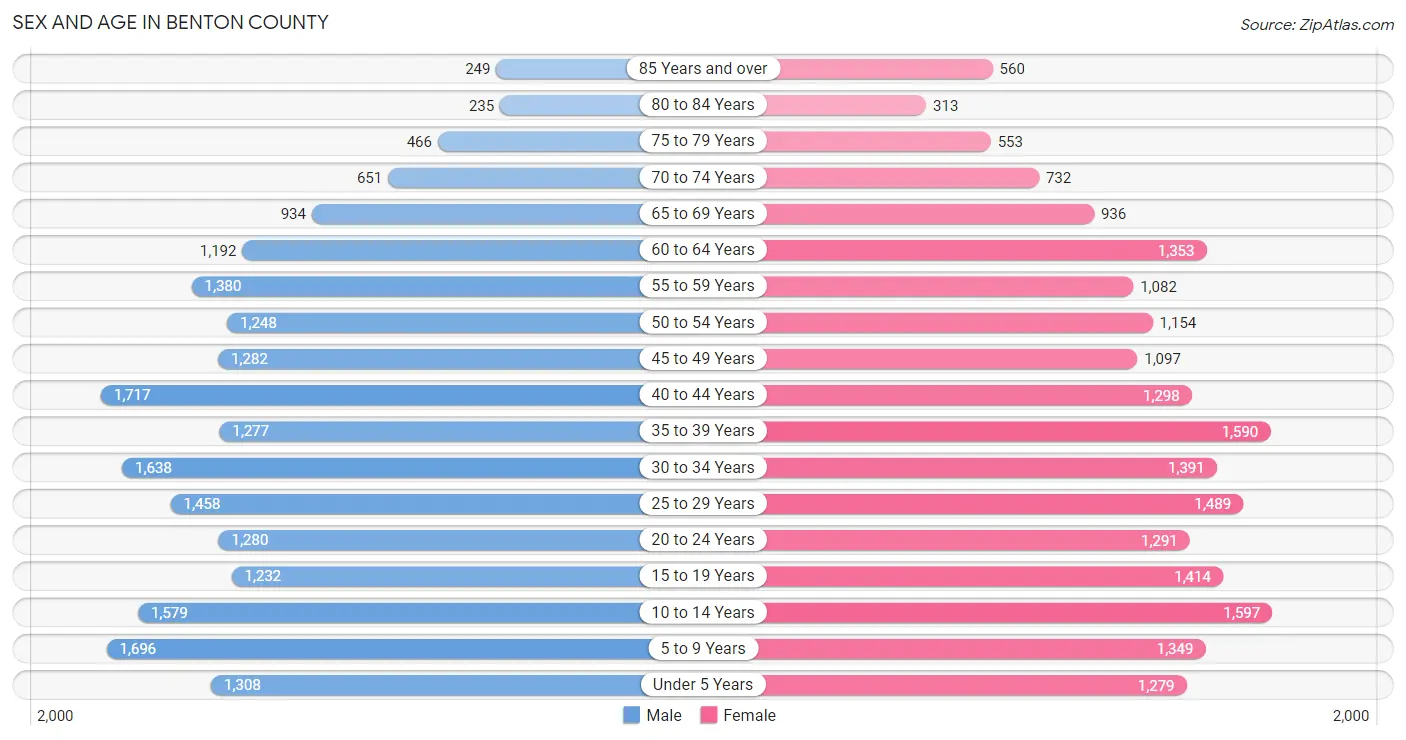
Sex and Age in Benton County
Sex and Age in Benton County
The most populous age groups in Benton County are 40 to 44 Years (1,717 | 8.3%) for men and 10 to 14 Years (1,597 | 7.8%) for women.
| Age Bracket | Male | Female |
| Under 5 Years | 1,308 (6.3%) | 1,279 (6.2%) |
| 5 to 9 Years | 1,696 (8.2%) | 1,349 (6.6%) |
| 10 to 14 Years | 1,579 (7.6%) | 1,597 (7.8%) |
| 15 to 19 Years | 1,232 (5.9%) | 1,414 (6.9%) |
| 20 to 24 Years | 1,280 (6.1%) | 1,291 (6.3%) |
| 25 to 29 Years | 1,458 (7.0%) | 1,489 (7.3%) |
| 30 to 34 Years | 1,638 (7.9%) | 1,391 (6.8%) |
| 35 to 39 Years | 1,277 (6.1%) | 1,590 (7.8%) |
| 40 to 44 Years | 1,717 (8.3%) | 1,298 (6.3%) |
| 45 to 49 Years | 1,282 (6.2%) | 1,097 (5.4%) |
| 50 to 54 Years | 1,248 (6.0%) | 1,154 (5.6%) |
| 55 to 59 Years | 1,380 (6.6%) | 1,082 (5.3%) |
| 60 to 64 Years | 1,192 (5.7%) | 1,353 (6.6%) |
| 65 to 69 Years | 934 (4.5%) | 936 (4.6%) |
| 70 to 74 Years | 651 (3.1%) | 732 (3.6%) |
| 75 to 79 Years | 466 (2.2%) | 553 (2.7%) |
| 80 to 84 Years | 235 (1.1%) | 313 (1.5%) |
| 85 Years and over | 249 (1.2%) | 560 (2.7%) |
| Total | 20,822 (100.0%) | 20,478 (100.0%) |
Families and Households in Benton County
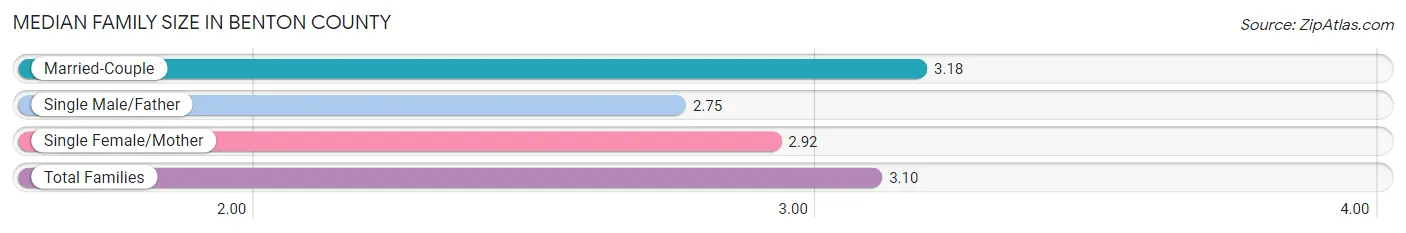
Median Family Size in Benton County
The median family size in Benton County is 3.10 persons per family, with married-couple families (7,488 | 74.5%) accounting for the largest median family size of 3.18 persons per family. On the other hand, single male/father families (1,080 | 10.7%) represent the smallest median family size with 2.75 persons per family.
| Family Type | # Families | Family Size |
| Married-Couple | 7,488 (74.5%) | 3.18 |
| Single Male/Father | 1,080 (10.7%) | 2.75 |
| Single Female/Mother | 1,481 (14.7%) | 2.92 |
| Total Families | 10,049 (100.0%) | 3.10 |
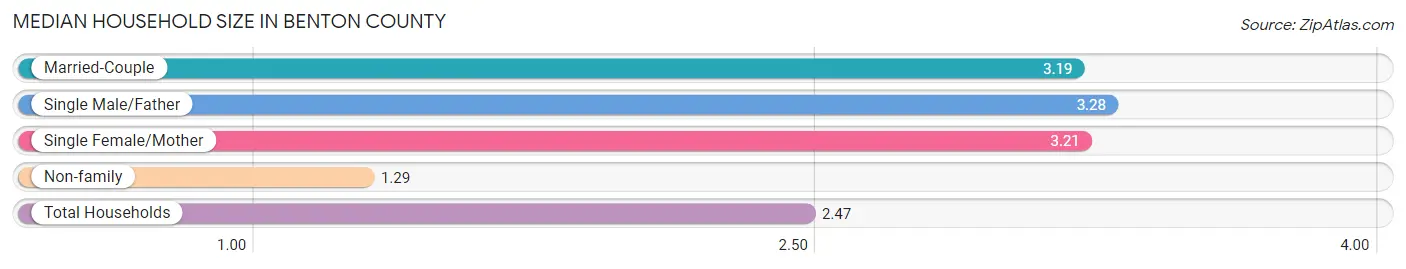
Median Household Size in Benton County
The median household size in Benton County is 2.47 persons per household, with single male/father households (1,080 | 6.6%) accounting for the largest median household size of 3.28 persons per household. non-family households (6,263 | 38.4%) represent the smallest median household size with 1.29 persons per household.
| Household Type | # Households | Household Size |
| Married-Couple | 7,488 (45.9%) | 3.19 |
| Single Male/Father | 1,080 (6.6%) | 3.28 |
| Single Female/Mother | 1,481 (9.1%) | 3.21 |
| Non-family | 6,263 (38.4%) | 1.29 |
| Total Households | 16,312 (100.0%) | 2.47 |
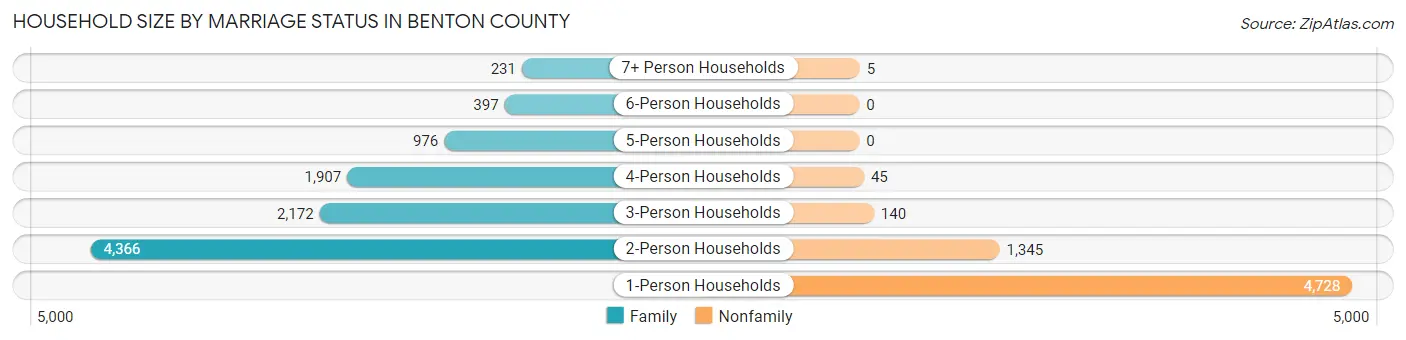
Household Size by Marriage Status in Benton County
Out of a total of 16,312 households in Benton County, 10,049 (61.6%) are family households, while 6,263 (38.4%) are nonfamily households. The most numerous type of family households are 2-person households, comprising 4,366, and the most common type of nonfamily households are 1-person households, comprising 4,728.
| Household Size | Family Households | Nonfamily Households |
| 1-Person Households | - | 4,728 (29.0%) |
| 2-Person Households | 4,366 (26.8%) | 1,345 (8.3%) |
| 3-Person Households | 2,172 (13.3%) | 140 (0.9%) |
| 4-Person Households | 1,907 (11.7%) | 45 (0.3%) |
| 5-Person Households | 976 (6.0%) | 0 (0.0%) |
| 6-Person Households | 397 (2.4%) | 0 (0.0%) |
| 7+ Person Households | 231 (1.4%) | 5 (0.0%) |
| Total | 10,049 (61.6%) | 6,263 (38.4%) |
Female Fertility in Benton County
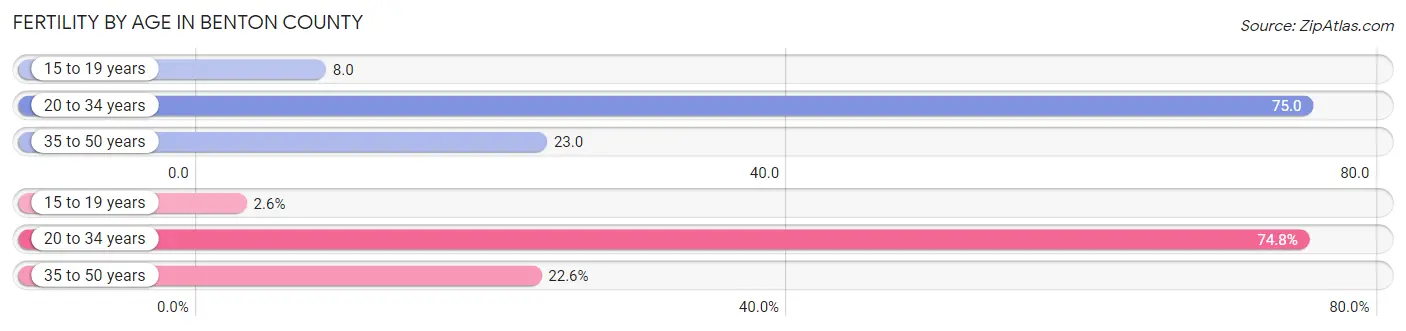
Fertility by Age in Benton County
Average fertility rate in Benton County is 43.0 births per 1,000 women. Women in the age bracket of 20 to 34 years have the highest fertility rate with 75.0 births per 1,000 women. Women in the age bracket of 20 to 34 years acount for 74.8% of all women with births.
| Age Bracket | Women with Births | Births / 1,000 Women |
| 15 to 19 years | 11 (2.6%) | 8.0 |
| 20 to 34 years | 314 (74.8%) | 75.0 |
| 35 to 50 years | 95 (22.6%) | 23.0 |
| Total | 420 (100.0%) | 43.0 |
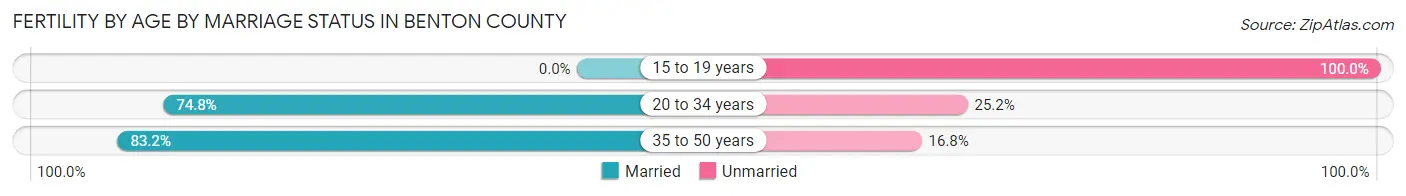
Fertility by Age by Marriage Status in Benton County
74.8% of women with births (420) in Benton County are married. The highest percentage of unmarried women with births falls into 15 to 19 years age bracket with 100.0% of them unmarried at the time of birth, while the lowest percentage of unmarried women with births belong to 35 to 50 years age bracket with 16.8% of them unmarried.
| Age Bracket | Married | Unmarried |
| 15 to 19 years | 0 (0.0%) | 11 (100.0%) |
| 20 to 34 years | 235 (74.8%) | 79 (25.2%) |
| 35 to 50 years | 79 (83.2%) | 16 (16.8%) |
| Total | 314 (74.8%) | 106 (25.2%) |
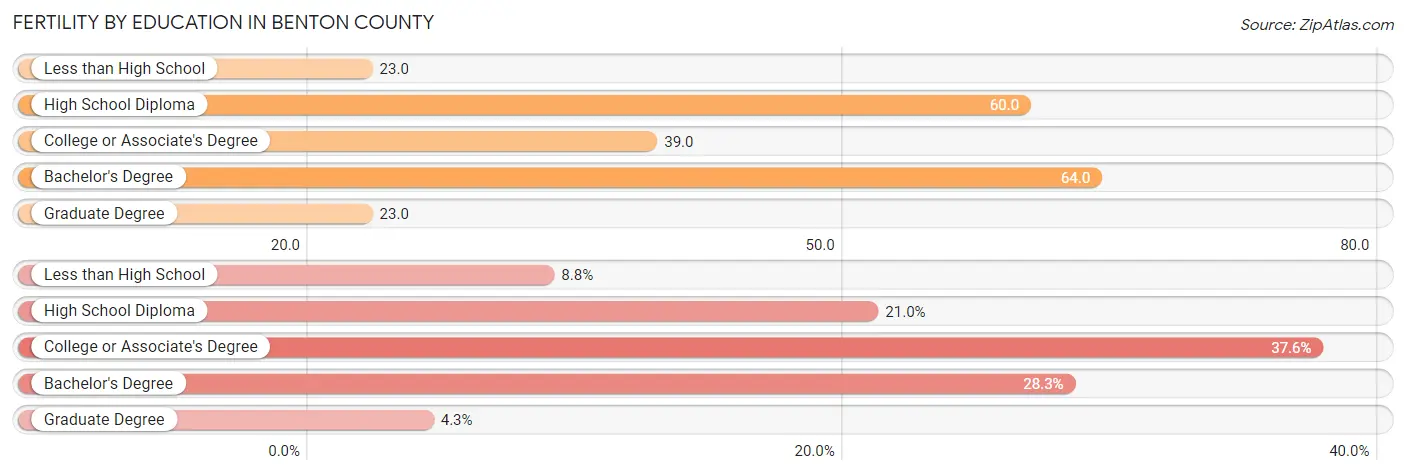
Fertility by Education in Benton County
Average fertility rate in Benton County is 43.0 births per 1,000 women. Women with the education attainment of bachelor's degree have the highest fertility rate of 64.0 births per 1,000 women, while women with the education attainment of less than high school have the lowest fertility at 23.0 births per 1,000 women. Women with the education attainment of college or associate's degree represent 37.6% of all women with births.
| Educational Attainment | Women with Births | Births / 1,000 Women |
| Less than High School | 37 (8.8%) | 23.0 |
| High School Diploma | 88 (20.9%) | 60.0 |
| College or Associate's Degree | 158 (37.6%) | 39.0 |
| Bachelor's Degree | 119 (28.3%) | 64.0 |
| Graduate Degree | 18 (4.3%) | 23.0 |
| Total | 420 (100.0%) | 43.0 |
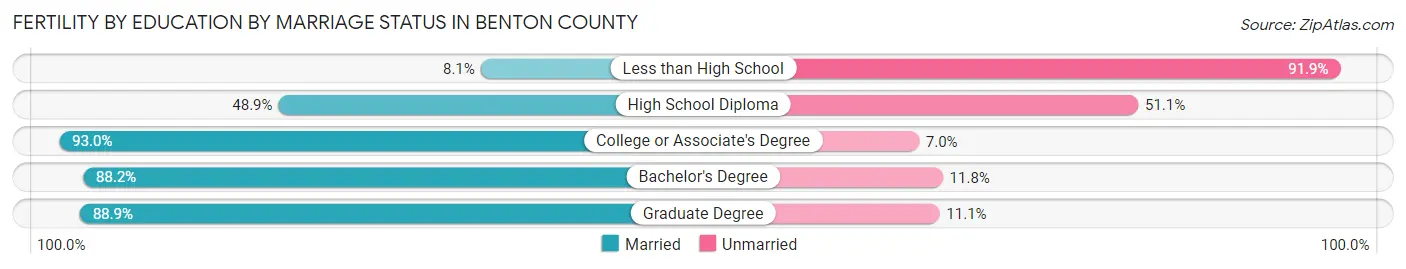
Fertility by Education by Marriage Status in Benton County
25.2% of women with births in Benton County are unmarried. Women with the educational attainment of college or associate's degree are most likely to be married with 93.0% of them married at childbirth, while women with the educational attainment of less than high school are least likely to be married with 91.9% of them unmarried at childbirth.
| Educational Attainment | Married | Unmarried |
| Less than High School | 3 (8.1%) | 34 (91.9%) |
| High School Diploma | 43 (48.9%) | 45 (51.1%) |
| College or Associate's Degree | 147 (93.0%) | 11 (7.0%) |
| Bachelor's Degree | 105 (88.2%) | 14 (11.8%) |
| Graduate Degree | 16 (88.9%) | 2 (11.1%) |
| Total | 314 (74.8%) | 106 (25.2%) |
Income in Benton County
Income Overview in Benton County
Per Capita Income in Benton County is $35,885, while median incomes of families and households are $90,316 and $70,346 respectively.
| Characteristic | Number | Measure |
| Per Capita Income | 41,300 | $35,885 |
| Median Family Income | 10,049 | $90,316 |
| Mean Family Income | 10,049 | $103,957 |
| Median Household Income | 16,312 | $70,346 |
| Mean Household Income | 16,312 | $87,758 |
| Income Deficit | 10,049 | $11,364 |
| Wage / Income Gap (%) | 41,300 | 29.17% |
| Wage / Income Gap ($) | 41,300 | 70.83¢ per $1 |
| Gini / Inequality Index | 41,300 | 0.39 |
Earnings by Sex in Benton County
Average Earnings in Benton County are $45,232, $52,873 for men and $37,448 for women, a difference of 29.2%.
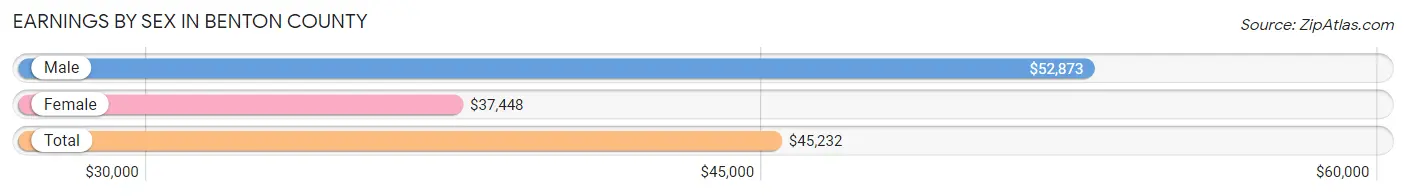
| Sex | Number | Average Earnings |
| Male | 12,358 (51.6%) | $52,873 |
| Female | 11,593 (48.4%) | $37,448 |
| Total | 23,951 (100.0%) | $45,232 |
Earnings by Sex by Income Bracket in Benton County
The most common earnings brackets in Benton County are $75,000 to $99,999 for men (1,812 | 14.7%) and $55,000 to $64,999 for women (1,029 | 8.9%).
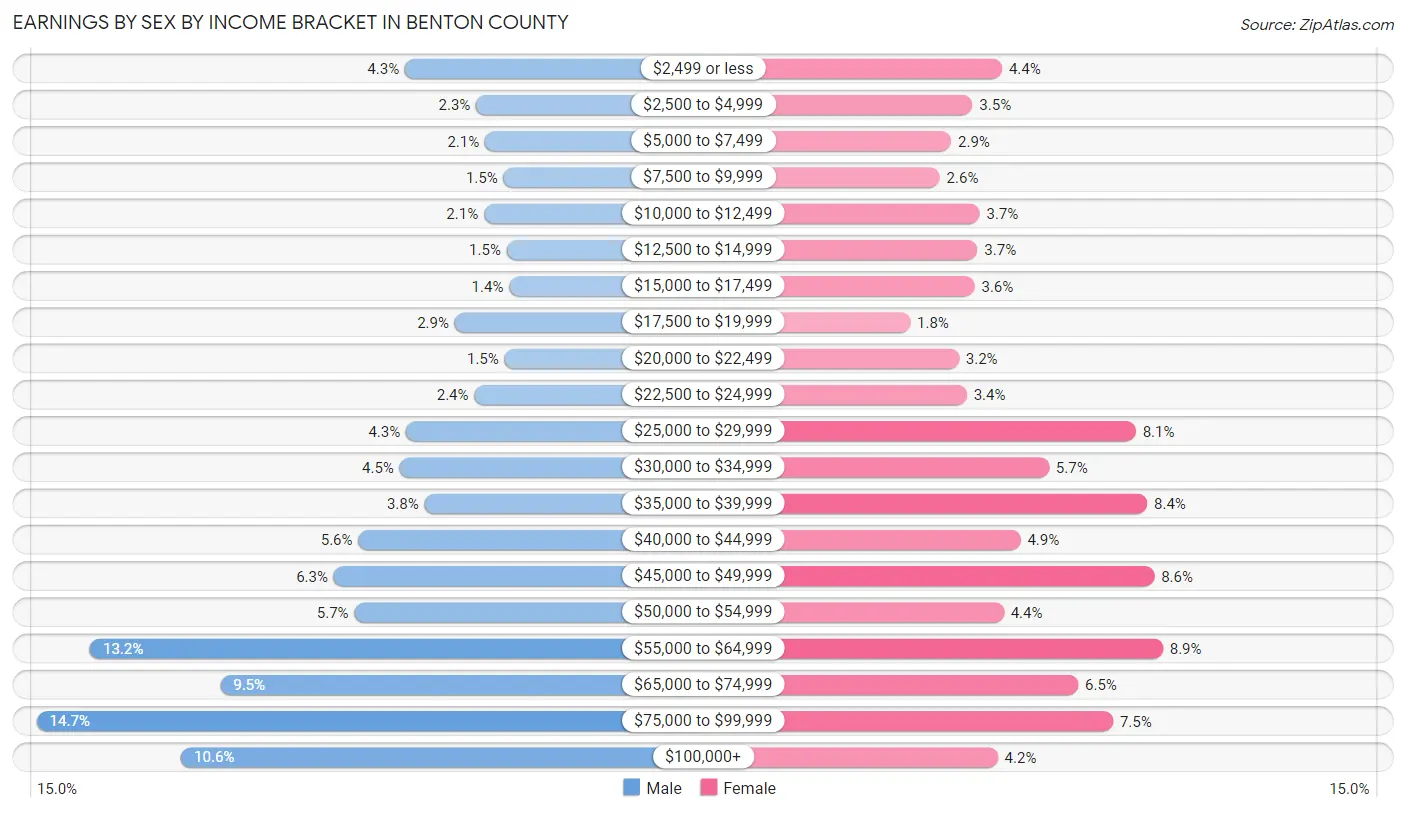
| Income | Male | Female |
| $2,499 or less | 533 (4.3%) | 506 (4.4%) |
| $2,500 to $4,999 | 286 (2.3%) | 409 (3.5%) |
| $5,000 to $7,499 | 255 (2.1%) | 340 (2.9%) |
| $7,500 to $9,999 | 190 (1.5%) | 302 (2.6%) |
| $10,000 to $12,499 | 258 (2.1%) | 432 (3.7%) |
| $12,500 to $14,999 | 179 (1.5%) | 426 (3.7%) |
| $15,000 to $17,499 | 170 (1.4%) | 416 (3.6%) |
| $17,500 to $19,999 | 359 (2.9%) | 206 (1.8%) |
| $20,000 to $22,499 | 187 (1.5%) | 365 (3.2%) |
| $22,500 to $24,999 | 292 (2.4%) | 391 (3.4%) |
| $25,000 to $29,999 | 529 (4.3%) | 941 (8.1%) |
| $30,000 to $34,999 | 551 (4.5%) | 659 (5.7%) |
| $35,000 to $39,999 | 465 (3.8%) | 979 (8.4%) |
| $40,000 to $44,999 | 694 (5.6%) | 566 (4.9%) |
| $45,000 to $49,999 | 780 (6.3%) | 1,002 (8.6%) |
| $50,000 to $54,999 | 708 (5.7%) | 511 (4.4%) |
| $55,000 to $64,999 | 1,626 (13.2%) | 1,029 (8.9%) |
| $65,000 to $74,999 | 1,174 (9.5%) | 754 (6.5%) |
| $75,000 to $99,999 | 1,812 (14.7%) | 867 (7.5%) |
| $100,000+ | 1,310 (10.6%) | 492 (4.2%) |
| Total | 12,358 (100.0%) | 11,593 (100.0%) |
Earnings by Sex by Educational Attainment in Benton County
Average earnings in Benton County are $56,844 for men and $42,117 for women, a difference of 25.9%. Men with an educational attainment of graduate degree enjoy the highest average annual earnings of $82,076, while those with high school diploma education earn the least with $46,613. Women with an educational attainment of graduate degree earn the most with the average annual earnings of $70,639, while those with less than high school education have the smallest earnings of $27,582.
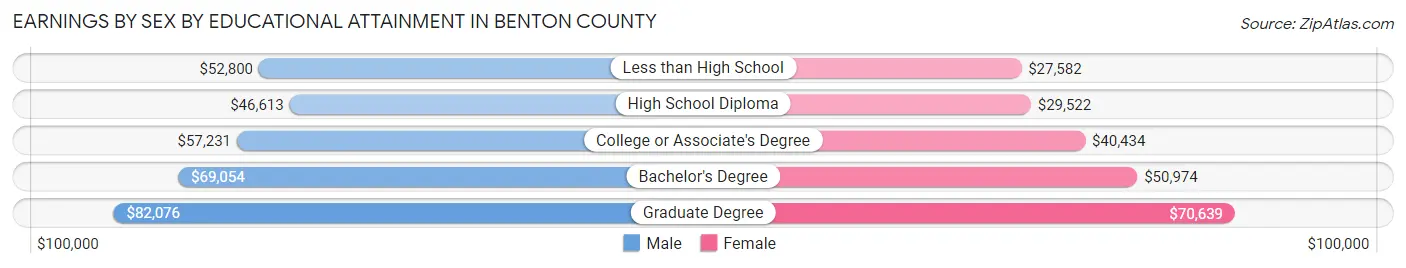
| Educational Attainment | Male Income | Female Income |
| Less than High School | $52,800 | $27,582 |
| High School Diploma | $46,613 | $29,522 |
| College or Associate's Degree | $57,231 | $40,434 |
| Bachelor's Degree | $69,054 | $50,974 |
| Graduate Degree | $82,076 | $70,639 |
| Total | $56,844 | $42,117 |
Family Income in Benton County
Family Income Brackets in Benton County
According to the Benton County family income data, there are 2,552 families falling into the $100,000 to $149,999 income range, which is the most common income bracket and makes up 25.4% of all families. Conversely, the $10,000 to $14,999 income bracket is the least frequent group with only 30 families (0.3%) belonging to this category.
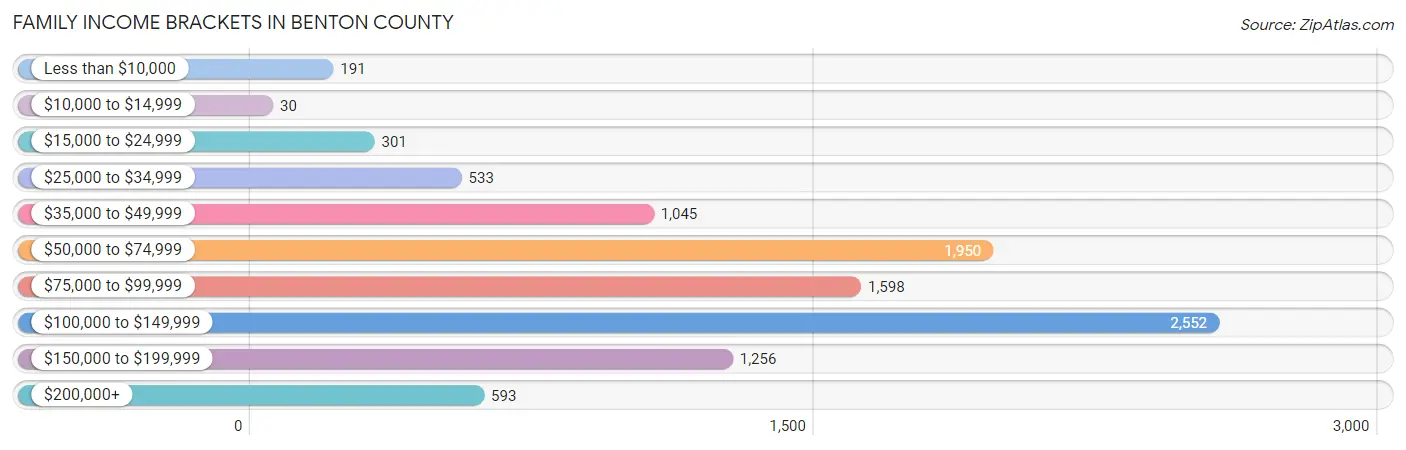
| Income Bracket | # Families | % Families |
| Less than $10,000 | 191 | 1.9% |
| $10,000 to $14,999 | 30 | 0.3% |
| $15,000 to $24,999 | 301 | 3.0% |
| $25,000 to $34,999 | 533 | 5.3% |
| $35,000 to $49,999 | 1,045 | 10.4% |
| $50,000 to $74,999 | 1,950 | 19.4% |
| $75,000 to $99,999 | 1,598 | 15.9% |
| $100,000 to $149,999 | 2,552 | 25.4% |
| $150,000 to $199,999 | 1,256 | 12.5% |
| $200,000+ | 593 | 5.9% |
Family Income by Famaliy Size in Benton County
5-person families (921 | 9.2%) account for the highest median family income in Benton County with $131,359 per family, while 2-person families (4,703 | 46.8%) have the highest median income of $40,830 per family member.
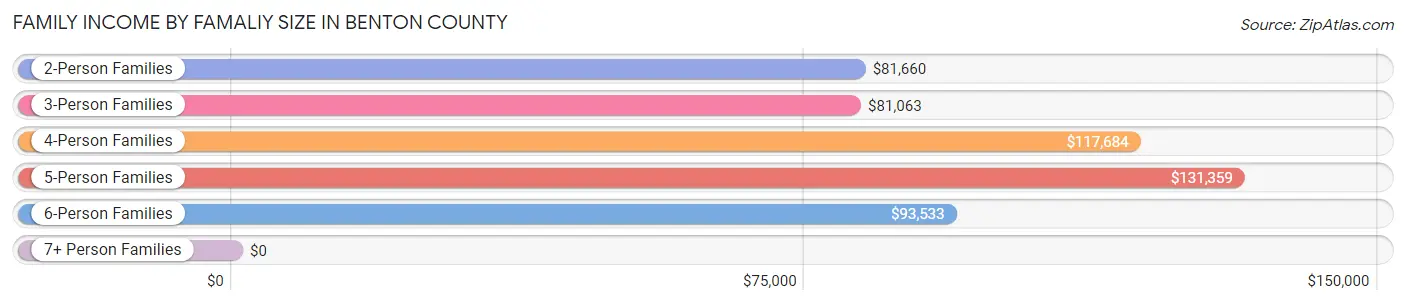
| Income Bracket | # Families | Median Income |
| 2-Person Families | 4,703 (46.8%) | $81,660 |
| 3-Person Families | 2,214 (22.0%) | $81,063 |
| 4-Person Families | 1,715 (17.1%) | $117,684 |
| 5-Person Families | 921 (9.2%) | $131,359 |
| 6-Person Families | 315 (3.1%) | $93,533 |
| 7+ Person Families | 181 (1.8%) | $0 |
| Total | 10,049 (100.0%) | $90,316 |
Family Income by Number of Earners in Benton County
The median family income in Benton County is $90,316, with families comprising 3+ earners (1,202) having the highest median family income of $143,370, while families with no earners (1,167) have the lowest median family income of $51,273, accounting for 12.0% and 11.6% of families, respectively.
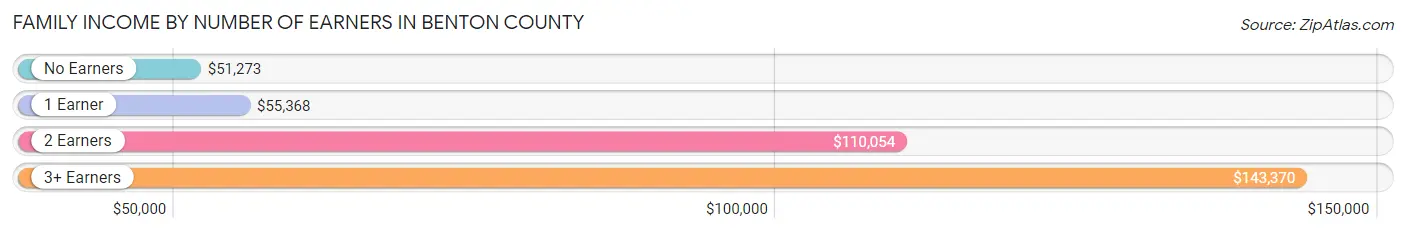
| Number of Earners | # Families | Median Income |
| No Earners | 1,167 (11.6%) | $51,273 |
| 1 Earner | 2,748 (27.4%) | $55,368 |
| 2 Earners | 4,932 (49.1%) | $110,054 |
| 3+ Earners | 1,202 (12.0%) | $143,370 |
| Total | 10,049 (100.0%) | $90,316 |
Household Income in Benton County
Household Income Brackets in Benton County
With 3,393 households falling in the category, the $100,000 to $149,999 income range is the most frequent in Benton County, accounting for 20.8% of all households. In contrast, only 343 households (2.1%) fall into the $10,000 to $14,999 income bracket, making it the least populous group.
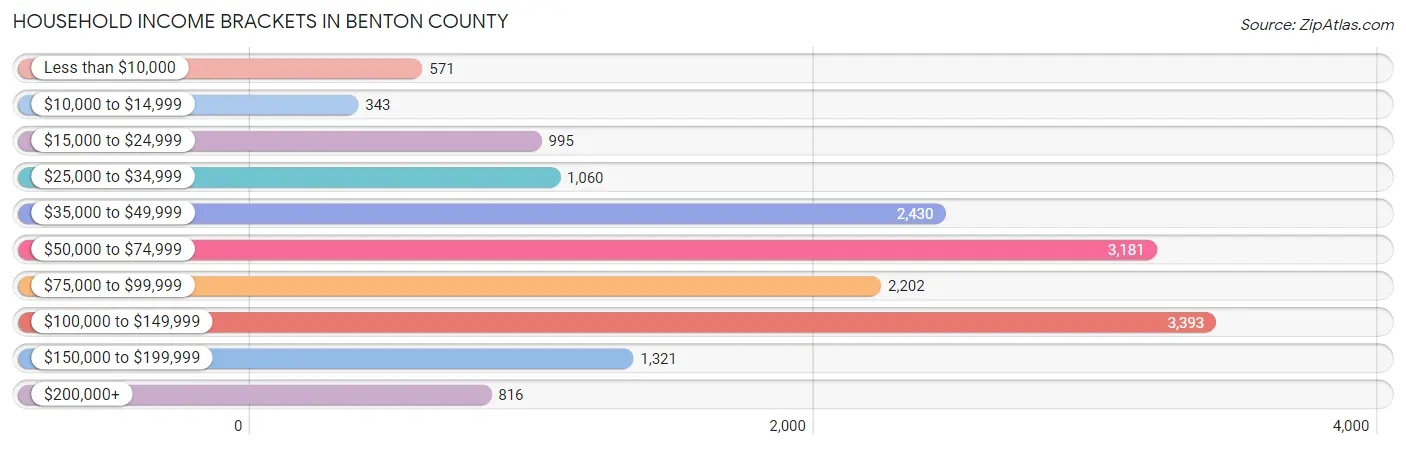
| Income Bracket | # Households | % Households |
| Less than $10,000 | 571 | 3.5% |
| $10,000 to $14,999 | 343 | 2.1% |
| $15,000 to $24,999 | 995 | 6.1% |
| $25,000 to $34,999 | 1,060 | 6.5% |
| $35,000 to $49,999 | 2,430 | 14.9% |
| $50,000 to $74,999 | 3,181 | 19.5% |
| $75,000 to $99,999 | 2,202 | 13.5% |
| $100,000 to $149,999 | 3,393 | 20.8% |
| $150,000 to $199,999 | 1,321 | 8.1% |
| $200,000+ | 816 | 5.0% |
Household Income by Householder Age in Benton County
The median household income in Benton County is $70,346, with the highest median household income of $88,169 found in the 45 to 64 years age bracket for the primary householder. A total of 5,789 households (35.5%) fall into this category. Meanwhile, the 15 to 24 years age bracket for the primary householder has the lowest median household income of $43,285, with 998 households (6.1%) in this group.
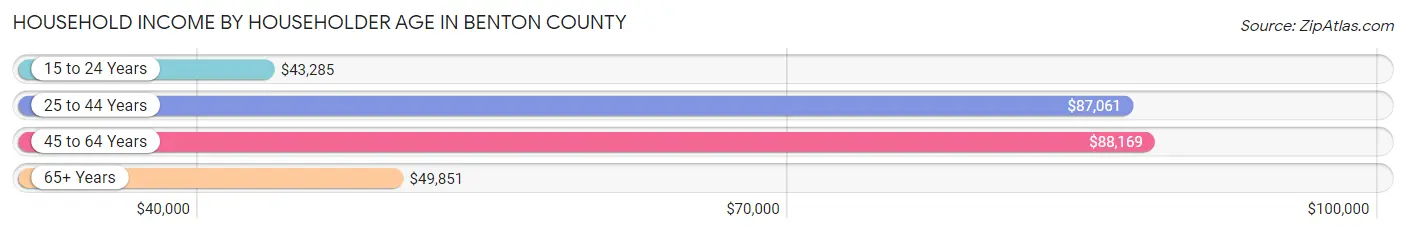
| Income Bracket | # Households | Median Income |
| 15 to 24 Years | 998 (6.1%) | $43,285 |
| 25 to 44 Years | 6,291 (38.6%) | $87,061 |
| 45 to 64 Years | 5,789 (35.5%) | $88,169 |
| 65+ Years | 3,234 (19.8%) | $49,851 |
| Total | 16,312 (100.0%) | $70,346 |
Poverty in Benton County
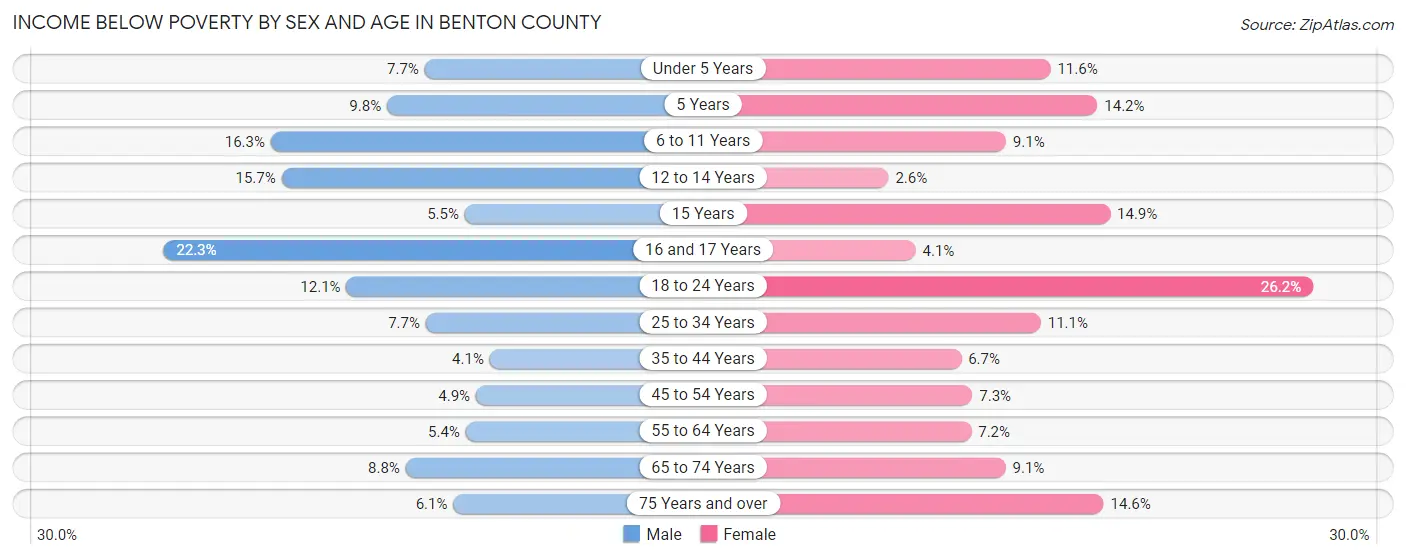
Income Below Poverty by Sex and Age in Benton County
With 8.4% poverty level for males and 10.2% for females among the residents of Benton County, 16 and 17 year old males and 18 to 24 year old females are the most vulnerable to poverty, with 108 males (22.3%) and 464 females (26.2%) in their respective age groups living below the poverty level.
| Age Bracket | Male | Female |
| Under 5 Years | 101 (7.7%) | 148 (11.6%) |
| 5 Years | 28 (9.8%) | 35 (14.2%) |
| 6 to 11 Years | 313 (16.3%) | 136 (9.1%) |
| 12 to 14 Years | 148 (15.7%) | 30 (2.6%) |
| 15 Years | 18 (5.5%) | 49 (14.9%) |
| 16 and 17 Years | 108 (22.3%) | 25 (4.1%) |
| 18 to 24 Years | 203 (12.1%) | 464 (26.2%) |
| 25 to 34 Years | 237 (7.7%) | 319 (11.1%) |
| 35 to 44 Years | 121 (4.1%) | 192 (6.7%) |
| 45 to 54 Years | 123 (4.9%) | 163 (7.3%) |
| 55 to 64 Years | 139 (5.4%) | 175 (7.2%) |
| 65 to 74 Years | 137 (8.8%) | 145 (9.1%) |
| 75 Years and over | 51 (6.1%) | 172 (14.6%) |
| Total | 1,727 (8.4%) | 2,053 (10.2%) |
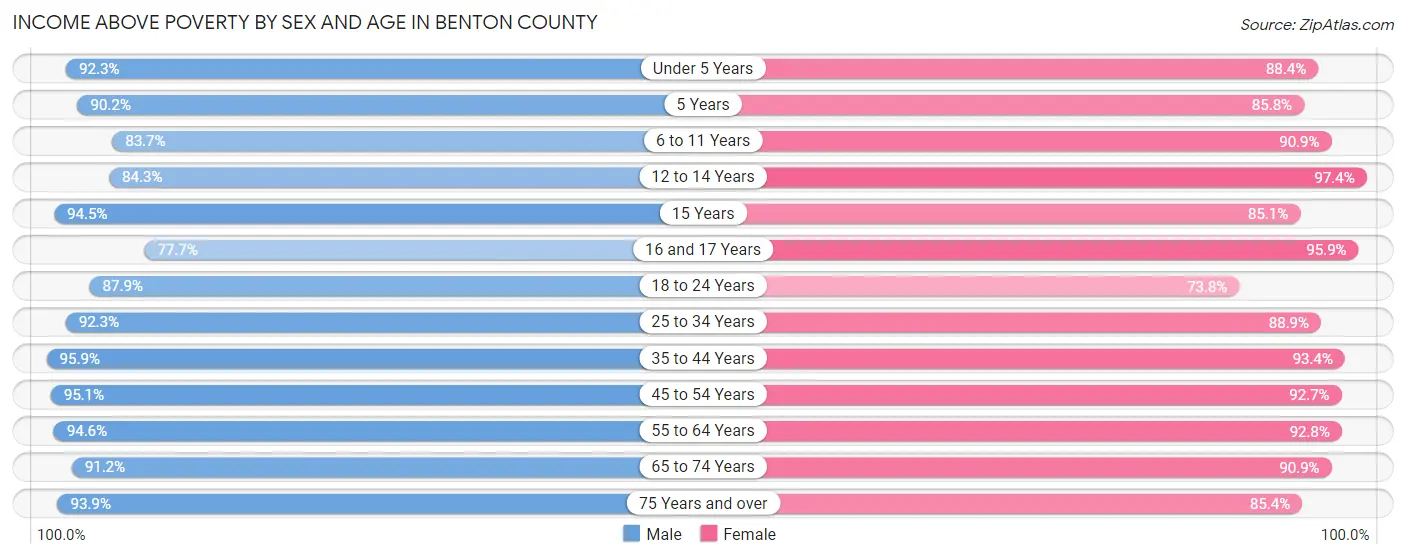
Income Above Poverty by Sex and Age in Benton County
According to the poverty statistics in Benton County, males aged 35 to 44 years and females aged 12 to 14 years are the age groups that are most secure financially, with 95.9% of males and 97.4% of females in these age groups living above the poverty line.
| Age Bracket | Male | Female |
| Under 5 Years | 1,207 (92.3%) | 1,126 (88.4%) |
| 5 Years | 257 (90.2%) | 211 (85.8%) |
| 6 to 11 Years | 1,608 (83.7%) | 1,352 (90.9%) |
| 12 to 14 Years | 795 (84.3%) | 1,123 (97.4%) |
| 15 Years | 310 (94.5%) | 279 (85.1%) |
| 16 and 17 Years | 377 (77.7%) | 584 (95.9%) |
| 18 to 24 Years | 1,478 (87.9%) | 1,304 (73.8%) |
| 25 to 34 Years | 2,859 (92.3%) | 2,561 (88.9%) |
| 35 to 44 Years | 2,831 (95.9%) | 2,696 (93.3%) |
| 45 to 54 Years | 2,404 (95.1%) | 2,079 (92.7%) |
| 55 to 64 Years | 2,415 (94.6%) | 2,252 (92.8%) |
| 65 to 74 Years | 1,423 (91.2%) | 1,445 (90.9%) |
| 75 Years and over | 781 (93.9%) | 1,008 (85.4%) |
| Total | 18,745 (91.6%) | 18,020 (89.8%) |
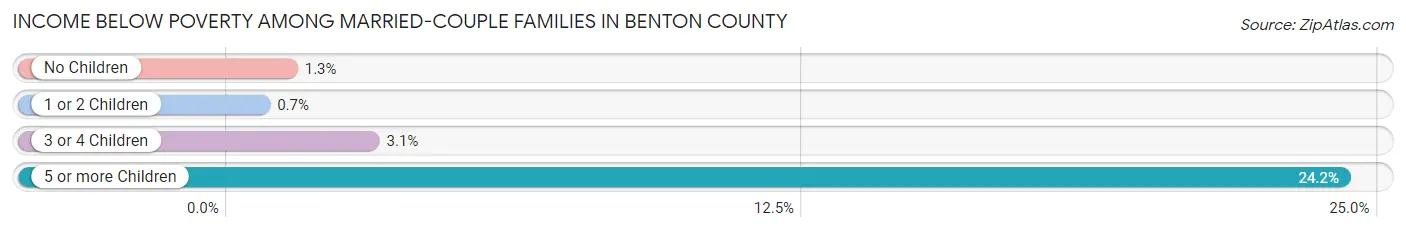
Income Below Poverty Among Married-Couple Families in Benton County
The poverty statistics for married-couple families in Benton County show that 1.6% or 119 of the total 7,488 families live below the poverty line. Families with 5 or more children have the highest poverty rate of 24.2%, comprising of 23 families. On the other hand, families with 1 or 2 children have the lowest poverty rate of 0.7%, which includes 16 families.
| Children | Above Poverty | Below Poverty |
| No Children | 4,258 (98.7%) | 56 (1.3%) |
| 1 or 2 Children | 2,283 (99.3%) | 16 (0.7%) |
| 3 or 4 Children | 756 (96.9%) | 24 (3.1%) |
| 5 or more Children | 72 (75.8%) | 23 (24.2%) |
| Total | 7,369 (98.4%) | 119 (1.6%) |
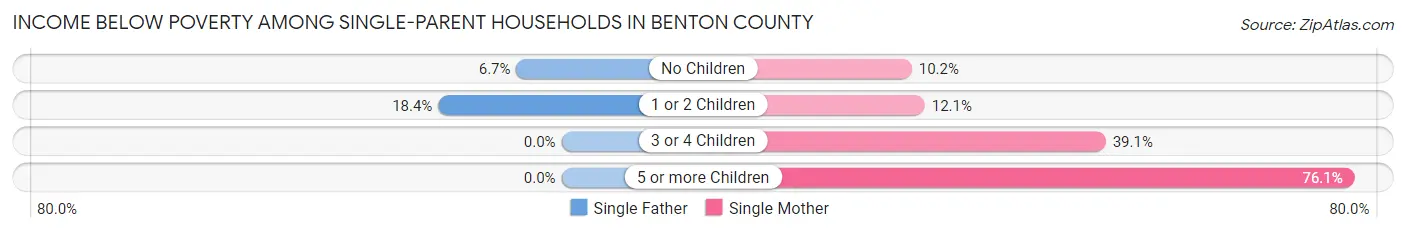
Income Below Poverty Among Single-Parent Households in Benton County
According to the poverty data in Benton County, 12.9% or 139 single-father households and 19.5% or 288 single-mother households are living below the poverty line. Among single-father households, those with 1 or 2 children have the highest poverty rate, with 113 households (18.4%) experiencing poverty. Likewise, among single-mother households, those with 5 or more children have the highest poverty rate, with 51 households (76.1%) falling below the poverty line.
| Children | Single Father | Single Mother |
| No Children | 26 (6.7%) | 41 (10.2%) |
| 1 or 2 Children | 113 (18.4%) | 89 (12.1%) |
| 3 or 4 Children | 0 (0.0%) | 107 (39.1%) |
| 5 or more Children | 0 (0.0%) | 51 (76.1%) |
| Total | 139 (12.9%) | 288 (19.5%) |
Income Below Poverty Among Married-Couple vs Single-Parent Households in Benton County
The poverty data for Benton County shows that 119 of the married-couple family households (1.6%) and 427 of the single-parent households (16.7%) are living below the poverty level. Within the married-couple family households, those with 5 or more children have the highest poverty rate, with 23 households (24.2%) falling below the poverty line. Among the single-parent households, those with 5 or more children have the highest poverty rate, with 51 household (73.9%) living below poverty.
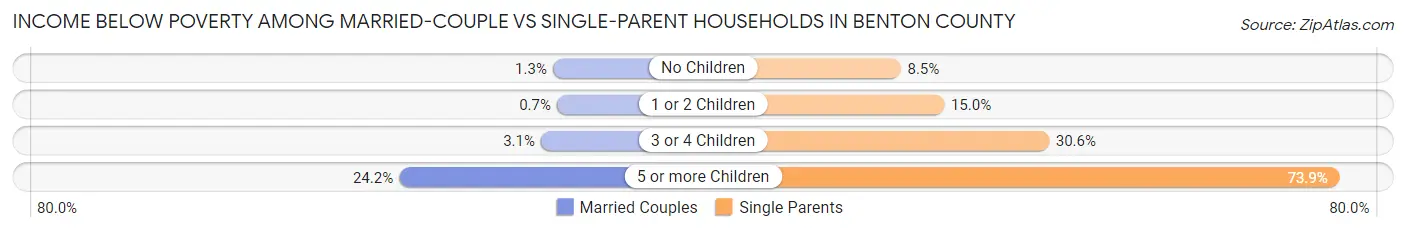
| Children | Married-Couple Families | Single-Parent Households |
| No Children | 56 (1.3%) | 67 (8.5%) |
| 1 or 2 Children | 16 (0.7%) | 202 (14.9%) |
| 3 or 4 Children | 24 (3.1%) | 107 (30.6%) |
| 5 or more Children | 23 (24.2%) | 51 (73.9%) |
| Total | 119 (1.6%) | 427 (16.7%) |
Employment Characteristics in Benton County
Employment by Class of Employer in Benton County
Among the 22,016 employed individuals in Benton County, private company employees (14,085 | 64.0%), not-for-profit organizations (2,764 | 12.6%), and local government employees (1,811 | 8.2%) make up the most common classes of employment.
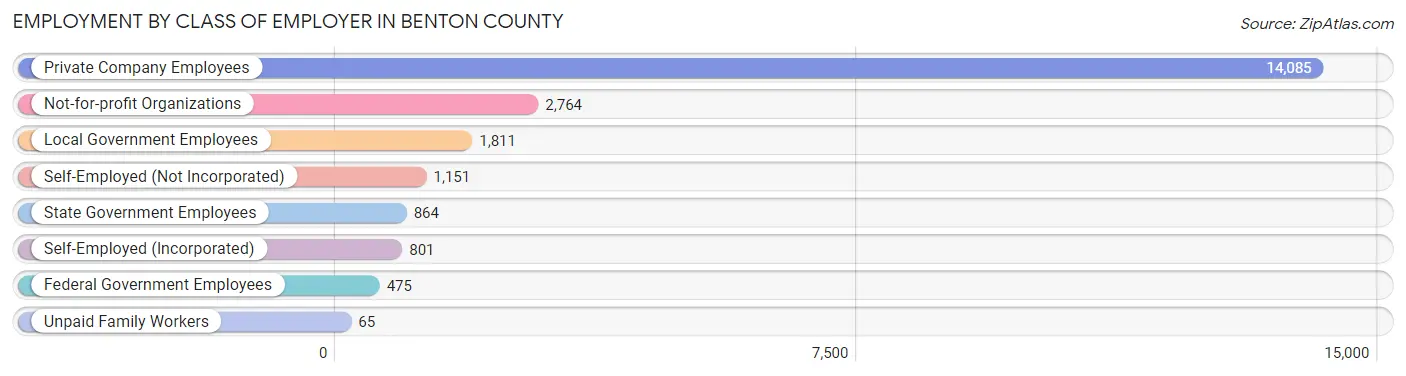
| Employer Class | # Employees | % Employees |
| Private Company Employees | 14,085 | 64.0% |
| Self-Employed (Incorporated) | 801 | 3.6% |
| Self-Employed (Not Incorporated) | 1,151 | 5.2% |
| Not-for-profit Organizations | 2,764 | 12.6% |
| Local Government Employees | 1,811 | 8.2% |
| State Government Employees | 864 | 3.9% |
| Federal Government Employees | 475 | 2.2% |
| Unpaid Family Workers | 65 | 0.3% |
| Total | 22,016 | 100.0% |
Employment Status by Age in Benton County
According to the labor force statistics for Benton County, out of the total population over 16 years of age (31,834), 73.3% or 23,334 individuals are in the labor force, with 3.7% or 863 of them unemployed. The age group with the highest labor force participation rate is 45 to 54 years, with 91.1% or 4,355 individuals in the labor force. Within the labor force, the 16 to 19 years age range has the highest percentage of unemployed individuals, with 7.1% or 91 of them being unemployed.
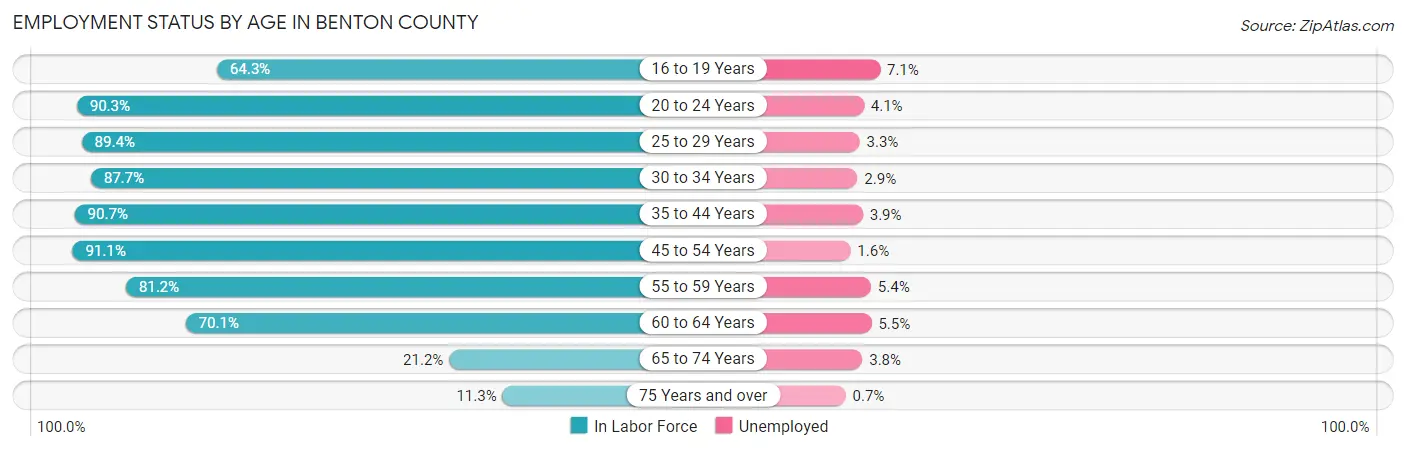
| Age Bracket | In Labor Force | Unemployed |
| 16 to 19 Years | 1,278 (64.3%) | 91 (7.1%) |
| 20 to 24 Years | 2,322 (90.3%) | 95 (4.1%) |
| 25 to 29 Years | 2,635 (89.4%) | 87 (3.3%) |
| 30 to 34 Years | 2,656 (87.7%) | 77 (2.9%) |
| 35 to 44 Years | 5,335 (90.7%) | 208 (3.9%) |
| 45 to 54 Years | 4,355 (91.1%) | 70 (1.6%) |
| 55 to 59 Years | 1,999 (81.2%) | 108 (5.4%) |
| 60 to 64 Years | 1,784 (70.1%) | 98 (5.5%) |
| 65 to 74 Years | 690 (21.2%) | 26 (3.8%) |
| 75 Years and over | 268 (11.3%) | 2 (0.7%) |
| Total | 23,334 (73.3%) | 863 (3.7%) |
Employment Status by Educational Attainment in Benton County
According to labor force statistics for Benton County, 86.7% of individuals (18,767) out of the total population between 25 and 64 years of age (21,646) are in the labor force, with 3.5% or 657 of them being unemployed. The group with the highest labor force participation rate are those with the educational attainment of bachelor's degree or higher, with 92.8% or 5,141 individuals in the labor force. Within the labor force, individuals with high school diploma education have the highest percentage of unemployment, with 6.4% or 271 of them being unemployed.
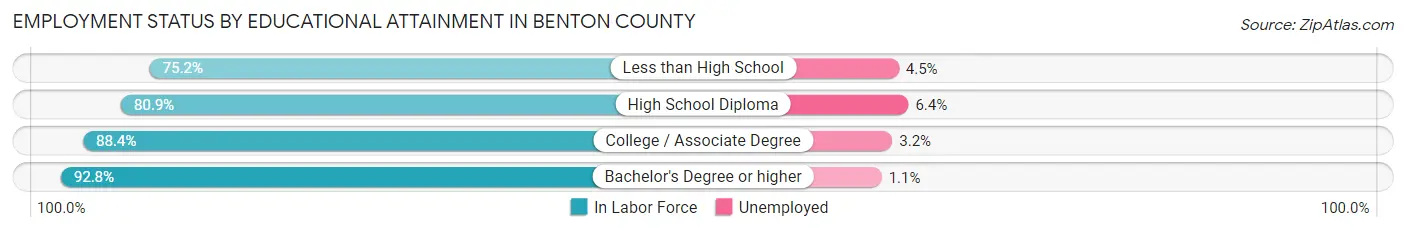
| Educational Attainment | In Labor Force | Unemployed |
| Less than High School | 1,254 (75.2%) | 75 (4.5%) |
| High School Diploma | 4,233 (80.9%) | 335 (6.4%) |
| College / Associate Degree | 8,138 (88.4%) | 295 (3.2%) |
| Bachelor's Degree or higher | 5,141 (92.8%) | 61 (1.1%) |
| Total | 18,767 (86.7%) | 758 (3.5%) |
Employment Occupations by Sex in Benton County
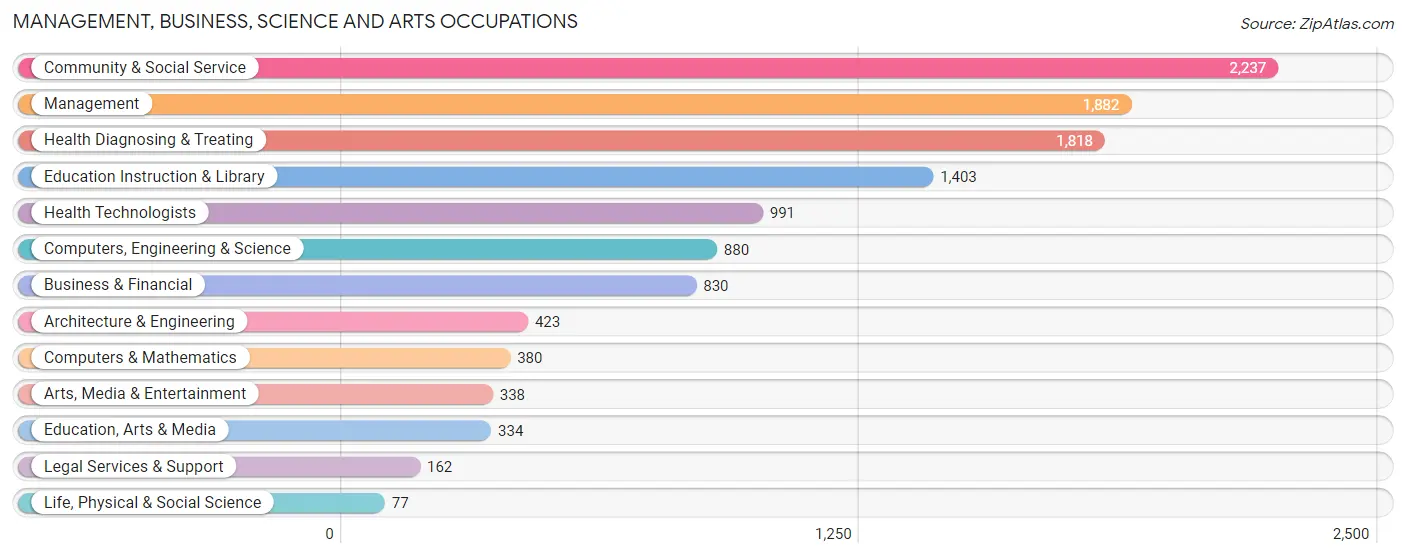
Management, Business, Science and Arts Occupations
The most common Management, Business, Science and Arts occupations in Benton County are Community & Social Service (2,237 | 10.0%), Management (1,882 | 8.4%), Health Diagnosing & Treating (1,818 | 8.1%), Education Instruction & Library (1,403 | 6.3%), and Health Technologists (991 | 4.4%).
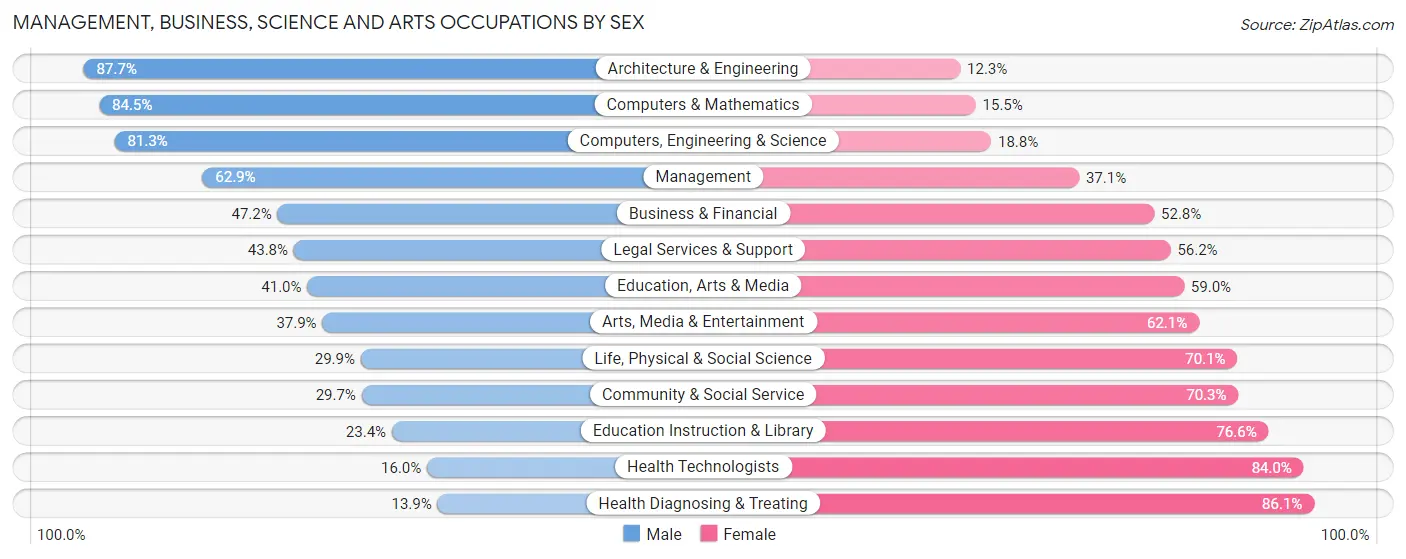
Management, Business, Science and Arts Occupations by Sex
Within the Management, Business, Science and Arts occupations in Benton County, the most male-oriented occupations are Architecture & Engineering (87.7%), Computers & Mathematics (84.5%), and Computers, Engineering & Science (81.2%), while the most female-oriented occupations are Health Diagnosing & Treating (86.1%), Health Technologists (84.0%), and Education Instruction & Library (76.6%).
| Occupation | Male | Female |
| Management | 1,184 (62.9%) | 698 (37.1%) |
| Business & Financial | 392 (47.2%) | 438 (52.8%) |
| Computers, Engineering & Science | 715 (81.2%) | 165 (18.8%) |
| Computers & Mathematics | 321 (84.5%) | 59 (15.5%) |
| Architecture & Engineering | 371 (87.7%) | 52 (12.3%) |
| Life, Physical & Social Science | 23 (29.9%) | 54 (70.1%) |
| Community & Social Service | 664 (29.7%) | 1,573 (70.3%) |
| Education, Arts & Media | 137 (41.0%) | 197 (59.0%) |
| Legal Services & Support | 71 (43.8%) | 91 (56.2%) |
| Education Instruction & Library | 328 (23.4%) | 1,075 (76.6%) |
| Arts, Media & Entertainment | 128 (37.9%) | 210 (62.1%) |
| Health Diagnosing & Treating | 252 (13.9%) | 1,566 (86.1%) |
| Health Technologists | 159 (16.0%) | 832 (84.0%) |
| Total (Category) | 3,207 (41.9%) | 4,440 (58.1%) |
| Total (Overall) | 11,483 (51.2%) | 10,923 (48.7%) |
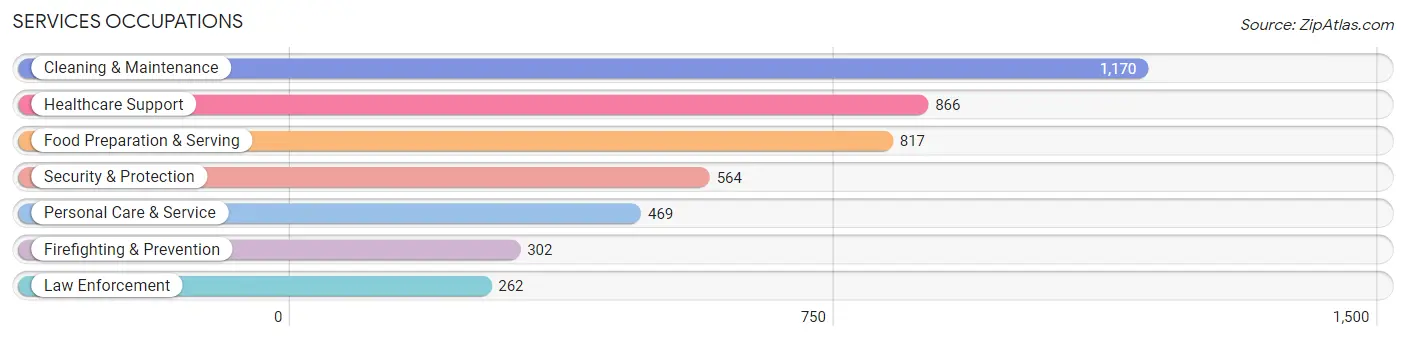
Services Occupations
The most common Services occupations in Benton County are Cleaning & Maintenance (1,170 | 5.2%), Healthcare Support (866 | 3.9%), Food Preparation & Serving (817 | 3.6%), Security & Protection (564 | 2.5%), and Personal Care & Service (469 | 2.1%).
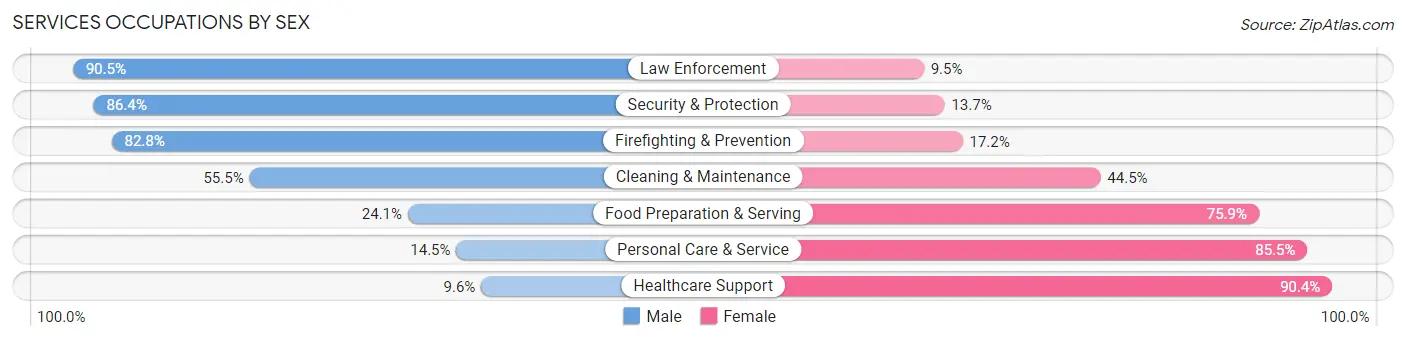
Services Occupations by Sex
Within the Services occupations in Benton County, the most male-oriented occupations are Law Enforcement (90.5%), Security & Protection (86.4%), and Firefighting & Prevention (82.8%), while the most female-oriented occupations are Healthcare Support (90.4%), Personal Care & Service (85.5%), and Food Preparation & Serving (75.9%).
| Occupation | Male | Female |
| Healthcare Support | 83 (9.6%) | 783 (90.4%) |
| Security & Protection | 487 (86.4%) | 77 (13.7%) |
| Firefighting & Prevention | 250 (82.8%) | 52 (17.2%) |
| Law Enforcement | 237 (90.5%) | 25 (9.5%) |
| Food Preparation & Serving | 197 (24.1%) | 620 (75.9%) |
| Cleaning & Maintenance | 649 (55.5%) | 521 (44.5%) |
| Personal Care & Service | 68 (14.5%) | 401 (85.5%) |
| Total (Category) | 1,484 (38.2%) | 2,402 (61.8%) |
| Total (Overall) | 11,483 (51.2%) | 10,923 (48.7%) |
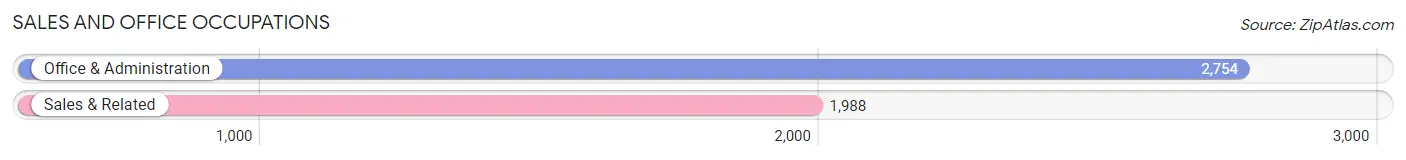
Sales and Office Occupations
The most common Sales and Office occupations in Benton County are Office & Administration (2,754 | 12.3%), and Sales & Related (1,988 | 8.9%).
Sales and Office Occupations by Sex
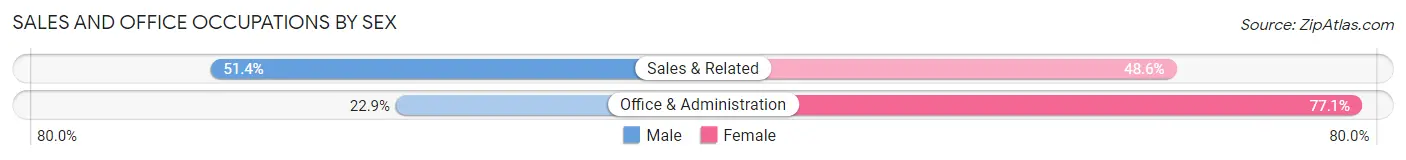
| Occupation | Male | Female |
| Sales & Related | 1,022 (51.4%) | 966 (48.6%) |
| Office & Administration | 630 (22.9%) | 2,124 (77.1%) |
| Total (Category) | 1,652 (34.8%) | 3,090 (65.2%) |
| Total (Overall) | 11,483 (51.2%) | 10,923 (48.7%) |
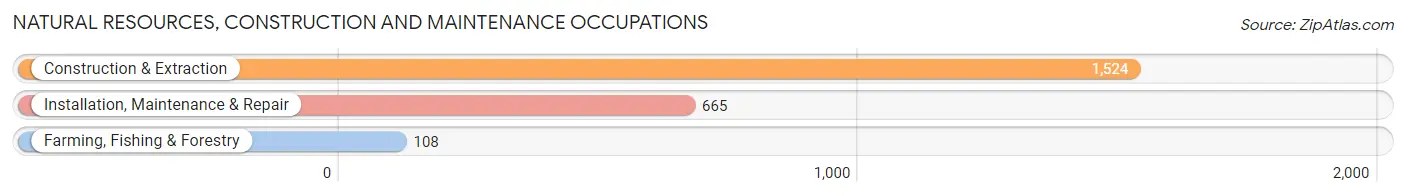
Natural Resources, Construction and Maintenance Occupations
The most common Natural Resources, Construction and Maintenance occupations in Benton County are Construction & Extraction (1,524 | 6.8%), Installation, Maintenance & Repair (665 | 3.0%), and Farming, Fishing & Forestry (108 | 0.5%).
Natural Resources, Construction and Maintenance Occupations by Sex
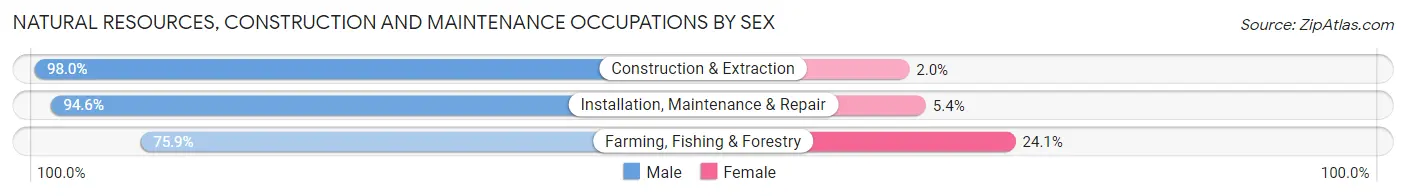
| Occupation | Male | Female |
| Farming, Fishing & Forestry | 82 (75.9%) | 26 (24.1%) |
| Construction & Extraction | 1,494 (98.0%) | 30 (2.0%) |
| Installation, Maintenance & Repair | 629 (94.6%) | 36 (5.4%) |
| Total (Category) | 2,205 (96.0%) | 92 (4.0%) |
| Total (Overall) | 11,483 (51.2%) | 10,923 (48.7%) |
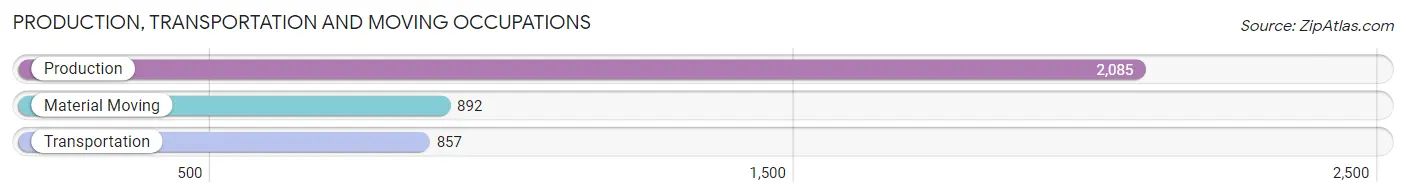
Production, Transportation and Moving Occupations
The most common Production, Transportation and Moving occupations in Benton County are Production (2,085 | 9.3%), Material Moving (892 | 4.0%), and Transportation (857 | 3.8%).
Production, Transportation and Moving Occupations by Sex
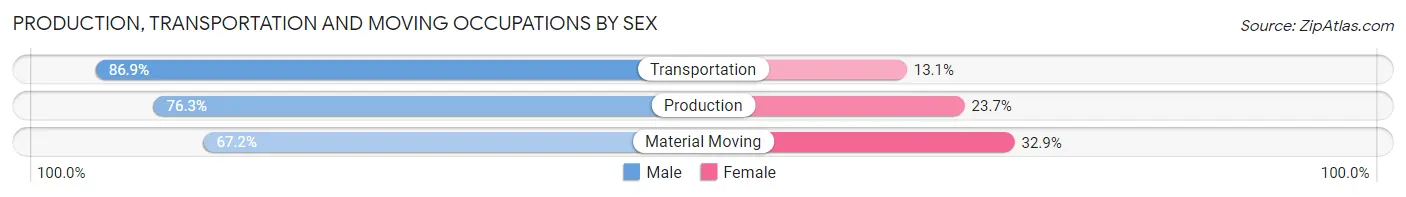
| Occupation | Male | Female |
| Production | 1,591 (76.3%) | 494 (23.7%) |
| Transportation | 745 (86.9%) | 112 (13.1%) |
| Material Moving | 599 (67.1%) | 293 (32.9%) |
| Total (Category) | 2,935 (76.5%) | 899 (23.4%) |
| Total (Overall) | 11,483 (51.2%) | 10,923 (48.7%) |
Employment Industries by Sex in Benton County
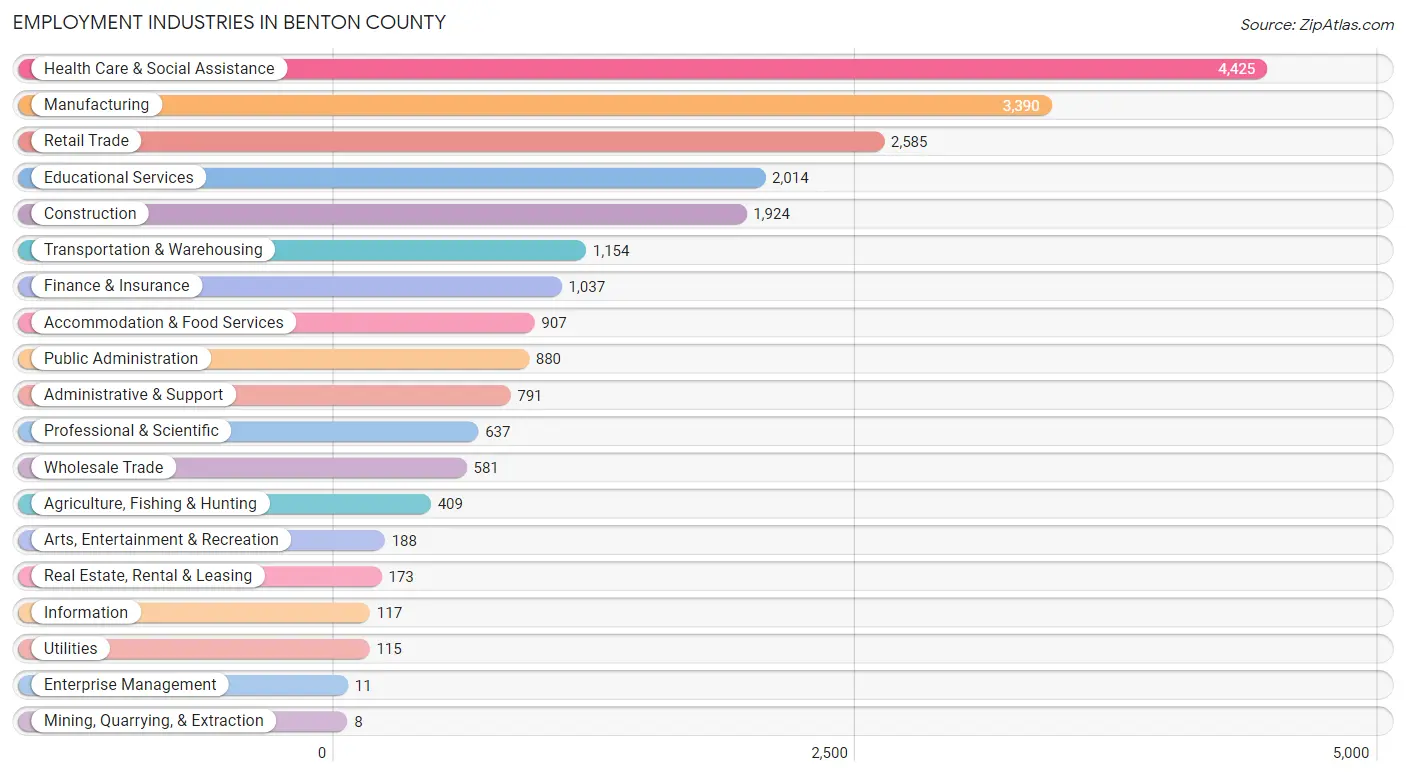
Employment Industries in Benton County
The major employment industries in Benton County include Health Care & Social Assistance (4,425 | 19.8%), Manufacturing (3,390 | 15.1%), Retail Trade (2,585 | 11.5%), Educational Services (2,014 | 9.0%), and Construction (1,924 | 8.6%).
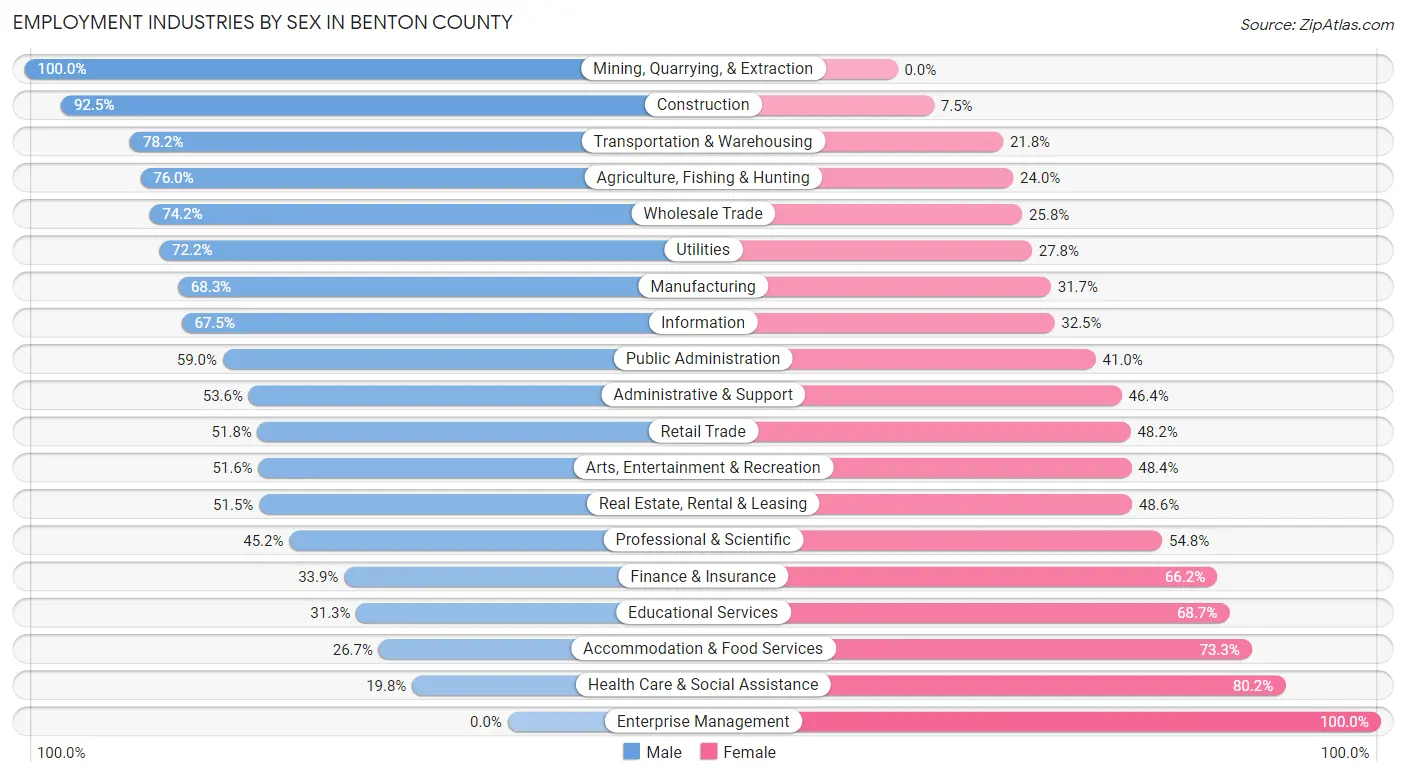
Employment Industries by Sex in Benton County
The Benton County industries that see more men than women are Mining, Quarrying, & Extraction (100.0%), Construction (92.5%), and Transportation & Warehousing (78.2%), whereas the industries that tend to have a higher number of women are Enterprise Management (100.0%), Health Care & Social Assistance (80.2%), and Accommodation & Food Services (73.3%).
| Industry | Male | Female |
| Agriculture, Fishing & Hunting | 311 (76.0%) | 98 (24.0%) |
| Mining, Quarrying, & Extraction | 8 (100.0%) | 0 (0.0%) |
| Construction | 1,779 (92.5%) | 145 (7.5%) |
| Manufacturing | 2,314 (68.3%) | 1,076 (31.7%) |
| Wholesale Trade | 431 (74.2%) | 150 (25.8%) |
| Retail Trade | 1,338 (51.8%) | 1,247 (48.2%) |
| Transportation & Warehousing | 902 (78.2%) | 252 (21.8%) |
| Utilities | 83 (72.2%) | 32 (27.8%) |
| Information | 79 (67.5%) | 38 (32.5%) |
| Finance & Insurance | 351 (33.9%) | 686 (66.1%) |
| Real Estate, Rental & Leasing | 89 (51.4%) | 84 (48.5%) |
| Professional & Scientific | 288 (45.2%) | 349 (54.8%) |
| Enterprise Management | 0 (0.0%) | 11 (100.0%) |
| Administrative & Support | 424 (53.6%) | 367 (46.4%) |
| Educational Services | 631 (31.3%) | 1,383 (68.7%) |
| Health Care & Social Assistance | 875 (19.8%) | 3,550 (80.2%) |
| Arts, Entertainment & Recreation | 97 (51.6%) | 91 (48.4%) |
| Accommodation & Food Services | 242 (26.7%) | 665 (73.3%) |
| Public Administration | 519 (59.0%) | 361 (41.0%) |
| Total | 11,483 (51.2%) | 10,923 (48.7%) |
Education in Benton County
School Enrollment in Benton County
The most common levels of schooling among the 10,592 students in Benton County are middle school (2,650 | 25.0%), elementary school (2,437 | 23.0%), and high school (2,279 | 21.5%).
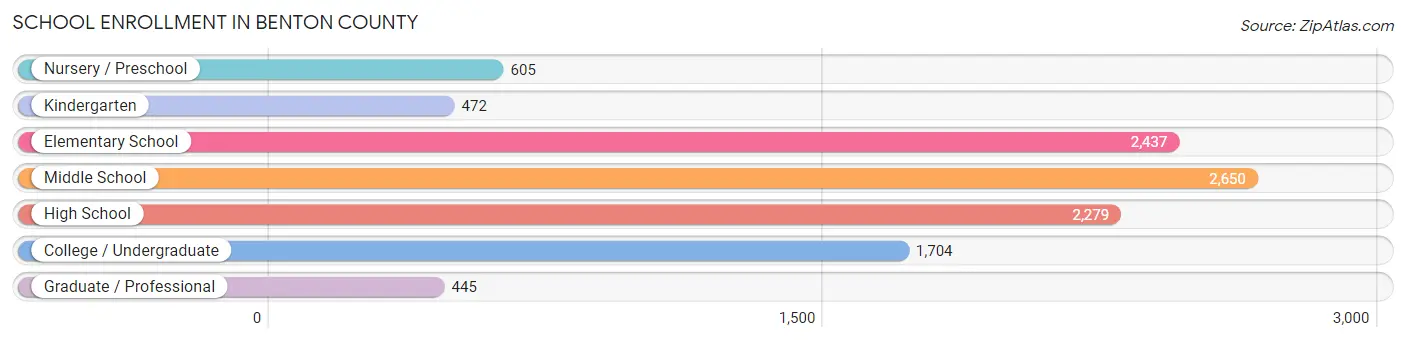
| School Level | # Students | % Students |
| Nursery / Preschool | 605 | 5.7% |
| Kindergarten | 472 | 4.5% |
| Elementary School | 2,437 | 23.0% |
| Middle School | 2,650 | 25.0% |
| High School | 2,279 | 21.5% |
| College / Undergraduate | 1,704 | 16.1% |
| Graduate / Professional | 445 | 4.2% |
| Total | 10,592 | 100.0% |
School Enrollment by Age by Funding Source in Benton County
Out of a total of 10,592 students who are enrolled in schools in Benton County, 1,123 (10.6%) attend a private institution, while the remaining 9,469 (89.4%) are enrolled in public schools. The age group of 3 to 4 year olds has the highest likelihood of being enrolled in private schools, with 104 (24.8% in the age bracket) enrolled. Conversely, the age group of 15 to 17 year olds has the lowest likelihood of being enrolled in a private school, with 1,600 (93.0% in the age bracket) attending a public institution.
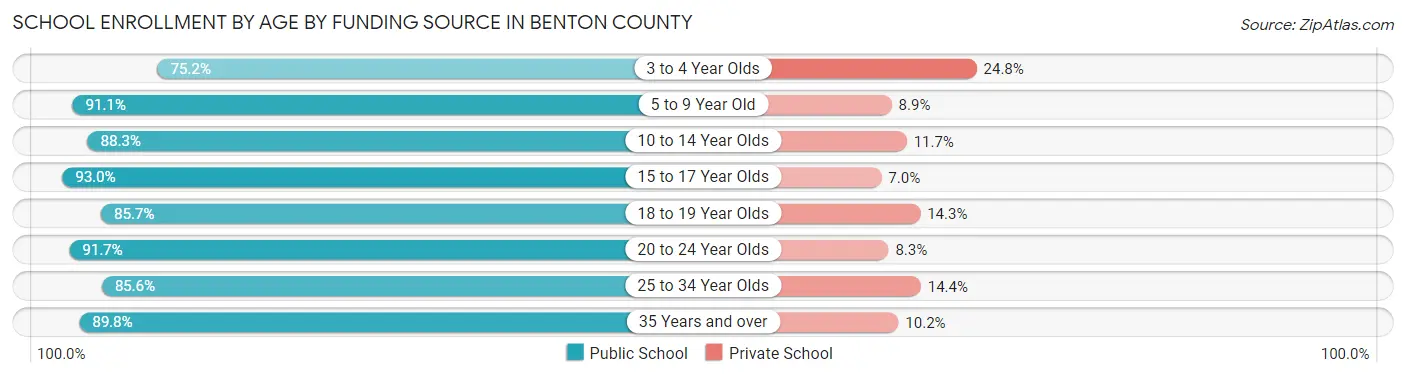
| Age Bracket | Public School | Private School |
| 3 to 4 Year Olds | 316 (75.2%) | 104 (24.8%) |
| 5 to 9 Year Old | 2,606 (91.1%) | 256 (8.9%) |
| 10 to 14 Year Olds | 2,766 (88.3%) | 368 (11.7%) |
| 15 to 17 Year Olds | 1,600 (93.0%) | 121 (7.0%) |
| 18 to 19 Year Olds | 457 (85.7%) | 76 (14.3%) |
| 20 to 24 Year Olds | 879 (91.7%) | 80 (8.3%) |
| 25 to 34 Year Olds | 447 (85.6%) | 75 (14.4%) |
| 35 Years and over | 396 (89.8%) | 45 (10.2%) |
| Total | 9,469 (89.4%) | 1,123 (10.6%) |
Educational Attainment by Field of Study in Benton County
Business (1,404 | 19.8%), education (1,263 | 17.8%), science & technology (931 | 13.1%), arts & humanities (648 | 9.1%), and bio, nature & agricultural (450 | 6.3%) are the most common fields of study among 7,093 individuals in Benton County who have obtained a bachelor's degree or higher.
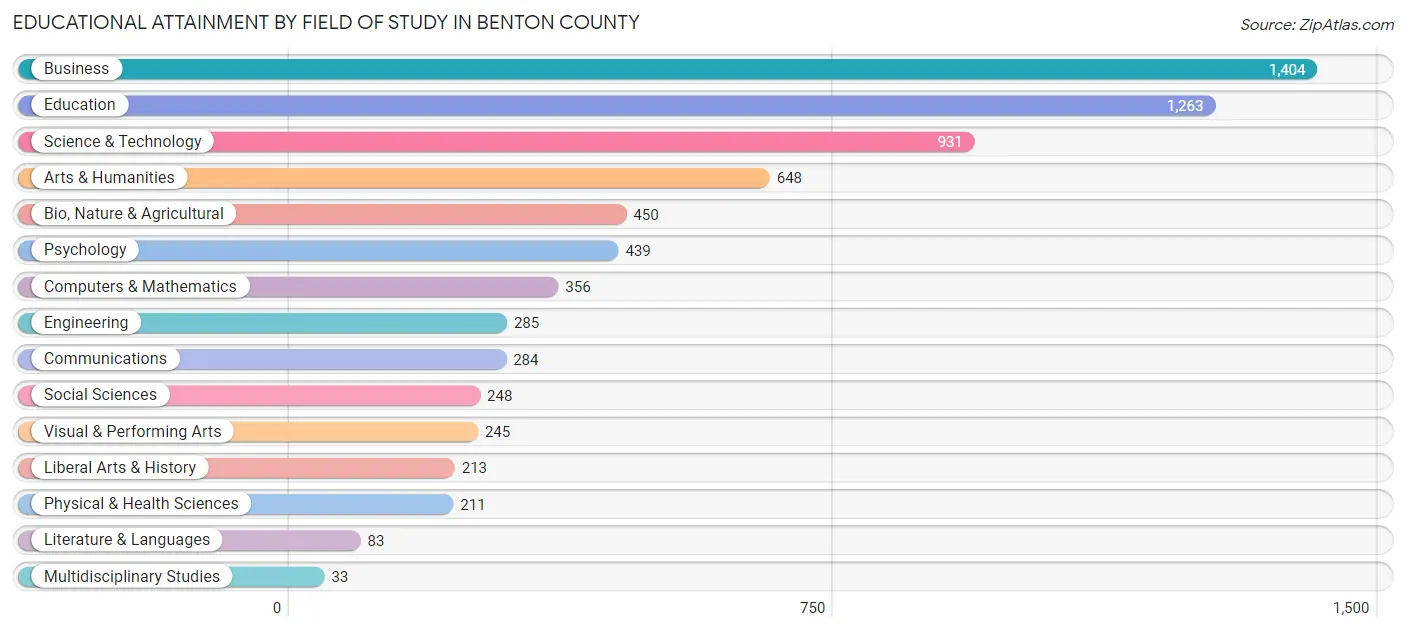
| Field of Study | # Graduates | % Graduates |
| Computers & Mathematics | 356 | 5.0% |
| Bio, Nature & Agricultural | 450 | 6.3% |
| Physical & Health Sciences | 211 | 3.0% |
| Psychology | 439 | 6.2% |
| Social Sciences | 248 | 3.5% |
| Engineering | 285 | 4.0% |
| Multidisciplinary Studies | 33 | 0.5% |
| Science & Technology | 931 | 13.1% |
| Business | 1,404 | 19.8% |
| Education | 1,263 | 17.8% |
| Literature & Languages | 83 | 1.2% |
| Liberal Arts & History | 213 | 3.0% |
| Visual & Performing Arts | 245 | 3.5% |
| Communications | 284 | 4.0% |
| Arts & Humanities | 648 | 9.1% |
| Total | 7,093 | 100.0% |
Transportation & Commute in Benton County
Vehicle Availability by Sex in Benton County
The most prevalent vehicle ownership categories in Benton County are males with 2 vehicles (4,453, accounting for 39.4%) and females with 2 vehicles (4,056, making up 41.9%).
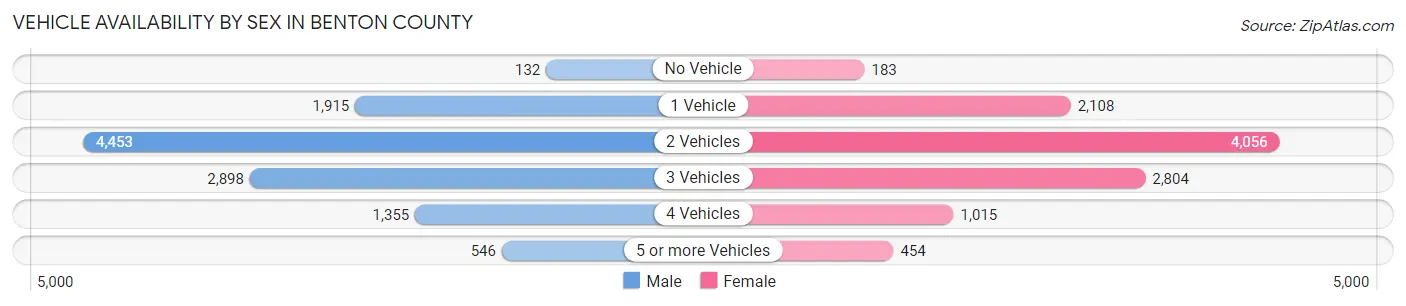
| Vehicles Available | Male | Female |
| No Vehicle | 132 (1.2%) | 183 (1.7%) |
| 1 Vehicle | 1,915 (17.0%) | 2,108 (19.9%) |
| 2 Vehicles | 4,453 (39.4%) | 4,056 (38.2%) |
| 3 Vehicles | 2,898 (25.7%) | 2,804 (26.4%) |
| 4 Vehicles | 1,355 (12.0%) | 1,015 (9.6%) |
| 5 or more Vehicles | 546 (4.8%) | 454 (4.3%) |
| Total | 11,299 (100.0%) | 10,620 (100.0%) |
Commute Time in Benton County
The most frequently occuring commute durations in Benton County are 15 to 19 minutes (3,899 commuters, 18.9%), 10 to 14 minutes (3,786 commuters, 18.4%), and 20 to 24 minutes (3,152 commuters, 15.3%).
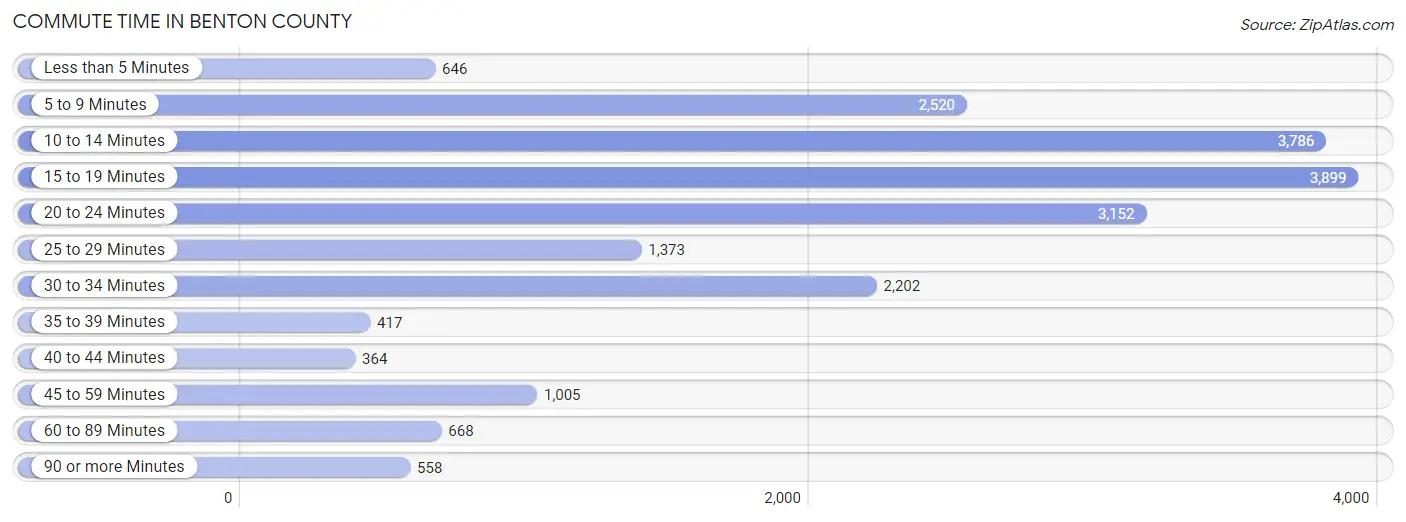
| Commute Time | # Commuters | % Commuters |
| Less than 5 Minutes | 646 | 3.1% |
| 5 to 9 Minutes | 2,520 | 12.2% |
| 10 to 14 Minutes | 3,786 | 18.4% |
| 15 to 19 Minutes | 3,899 | 18.9% |
| 20 to 24 Minutes | 3,152 | 15.3% |
| 25 to 29 Minutes | 1,373 | 6.7% |
| 30 to 34 Minutes | 2,202 | 10.7% |
| 35 to 39 Minutes | 417 | 2.0% |
| 40 to 44 Minutes | 364 | 1.8% |
| 45 to 59 Minutes | 1,005 | 4.9% |
| 60 to 89 Minutes | 668 | 3.2% |
| 90 or more Minutes | 558 | 2.7% |
Commute Time by Sex in Benton County
The most common commute times in Benton County are 15 to 19 minutes (1,754 commuters, 16.3%) for males and 15 to 19 minutes (2,145 commuters, 21.8%) for females.
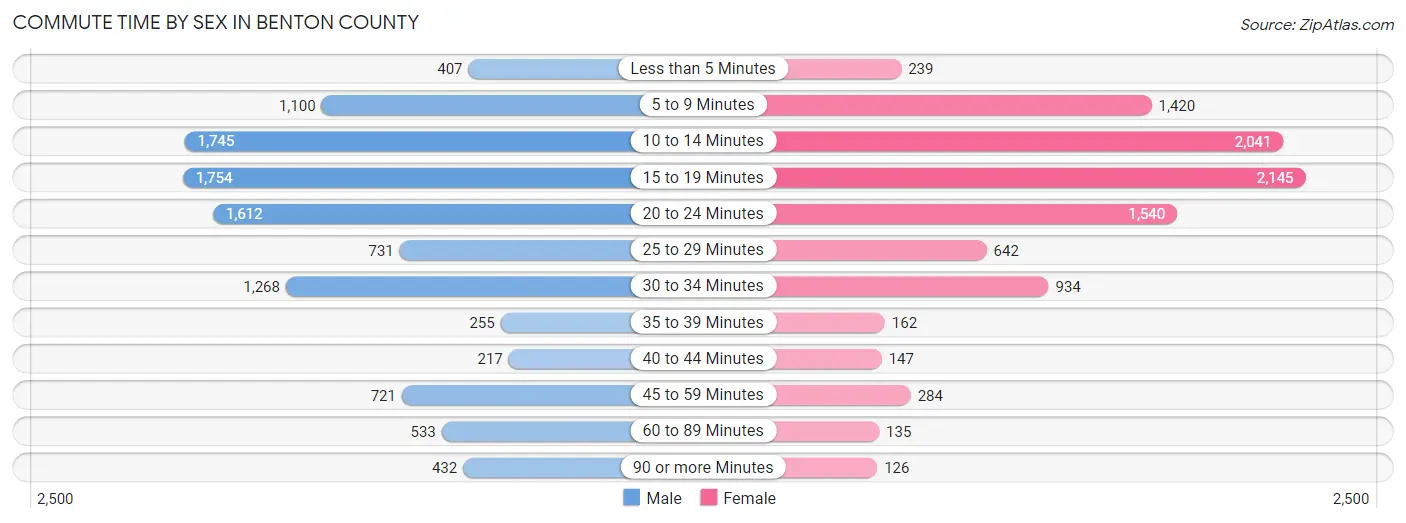
| Commute Time | Male | Female |
| Less than 5 Minutes | 407 (3.8%) | 239 (2.4%) |
| 5 to 9 Minutes | 1,100 (10.2%) | 1,420 (14.5%) |
| 10 to 14 Minutes | 1,745 (16.2%) | 2,041 (20.8%) |
| 15 to 19 Minutes | 1,754 (16.3%) | 2,145 (21.8%) |
| 20 to 24 Minutes | 1,612 (15.0%) | 1,540 (15.7%) |
| 25 to 29 Minutes | 731 (6.8%) | 642 (6.5%) |
| 30 to 34 Minutes | 1,268 (11.8%) | 934 (9.5%) |
| 35 to 39 Minutes | 255 (2.4%) | 162 (1.7%) |
| 40 to 44 Minutes | 217 (2.0%) | 147 (1.5%) |
| 45 to 59 Minutes | 721 (6.7%) | 284 (2.9%) |
| 60 to 89 Minutes | 533 (5.0%) | 135 (1.4%) |
| 90 or more Minutes | 432 (4.0%) | 126 (1.3%) |
Time of Departure to Work by Sex in Benton County
The most frequent times of departure to work in Benton County are 7:00 AM to 7:29 AM (1,598, 14.8%) for males and 7:00 AM to 7:29 AM (1,587, 16.2%) for females.
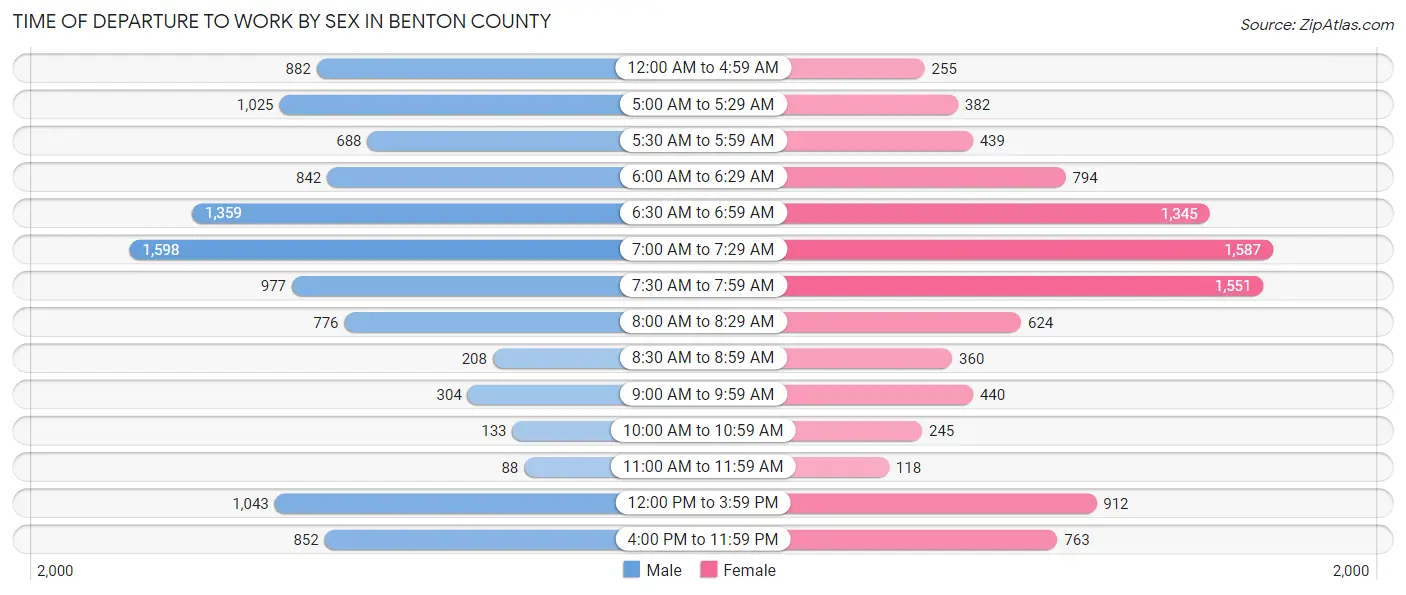
| Time of Departure | Male | Female |
| 12:00 AM to 4:59 AM | 882 (8.2%) | 255 (2.6%) |
| 5:00 AM to 5:29 AM | 1,025 (9.5%) | 382 (3.9%) |
| 5:30 AM to 5:59 AM | 688 (6.4%) | 439 (4.5%) |
| 6:00 AM to 6:29 AM | 842 (7.8%) | 794 (8.1%) |
| 6:30 AM to 6:59 AM | 1,359 (12.6%) | 1,345 (13.7%) |
| 7:00 AM to 7:29 AM | 1,598 (14.8%) | 1,587 (16.2%) |
| 7:30 AM to 7:59 AM | 977 (9.1%) | 1,551 (15.8%) |
| 8:00 AM to 8:29 AM | 776 (7.2%) | 624 (6.4%) |
| 8:30 AM to 8:59 AM | 208 (1.9%) | 360 (3.7%) |
| 9:00 AM to 9:59 AM | 304 (2.8%) | 440 (4.5%) |
| 10:00 AM to 10:59 AM | 133 (1.2%) | 245 (2.5%) |
| 11:00 AM to 11:59 AM | 88 (0.8%) | 118 (1.2%) |
| 12:00 PM to 3:59 PM | 1,043 (9.7%) | 912 (9.3%) |
| 4:00 PM to 11:59 PM | 852 (7.9%) | 763 (7.8%) |
| Total | 10,775 (100.0%) | 9,815 (100.0%) |
Housing Occupancy in Benton County
Occupancy by Ownership in Benton County
Of the total 16,312 dwellings in Benton County, owner-occupied units account for 10,842 (66.5%), while renter-occupied units make up 5,470 (33.5%).
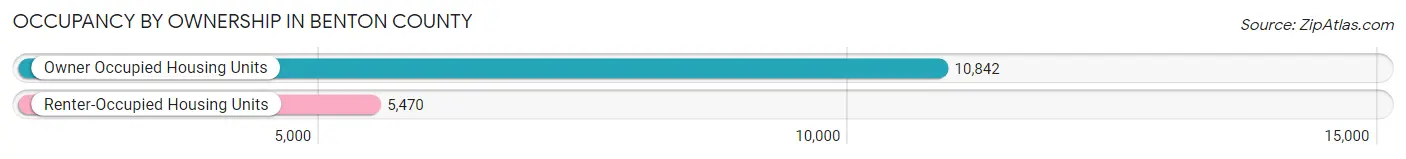
| Occupancy | # Housing Units | % Housing Units |
| Owner Occupied Housing Units | 10,842 | 66.5% |
| Renter-Occupied Housing Units | 5,470 | 33.5% |
| Total Occupied Housing Units | 16,312 | 100.0% |
Occupancy by Household Size in Benton County
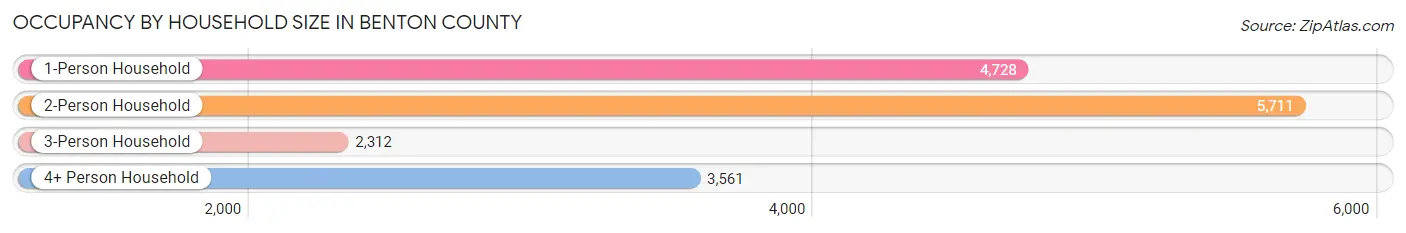
| Household Size | # Housing Units | % Housing Units |
| 1-Person Household | 4,728 | 29.0% |
| 2-Person Household | 5,711 | 35.0% |
| 3-Person Household | 2,312 | 14.2% |
| 4+ Person Household | 3,561 | 21.8% |
| Total Housing Units | 16,312 | 100.0% |
Occupancy by Ownership by Household Size in Benton County
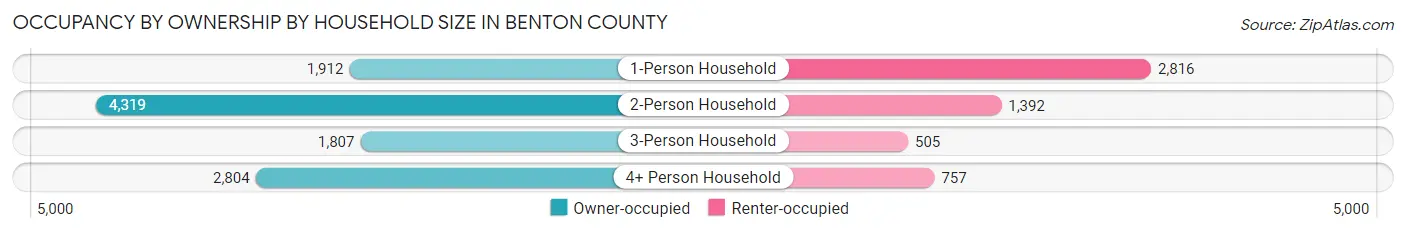
| Household Size | Owner-occupied | Renter-occupied |
| 1-Person Household | 1,912 (40.4%) | 2,816 (59.6%) |
| 2-Person Household | 4,319 (75.6%) | 1,392 (24.4%) |
| 3-Person Household | 1,807 (78.2%) | 505 (21.8%) |
| 4+ Person Household | 2,804 (78.7%) | 757 (21.3%) |
| Total Housing Units | 10,842 (66.5%) | 5,470 (33.5%) |
Occupancy by Educational Attainment in Benton County
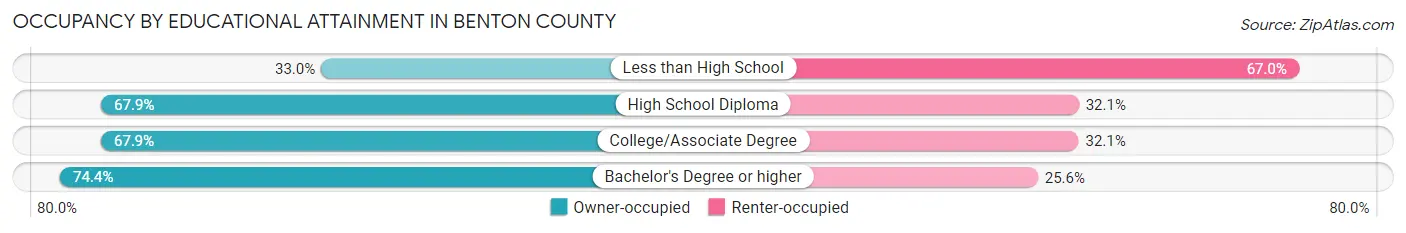
| Household Size | Owner-occupied | Renter-occupied |
| Less than High School | 467 (33.0%) | 949 (67.0%) |
| High School Diploma | 2,670 (67.9%) | 1,264 (32.1%) |
| College/Associate Degree | 4,701 (67.9%) | 2,222 (32.1%) |
| Bachelor's Degree or higher | 3,004 (74.4%) | 1,035 (25.6%) |
Occupancy by Age of Householder in Benton County
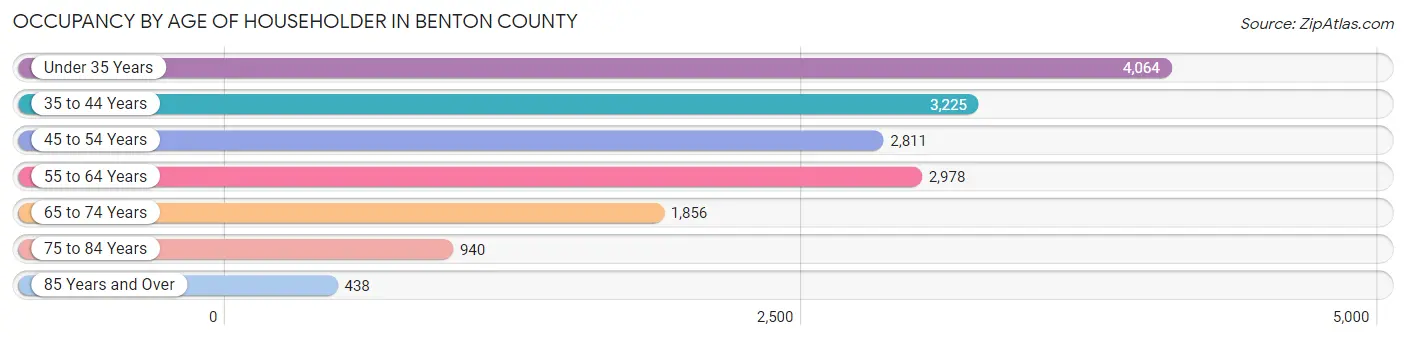
| Age Bracket | # Households | % Households |
| Under 35 Years | 4,064 | 24.9% |
| 35 to 44 Years | 3,225 | 19.8% |
| 45 to 54 Years | 2,811 | 17.2% |
| 55 to 64 Years | 2,978 | 18.3% |
| 65 to 74 Years | 1,856 | 11.4% |
| 75 to 84 Years | 940 | 5.8% |
| 85 Years and Over | 438 | 2.7% |
| Total | 16,312 | 100.0% |
Housing Finances in Benton County
Median Income by Occupancy in Benton County
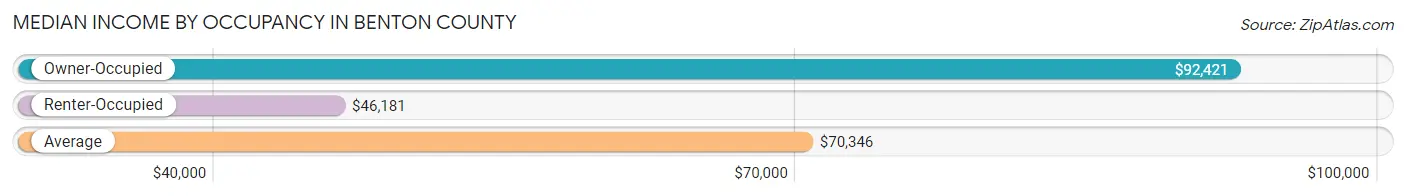
| Occupancy Type | # Households | Median Income |
| Owner-Occupied | 10,842 (66.5%) | $92,421 |
| Renter-Occupied | 5,470 (33.5%) | $46,181 |
| Average | 16,312 (100.0%) | $70,346 |
Occupancy by Householder Income Bracket in Benton County
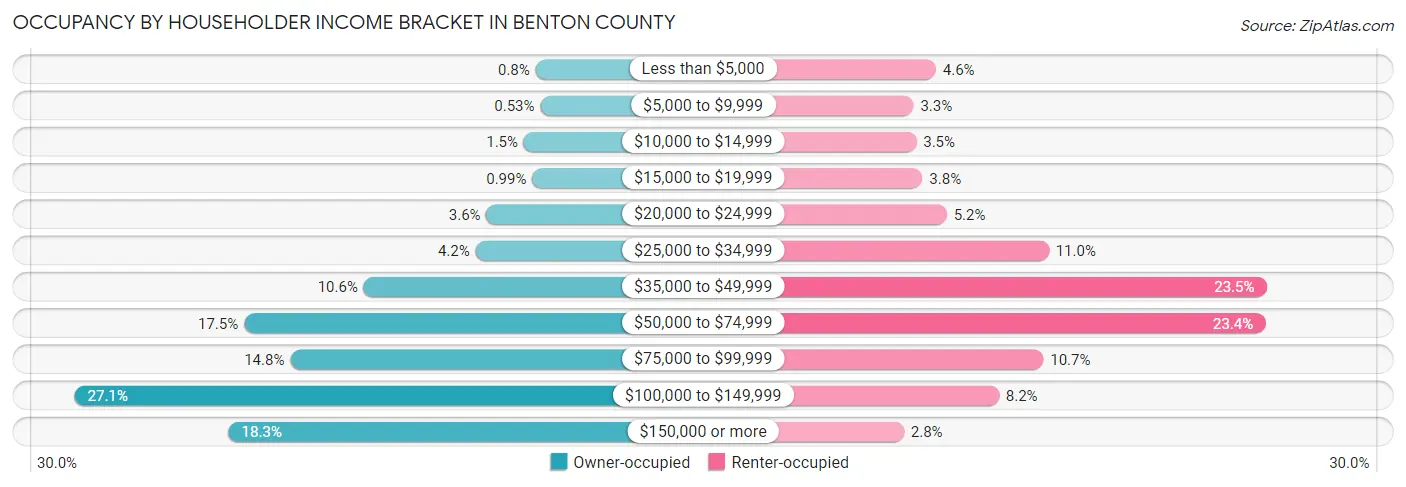
| Income Bracket | Owner-occupied | Renter-occupied |
| Less than $5,000 | 87 (0.8%) | 251 (4.6%) |
| $5,000 to $9,999 | 58 (0.5%) | 181 (3.3%) |
| $10,000 to $14,999 | 159 (1.5%) | 190 (3.5%) |
| $15,000 to $19,999 | 107 (1.0%) | 209 (3.8%) |
| $20,000 to $24,999 | 391 (3.6%) | 285 (5.2%) |
| $25,000 to $34,999 | 459 (4.2%) | 604 (11.0%) |
| $35,000 to $49,999 | 1,151 (10.6%) | 1,284 (23.5%) |
| $50,000 to $74,999 | 1,893 (17.5%) | 1,280 (23.4%) |
| $75,000 to $99,999 | 1,607 (14.8%) | 587 (10.7%) |
| $100,000 to $149,999 | 2,942 (27.1%) | 448 (8.2%) |
| $150,000 or more | 1,988 (18.3%) | 151 (2.8%) |
| Total | 10,842 (100.0%) | 5,470 (100.0%) |
Monthly Housing Cost Tiers in Benton County
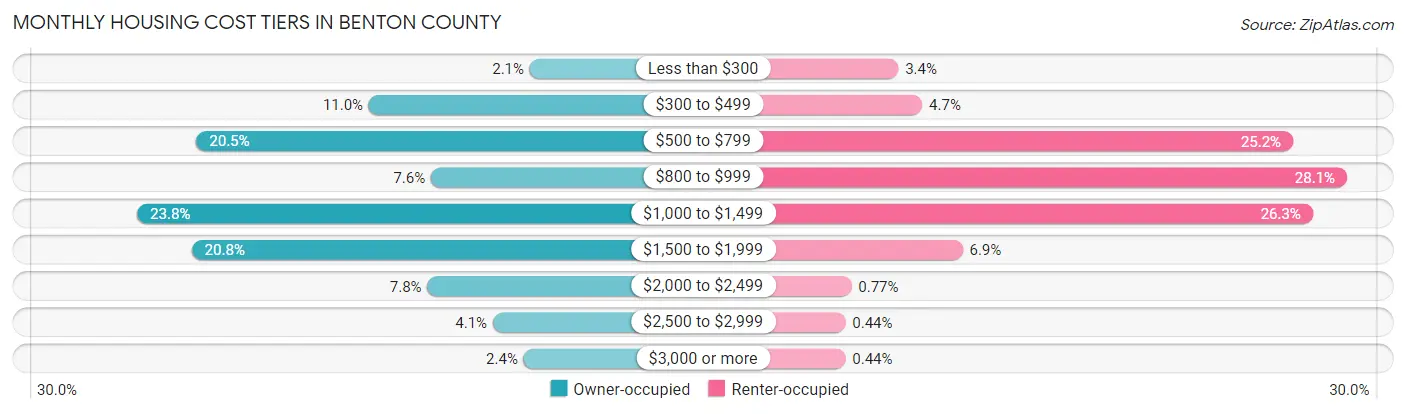
| Monthly Cost | Owner-occupied | Renter-occupied |
| Less than $300 | 227 (2.1%) | 184 (3.4%) |
| $300 to $499 | 1,190 (11.0%) | 256 (4.7%) |
| $500 to $799 | 2,224 (20.5%) | 1,376 (25.2%) |
| $800 to $999 | 819 (7.5%) | 1,539 (28.1%) |
| $1,000 to $1,499 | 2,578 (23.8%) | 1,436 (26.3%) |
| $1,500 to $1,999 | 2,252 (20.8%) | 378 (6.9%) |
| $2,000 to $2,499 | 840 (7.7%) | 42 (0.8%) |
| $2,500 to $2,999 | 448 (4.1%) | 24 (0.4%) |
| $3,000 or more | 264 (2.4%) | 24 (0.4%) |
| Total | 10,842 (100.0%) | 5,470 (100.0%) |
Physical Housing Characteristics in Benton County
Housing Structures in Benton County
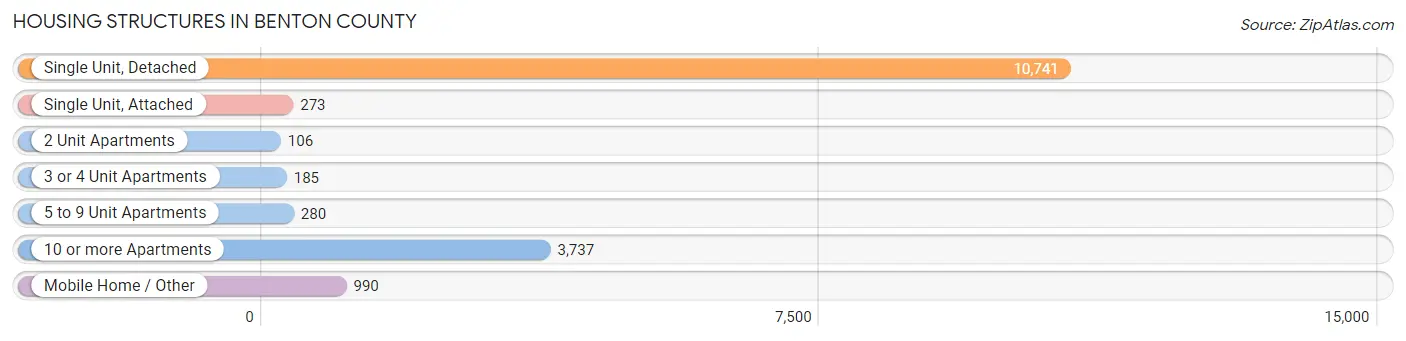
| Structure Type | # Housing Units | % Housing Units |
| Single Unit, Detached | 10,741 | 65.8% |
| Single Unit, Attached | 273 | 1.7% |
| 2 Unit Apartments | 106 | 0.6% |
| 3 or 4 Unit Apartments | 185 | 1.1% |
| 5 to 9 Unit Apartments | 280 | 1.7% |
| 10 or more Apartments | 3,737 | 22.9% |
| Mobile Home / Other | 990 | 6.1% |
| Total | 16,312 | 100.0% |
Housing Structures by Occupancy in Benton County
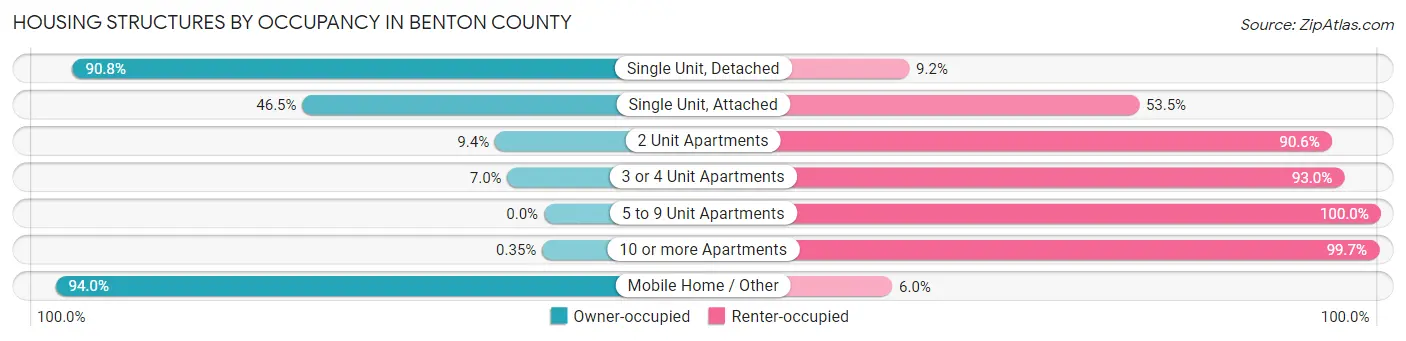
| Structure Type | Owner-occupied | Renter-occupied |
| Single Unit, Detached | 9,748 (90.8%) | 993 (9.2%) |
| Single Unit, Attached | 127 (46.5%) | 146 (53.5%) |
| 2 Unit Apartments | 10 (9.4%) | 96 (90.6%) |
| 3 or 4 Unit Apartments | 13 (7.0%) | 172 (93.0%) |
| 5 to 9 Unit Apartments | 0 (0.0%) | 280 (100.0%) |
| 10 or more Apartments | 13 (0.4%) | 3,724 (99.7%) |
| Mobile Home / Other | 931 (94.0%) | 59 (6.0%) |
| Total | 10,842 (66.5%) | 5,470 (33.5%) |
Housing Structures by Number of Rooms in Benton County
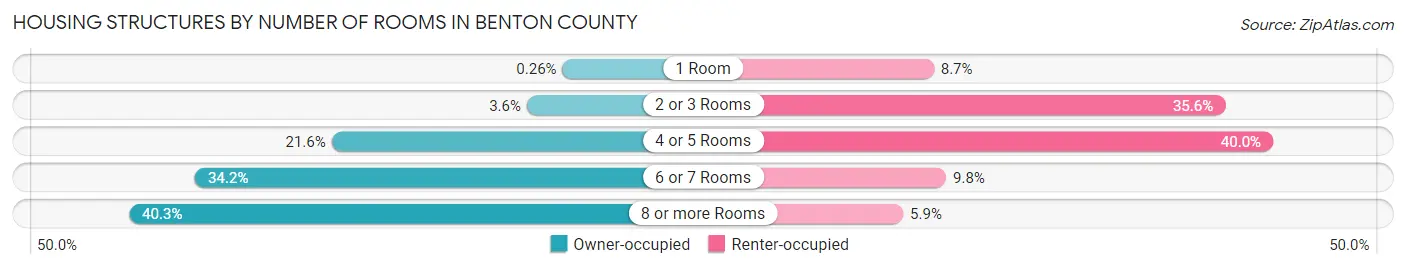
| Number of Rooms | Owner-occupied | Renter-occupied |
| 1 Room | 28 (0.3%) | 475 (8.7%) |
| 2 or 3 Rooms | 385 (3.5%) | 1,948 (35.6%) |
| 4 or 5 Rooms | 2,343 (21.6%) | 2,190 (40.0%) |
| 6 or 7 Rooms | 3,712 (34.2%) | 537 (9.8%) |
| 8 or more Rooms | 4,374 (40.3%) | 320 (5.9%) |
| Total | 10,842 (100.0%) | 5,470 (100.0%) |
Housing Structure by Heating Type in Benton County
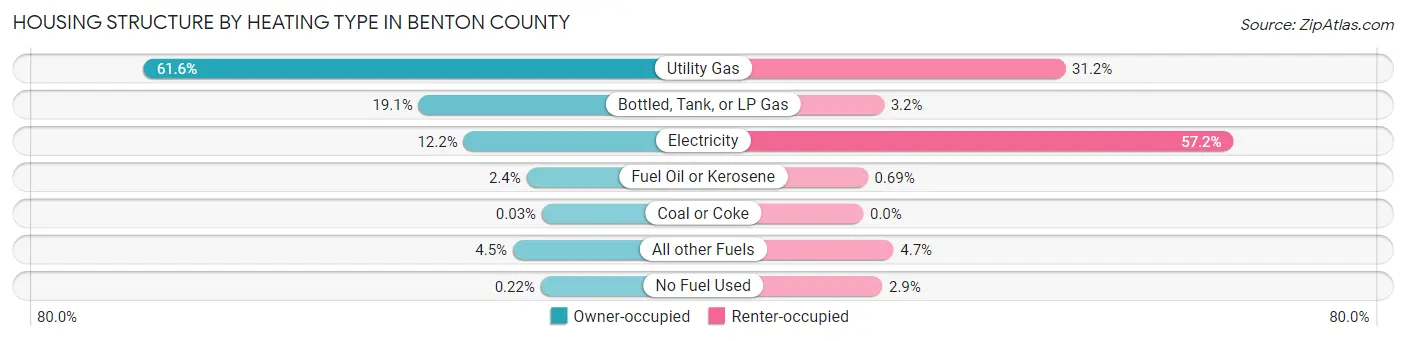
| Heating Type | Owner-occupied | Renter-occupied |
| Utility Gas | 6,677 (61.6%) | 1,709 (31.2%) |
| Bottled, Tank, or LP Gas | 2,072 (19.1%) | 175 (3.2%) |
| Electricity | 1,317 (12.1%) | 3,131 (57.2%) |
| Fuel Oil or Kerosene | 260 (2.4%) | 38 (0.7%) |
| Coal or Coke | 3 (0.0%) | 0 (0.0%) |
| All other Fuels | 489 (4.5%) | 256 (4.7%) |
| No Fuel Used | 24 (0.2%) | 161 (2.9%) |
| Total | 10,842 (100.0%) | 5,470 (100.0%) |
Household Vehicle Usage in Benton County
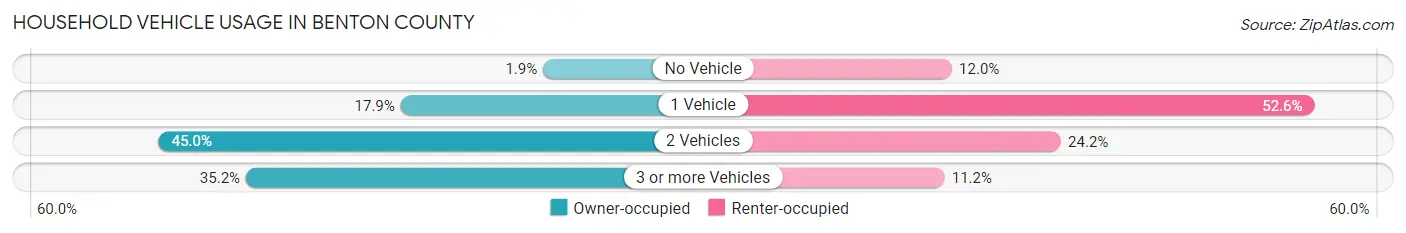
| Vehicles per Household | Owner-occupied | Renter-occupied |
| No Vehicle | 208 (1.9%) | 657 (12.0%) |
| 1 Vehicle | 1,939 (17.9%) | 2,876 (52.6%) |
| 2 Vehicles | 4,878 (45.0%) | 1,325 (24.2%) |
| 3 or more Vehicles | 3,817 (35.2%) | 612 (11.2%) |
| Total | 10,842 (100.0%) | 5,470 (100.0%) |
Real Estate & Mortgages in Benton County
Real Estate and Mortgage Overview in Benton County
| Characteristic | Without Mortgage | With Mortgage |
| Housing Units | 4,146 | 6,696 |
| Median Property Value | $216,100 | $235,800 |
| Median Household Income | $66,923 | $1,395 |
| Monthly Housing Costs | $577 | $255 |
| Real Estate Taxes | $2,389 | $155 |
Property Value by Mortgage Status in Benton County
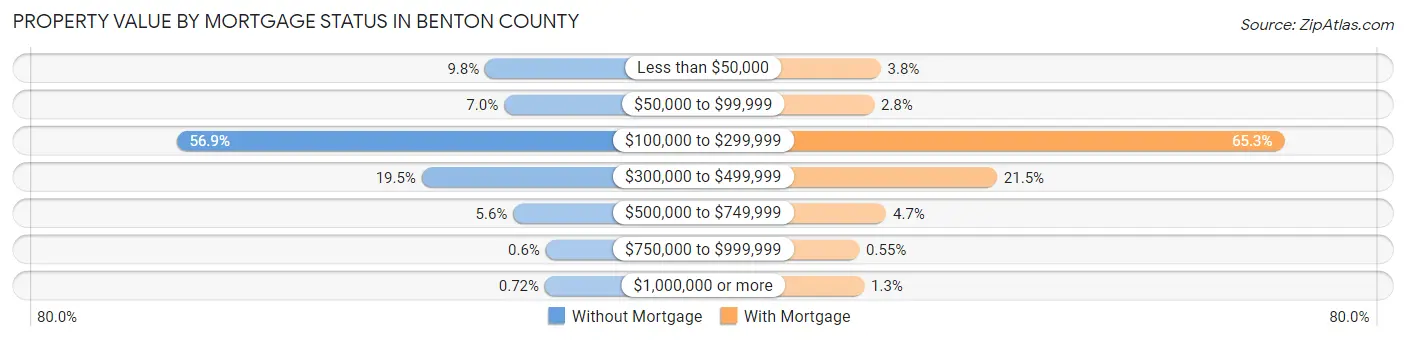
| Property Value | Without Mortgage | With Mortgage |
| Less than $50,000 | 408 (9.8%) | 256 (3.8%) |
| $50,000 to $99,999 | 288 (7.0%) | 188 (2.8%) |
| $100,000 to $299,999 | 2,357 (56.9%) | 4,374 (65.3%) |
| $300,000 to $499,999 | 808 (19.5%) | 1,442 (21.5%) |
| $500,000 to $749,999 | 230 (5.6%) | 312 (4.7%) |
| $750,000 to $999,999 | 25 (0.6%) | 37 (0.5%) |
| $1,000,000 or more | 30 (0.7%) | 87 (1.3%) |
| Total | 4,146 (100.0%) | 6,696 (100.0%) |
Household Income by Mortgage Status in Benton County
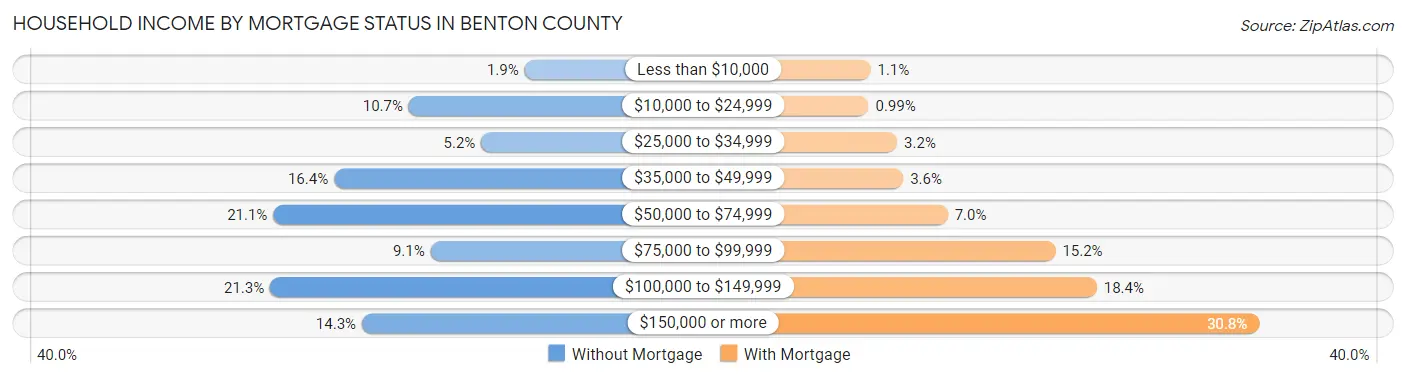
| Household Income | Without Mortgage | With Mortgage |
| Less than $10,000 | 79 (1.9%) | 76 (1.1%) |
| $10,000 to $24,999 | 445 (10.7%) | 66 (1.0%) |
| $25,000 to $34,999 | 216 (5.2%) | 212 (3.2%) |
| $35,000 to $49,999 | 681 (16.4%) | 243 (3.6%) |
| $50,000 to $74,999 | 873 (21.1%) | 470 (7.0%) |
| $75,000 to $99,999 | 376 (9.1%) | 1,020 (15.2%) |
| $100,000 to $149,999 | 883 (21.3%) | 1,231 (18.4%) |
| $150,000 or more | 593 (14.3%) | 2,059 (30.7%) |
| Total | 4,146 (100.0%) | 6,696 (100.0%) |
Property Value to Household Income Ratio in Benton County
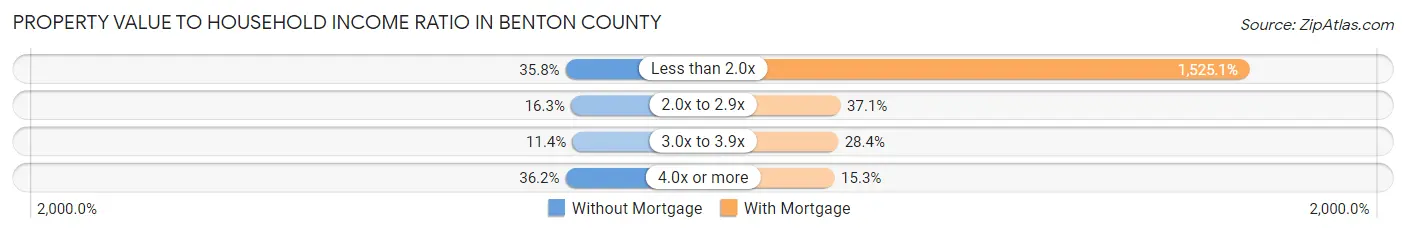
| Value-to-Income Ratio | Without Mortgage | With Mortgage |
| Less than 2.0x | 1,482 (35.7%) | 102,120 (1,525.1%) |
| 2.0x to 2.9x | 674 (16.3%) | 2,487 (37.1%) |
| 3.0x to 3.9x | 472 (11.4%) | 1,903 (28.4%) |
| 4.0x or more | 1,499 (36.2%) | 1,027 (15.3%) |
| Total | 4,146 (100.0%) | 6,696 (100.0%) |
Real Estate Taxes by Mortgage Status in Benton County
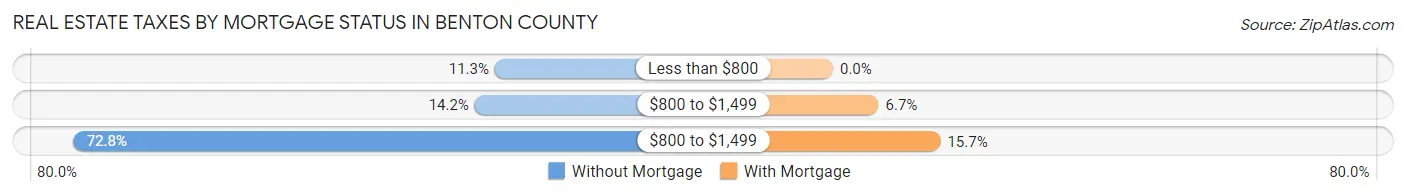
| Property Taxes | Without Mortgage | With Mortgage |
| Less than $800 | 468 (11.3%) | 0 (0.0%) |
| $800 to $1,499 | 590 (14.2%) | 445 (6.7%) |
| $800 to $1,499 | 3,019 (72.8%) | 1,051 (15.7%) |
| Total | 4,146 (100.0%) | 6,696 (100.0%) |
Health & Disability in Benton County
Health Insurance Coverage by Age in Benton County
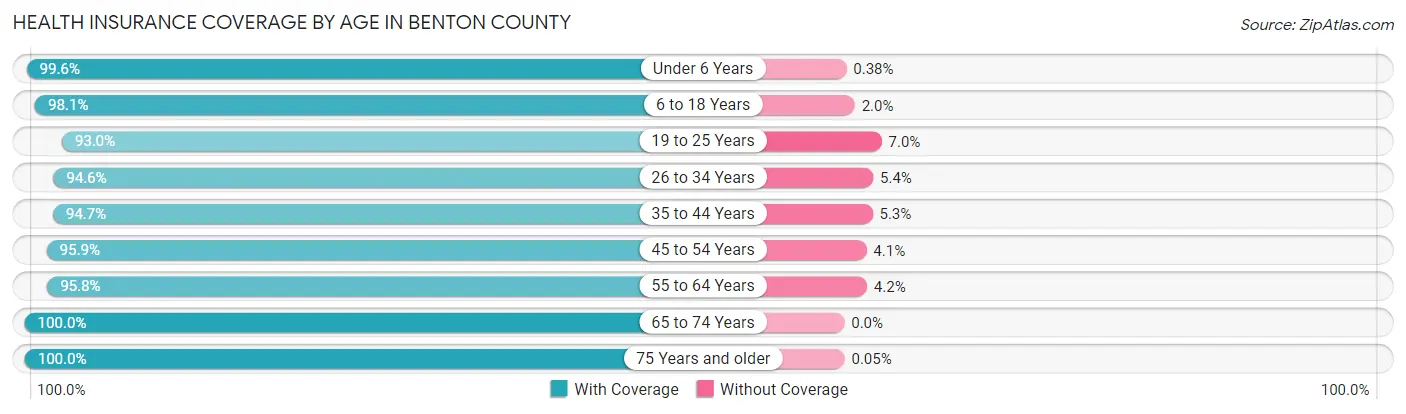
| Age Bracket | With Coverage | Without Coverage |
| Under 6 Years | 3,116 (99.6%) | 12 (0.4%) |
| 6 to 18 Years | 7,748 (98.1%) | 154 (1.9%) |
| 19 to 25 Years | 3,274 (93.0%) | 245 (7.0%) |
| 26 to 34 Years | 5,109 (94.6%) | 290 (5.4%) |
| 35 to 44 Years | 5,527 (94.7%) | 307 (5.3%) |
| 45 to 54 Years | 4,559 (95.9%) | 196 (4.1%) |
| 55 to 64 Years | 4,771 (95.8%) | 210 (4.2%) |
| 65 to 74 Years | 3,150 (100.0%) | 0 (0.0%) |
| 75 Years and older | 2,011 (100.0%) | 1 (0.1%) |
| Total | 39,265 (96.5%) | 1,415 (3.5%) |
Health Insurance Coverage by Citizenship Status in Benton County
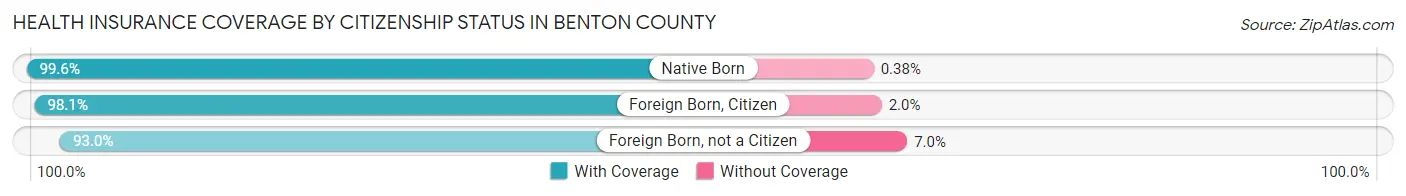
| Citizenship Status | With Coverage | Without Coverage |
| Native Born | 3,116 (99.6%) | 12 (0.4%) |
| Foreign Born, Citizen | 7,748 (98.1%) | 154 (1.9%) |
| Foreign Born, not a Citizen | 3,274 (93.0%) | 245 (7.0%) |
Health Insurance Coverage by Household Income in Benton County
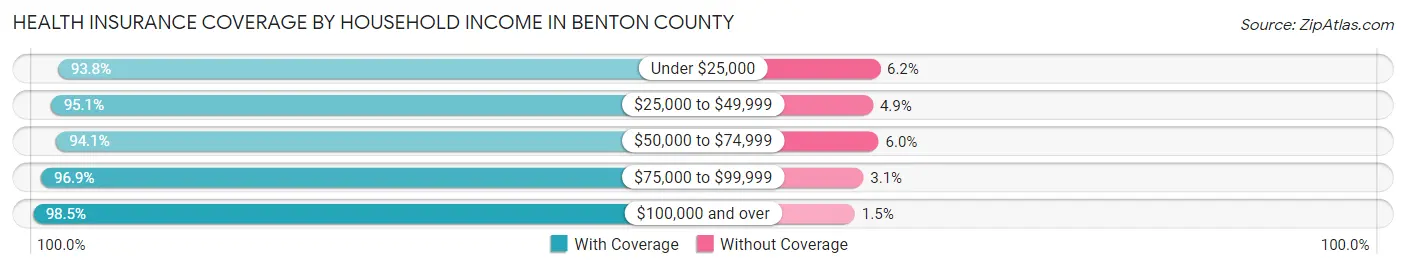
| Household Income | With Coverage | Without Coverage |
| Under $25,000 | 2,408 (93.8%) | 160 (6.2%) |
| $25,000 to $49,999 | 6,210 (95.1%) | 320 (4.9%) |
| $50,000 to $74,999 | 6,990 (94.1%) | 442 (5.9%) |
| $75,000 to $99,999 | 5,752 (96.9%) | 184 (3.1%) |
| $100,000 and over | 17,483 (98.5%) | 269 (1.5%) |
Public vs Private Health Insurance Coverage by Age in Benton County
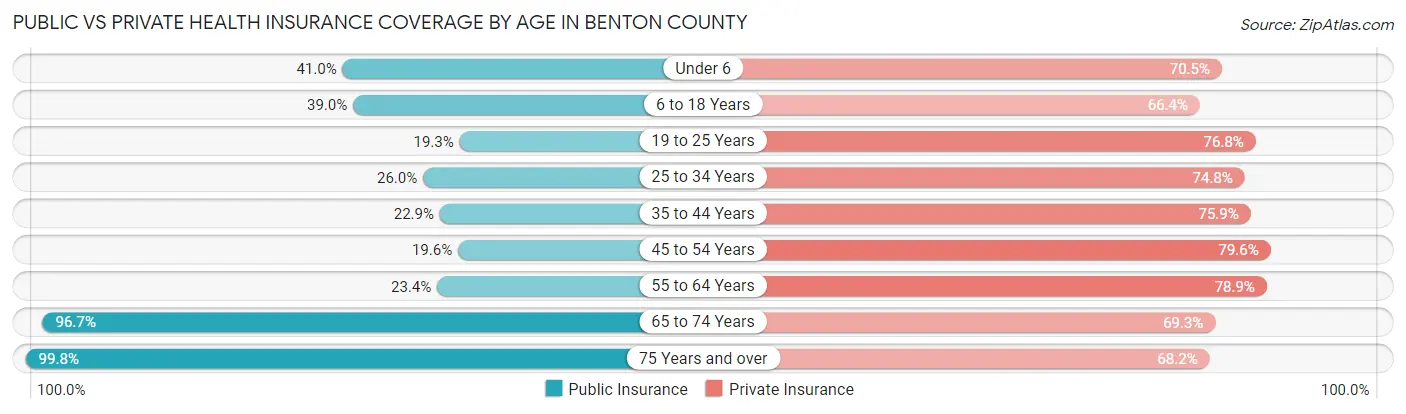
| Age Bracket | Public Insurance | Private Insurance |
| Under 6 | 1,282 (41.0%) | 2,206 (70.5%) |
| 6 to 18 Years | 3,084 (39.0%) | 5,250 (66.4%) |
| 19 to 25 Years | 678 (19.3%) | 2,703 (76.8%) |
| 25 to 34 Years | 1,406 (26.0%) | 4,037 (74.8%) |
| 35 to 44 Years | 1,338 (22.9%) | 4,426 (75.9%) |
| 45 to 54 Years | 930 (19.6%) | 3,784 (79.6%) |
| 55 to 64 Years | 1,167 (23.4%) | 3,928 (78.9%) |
| 65 to 74 Years | 3,045 (96.7%) | 2,183 (69.3%) |
| 75 Years and over | 2,008 (99.8%) | 1,373 (68.2%) |
| Total | 14,938 (36.7%) | 29,890 (73.5%) |
Disability Status by Sex by Age in Benton County
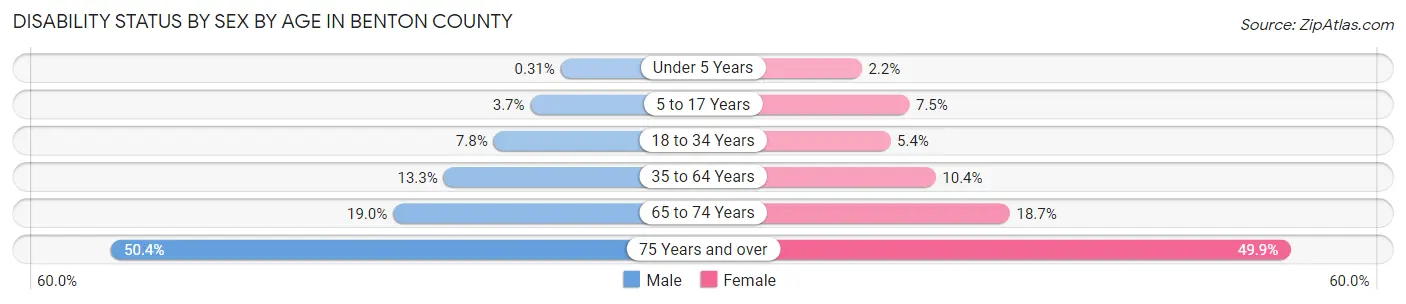
| Age Bracket | Male | Female |
| Under 5 Years | 4 (0.3%) | 28 (2.2%) |
| 5 to 17 Years | 150 (3.7%) | 291 (7.5%) |
| 18 to 34 Years | 369 (7.8%) | 250 (5.4%) |
| 35 to 64 Years | 1,071 (13.3%) | 786 (10.4%) |
| 65 to 74 Years | 296 (19.0%) | 297 (18.7%) |
| 75 Years and over | 419 (50.4%) | 589 (49.9%) |
Disability Class by Sex by Age in Benton County
Disability Class: Hearing Difficulty
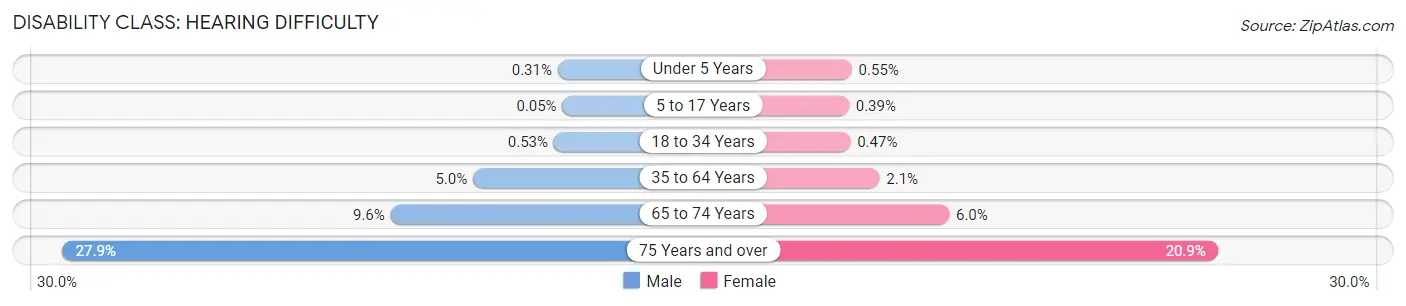
| Age Bracket | Male | Female |
| Under 5 Years | 4 (0.3%) | 7 (0.5%) |
| 5 to 17 Years | 2 (0.1%) | 15 (0.4%) |
| 18 to 34 Years | 25 (0.5%) | 22 (0.5%) |
| 35 to 64 Years | 404 (5.0%) | 158 (2.1%) |
| 65 to 74 Years | 150 (9.6%) | 95 (6.0%) |
| 75 Years and over | 232 (27.9%) | 247 (20.9%) |
Disability Class: Vision Difficulty
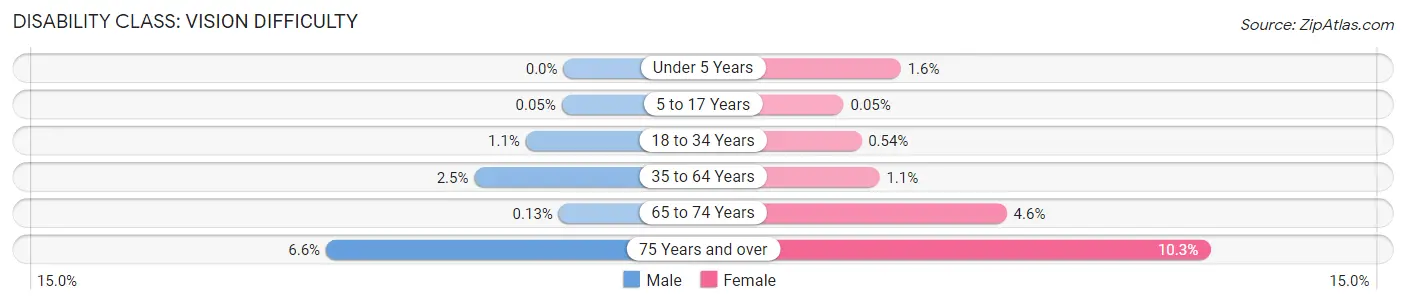
| Age Bracket | Male | Female |
| Under 5 Years | 0 (0.0%) | 21 (1.6%) |
| 5 to 17 Years | 2 (0.1%) | 2 (0.1%) |
| 18 to 34 Years | 50 (1.1%) | 25 (0.5%) |
| 35 to 64 Years | 199 (2.5%) | 79 (1.1%) |
| 65 to 74 Years | 2 (0.1%) | 73 (4.6%) |
| 75 Years and over | 55 (6.6%) | 121 (10.2%) |
Disability Class: Cognitive Difficulty
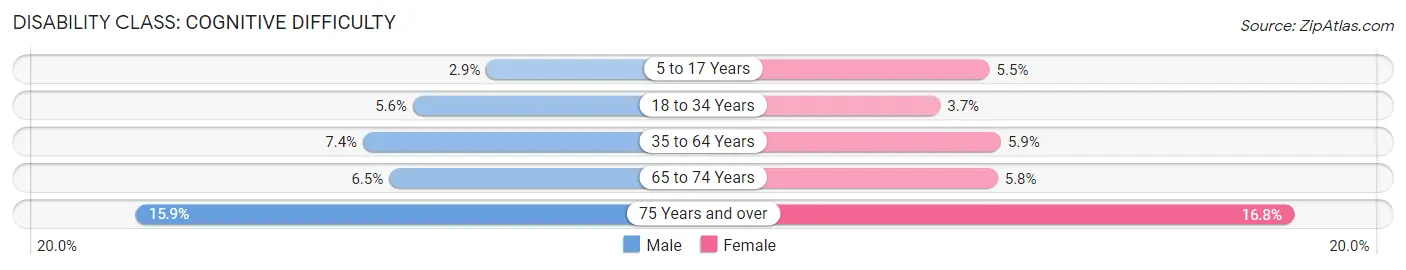
| Age Bracket | Male | Female |
| 5 to 17 Years | 117 (2.9%) | 213 (5.5%) |
| 18 to 34 Years | 265 (5.6%) | 170 (3.7%) |
| 35 to 64 Years | 597 (7.4%) | 446 (5.9%) |
| 65 to 74 Years | 101 (6.5%) | 92 (5.8%) |
| 75 Years and over | 132 (15.9%) | 198 (16.8%) |
Disability Class: Ambulatory Difficulty
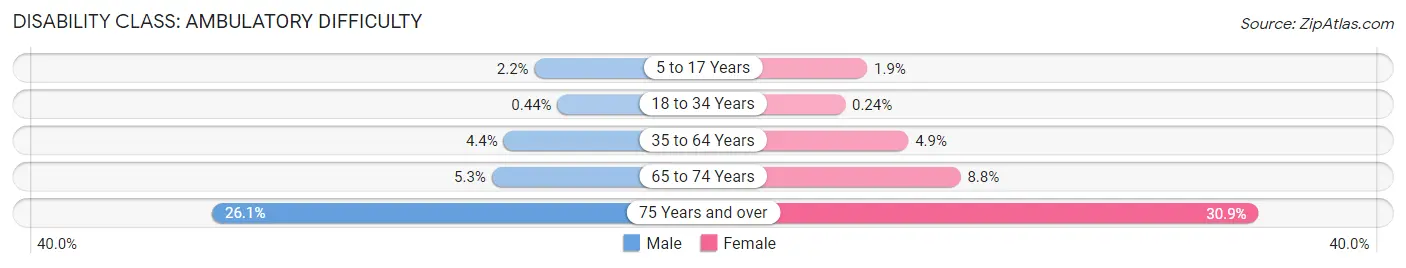
| Age Bracket | Male | Female |
| 5 to 17 Years | 88 (2.1%) | 73 (1.9%) |
| 18 to 34 Years | 21 (0.4%) | 11 (0.2%) |
| 35 to 64 Years | 356 (4.4%) | 372 (4.9%) |
| 65 to 74 Years | 83 (5.3%) | 140 (8.8%) |
| 75 Years and over | 217 (26.1%) | 365 (30.9%) |
Disability Class: Self-Care Difficulty
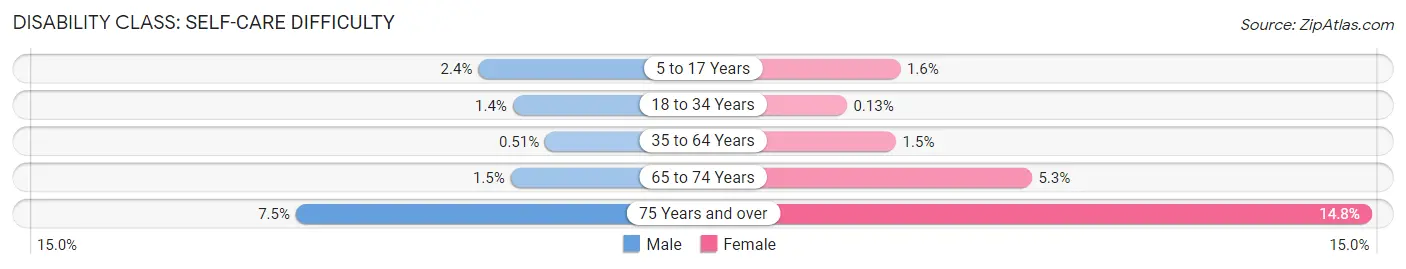
| Age Bracket | Male | Female |
| 5 to 17 Years | 97 (2.4%) | 63 (1.6%) |
| 18 to 34 Years | 67 (1.4%) | 6 (0.1%) |
| 35 to 64 Years | 41 (0.5%) | 113 (1.5%) |
| 65 to 74 Years | 23 (1.5%) | 84 (5.3%) |
| 75 Years and over | 62 (7.4%) | 174 (14.7%) |
Technology Access in Benton County
Computing Device Access in Benton County
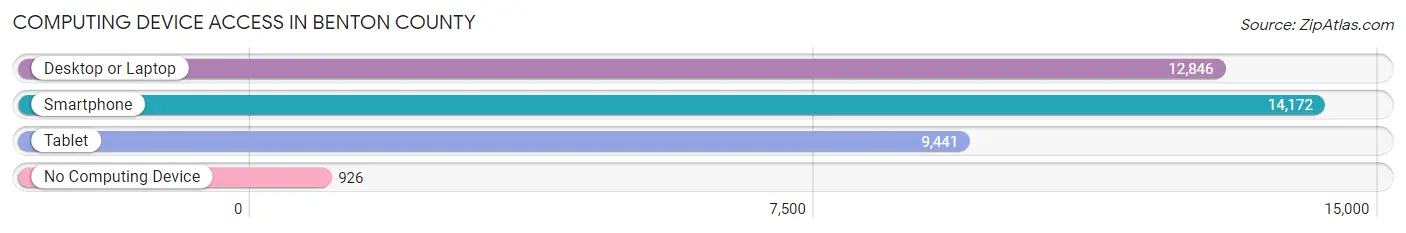
| Device Type | # Households | % Households |
| Desktop or Laptop | 12,846 | 78.7% |
| Smartphone | 14,172 | 86.9% |
| Tablet | 9,441 | 57.9% |
| No Computing Device | 926 | 5.7% |
| Total | 16,312 | 100.0% |
Internet Access in Benton County
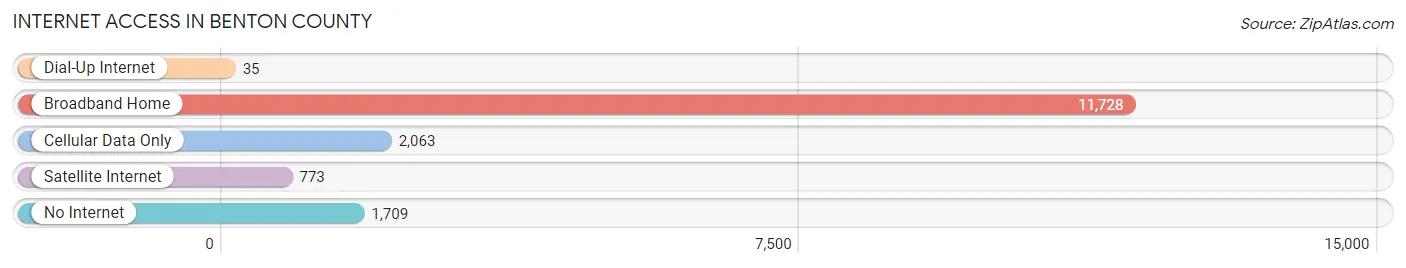
| Internet Type | # Households | % Households |
| Dial-Up Internet | 35 | 0.2% |
| Broadband Home | 11,728 | 71.9% |
| Cellular Data Only | 2,063 | 12.7% |
| Satellite Internet | 773 | 4.7% |
| No Internet | 1,709 | 10.5% |
| Total | 16,312 | 100.0% |
Benton County Summary
Benton County is located in the central part of Minnesota, and is part of the St. Cloud Metropolitan Statistical Area. The county was established in 1849 and named after Thomas Hart Benton, a U.S. Senator from Missouri. As of the 2010 census, the population was 38,451. The county seat is Foley.
Geography
Benton County is located in the central part of Minnesota, and is part of the St. Cloud Metropolitan Statistical Area. The county has a total area of 576 square miles, of which 573 square miles is land and 3.2 square miles (0.6%) is water. The terrain is mostly rolling hills and plains, with some areas of marshland. The highest point in the county is located in the northwest corner, at an elevation of 1,092 feet.
The county is bordered by Stearns County to the north, Sherburne County to the east, Mille Lacs County to the south, and Morrison County to the west. The county is also bordered by the Mississippi River to the west.
Demographics
As of the 2010 census, there were 38,451 people, 14,845 households, and 10,541 families residing in the county. The population density was 67 people per square mile. There were 15,845 housing units at an average density of 27 per square mile. The racial makeup of the county was 97.2% White, 0.5% Black or African American, 0.4% Native American, 0.6% Asian, 0.2% Pacific Islander, 0.4% from other races, and 0.7% from two or more races. 1.3% of the population were Hispanic or Latino of any race.
There were 14,845 households, out of which 33.2% had children under the age of 18 living with them, 57.2% were married couples living together, 8.7% had a female householder with no husband present, and 29.7% were non-families. 24.3% of all households were made up of individuals, and 10.2% had someone living alone who was 65 years of age or older. The average household size was 2.56 and the average family size was 3.05.
The median age in the county was 38.3 years. 25.7% of residents were under the age of 18; 7.2% were between the ages of 18 and 24; 25.2% were from 25 to 44; 27.2% were from 45 to 64; and 14.7% were 65 years of age or older. The gender makeup of the county was 49.7% male and 50.3% female.
Economy
Benton County's economy is largely based on agriculture, with corn, soybeans, and hay being the main crops. The county also has a strong manufacturing sector, with companies such as 3M, Andersen Windows, and Polaris Industries having a presence in the area.
The county also has a strong tourism industry, with many visitors coming to the area to enjoy the natural beauty of the area. The county is home to several state parks, including Sibley State Park, which is located on the banks of the Mississippi River.
The county also has a strong retail sector, with several large shopping centers located in the county. The largest of these is the Crossroads Center, which is located in the city of St. Cloud.
Conclusion
Benton County is a rural county located in the central part of Minnesota. The county has a strong agricultural and manufacturing base, as well as a strong tourism industry. The county is home to several state parks, and has a strong retail sector. The population of the county is 38,451, and the median age is 38.3 years.
Common Questions
What is the Total Population of Benton County?
Total Population of Benton County is 41,300.
What is the Total Male Population of Benton County?
Total Male Population of Benton County is 20,822.
What is the Total Female Population of Benton County?
Total Female Population of Benton County is 20,478.
What is the Ratio of Males per 100 Females in Benton County?
There are 101.68 Males per 100 Females in Benton County.
What is the Ratio of Females per 100 Males in Benton County?
There are 98.35 Females per 100 Males in Benton County.
What is the Median Population Age in Benton County?
Median Population Age in Benton County is 36.2 Years.
What is the Average Family Size in Benton County
Average Family Size in Benton County is 3.1 People.
What is the Average Household Size in Benton County
Average Household Size in Benton County is 2.5 People.
What is Per Capita Income in Benton County?
Per Capita income in Benton County is $35,885.
What is the Median Family Income in Benton County?
Median Family Income in Benton County is $90,316.
What is the Median Household income in Benton County?
Median Household Income in Benton County is $70,346.
What is Income or Wage Gap in Benton County?
Income or Wage Gap in Benton County is 29.2%.
Women in Benton County earn 70.8 cents for every dollar earned by a man.
What is Family Income Deficit in Benton County?
Family Income Deficit in Benton County is $11,364.
Families that are below poverty line in Benton County earn $11,364 less on average than the poverty threshold level.
What is Inequality or Gini Index in Benton County?
Inequality or Gini Index in Benton County is 0.39.
How Large is the Labor Force in Benton County?
There are 23,334 People in the Labor Forcein in Benton County.
What is the Percentage of People in the Labor Force in Benton County?
73.3% of People are in the Labor Force in Benton County.
What is the Unemployment Rate in Benton County?
Unemployment Rate in Benton County is 3.7%.