Beltrami County, MN
Beltrami County Map
Beltrami County Overview
46,274
TOTAL POPULATION
23,299
MALE POPULATION
22,975
FEMALE POPULATION
101.41
MALES / 100 FEMALES
98.61
FEMALES / 100 MALES
35.0
MEDIAN AGE
3.0
AVG FAMILY SIZE
2.5
AVG HOUSEHOLD SIZE
$32,055
PER CAPITA INCOME
$80,795
AVG FAMILY INCOME
$62,173
AVG HOUSEHOLD INCOME
22.6%
WAGE / INCOME GAP [ % ]
77.4¢/ $1
WAGE / INCOME GAP [ $ ]
$11,291
FAMILY INCOME DEFICIT
0.44
INEQUALITY / GINI INDEX
22,682
LABOR FORCE [ PEOPLE ]
63.0%
PERCENT IN LABOR FORCE
5.4%
UNEMPLOYMENT RATE
Beltrami County Area Codes
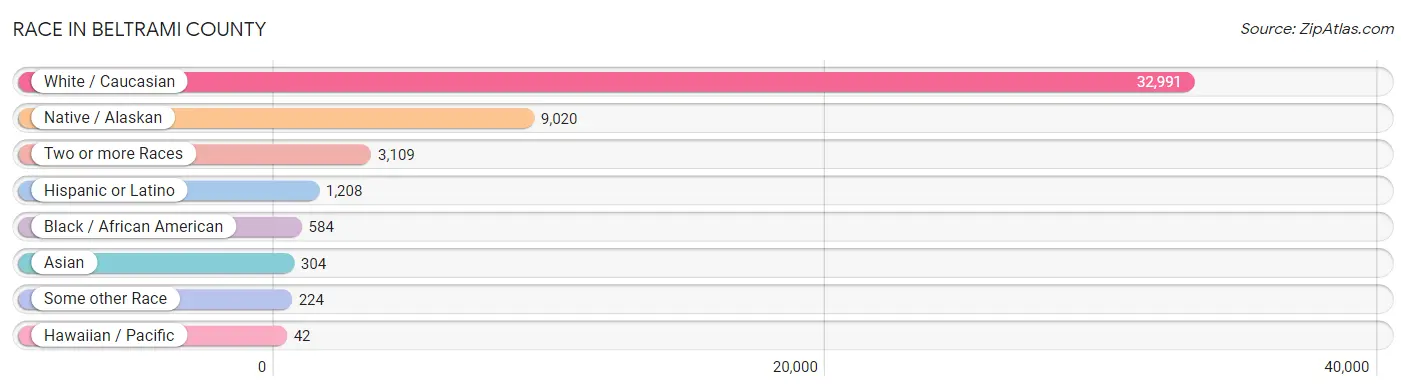
Race in Beltrami County
The most populous races in Beltrami County are White / Caucasian (32,991 | 71.3%), Native / Alaskan (9,020 | 19.5%), and Two or more Races (3,109 | 6.7%).
| Race | # Population | % Population |
| Asian | 304 | 0.7% |
| Black / African American | 584 | 1.3% |
| Hawaiian / Pacific | 42 | 0.1% |
| Hispanic or Latino | 1,208 | 2.6% |
| Native / Alaskan | 9,020 | 19.5% |
| White / Caucasian | 32,991 | 71.3% |
| Two or more Races | 3,109 | 6.7% |
| Some other Race | 224 | 0.5% |
| Total | 46,274 | 100.0% |
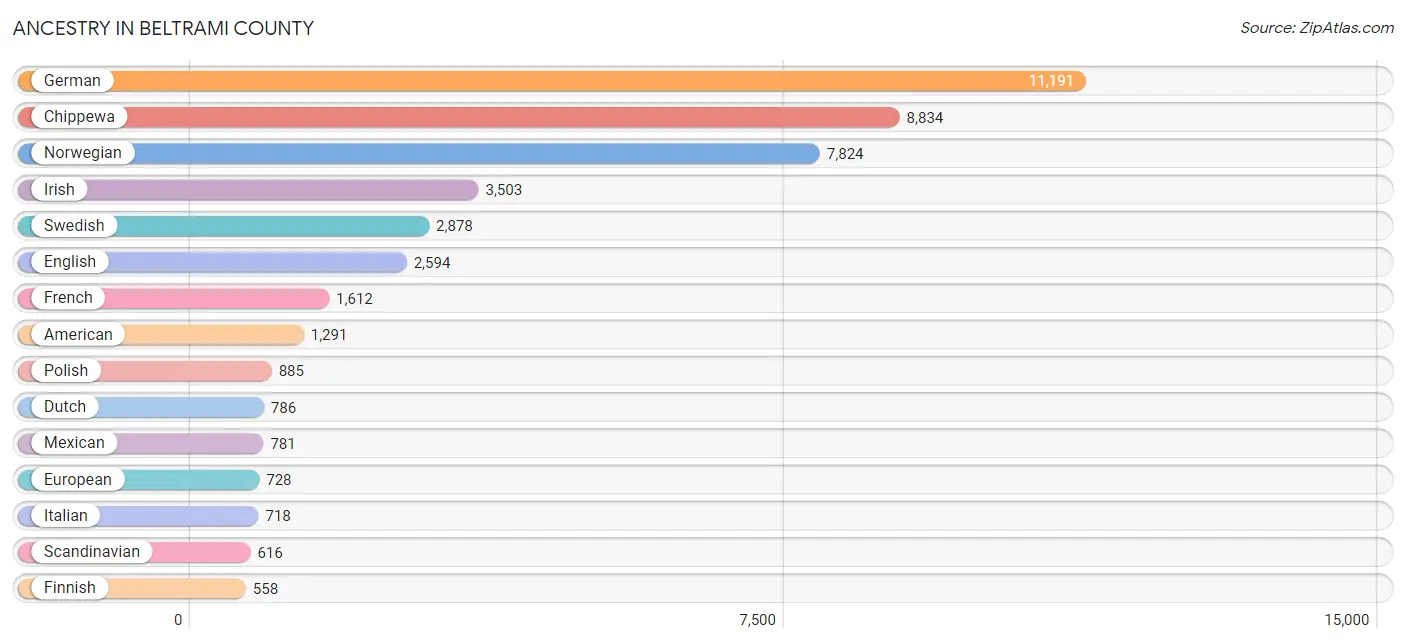
Ancestry in Beltrami County
The most populous ancestries reported in Beltrami County are German (11,191 | 24.2%), Chippewa (8,834 | 19.1%), Norwegian (7,824 | 16.9%), Irish (3,503 | 7.6%), and Swedish (2,878 | 6.2%), together accounting for 74.0% of all Beltrami County residents.
| Ancestry | # Population | % Population |
| African | 12 | 0.0% |
| Alaska Native | 13 | 0.0% |
| Albanian | 13 | 0.0% |
| American | 1,291 | 2.8% |
| Apache | 39 | 0.1% |
| Arab | 116 | 0.3% |
| Armenian | 3 | 0.0% |
| Australian | 6 | 0.0% |
| Austrian | 52 | 0.1% |
| Bahamian | 22 | 0.1% |
| Bangladeshi | 52 | 0.1% |
| Belgian | 21 | 0.1% |
| Bhutanese | 52 | 0.1% |
| Blackfeet | 46 | 0.1% |
| British | 140 | 0.3% |
| Bulgarian | 6 | 0.0% |
| Burmese | 49 | 0.1% |
| Cajun | 5 | 0.0% |
| Canadian | 223 | 0.5% |
| Celtic | 2 | 0.0% |
| Central American | 94 | 0.2% |
| Cherokee | 37 | 0.1% |
| Chilean | 23 | 0.1% |
| Chippewa | 8,834 | 19.1% |
| Choctaw | 165 | 0.4% |
| Colombian | 6 | 0.0% |
| Comanche | 22 | 0.1% |
| Costa Rican | 38 | 0.1% |
| Cree | 159 | 0.3% |
| Creek | 5 | 0.0% |
| Croatian | 68 | 0.2% |
| Crow | 9 | 0.0% |
| Cuban | 34 | 0.1% |
| Czech | 382 | 0.8% |
| Czechoslovakian | 43 | 0.1% |
| Danish | 445 | 1.0% |
| Dominican | 50 | 0.1% |
| Dutch | 786 | 1.7% |
| Eastern European | 95 | 0.2% |
| English | 2,594 | 5.6% |
| Estonian | 9 | 0.0% |
| Ethiopian | 4 | 0.0% |
| European | 728 | 1.6% |
| Finnish | 558 | 1.2% |
| French | 1,612 | 3.5% |
| French American Indian | 20 | 0.0% |
| French Canadian | 484 | 1.1% |
| German | 11,191 | 24.2% |
| German Russian | 6 | 0.0% |
| Greek | 106 | 0.2% |
| Guamanian / Chamorro | 23 | 0.1% |
| Haitian | 15 | 0.0% |
| Hungarian | 40 | 0.1% |
| Icelander | 198 | 0.4% |
| Indian (Asian) | 167 | 0.4% |
| Irish | 3,503 | 7.6% |
| Iroquois | 5 | 0.0% |
| Italian | 718 | 1.5% |
| Kenyan | 2 | 0.0% |
| Korean | 124 | 0.3% |
| Lebanese | 39 | 0.1% |
| Liberian | 42 | 0.1% |
| Lithuanian | 36 | 0.1% |
| Luxembourger | 22 | 0.1% |
| Malaysian | 21 | 0.1% |
| Mexican | 781 | 1.7% |
| Native Hawaiian | 7 | 0.0% |
| Navajo | 212 | 0.5% |
| Northern European | 171 | 0.4% |
| Norwegian | 7,824 | 16.9% |
| Ottawa | 11 | 0.0% |
| Pakistani | 42 | 0.1% |
| Panamanian | 56 | 0.1% |
| Pennsylvania German | 5 | 0.0% |
| Polish | 885 | 1.9% |
| Portuguese | 8 | 0.0% |
| Puerto Rican | 111 | 0.2% |
| Romanian | 3 | 0.0% |
| Russian | 220 | 0.5% |
| Scandinavian | 616 | 1.3% |
| Scotch-Irish | 163 | 0.4% |
| Scottish | 439 | 0.9% |
| Serbian | 7 | 0.0% |
| Sioux | 157 | 0.3% |
| Slavic | 4 | 0.0% |
| Slovak | 30 | 0.1% |
| Slovene | 21 | 0.1% |
| South American | 37 | 0.1% |
| Spanish | 9 | 0.0% |
| Sri Lankan | 37 | 0.1% |
| Subsaharan African | 70 | 0.2% |
| Swedish | 2,878 | 6.2% |
| Swiss | 73 | 0.2% |
| Syrian | 11 | 0.0% |
| Thai | 9 | 0.0% |
| Tohono O'Odham | 14 | 0.0% |
| Ukrainian | 73 | 0.2% |
| Welsh | 104 | 0.2% |
| Yugoslavian | 24 | 0.1% |
| Yuman | 13 | 0.0% |
| Yup'ik | 8 | 0.0% |
| Zimbabwean | 8 | 0.0% | View All 102 Rows |
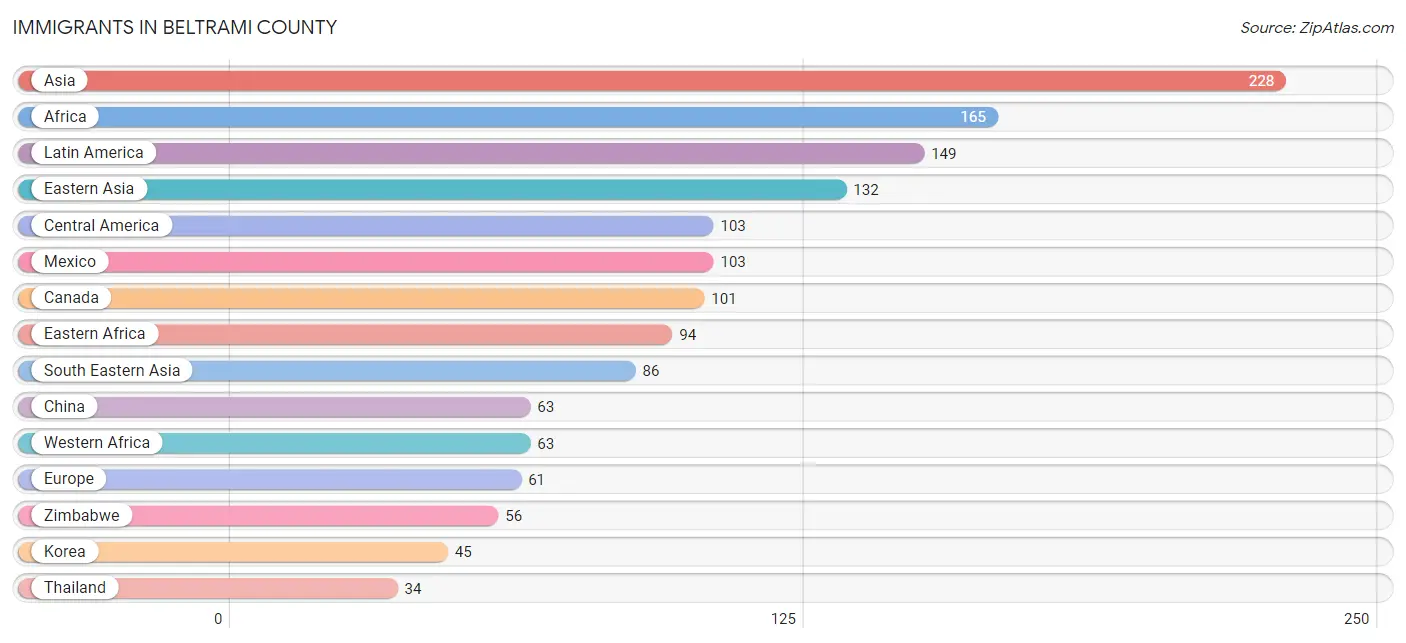
Immigrants in Beltrami County
The most numerous immigrant groups reported in Beltrami County came from Asia (228 | 0.5%), Africa (165 | 0.4%), Latin America (149 | 0.3%), Eastern Asia (132 | 0.3%), and Central America (103 | 0.2%), together accounting for 1.7% of all Beltrami County residents.
| Immigration Origin | # Population | % Population |
| Africa | 165 | 0.4% |
| Asia | 228 | 0.5% |
| Austria | 3 | 0.0% |
| Cameroon | 2 | 0.0% |
| Canada | 101 | 0.2% |
| Caribbean | 21 | 0.1% |
| Central America | 103 | 0.2% |
| Chile | 23 | 0.1% |
| China | 63 | 0.1% |
| Colombia | 2 | 0.0% |
| Dominican Republic | 21 | 0.1% |
| Eastern Africa | 94 | 0.2% |
| Eastern Asia | 132 | 0.3% |
| Eastern Europe | 25 | 0.1% |
| England | 2 | 0.0% |
| Ethiopia | 22 | 0.1% |
| Europe | 61 | 0.1% |
| Germany | 24 | 0.1% |
| Ghana | 21 | 0.1% |
| Hong Kong | 1 | 0.0% |
| India | 10 | 0.0% |
| Japan | 24 | 0.1% |
| Korea | 45 | 0.1% |
| Laos | 4 | 0.0% |
| Latin America | 149 | 0.3% |
| Malaysia | 1 | 0.0% |
| Mexico | 103 | 0.2% |
| Middle Africa | 2 | 0.0% |
| Northern Africa | 6 | 0.0% |
| Northern Europe | 9 | 0.0% |
| Philippines | 31 | 0.1% |
| Romania | 2 | 0.0% |
| Russia | 6 | 0.0% |
| Somalia | 16 | 0.0% |
| South America | 25 | 0.1% |
| South Central Asia | 10 | 0.0% |
| South Eastern Asia | 86 | 0.2% |
| Sweden | 7 | 0.0% |
| Thailand | 34 | 0.1% |
| Ukraine | 17 | 0.0% |
| Vietnam | 16 | 0.0% |
| Western Africa | 63 | 0.1% |
| Western Europe | 27 | 0.1% |
| Zimbabwe | 56 | 0.1% | View All 44 Rows |
Sex and Age in Beltrami County
Sex and Age in Beltrami County
The most populous age groups in Beltrami County are 20 to 24 Years (2,274 | 9.8%) for men and 20 to 24 Years (2,063 | 9.0%) for women.
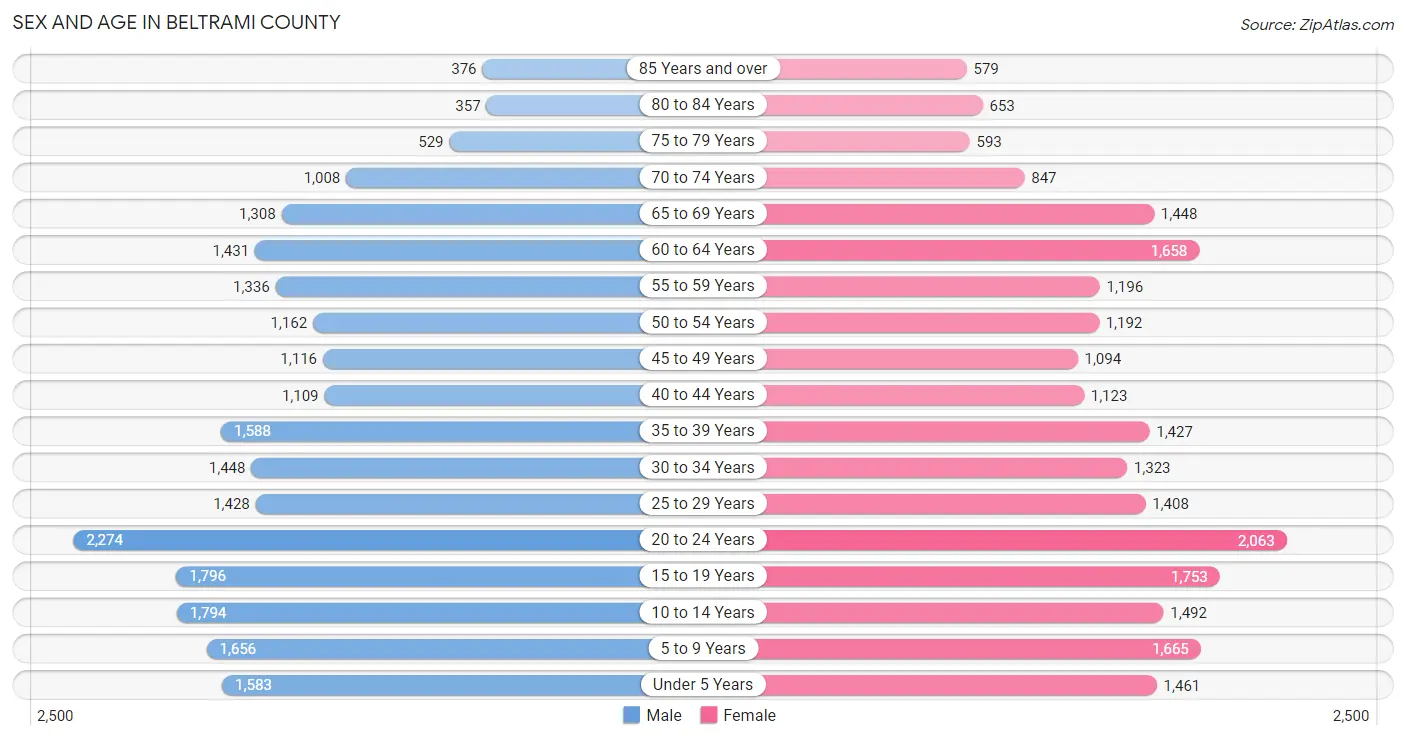
| Age Bracket | Male | Female |
| Under 5 Years | 1,583 (6.8%) | 1,461 (6.4%) |
| 5 to 9 Years | 1,656 (7.1%) | 1,665 (7.2%) |
| 10 to 14 Years | 1,794 (7.7%) | 1,492 (6.5%) |
| 15 to 19 Years | 1,796 (7.7%) | 1,753 (7.6%) |
| 20 to 24 Years | 2,274 (9.8%) | 2,063 (9.0%) |
| 25 to 29 Years | 1,428 (6.1%) | 1,408 (6.1%) |
| 30 to 34 Years | 1,448 (6.2%) | 1,323 (5.8%) |
| 35 to 39 Years | 1,588 (6.8%) | 1,427 (6.2%) |
| 40 to 44 Years | 1,109 (4.8%) | 1,123 (4.9%) |
| 45 to 49 Years | 1,116 (4.8%) | 1,094 (4.8%) |
| 50 to 54 Years | 1,162 (5.0%) | 1,192 (5.2%) |
| 55 to 59 Years | 1,336 (5.7%) | 1,196 (5.2%) |
| 60 to 64 Years | 1,431 (6.1%) | 1,658 (7.2%) |
| 65 to 69 Years | 1,308 (5.6%) | 1,448 (6.3%) |
| 70 to 74 Years | 1,008 (4.3%) | 847 (3.7%) |
| 75 to 79 Years | 529 (2.3%) | 593 (2.6%) |
| 80 to 84 Years | 357 (1.5%) | 653 (2.8%) |
| 85 Years and over | 376 (1.6%) | 579 (2.5%) |
| Total | 23,299 (100.0%) | 22,975 (100.0%) |
Families and Households in Beltrami County
Median Family Size in Beltrami County
The median family size in Beltrami County is 3.05 persons per family, with single female/mother families (2,328 | 20.9%) accounting for the largest median family size of 3.3 persons per family. On the other hand, married-couple families (7,904 | 71.0%) represent the smallest median family size with 2.96 persons per family.
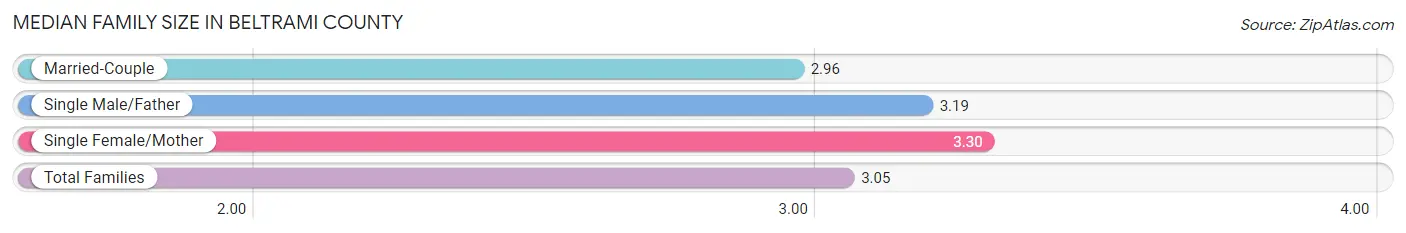
| Family Type | # Families | Family Size |
| Married-Couple | 7,904 (71.0%) | 2.96 |
| Single Male/Father | 903 (8.1%) | 3.19 |
| Single Female/Mother | 2,328 (20.9%) | 3.30 |
| Total Families | 11,135 (100.0%) | 3.05 |
Median Household Size in Beltrami County
The median household size in Beltrami County is 2.48 persons per household, with single female/mother households (2,328 | 13.0%) accounting for the largest median household size of 3.7 persons per household. non-family households (6,735 | 37.7%) represent the smallest median household size with 1.29 persons per household.
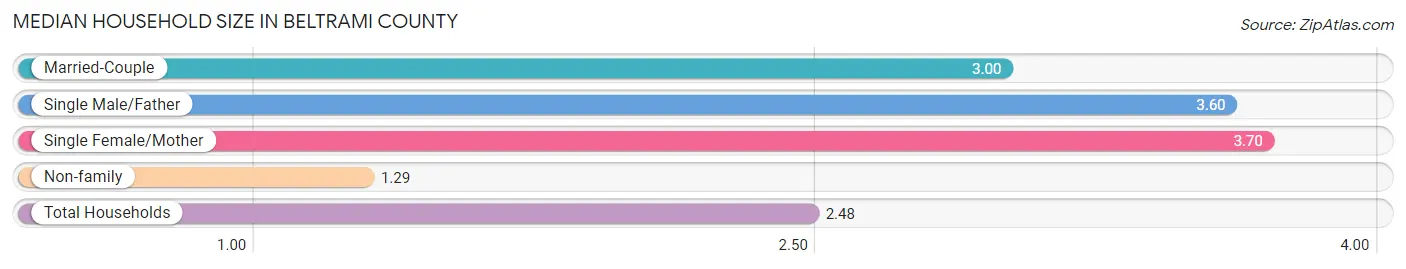
| Household Type | # Households | Household Size |
| Married-Couple | 7,904 (44.2%) | 3.00 |
| Single Male/Father | 903 (5.1%) | 3.60 |
| Single Female/Mother | 2,328 (13.0%) | 3.70 |
| Non-family | 6,735 (37.7%) | 1.29 |
| Total Households | 17,870 (100.0%) | 2.48 |
Household Size by Marriage Status in Beltrami County
Out of a total of 17,870 households in Beltrami County, 11,135 (62.3%) are family households, while 6,735 (37.7%) are nonfamily households. The most numerous type of family households are 2-person households, comprising 5,149, and the most common type of nonfamily households are 1-person households, comprising 5,224.
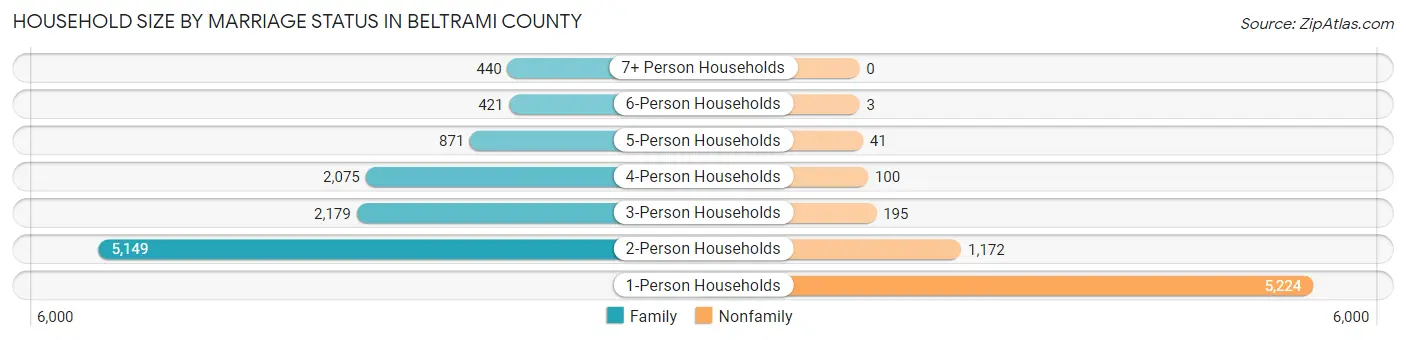
| Household Size | Family Households | Nonfamily Households |
| 1-Person Households | - | 5,224 (29.2%) |
| 2-Person Households | 5,149 (28.8%) | 1,172 (6.6%) |
| 3-Person Households | 2,179 (12.2%) | 195 (1.1%) |
| 4-Person Households | 2,075 (11.6%) | 100 (0.6%) |
| 5-Person Households | 871 (4.9%) | 41 (0.2%) |
| 6-Person Households | 421 (2.4%) | 3 (0.0%) |
| 7+ Person Households | 440 (2.5%) | 0 (0.0%) |
| Total | 11,135 (62.3%) | 6,735 (37.7%) |
Female Fertility in Beltrami County
Fertility by Age in Beltrami County
Average fertility rate in Beltrami County is 47.0 births per 1,000 women. Women in the age bracket of 20 to 34 years have the highest fertility rate with 77.0 births per 1,000 women. Women in the age bracket of 20 to 34 years acount for 75.8% of all women with births.
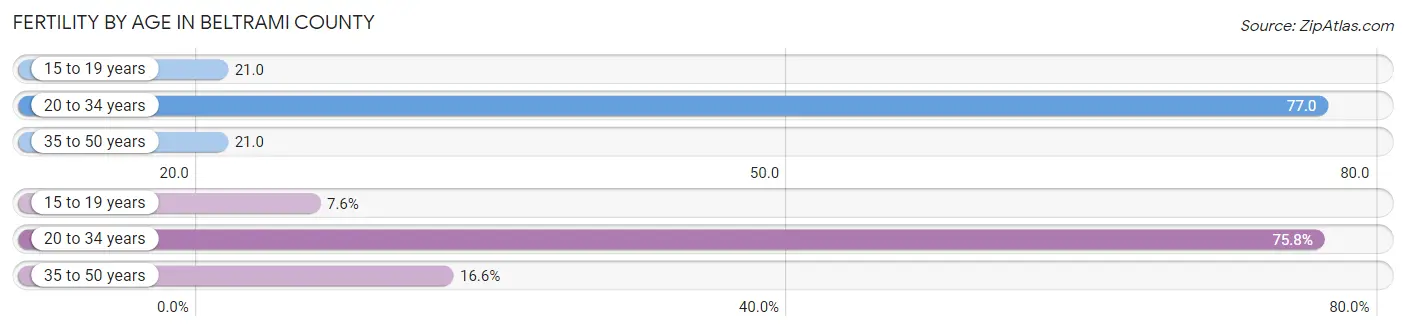
| Age Bracket | Women with Births | Births / 1,000 Women |
| 15 to 19 years | 37 (7.6%) | 21.0 |
| 20 to 34 years | 369 (75.8%) | 77.0 |
| 35 to 50 years | 81 (16.6%) | 21.0 |
| Total | 487 (100.0%) | 47.0 |
Fertility by Age by Marriage Status in Beltrami County
48.7% of women with births (487) in Beltrami County are married. The highest percentage of unmarried women with births falls into 15 to 19 years age bracket with 100.0% of them unmarried at the time of birth, while the lowest percentage of unmarried women with births belong to 35 to 50 years age bracket with 33.3% of them unmarried.
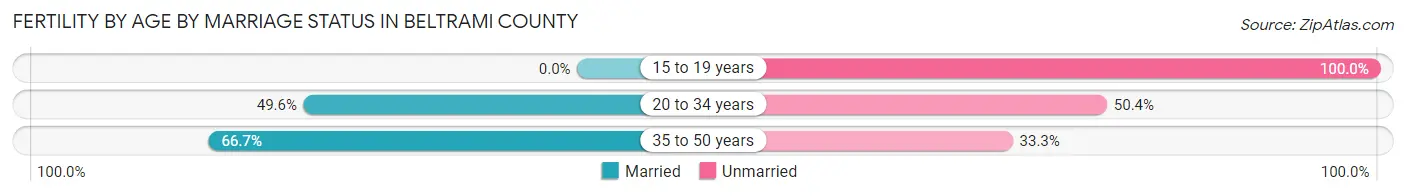
| Age Bracket | Married | Unmarried |
| 15 to 19 years | 0 (0.0%) | 37 (100.0%) |
| 20 to 34 years | 183 (49.6%) | 186 (50.4%) |
| 35 to 50 years | 54 (66.7%) | 27 (33.3%) |
| Total | 237 (48.7%) | 250 (51.3%) |
Fertility by Education in Beltrami County
Average fertility rate in Beltrami County is 47.0 births per 1,000 women. Women with the education attainment of high school diploma have the highest fertility rate of 94.0 births per 1,000 women, while women with the education attainment of college or associate's degree have the lowest fertility at 16.0 births per 1,000 women. Women with the education attainment of high school diploma represent 34.1% of all women with births.
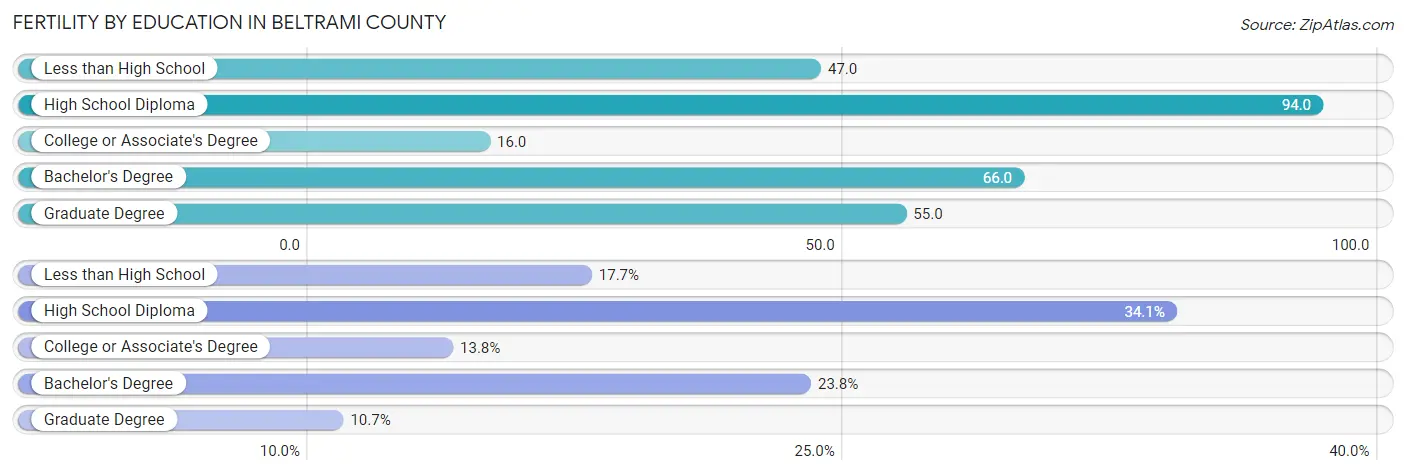
| Educational Attainment | Women with Births | Births / 1,000 Women |
| Less than High School | 86 (17.7%) | 47.0 |
| High School Diploma | 166 (34.1%) | 94.0 |
| College or Associate's Degree | 67 (13.8%) | 16.0 |
| Bachelor's Degree | 116 (23.8%) | 66.0 |
| Graduate Degree | 52 (10.7%) | 55.0 |
| Total | 487 (100.0%) | 47.0 |
Fertility by Education by Marriage Status in Beltrami County
51.3% of women with births in Beltrami County are unmarried. Women with the educational attainment of bachelor's degree are most likely to be married with 97.4% of them married at childbirth, while women with the educational attainment of less than high school are least likely to be married with 100.0% of them unmarried at childbirth.
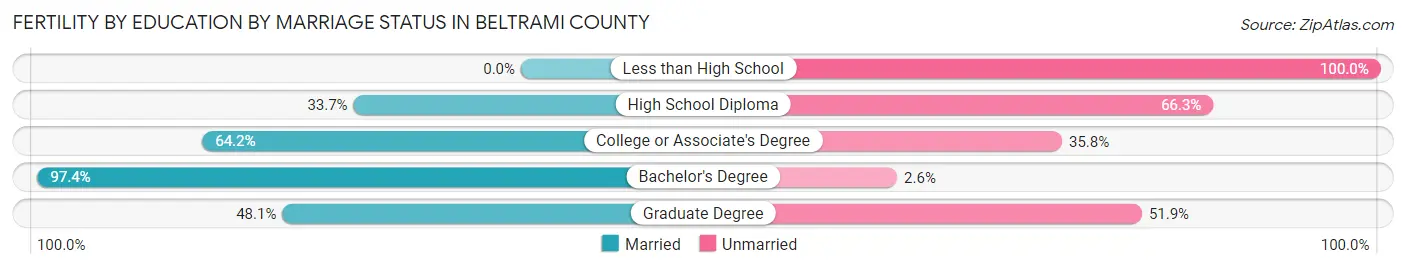
| Educational Attainment | Married | Unmarried |
| Less than High School | 0 (0.0%) | 86 (100.0%) |
| High School Diploma | 56 (33.7%) | 110 (66.3%) |
| College or Associate's Degree | 43 (64.2%) | 24 (35.8%) |
| Bachelor's Degree | 113 (97.4%) | 3 (2.6%) |
| Graduate Degree | 25 (48.1%) | 27 (51.9%) |
| Total | 237 (48.7%) | 250 (51.3%) |
Income in Beltrami County
Income Overview in Beltrami County
Per Capita Income in Beltrami County is $32,055, while median incomes of families and households are $80,795 and $62,173 respectively.
| Characteristic | Number | Measure |
| Per Capita Income | 46,274 | $32,055 |
| Median Family Income | 11,135 | $80,795 |
| Mean Family Income | 11,135 | $98,275 |
| Median Household Income | 17,870 | $62,173 |
| Mean Household Income | 17,870 | $81,939 |
| Income Deficit | 11,135 | $11,291 |
| Wage / Income Gap (%) | 46,274 | 22.62% |
| Wage / Income Gap ($) | 46,274 | 77.38¢ per $1 |
| Gini / Inequality Index | 46,274 | 0.44 |
Earnings by Sex in Beltrami County
Average Earnings in Beltrami County are $34,643, $39,235 for men and $30,360 for women, a difference of 22.6%.
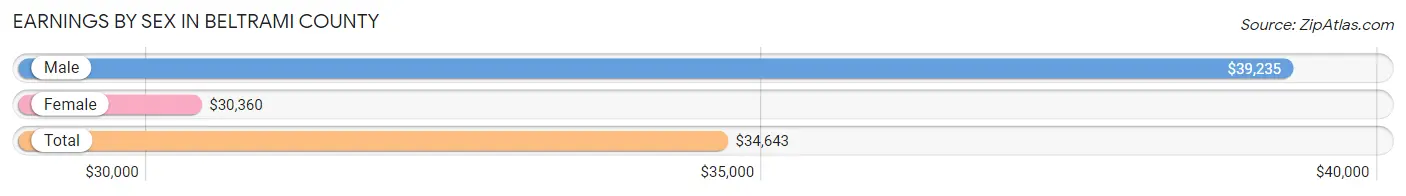
| Sex | Number | Average Earnings |
| Male | 12,747 (52.1%) | $39,235 |
| Female | 11,704 (47.9%) | $30,360 |
| Total | 24,451 (100.0%) | $34,643 |
Earnings by Sex by Income Bracket in Beltrami County
The most common earnings brackets in Beltrami County are $100,000+ for men (1,226 | 9.6%) and $55,000 to $64,999 for women (1,098 | 9.4%).
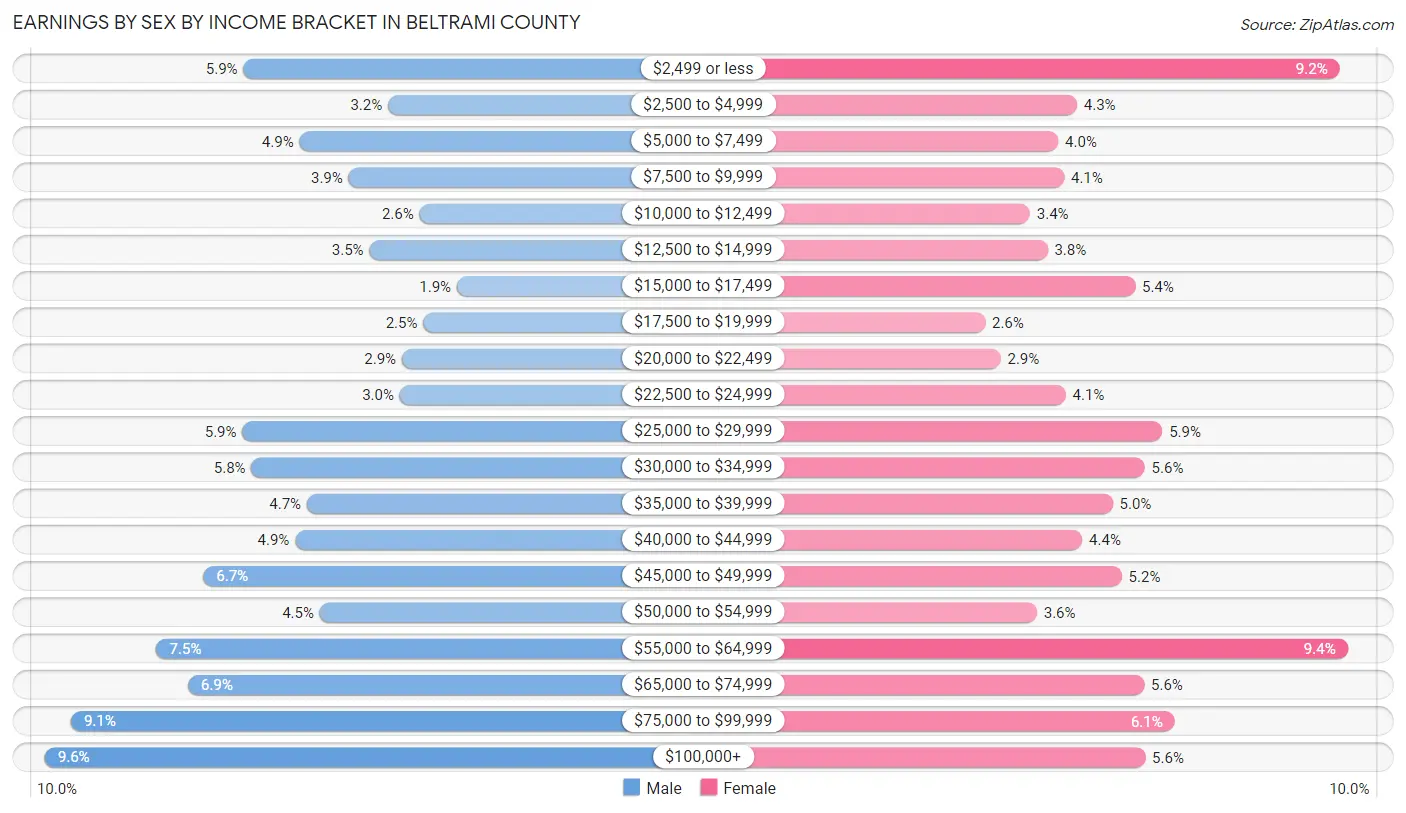
| Income | Male | Female |
| $2,499 or less | 752 (5.9%) | 1,080 (9.2%) |
| $2,500 to $4,999 | 406 (3.2%) | 504 (4.3%) |
| $5,000 to $7,499 | 618 (4.9%) | 464 (4.0%) |
| $7,500 to $9,999 | 501 (3.9%) | 476 (4.1%) |
| $10,000 to $12,499 | 332 (2.6%) | 401 (3.4%) |
| $12,500 to $14,999 | 451 (3.5%) | 440 (3.8%) |
| $15,000 to $17,499 | 242 (1.9%) | 632 (5.4%) |
| $17,500 to $19,999 | 322 (2.5%) | 303 (2.6%) |
| $20,000 to $22,499 | 373 (2.9%) | 337 (2.9%) |
| $22,500 to $24,999 | 379 (3.0%) | 480 (4.1%) |
| $25,000 to $29,999 | 755 (5.9%) | 692 (5.9%) |
| $30,000 to $34,999 | 733 (5.8%) | 653 (5.6%) |
| $35,000 to $39,999 | 601 (4.7%) | 583 (5.0%) |
| $40,000 to $44,999 | 629 (4.9%) | 516 (4.4%) |
| $45,000 to $49,999 | 848 (6.7%) | 603 (5.1%) |
| $50,000 to $54,999 | 570 (4.5%) | 417 (3.6%) |
| $55,000 to $64,999 | 960 (7.5%) | 1,098 (9.4%) |
| $65,000 to $74,999 | 885 (6.9%) | 652 (5.6%) |
| $75,000 to $99,999 | 1,164 (9.1%) | 719 (6.1%) |
| $100,000+ | 1,226 (9.6%) | 654 (5.6%) |
| Total | 12,747 (100.0%) | 11,704 (100.0%) |
Earnings by Sex by Educational Attainment in Beltrami County
Average earnings in Beltrami County are $48,564 for men and $39,900 for women, a difference of 17.8%. Men with an educational attainment of graduate degree enjoy the highest average annual earnings of $79,311, while those with less than high school education earn the least with $26,181. Women with an educational attainment of graduate degree earn the most with the average annual earnings of $70,893, while those with high school diploma education have the smallest earnings of $21,159.
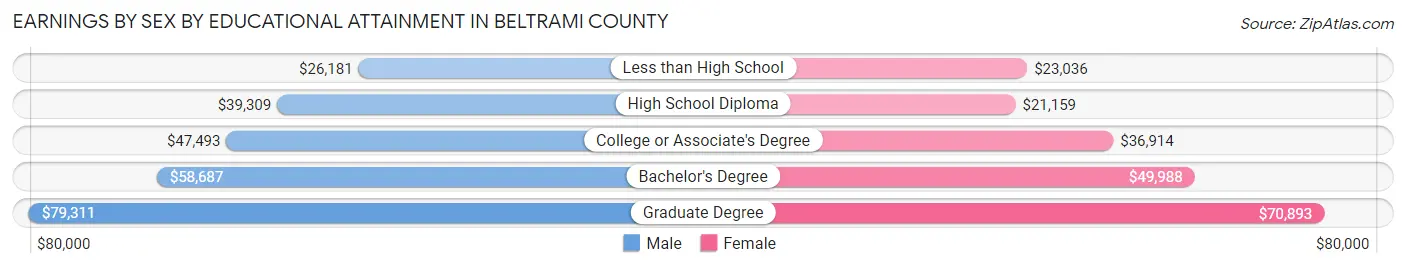
| Educational Attainment | Male Income | Female Income |
| Less than High School | $26,181 | $23,036 |
| High School Diploma | $39,309 | $21,159 |
| College or Associate's Degree | $47,493 | $36,914 |
| Bachelor's Degree | $58,687 | $49,988 |
| Graduate Degree | $79,311 | $70,893 |
| Total | $48,564 | $39,900 |
Family Income in Beltrami County
Family Income Brackets in Beltrami County
According to the Beltrami County family income data, there are 2,316 families falling into the $100,000 to $149,999 income range, which is the most common income bracket and makes up 20.8% of all families. Conversely, the less than $10,000 income bracket is the least frequent group with only 312 families (2.8%) belonging to this category.
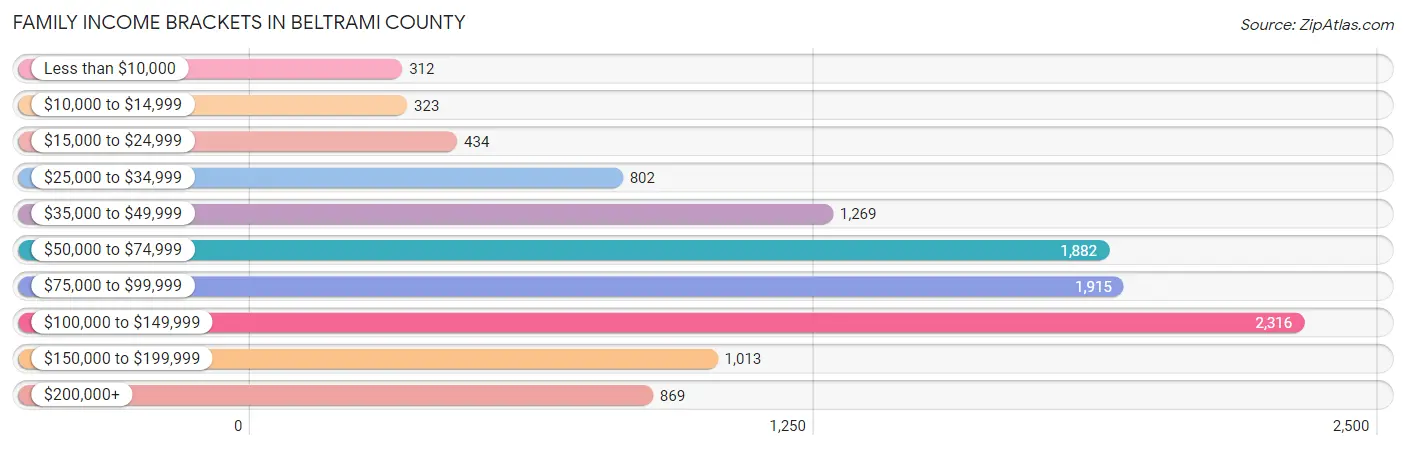
| Income Bracket | # Families | % Families |
| Less than $10,000 | 312 | 2.8% |
| $10,000 to $14,999 | 323 | 2.9% |
| $15,000 to $24,999 | 434 | 3.9% |
| $25,000 to $34,999 | 802 | 7.2% |
| $35,000 to $49,999 | 1,269 | 11.4% |
| $50,000 to $74,999 | 1,882 | 16.9% |
| $75,000 to $99,999 | 1,915 | 17.2% |
| $100,000 to $149,999 | 2,316 | 20.8% |
| $150,000 to $199,999 | 1,013 | 9.1% |
| $200,000+ | 869 | 7.8% |
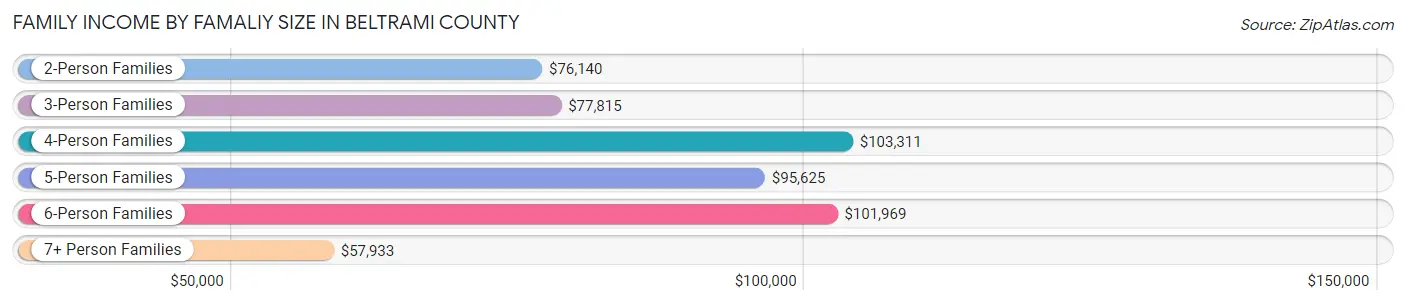
Family Income by Famaliy Size in Beltrami County
4-person families (1,916 | 17.2%) account for the highest median family income in Beltrami County with $103,311 per family, while 2-person families (5,719 | 51.4%) have the highest median income of $38,070 per family member.
| Income Bracket | # Families | Median Income |
| 2-Person Families | 5,719 (51.4%) | $76,140 |
| 3-Person Families | 1,988 (17.8%) | $77,815 |
| 4-Person Families | 1,916 (17.2%) | $103,311 |
| 5-Person Families | 768 (6.9%) | $95,625 |
| 6-Person Families | 459 (4.1%) | $101,969 |
| 7+ Person Families | 285 (2.6%) | $57,933 |
| Total | 11,135 (100.0%) | $80,795 |
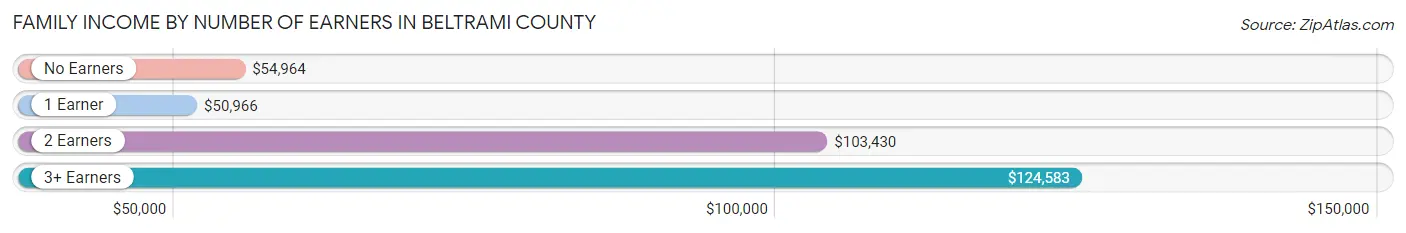
Family Income by Number of Earners in Beltrami County
The median family income in Beltrami County is $80,795, with families comprising 3+ earners (1,050) having the highest median family income of $124,583, while families with 1 earner (3,413) have the lowest median family income of $50,966, accounting for 9.4% and 30.6% of families, respectively.
| Number of Earners | # Families | Median Income |
| No Earners | 1,796 (16.1%) | $54,964 |
| 1 Earner | 3,413 (30.6%) | $50,966 |
| 2 Earners | 4,876 (43.8%) | $103,430 |
| 3+ Earners | 1,050 (9.4%) | $124,583 |
| Total | 11,135 (100.0%) | $80,795 |
Household Income in Beltrami County
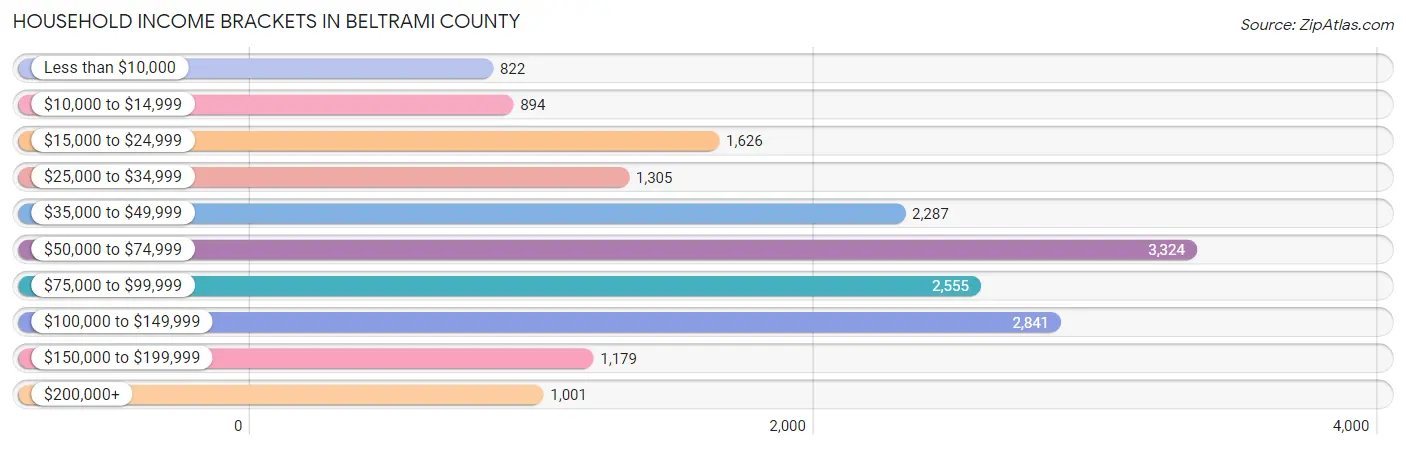
Household Income Brackets in Beltrami County
With 3,324 households falling in the category, the $50,000 to $74,999 income range is the most frequent in Beltrami County, accounting for 18.6% of all households. In contrast, only 822 households (4.6%) fall into the less than $10,000 income bracket, making it the least populous group.
| Income Bracket | # Households | % Households |
| Less than $10,000 | 822 | 4.6% |
| $10,000 to $14,999 | 894 | 5.0% |
| $15,000 to $24,999 | 1,626 | 9.1% |
| $25,000 to $34,999 | 1,305 | 7.3% |
| $35,000 to $49,999 | 2,287 | 12.8% |
| $50,000 to $74,999 | 3,324 | 18.6% |
| $75,000 to $99,999 | 2,555 | 14.3% |
| $100,000 to $149,999 | 2,841 | 15.9% |
| $150,000 to $199,999 | 1,179 | 6.6% |
| $200,000+ | 1,001 | 5.6% |
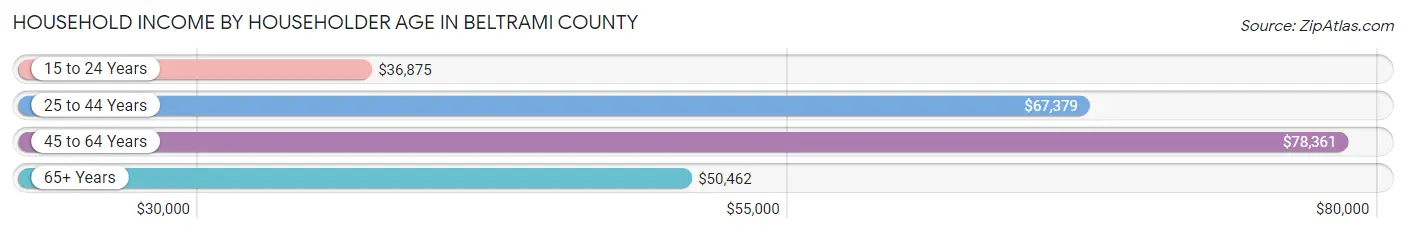
Household Income by Householder Age in Beltrami County
The median household income in Beltrami County is $62,173, with the highest median household income of $78,361 found in the 45 to 64 years age bracket for the primary householder. A total of 6,200 households (34.7%) fall into this category. Meanwhile, the 15 to 24 years age bracket for the primary householder has the lowest median household income of $36,875, with 1,597 households (8.9%) in this group.
| Income Bracket | # Households | Median Income |
| 15 to 24 Years | 1,597 (8.9%) | $36,875 |
| 25 to 44 Years | 5,271 (29.5%) | $67,379 |
| 45 to 64 Years | 6,200 (34.7%) | $78,361 |
| 65+ Years | 4,802 (26.9%) | $50,462 |
| Total | 17,870 (100.0%) | $62,173 |
Poverty in Beltrami County
Income Below Poverty by Sex and Age in Beltrami County
With 14.8% poverty level for males and 17.5% for females among the residents of Beltrami County, 12 to 14 year old males and 18 to 24 year old females are the most vulnerable to poverty, with 241 males (27.9%) and 717 females (30.1%) in their respective age groups living below the poverty level.
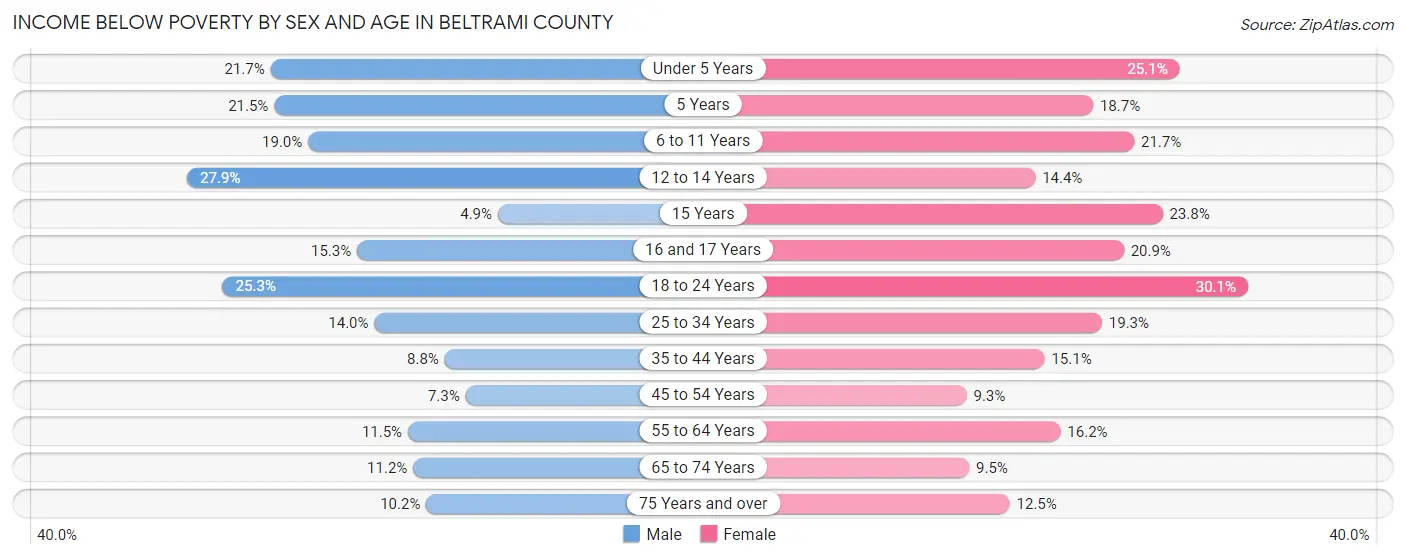
| Age Bracket | Male | Female |
| Under 5 Years | 329 (21.7%) | 363 (25.1%) |
| 5 Years | 82 (21.5%) | 72 (18.6%) |
| 6 to 11 Years | 405 (19.0%) | 399 (21.7%) |
| 12 to 14 Years | 241 (27.9%) | 118 (14.4%) |
| 15 Years | 14 (4.9%) | 75 (23.8%) |
| 16 and 17 Years | 97 (15.3%) | 117 (20.9%) |
| 18 to 24 Years | 653 (25.3%) | 717 (30.1%) |
| 25 to 34 Years | 397 (14.0%) | 520 (19.3%) |
| 35 to 44 Years | 235 (8.8%) | 382 (15.0%) |
| 45 to 54 Years | 165 (7.3%) | 210 (9.3%) |
| 55 to 64 Years | 319 (11.5%) | 460 (16.2%) |
| 65 to 74 Years | 256 (11.2%) | 212 (9.5%) |
| 75 Years and over | 122 (10.2%) | 200 (12.5%) |
| Total | 3,315 (14.8%) | 3,845 (17.5%) |
Income Above Poverty by Sex and Age in Beltrami County
According to the poverty statistics in Beltrami County, males aged 15 years and females aged 45 to 54 years are the age groups that are most secure financially, with 95.1% of males and 90.7% of females in these age groups living above the poverty line.
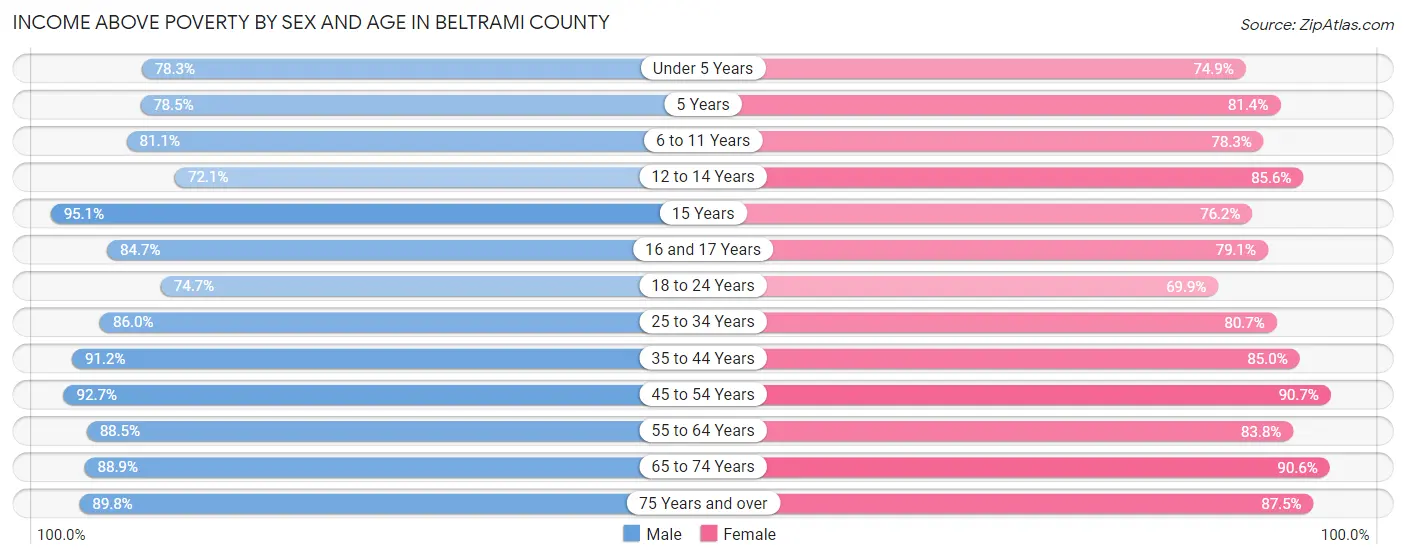
| Age Bracket | Male | Female |
| Under 5 Years | 1,184 (78.3%) | 1,085 (74.9%) |
| 5 Years | 300 (78.5%) | 314 (81.4%) |
| 6 to 11 Years | 1,732 (81.0%) | 1,440 (78.3%) |
| 12 to 14 Years | 622 (72.1%) | 704 (85.6%) |
| 15 Years | 274 (95.1%) | 240 (76.2%) |
| 16 and 17 Years | 536 (84.7%) | 442 (79.1%) |
| 18 to 24 Years | 1,928 (74.7%) | 1,662 (69.9%) |
| 25 to 34 Years | 2,432 (86.0%) | 2,173 (80.7%) |
| 35 to 44 Years | 2,433 (91.2%) | 2,157 (85.0%) |
| 45 to 54 Years | 2,109 (92.7%) | 2,057 (90.7%) |
| 55 to 64 Years | 2,445 (88.5%) | 2,374 (83.8%) |
| 65 to 74 Years | 2,040 (88.8%) | 2,031 (90.5%) |
| 75 Years and over | 1,076 (89.8%) | 1,405 (87.5%) |
| Total | 19,111 (85.2%) | 18,084 (82.5%) |
Income Below Poverty Among Married-Couple Families in Beltrami County
The poverty statistics for married-couple families in Beltrami County show that 3.0% or 237 of the total 7,904 families live below the poverty line. Families with 5 or more children have the highest poverty rate of 9.9%, comprising of 13 families. On the other hand, families with no children have the lowest poverty rate of 2.4%, which includes 115 families.
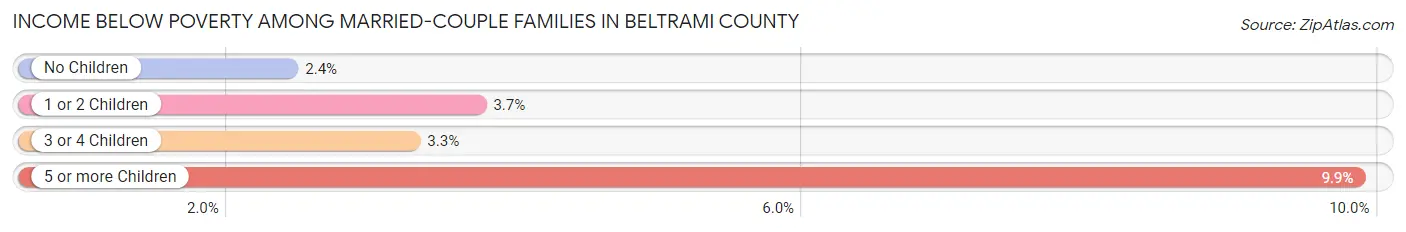
| Children | Above Poverty | Below Poverty |
| No Children | 4,646 (97.6%) | 115 (2.4%) |
| 1 or 2 Children | 2,222 (96.3%) | 86 (3.7%) |
| 3 or 4 Children | 680 (96.7%) | 23 (3.3%) |
| 5 or more Children | 119 (90.1%) | 13 (9.9%) |
| Total | 7,667 (97.0%) | 237 (3.0%) |
Income Below Poverty Among Single-Parent Households in Beltrami County
According to the poverty data in Beltrami County, 14.0% or 126 single-father households and 29.3% or 682 single-mother households are living below the poverty line. Among single-father households, those with 5 or more children have the highest poverty rate, with 14 households (100.0%) experiencing poverty. Likewise, among single-mother households, those with 5 or more children have the highest poverty rate, with 34 households (50.7%) falling below the poverty line.
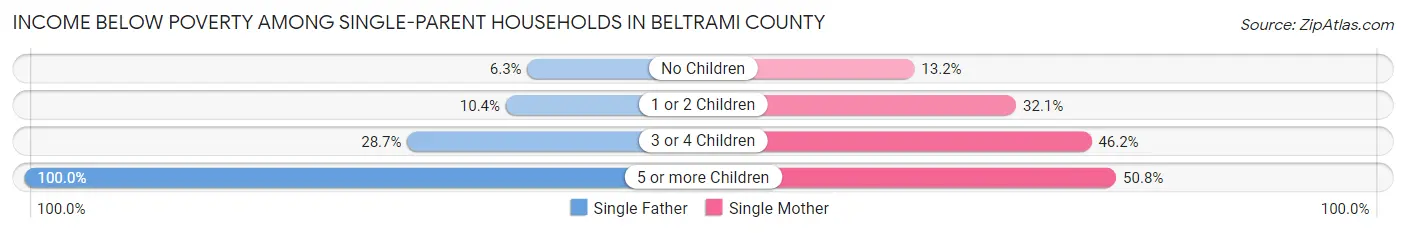
| Children | Single Father | Single Mother |
| No Children | 23 (6.3%) | 95 (13.2%) |
| 1 or 2 Children | 35 (10.4%) | 361 (32.1%) |
| 3 or 4 Children | 54 (28.7%) | 192 (46.2%) |
| 5 or more Children | 14 (100.0%) | 34 (50.7%) |
| Total | 126 (14.0%) | 682 (29.3%) |
Income Below Poverty Among Married-Couple vs Single-Parent Households in Beltrami County
The poverty data for Beltrami County shows that 237 of the married-couple family households (3.0%) and 808 of the single-parent households (25.0%) are living below the poverty level. Within the married-couple family households, those with 5 or more children have the highest poverty rate, with 13 households (9.9%) falling below the poverty line. Among the single-parent households, those with 5 or more children have the highest poverty rate, with 48 household (59.3%) living below poverty.
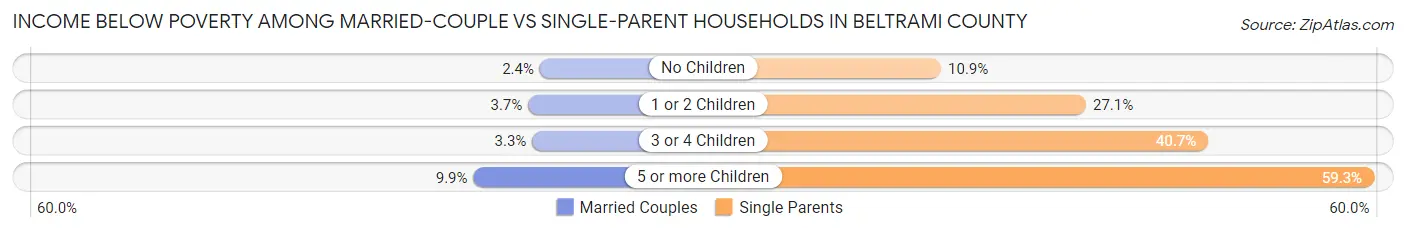
| Children | Married-Couple Families | Single-Parent Households |
| No Children | 115 (2.4%) | 118 (10.9%) |
| 1 or 2 Children | 86 (3.7%) | 396 (27.1%) |
| 3 or 4 Children | 23 (3.3%) | 246 (40.7%) |
| 5 or more Children | 13 (9.9%) | 48 (59.3%) |
| Total | 237 (3.0%) | 808 (25.0%) |
Employment Characteristics in Beltrami County
Employment by Class of Employer in Beltrami County
Among the 21,007 employed individuals in Beltrami County, private company employees (11,085 | 52.8%), local government employees (3,360 | 16.0%), and not-for-profit organizations (2,492 | 11.9%) make up the most common classes of employment.
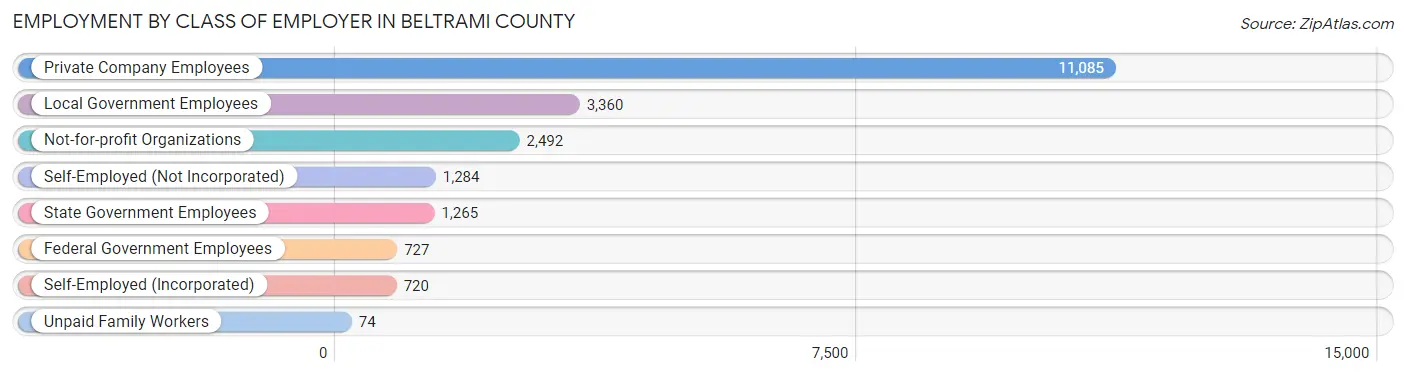
| Employer Class | # Employees | % Employees |
| Private Company Employees | 11,085 | 52.8% |
| Self-Employed (Incorporated) | 720 | 3.4% |
| Self-Employed (Not Incorporated) | 1,284 | 6.1% |
| Not-for-profit Organizations | 2,492 | 11.9% |
| Local Government Employees | 3,360 | 16.0% |
| State Government Employees | 1,265 | 6.0% |
| Federal Government Employees | 727 | 3.5% |
| Unpaid Family Workers | 74 | 0.4% |
| Total | 21,007 | 100.0% |
Employment Status by Age in Beltrami County
According to the labor force statistics for Beltrami County, out of the total population over 16 years of age (36,003), 63.0% or 22,682 individuals are in the labor force, with 5.4% or 1,225 of them unemployed. The age group with the highest labor force participation rate is 25 to 29 years, with 84.9% or 2,408 individuals in the labor force. Within the labor force, the 30 to 34 years age range has the highest percentage of unemployed individuals, with 8.5% or 180 of them being unemployed.
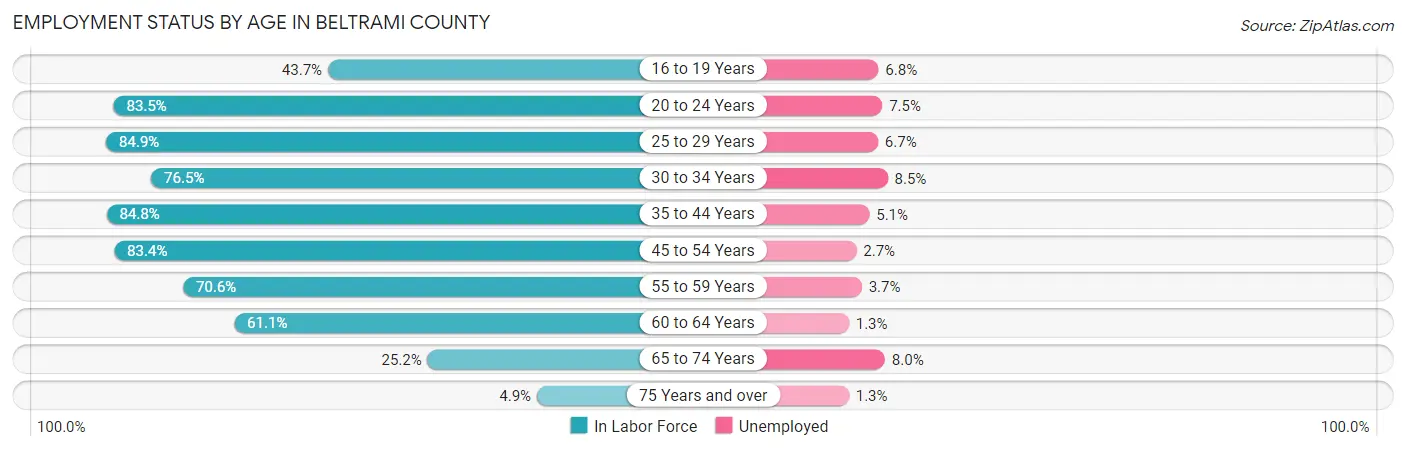
| Age Bracket | In Labor Force | Unemployed |
| 16 to 19 Years | 1,280 (43.7%) | 87 (6.8%) |
| 20 to 24 Years | 3,621 (83.5%) | 272 (7.5%) |
| 25 to 29 Years | 2,408 (84.9%) | 161 (6.7%) |
| 30 to 34 Years | 2,120 (76.5%) | 180 (8.5%) |
| 35 to 44 Years | 4,449 (84.8%) | 227 (5.1%) |
| 45 to 54 Years | 3,806 (83.4%) | 103 (2.7%) |
| 55 to 59 Years | 1,788 (70.6%) | 66 (3.7%) |
| 60 to 64 Years | 1,887 (61.1%) | 25 (1.3%) |
| 65 to 74 Years | 1,162 (25.2%) | 93 (8.0%) |
| 75 Years and over | 151 (4.9%) | 2 (1.3%) |
| Total | 22,682 (63.0%) | 1,225 (5.4%) |
Employment Status by Educational Attainment in Beltrami County
According to labor force statistics for Beltrami County, 78.2% of individuals (16,452) out of the total population between 25 and 64 years of age (21,039) are in the labor force, with 4.6% or 757 of them being unemployed. The group with the highest labor force participation rate are those with the educational attainment of bachelor's degree or higher, with 87.5% or 5,748 individuals in the labor force. Within the labor force, individuals with less than high school education have the highest percentage of unemployment, with 16.8% or 153 of them being unemployed.
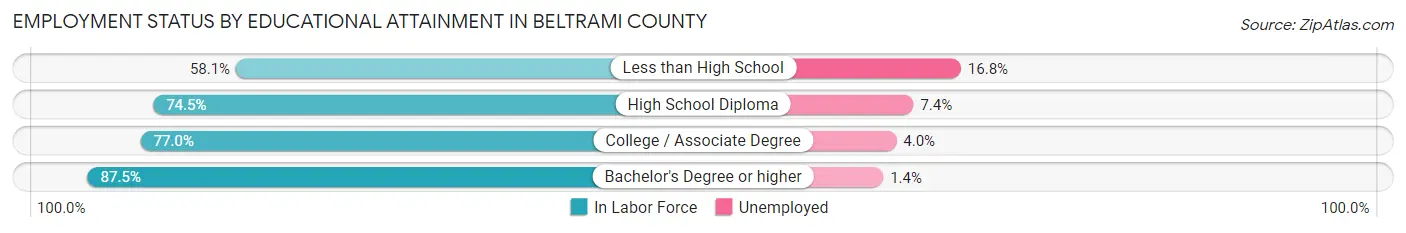
| Educational Attainment | In Labor Force | Unemployed |
| Less than High School | 911 (58.1%) | 263 (16.8%) |
| High School Diploma | 3,954 (74.5%) | 393 (7.4%) |
| College / Associate Degree | 5,848 (77.0%) | 304 (4.0%) |
| Bachelor's Degree or higher | 5,748 (87.5%) | 92 (1.4%) |
| Total | 16,452 (78.2%) | 968 (4.6%) |
Employment Occupations by Sex in Beltrami County
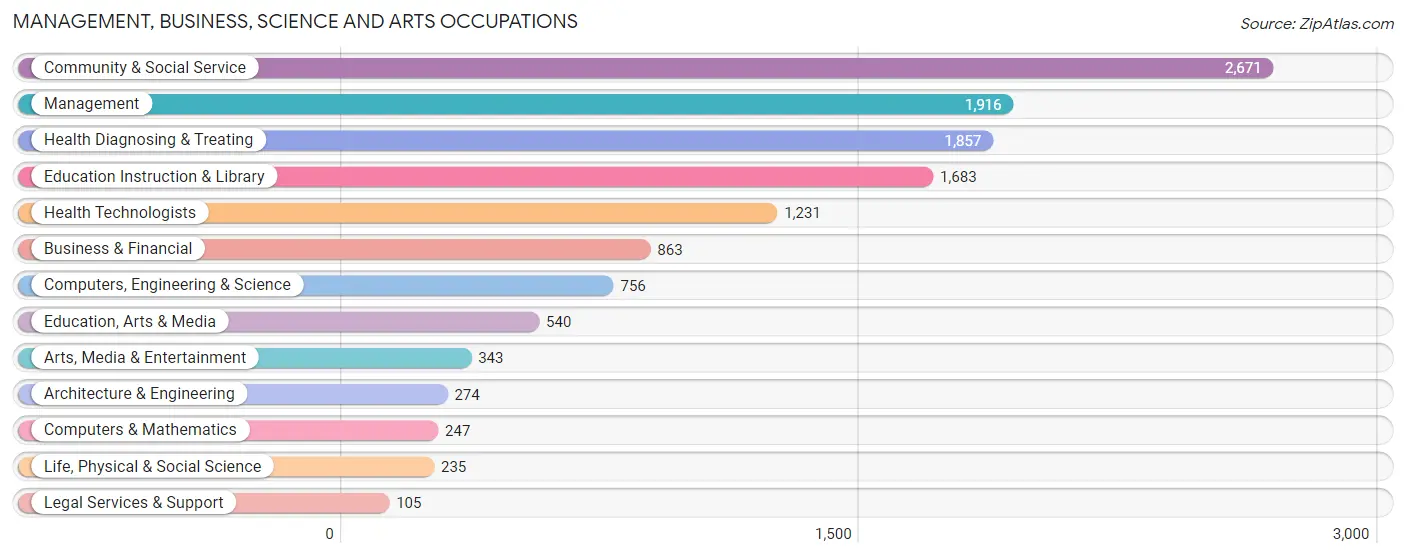
Management, Business, Science and Arts Occupations
The most common Management, Business, Science and Arts occupations in Beltrami County are Community & Social Service (2,671 | 12.5%), Management (1,916 | 8.9%), Health Diagnosing & Treating (1,857 | 8.7%), Education Instruction & Library (1,683 | 7.9%), and Health Technologists (1,231 | 5.8%).
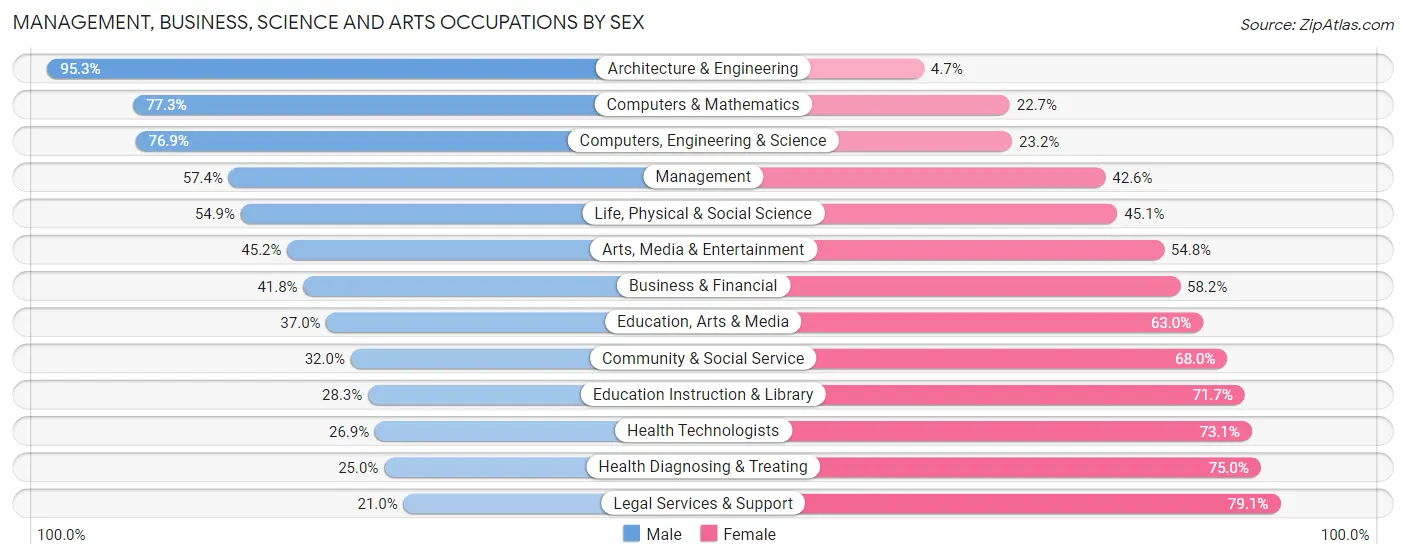
Management, Business, Science and Arts Occupations by Sex
Within the Management, Business, Science and Arts occupations in Beltrami County, the most male-oriented occupations are Architecture & Engineering (95.3%), Computers & Mathematics (77.3%), and Computers, Engineering & Science (76.8%), while the most female-oriented occupations are Legal Services & Support (79.0%), Health Diagnosing & Treating (75.0%), and Health Technologists (73.1%).
| Occupation | Male | Female |
| Management | 1,100 (57.4%) | 816 (42.6%) |
| Business & Financial | 361 (41.8%) | 502 (58.2%) |
| Computers, Engineering & Science | 581 (76.8%) | 175 (23.2%) |
| Computers & Mathematics | 191 (77.3%) | 56 (22.7%) |
| Architecture & Engineering | 261 (95.3%) | 13 (4.7%) |
| Life, Physical & Social Science | 129 (54.9%) | 106 (45.1%) |
| Community & Social Service | 854 (32.0%) | 1,817 (68.0%) |
| Education, Arts & Media | 200 (37.0%) | 340 (63.0%) |
| Legal Services & Support | 22 (20.9%) | 83 (79.0%) |
| Education Instruction & Library | 477 (28.3%) | 1,206 (71.7%) |
| Arts, Media & Entertainment | 155 (45.2%) | 188 (54.8%) |
| Health Diagnosing & Treating | 464 (25.0%) | 1,393 (75.0%) |
| Health Technologists | 331 (26.9%) | 900 (73.1%) |
| Total (Category) | 3,360 (41.7%) | 4,703 (58.3%) |
| Total (Overall) | 10,990 (51.3%) | 10,432 (48.7%) |
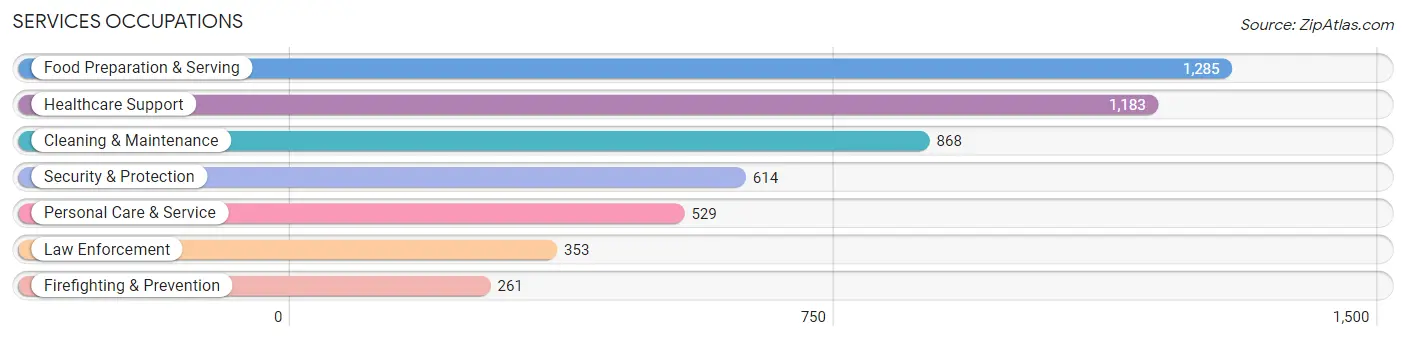
Services Occupations
The most common Services occupations in Beltrami County are Food Preparation & Serving (1,285 | 6.0%), Healthcare Support (1,183 | 5.5%), Cleaning & Maintenance (868 | 4.1%), Security & Protection (614 | 2.9%), and Personal Care & Service (529 | 2.5%).
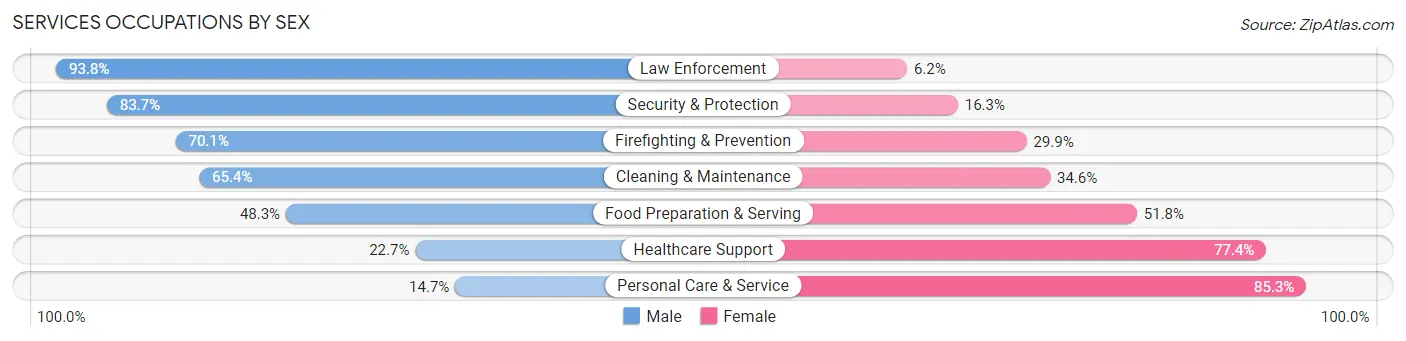
Services Occupations by Sex
Within the Services occupations in Beltrami County, the most male-oriented occupations are Law Enforcement (93.8%), Security & Protection (83.7%), and Firefighting & Prevention (70.1%), while the most female-oriented occupations are Personal Care & Service (85.3%), Healthcare Support (77.3%), and Food Preparation & Serving (51.7%).
| Occupation | Male | Female |
| Healthcare Support | 268 (22.7%) | 915 (77.3%) |
| Security & Protection | 514 (83.7%) | 100 (16.3%) |
| Firefighting & Prevention | 183 (70.1%) | 78 (29.9%) |
| Law Enforcement | 331 (93.8%) | 22 (6.2%) |
| Food Preparation & Serving | 620 (48.2%) | 665 (51.7%) |
| Cleaning & Maintenance | 568 (65.4%) | 300 (34.6%) |
| Personal Care & Service | 78 (14.7%) | 451 (85.3%) |
| Total (Category) | 2,048 (45.7%) | 2,431 (54.3%) |
| Total (Overall) | 10,990 (51.3%) | 10,432 (48.7%) |
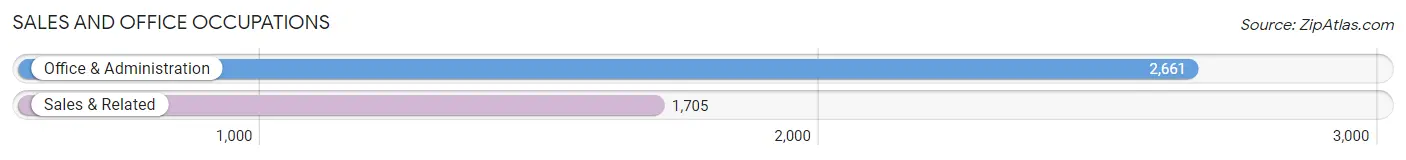
Sales and Office Occupations
The most common Sales and Office occupations in Beltrami County are Office & Administration (2,661 | 12.4%), and Sales & Related (1,705 | 8.0%).
Sales and Office Occupations by Sex
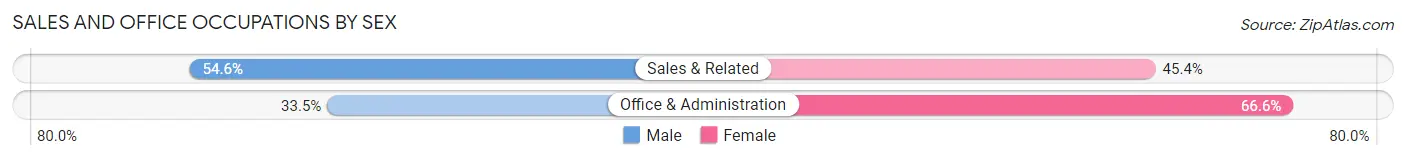
| Occupation | Male | Female |
| Sales & Related | 931 (54.6%) | 774 (45.4%) |
| Office & Administration | 890 (33.5%) | 1,771 (66.5%) |
| Total (Category) | 1,821 (41.7%) | 2,545 (58.3%) |
| Total (Overall) | 10,990 (51.3%) | 10,432 (48.7%) |
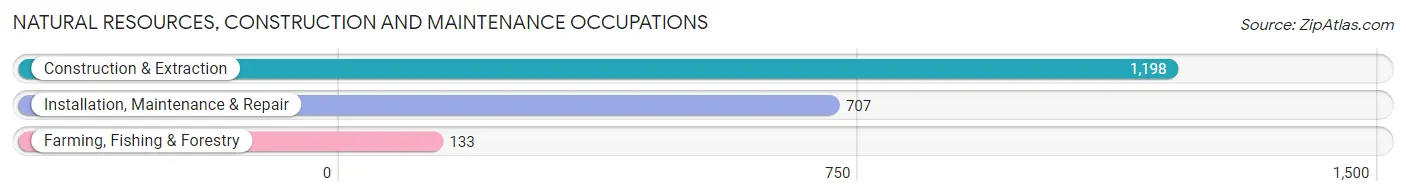
Natural Resources, Construction and Maintenance Occupations
The most common Natural Resources, Construction and Maintenance occupations in Beltrami County are Construction & Extraction (1,198 | 5.6%), Installation, Maintenance & Repair (707 | 3.3%), and Farming, Fishing & Forestry (133 | 0.6%).
Natural Resources, Construction and Maintenance Occupations by Sex
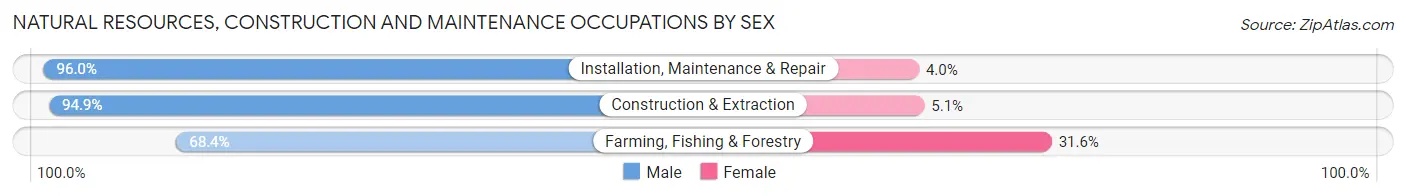
| Occupation | Male | Female |
| Farming, Fishing & Forestry | 91 (68.4%) | 42 (31.6%) |
| Construction & Extraction | 1,137 (94.9%) | 61 (5.1%) |
| Installation, Maintenance & Repair | 679 (96.0%) | 28 (4.0%) |
| Total (Category) | 1,907 (93.6%) | 131 (6.4%) |
| Total (Overall) | 10,990 (51.3%) | 10,432 (48.7%) |
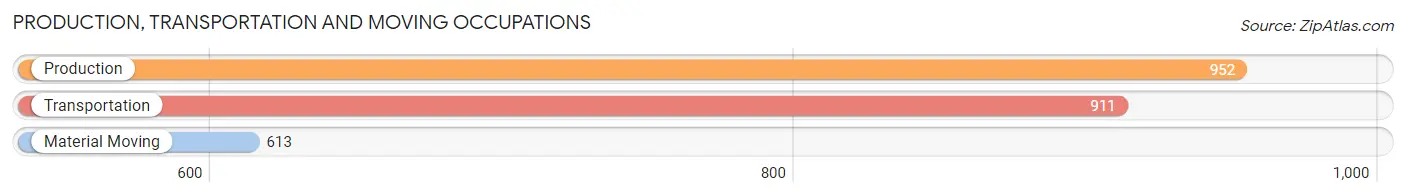
Production, Transportation and Moving Occupations
The most common Production, Transportation and Moving occupations in Beltrami County are Production (952 | 4.4%), Transportation (911 | 4.3%), and Material Moving (613 | 2.9%).
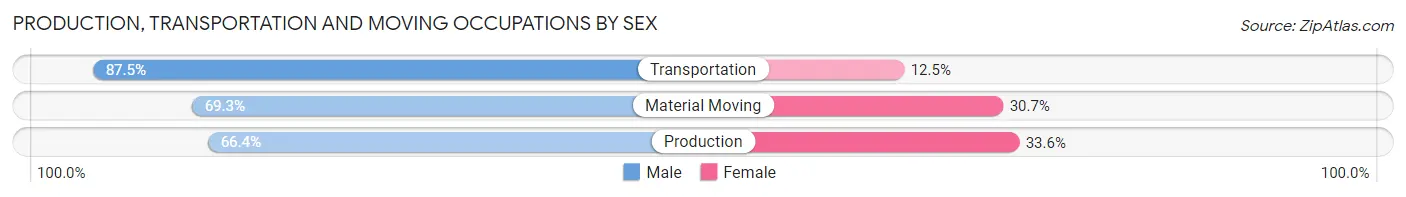
Production, Transportation and Moving Occupations by Sex
| Occupation | Male | Female |
| Production | 632 (66.4%) | 320 (33.6%) |
| Transportation | 797 (87.5%) | 114 (12.5%) |
| Material Moving | 425 (69.3%) | 188 (30.7%) |
| Total (Category) | 1,854 (74.9%) | 622 (25.1%) |
| Total (Overall) | 10,990 (51.3%) | 10,432 (48.7%) |
Employment Industries by Sex in Beltrami County
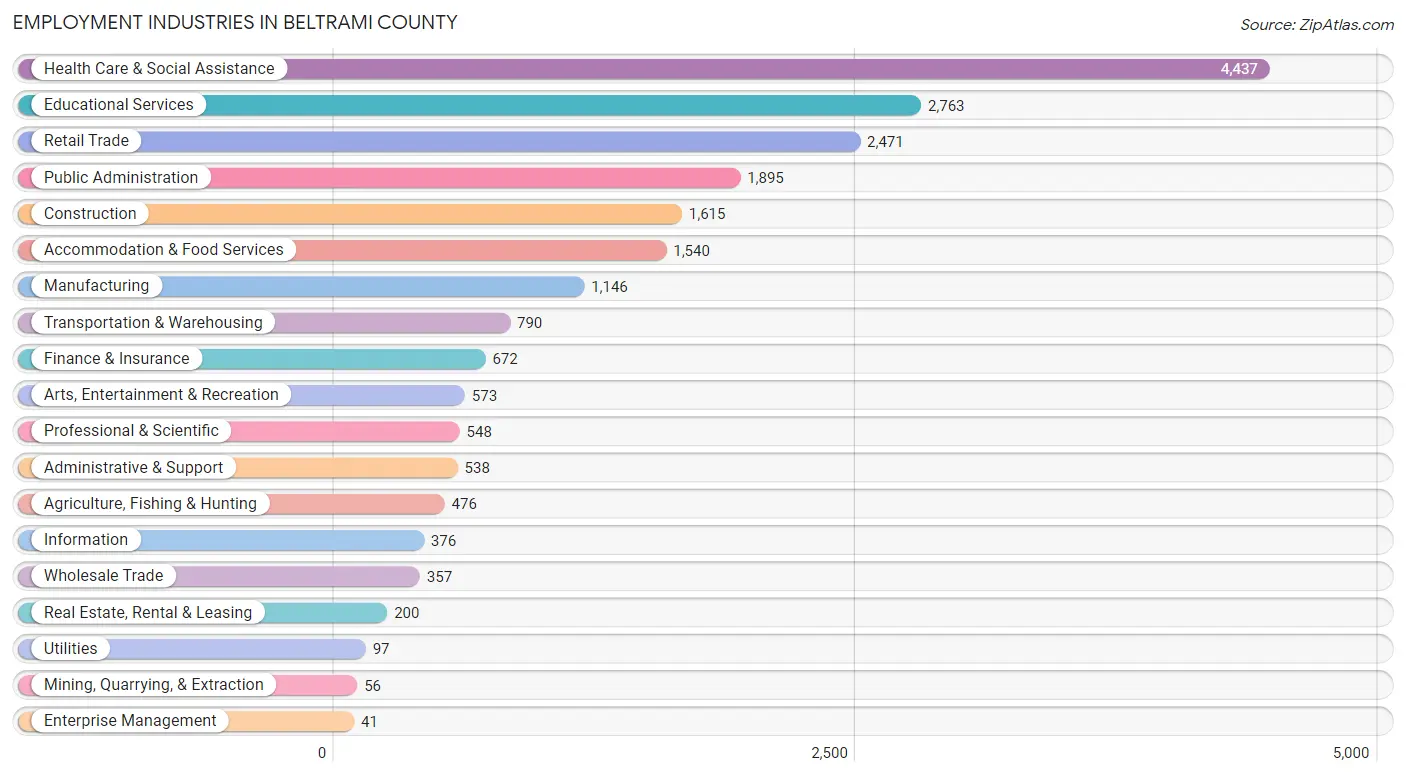
Employment Industries in Beltrami County
The major employment industries in Beltrami County include Health Care & Social Assistance (4,437 | 20.7%), Educational Services (2,763 | 12.9%), Retail Trade (2,471 | 11.5%), Public Administration (1,895 | 8.8%), and Construction (1,615 | 7.5%).
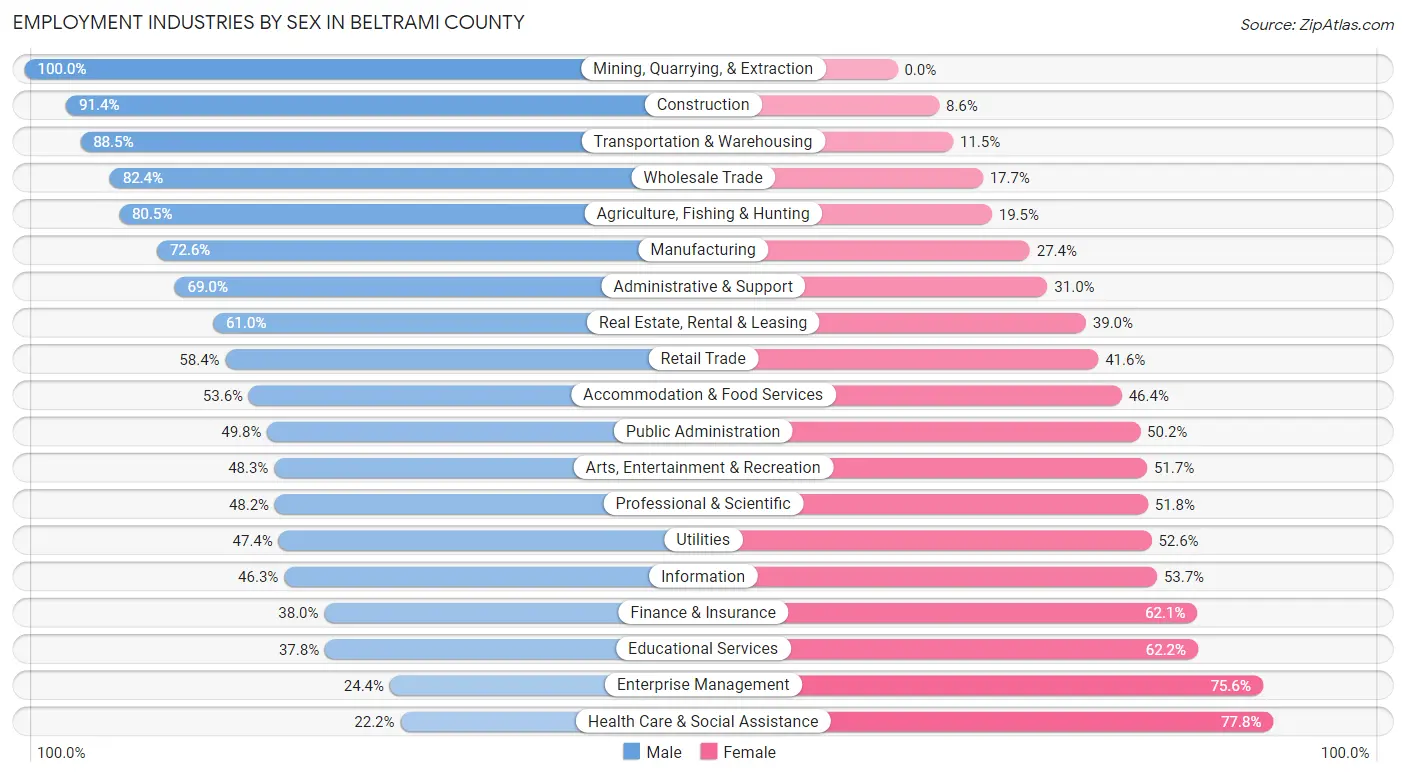
Employment Industries by Sex in Beltrami County
The Beltrami County industries that see more men than women are Mining, Quarrying, & Extraction (100.0%), Construction (91.4%), and Transportation & Warehousing (88.5%), whereas the industries that tend to have a higher number of women are Health Care & Social Assistance (77.8%), Enterprise Management (75.6%), and Educational Services (62.2%).
| Industry | Male | Female |
| Agriculture, Fishing & Hunting | 383 (80.5%) | 93 (19.5%) |
| Mining, Quarrying, & Extraction | 56 (100.0%) | 0 (0.0%) |
| Construction | 1,476 (91.4%) | 139 (8.6%) |
| Manufacturing | 832 (72.6%) | 314 (27.4%) |
| Wholesale Trade | 294 (82.4%) | 63 (17.6%) |
| Retail Trade | 1,444 (58.4%) | 1,027 (41.6%) |
| Transportation & Warehousing | 699 (88.5%) | 91 (11.5%) |
| Utilities | 46 (47.4%) | 51 (52.6%) |
| Information | 174 (46.3%) | 202 (53.7%) |
| Finance & Insurance | 255 (38.0%) | 417 (62.1%) |
| Real Estate, Rental & Leasing | 122 (61.0%) | 78 (39.0%) |
| Professional & Scientific | 264 (48.2%) | 284 (51.8%) |
| Enterprise Management | 10 (24.4%) | 31 (75.6%) |
| Administrative & Support | 371 (69.0%) | 167 (31.0%) |
| Educational Services | 1,045 (37.8%) | 1,718 (62.2%) |
| Health Care & Social Assistance | 986 (22.2%) | 3,451 (77.8%) |
| Arts, Entertainment & Recreation | 277 (48.3%) | 296 (51.7%) |
| Accommodation & Food Services | 825 (53.6%) | 715 (46.4%) |
| Public Administration | 943 (49.8%) | 952 (50.2%) |
| Total | 10,990 (51.3%) | 10,432 (48.7%) |
Education in Beltrami County
School Enrollment in Beltrami County
The most common levels of schooling among the 13,088 students in Beltrami County are college / undergraduate (3,556 | 27.2%), elementary school (2,634 | 20.1%), and high school (2,607 | 19.9%).
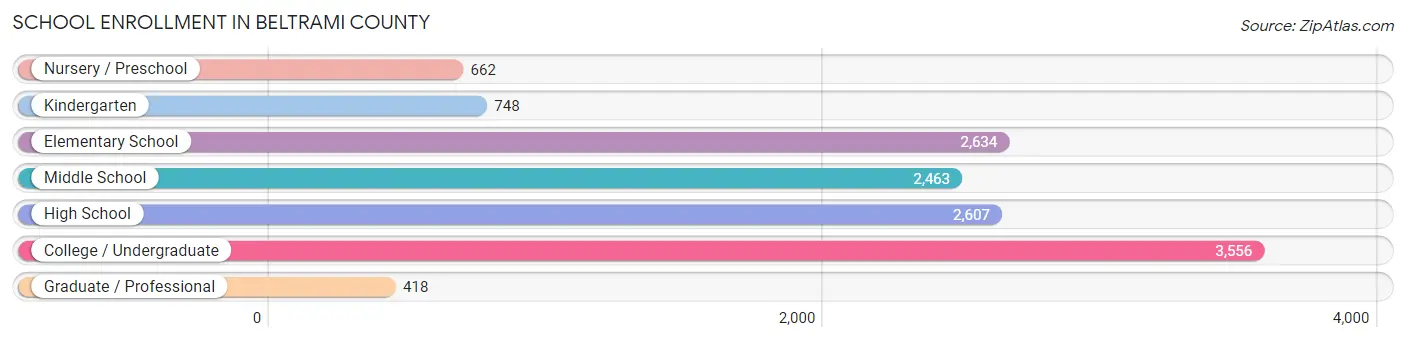
| School Level | # Students | % Students |
| Nursery / Preschool | 662 | 5.1% |
| Kindergarten | 748 | 5.7% |
| Elementary School | 2,634 | 20.1% |
| Middle School | 2,463 | 18.8% |
| High School | 2,607 | 19.9% |
| College / Undergraduate | 3,556 | 27.2% |
| Graduate / Professional | 418 | 3.2% |
| Total | 13,088 | 100.0% |
School Enrollment by Age by Funding Source in Beltrami County
Out of a total of 13,088 students who are enrolled in schools in Beltrami County, 1,963 (15.0%) attend a private institution, while the remaining 11,125 (85.0%) are enrolled in public schools. The age group of 3 to 4 year olds has the highest likelihood of being enrolled in private schools, with 223 (48.3% in the age bracket) enrolled. Conversely, the age group of 18 to 19 year olds has the lowest likelihood of being enrolled in a private school, with 1,223 (94.2% in the age bracket) attending a public institution.
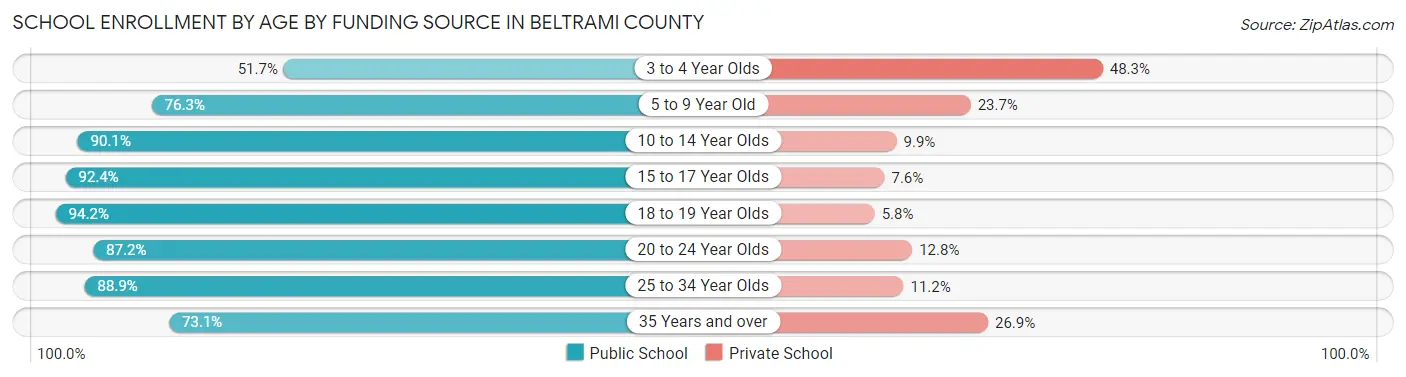
| Age Bracket | Public School | Private School |
| 3 to 4 Year Olds | 239 (51.7%) | 223 (48.3%) |
| 5 to 9 Year Old | 2,358 (76.3%) | 731 (23.7%) |
| 10 to 14 Year Olds | 2,863 (90.1%) | 313 (9.9%) |
| 15 to 17 Year Olds | 1,664 (92.4%) | 137 (7.6%) |
| 18 to 19 Year Olds | 1,223 (94.2%) | 75 (5.8%) |
| 20 to 24 Year Olds | 1,837 (87.2%) | 269 (12.8%) |
| 25 to 34 Year Olds | 558 (88.8%) | 70 (11.2%) |
| 35 Years and over | 386 (73.1%) | 142 (26.9%) |
| Total | 11,125 (85.0%) | 1,963 (15.0%) |
Educational Attainment by Field of Study in Beltrami County
Education (2,209 | 22.0%), science & technology (1,548 | 15.4%), business (1,168 | 11.7%), arts & humanities (1,044 | 10.4%), and bio, nature & agricultural (828 | 8.3%) are the most common fields of study among 10,026 individuals in Beltrami County who have obtained a bachelor's degree or higher.
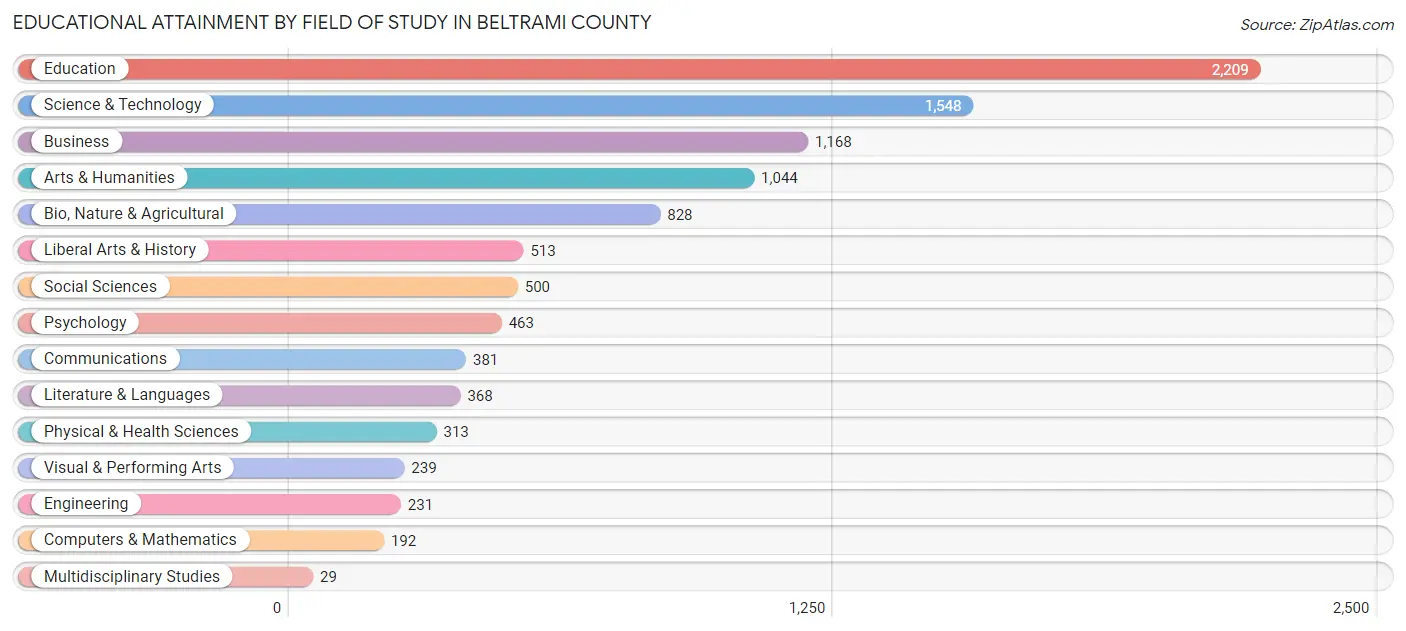
| Field of Study | # Graduates | % Graduates |
| Computers & Mathematics | 192 | 1.9% |
| Bio, Nature & Agricultural | 828 | 8.3% |
| Physical & Health Sciences | 313 | 3.1% |
| Psychology | 463 | 4.6% |
| Social Sciences | 500 | 5.0% |
| Engineering | 231 | 2.3% |
| Multidisciplinary Studies | 29 | 0.3% |
| Science & Technology | 1,548 | 15.4% |
| Business | 1,168 | 11.7% |
| Education | 2,209 | 22.0% |
| Literature & Languages | 368 | 3.7% |
| Liberal Arts & History | 513 | 5.1% |
| Visual & Performing Arts | 239 | 2.4% |
| Communications | 381 | 3.8% |
| Arts & Humanities | 1,044 | 10.4% |
| Total | 10,026 | 100.0% |
Transportation & Commute in Beltrami County
Vehicle Availability by Sex in Beltrami County
The most prevalent vehicle ownership categories in Beltrami County are males with 2 vehicles (3,779, accounting for 35.8%) and females with 2 vehicles (3,846, making up 38.3%).
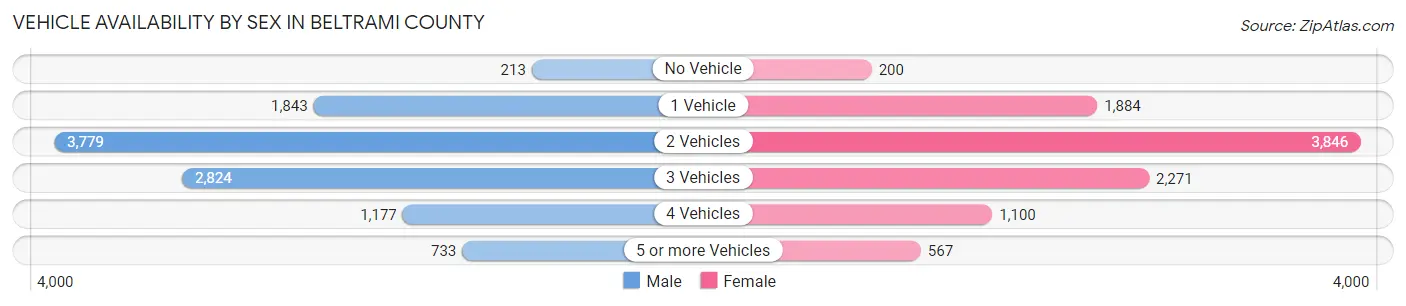
| Vehicles Available | Male | Female |
| No Vehicle | 213 (2.0%) | 200 (2.0%) |
| 1 Vehicle | 1,843 (17.4%) | 1,884 (19.1%) |
| 2 Vehicles | 3,779 (35.8%) | 3,846 (39.0%) |
| 3 Vehicles | 2,824 (26.7%) | 2,271 (23.0%) |
| 4 Vehicles | 1,177 (11.1%) | 1,100 (11.2%) |
| 5 or more Vehicles | 733 (6.9%) | 567 (5.8%) |
| Total | 10,569 (100.0%) | 9,868 (100.0%) |
Commute Time in Beltrami County
The most frequently occuring commute durations in Beltrami County are 10 to 14 minutes (4,183 commuters, 21.6%), 5 to 9 minutes (3,338 commuters, 17.2%), and 15 to 19 minutes (3,220 commuters, 16.6%).
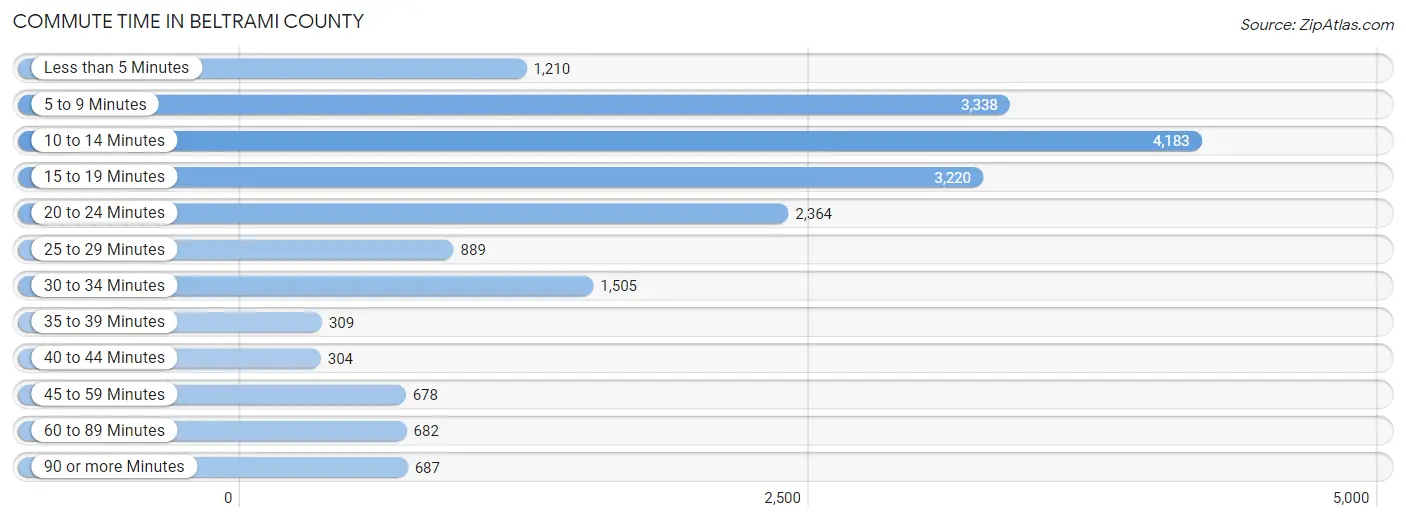
| Commute Time | # Commuters | % Commuters |
| Less than 5 Minutes | 1,210 | 6.2% |
| 5 to 9 Minutes | 3,338 | 17.2% |
| 10 to 14 Minutes | 4,183 | 21.6% |
| 15 to 19 Minutes | 3,220 | 16.6% |
| 20 to 24 Minutes | 2,364 | 12.2% |
| 25 to 29 Minutes | 889 | 4.6% |
| 30 to 34 Minutes | 1,505 | 7.8% |
| 35 to 39 Minutes | 309 | 1.6% |
| 40 to 44 Minutes | 304 | 1.6% |
| 45 to 59 Minutes | 678 | 3.5% |
| 60 to 89 Minutes | 682 | 3.5% |
| 90 or more Minutes | 687 | 3.5% |
Commute Time by Sex in Beltrami County
The most common commute times in Beltrami County are 10 to 14 minutes (2,219 commuters, 21.9%) for males and 10 to 14 minutes (1,964 commuters, 21.3%) for females.
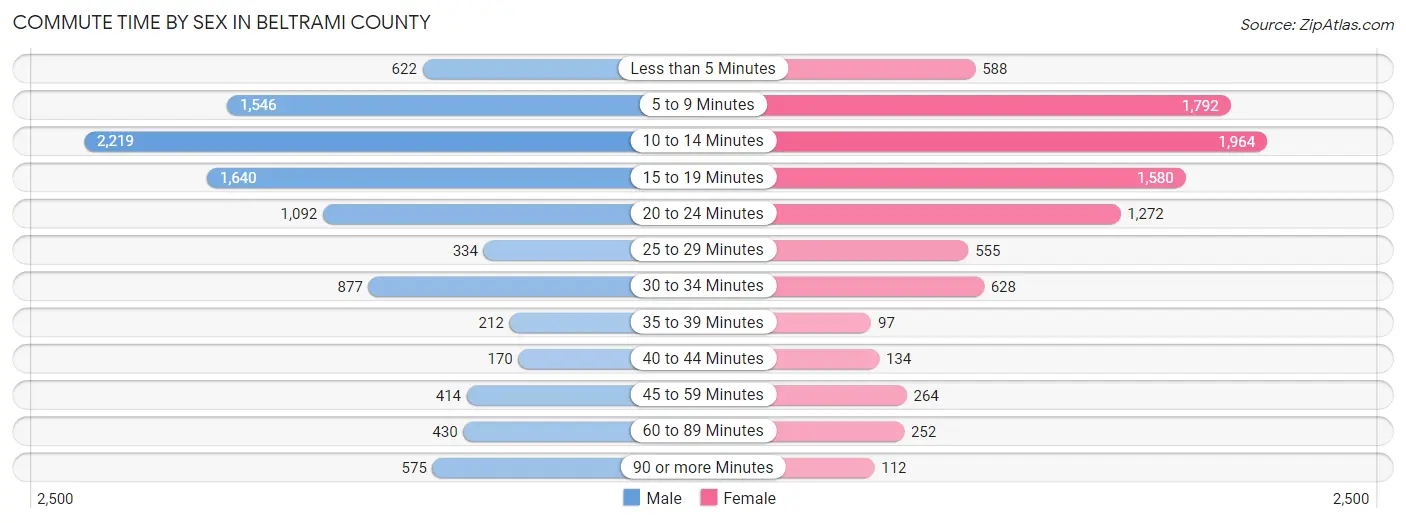
| Commute Time | Male | Female |
| Less than 5 Minutes | 622 (6.1%) | 588 (6.4%) |
| 5 to 9 Minutes | 1,546 (15.3%) | 1,792 (19.4%) |
| 10 to 14 Minutes | 2,219 (21.9%) | 1,964 (21.3%) |
| 15 to 19 Minutes | 1,640 (16.2%) | 1,580 (17.1%) |
| 20 to 24 Minutes | 1,092 (10.8%) | 1,272 (13.8%) |
| 25 to 29 Minutes | 334 (3.3%) | 555 (6.0%) |
| 30 to 34 Minutes | 877 (8.7%) | 628 (6.8%) |
| 35 to 39 Minutes | 212 (2.1%) | 97 (1.1%) |
| 40 to 44 Minutes | 170 (1.7%) | 134 (1.5%) |
| 45 to 59 Minutes | 414 (4.1%) | 264 (2.9%) |
| 60 to 89 Minutes | 430 (4.2%) | 252 (2.7%) |
| 90 or more Minutes | 575 (5.7%) | 112 (1.2%) |
Time of Departure to Work by Sex in Beltrami County
The most frequent times of departure to work in Beltrami County are 7:00 AM to 7:29 AM (1,867, 18.4%) for males and 7:30 AM to 7:59 AM (2,491, 27.0%) for females.
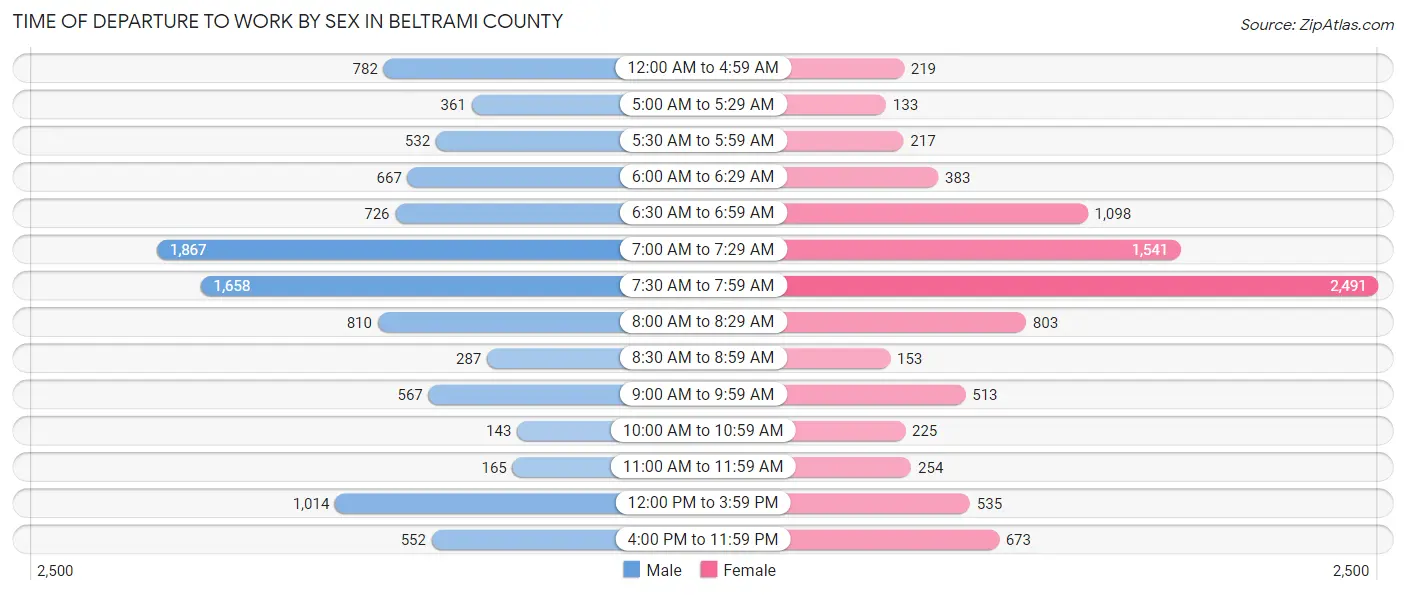
| Time of Departure | Male | Female |
| 12:00 AM to 4:59 AM | 782 (7.7%) | 219 (2.4%) |
| 5:00 AM to 5:29 AM | 361 (3.6%) | 133 (1.4%) |
| 5:30 AM to 5:59 AM | 532 (5.2%) | 217 (2.4%) |
| 6:00 AM to 6:29 AM | 667 (6.6%) | 383 (4.2%) |
| 6:30 AM to 6:59 AM | 726 (7.2%) | 1,098 (11.9%) |
| 7:00 AM to 7:29 AM | 1,867 (18.4%) | 1,541 (16.7%) |
| 7:30 AM to 7:59 AM | 1,658 (16.4%) | 2,491 (27.0%) |
| 8:00 AM to 8:29 AM | 810 (8.0%) | 803 (8.7%) |
| 8:30 AM to 8:59 AM | 287 (2.8%) | 153 (1.7%) |
| 9:00 AM to 9:59 AM | 567 (5.6%) | 513 (5.6%) |
| 10:00 AM to 10:59 AM | 143 (1.4%) | 225 (2.4%) |
| 11:00 AM to 11:59 AM | 165 (1.6%) | 254 (2.8%) |
| 12:00 PM to 3:59 PM | 1,014 (10.0%) | 535 (5.8%) |
| 4:00 PM to 11:59 PM | 552 (5.4%) | 673 (7.3%) |
| Total | 10,131 (100.0%) | 9,238 (100.0%) |
Housing Occupancy in Beltrami County
Occupancy by Ownership in Beltrami County
Of the total 17,870 dwellings in Beltrami County, owner-occupied units account for 12,114 (67.8%), while renter-occupied units make up 5,756 (32.2%).
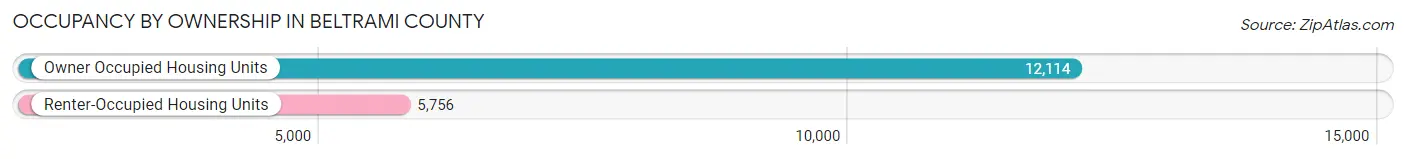
| Occupancy | # Housing Units | % Housing Units |
| Owner Occupied Housing Units | 12,114 | 67.8% |
| Renter-Occupied Housing Units | 5,756 | 32.2% |
| Total Occupied Housing Units | 17,870 | 100.0% |
Occupancy by Household Size in Beltrami County
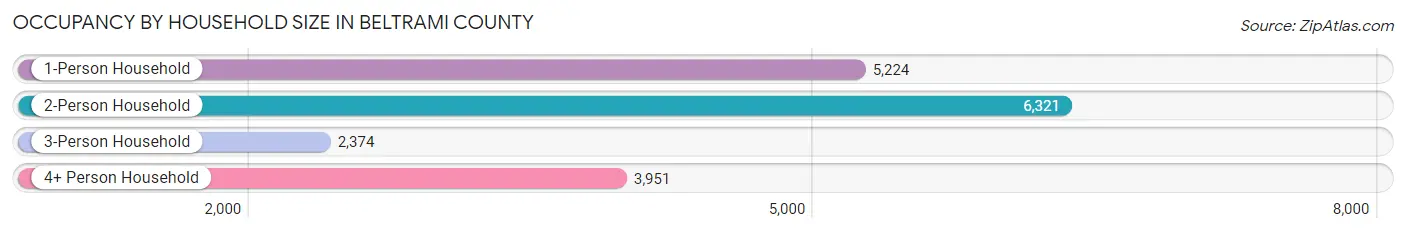
| Household Size | # Housing Units | % Housing Units |
| 1-Person Household | 5,224 | 29.2% |
| 2-Person Household | 6,321 | 35.4% |
| 3-Person Household | 2,374 | 13.3% |
| 4+ Person Household | 3,951 | 22.1% |
| Total Housing Units | 17,870 | 100.0% |
Occupancy by Ownership by Household Size in Beltrami County
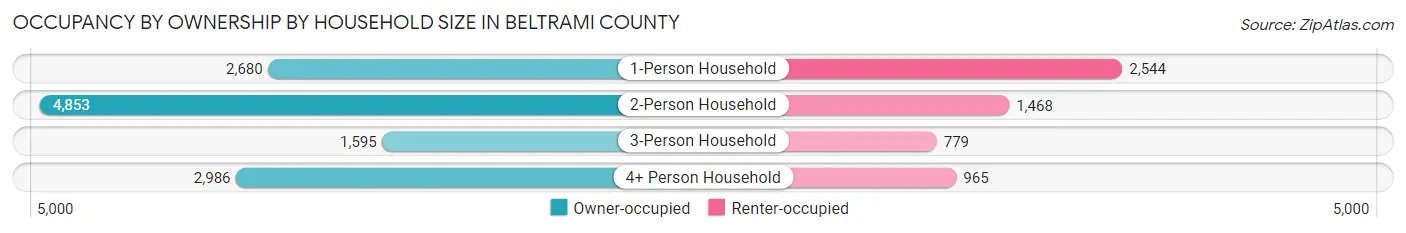
| Household Size | Owner-occupied | Renter-occupied |
| 1-Person Household | 2,680 (51.3%) | 2,544 (48.7%) |
| 2-Person Household | 4,853 (76.8%) | 1,468 (23.2%) |
| 3-Person Household | 1,595 (67.2%) | 779 (32.8%) |
| 4+ Person Household | 2,986 (75.6%) | 965 (24.4%) |
| Total Housing Units | 12,114 (67.8%) | 5,756 (32.2%) |
Occupancy by Educational Attainment in Beltrami County
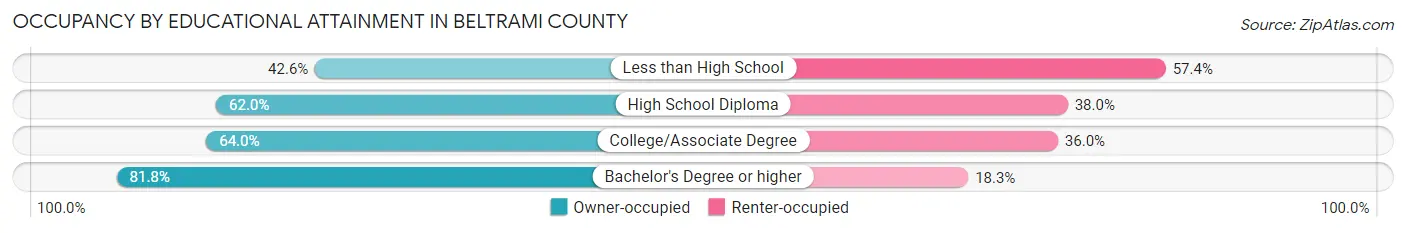
| Household Size | Owner-occupied | Renter-occupied |
| Less than High School | 471 (42.6%) | 635 (57.4%) |
| High School Diploma | 2,739 (62.0%) | 1,677 (38.0%) |
| College/Associate Degree | 4,282 (64.0%) | 2,412 (36.0%) |
| Bachelor's Degree or higher | 4,622 (81.8%) | 1,032 (18.2%) |
Occupancy by Age of Householder in Beltrami County
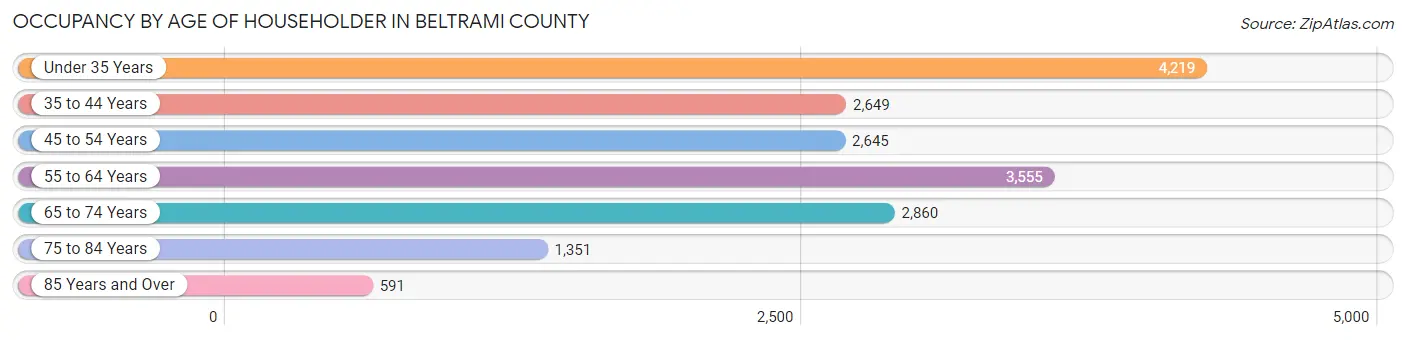
| Age Bracket | # Households | % Households |
| Under 35 Years | 4,219 | 23.6% |
| 35 to 44 Years | 2,649 | 14.8% |
| 45 to 54 Years | 2,645 | 14.8% |
| 55 to 64 Years | 3,555 | 19.9% |
| 65 to 74 Years | 2,860 | 16.0% |
| 75 to 84 Years | 1,351 | 7.6% |
| 85 Years and Over | 591 | 3.3% |
| Total | 17,870 | 100.0% |
Housing Finances in Beltrami County
Median Income by Occupancy in Beltrami County
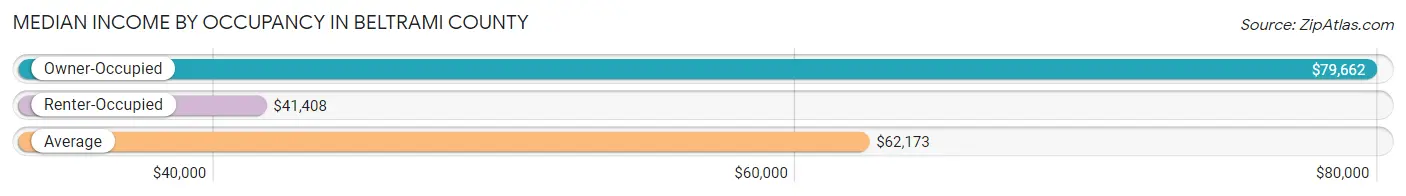
| Occupancy Type | # Households | Median Income |
| Owner-Occupied | 12,114 (67.8%) | $79,662 |
| Renter-Occupied | 5,756 (32.2%) | $41,408 |
| Average | 17,870 (100.0%) | $62,173 |
Occupancy by Householder Income Bracket in Beltrami County
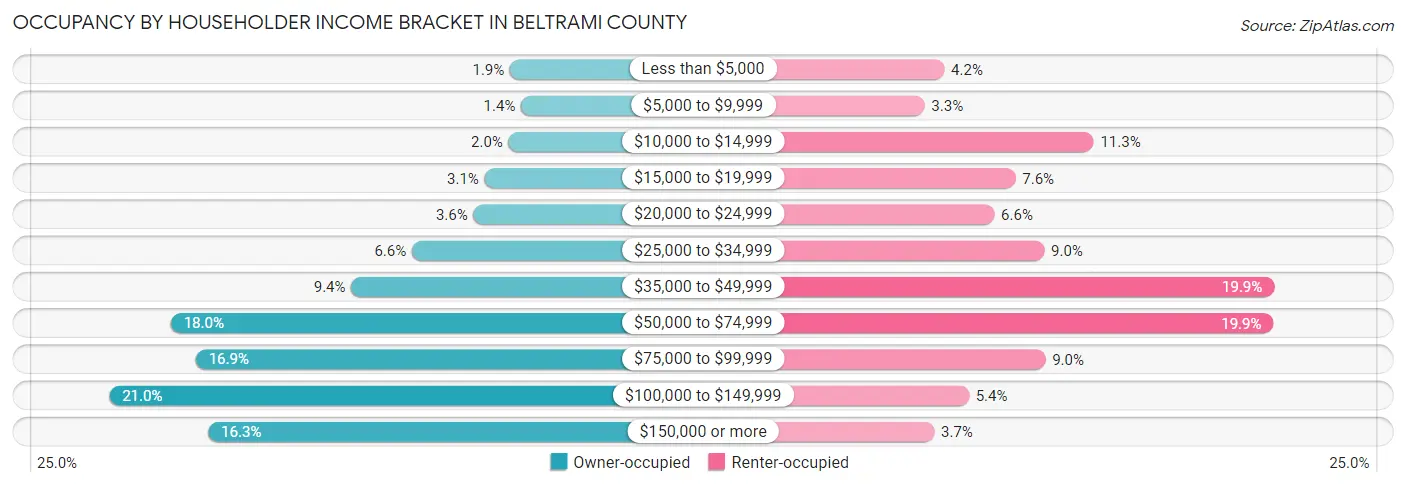
| Income Bracket | Owner-occupied | Renter-occupied |
| Less than $5,000 | 228 (1.9%) | 243 (4.2%) |
| $5,000 to $9,999 | 164 (1.3%) | 189 (3.3%) |
| $10,000 to $14,999 | 236 (1.9%) | 652 (11.3%) |
| $15,000 to $19,999 | 374 (3.1%) | 438 (7.6%) |
| $20,000 to $24,999 | 438 (3.6%) | 380 (6.6%) |
| $25,000 to $34,999 | 794 (6.6%) | 517 (9.0%) |
| $35,000 to $49,999 | 1,144 (9.4%) | 1,147 (19.9%) |
| $50,000 to $74,999 | 2,185 (18.0%) | 1,145 (19.9%) |
| $75,000 to $99,999 | 2,041 (16.9%) | 520 (9.0%) |
| $100,000 to $149,999 | 2,540 (21.0%) | 310 (5.4%) |
| $150,000 or more | 1,970 (16.3%) | 215 (3.7%) |
| Total | 12,114 (100.0%) | 5,756 (100.0%) |
Monthly Housing Cost Tiers in Beltrami County
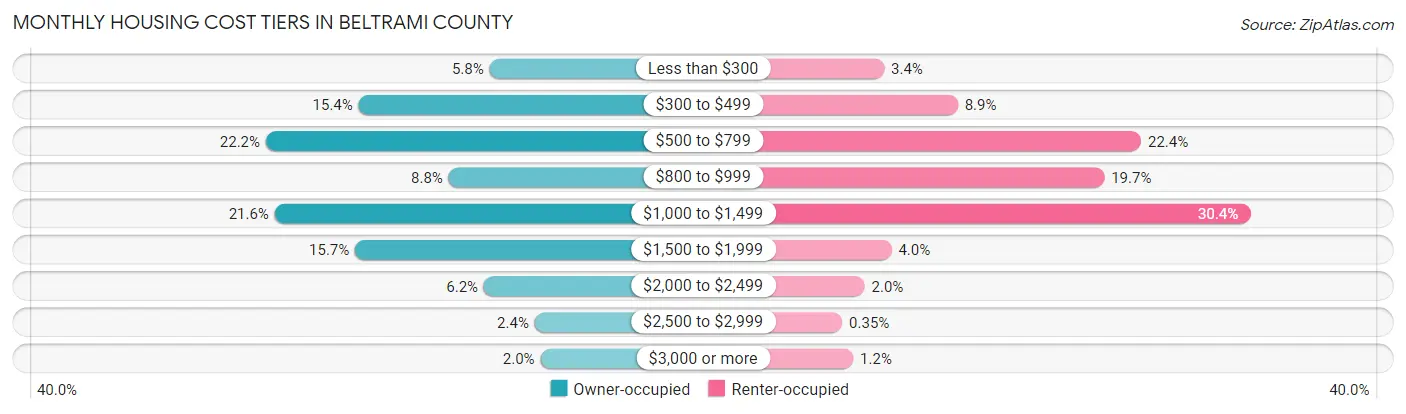
| Monthly Cost | Owner-occupied | Renter-occupied |
| Less than $300 | 698 (5.8%) | 198 (3.4%) |
| $300 to $499 | 1,865 (15.4%) | 510 (8.9%) |
| $500 to $799 | 2,693 (22.2%) | 1,287 (22.4%) |
| $800 to $999 | 1,062 (8.8%) | 1,131 (19.7%) |
| $1,000 to $1,499 | 2,614 (21.6%) | 1,749 (30.4%) |
| $1,500 to $1,999 | 1,897 (15.7%) | 229 (4.0%) |
| $2,000 to $2,499 | 747 (6.2%) | 115 (2.0%) |
| $2,500 to $2,999 | 294 (2.4%) | 20 (0.4%) |
| $3,000 or more | 244 (2.0%) | 67 (1.2%) |
| Total | 12,114 (100.0%) | 5,756 (100.0%) |
Physical Housing Characteristics in Beltrami County
Housing Structures in Beltrami County
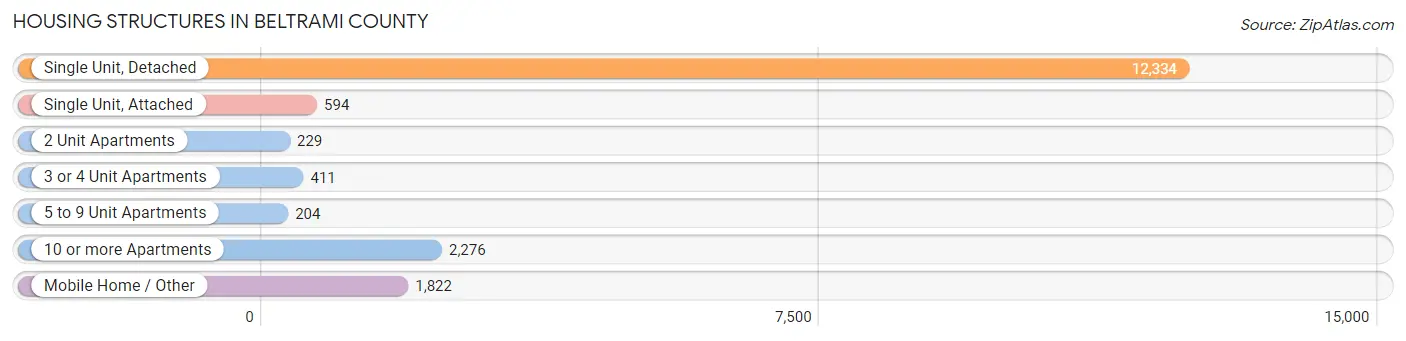
| Structure Type | # Housing Units | % Housing Units |
| Single Unit, Detached | 12,334 | 69.0% |
| Single Unit, Attached | 594 | 3.3% |
| 2 Unit Apartments | 229 | 1.3% |
| 3 or 4 Unit Apartments | 411 | 2.3% |
| 5 to 9 Unit Apartments | 204 | 1.1% |
| 10 or more Apartments | 2,276 | 12.7% |
| Mobile Home / Other | 1,822 | 10.2% |
| Total | 17,870 | 100.0% |
Housing Structures by Occupancy in Beltrami County
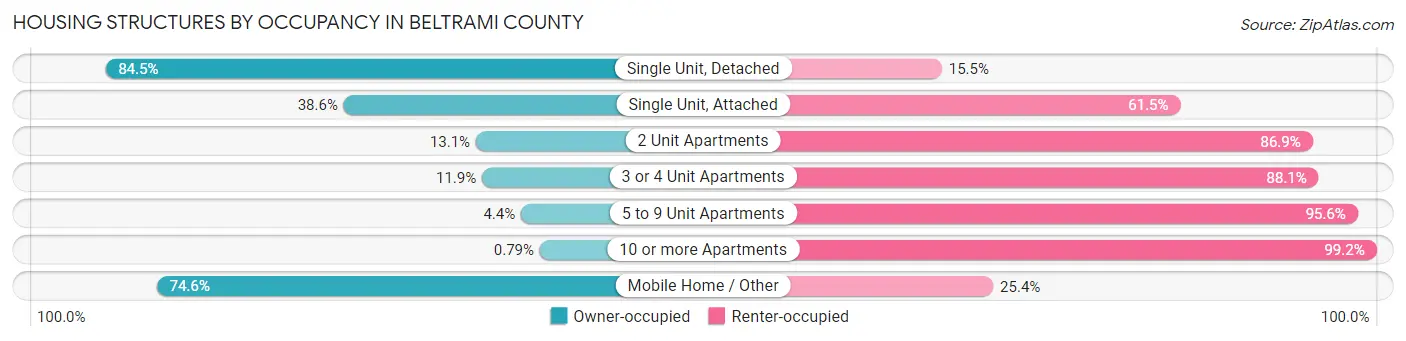
| Structure Type | Owner-occupied | Renter-occupied |
| Single Unit, Detached | 10,420 (84.5%) | 1,914 (15.5%) |
| Single Unit, Attached | 229 (38.6%) | 365 (61.5%) |
| 2 Unit Apartments | 30 (13.1%) | 199 (86.9%) |
| 3 or 4 Unit Apartments | 49 (11.9%) | 362 (88.1%) |
| 5 to 9 Unit Apartments | 9 (4.4%) | 195 (95.6%) |
| 10 or more Apartments | 18 (0.8%) | 2,258 (99.2%) |
| Mobile Home / Other | 1,359 (74.6%) | 463 (25.4%) |
| Total | 12,114 (67.8%) | 5,756 (32.2%) |
Housing Structures by Number of Rooms in Beltrami County
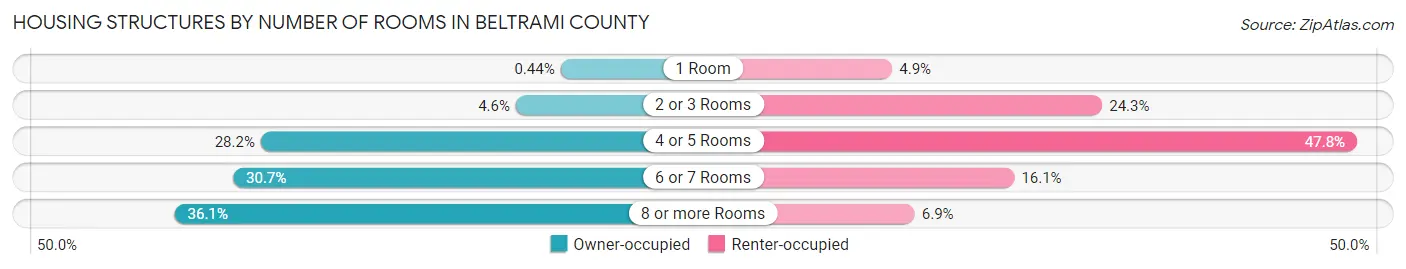
| Number of Rooms | Owner-occupied | Renter-occupied |
| 1 Room | 53 (0.4%) | 279 (4.9%) |
| 2 or 3 Rooms | 554 (4.6%) | 1,397 (24.3%) |
| 4 or 5 Rooms | 3,411 (28.2%) | 2,752 (47.8%) |
| 6 or 7 Rooms | 3,721 (30.7%) | 929 (16.1%) |
| 8 or more Rooms | 4,375 (36.1%) | 399 (6.9%) |
| Total | 12,114 (100.0%) | 5,756 (100.0%) |
Housing Structure by Heating Type in Beltrami County
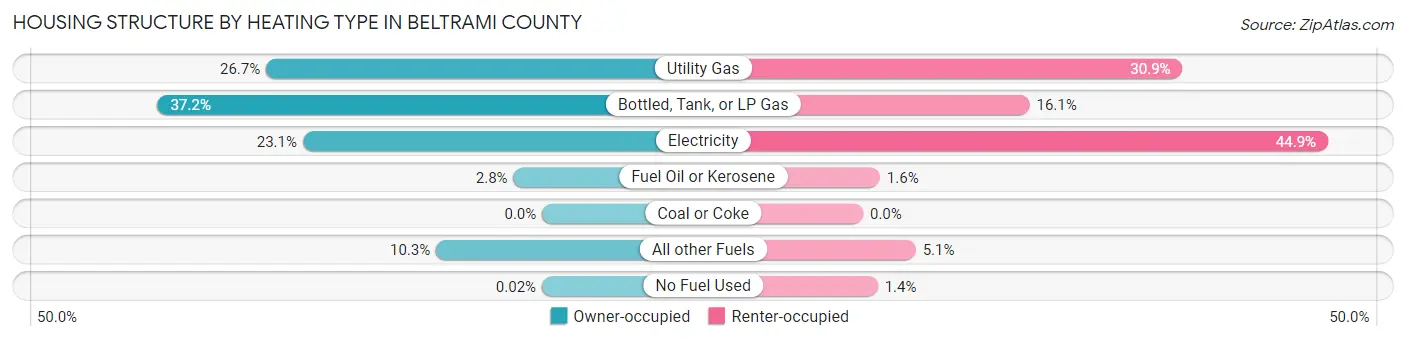
| Heating Type | Owner-occupied | Renter-occupied |
| Utility Gas | 3,231 (26.7%) | 1,776 (30.8%) |
| Bottled, Tank, or LP Gas | 4,502 (37.2%) | 926 (16.1%) |
| Electricity | 2,801 (23.1%) | 2,585 (44.9%) |
| Fuel Oil or Kerosene | 336 (2.8%) | 94 (1.6%) |
| Coal or Coke | 0 (0.0%) | 0 (0.0%) |
| All other Fuels | 1,242 (10.2%) | 293 (5.1%) |
| No Fuel Used | 2 (0.0%) | 82 (1.4%) |
| Total | 12,114 (100.0%) | 5,756 (100.0%) |
Household Vehicle Usage in Beltrami County
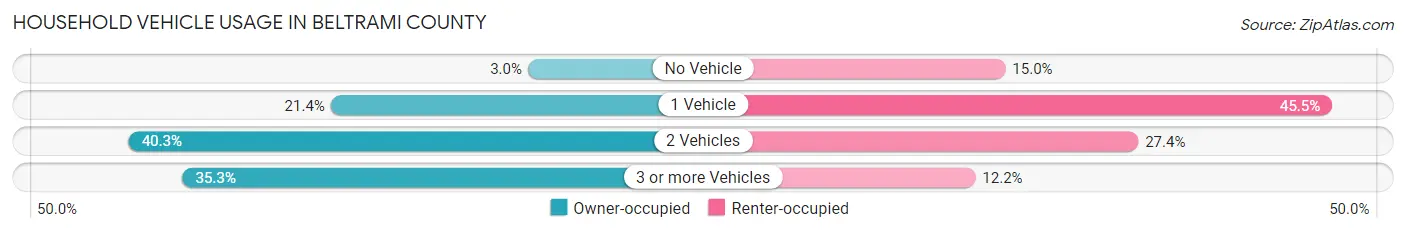
| Vehicles per Household | Owner-occupied | Renter-occupied |
| No Vehicle | 367 (3.0%) | 862 (15.0%) |
| 1 Vehicle | 2,596 (21.4%) | 2,617 (45.5%) |
| 2 Vehicles | 4,880 (40.3%) | 1,576 (27.4%) |
| 3 or more Vehicles | 4,271 (35.3%) | 701 (12.2%) |
| Total | 12,114 (100.0%) | 5,756 (100.0%) |
Real Estate & Mortgages in Beltrami County
Real Estate and Mortgage Overview in Beltrami County
| Characteristic | Without Mortgage | With Mortgage |
| Housing Units | 5,814 | 6,300 |
| Median Property Value | $187,600 | $216,300 |
| Median Household Income | $64,886 | $1,189 |
| Monthly Housing Costs | $560 | $237 |
| Real Estate Taxes | $2,079 | $388 |
Property Value by Mortgage Status in Beltrami County
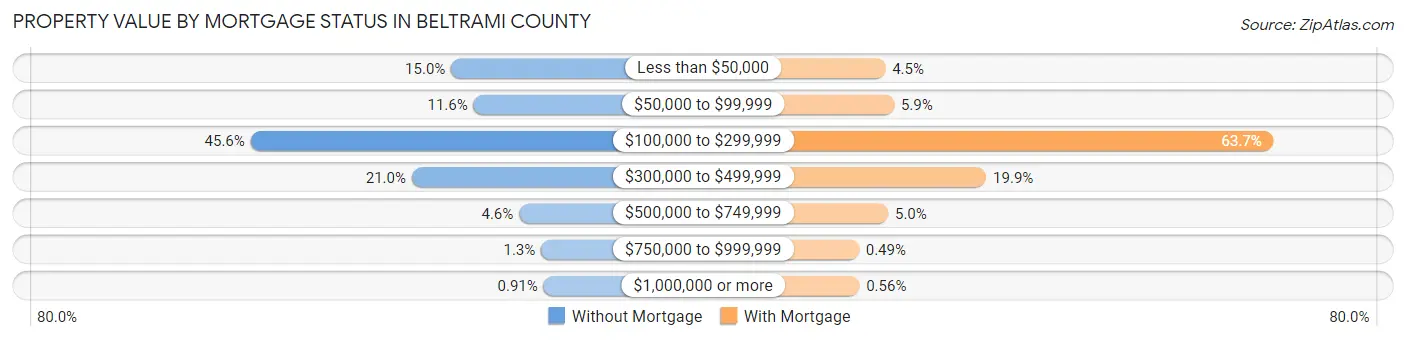
| Property Value | Without Mortgage | With Mortgage |
| Less than $50,000 | 872 (15.0%) | 285 (4.5%) |
| $50,000 to $99,999 | 674 (11.6%) | 369 (5.9%) |
| $100,000 to $299,999 | 2,649 (45.6%) | 4,014 (63.7%) |
| $300,000 to $499,999 | 1,221 (21.0%) | 1,254 (19.9%) |
| $500,000 to $749,999 | 270 (4.6%) | 312 (5.0%) |
| $750,000 to $999,999 | 75 (1.3%) | 31 (0.5%) |
| $1,000,000 or more | 53 (0.9%) | 35 (0.6%) |
| Total | 5,814 (100.0%) | 6,300 (100.0%) |
Household Income by Mortgage Status in Beltrami County
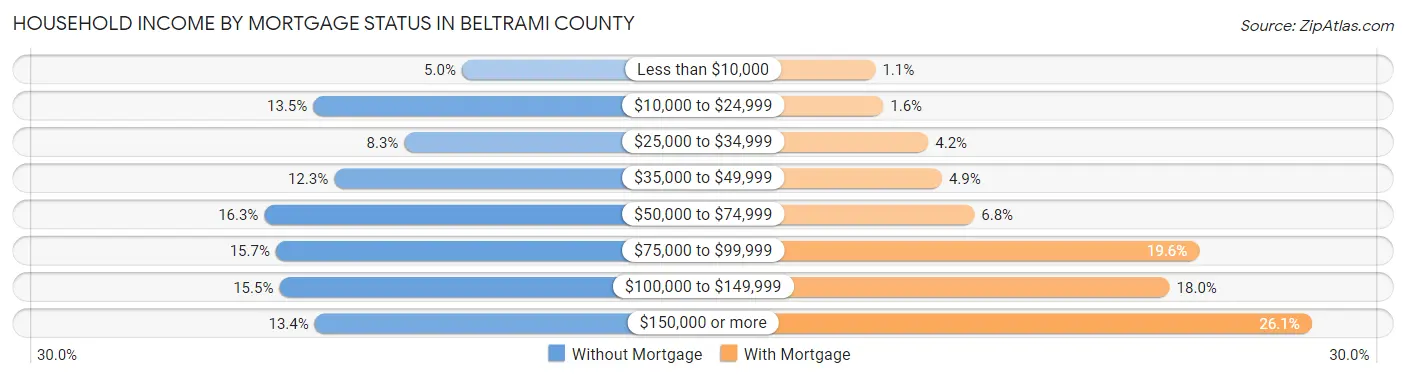
| Household Income | Without Mortgage | With Mortgage |
| Less than $10,000 | 292 (5.0%) | 72 (1.1%) |
| $10,000 to $24,999 | 786 (13.5%) | 100 (1.6%) |
| $25,000 to $34,999 | 483 (8.3%) | 262 (4.2%) |
| $35,000 to $49,999 | 716 (12.3%) | 311 (4.9%) |
| $50,000 to $74,999 | 948 (16.3%) | 428 (6.8%) |
| $75,000 to $99,999 | 910 (15.7%) | 1,237 (19.6%) |
| $100,000 to $149,999 | 898 (15.4%) | 1,131 (17.9%) |
| $150,000 or more | 781 (13.4%) | 1,642 (26.1%) |
| Total | 5,814 (100.0%) | 6,300 (100.0%) |
Property Value to Household Income Ratio in Beltrami County
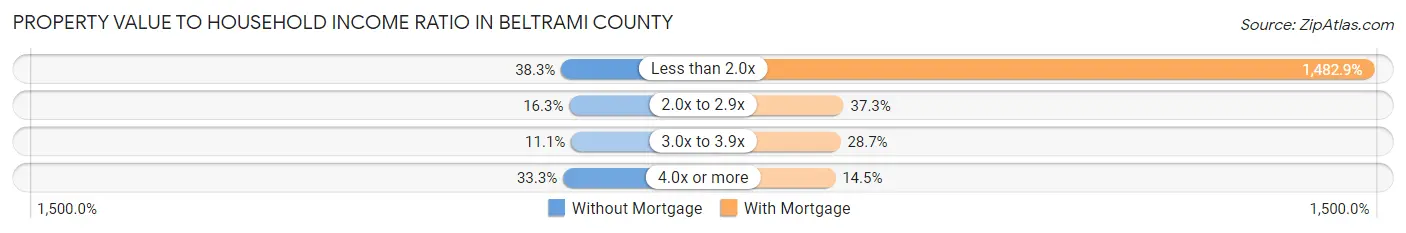
| Value-to-Income Ratio | Without Mortgage | With Mortgage |
| Less than 2.0x | 2,224 (38.3%) | 93,420 (1,482.9%) |
| 2.0x to 2.9x | 949 (16.3%) | 2,352 (37.3%) |
| 3.0x to 3.9x | 645 (11.1%) | 1,810 (28.7%) |
| 4.0x or more | 1,938 (33.3%) | 915 (14.5%) |
| Total | 5,814 (100.0%) | 6,300 (100.0%) |
Real Estate Taxes by Mortgage Status in Beltrami County
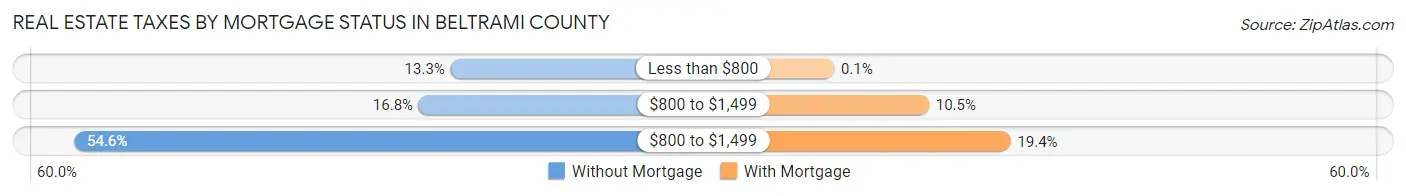
| Property Taxes | Without Mortgage | With Mortgage |
| Less than $800 | 774 (13.3%) | 6 (0.1%) |
| $800 to $1,499 | 976 (16.8%) | 661 (10.5%) |
| $800 to $1,499 | 3,173 (54.6%) | 1,225 (19.4%) |
| Total | 5,814 (100.0%) | 6,300 (100.0%) |
Health & Disability in Beltrami County
Health Insurance Coverage by Age in Beltrami County
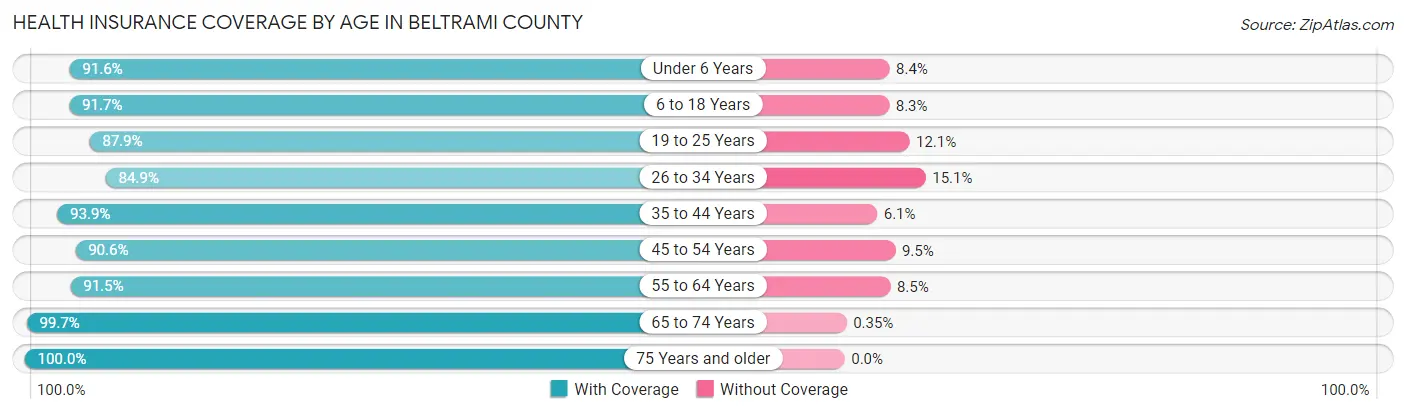
| Age Bracket | With Coverage | Without Coverage |
| Under 6 Years | 3,495 (91.6%) | 319 (8.4%) |
| 6 to 18 Years | 7,725 (91.7%) | 699 (8.3%) |
| 19 to 25 Years | 4,904 (87.9%) | 673 (12.1%) |
| 26 to 34 Years | 4,374 (84.9%) | 778 (15.1%) |
| 35 to 44 Years | 4,896 (93.9%) | 316 (6.1%) |
| 45 to 54 Years | 4,129 (90.5%) | 431 (9.5%) |
| 55 to 64 Years | 5,121 (91.5%) | 477 (8.5%) |
| 65 to 74 Years | 4,523 (99.7%) | 16 (0.4%) |
| 75 Years and older | 2,803 (100.0%) | 0 (0.0%) |
| Total | 41,970 (91.9%) | 3,709 (8.1%) |
Health Insurance Coverage by Citizenship Status in Beltrami County
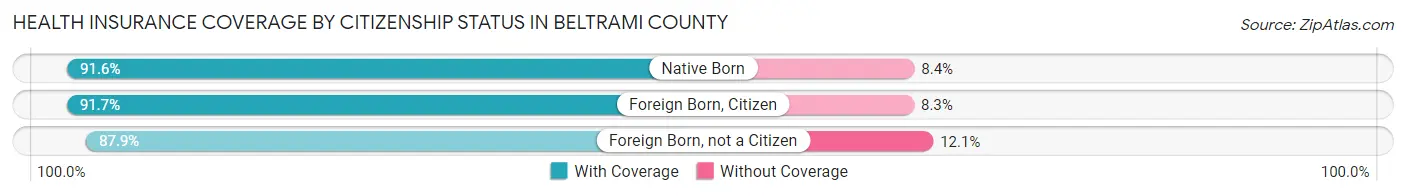
| Citizenship Status | With Coverage | Without Coverage |
| Native Born | 3,495 (91.6%) | 319 (8.4%) |
| Foreign Born, Citizen | 7,725 (91.7%) | 699 (8.3%) |
| Foreign Born, not a Citizen | 4,904 (87.9%) | 673 (12.1%) |
Health Insurance Coverage by Household Income in Beltrami County
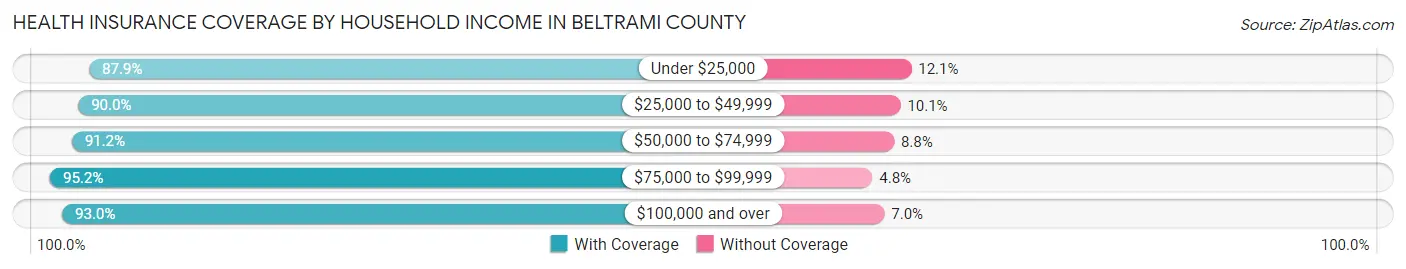
| Household Income | With Coverage | Without Coverage |
| Under $25,000 | 5,294 (87.9%) | 728 (12.1%) |
| $25,000 to $49,999 | 7,301 (89.9%) | 816 (10.1%) |
| $50,000 to $74,999 | 7,096 (91.2%) | 688 (8.8%) |
| $75,000 to $99,999 | 6,039 (95.2%) | 303 (4.8%) |
| $100,000 and over | 14,892 (93.0%) | 1,127 (7.0%) |
Public vs Private Health Insurance Coverage by Age in Beltrami County
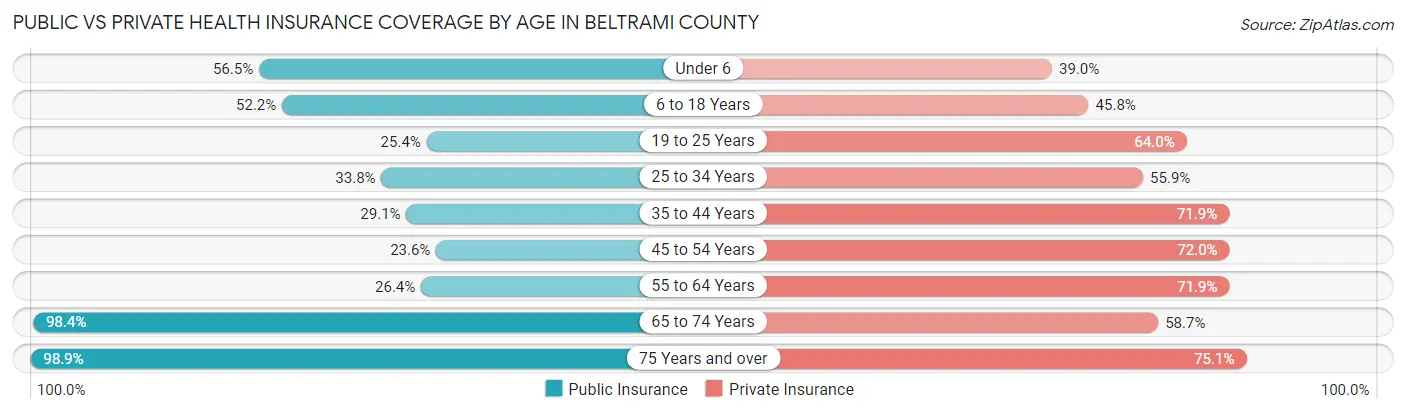
| Age Bracket | Public Insurance | Private Insurance |
| Under 6 | 2,155 (56.5%) | 1,489 (39.0%) |
| 6 to 18 Years | 4,397 (52.2%) | 3,860 (45.8%) |
| 19 to 25 Years | 1,415 (25.4%) | 3,568 (64.0%) |
| 25 to 34 Years | 1,740 (33.8%) | 2,882 (55.9%) |
| 35 to 44 Years | 1,518 (29.1%) | 3,746 (71.9%) |
| 45 to 54 Years | 1,076 (23.6%) | 3,281 (72.0%) |
| 55 to 64 Years | 1,478 (26.4%) | 4,026 (71.9%) |
| 65 to 74 Years | 4,468 (98.4%) | 2,666 (58.7%) |
| 75 Years and over | 2,773 (98.9%) | 2,104 (75.1%) |
| Total | 21,020 (46.0%) | 27,622 (60.5%) |
Disability Status by Sex by Age in Beltrami County
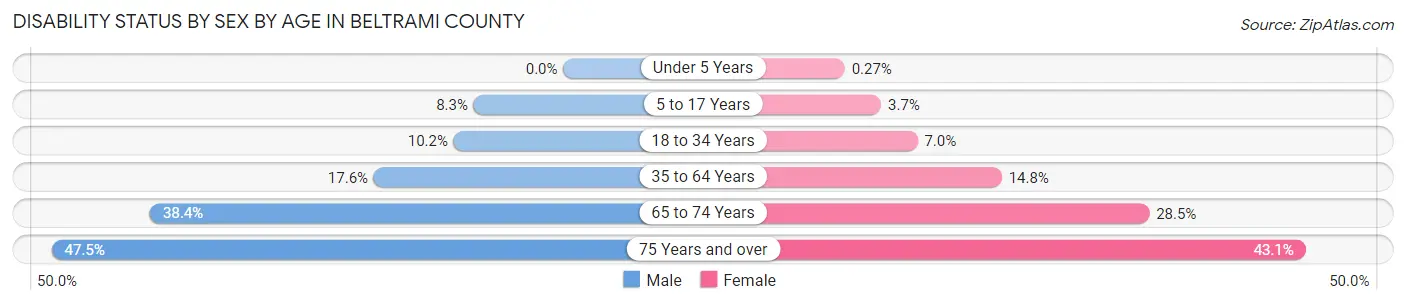
| Age Bracket | Male | Female |
| Under 5 Years | 0 (0.0%) | 4 (0.3%) |
| 5 to 17 Years | 362 (8.3%) | 147 (3.6%) |
| 18 to 34 Years | 602 (10.2%) | 394 (7.0%) |
| 35 to 64 Years | 1,354 (17.6%) | 1,138 (14.8%) |
| 65 to 74 Years | 881 (38.4%) | 640 (28.5%) |
| 75 Years and over | 569 (47.5%) | 691 (43.0%) |
Disability Class by Sex by Age in Beltrami County
Disability Class: Hearing Difficulty
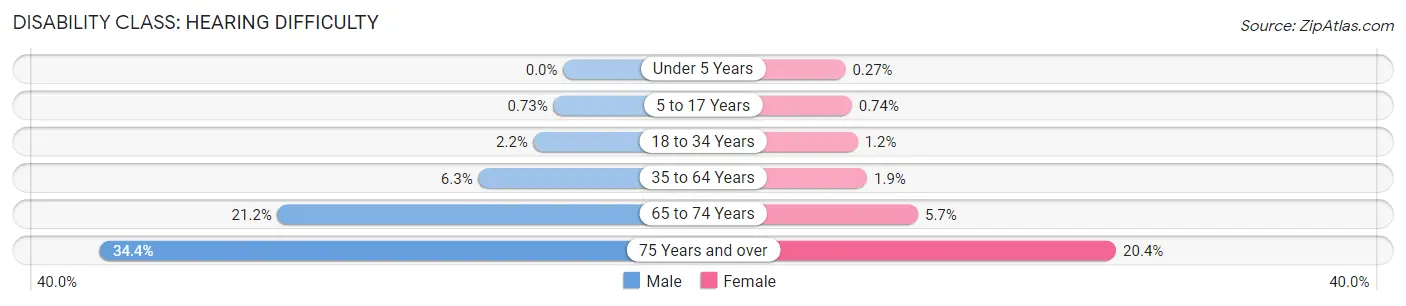
| Age Bracket | Male | Female |
| Under 5 Years | 0 (0.0%) | 4 (0.3%) |
| 5 to 17 Years | 32 (0.7%) | 30 (0.7%) |
| 18 to 34 Years | 130 (2.2%) | 66 (1.2%) |
| 35 to 64 Years | 485 (6.3%) | 144 (1.9%) |
| 65 to 74 Years | 487 (21.2%) | 127 (5.7%) |
| 75 Years and over | 412 (34.4%) | 327 (20.4%) |
Disability Class: Vision Difficulty
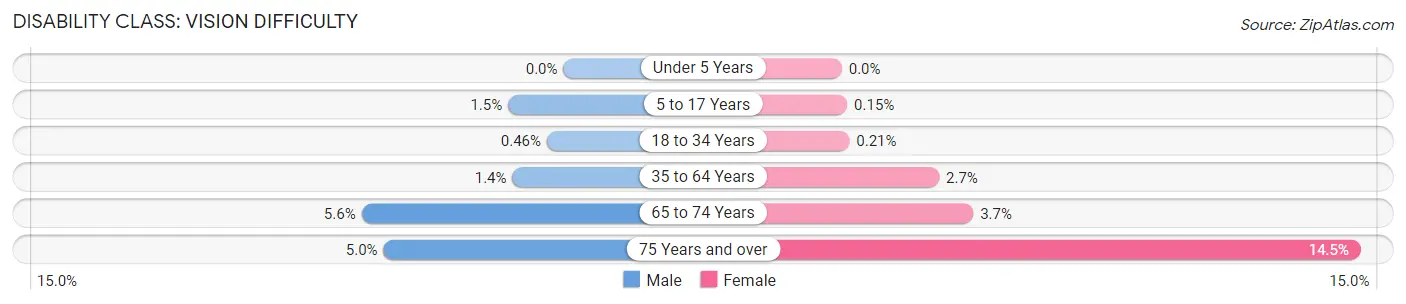
| Age Bracket | Male | Female |
| Under 5 Years | 0 (0.0%) | 0 (0.0%) |
| 5 to 17 Years | 67 (1.5%) | 6 (0.2%) |
| 18 to 34 Years | 27 (0.5%) | 12 (0.2%) |
| 35 to 64 Years | 109 (1.4%) | 208 (2.7%) |
| 65 to 74 Years | 129 (5.6%) | 82 (3.7%) |
| 75 Years and over | 60 (5.0%) | 232 (14.4%) |
Disability Class: Cognitive Difficulty
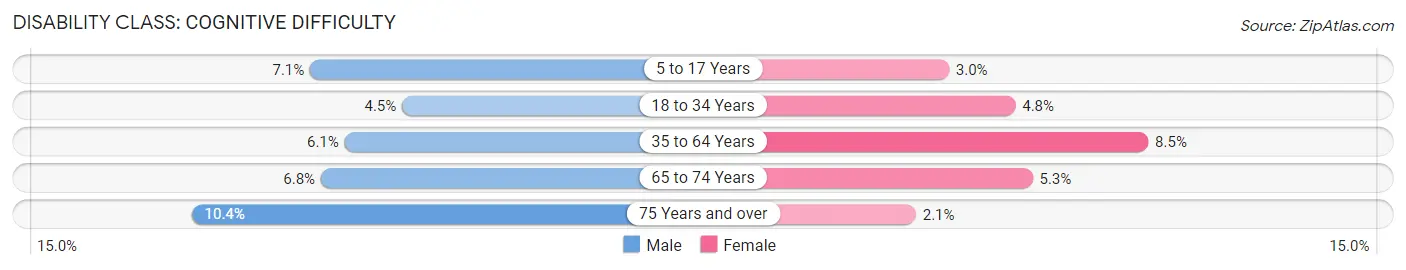
| Age Bracket | Male | Female |
| 5 to 17 Years | 307 (7.0%) | 120 (3.0%) |
| 18 to 34 Years | 266 (4.5%) | 271 (4.8%) |
| 35 to 64 Years | 469 (6.1%) | 654 (8.5%) |
| 65 to 74 Years | 155 (6.8%) | 119 (5.3%) |
| 75 Years and over | 124 (10.3%) | 33 (2.1%) |
Disability Class: Ambulatory Difficulty
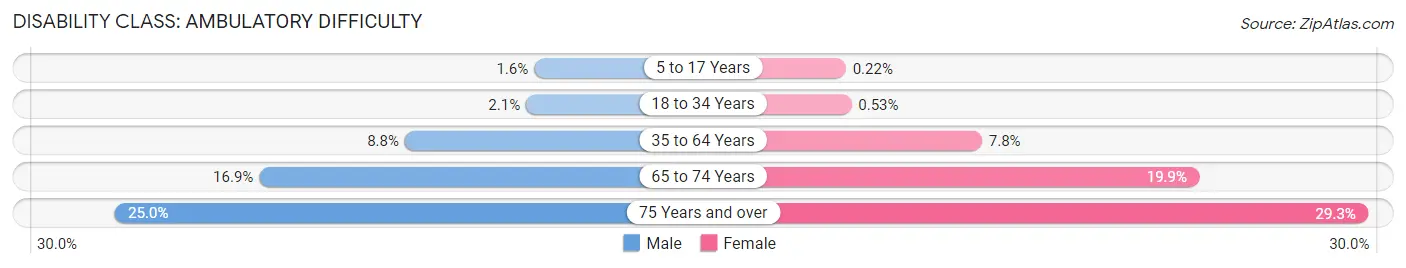
| Age Bracket | Male | Female |
| 5 to 17 Years | 71 (1.6%) | 9 (0.2%) |
| 18 to 34 Years | 123 (2.1%) | 30 (0.5%) |
| 35 to 64 Years | 680 (8.8%) | 598 (7.8%) |
| 65 to 74 Years | 389 (16.9%) | 446 (19.9%) |
| 75 Years and over | 299 (25.0%) | 470 (29.3%) |
Disability Class: Self-Care Difficulty
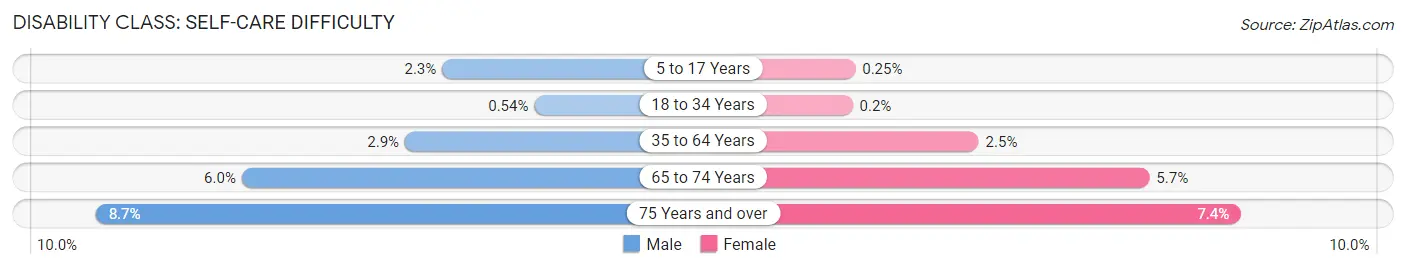
| Age Bracket | Male | Female |
| 5 to 17 Years | 98 (2.2%) | 10 (0.3%) |
| 18 to 34 Years | 32 (0.5%) | 11 (0.2%) |
| 35 to 64 Years | 226 (2.9%) | 195 (2.5%) |
| 65 to 74 Years | 137 (6.0%) | 128 (5.7%) |
| 75 Years and over | 104 (8.7%) | 119 (7.4%) |
Technology Access in Beltrami County
Computing Device Access in Beltrami County
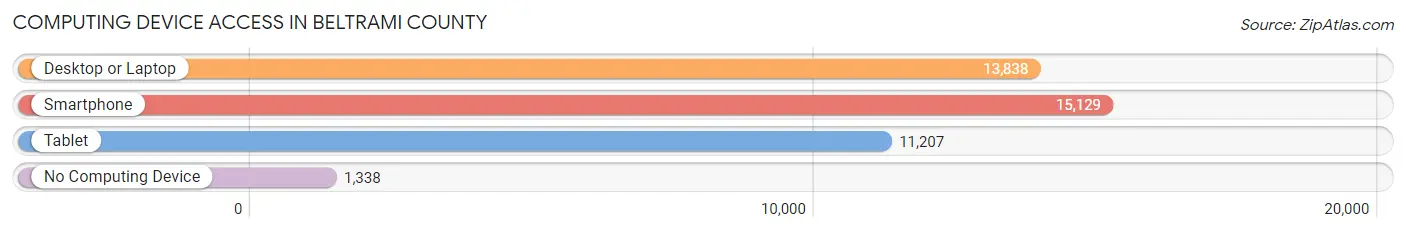
| Device Type | # Households | % Households |
| Desktop or Laptop | 13,838 | 77.4% |
| Smartphone | 15,129 | 84.7% |
| Tablet | 11,207 | 62.7% |
| No Computing Device | 1,338 | 7.5% |
| Total | 17,870 | 100.0% |
Internet Access in Beltrami County
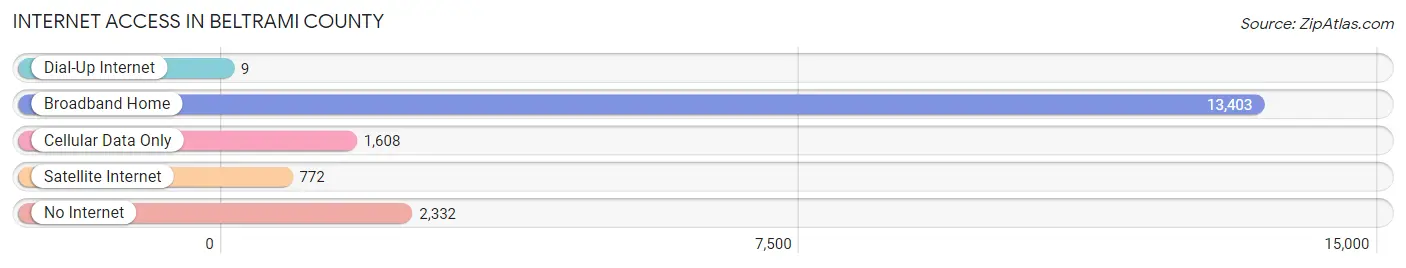
| Internet Type | # Households | % Households |
| Dial-Up Internet | 9 | 0.1% |
| Broadband Home | 13,403 | 75.0% |
| Cellular Data Only | 1,608 | 9.0% |
| Satellite Internet | 772 | 4.3% |
| No Internet | 2,332 | 13.1% |
| Total | 17,870 | 100.0% |
Beltrami County Summary
Beltrami County is located in the northern part of Minnesota, and is the largest county in the state. It is bordered by Clearwater County to the north, Hubbard County to the east, Cass County to the south, and Roseau County to the west. The county seat is Bemidji, and the county is named after Giacomo Beltrami, an Italian explorer who visited the area in 1825.
Geography
Beltrami County covers an area of 2,902 square miles, making it the largest county in Minnesota. The county is located in the northern part of the state, and is part of the Red River Valley region. The terrain is mostly flat, with some rolling hills in the western part of the county. The county is home to several lakes, including Lake Bemidji, Lake Irving, and Lake Plantagenet. The county is also home to the Red Lake Indian Reservation, which covers a large portion of the county.
The county is home to several state parks, including Itasca State Park, which is the oldest and largest state park in Minnesota. The park is home to the headwaters of the Mississippi River, and is a popular destination for camping, hiking, and fishing. Other parks in the county include Lake Bemidji State Park, Lake Irving State Park, and Red Lake State Park.
Climate
Beltrami County has a humid continental climate, with cold winters and warm summers. The average annual temperature is 40°F, and the average annual precipitation is 28 inches. The county is prone to severe weather, including thunderstorms, tornadoes, and blizzards.
Demographics
As of the 2010 census, the population of Beltrami County was 44,442. The population is mostly white (90.2%), with small percentages of Native American (4.3%), African American (2.2%), Asian (1.2%), and Hispanic or Latino (1.1%) populations. The median household income is $45,845, and the median home value is $133,400.
Economy
Beltrami County’s economy is largely based on agriculture, forestry, and tourism. The county is home to several large farms, and is a major producer of corn, soybeans, and wheat. The county is also home to several timber companies, and is a major producer of lumber and paper products. Tourism is also an important part of the economy, with visitors coming to the county to enjoy the many lakes, parks, and outdoor activities.
The county is home to several large employers, including Bemidji State University, Sanford Health, and the Red Lake Nation. The county is also home to several manufacturing companies, including Polaris Industries, which produces snowmobiles and all-terrain vehicles.
History
Beltrami County was established in 1866, and was named after Giacomo Beltrami, an Italian explorer who visited the area in 1825. The county was originally home to the Ojibwe people, who had lived in the area for centuries. The county was largely rural until the early 20th century, when the logging and farming industries began to grow.
In the late 19th century, the county was home to several large logging companies, and the timber industry was a major part of the economy. The county was also home to several large farms, and the agricultural industry was an important part of the economy.
In the early 20th century, the county began to develop, and the population began to grow. The county was home to several large employers, including Bemidji State University, which was founded in 1919. The county also began to attract tourists, and the tourism industry became an important part of the economy.
Today, Beltrami County is a thriving community, with a diverse economy and a growing population. The county is home to several large employers, and is a popular destination for tourists. The county is also home to several state parks, and is a popular destination for outdoor activities.
Common Questions
What is the Total Population of Beltrami County?
Total Population of Beltrami County is 46,274.
What is the Total Male Population of Beltrami County?
Total Male Population of Beltrami County is 23,299.
What is the Total Female Population of Beltrami County?
Total Female Population of Beltrami County is 22,975.
What is the Ratio of Males per 100 Females in Beltrami County?
There are 101.41 Males per 100 Females in Beltrami County.
What is the Ratio of Females per 100 Males in Beltrami County?
There are 98.61 Females per 100 Males in Beltrami County.
What is the Median Population Age in Beltrami County?
Median Population Age in Beltrami County is 35.0 Years.
What is the Average Family Size in Beltrami County
Average Family Size in Beltrami County is 3.0 People.
What is the Average Household Size in Beltrami County
Average Household Size in Beltrami County is 2.5 People.
What is Per Capita Income in Beltrami County?
Per Capita income in Beltrami County is $32,055.
What is the Median Family Income in Beltrami County?
Median Family Income in Beltrami County is $80,795.
What is the Median Household income in Beltrami County?
Median Household Income in Beltrami County is $62,173.
What is Income or Wage Gap in Beltrami County?
Income or Wage Gap in Beltrami County is 22.6%.
Women in Beltrami County earn 77.4 cents for every dollar earned by a man.
What is Family Income Deficit in Beltrami County?
Family Income Deficit in Beltrami County is $11,291.
Families that are below poverty line in Beltrami County earn $11,291 less on average than the poverty threshold level.
What is Inequality or Gini Index in Beltrami County?
Inequality or Gini Index in Beltrami County is 0.44.
How Large is the Labor Force in Beltrami County?
There are 22,682 People in the Labor Forcein in Beltrami County.
What is the Percentage of People in the Labor Force in Beltrami County?
63.0% of People are in the Labor Force in Beltrami County.
What is the Unemployment Rate in Beltrami County?
Unemployment Rate in Beltrami County is 5.4%.