Anoka County, MN
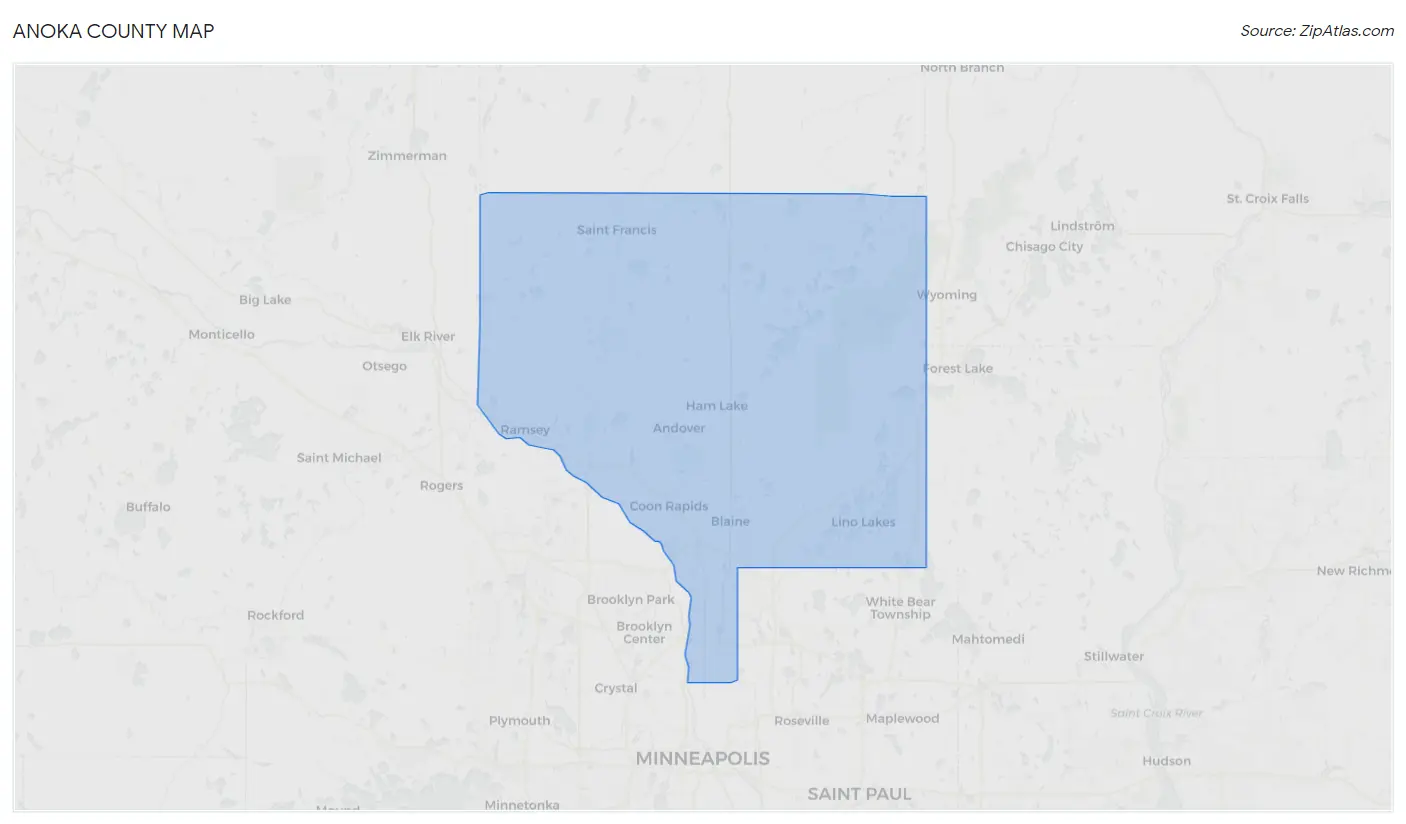
Anoka County Map
Anoka County Overview
363,985
TOTAL POPULATION
183,494
MALE POPULATION
180,491
FEMALE POPULATION
101.66
MALES / 100 FEMALES
98.36
FEMALES / 100 MALES
38.8
MEDIAN AGE
3.2
AVG FAMILY SIZE
2.7
AVG HOUSEHOLD SIZE
$43,106
PER CAPITA INCOME
$110,651
AVG FAMILY INCOME
$95,782
AVG HOUSEHOLD INCOME
25.8%
WAGE / INCOME GAP [ % ]
74.2¢/ $1
WAGE / INCOME GAP [ $ ]
$9,992
FAMILY INCOME DEFICIT
0.39
INEQUALITY / GINI INDEX
202,932
LABOR FORCE [ PEOPLE ]
70.4%
PERCENT IN LABOR FORCE
4.0%
UNEMPLOYMENT RATE
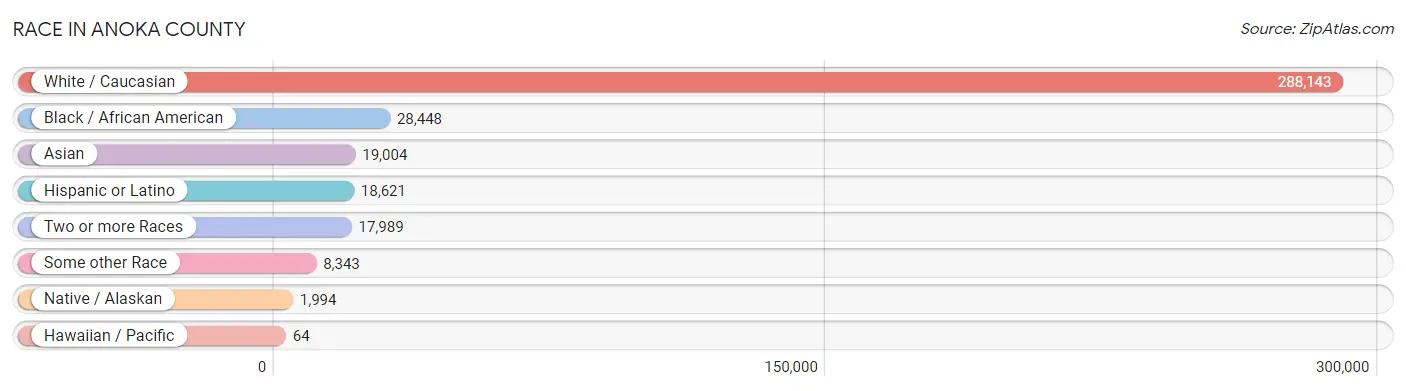
Race in Anoka County
The most populous races in Anoka County are White / Caucasian (288,143 | 79.2%), Black / African American (28,448 | 7.8%), and Asian (19,004 | 5.2%).
| Race | # Population | % Population |
| Asian | 19,004 | 5.2% |
| Black / African American | 28,448 | 7.8% |
| Hawaiian / Pacific | 64 | 0.0% |
| Hispanic or Latino | 18,621 | 5.1% |
| Native / Alaskan | 1,994 | 0.5% |
| White / Caucasian | 288,143 | 79.2% |
| Two or more Races | 17,989 | 4.9% |
| Some other Race | 8,343 | 2.3% |
| Total | 363,985 | 100.0% |
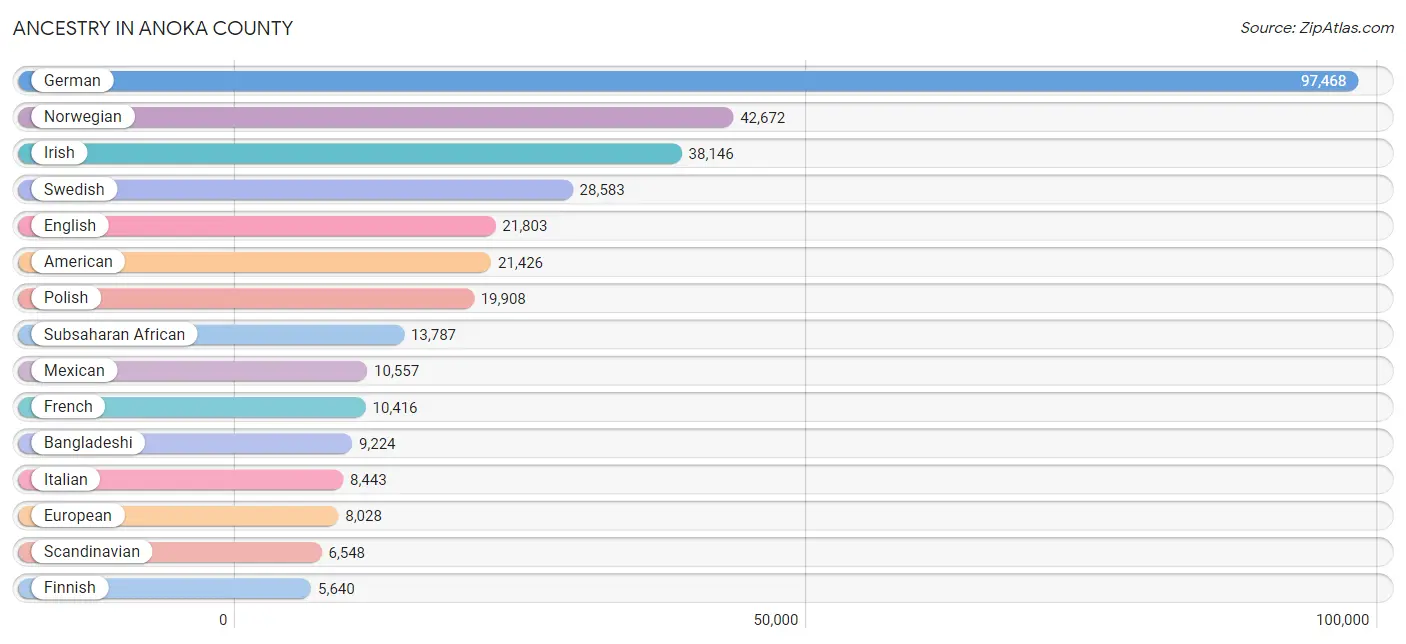
Ancestry in Anoka County
The most populous ancestries reported in Anoka County are German (97,468 | 26.8%), Norwegian (42,672 | 11.7%), Irish (38,146 | 10.5%), Swedish (28,583 | 7.9%), and English (21,803 | 6.0%), together accounting for 62.8% of all Anoka County residents.
| Ancestry | # Population | % Population |
| Afghan | 67 | 0.0% |
| African | 3,003 | 0.8% |
| Alaska Native | 4 | 0.0% |
| Albanian | 45 | 0.0% |
| Alsatian | 11 | 0.0% |
| American | 21,426 | 5.9% |
| Arab | 4,522 | 1.2% |
| Argentinean | 60 | 0.0% |
| Armenian | 155 | 0.0% |
| Australian | 42 | 0.0% |
| Austrian | 899 | 0.3% |
| Bahamian | 20 | 0.0% |
| Bangladeshi | 9,224 | 2.5% |
| Basque | 11 | 0.0% |
| Belgian | 375 | 0.1% |
| Bhutanese | 725 | 0.2% |
| Blackfeet | 160 | 0.0% |
| Brazilian | 128 | 0.0% |
| British | 1,020 | 0.3% |
| Bulgarian | 74 | 0.0% |
| Burmese | 1,795 | 0.5% |
| Cajun | 5 | 0.0% |
| Canadian | 414 | 0.1% |
| Carpatho Rusyn | 10 | 0.0% |
| Celtic | 11 | 0.0% |
| Central American | 1,694 | 0.5% |
| Central American Indian | 50 | 0.0% |
| Cherokee | 254 | 0.1% |
| Cheyenne | 6 | 0.0% |
| Chilean | 102 | 0.0% |
| Chippewa | 2,194 | 0.6% |
| Choctaw | 28 | 0.0% |
| Colombian | 439 | 0.1% |
| Costa Rican | 166 | 0.1% |
| Cree | 14 | 0.0% |
| Creek | 13 | 0.0% |
| Croatian | 685 | 0.2% |
| Crow | 13 | 0.0% |
| Cuban | 318 | 0.1% |
| Czech | 4,304 | 1.2% |
| Czechoslovakian | 642 | 0.2% |
| Danish | 3,562 | 1.0% |
| Dominican | 87 | 0.0% |
| Dutch | 3,643 | 1.0% |
| Eastern European | 977 | 0.3% |
| Ecuadorian | 2,611 | 0.7% |
| Egyptian | 899 | 0.3% |
| English | 21,803 | 6.0% |
| Estonian | 17 | 0.0% |
| Ethiopian | 3,093 | 0.9% |
| European | 8,028 | 2.2% |
| Filipino | 49 | 0.0% |
| Finnish | 5,640 | 1.5% |
| French | 10,416 | 2.9% |
| French American Indian | 296 | 0.1% |
| French Canadian | 3,811 | 1.1% |
| German | 97,468 | 26.8% |
| German Russian | 8 | 0.0% |
| Ghanaian | 240 | 0.1% |
| Greek | 578 | 0.2% |
| Guamanian / Chamorro | 125 | 0.0% |
| Guatemalan | 269 | 0.1% |
| Guyanese | 197 | 0.1% |
| Haitian | 12 | 0.0% |
| Honduran | 114 | 0.0% |
| Hungarian | 799 | 0.2% |
| Icelander | 173 | 0.1% |
| Indian (Asian) | 2,095 | 0.6% |
| Inupiat | 53 | 0.0% |
| Iranian | 18 | 0.0% |
| Iraqi | 1,090 | 0.3% |
| Irish | 38,146 | 10.5% |
| Iroquois | 97 | 0.0% |
| Italian | 8,443 | 2.3% |
| Jamaican | 276 | 0.1% |
| Japanese | 252 | 0.1% |
| Jordanian | 349 | 0.1% |
| Kenyan | 801 | 0.2% |
| Kiowa | 9 | 0.0% |
| Korean | 1,828 | 0.5% |
| Laotian | 19 | 0.0% |
| Latvian | 169 | 0.1% |
| Lebanese | 640 | 0.2% |
| Liberian | 808 | 0.2% |
| Lithuanian | 364 | 0.1% |
| Lumbee | 31 | 0.0% |
| Luxembourger | 173 | 0.1% |
| Macedonian | 38 | 0.0% |
| Malaysian | 862 | 0.2% |
| Mexican | 10,557 | 2.9% |
| Mexican American Indian | 215 | 0.1% |
| Mongolian | 9 | 0.0% |
| Moroccan | 231 | 0.1% |
| Native Hawaiian | 58 | 0.0% |
| Navajo | 20 | 0.0% |
| Nicaraguan | 181 | 0.1% |
| Nigerian | 716 | 0.2% |
| Northern European | 677 | 0.2% |
| Norwegian | 42,672 | 11.7% |
| Pakistani | 290 | 0.1% |
| Palestinian | 314 | 0.1% |
| Panamanian | 128 | 0.0% |
| Paraguayan | 25 | 0.0% |
| Pennsylvania German | 44 | 0.0% |
| Peruvian | 165 | 0.1% |
| Polish | 19,908 | 5.5% |
| Portuguese | 263 | 0.1% |
| Potawatomi | 6 | 0.0% |
| Puerto Rican | 736 | 0.2% |
| Romanian | 455 | 0.1% |
| Russian | 1,984 | 0.5% |
| Salvadoran | 836 | 0.2% |
| Samoan | 52 | 0.0% |
| Scandinavian | 6,548 | 1.8% |
| Scotch-Irish | 1,647 | 0.4% |
| Scottish | 3,933 | 1.1% |
| Serbian | 104 | 0.0% |
| Sierra Leonean | 12 | 0.0% |
| Sioux | 412 | 0.1% |
| Slavic | 145 | 0.0% |
| Slovak | 597 | 0.2% |
| Slovene | 322 | 0.1% |
| Somali | 4,414 | 1.2% |
| South African | 10 | 0.0% |
| South American | 3,982 | 1.1% |
| South American Indian | 118 | 0.0% |
| Spaniard | 100 | 0.0% |
| Spanish | 176 | 0.1% |
| Spanish American | 24 | 0.0% |
| Sri Lankan | 3,215 | 0.9% |
| Subsaharan African | 13,787 | 3.8% |
| Sudanese | 147 | 0.0% |
| Swedish | 28,583 | 7.9% |
| Swiss | 829 | 0.2% |
| Syrian | 41 | 0.0% |
| Thai | 2,372 | 0.6% |
| Tlingit-Haida | 13 | 0.0% |
| Tongan | 22 | 0.0% |
| Turkish | 23 | 0.0% |
| U.S. Virgin Islander | 26 | 0.0% |
| Ugandan | 45 | 0.0% |
| Ukrainian | 1,714 | 0.5% |
| Uruguayan | 157 | 0.0% |
| Venezuelan | 195 | 0.1% |
| Vietnamese | 92 | 0.0% |
| Welsh | 1,365 | 0.4% |
| West Indian | 145 | 0.0% |
| Yugoslavian | 766 | 0.2% | View All 148 Rows |
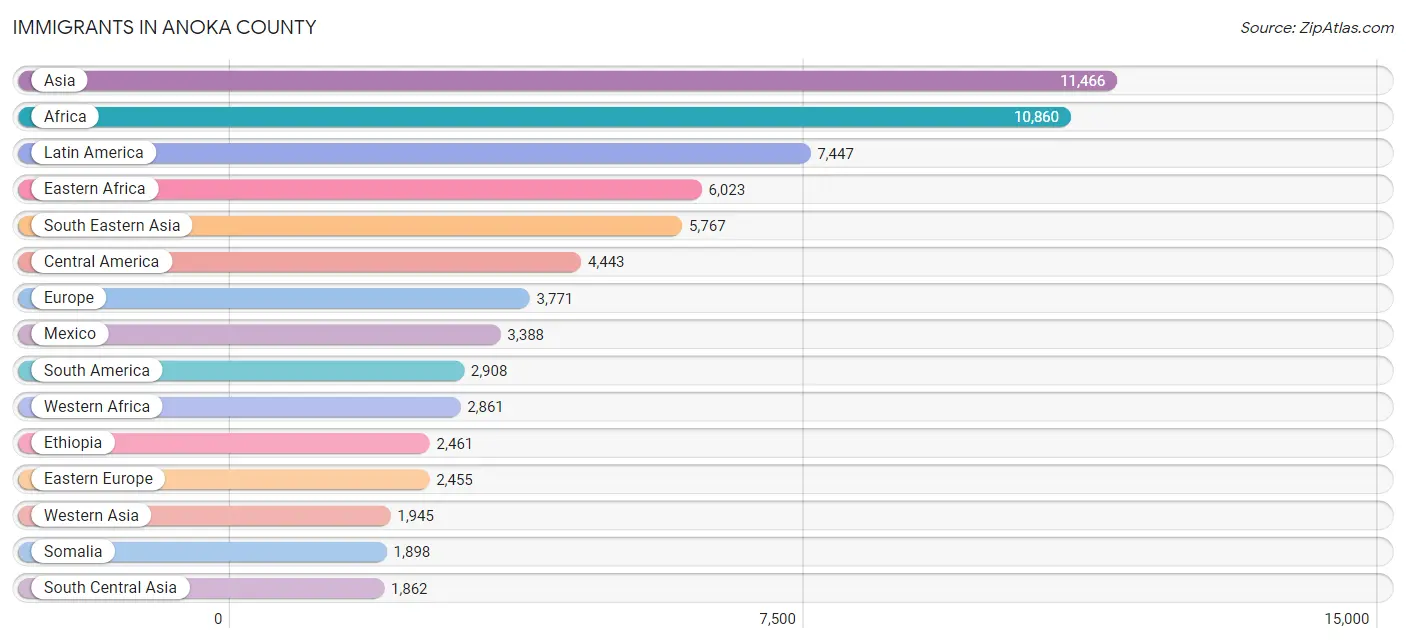
Immigrants in Anoka County
The most numerous immigrant groups reported in Anoka County came from Asia (11,466 | 3.2%), Africa (10,860 | 3.0%), Latin America (7,447 | 2.1%), Eastern Africa (6,023 | 1.7%), and South Eastern Asia (5,767 | 1.6%), together accounting for 11.4% of all Anoka County residents.
| Immigration Origin | # Population | % Population |
| Afghanistan | 40 | 0.0% |
| Africa | 10,860 | 3.0% |
| Argentina | 8 | 0.0% |
| Asia | 11,466 | 3.2% |
| Australia | 23 | 0.0% |
| Austria | 22 | 0.0% |
| Bahamas | 23 | 0.0% |
| Bangladesh | 28 | 0.0% |
| Barbados | 5 | 0.0% |
| Belarus | 186 | 0.1% |
| Bosnia and Herzegovina | 493 | 0.1% |
| Brazil | 71 | 0.0% |
| Cambodia | 47 | 0.0% |
| Cameroon | 624 | 0.2% |
| Canada | 505 | 0.1% |
| Caribbean | 96 | 0.0% |
| Central America | 4,443 | 1.2% |
| Chile | 22 | 0.0% |
| China | 898 | 0.3% |
| Colombia | 320 | 0.1% |
| Congo | 46 | 0.0% |
| Costa Rica | 58 | 0.0% |
| Croatia | 61 | 0.0% |
| Cuba | 19 | 0.0% |
| Denmark | 5 | 0.0% |
| Dominican Republic | 38 | 0.0% |
| Eastern Africa | 6,023 | 1.7% |
| Eastern Asia | 1,794 | 0.5% |
| Eastern Europe | 2,455 | 0.7% |
| Ecuador | 1,425 | 0.4% |
| Egypt | 571 | 0.2% |
| El Salvador | 463 | 0.1% |
| England | 122 | 0.0% |
| Eritrea | 243 | 0.1% |
| Ethiopia | 2,461 | 0.7% |
| Europe | 3,771 | 1.0% |
| France | 88 | 0.0% |
| Germany | 488 | 0.1% |
| Ghana | 384 | 0.1% |
| Greece | 50 | 0.0% |
| Guatemala | 195 | 0.1% |
| Guyana | 579 | 0.2% |
| Honduras | 234 | 0.1% |
| Hong Kong | 58 | 0.0% |
| Hungary | 49 | 0.0% |
| India | 1,288 | 0.4% |
| Indonesia | 9 | 0.0% |
| Iran | 17 | 0.0% |
| Iraq | 1,117 | 0.3% |
| Italy | 91 | 0.0% |
| Jamaica | 11 | 0.0% |
| Japan | 90 | 0.0% |
| Jordan | 288 | 0.1% |
| Kazakhstan | 40 | 0.0% |
| Kenya | 1,147 | 0.3% |
| Korea | 806 | 0.2% |
| Kuwait | 55 | 0.0% |
| Laos | 1,760 | 0.5% |
| Latin America | 7,447 | 2.1% |
| Latvia | 67 | 0.0% |
| Lebanon | 104 | 0.0% |
| Liberia | 1,512 | 0.4% |
| Lithuania | 26 | 0.0% |
| Malaysia | 47 | 0.0% |
| Mexico | 3,388 | 0.9% |
| Middle Africa | 731 | 0.2% |
| Moldova | 272 | 0.1% |
| Morocco | 198 | 0.1% |
| Nepal | 94 | 0.0% |
| Netherlands | 60 | 0.0% |
| Nicaragua | 92 | 0.0% |
| Nigeria | 474 | 0.1% |
| North Macedonia | 26 | 0.0% |
| Northern Africa | 861 | 0.2% |
| Northern Europe | 475 | 0.1% |
| Norway | 12 | 0.0% |
| Oceania | 35 | 0.0% |
| Pakistan | 301 | 0.1% |
| Panama | 13 | 0.0% |
| Peru | 132 | 0.0% |
| Philippines | 681 | 0.2% |
| Poland | 195 | 0.1% |
| Portugal | 25 | 0.0% |
| Romania | 52 | 0.0% |
| Russia | 199 | 0.1% |
| Saudi Arabia | 117 | 0.0% |
| Scotland | 30 | 0.0% |
| Senegal | 26 | 0.0% |
| Serbia | 29 | 0.0% |
| Sierra Leone | 110 | 0.0% |
| Singapore | 10 | 0.0% |
| Somalia | 1,898 | 0.5% |
| South America | 2,908 | 0.8% |
| South Central Asia | 1,862 | 0.5% |
| South Eastern Asia | 5,767 | 1.6% |
| Southern Europe | 176 | 0.1% |
| Spain | 10 | 0.0% |
| Sri Lanka | 54 | 0.0% |
| Sudan | 76 | 0.0% |
| Sweden | 39 | 0.0% |
| Switzerland | 7 | 0.0% |
| Syria | 82 | 0.0% |
| Taiwan | 41 | 0.0% |
| Thailand | 1,389 | 0.4% |
| Turkey | 2 | 0.0% |
| Uganda | 71 | 0.0% |
| Ukraine | 680 | 0.2% |
| Venezuela | 251 | 0.1% |
| Vietnam | 1,824 | 0.5% |
| Western Africa | 2,861 | 0.8% |
| Western Asia | 1,945 | 0.5% |
| Western Europe | 665 | 0.2% |
| Yemen | 91 | 0.0% |
| Zaire | 61 | 0.0% | View All 114 Rows |
Sex and Age in Anoka County
Sex and Age in Anoka County
The most populous age groups in Anoka County are 10 to 14 Years (13,618 | 7.4%) for men and 10 to 14 Years (12,896 | 7.1%) for women.
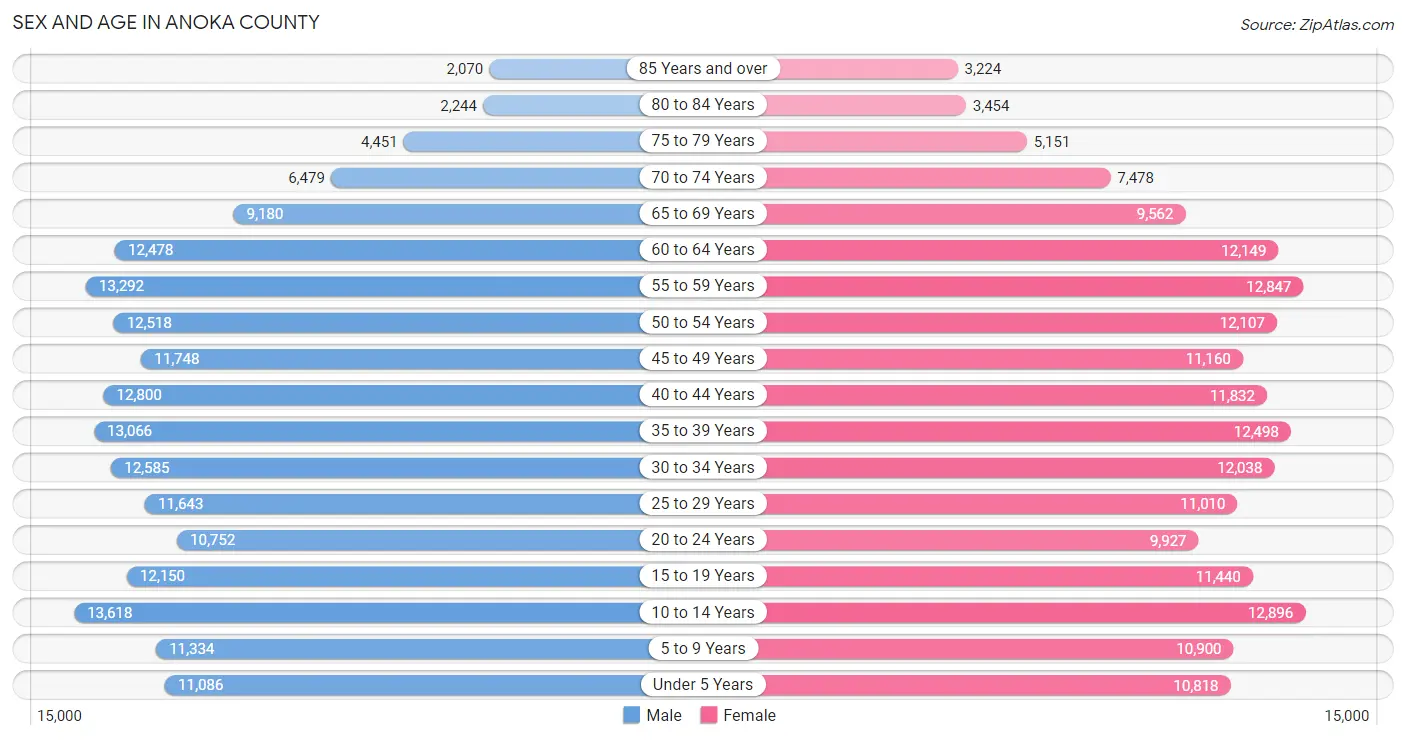
| Age Bracket | Male | Female |
| Under 5 Years | 11,086 (6.0%) | 10,818 (6.0%) |
| 5 to 9 Years | 11,334 (6.2%) | 10,900 (6.0%) |
| 10 to 14 Years | 13,618 (7.4%) | 12,896 (7.1%) |
| 15 to 19 Years | 12,150 (6.6%) | 11,440 (6.3%) |
| 20 to 24 Years | 10,752 (5.9%) | 9,927 (5.5%) |
| 25 to 29 Years | 11,643 (6.4%) | 11,010 (6.1%) |
| 30 to 34 Years | 12,585 (6.9%) | 12,038 (6.7%) |
| 35 to 39 Years | 13,066 (7.1%) | 12,498 (6.9%) |
| 40 to 44 Years | 12,800 (7.0%) | 11,832 (6.6%) |
| 45 to 49 Years | 11,748 (6.4%) | 11,160 (6.2%) |
| 50 to 54 Years | 12,518 (6.8%) | 12,107 (6.7%) |
| 55 to 59 Years | 13,292 (7.2%) | 12,847 (7.1%) |
| 60 to 64 Years | 12,478 (6.8%) | 12,149 (6.7%) |
| 65 to 69 Years | 9,180 (5.0%) | 9,562 (5.3%) |
| 70 to 74 Years | 6,479 (3.5%) | 7,478 (4.1%) |
| 75 to 79 Years | 4,451 (2.4%) | 5,151 (2.9%) |
| 80 to 84 Years | 2,244 (1.2%) | 3,454 (1.9%) |
| 85 Years and over | 2,070 (1.1%) | 3,224 (1.8%) |
| Total | 183,494 (100.0%) | 180,491 (100.0%) |
Families and Households in Anoka County
Median Family Size in Anoka County
The median family size in Anoka County is 3.18 persons per family, with married-couple families (73,862 | 78.0%) accounting for the largest median family size of 3.22 persons per family. On the other hand, single male/father families (6,854 | 7.2%) represent the smallest median family size with 2.85 persons per family.
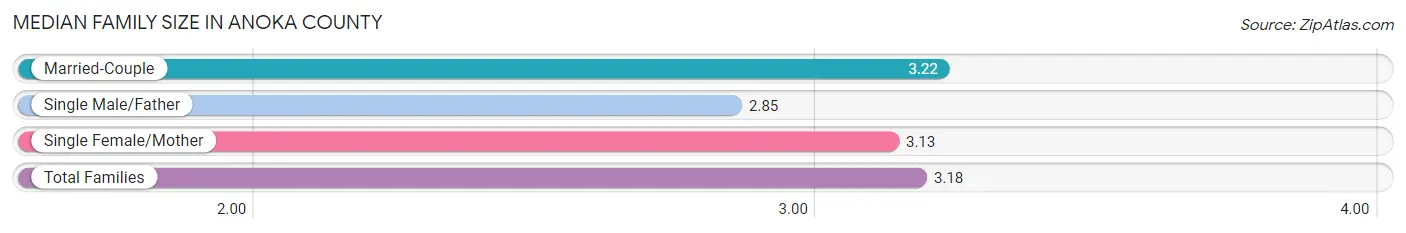
| Family Type | # Families | Family Size |
| Married-Couple | 73,862 (78.0%) | 3.22 |
| Single Male/Father | 6,854 (7.2%) | 2.85 |
| Single Female/Mother | 13,939 (14.7%) | 3.13 |
| Total Families | 94,655 (100.0%) | 3.18 |
Median Household Size in Anoka County
The median household size in Anoka County is 2.68 persons per household, with single female/mother households (13,939 | 10.4%) accounting for the largest median household size of 3.42 persons per household. non-family households (39,735 | 29.6%) represent the smallest median household size with 1.30 persons per household.
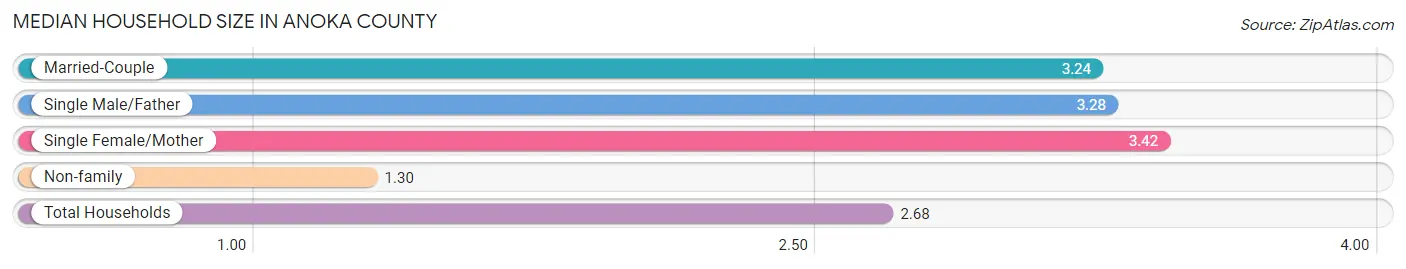
| Household Type | # Households | Household Size |
| Married-Couple | 73,862 (55.0%) | 3.24 |
| Single Male/Father | 6,854 (5.1%) | 3.28 |
| Single Female/Mother | 13,939 (10.4%) | 3.42 |
| Non-family | 39,735 (29.6%) | 1.30 |
| Total Households | 134,390 (100.0%) | 2.68 |
Household Size by Marriage Status in Anoka County
Out of a total of 134,390 households in Anoka County, 94,655 (70.4%) are family households, while 39,735 (29.6%) are nonfamily households. The most numerous type of family households are 2-person households, comprising 41,691, and the most common type of nonfamily households are 1-person households, comprising 30,713.
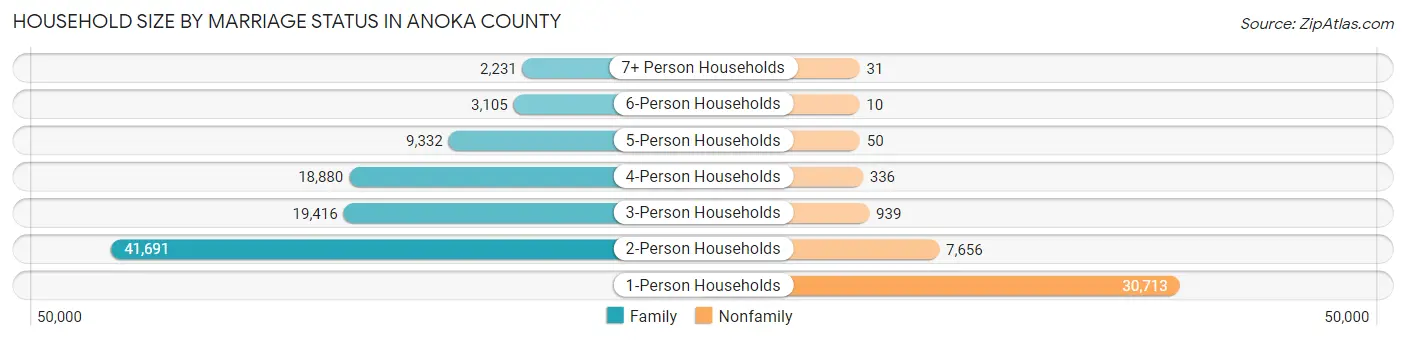
| Household Size | Family Households | Nonfamily Households |
| 1-Person Households | - | 30,713 (22.9%) |
| 2-Person Households | 41,691 (31.0%) | 7,656 (5.7%) |
| 3-Person Households | 19,416 (14.4%) | 939 (0.7%) |
| 4-Person Households | 18,880 (14.1%) | 336 (0.3%) |
| 5-Person Households | 9,332 (6.9%) | 50 (0.0%) |
| 6-Person Households | 3,105 (2.3%) | 10 (0.0%) |
| 7+ Person Households | 2,231 (1.7%) | 31 (0.0%) |
| Total | 94,655 (70.4%) | 39,735 (29.6%) |
Female Fertility in Anoka County
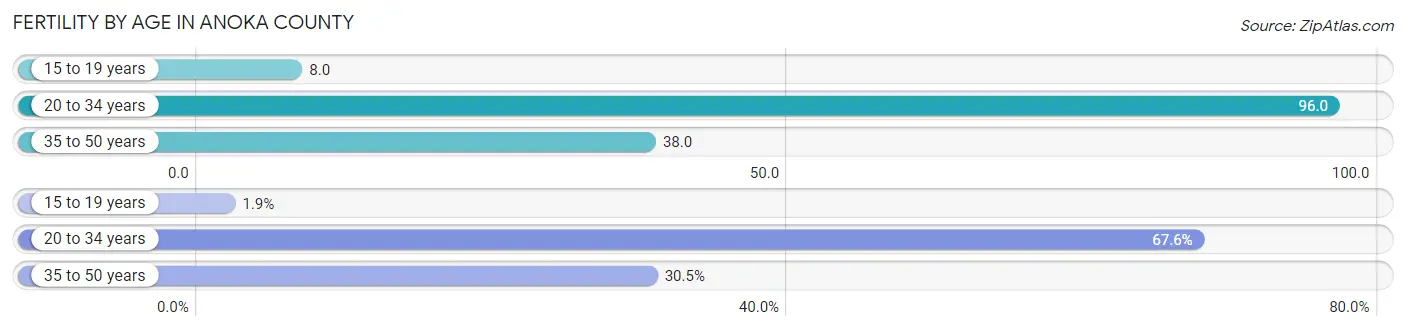
Fertility by Age in Anoka County
Average fertility rate in Anoka County is 57.0 births per 1,000 women. Women in the age bracket of 20 to 34 years have the highest fertility rate with 96.0 births per 1,000 women. Women in the age bracket of 20 to 34 years acount for 67.6% of all women with births.
| Age Bracket | Women with Births | Births / 1,000 Women |
| 15 to 19 years | 87 (1.9%) | 8.0 |
| 20 to 34 years | 3,155 (67.6%) | 96.0 |
| 35 to 50 years | 1,424 (30.5%) | 38.0 |
| Total | 4,666 (100.0%) | 57.0 |
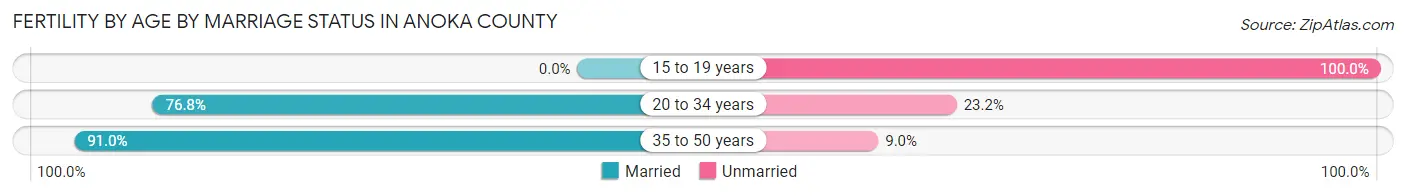
Fertility by Age by Marriage Status in Anoka County
79.7% of women with births (4,666) in Anoka County are married. The highest percentage of unmarried women with births falls into 15 to 19 years age bracket with 100.0% of them unmarried at the time of birth, while the lowest percentage of unmarried women with births belong to 35 to 50 years age bracket with 9.0% of them unmarried.
| Age Bracket | Married | Unmarried |
| 15 to 19 years | 0 (0.0%) | 87 (100.0%) |
| 20 to 34 years | 2,423 (76.8%) | 732 (23.2%) |
| 35 to 50 years | 1,296 (91.0%) | 128 (9.0%) |
| Total | 3,719 (79.7%) | 947 (20.3%) |
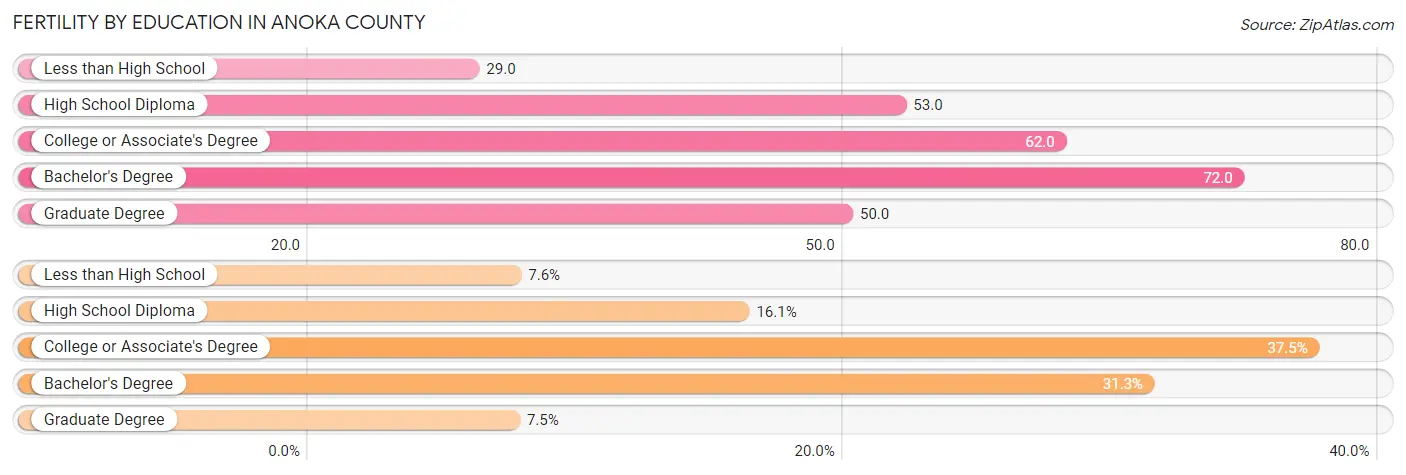
Fertility by Education in Anoka County
Average fertility rate in Anoka County is 57.0 births per 1,000 women. Women with the education attainment of bachelor's degree have the highest fertility rate of 72.0 births per 1,000 women, while women with the education attainment of less than high school have the lowest fertility at 29.0 births per 1,000 women. Women with the education attainment of college or associate's degree represent 37.5% of all women with births.
| Educational Attainment | Women with Births | Births / 1,000 Women |
| Less than High School | 353 (7.6%) | 29.0 |
| High School Diploma | 752 (16.1%) | 53.0 |
| College or Associate's Degree | 1,749 (37.5%) | 62.0 |
| Bachelor's Degree | 1,461 (31.3%) | 72.0 |
| Graduate Degree | 351 (7.5%) | 50.0 |
| Total | 4,666 (100.0%) | 57.0 |
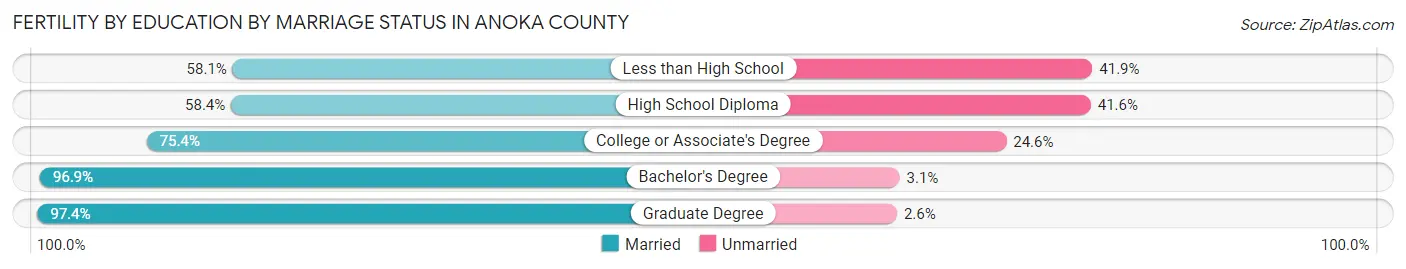
Fertility by Education by Marriage Status in Anoka County
20.3% of women with births in Anoka County are unmarried. Women with the educational attainment of graduate degree are most likely to be married with 97.4% of them married at childbirth, while women with the educational attainment of less than high school are least likely to be married with 41.9% of them unmarried at childbirth.
| Educational Attainment | Married | Unmarried |
| Less than High School | 205 (58.1%) | 148 (41.9%) |
| High School Diploma | 439 (58.4%) | 313 (41.6%) |
| College or Associate's Degree | 1,319 (75.4%) | 430 (24.6%) |
| Bachelor's Degree | 1,416 (96.9%) | 45 (3.1%) |
| Graduate Degree | 342 (97.4%) | 9 (2.6%) |
| Total | 3,719 (79.7%) | 947 (20.3%) |
Income in Anoka County
Income Overview in Anoka County
Per Capita Income in Anoka County is $43,106, while median incomes of families and households are $110,651 and $95,782 respectively.
| Characteristic | Number | Measure |
| Per Capita Income | 363,985 | $43,106 |
| Median Family Income | 94,655 | $110,651 |
| Mean Family Income | 94,655 | $129,822 |
| Median Household Income | 134,390 | $95,782 |
| Mean Household Income | 134,390 | $113,763 |
| Income Deficit | 94,655 | $9,992 |
| Wage / Income Gap (%) | 363,985 | 25.82% |
| Wage / Income Gap ($) | 363,985 | 74.18¢ per $1 |
| Gini / Inequality Index | 363,985 | 0.39 |
Earnings by Sex in Anoka County
Average Earnings in Anoka County are $49,901, $57,570 for men and $42,705 for women, a difference of 25.8%.
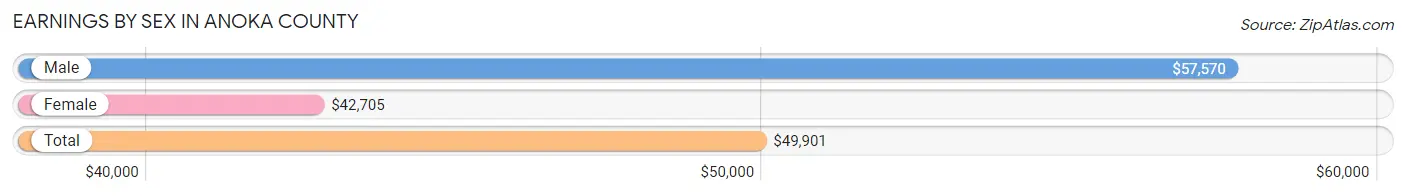
| Sex | Number | Average Earnings |
| Male | 111,383 (52.6%) | $57,570 |
| Female | 100,295 (47.4%) | $42,705 |
| Total | 211,678 (100.0%) | $49,901 |
Earnings by Sex by Income Bracket in Anoka County
The most common earnings brackets in Anoka County are $100,000+ for men (21,401 | 19.2%) and $75,000 to $99,999 for women (11,285 | 11.3%).
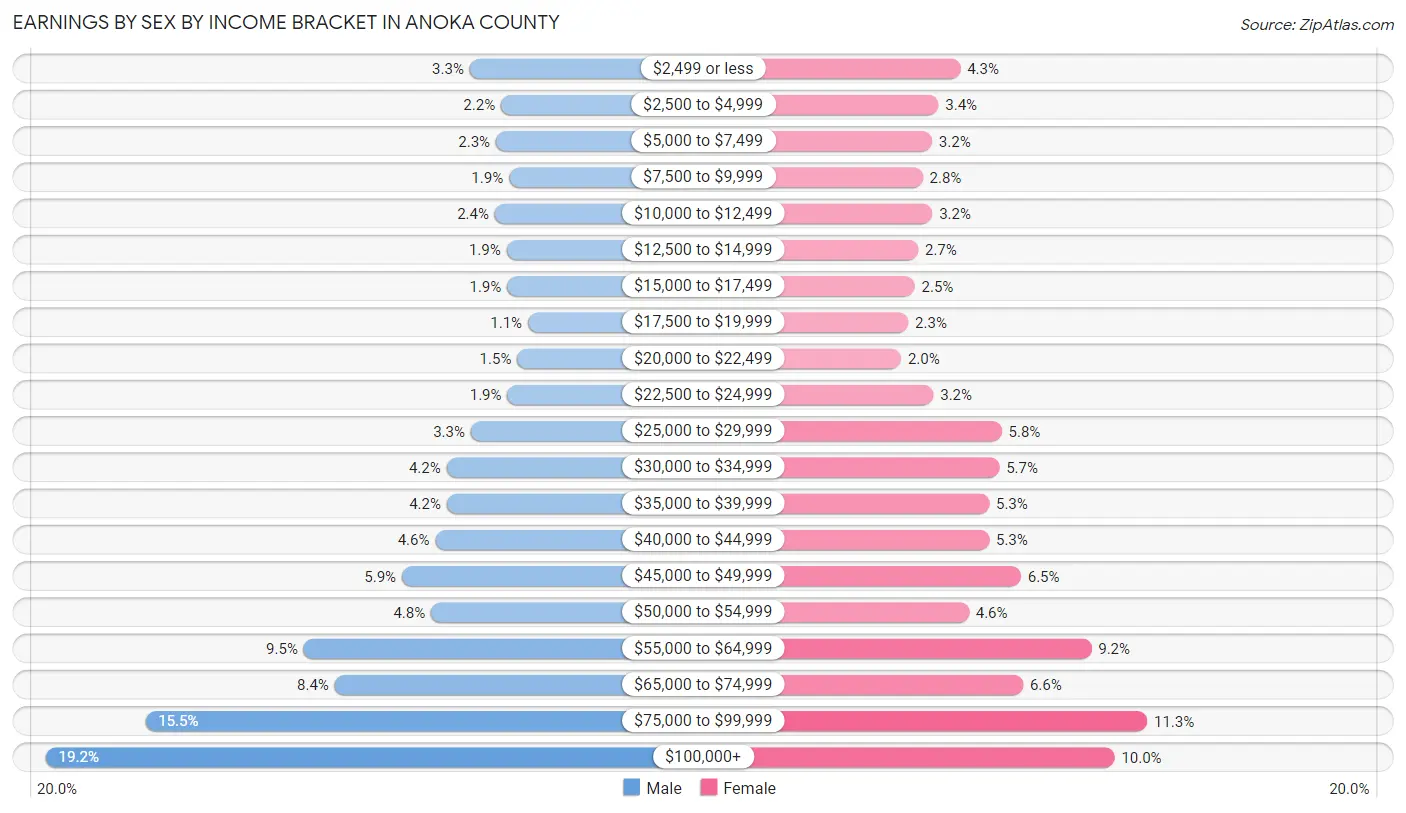
| Income | Male | Female |
| $2,499 or less | 3,699 (3.3%) | 4,267 (4.3%) |
| $2,500 to $4,999 | 2,393 (2.1%) | 3,438 (3.4%) |
| $5,000 to $7,499 | 2,610 (2.3%) | 3,204 (3.2%) |
| $7,500 to $9,999 | 2,061 (1.8%) | 2,852 (2.8%) |
| $10,000 to $12,499 | 2,651 (2.4%) | 3,210 (3.2%) |
| $12,500 to $14,999 | 2,165 (1.9%) | 2,675 (2.7%) |
| $15,000 to $17,499 | 2,133 (1.9%) | 2,549 (2.5%) |
| $17,500 to $19,999 | 1,268 (1.1%) | 2,307 (2.3%) |
| $20,000 to $22,499 | 1,717 (1.5%) | 2,038 (2.0%) |
| $22,500 to $24,999 | 2,127 (1.9%) | 3,246 (3.2%) |
| $25,000 to $29,999 | 3,649 (3.3%) | 5,814 (5.8%) |
| $30,000 to $34,999 | 4,670 (4.2%) | 5,723 (5.7%) |
| $35,000 to $39,999 | 4,655 (4.2%) | 5,349 (5.3%) |
| $40,000 to $44,999 | 5,138 (4.6%) | 5,343 (5.3%) |
| $45,000 to $49,999 | 6,532 (5.9%) | 6,541 (6.5%) |
| $50,000 to $54,999 | 5,313 (4.8%) | 4,586 (4.6%) |
| $55,000 to $64,999 | 10,626 (9.5%) | 9,192 (9.2%) |
| $65,000 to $74,999 | 9,336 (8.4%) | 6,620 (6.6%) |
| $75,000 to $99,999 | 17,239 (15.5%) | 11,285 (11.3%) |
| $100,000+ | 21,401 (19.2%) | 10,056 (10.0%) |
| Total | 111,383 (100.0%) | 100,295 (100.0%) |
Earnings by Sex by Educational Attainment in Anoka County
Average earnings in Anoka County are $64,416 for men and $47,794 for women, a difference of 25.8%. Men with an educational attainment of graduate degree enjoy the highest average annual earnings of $97,765, while those with less than high school education earn the least with $44,570. Women with an educational attainment of graduate degree earn the most with the average annual earnings of $85,861, while those with less than high school education have the smallest earnings of $29,748.
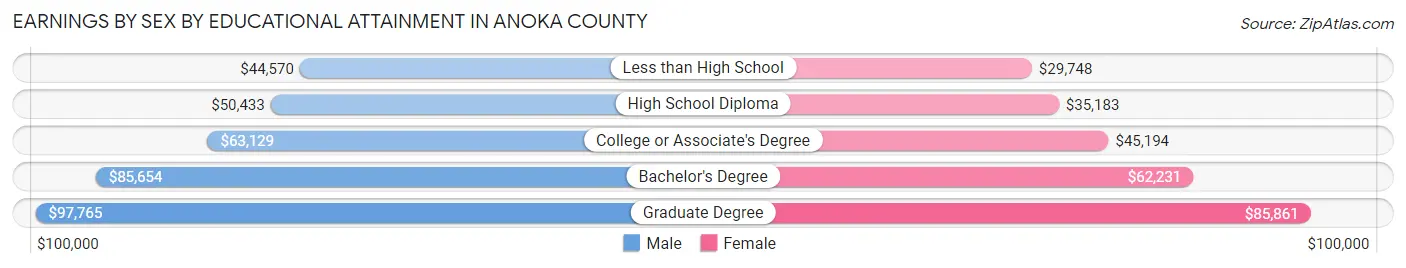
| Educational Attainment | Male Income | Female Income |
| Less than High School | $44,570 | $29,748 |
| High School Diploma | $50,433 | $35,183 |
| College or Associate's Degree | $63,129 | $45,194 |
| Bachelor's Degree | $85,654 | $62,231 |
| Graduate Degree | $97,765 | $85,861 |
| Total | $64,416 | $47,794 |
Family Income in Anoka County
Family Income Brackets in Anoka County
According to the Anoka County family income data, there are 25,084 families falling into the $100,000 to $149,999 income range, which is the most common income bracket and makes up 26.5% of all families. Conversely, the $10,000 to $14,999 income bracket is the least frequent group with only 663 families (0.7%) belonging to this category.
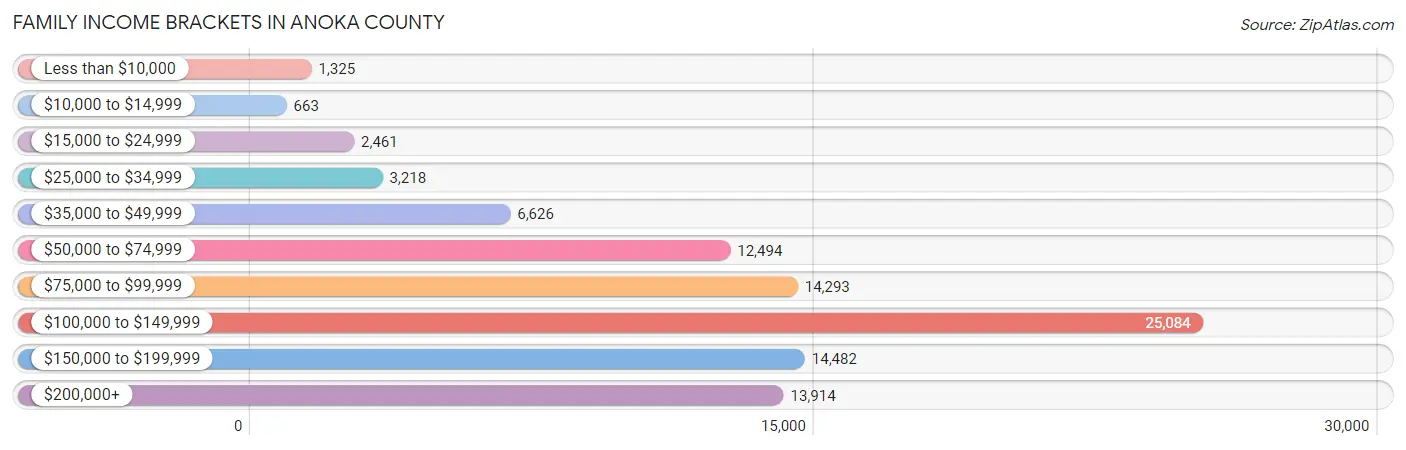
| Income Bracket | # Families | % Families |
| Less than $10,000 | 1,325 | 1.4% |
| $10,000 to $14,999 | 663 | 0.7% |
| $15,000 to $24,999 | 2,461 | 2.6% |
| $25,000 to $34,999 | 3,218 | 3.4% |
| $35,000 to $49,999 | 6,626 | 7.0% |
| $50,000 to $74,999 | 12,494 | 13.2% |
| $75,000 to $99,999 | 14,293 | 15.1% |
| $100,000 to $149,999 | 25,084 | 26.5% |
| $150,000 to $199,999 | 14,482 | 15.3% |
| $200,000+ | 13,914 | 14.7% |
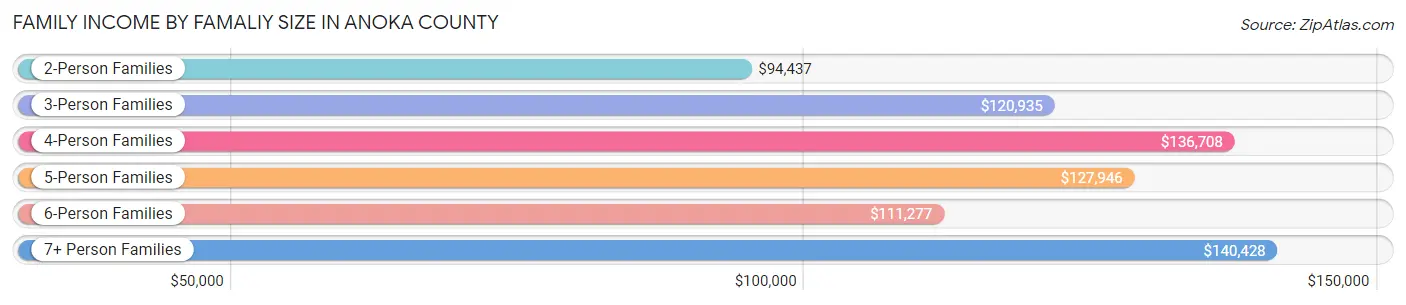
Family Income by Famaliy Size in Anoka County
7+ person families (1,907 | 2.0%) account for the highest median family income in Anoka County with $140,428 per family, while 2-person families (44,721 | 47.2%) have the highest median income of $47,218 per family member.
| Income Bracket | # Families | Median Income |
| 2-Person Families | 44,721 (47.2%) | $94,437 |
| 3-Person Families | 18,591 (19.6%) | $120,935 |
| 4-Person Families | 18,299 (19.3%) | $136,708 |
| 5-Person Families | 8,319 (8.8%) | $127,946 |
| 6-Person Families | 2,818 (3.0%) | $111,277 |
| 7+ Person Families | 1,907 (2.0%) | $140,428 |
| Total | 94,655 (100.0%) | $110,651 |
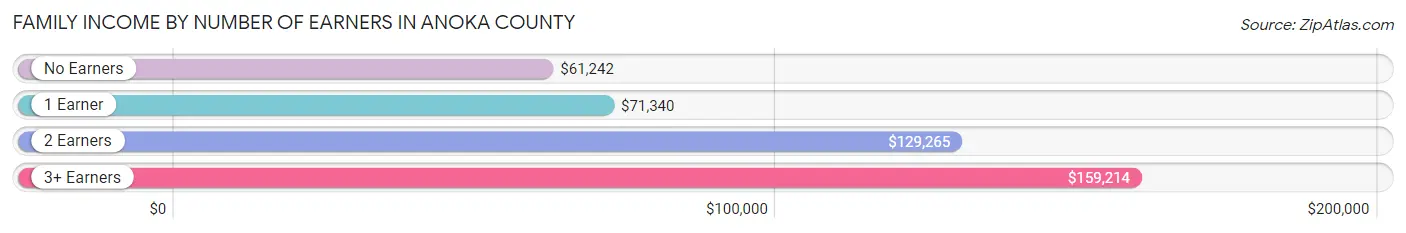
Family Income by Number of Earners in Anoka County
The median family income in Anoka County is $110,651, with families comprising 3+ earners (14,579) having the highest median family income of $159,214, while families with no earners (11,787) have the lowest median family income of $61,242, accounting for 15.4% and 12.4% of families, respectively.
| Number of Earners | # Families | Median Income |
| No Earners | 11,787 (12.4%) | $61,242 |
| 1 Earner | 23,254 (24.6%) | $71,340 |
| 2 Earners | 45,035 (47.6%) | $129,265 |
| 3+ Earners | 14,579 (15.4%) | $159,214 |
| Total | 94,655 (100.0%) | $110,651 |
Household Income in Anoka County
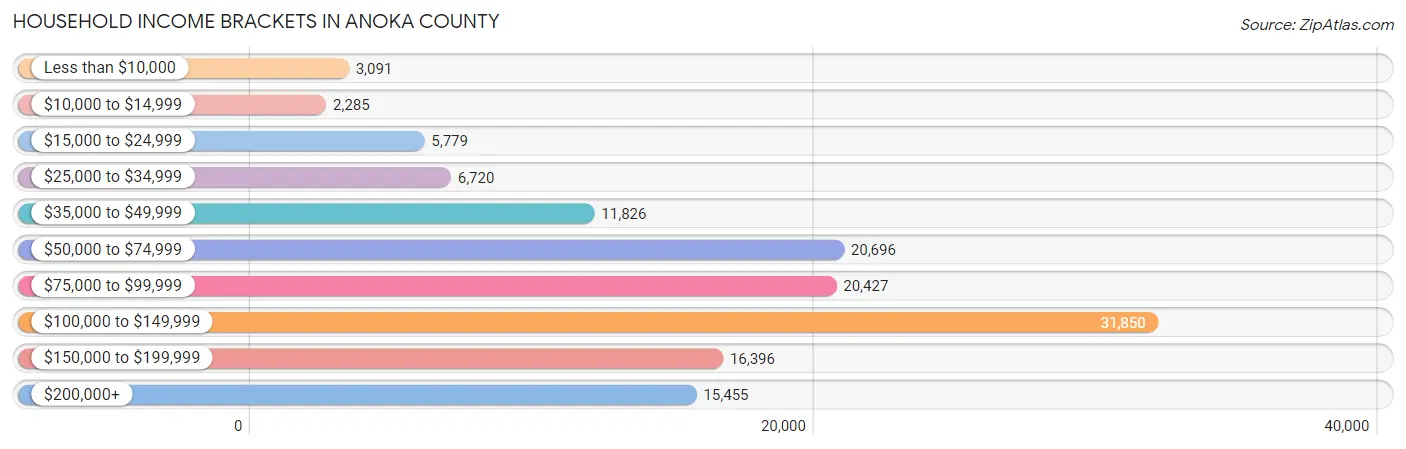
Household Income Brackets in Anoka County
With 31,850 households falling in the category, the $100,000 to $149,999 income range is the most frequent in Anoka County, accounting for 23.7% of all households. In contrast, only 2,285 households (1.7%) fall into the $10,000 to $14,999 income bracket, making it the least populous group.
| Income Bracket | # Households | % Households |
| Less than $10,000 | 3,091 | 2.3% |
| $10,000 to $14,999 | 2,285 | 1.7% |
| $15,000 to $24,999 | 5,779 | 4.3% |
| $25,000 to $34,999 | 6,720 | 5.0% |
| $35,000 to $49,999 | 11,826 | 8.8% |
| $50,000 to $74,999 | 20,696 | 15.4% |
| $75,000 to $99,999 | 20,427 | 15.2% |
| $100,000 to $149,999 | 31,850 | 23.7% |
| $150,000 to $199,999 | 16,396 | 12.2% |
| $200,000+ | 15,455 | 11.5% |
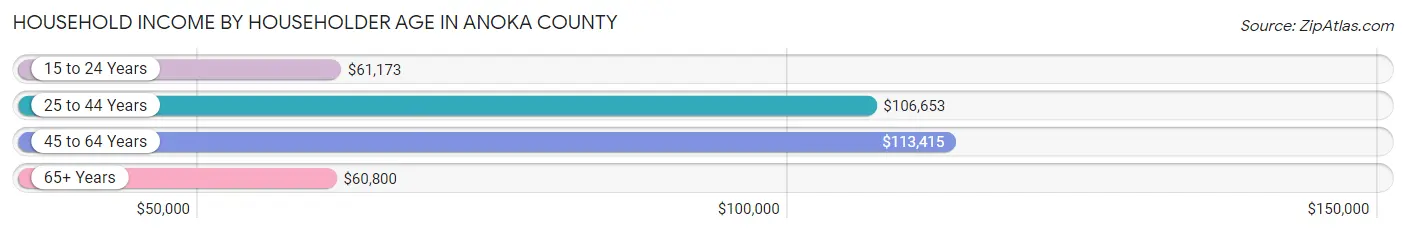
Household Income by Householder Age in Anoka County
The median household income in Anoka County is $95,782, with the highest median household income of $113,415 found in the 45 to 64 years age bracket for the primary householder. A total of 54,032 households (40.2%) fall into this category. Meanwhile, the 65+ years age bracket for the primary householder has the lowest median household income of $60,800, with 32,630 households (24.3%) in this group.
| Income Bracket | # Households | Median Income |
| 15 to 24 Years | 3,382 (2.5%) | $61,173 |
| 25 to 44 Years | 44,346 (33.0%) | $106,653 |
| 45 to 64 Years | 54,032 (40.2%) | $113,415 |
| 65+ Years | 32,630 (24.3%) | $60,800 |
| Total | 134,390 (100.0%) | $95,782 |
Poverty in Anoka County
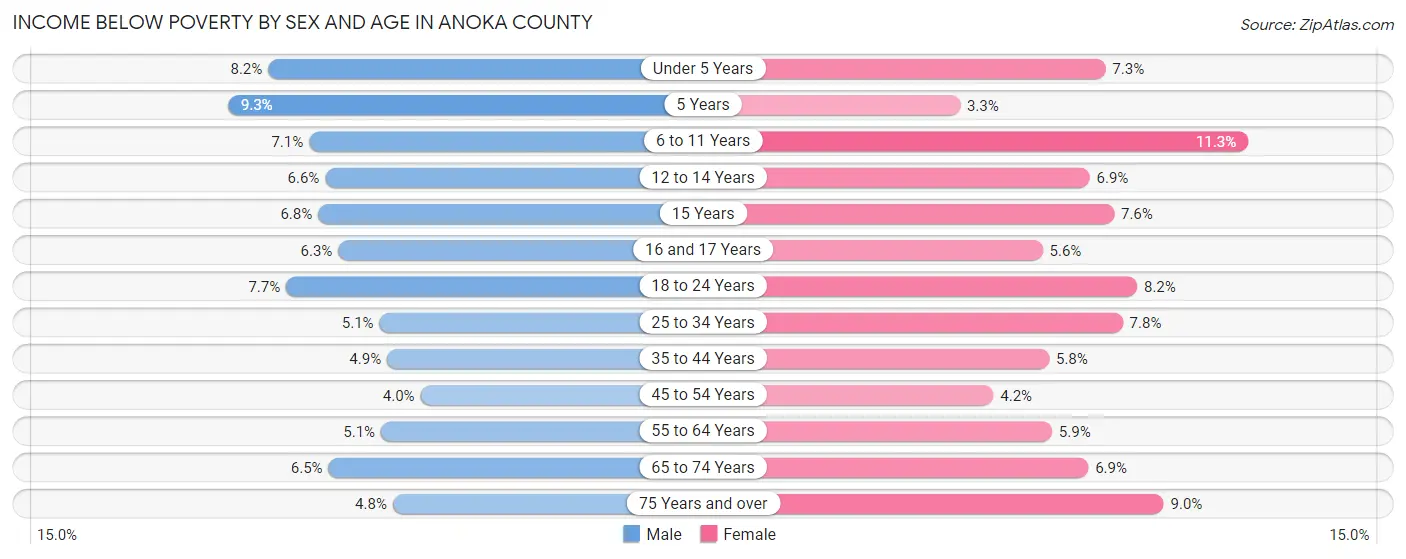
Income Below Poverty by Sex and Age in Anoka County
With 5.8% poverty level for males and 6.9% for females among the residents of Anoka County, 5 year old males and 6 to 11 year old females are the most vulnerable to poverty, with 191 males (9.3%) and 1,592 females (11.3%) in their respective age groups living below the poverty level.
| Age Bracket | Male | Female |
| Under 5 Years | 902 (8.2%) | 792 (7.3%) |
| 5 Years | 191 (9.3%) | 57 (3.3%) |
| 6 to 11 Years | 1,018 (7.1%) | 1,592 (11.3%) |
| 12 to 14 Years | 530 (6.6%) | 519 (6.9%) |
| 15 Years | 166 (6.8%) | 199 (7.6%) |
| 16 and 17 Years | 336 (6.3%) | 276 (5.6%) |
| 18 to 24 Years | 1,156 (7.7%) | 1,132 (8.2%) |
| 25 to 34 Years | 1,222 (5.1%) | 1,802 (7.8%) |
| 35 to 44 Years | 1,248 (4.9%) | 1,404 (5.8%) |
| 45 to 54 Years | 956 (4.0%) | 981 (4.2%) |
| 55 to 64 Years | 1,301 (5.1%) | 1,460 (5.9%) |
| 65 to 74 Years | 1,017 (6.5%) | 1,163 (6.9%) |
| 75 Years and over | 401 (4.8%) | 1,031 (9.0%) |
| Total | 10,444 (5.8%) | 12,408 (6.9%) |
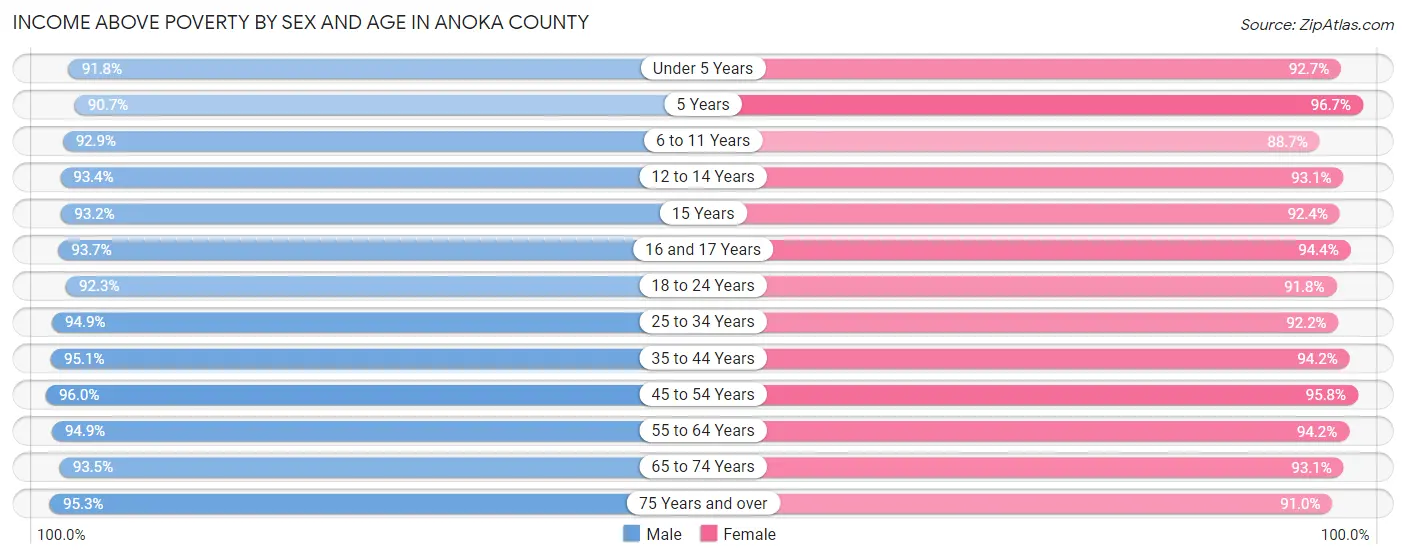
Income Above Poverty by Sex and Age in Anoka County
According to the poverty statistics in Anoka County, males aged 45 to 54 years and females aged 5 years are the age groups that are most secure financially, with 96.0% of males and 96.7% of females in these age groups living above the poverty line.
| Age Bracket | Male | Female |
| Under 5 Years | 10,069 (91.8%) | 10,003 (92.7%) |
| 5 Years | 1,853 (90.7%) | 1,675 (96.7%) |
| 6 to 11 Years | 13,358 (92.9%) | 12,487 (88.7%) |
| 12 to 14 Years | 7,458 (93.4%) | 7,003 (93.1%) |
| 15 Years | 2,263 (93.2%) | 2,426 (92.4%) |
| 16 and 17 Years | 5,021 (93.7%) | 4,664 (94.4%) |
| 18 to 24 Years | 13,823 (92.3%) | 12,634 (91.8%) |
| 25 to 34 Years | 22,658 (94.9%) | 21,240 (92.2%) |
| 35 to 44 Years | 24,164 (95.1%) | 22,920 (94.2%) |
| 45 to 54 Years | 23,089 (96.0%) | 22,272 (95.8%) |
| 55 to 64 Years | 24,333 (94.9%) | 23,486 (94.2%) |
| 65 to 74 Years | 14,530 (93.5%) | 15,787 (93.1%) |
| 75 Years and over | 8,040 (95.3%) | 10,473 (91.0%) |
| Total | 170,659 (94.2%) | 167,070 (93.1%) |
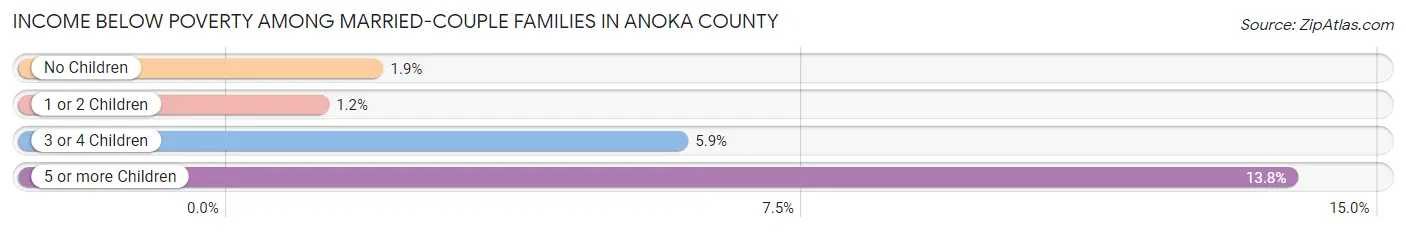
Income Below Poverty Among Married-Couple Families in Anoka County
The poverty statistics for married-couple families in Anoka County show that 2.1% or 1,583 of the total 73,862 families live below the poverty line. Families with 5 or more children have the highest poverty rate of 13.8%, comprising of 89 families. On the other hand, families with 1 or 2 children have the lowest poverty rate of 1.2%, which includes 281 families.
| Children | Above Poverty | Below Poverty |
| No Children | 41,876 (98.1%) | 809 (1.9%) |
| 1 or 2 Children | 23,388 (98.8%) | 281 (1.2%) |
| 3 or 4 Children | 6,461 (94.1%) | 404 (5.9%) |
| 5 or more Children | 554 (86.2%) | 89 (13.8%) |
| Total | 72,279 (97.9%) | 1,583 (2.1%) |
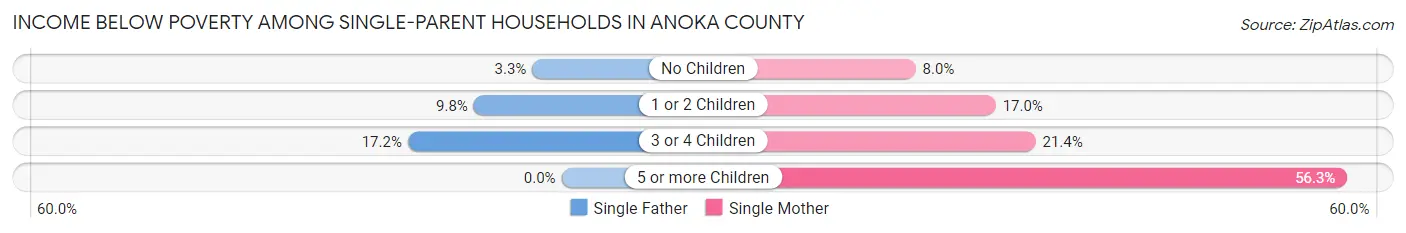
Income Below Poverty Among Single-Parent Households in Anoka County
According to the poverty data in Anoka County, 7.5% or 516 single-father households and 15.2% or 2,114 single-mother households are living below the poverty line. Among single-father households, those with 3 or 4 children have the highest poverty rate, with 106 households (17.2%) experiencing poverty. Likewise, among single-mother households, those with 5 or more children have the highest poverty rate, with 148 households (56.3%) falling below the poverty line.
| Children | Single Father | Single Mother |
| No Children | 99 (3.3%) | 384 (8.0%) |
| 1 or 2 Children | 311 (9.8%) | 1,246 (17.0%) |
| 3 or 4 Children | 106 (17.2%) | 336 (21.4%) |
| 5 or more Children | 0 (0.0%) | 148 (56.3%) |
| Total | 516 (7.5%) | 2,114 (15.2%) |
Income Below Poverty Among Married-Couple vs Single-Parent Households in Anoka County
The poverty data for Anoka County shows that 1,583 of the married-couple family households (2.1%) and 2,630 of the single-parent households (12.7%) are living below the poverty level. Within the married-couple family households, those with 5 or more children have the highest poverty rate, with 89 households (13.8%) falling below the poverty line. Among the single-parent households, those with 5 or more children have the highest poverty rate, with 148 household (49.3%) living below poverty.
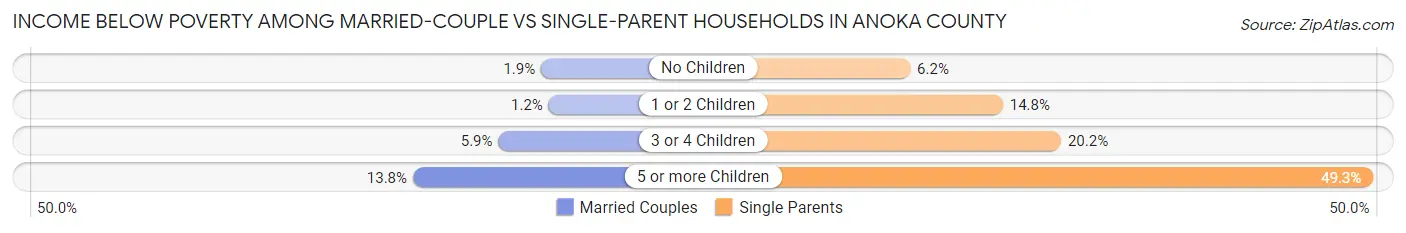
| Children | Married-Couple Families | Single-Parent Households |
| No Children | 809 (1.9%) | 483 (6.2%) |
| 1 or 2 Children | 281 (1.2%) | 1,557 (14.8%) |
| 3 or 4 Children | 404 (5.9%) | 442 (20.2%) |
| 5 or more Children | 89 (13.8%) | 148 (49.3%) |
| Total | 1,583 (2.1%) | 2,630 (12.7%) |
Employment Characteristics in Anoka County
Employment by Class of Employer in Anoka County
Among the 190,371 employed individuals in Anoka County, private company employees (137,275 | 72.1%), not-for-profit organizations (15,118 | 7.9%), and local government employees (13,530 | 7.1%) make up the most common classes of employment.
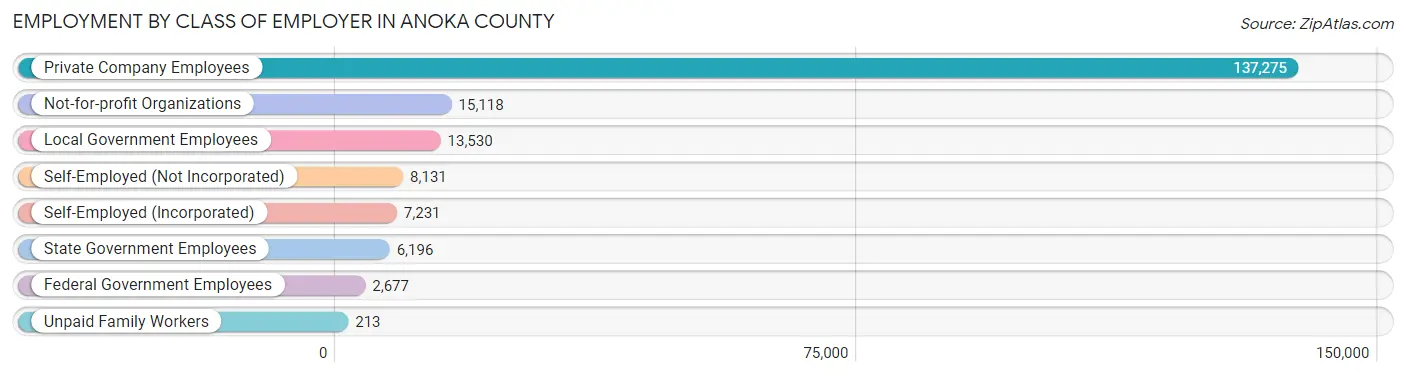
| Employer Class | # Employees | % Employees |
| Private Company Employees | 137,275 | 72.1% |
| Self-Employed (Incorporated) | 7,231 | 3.8% |
| Self-Employed (Not Incorporated) | 8,131 | 4.3% |
| Not-for-profit Organizations | 15,118 | 7.9% |
| Local Government Employees | 13,530 | 7.1% |
| State Government Employees | 6,196 | 3.3% |
| Federal Government Employees | 2,677 | 1.4% |
| Unpaid Family Workers | 213 | 0.1% |
| Total | 190,371 | 100.0% |
Employment Status by Age in Anoka County
According to the labor force statistics for Anoka County, out of the total population over 16 years of age (288,255), 70.4% or 202,932 individuals are in the labor force, with 4.0% or 8,117 of them unemployed. The age group with the highest labor force participation rate is 45 to 54 years, with 89.8% or 42,685 individuals in the labor force. Within the labor force, the 16 to 19 years age range has the highest percentage of unemployed individuals, with 12.0% or 1,133 of them being unemployed.
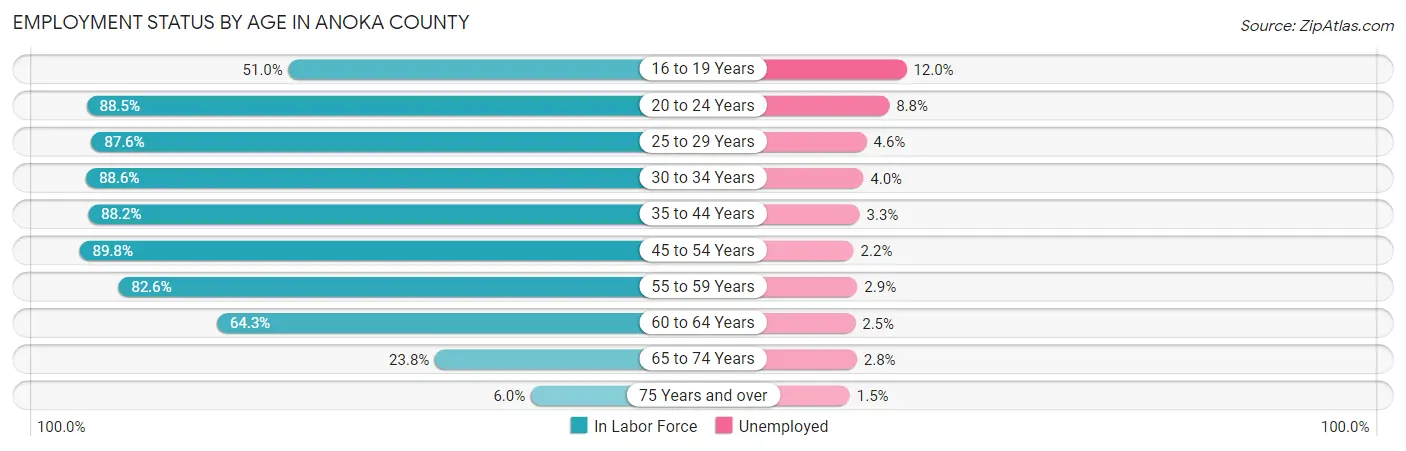
| Age Bracket | In Labor Force | Unemployed |
| 16 to 19 Years | 9,441 (51.0%) | 1,133 (12.0%) |
| 20 to 24 Years | 18,301 (88.5%) | 1,610 (8.8%) |
| 25 to 29 Years | 19,844 (87.6%) | 913 (4.6%) |
| 30 to 34 Years | 21,816 (88.6%) | 873 (4.0%) |
| 35 to 44 Years | 44,273 (88.2%) | 1,461 (3.3%) |
| 45 to 54 Years | 42,685 (89.8%) | 939 (2.2%) |
| 55 to 59 Years | 21,591 (82.6%) | 626 (2.9%) |
| 60 to 64 Years | 15,835 (64.3%) | 396 (2.5%) |
| 65 to 74 Years | 7,782 (23.8%) | 218 (2.8%) |
| 75 Years and over | 1,236 (6.0%) | 19 (1.5%) |
| Total | 202,932 (70.4%) | 8,117 (4.0%) |
Employment Status by Educational Attainment in Anoka County
According to labor force statistics for Anoka County, 84.8% of individuals (166,014) out of the total population between 25 and 64 years of age (195,771) are in the labor force, with 3.1% or 5,146 of them being unemployed. The group with the highest labor force participation rate are those with the educational attainment of bachelor's degree or higher, with 90.5% or 59,395 individuals in the labor force. Within the labor force, individuals with less than high school education have the highest percentage of unemployment, with 8.0% or 604 of them being unemployed.
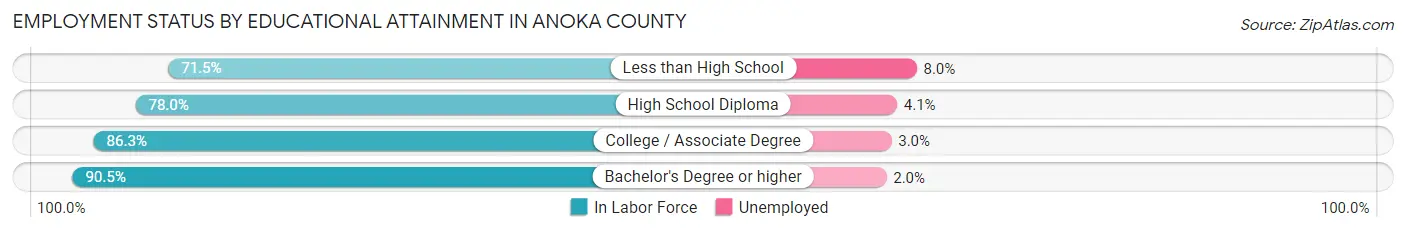
| Educational Attainment | In Labor Force | Unemployed |
| Less than High School | 7,546 (71.5%) | 844 (8.0%) |
| High School Diploma | 38,038 (78.0%) | 1,999 (4.1%) |
| College / Associate Degree | 61,118 (86.3%) | 2,125 (3.0%) |
| Bachelor's Degree or higher | 59,395 (90.5%) | 1,313 (2.0%) |
| Total | 166,014 (84.8%) | 6,069 (3.1%) |
Employment Occupations by Sex in Anoka County
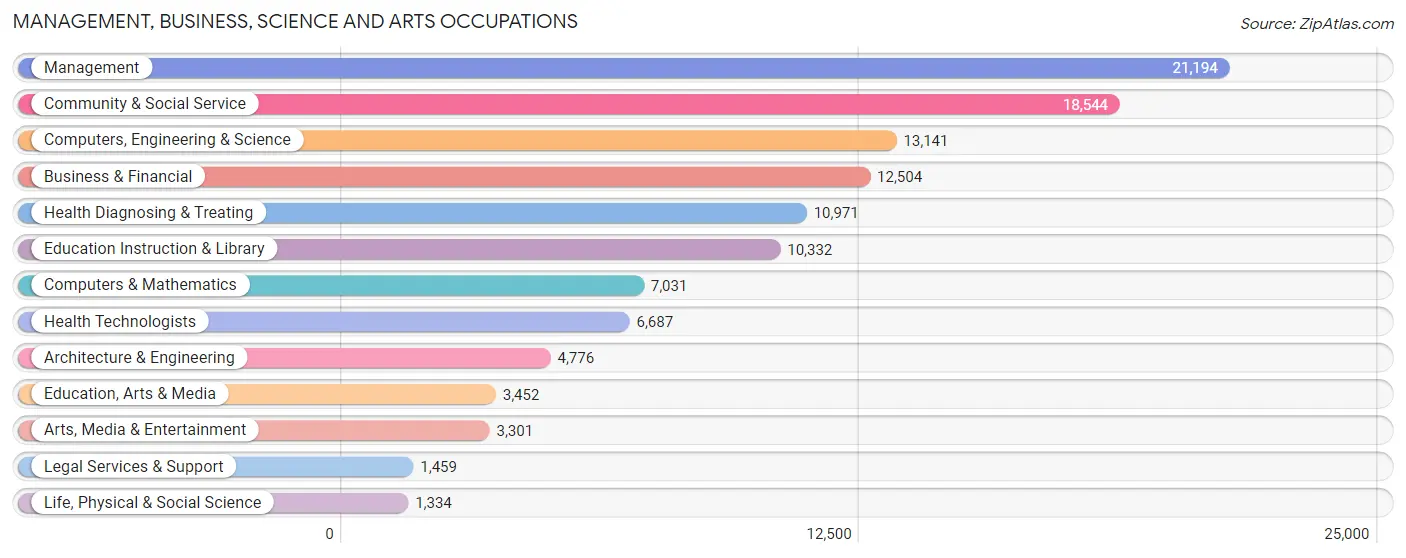
Management, Business, Science and Arts Occupations
The most common Management, Business, Science and Arts occupations in Anoka County are Management (21,194 | 10.9%), Community & Social Service (18,544 | 9.5%), Computers, Engineering & Science (13,141 | 6.8%), Business & Financial (12,504 | 6.4%), and Health Diagnosing & Treating (10,971 | 5.6%).
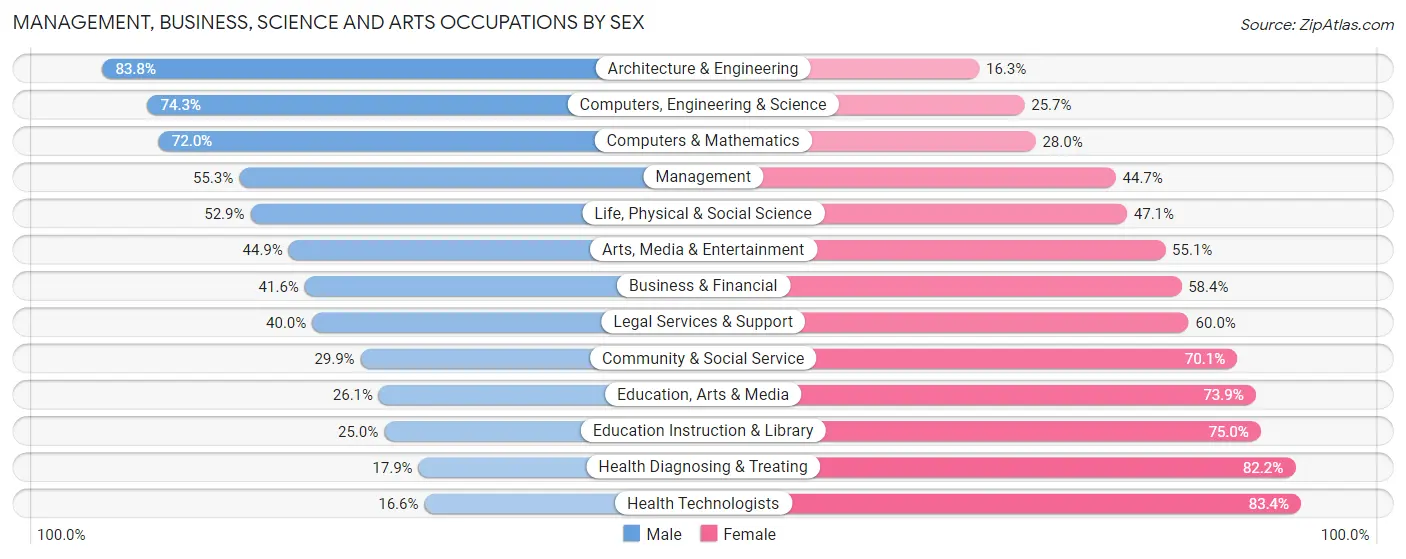
Management, Business, Science and Arts Occupations by Sex
Within the Management, Business, Science and Arts occupations in Anoka County, the most male-oriented occupations are Architecture & Engineering (83.8%), Computers, Engineering & Science (74.3%), and Computers & Mathematics (72.0%), while the most female-oriented occupations are Health Technologists (83.4%), Health Diagnosing & Treating (82.2%), and Education Instruction & Library (75.0%).
| Occupation | Male | Female |
| Management | 11,712 (55.3%) | 9,482 (44.7%) |
| Business & Financial | 5,199 (41.6%) | 7,305 (58.4%) |
| Computers, Engineering & Science | 9,767 (74.3%) | 3,374 (25.7%) |
| Computers & Mathematics | 5,061 (72.0%) | 1,970 (28.0%) |
| Architecture & Engineering | 4,000 (83.8%) | 776 (16.3%) |
| Life, Physical & Social Science | 706 (52.9%) | 628 (47.1%) |
| Community & Social Service | 5,552 (29.9%) | 12,992 (70.1%) |
| Education, Arts & Media | 901 (26.1%) | 2,551 (73.9%) |
| Legal Services & Support | 584 (40.0%) | 875 (60.0%) |
| Education Instruction & Library | 2,584 (25.0%) | 7,748 (75.0%) |
| Arts, Media & Entertainment | 1,483 (44.9%) | 1,818 (55.1%) |
| Health Diagnosing & Treating | 1,958 (17.8%) | 9,013 (82.2%) |
| Health Technologists | 1,112 (16.6%) | 5,575 (83.4%) |
| Total (Category) | 34,188 (44.8%) | 42,166 (55.2%) |
| Total (Overall) | 102,061 (52.5%) | 92,303 (47.5%) |
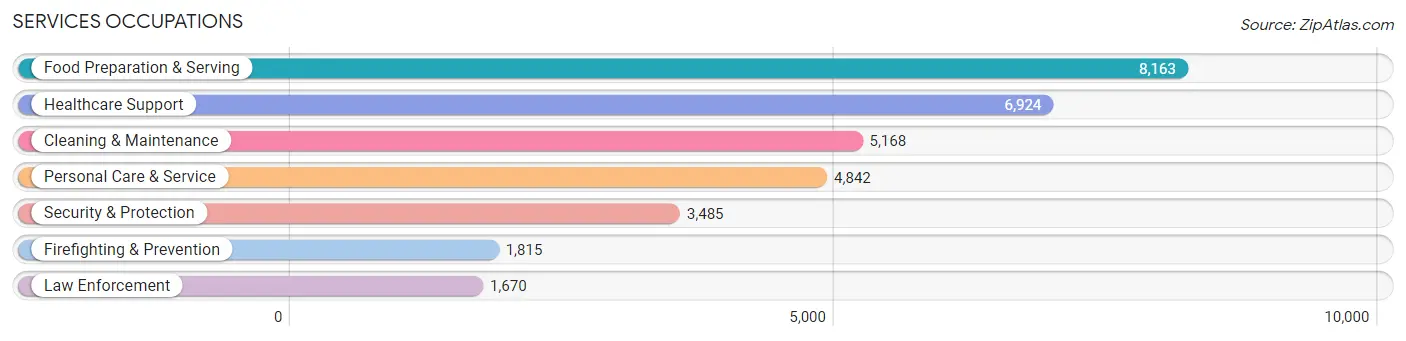
Services Occupations
The most common Services occupations in Anoka County are Food Preparation & Serving (8,163 | 4.2%), Healthcare Support (6,924 | 3.6%), Cleaning & Maintenance (5,168 | 2.7%), Personal Care & Service (4,842 | 2.5%), and Security & Protection (3,485 | 1.8%).
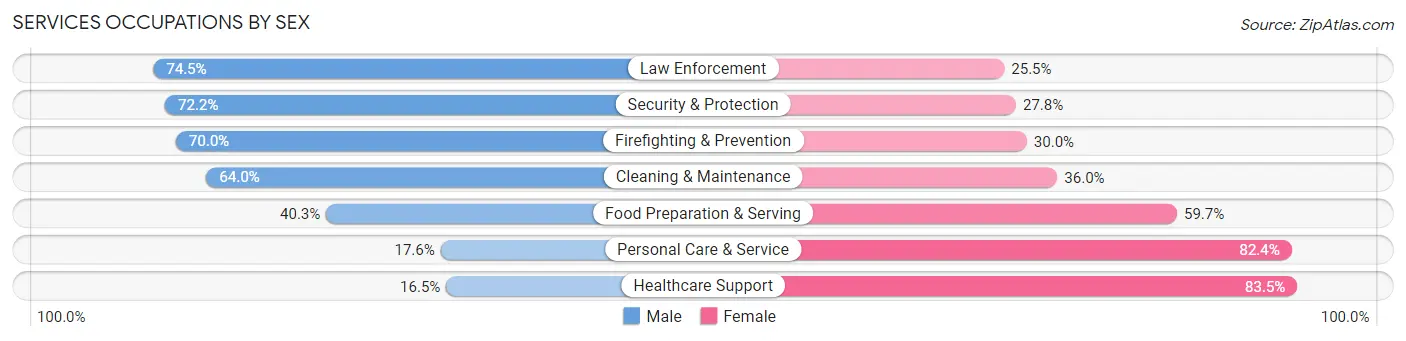
Services Occupations by Sex
Within the Services occupations in Anoka County, the most male-oriented occupations are Law Enforcement (74.5%), Security & Protection (72.2%), and Firefighting & Prevention (70.0%), while the most female-oriented occupations are Healthcare Support (83.5%), Personal Care & Service (82.4%), and Food Preparation & Serving (59.7%).
| Occupation | Male | Female |
| Healthcare Support | 1,144 (16.5%) | 5,780 (83.5%) |
| Security & Protection | 2,515 (72.2%) | 970 (27.8%) |
| Firefighting & Prevention | 1,271 (70.0%) | 544 (30.0%) |
| Law Enforcement | 1,244 (74.5%) | 426 (25.5%) |
| Food Preparation & Serving | 3,289 (40.3%) | 4,874 (59.7%) |
| Cleaning & Maintenance | 3,307 (64.0%) | 1,861 (36.0%) |
| Personal Care & Service | 854 (17.6%) | 3,988 (82.4%) |
| Total (Category) | 11,109 (38.9%) | 17,473 (61.1%) |
| Total (Overall) | 102,061 (52.5%) | 92,303 (47.5%) |
Sales and Office Occupations
The most common Sales and Office occupations in Anoka County are Office & Administration (23,264 | 12.0%), and Sales & Related (18,665 | 9.6%).

Sales and Office Occupations by Sex
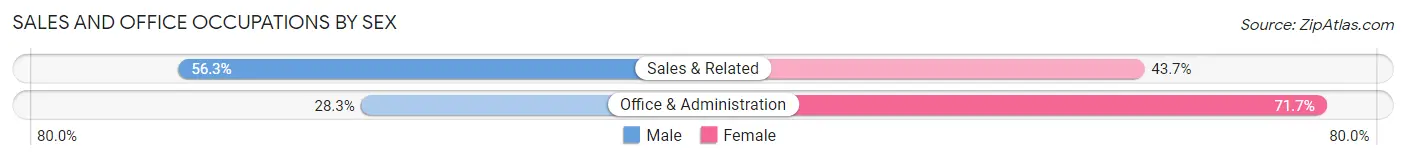
| Occupation | Male | Female |
| Sales & Related | 10,516 (56.3%) | 8,149 (43.7%) |
| Office & Administration | 6,589 (28.3%) | 16,675 (71.7%) |
| Total (Category) | 17,105 (40.8%) | 24,824 (59.2%) |
| Total (Overall) | 102,061 (52.5%) | 92,303 (47.5%) |
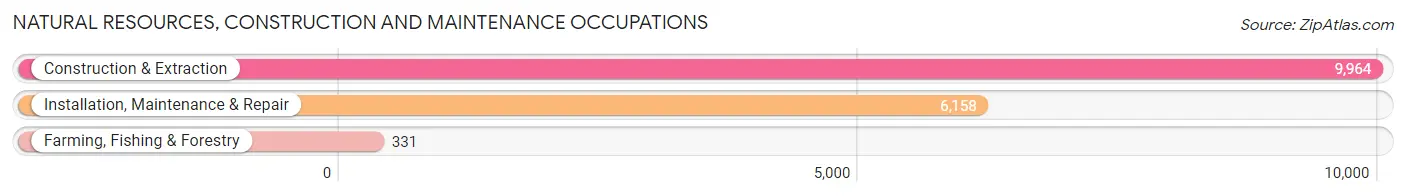
Natural Resources, Construction and Maintenance Occupations
The most common Natural Resources, Construction and Maintenance occupations in Anoka County are Construction & Extraction (9,964 | 5.1%), Installation, Maintenance & Repair (6,158 | 3.2%), and Farming, Fishing & Forestry (331 | 0.2%).
Natural Resources, Construction and Maintenance Occupations by Sex
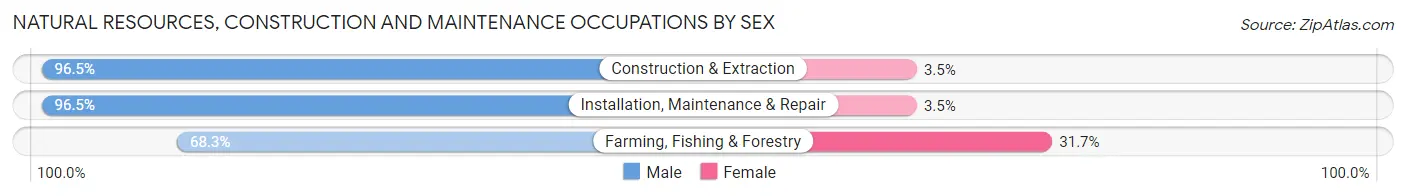
| Occupation | Male | Female |
| Farming, Fishing & Forestry | 226 (68.3%) | 105 (31.7%) |
| Construction & Extraction | 9,611 (96.5%) | 353 (3.5%) |
| Installation, Maintenance & Repair | 5,940 (96.5%) | 218 (3.5%) |
| Total (Category) | 15,777 (95.9%) | 676 (4.1%) |
| Total (Overall) | 102,061 (52.5%) | 92,303 (47.5%) |
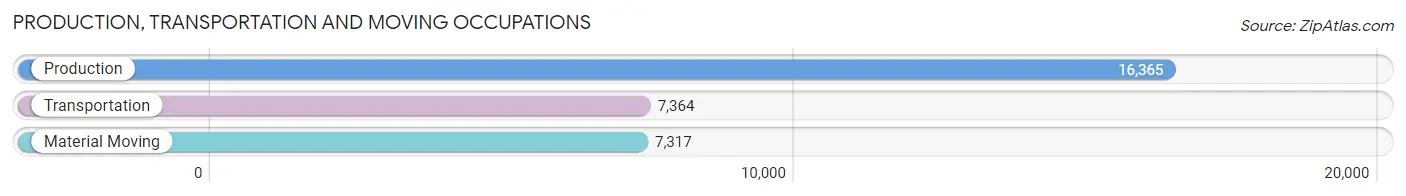
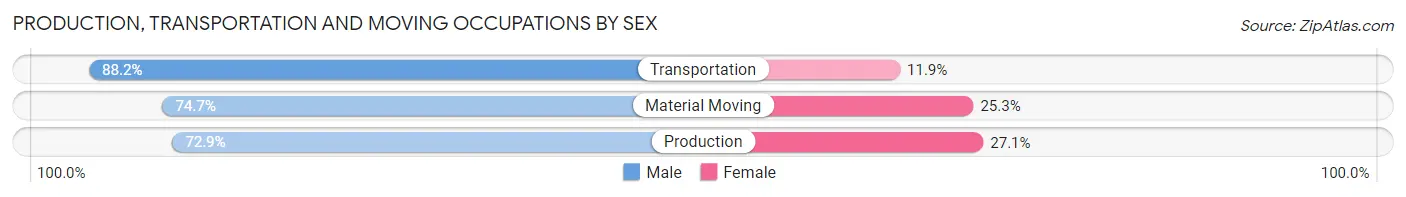
Production, Transportation and Moving Occupations
The most common Production, Transportation and Moving occupations in Anoka County are Production (16,365 | 8.4%), Transportation (7,364 | 3.8%), and Material Moving (7,317 | 3.8%).
Production, Transportation and Moving Occupations by Sex
| Occupation | Male | Female |
| Production | 11,926 (72.9%) | 4,439 (27.1%) |
| Transportation | 6,491 (88.1%) | 873 (11.8%) |
| Material Moving | 5,465 (74.7%) | 1,852 (25.3%) |
| Total (Category) | 23,882 (76.9%) | 7,164 (23.1%) |
| Total (Overall) | 102,061 (52.5%) | 92,303 (47.5%) |
Employment Industries by Sex in Anoka County
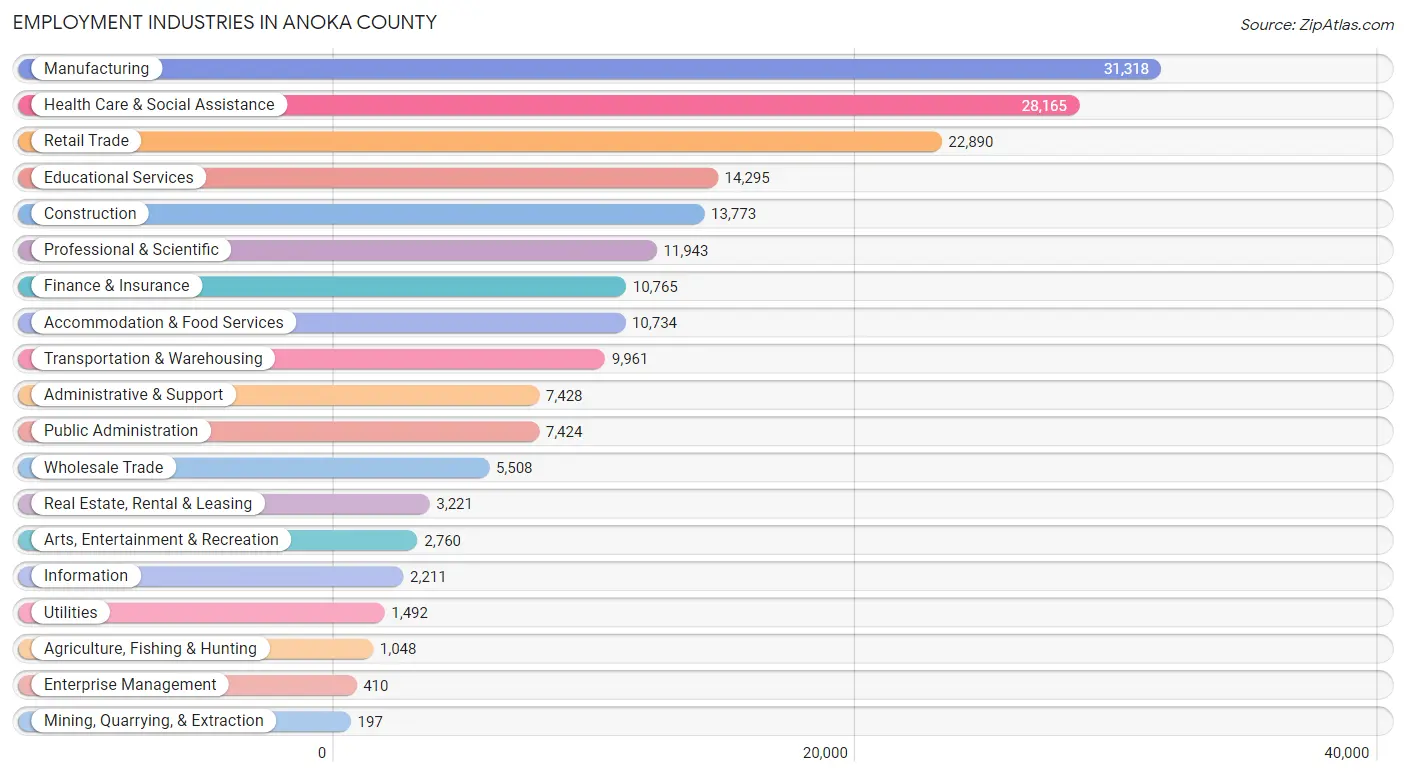
Employment Industries in Anoka County
The major employment industries in Anoka County include Manufacturing (31,318 | 16.1%), Health Care & Social Assistance (28,165 | 14.5%), Retail Trade (22,890 | 11.8%), Educational Services (14,295 | 7.3%), and Construction (13,773 | 7.1%).
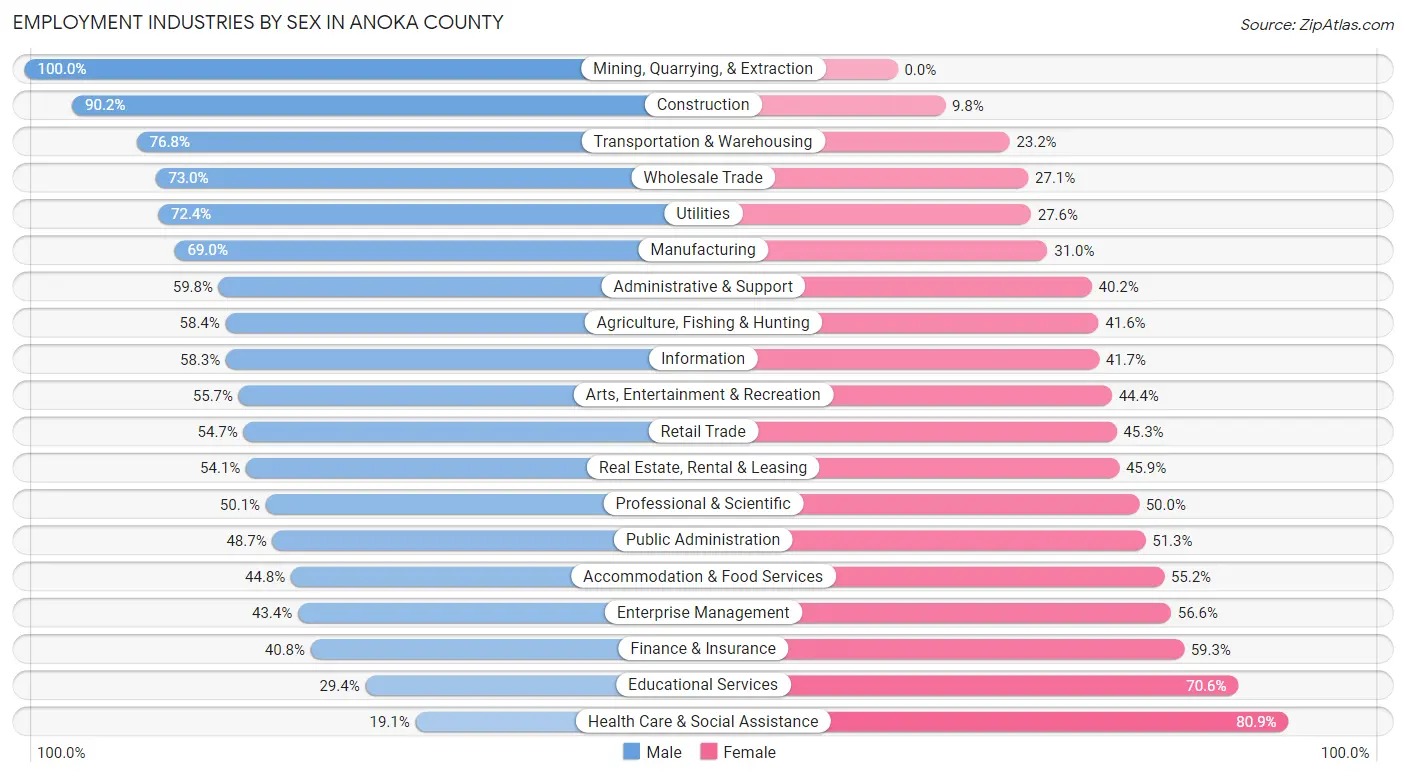
Employment Industries by Sex in Anoka County
The Anoka County industries that see more men than women are Mining, Quarrying, & Extraction (100.0%), Construction (90.2%), and Transportation & Warehousing (76.8%), whereas the industries that tend to have a higher number of women are Health Care & Social Assistance (80.9%), Educational Services (70.6%), and Finance & Insurance (59.3%).
| Industry | Male | Female |
| Agriculture, Fishing & Hunting | 612 (58.4%) | 436 (41.6%) |
| Mining, Quarrying, & Extraction | 197 (100.0%) | 0 (0.0%) |
| Construction | 12,418 (90.2%) | 1,355 (9.8%) |
| Manufacturing | 21,599 (69.0%) | 9,719 (31.0%) |
| Wholesale Trade | 4,018 (73.0%) | 1,490 (27.1%) |
| Retail Trade | 12,514 (54.7%) | 10,376 (45.3%) |
| Transportation & Warehousing | 7,651 (76.8%) | 2,310 (23.2%) |
| Utilities | 1,080 (72.4%) | 412 (27.6%) |
| Information | 1,289 (58.3%) | 922 (41.7%) |
| Finance & Insurance | 4,387 (40.7%) | 6,378 (59.3%) |
| Real Estate, Rental & Leasing | 1,744 (54.1%) | 1,477 (45.9%) |
| Professional & Scientific | 5,978 (50.0%) | 5,965 (49.9%) |
| Enterprise Management | 178 (43.4%) | 232 (56.6%) |
| Administrative & Support | 4,443 (59.8%) | 2,985 (40.2%) |
| Educational Services | 4,208 (29.4%) | 10,087 (70.6%) |
| Health Care & Social Assistance | 5,373 (19.1%) | 22,792 (80.9%) |
| Arts, Entertainment & Recreation | 1,536 (55.6%) | 1,224 (44.4%) |
| Accommodation & Food Services | 4,812 (44.8%) | 5,922 (55.2%) |
| Public Administration | 3,615 (48.7%) | 3,809 (51.3%) |
| Total | 102,061 (52.5%) | 92,303 (47.5%) |
Education in Anoka County
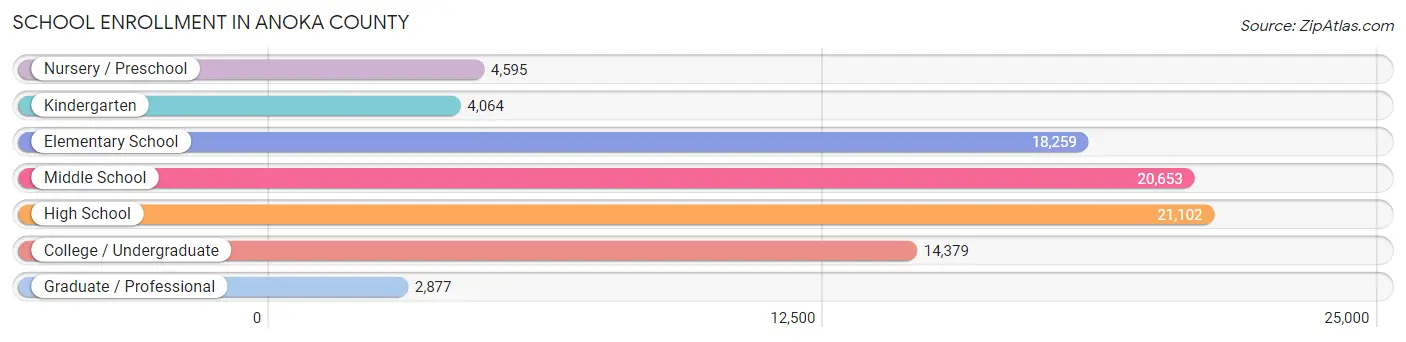
School Enrollment in Anoka County
The most common levels of schooling among the 85,929 students in Anoka County are high school (21,102 | 24.6%), middle school (20,653 | 24.0%), and elementary school (18,259 | 21.2%).
| School Level | # Students | % Students |
| Nursery / Preschool | 4,595 | 5.3% |
| Kindergarten | 4,064 | 4.7% |
| Elementary School | 18,259 | 21.2% |
| Middle School | 20,653 | 24.0% |
| High School | 21,102 | 24.6% |
| College / Undergraduate | 14,379 | 16.7% |
| Graduate / Professional | 2,877 | 3.4% |
| Total | 85,929 | 100.0% |
School Enrollment by Age by Funding Source in Anoka County
Out of a total of 85,929 students who are enrolled in schools in Anoka County, 10,140 (11.8%) attend a private institution, while the remaining 75,789 (88.2%) are enrolled in public schools. The age group of 25 to 34 year olds has the highest likelihood of being enrolled in private schools, with 1,366 (32.6% in the age bracket) enrolled. Conversely, the age group of 15 to 17 year olds has the lowest likelihood of being enrolled in a private school, with 14,150 (94.3% in the age bracket) attending a public institution.
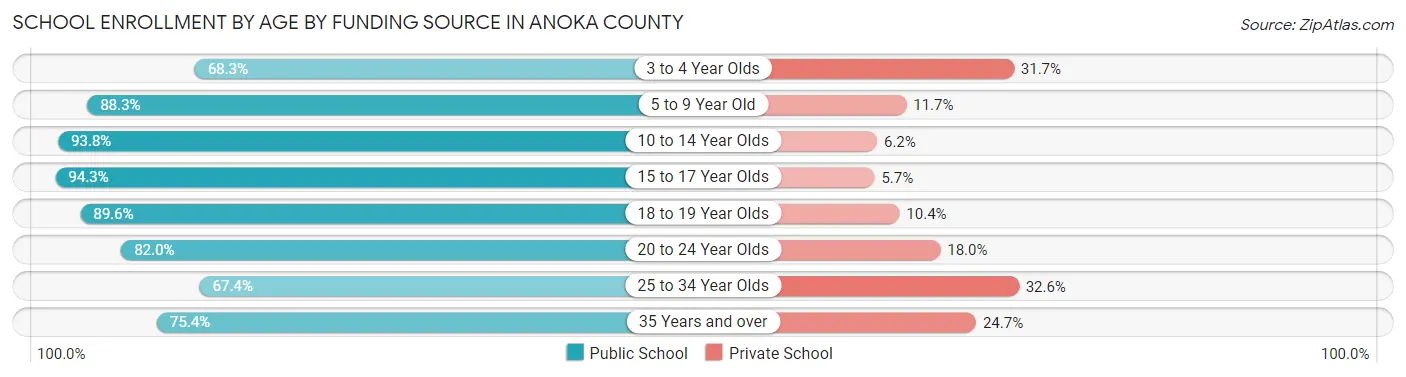
| Age Bracket | Public School | Private School |
| 3 to 4 Year Olds | 2,446 (68.3%) | 1,135 (31.7%) |
| 5 to 9 Year Old | 18,267 (88.3%) | 2,414 (11.7%) |
| 10 to 14 Year Olds | 24,284 (93.8%) | 1,611 (6.2%) |
| 15 to 17 Year Olds | 14,150 (94.3%) | 861 (5.7%) |
| 18 to 19 Year Olds | 5,416 (89.6%) | 627 (10.4%) |
| 20 to 24 Year Olds | 5,543 (82.0%) | 1,217 (18.0%) |
| 25 to 34 Year Olds | 2,824 (67.4%) | 1,366 (32.6%) |
| 35 Years and over | 2,839 (75.3%) | 929 (24.6%) |
| Total | 75,789 (88.2%) | 10,140 (11.8%) |
Educational Attainment by Field of Study in Anoka County
Business (19,593 | 22.9%), education (9,974 | 11.7%), science & technology (8,734 | 10.2%), arts & humanities (6,776 | 7.9%), and engineering (6,167 | 7.2%) are the most common fields of study among 85,482 individuals in Anoka County who have obtained a bachelor's degree or higher.
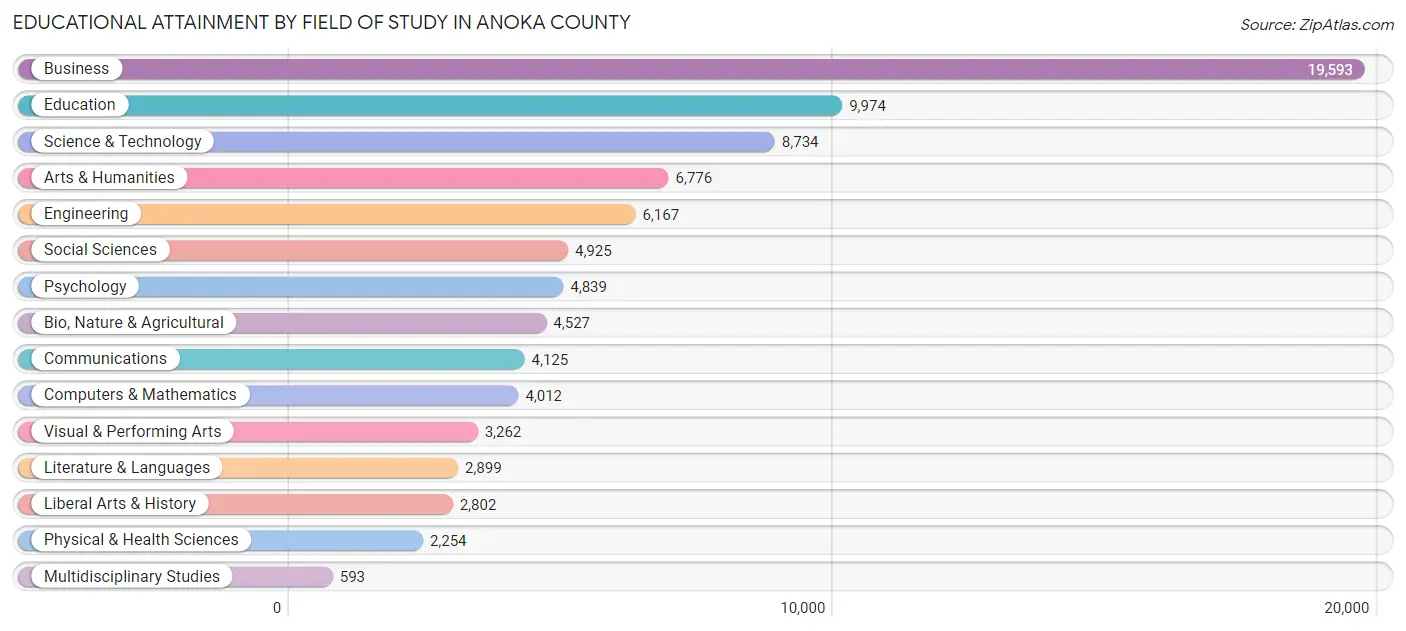
| Field of Study | # Graduates | % Graduates |
| Computers & Mathematics | 4,012 | 4.7% |
| Bio, Nature & Agricultural | 4,527 | 5.3% |
| Physical & Health Sciences | 2,254 | 2.6% |
| Psychology | 4,839 | 5.7% |
| Social Sciences | 4,925 | 5.8% |
| Engineering | 6,167 | 7.2% |
| Multidisciplinary Studies | 593 | 0.7% |
| Science & Technology | 8,734 | 10.2% |
| Business | 19,593 | 22.9% |
| Education | 9,974 | 11.7% |
| Literature & Languages | 2,899 | 3.4% |
| Liberal Arts & History | 2,802 | 3.3% |
| Visual & Performing Arts | 3,262 | 3.8% |
| Communications | 4,125 | 4.8% |
| Arts & Humanities | 6,776 | 7.9% |
| Total | 85,482 | 100.0% |
Transportation & Commute in Anoka County
Vehicle Availability by Sex in Anoka County
The most prevalent vehicle ownership categories in Anoka County are males with 2 vehicles (44,576, accounting for 44.4%) and females with 2 vehicles (38,675, making up 49.8%).
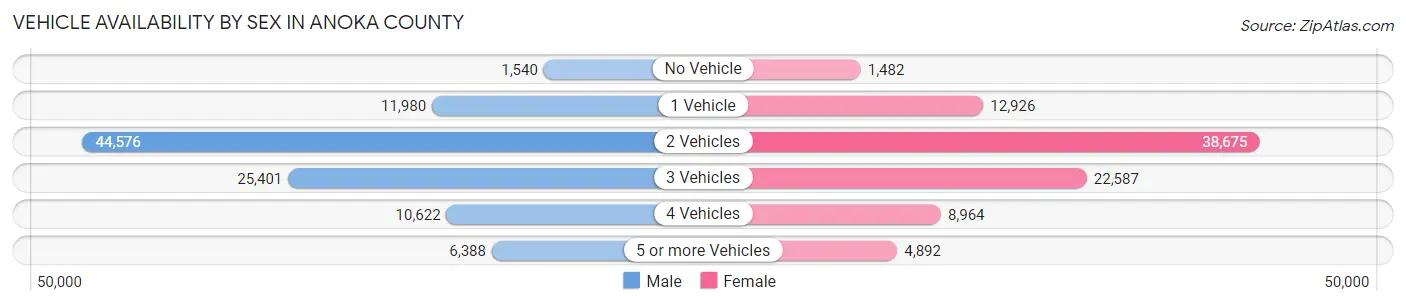
| Vehicles Available | Male | Female |
| No Vehicle | 1,540 (1.5%) | 1,482 (1.7%) |
| 1 Vehicle | 11,980 (11.9%) | 12,926 (14.4%) |
| 2 Vehicles | 44,576 (44.4%) | 38,675 (43.2%) |
| 3 Vehicles | 25,401 (25.3%) | 22,587 (25.2%) |
| 4 Vehicles | 10,622 (10.6%) | 8,964 (10.0%) |
| 5 or more Vehicles | 6,388 (6.4%) | 4,892 (5.5%) |
| Total | 100,507 (100.0%) | 89,526 (100.0%) |
Commute Time in Anoka County
The most frequently occuring commute durations in Anoka County are 20 to 24 minutes (28,275 commuters, 17.1%), 30 to 34 minutes (27,154 commuters, 16.4%), and 15 to 19 minutes (21,403 commuters, 13.0%).
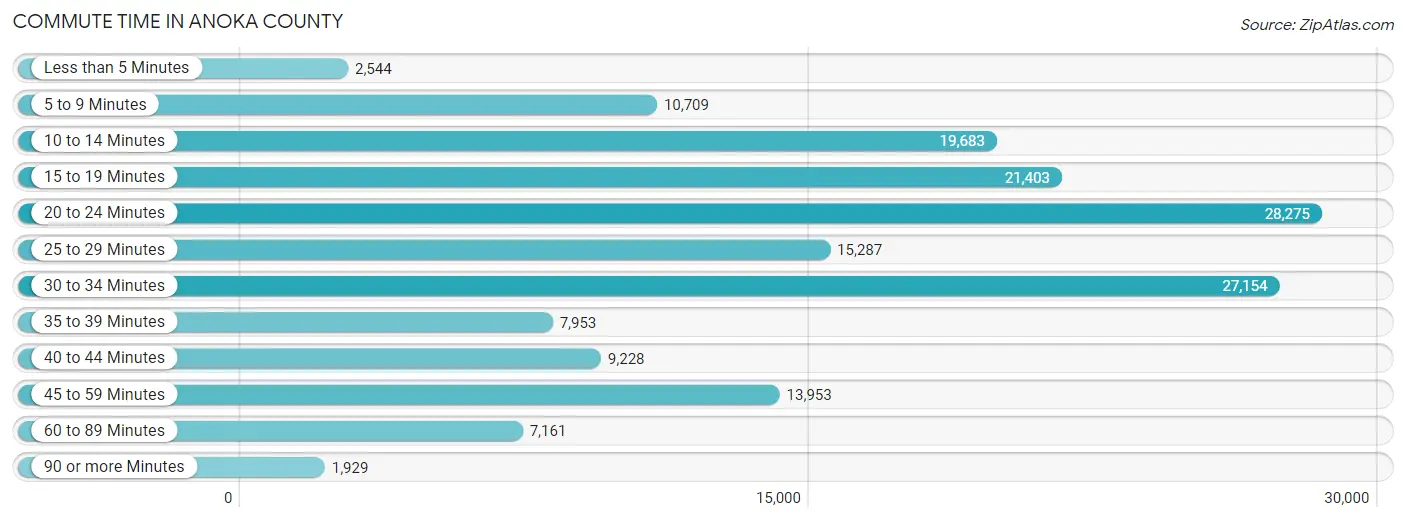
| Commute Time | # Commuters | % Commuters |
| Less than 5 Minutes | 2,544 | 1.5% |
| 5 to 9 Minutes | 10,709 | 6.5% |
| 10 to 14 Minutes | 19,683 | 11.9% |
| 15 to 19 Minutes | 21,403 | 13.0% |
| 20 to 24 Minutes | 28,275 | 17.1% |
| 25 to 29 Minutes | 15,287 | 9.2% |
| 30 to 34 Minutes | 27,154 | 16.4% |
| 35 to 39 Minutes | 7,953 | 4.8% |
| 40 to 44 Minutes | 9,228 | 5.6% |
| 45 to 59 Minutes | 13,953 | 8.4% |
| 60 to 89 Minutes | 7,161 | 4.3% |
| 90 or more Minutes | 1,929 | 1.2% |
Commute Time by Sex in Anoka County
The most common commute times in Anoka County are 30 to 34 minutes (15,944 commuters, 17.6%) for males and 20 to 24 minutes (12,755 commuters, 17.0%) for females.
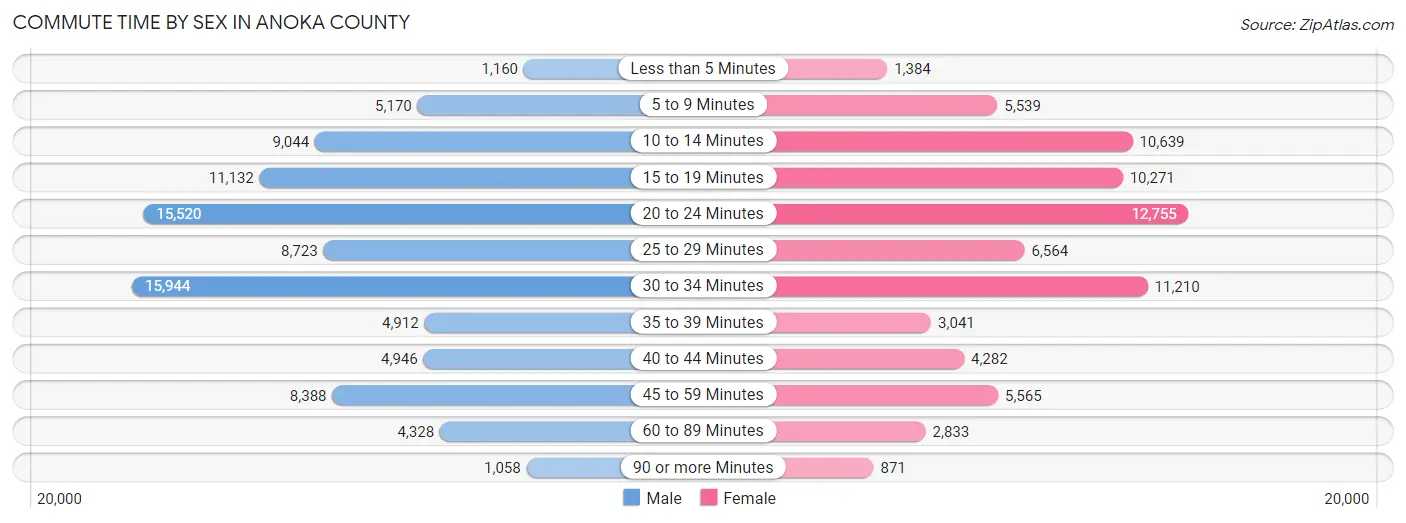
| Commute Time | Male | Female |
| Less than 5 Minutes | 1,160 (1.3%) | 1,384 (1.8%) |
| 5 to 9 Minutes | 5,170 (5.7%) | 5,539 (7.4%) |
| 10 to 14 Minutes | 9,044 (10.0%) | 10,639 (14.2%) |
| 15 to 19 Minutes | 11,132 (12.3%) | 10,271 (13.7%) |
| 20 to 24 Minutes | 15,520 (17.2%) | 12,755 (17.0%) |
| 25 to 29 Minutes | 8,723 (9.7%) | 6,564 (8.8%) |
| 30 to 34 Minutes | 15,944 (17.6%) | 11,210 (15.0%) |
| 35 to 39 Minutes | 4,912 (5.4%) | 3,041 (4.1%) |
| 40 to 44 Minutes | 4,946 (5.5%) | 4,282 (5.7%) |
| 45 to 59 Minutes | 8,388 (9.3%) | 5,565 (7.4%) |
| 60 to 89 Minutes | 4,328 (4.8%) | 2,833 (3.8%) |
| 90 or more Minutes | 1,058 (1.2%) | 871 (1.2%) |
Time of Departure to Work by Sex in Anoka County
The most frequent times of departure to work in Anoka County are 7:00 AM to 7:29 AM (12,792, 14.2%) for males and 7:00 AM to 7:29 AM (11,765, 15.7%) for females.
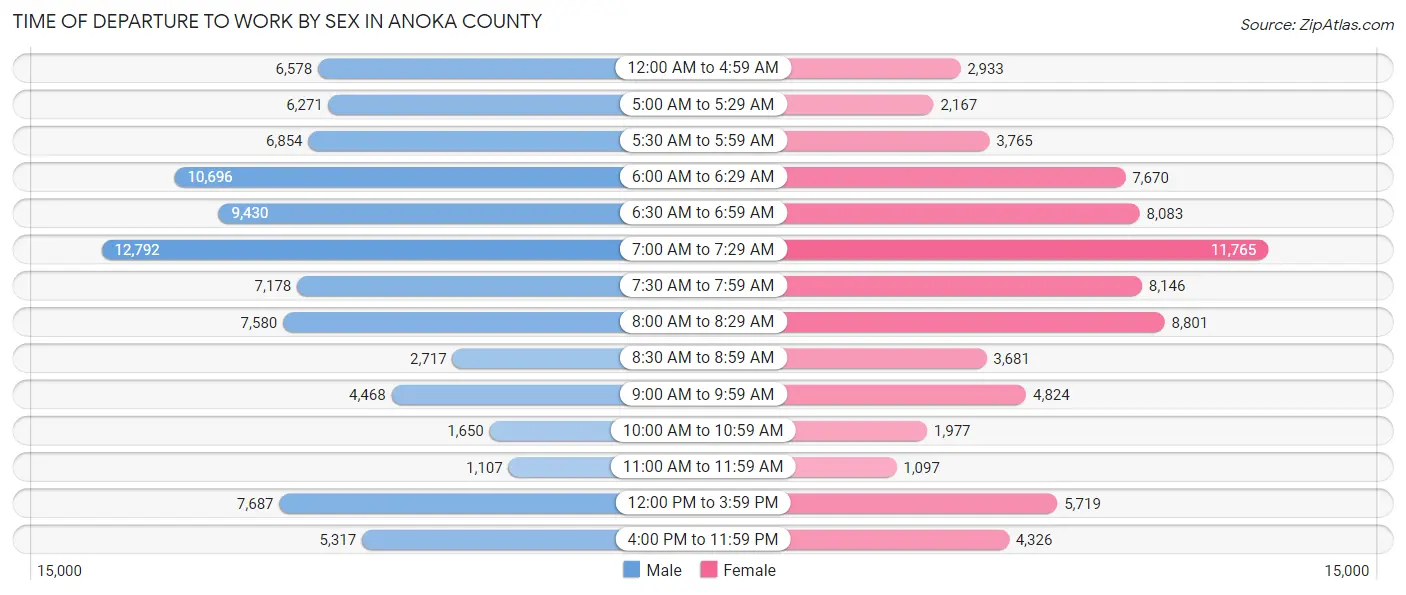
| Time of Departure | Male | Female |
| 12:00 AM to 4:59 AM | 6,578 (7.3%) | 2,933 (3.9%) |
| 5:00 AM to 5:29 AM | 6,271 (6.9%) | 2,167 (2.9%) |
| 5:30 AM to 5:59 AM | 6,854 (7.6%) | 3,765 (5.0%) |
| 6:00 AM to 6:29 AM | 10,696 (11.8%) | 7,670 (10.2%) |
| 6:30 AM to 6:59 AM | 9,430 (10.4%) | 8,083 (10.8%) |
| 7:00 AM to 7:29 AM | 12,792 (14.2%) | 11,765 (15.7%) |
| 7:30 AM to 7:59 AM | 7,178 (8.0%) | 8,146 (10.9%) |
| 8:00 AM to 8:29 AM | 7,580 (8.4%) | 8,801 (11.7%) |
| 8:30 AM to 8:59 AM | 2,717 (3.0%) | 3,681 (4.9%) |
| 9:00 AM to 9:59 AM | 4,468 (5.0%) | 4,824 (6.4%) |
| 10:00 AM to 10:59 AM | 1,650 (1.8%) | 1,977 (2.6%) |
| 11:00 AM to 11:59 AM | 1,107 (1.2%) | 1,097 (1.5%) |
| 12:00 PM to 3:59 PM | 7,687 (8.5%) | 5,719 (7.6%) |
| 4:00 PM to 11:59 PM | 5,317 (5.9%) | 4,326 (5.8%) |
| Total | 90,325 (100.0%) | 74,954 (100.0%) |
Housing Occupancy in Anoka County
Occupancy by Ownership in Anoka County
Of the total 134,390 dwellings in Anoka County, owner-occupied units account for 107,811 (80.2%), while renter-occupied units make up 26,579 (19.8%).
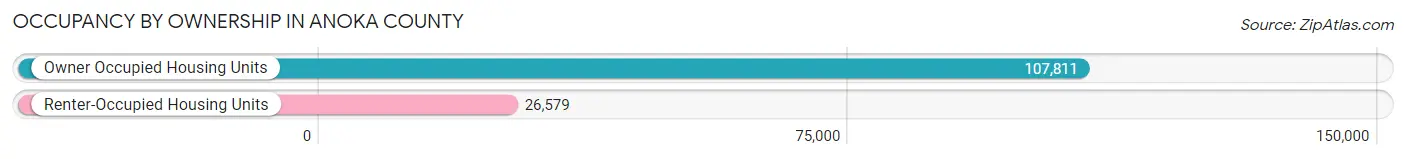
| Occupancy | # Housing Units | % Housing Units |
| Owner Occupied Housing Units | 107,811 | 80.2% |
| Renter-Occupied Housing Units | 26,579 | 19.8% |
| Total Occupied Housing Units | 134,390 | 100.0% |
Occupancy by Household Size in Anoka County
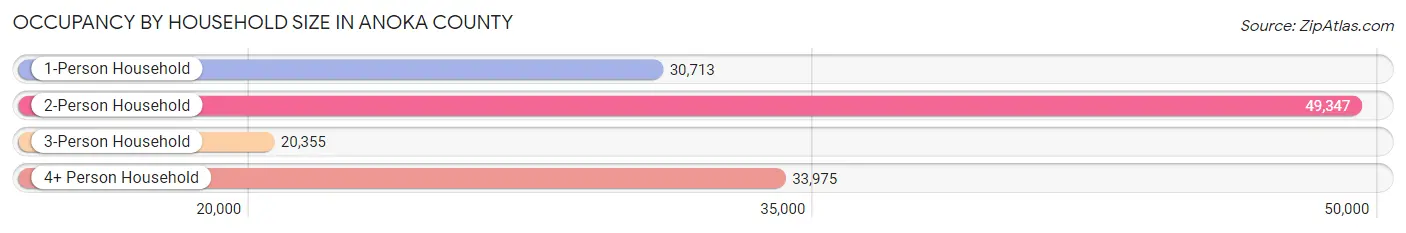
| Household Size | # Housing Units | % Housing Units |
| 1-Person Household | 30,713 | 22.9% |
| 2-Person Household | 49,347 | 36.7% |
| 3-Person Household | 20,355 | 15.1% |
| 4+ Person Household | 33,975 | 25.3% |
| Total Housing Units | 134,390 | 100.0% |
Occupancy by Ownership by Household Size in Anoka County
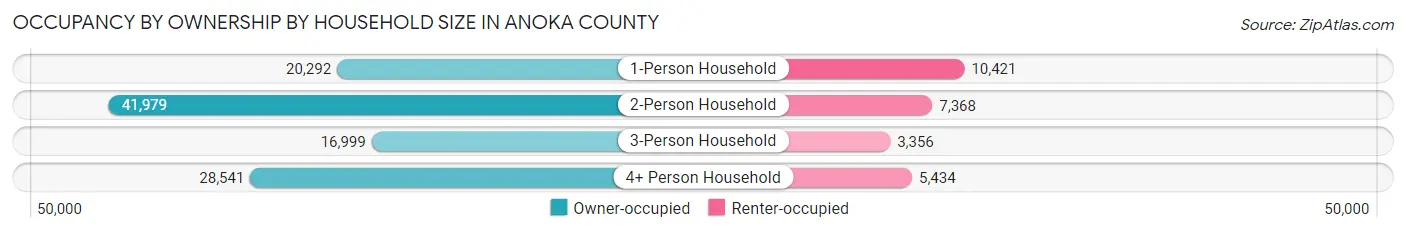
| Household Size | Owner-occupied | Renter-occupied |
| 1-Person Household | 20,292 (66.1%) | 10,421 (33.9%) |
| 2-Person Household | 41,979 (85.1%) | 7,368 (14.9%) |
| 3-Person Household | 16,999 (83.5%) | 3,356 (16.5%) |
| 4+ Person Household | 28,541 (84.0%) | 5,434 (16.0%) |
| Total Housing Units | 107,811 (80.2%) | 26,579 (19.8%) |
Occupancy by Educational Attainment in Anoka County
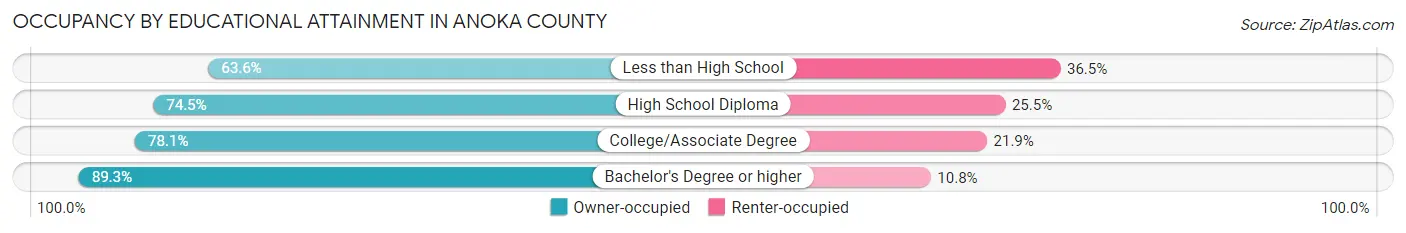
| Household Size | Owner-occupied | Renter-occupied |
| Less than High School | 3,968 (63.5%) | 2,276 (36.4%) |
| High School Diploma | 24,860 (74.5%) | 8,529 (25.5%) |
| College/Associate Degree | 39,115 (78.1%) | 10,971 (21.9%) |
| Bachelor's Degree or higher | 39,868 (89.2%) | 4,803 (10.7%) |
Occupancy by Age of Householder in Anoka County
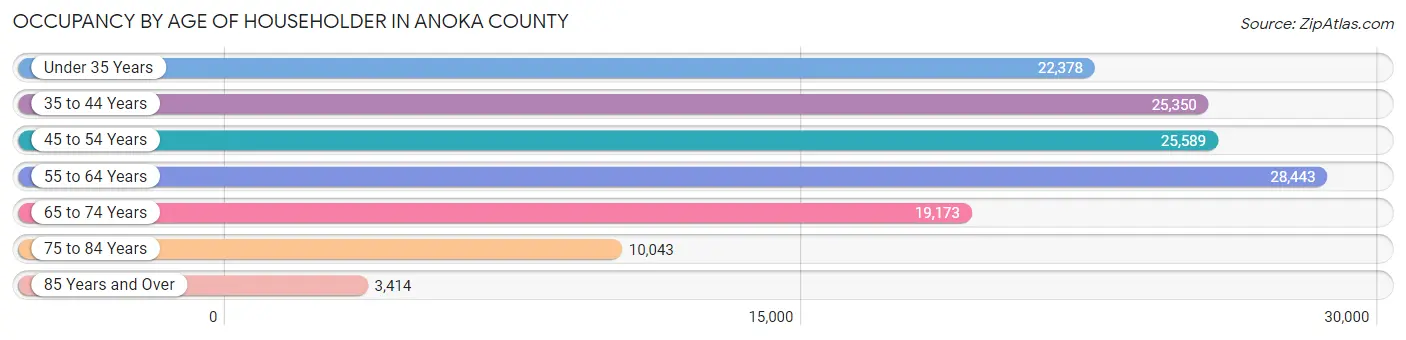
| Age Bracket | # Households | % Households |
| Under 35 Years | 22,378 | 16.7% |
| 35 to 44 Years | 25,350 | 18.9% |
| 45 to 54 Years | 25,589 | 19.0% |
| 55 to 64 Years | 28,443 | 21.2% |
| 65 to 74 Years | 19,173 | 14.3% |
| 75 to 84 Years | 10,043 | 7.5% |
| 85 Years and Over | 3,414 | 2.5% |
| Total | 134,390 | 100.0% |
Housing Finances in Anoka County
Median Income by Occupancy in Anoka County
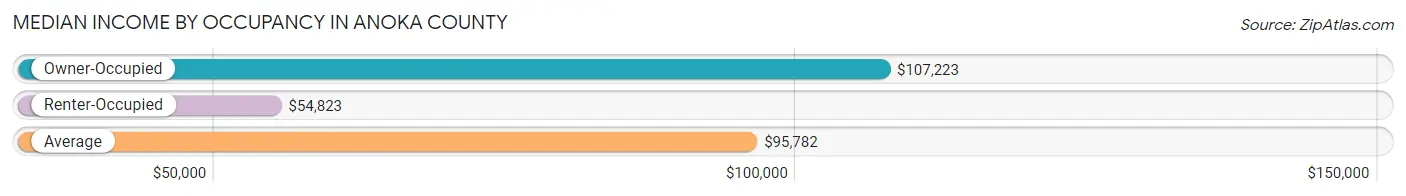
| Occupancy Type | # Households | Median Income |
| Owner-Occupied | 107,811 (80.2%) | $107,223 |
| Renter-Occupied | 26,579 (19.8%) | $54,823 |
| Average | 134,390 (100.0%) | $95,782 |
Occupancy by Householder Income Bracket in Anoka County
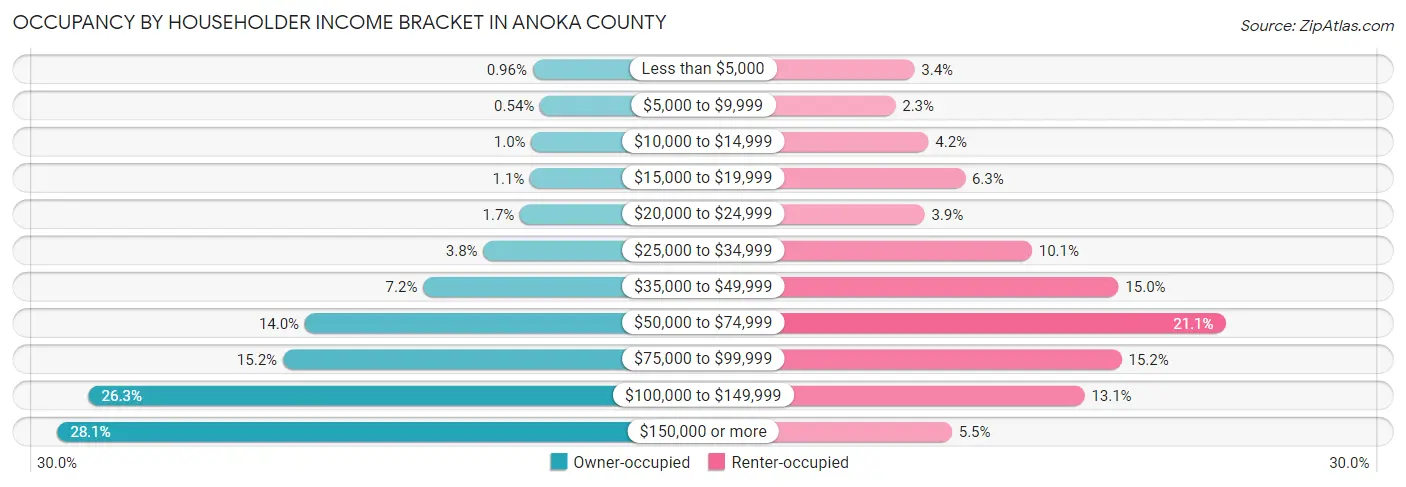
| Income Bracket | Owner-occupied | Renter-occupied |
| Less than $5,000 | 1,032 (1.0%) | 893 (3.4%) |
| $5,000 to $9,999 | 578 (0.5%) | 603 (2.3%) |
| $10,000 to $14,999 | 1,119 (1.0%) | 1,107 (4.2%) |
| $15,000 to $19,999 | 1,193 (1.1%) | 1,662 (6.2%) |
| $20,000 to $24,999 | 1,813 (1.7%) | 1,048 (3.9%) |
| $25,000 to $34,999 | 4,071 (3.8%) | 2,677 (10.1%) |
| $35,000 to $49,999 | 7,779 (7.2%) | 3,993 (15.0%) |
| $50,000 to $74,999 | 15,074 (14.0%) | 5,616 (21.1%) |
| $75,000 to $99,999 | 16,430 (15.2%) | 4,041 (15.2%) |
| $100,000 to $149,999 | 28,395 (26.3%) | 3,476 (13.1%) |
| $150,000 or more | 30,327 (28.1%) | 1,463 (5.5%) |
| Total | 107,811 (100.0%) | 26,579 (100.0%) |
Monthly Housing Cost Tiers in Anoka County
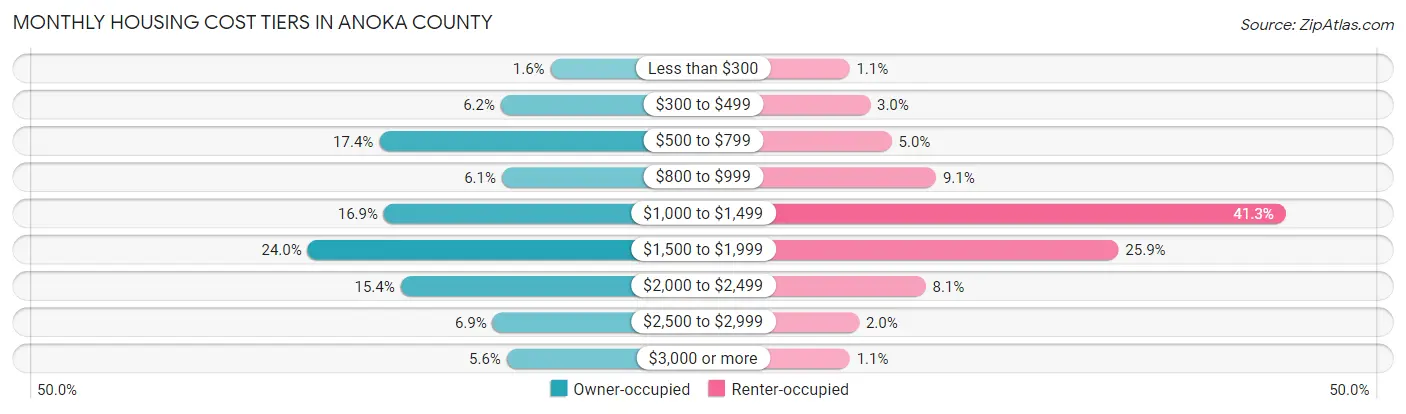
| Monthly Cost | Owner-occupied | Renter-occupied |
| Less than $300 | 1,717 (1.6%) | 295 (1.1%) |
| $300 to $499 | 6,646 (6.2%) | 798 (3.0%) |
| $500 to $799 | 18,717 (17.4%) | 1,325 (5.0%) |
| $800 to $999 | 6,543 (6.1%) | 2,410 (9.1%) |
| $1,000 to $1,499 | 18,257 (16.9%) | 10,966 (41.3%) |
| $1,500 to $1,999 | 25,817 (23.9%) | 6,876 (25.9%) |
| $2,000 to $2,499 | 16,595 (15.4%) | 2,156 (8.1%) |
| $2,500 to $2,999 | 7,463 (6.9%) | 526 (2.0%) |
| $3,000 or more | 6,056 (5.6%) | 300 (1.1%) |
| Total | 107,811 (100.0%) | 26,579 (100.0%) |
Physical Housing Characteristics in Anoka County
Housing Structures in Anoka County
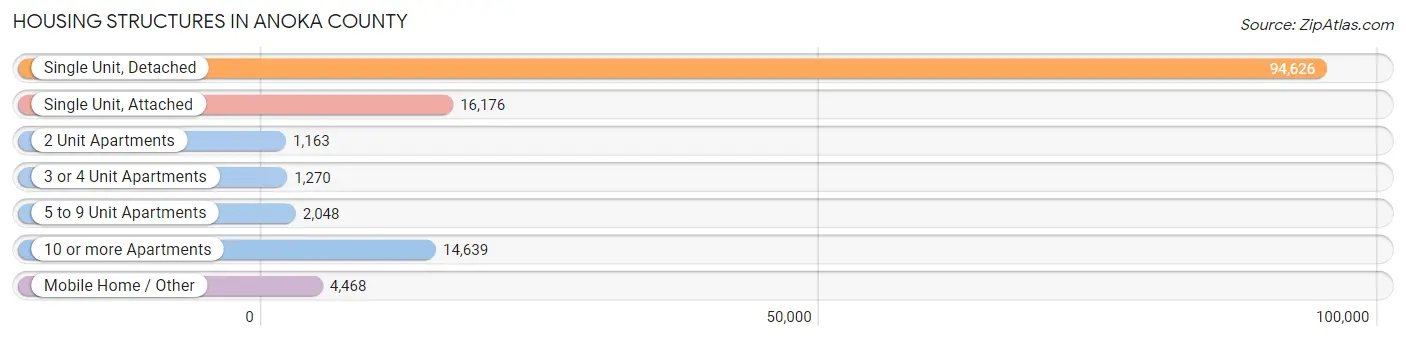
| Structure Type | # Housing Units | % Housing Units |
| Single Unit, Detached | 94,626 | 70.4% |
| Single Unit, Attached | 16,176 | 12.0% |
| 2 Unit Apartments | 1,163 | 0.9% |
| 3 or 4 Unit Apartments | 1,270 | 0.9% |
| 5 to 9 Unit Apartments | 2,048 | 1.5% |
| 10 or more Apartments | 14,639 | 10.9% |
| Mobile Home / Other | 4,468 | 3.3% |
| Total | 134,390 | 100.0% |
Housing Structures by Occupancy in Anoka County
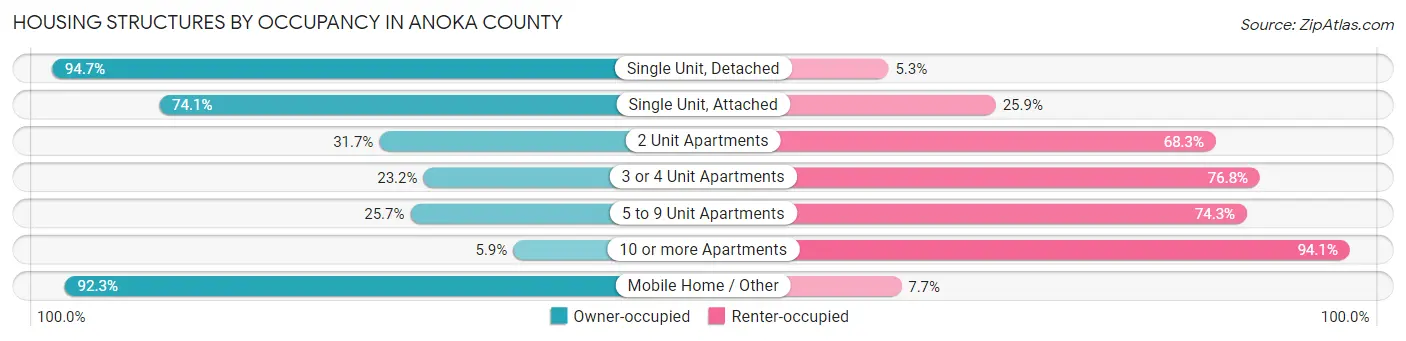
| Structure Type | Owner-occupied | Renter-occupied |
| Single Unit, Detached | 89,644 (94.7%) | 4,982 (5.3%) |
| Single Unit, Attached | 11,984 (74.1%) | 4,192 (25.9%) |
| 2 Unit Apartments | 369 (31.7%) | 794 (68.3%) |
| 3 or 4 Unit Apartments | 295 (23.2%) | 975 (76.8%) |
| 5 to 9 Unit Apartments | 527 (25.7%) | 1,521 (74.3%) |
| 10 or more Apartments | 869 (5.9%) | 13,770 (94.1%) |
| Mobile Home / Other | 4,123 (92.3%) | 345 (7.7%) |
| Total | 107,811 (80.2%) | 26,579 (19.8%) |
Housing Structures by Number of Rooms in Anoka County
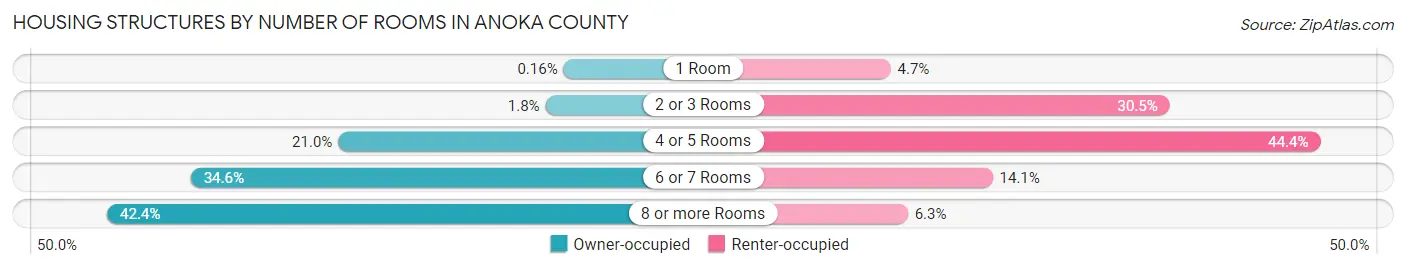
| Number of Rooms | Owner-occupied | Renter-occupied |
| 1 Room | 176 (0.2%) | 1,247 (4.7%) |
| 2 or 3 Rooms | 1,976 (1.8%) | 8,104 (30.5%) |
| 4 or 5 Rooms | 22,643 (21.0%) | 11,809 (44.4%) |
| 6 or 7 Rooms | 37,337 (34.6%) | 3,752 (14.1%) |
| 8 or more Rooms | 45,679 (42.4%) | 1,667 (6.3%) |
| Total | 107,811 (100.0%) | 26,579 (100.0%) |
Housing Structure by Heating Type in Anoka County
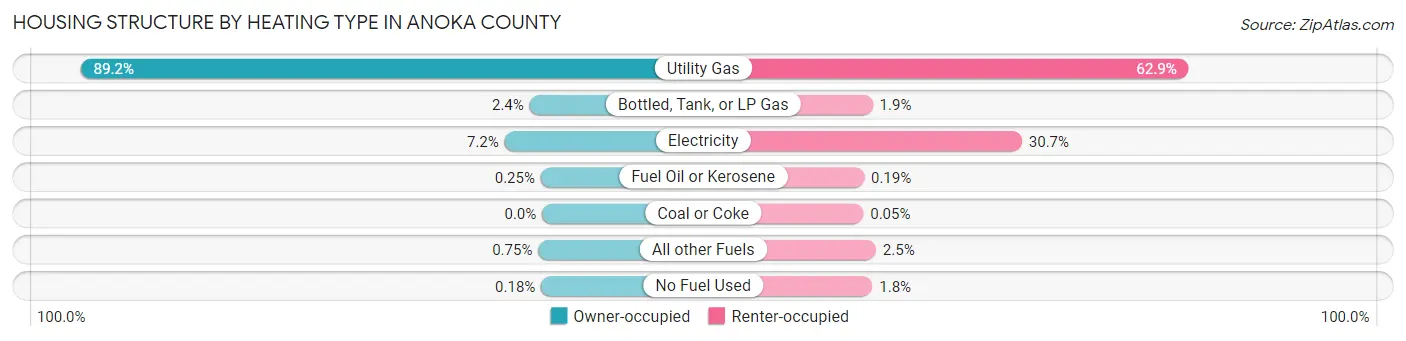
| Heating Type | Owner-occupied | Renter-occupied |
| Utility Gas | 96,134 (89.2%) | 16,722 (62.9%) |
| Bottled, Tank, or LP Gas | 2,600 (2.4%) | 494 (1.9%) |
| Electricity | 7,801 (7.2%) | 8,157 (30.7%) |
| Fuel Oil or Kerosene | 270 (0.3%) | 51 (0.2%) |
| Coal or Coke | 0 (0.0%) | 13 (0.1%) |
| All other Fuels | 807 (0.7%) | 663 (2.5%) |
| No Fuel Used | 199 (0.2%) | 479 (1.8%) |
| Total | 107,811 (100.0%) | 26,579 (100.0%) |
Household Vehicle Usage in Anoka County
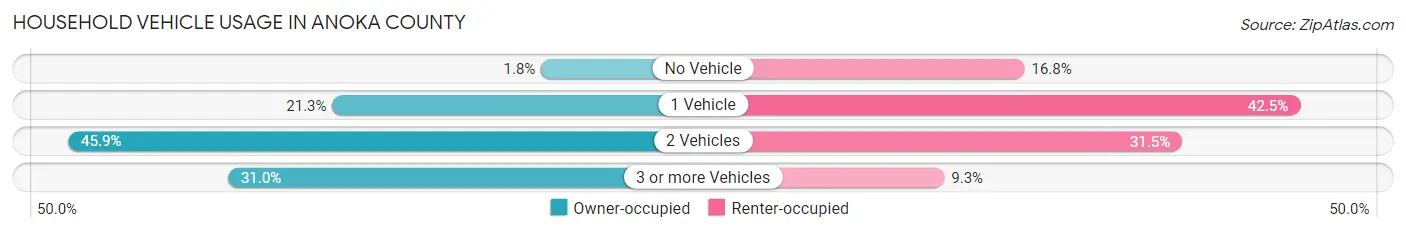
| Vehicles per Household | Owner-occupied | Renter-occupied |
| No Vehicle | 1,917 (1.8%) | 4,457 (16.8%) |
| 1 Vehicle | 22,928 (21.3%) | 11,293 (42.5%) |
| 2 Vehicles | 49,521 (45.9%) | 8,363 (31.5%) |
| 3 or more Vehicles | 33,445 (31.0%) | 2,466 (9.3%) |
| Total | 107,811 (100.0%) | 26,579 (100.0%) |
Real Estate & Mortgages in Anoka County
Real Estate and Mortgage Overview in Anoka County
| Characteristic | Without Mortgage | With Mortgage |
| Housing Units | 31,819 | 75,992 |
| Median Property Value | $281,700 | $313,200 |
| Median Household Income | $79,472 | $24,954 |
| Monthly Housing Costs | $624 | $6,002 |
| Real Estate Taxes | $2,851 | $1,013 |
Property Value by Mortgage Status in Anoka County
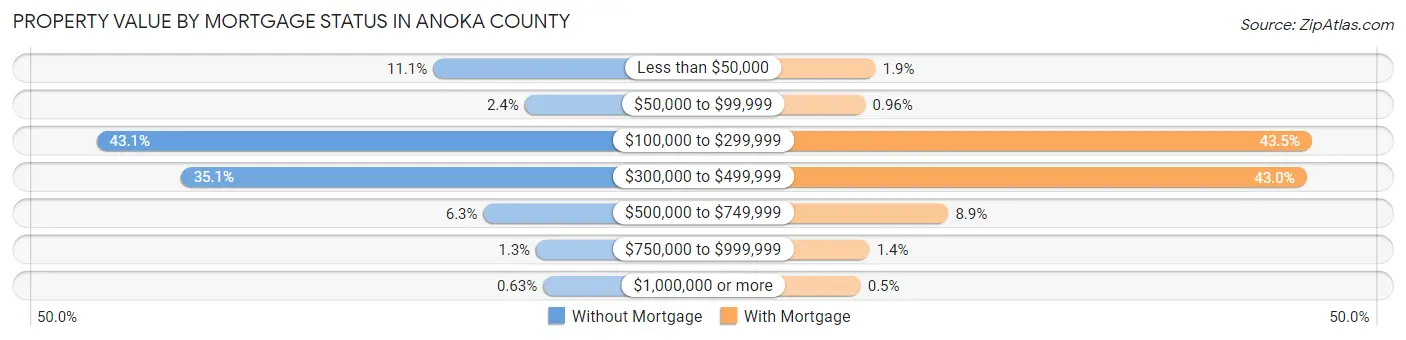
| Property Value | Without Mortgage | With Mortgage |
| Less than $50,000 | 3,533 (11.1%) | 1,470 (1.9%) |
| $50,000 to $99,999 | 759 (2.4%) | 732 (1.0%) |
| $100,000 to $299,999 | 13,727 (43.1%) | 33,021 (43.4%) |
| $300,000 to $499,999 | 11,179 (35.1%) | 32,637 (42.9%) |
| $500,000 to $749,999 | 2,007 (6.3%) | 6,729 (8.8%) |
| $750,000 to $999,999 | 415 (1.3%) | 1,026 (1.3%) |
| $1,000,000 or more | 199 (0.6%) | 377 (0.5%) |
| Total | 31,819 (100.0%) | 75,992 (100.0%) |
Household Income by Mortgage Status in Anoka County
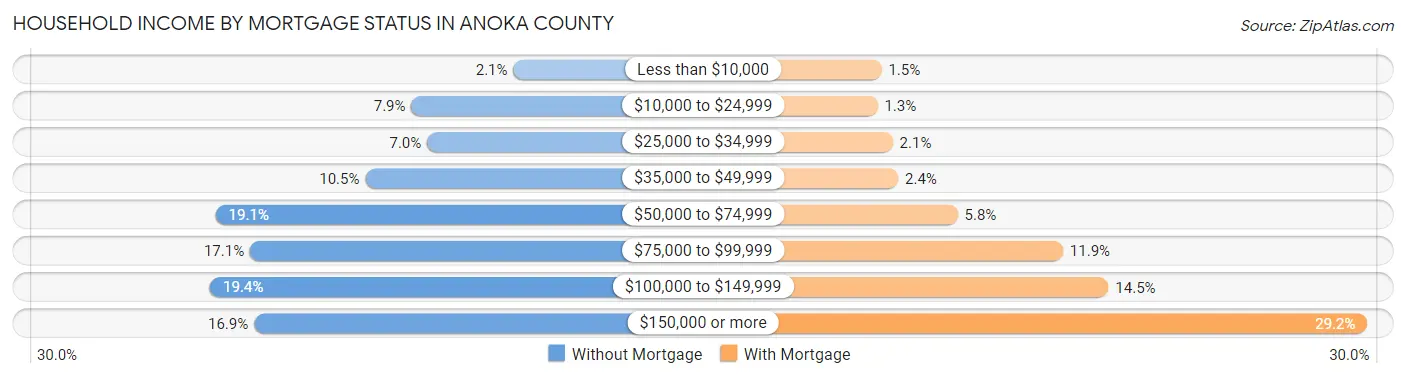
| Household Income | Without Mortgage | With Mortgage |
| Less than $10,000 | 660 (2.1%) | 1,126 (1.5%) |
| $10,000 to $24,999 | 2,513 (7.9%) | 950 (1.3%) |
| $25,000 to $34,999 | 2,227 (7.0%) | 1,612 (2.1%) |
| $35,000 to $49,999 | 3,351 (10.5%) | 1,844 (2.4%) |
| $50,000 to $74,999 | 6,072 (19.1%) | 4,428 (5.8%) |
| $75,000 to $99,999 | 5,449 (17.1%) | 9,002 (11.8%) |
| $100,000 to $149,999 | 6,174 (19.4%) | 10,981 (14.4%) |
| $150,000 or more | 5,373 (16.9%) | 22,221 (29.2%) |
| Total | 31,819 (100.0%) | 75,992 (100.0%) |
Property Value to Household Income Ratio in Anoka County
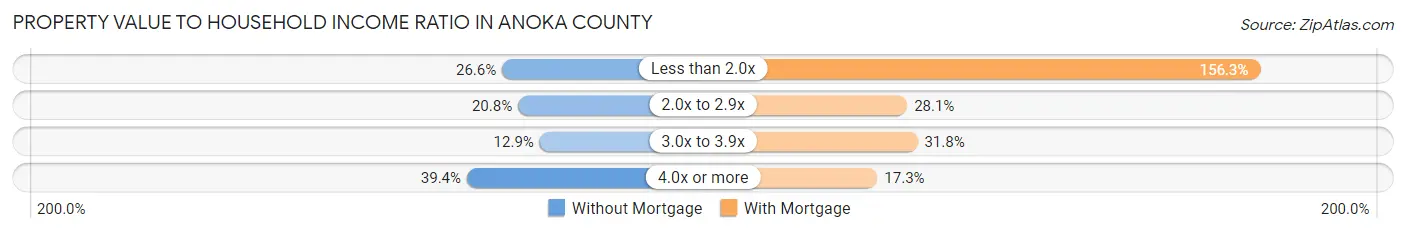
| Value-to-Income Ratio | Without Mortgage | With Mortgage |
| Less than 2.0x | 8,454 (26.6%) | 118,778 (156.3%) |
| 2.0x to 2.9x | 6,615 (20.8%) | 21,332 (28.1%) |
| 3.0x to 3.9x | 4,112 (12.9%) | 24,165 (31.8%) |
| 4.0x or more | 12,528 (39.4%) | 13,112 (17.2%) |
| Total | 31,819 (100.0%) | 75,992 (100.0%) |
Real Estate Taxes by Mortgage Status in Anoka County
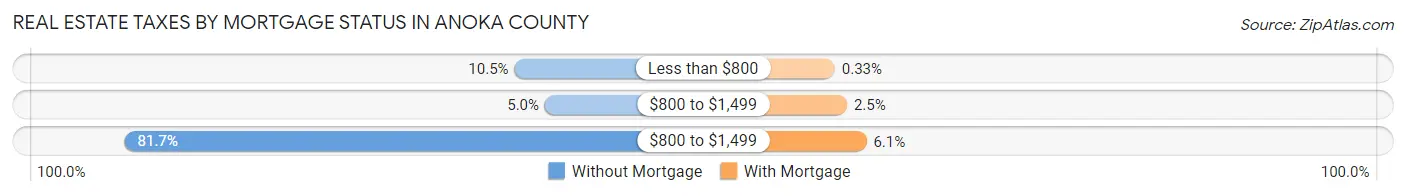
| Property Taxes | Without Mortgage | With Mortgage |
| Less than $800 | 3,354 (10.5%) | 253 (0.3%) |
| $800 to $1,499 | 1,585 (5.0%) | 1,932 (2.5%) |
| $800 to $1,499 | 26,006 (81.7%) | 4,636 (6.1%) |
| Total | 31,819 (100.0%) | 75,992 (100.0%) |
Health & Disability in Anoka County
Health Insurance Coverage by Age in Anoka County
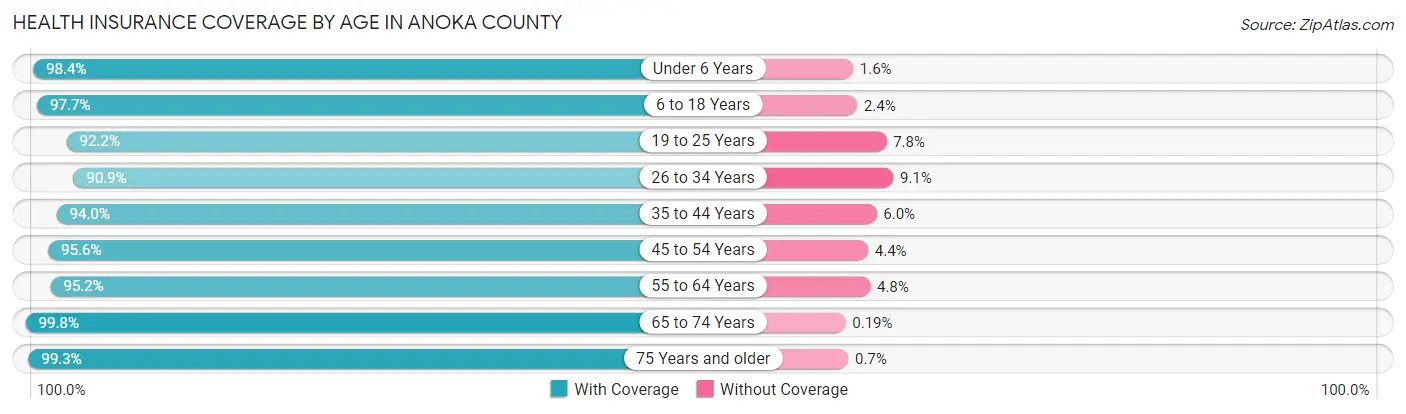
| Age Bracket | With Coverage | Without Coverage |
| Under 6 Years | 25,341 (98.4%) | 412 (1.6%) |
| 6 to 18 Years | 63,553 (97.7%) | 1,532 (2.4%) |
| 19 to 25 Years | 26,017 (92.2%) | 2,206 (7.8%) |
| 26 to 34 Years | 38,604 (90.9%) | 3,862 (9.1%) |
| 35 to 44 Years | 46,655 (94.0%) | 2,961 (6.0%) |
| 45 to 54 Years | 45,210 (95.6%) | 2,077 (4.4%) |
| 55 to 64 Years | 48,154 (95.2%) | 2,426 (4.8%) |
| 65 to 74 Years | 32,435 (99.8%) | 62 (0.2%) |
| 75 Years and older | 19,805 (99.3%) | 140 (0.7%) |
| Total | 345,774 (95.7%) | 15,678 (4.3%) |
Health Insurance Coverage by Citizenship Status in Anoka County
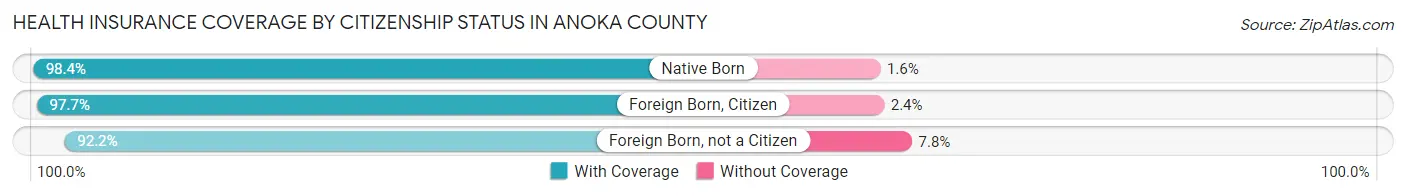
| Citizenship Status | With Coverage | Without Coverage |
| Native Born | 25,341 (98.4%) | 412 (1.6%) |
| Foreign Born, Citizen | 63,553 (97.7%) | 1,532 (2.4%) |
| Foreign Born, not a Citizen | 26,017 (92.2%) | 2,206 (7.8%) |
Health Insurance Coverage by Household Income in Anoka County
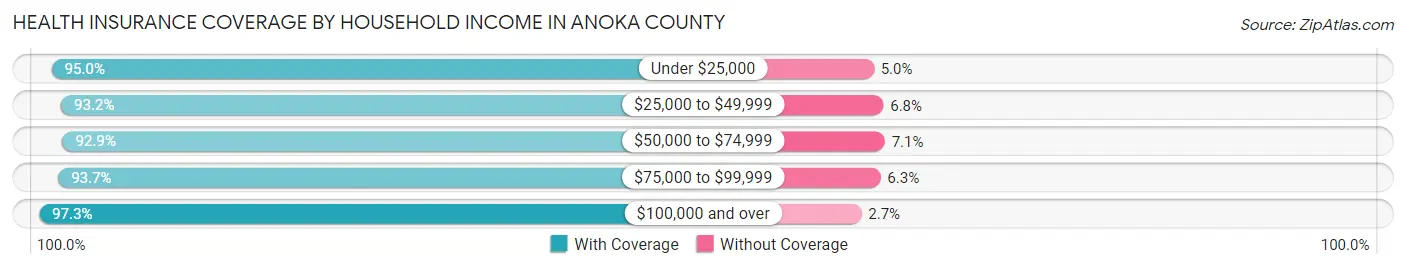
| Household Income | With Coverage | Without Coverage |
| Under $25,000 | 16,781 (95.0%) | 890 (5.0%) |
| $25,000 to $49,999 | 33,580 (93.2%) | 2,465 (6.8%) |
| $50,000 to $74,999 | 43,239 (92.9%) | 3,303 (7.1%) |
| $75,000 to $99,999 | 49,399 (93.7%) | 3,319 (6.3%) |
| $100,000 and over | 201,829 (97.3%) | 5,669 (2.7%) |
Public vs Private Health Insurance Coverage by Age in Anoka County
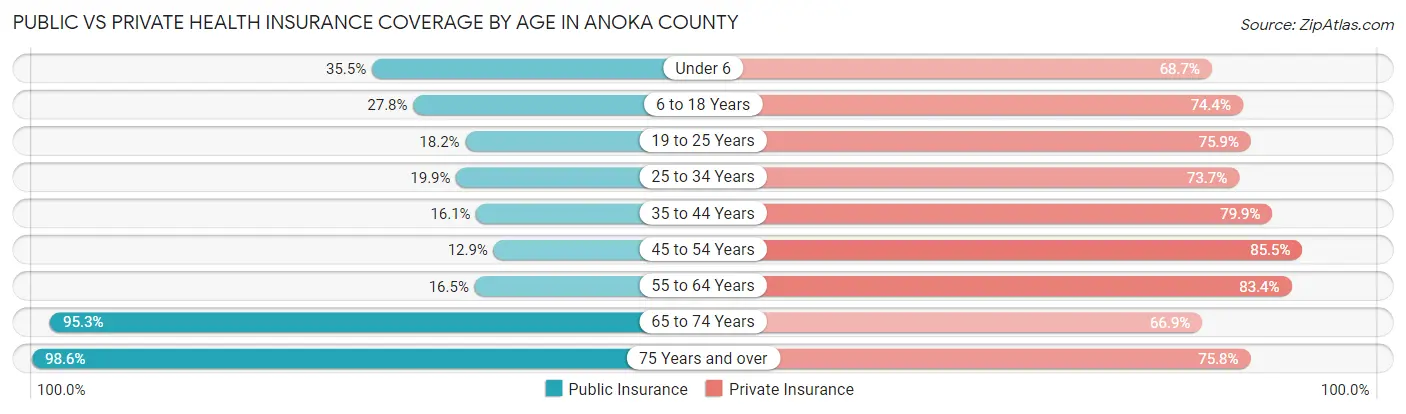
| Age Bracket | Public Insurance | Private Insurance |
| Under 6 | 9,146 (35.5%) | 17,679 (68.6%) |
| 6 to 18 Years | 18,120 (27.8%) | 48,431 (74.4%) |
| 19 to 25 Years | 5,130 (18.2%) | 21,425 (75.9%) |
| 25 to 34 Years | 8,433 (19.9%) | 31,312 (73.7%) |
| 35 to 44 Years | 8,002 (16.1%) | 39,646 (79.9%) |
| 45 to 54 Years | 6,112 (12.9%) | 40,418 (85.5%) |
| 55 to 64 Years | 8,322 (16.5%) | 42,203 (83.4%) |
| 65 to 74 Years | 30,953 (95.3%) | 21,734 (66.9%) |
| 75 Years and over | 19,665 (98.6%) | 15,125 (75.8%) |
| Total | 113,883 (31.5%) | 277,973 (76.9%) |
Disability Status by Sex by Age in Anoka County
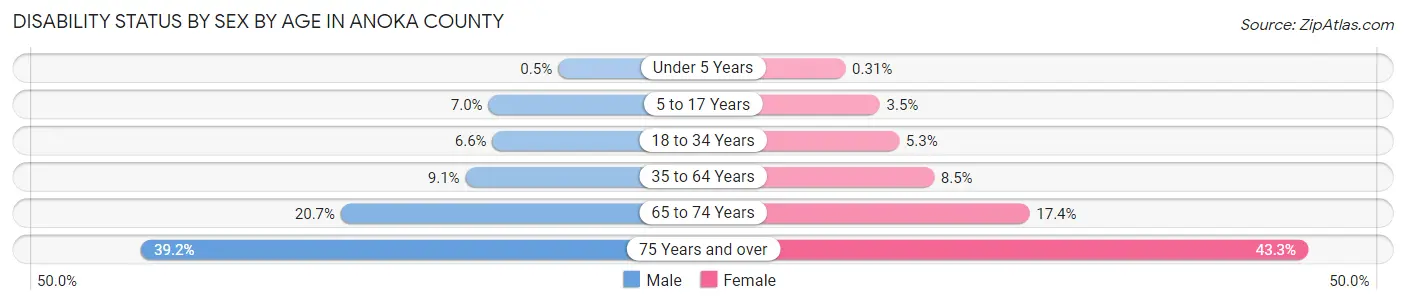
| Age Bracket | Male | Female |
| Under 5 Years | 55 (0.5%) | 33 (0.3%) |
| 5 to 17 Years | 2,275 (7.0%) | 1,101 (3.5%) |
| 18 to 34 Years | 2,551 (6.6%) | 1,949 (5.3%) |
| 35 to 64 Years | 6,821 (9.1%) | 6,182 (8.5%) |
| 65 to 74 Years | 3,211 (20.6%) | 2,951 (17.4%) |
| 75 Years and over | 3,307 (39.2%) | 4,976 (43.2%) |
Disability Class by Sex by Age in Anoka County
Disability Class: Hearing Difficulty
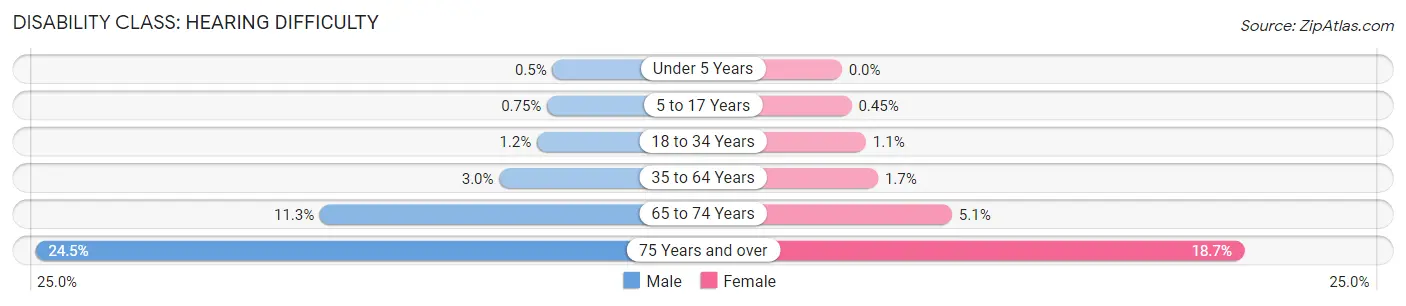
| Age Bracket | Male | Female |
| Under 5 Years | 55 (0.5%) | 0 (0.0%) |
| 5 to 17 Years | 246 (0.7%) | 140 (0.4%) |
| 18 to 34 Years | 474 (1.2%) | 413 (1.1%) |
| 35 to 64 Years | 2,230 (3.0%) | 1,215 (1.7%) |
| 65 to 74 Years | 1,755 (11.3%) | 866 (5.1%) |
| 75 Years and over | 2,068 (24.5%) | 2,145 (18.6%) |
Disability Class: Vision Difficulty
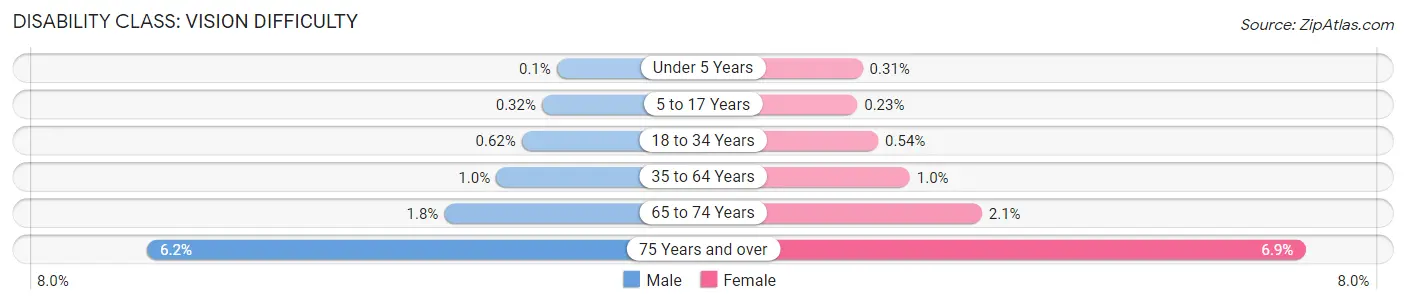
| Age Bracket | Male | Female |
| Under 5 Years | 11 (0.1%) | 33 (0.3%) |
| 5 to 17 Years | 104 (0.3%) | 71 (0.2%) |
| 18 to 34 Years | 242 (0.6%) | 200 (0.5%) |
| 35 to 64 Years | 749 (1.0%) | 733 (1.0%) |
| 65 to 74 Years | 275 (1.8%) | 352 (2.1%) |
| 75 Years and over | 522 (6.2%) | 792 (6.9%) |
Disability Class: Cognitive Difficulty
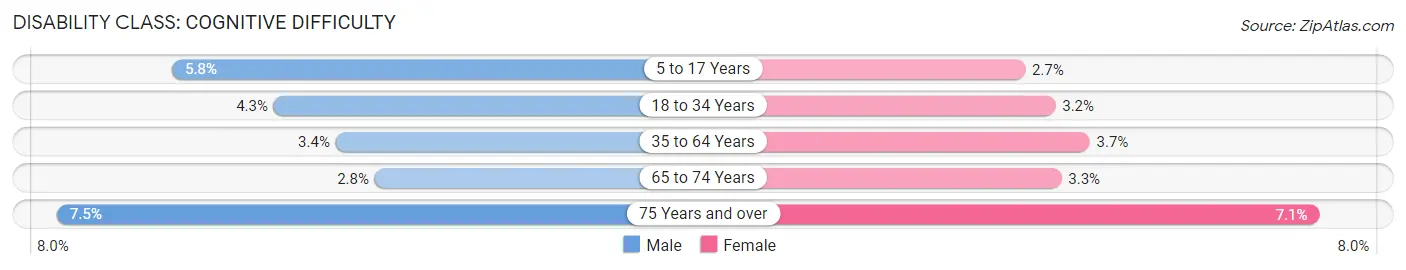
| Age Bracket | Male | Female |
| 5 to 17 Years | 1,900 (5.8%) | 854 (2.7%) |
| 18 to 34 Years | 1,668 (4.3%) | 1,167 (3.2%) |
| 35 to 64 Years | 2,537 (3.4%) | 2,663 (3.7%) |
| 65 to 74 Years | 435 (2.8%) | 553 (3.3%) |
| 75 Years and over | 635 (7.5%) | 816 (7.1%) |
Disability Class: Ambulatory Difficulty
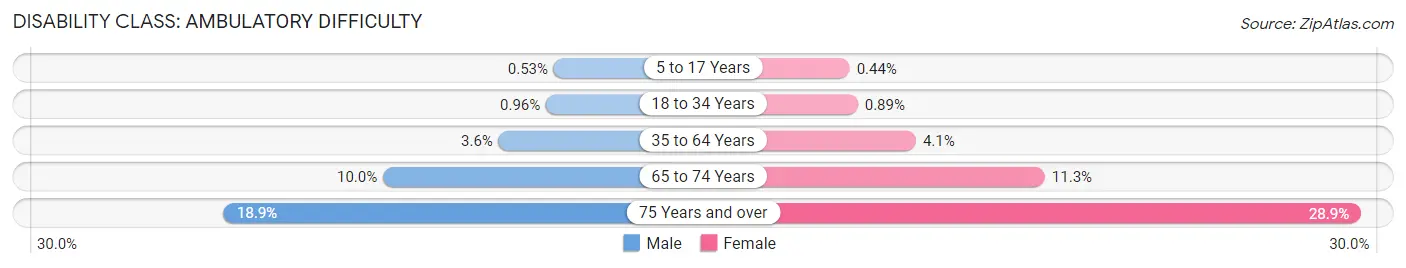
| Age Bracket | Male | Female |
| 5 to 17 Years | 175 (0.5%) | 139 (0.4%) |
| 18 to 34 Years | 372 (1.0%) | 327 (0.9%) |
| 35 to 64 Years | 2,701 (3.6%) | 2,990 (4.1%) |
| 65 to 74 Years | 1,561 (10.0%) | 1,917 (11.3%) |
| 75 Years and over | 1,595 (18.9%) | 3,326 (28.9%) |
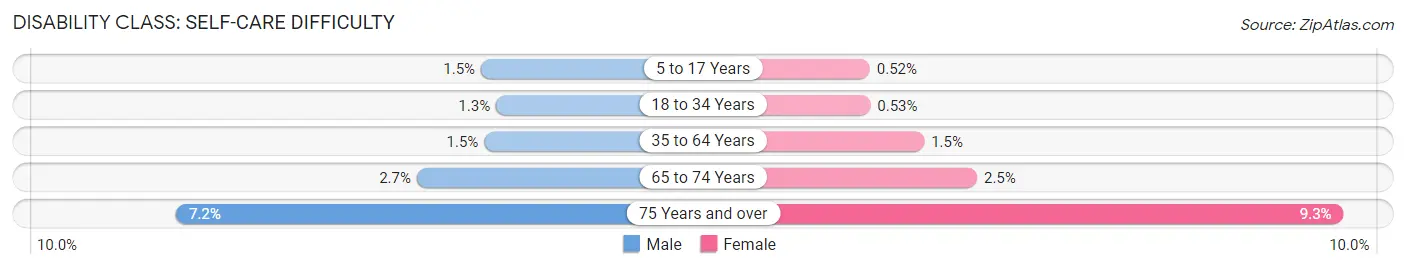
Disability Class: Self-Care Difficulty
| Age Bracket | Male | Female |
| 5 to 17 Years | 500 (1.5%) | 163 (0.5%) |
| 18 to 34 Years | 486 (1.3%) | 194 (0.5%) |
| 35 to 64 Years | 1,102 (1.5%) | 1,107 (1.5%) |
| 65 to 74 Years | 423 (2.7%) | 425 (2.5%) |
| 75 Years and over | 607 (7.2%) | 1,071 (9.3%) |
Technology Access in Anoka County
Computing Device Access in Anoka County
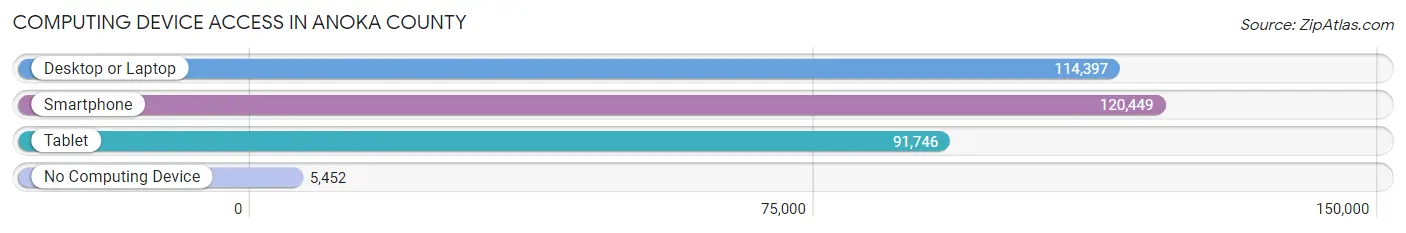
| Device Type | # Households | % Households |
| Desktop or Laptop | 114,397 | 85.1% |
| Smartphone | 120,449 | 89.6% |
| Tablet | 91,746 | 68.3% |
| No Computing Device | 5,452 | 4.1% |
| Total | 134,390 | 100.0% |
Internet Access in Anoka County
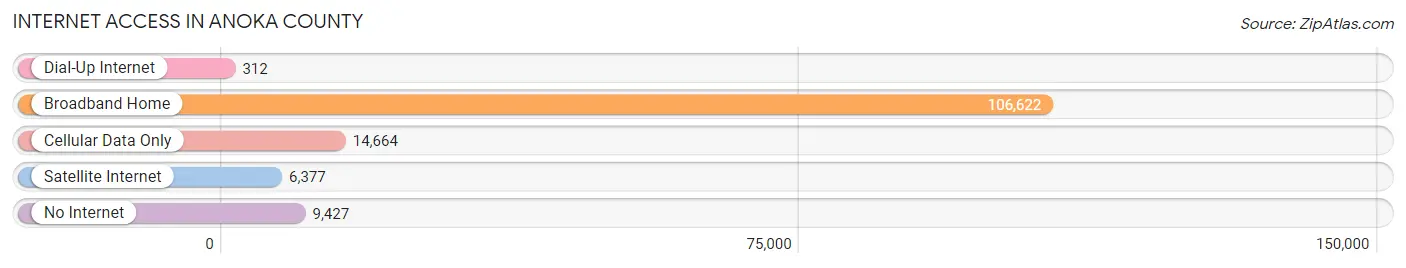
| Internet Type | # Households | % Households |
| Dial-Up Internet | 312 | 0.2% |
| Broadband Home | 106,622 | 79.3% |
| Cellular Data Only | 14,664 | 10.9% |
| Satellite Internet | 6,377 | 4.8% |
| No Internet | 9,427 | 7.0% |
| Total | 134,390 | 100.0% |
Anoka County Summary
Anoka County, Minnesota is located in the Twin Cities metropolitan area of the state and is the fourth most populous county in the state. It is bordered by the Mississippi River to the north, Isanti County to the east, Chisago County to the south, and Hennepin County to the west. The county seat is Anoka, and the largest city is Blaine.
History
Anoka County was established in 1857 and was named after the Dakota word for “on both sides” or “both banks”. The county was originally part of the Minnesota Territory and was one of the original nine counties established in the state. The county was originally populated by Native American tribes, including the Dakota, Ojibwe, and Sioux.
The first settlers in the area were French fur traders, who established trading posts in the area in the late 1700s. The first permanent settlers arrived in the early 1800s, and the county was officially organized in 1857. The county was initially an agricultural area, with the main crops being wheat, corn, and oats.
In the late 1800s, the county began to industrialize, with the first railroad being built in 1867. This led to the development of several small towns, including Anoka, Blaine, and Coon Rapids. The county also saw an influx of immigrants from Europe, particularly from Germany, Sweden, and Norway.
Geography
Anoka County covers an area of 545 square miles and is located in the central part of the state. The county is mostly flat, with the highest point being the summit of Bunker Hill, which is 1,093 feet above sea level. The county is drained by the Mississippi River, which forms its northern border, and the Rum River, which flows through the county.
The county is home to several parks and recreational areas, including the Anoka County Parks and Recreation System, which includes more than 20 parks and trails. The county also has several lakes, including Lake George, Lake George Regional Park, and Rice Lake.
Economy
Anoka County has a diverse economy, with the largest sectors being manufacturing, healthcare, and retail. The county is home to several large employers, including Medtronic, Target, and Anoka County Medical Center. The county also has a strong agricultural sector, with the main crops being corn, soybeans, and wheat.
The county has a median household income of $71,845, which is higher than the state average. The unemployment rate in the county is 3.7%, which is lower than the state average.
Demographics
As of the 2020 census, Anoka County had a population of 348,845. The population is spread out, with 24.3% under the age of 18, 10.2% from 18 to 24, 33.2% from 25 to 44, 22.2% from 45 to 64, and 10.1% who were 65 years of age or older. The median age in the county is 36.7 years.
The racial makeup of the county is 87.2% White, 5.2% Black or African American, 2.2% Asian, 0.5% Native American, 0.1% Pacific Islander, 2.7% from other races, and 2.1% from two or more races. The largest ancestry groups in the county are German (25.2%), Norwegian (17.2%), Irish (13.2%), Swedish (10.2%), and English (7.2%).
The county has a large immigrant population, with 11.2% of the population being foreign-born. The largest foreign-born populations are from Mexico (25.2%), India (7.2%), Somalia (6.2%), and Laos (4.2%). The county also has a large LGBT population, with 4.2% of the population identifying as LGBT.
Common Questions
What is the Total Population of Anoka County?
Total Population of Anoka County is 363,985.
What is the Total Male Population of Anoka County?
Total Male Population of Anoka County is 183,494.
What is the Total Female Population of Anoka County?
Total Female Population of Anoka County is 180,491.
What is the Ratio of Males per 100 Females in Anoka County?
There are 101.66 Males per 100 Females in Anoka County.
What is the Ratio of Females per 100 Males in Anoka County?
There are 98.36 Females per 100 Males in Anoka County.
What is the Median Population Age in Anoka County?
Median Population Age in Anoka County is 38.8 Years.
What is the Average Family Size in Anoka County
Average Family Size in Anoka County is 3.2 People.
What is the Average Household Size in Anoka County
Average Household Size in Anoka County is 2.7 People.
What is Per Capita Income in Anoka County?
Per Capita income in Anoka County is $43,106.
What is the Median Family Income in Anoka County?
Median Family Income in Anoka County is $110,651.
What is the Median Household income in Anoka County?
Median Household Income in Anoka County is $95,782.
What is Income or Wage Gap in Anoka County?
Income or Wage Gap in Anoka County is 25.8%.
Women in Anoka County earn 74.2 cents for every dollar earned by a man.
What is Family Income Deficit in Anoka County?
Family Income Deficit in Anoka County is $9,992.
Families that are below poverty line in Anoka County earn $9,992 less on average than the poverty threshold level.
What is Inequality or Gini Index in Anoka County?
Inequality or Gini Index in Anoka County is 0.39.
How Large is the Labor Force in Anoka County?
There are 202,932 People in the Labor Forcein in Anoka County.
What is the Percentage of People in the Labor Force in Anoka County?
70.4% of People are in the Labor Force in Anoka County.
What is the Unemployment Rate in Anoka County?
Unemployment Rate in Anoka County is 4.0%.