Akeley, MN
Akeley Map
Akeley Overview
363
TOTAL POPULATION
171
MALE POPULATION
192
FEMALE POPULATION
89.06
MALES / 100 FEMALES
112.28
FEMALES / 100 MALES
44.5
MEDIAN AGE
3.0
AVG FAMILY SIZE
2.1
AVG HOUSEHOLD SIZE
$25,044
PER CAPITA INCOME
$55,313
AVG FAMILY INCOME
$47,083
AVG HOUSEHOLD INCOME
36.1%
WAGE / INCOME GAP [ % ]
63.9¢/ $1
WAGE / INCOME GAP [ $ ]
0.40
INEQUALITY / GINI INDEX
126
LABOR FORCE [ PEOPLE ]
45.5%
PERCENT IN LABOR FORCE
5.6%
UNEMPLOYMENT RATE
Akeley Zip Codes
Akeley Area Codes
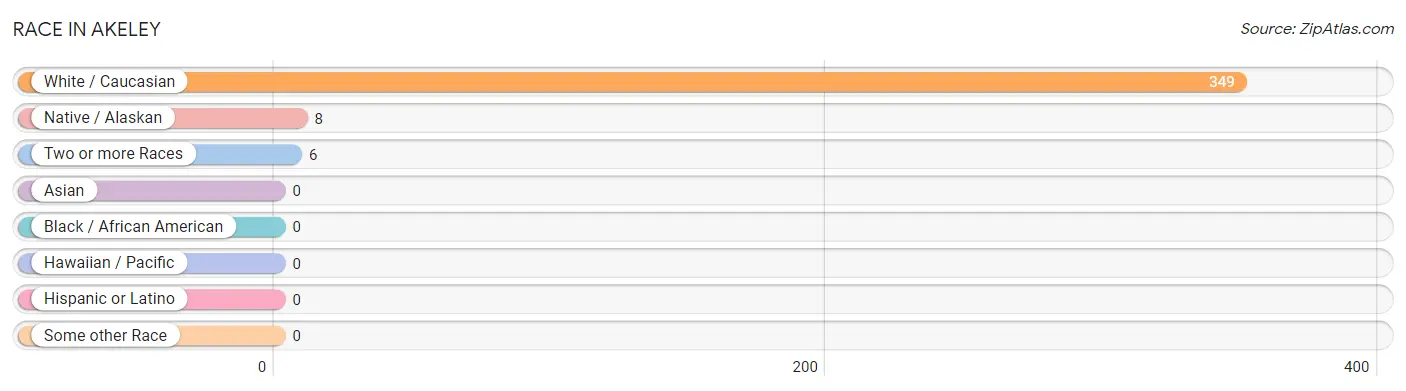
Race in Akeley
The most populous races in Akeley are White / Caucasian (349 | 96.1%), Native / Alaskan (8 | 2.2%), and Two or more Races (6 | 1.7%).
| Race | # Population | % Population |
| Asian | 0 | 0.0% |
| Black / African American | 0 | 0.0% |
| Hawaiian / Pacific | 0 | 0.0% |
| Hispanic or Latino | 0 | 0.0% |
| Native / Alaskan | 8 | 2.2% |
| White / Caucasian | 349 | 96.1% |
| Two or more Races | 6 | 1.7% |
| Some other Race | 0 | 0.0% |
| Total | 363 | 100.0% |
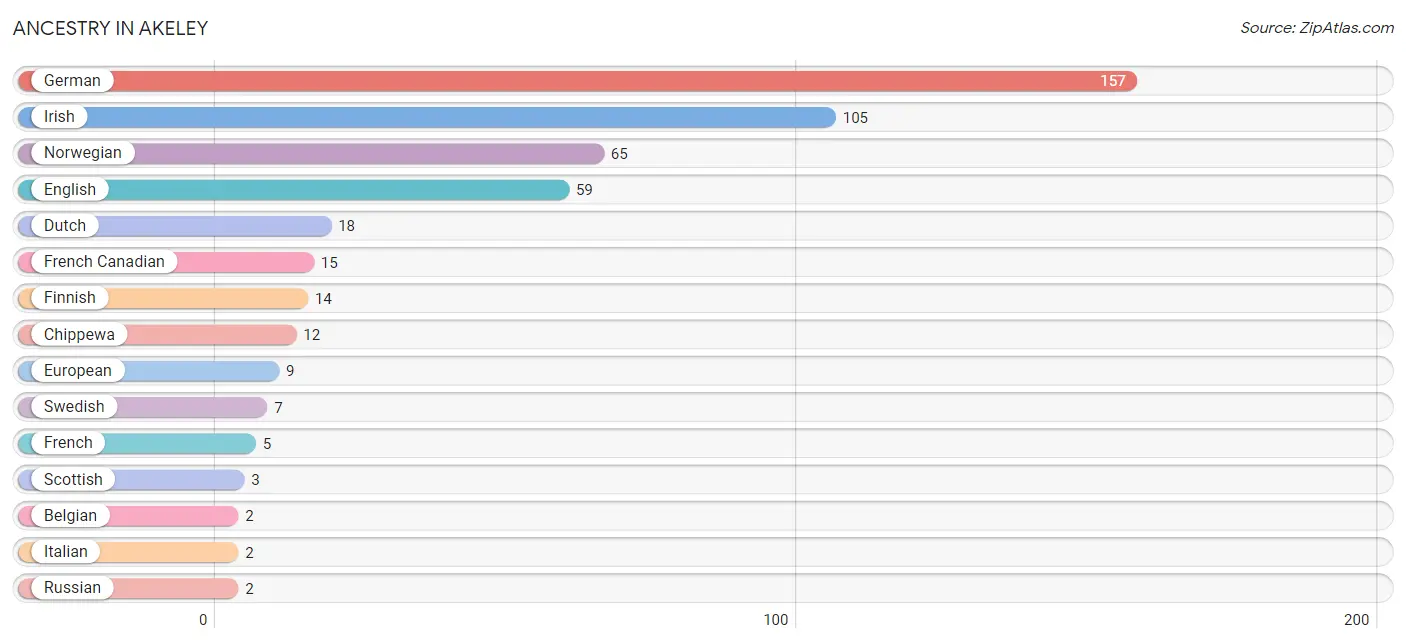
Ancestry in Akeley
The most populous ancestries reported in Akeley are German (157 | 43.2%), Irish (105 | 28.9%), Norwegian (65 | 17.9%), English (59 | 16.3%), and Dutch (18 | 5.0%), together accounting for 111.3% of all Akeley residents.
| Ancestry | # Population | % Population |
| Belgian | 2 | 0.5% |
| Chippewa | 12 | 3.3% |
| Dutch | 18 | 5.0% |
| English | 59 | 16.3% |
| European | 9 | 2.5% |
| Finnish | 14 | 3.9% |
| French | 5 | 1.4% |
| French Canadian | 15 | 4.1% |
| German | 157 | 43.2% |
| Irish | 105 | 28.9% |
| Italian | 2 | 0.5% |
| Norwegian | 65 | 17.9% |
| Russian | 2 | 0.5% |
| Scottish | 3 | 0.8% |
| Swedish | 7 | 1.9% | View All 15 Rows |
Immigrants in Akeley

| Immigration Origin | # Population | % Population | View All 0 Rows |
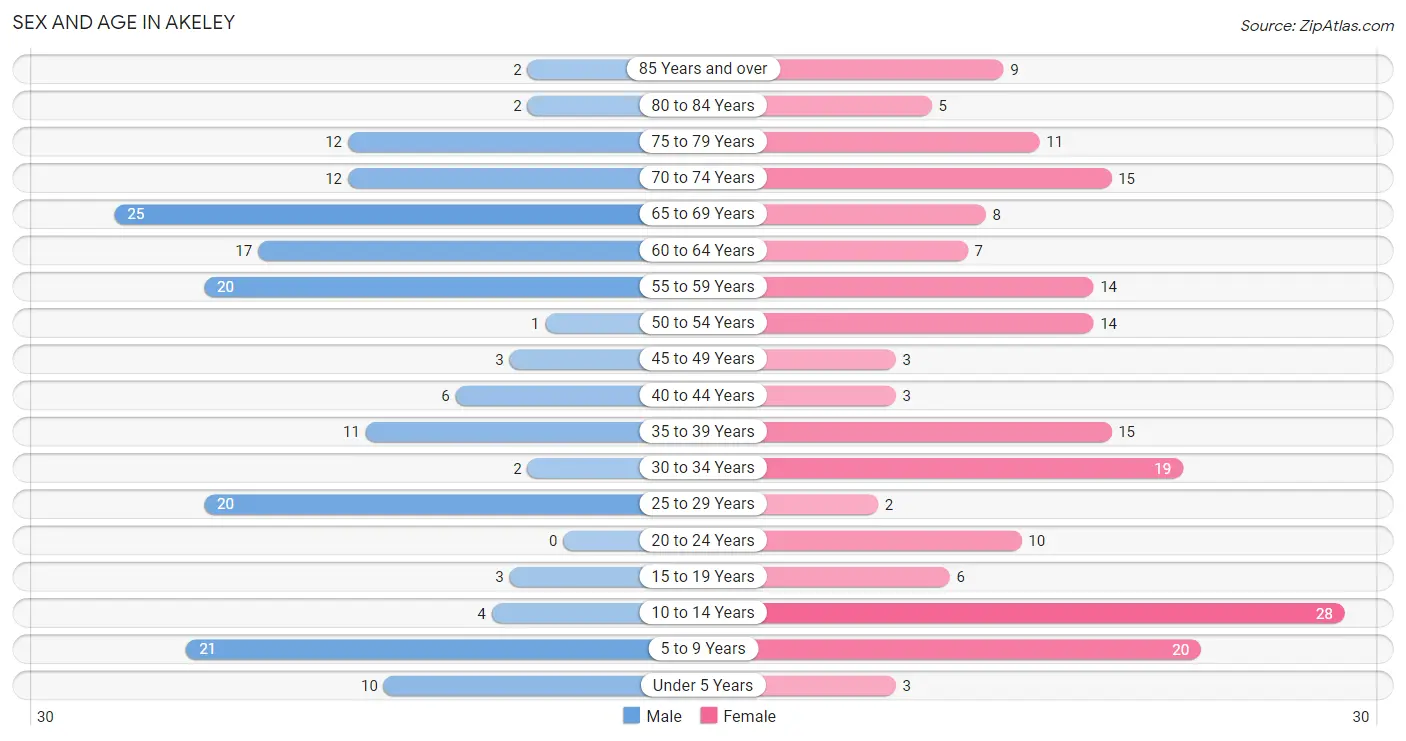
Sex and Age in Akeley
Sex and Age in Akeley
The most populous age groups in Akeley are 65 to 69 Years (25 | 14.6%) for men and 10 to 14 Years (28 | 14.6%) for women.
| Age Bracket | Male | Female |
| Under 5 Years | 10 (5.9%) | 3 (1.6%) |
| 5 to 9 Years | 21 (12.3%) | 20 (10.4%) |
| 10 to 14 Years | 4 (2.3%) | 28 (14.6%) |
| 15 to 19 Years | 3 (1.8%) | 6 (3.1%) |
| 20 to 24 Years | 0 (0.0%) | 10 (5.2%) |
| 25 to 29 Years | 20 (11.7%) | 2 (1.0%) |
| 30 to 34 Years | 2 (1.2%) | 19 (9.9%) |
| 35 to 39 Years | 11 (6.4%) | 15 (7.8%) |
| 40 to 44 Years | 6 (3.5%) | 3 (1.6%) |
| 45 to 49 Years | 3 (1.8%) | 3 (1.6%) |
| 50 to 54 Years | 1 (0.6%) | 14 (7.3%) |
| 55 to 59 Years | 20 (11.7%) | 14 (7.3%) |
| 60 to 64 Years | 17 (9.9%) | 7 (3.6%) |
| 65 to 69 Years | 25 (14.6%) | 8 (4.2%) |
| 70 to 74 Years | 12 (7.0%) | 15 (7.8%) |
| 75 to 79 Years | 12 (7.0%) | 11 (5.7%) |
| 80 to 84 Years | 2 (1.2%) | 5 (2.6%) |
| 85 Years and over | 2 (1.2%) | 9 (4.7%) |
| Total | 171 (100.0%) | 192 (100.0%) |
Families and Households in Akeley
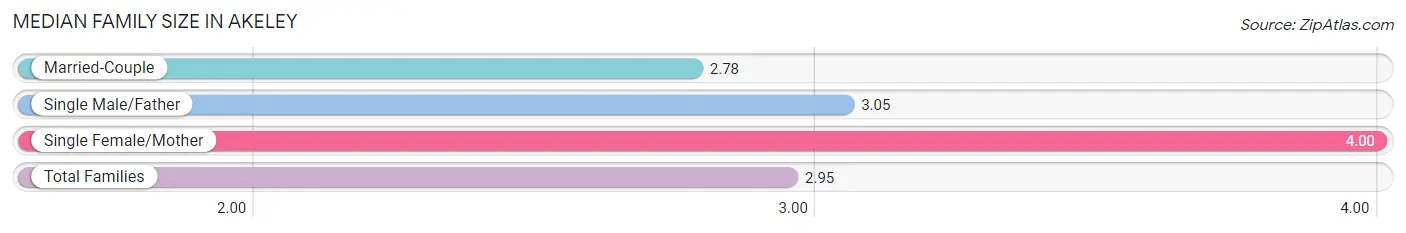
Median Family Size in Akeley
The median family size in Akeley is 2.95 persons per family, with single female/mother families (7 | 8.5%) accounting for the largest median family size of 4 persons per family. On the other hand, married-couple families (54 | 65.8%) represent the smallest median family size with 2.78 persons per family.
| Family Type | # Families | Family Size |
| Married-Couple | 54 (65.8%) | 2.78 |
| Single Male/Father | 21 (25.6%) | 3.05 |
| Single Female/Mother | 7 (8.5%) | 4.00 |
| Total Families | 82 (100.0%) | 2.95 |
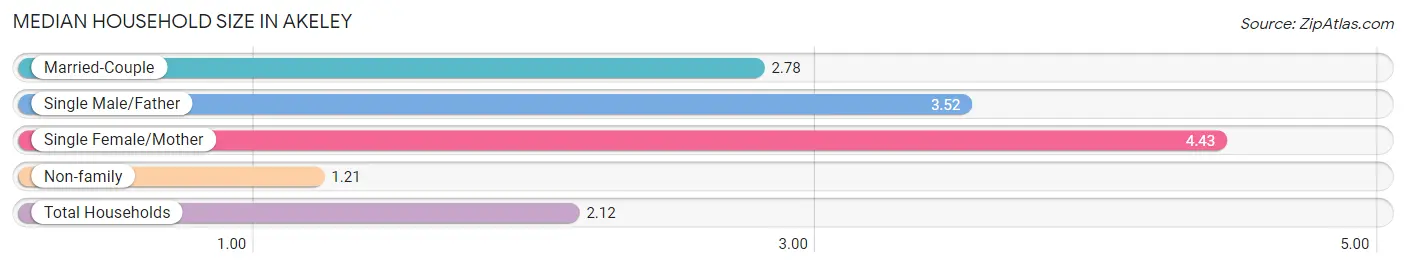
Median Household Size in Akeley
The median household size in Akeley is 2.12 persons per household, with single female/mother households (7 | 4.1%) accounting for the largest median household size of 4.43 persons per household. non-family households (89 | 52.0%) represent the smallest median household size with 1.21 persons per household.
| Household Type | # Households | Household Size |
| Married-Couple | 54 (31.6%) | 2.78 |
| Single Male/Father | 21 (12.3%) | 3.52 |
| Single Female/Mother | 7 (4.1%) | 4.43 |
| Non-family | 89 (52.0%) | 1.21 |
| Total Households | 171 (100.0%) | 2.12 |
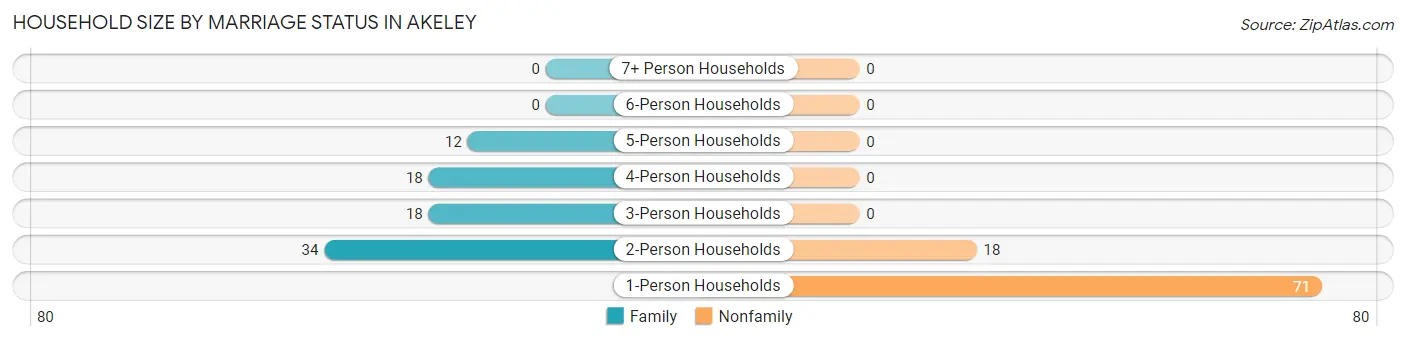
Household Size by Marriage Status in Akeley
Out of a total of 171 households in Akeley, 82 (47.9%) are family households, while 89 (52.0%) are nonfamily households. The most numerous type of family households are 2-person households, comprising 34, and the most common type of nonfamily households are 1-person households, comprising 71.
| Household Size | Family Households | Nonfamily Households |
| 1-Person Households | - | 71 (41.5%) |
| 2-Person Households | 34 (19.9%) | 18 (10.5%) |
| 3-Person Households | 18 (10.5%) | 0 (0.0%) |
| 4-Person Households | 18 (10.5%) | 0 (0.0%) |
| 5-Person Households | 12 (7.0%) | 0 (0.0%) |
| 6-Person Households | 0 (0.0%) | 0 (0.0%) |
| 7+ Person Households | 0 (0.0%) | 0 (0.0%) |
| Total | 82 (47.9%) | 89 (52.0%) |
Female Fertility in Akeley
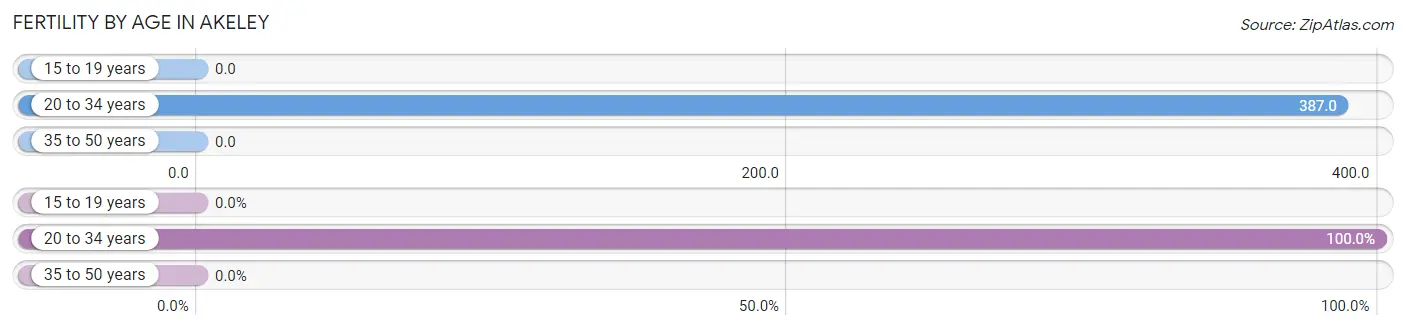
Fertility by Age in Akeley
Average fertility rate in Akeley is 185.0 births per 1,000 women. Women in the age bracket of 20 to 34 years have the highest fertility rate with 387.0 births per 1,000 women. Women in the age bracket of 20 to 34 years acount for 100.0% of all women with births.
| Age Bracket | Women with Births | Births / 1,000 Women |
| 15 to 19 years | 0 (0.0%) | 0.0 |
| 20 to 34 years | 12 (100.0%) | 387.0 |
| 35 to 50 years | 0 (0.0%) | 0.0 |
| Total | 12 (100.0%) | 185.0 |
Fertility by Age by Marriage Status in Akeley
16.7% of women with births (12) in Akeley are married. The highest percentage of unmarried women with births falls into 20 to 34 years age bracket with 83.3% of them unmarried at the time of birth, while the lowest percentage of unmarried women with births belong to 20 to 34 years age bracket with 83.3% of them unmarried.
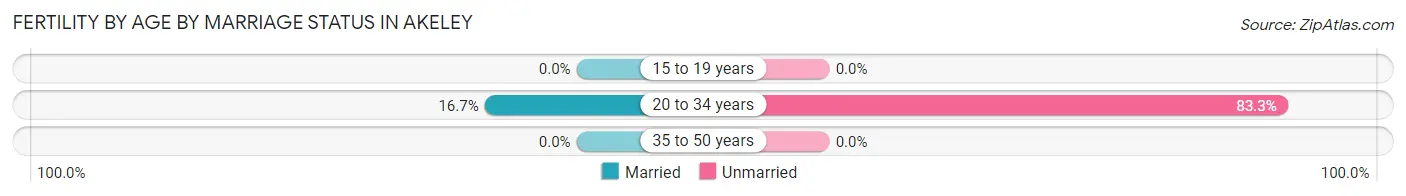
| Age Bracket | Married | Unmarried |
| 15 to 19 years | 0 (0.0%) | 0 (0.0%) |
| 20 to 34 years | 2 (16.7%) | 10 (83.3%) |
| 35 to 50 years | 0 (0.0%) | 0 (0.0%) |
| Total | 2 (16.7%) | 10 (83.3%) |
Fertility by Education in Akeley
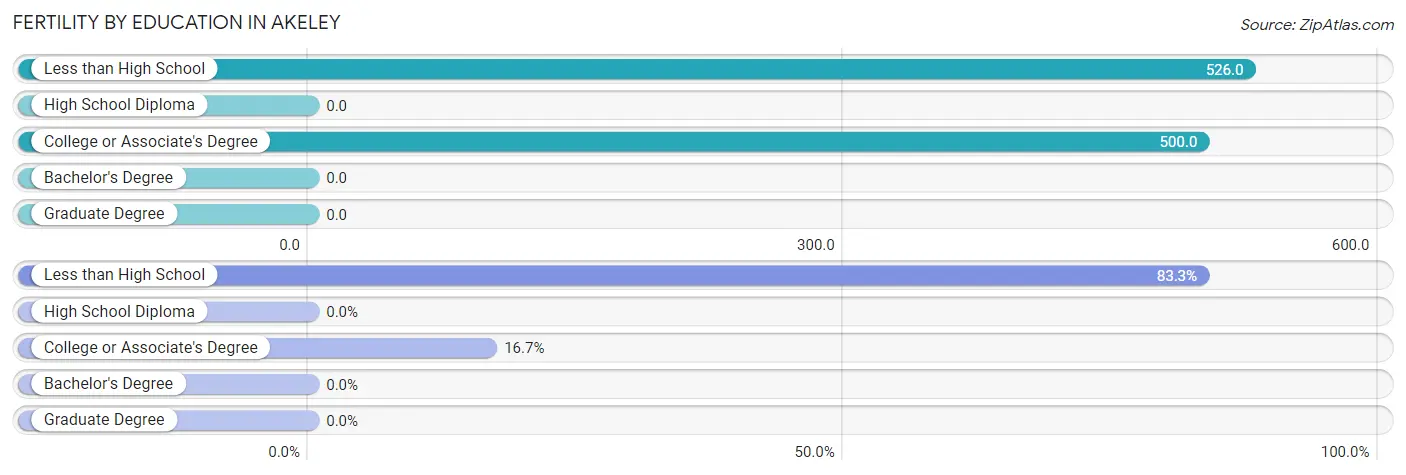
| Educational Attainment | Women with Births | Births / 1,000 Women |
| Less than High School | 10 (83.3%) | 526.0 |
| High School Diploma | 0 (0.0%) | 0.0 |
| College or Associate's Degree | 2 (16.7%) | 500.0 |
| Bachelor's Degree | 0 (0.0%) | 0.0 |
| Graduate Degree | 0 (0.0%) | 0.0 |
| Total | 12 (100.0%) | 185.0 |
Fertility by Education by Marriage Status in Akeley
83.3% of women with births in Akeley are unmarried. Women with the educational attainment of college or associate's degree are most likely to be married with 100.0% of them married at childbirth, while women with the educational attainment of less than high school are least likely to be married with 100.0% of them unmarried at childbirth.
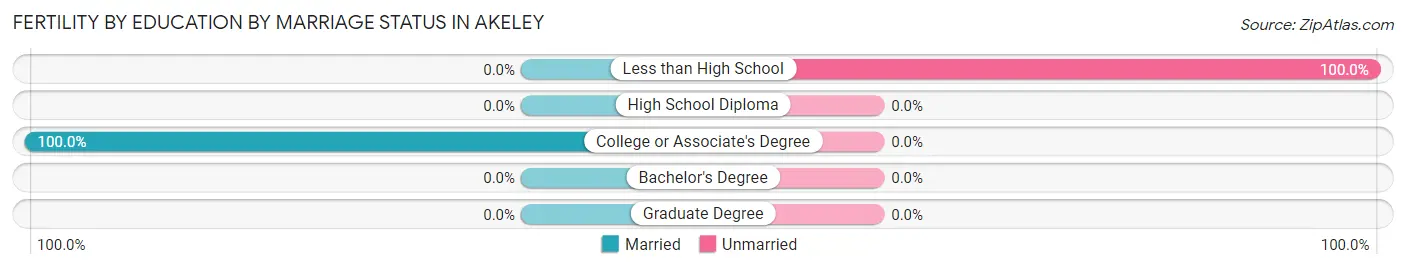
| Educational Attainment | Married | Unmarried |
| Less than High School | 0 (0.0%) | 10 (100.0%) |
| High School Diploma | 0 (0.0%) | 0 (0.0%) |
| College or Associate's Degree | 2 (100.0%) | 0 (0.0%) |
| Bachelor's Degree | 0 (0.0%) | 0 (0.0%) |
| Graduate Degree | 0 (0.0%) | 0 (0.0%) |
| Total | 2 (16.7%) | 10 (83.3%) |
Income in Akeley
Income Overview in Akeley
Per Capita Income in Akeley is $25,044, while median incomes of families and households are $55,313 and $47,083 respectively.
| Characteristic | Number | Measure |
| Per Capita Income | 363 | $25,044 |
| Median Family Income | 82 | $55,313 |
| Mean Family Income | 82 | $72,923 |
| Median Household Income | 171 | $47,083 |
| Mean Household Income | 171 | $54,262 |
| Income Deficit | 82 | $0 |
| Wage / Income Gap (%) | 363 | 36.06% |
| Wage / Income Gap ($) | 363 | 63.94¢ per $1 |
| Gini / Inequality Index | 363 | 0.40 |
Earnings by Sex in Akeley
Average Earnings in Akeley are $34,063, $45,455 for men and $29,063 for women, a difference of 36.1%.
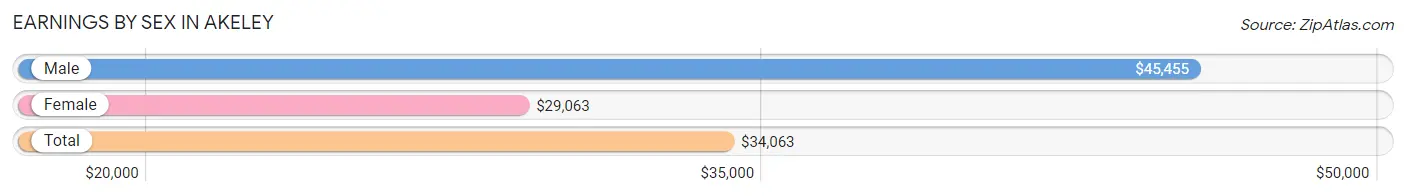
| Sex | Number | Average Earnings |
| Male | 62 (45.9%) | $45,455 |
| Female | 73 (54.1%) | $29,063 |
| Total | 135 (100.0%) | $34,063 |
Earnings by Sex by Income Bracket in Akeley
The most common earnings brackets in Akeley are $45,000 to $49,999 for men (18 | 29.0%) and $5,000 to $7,499 for women (12 | 16.4%).
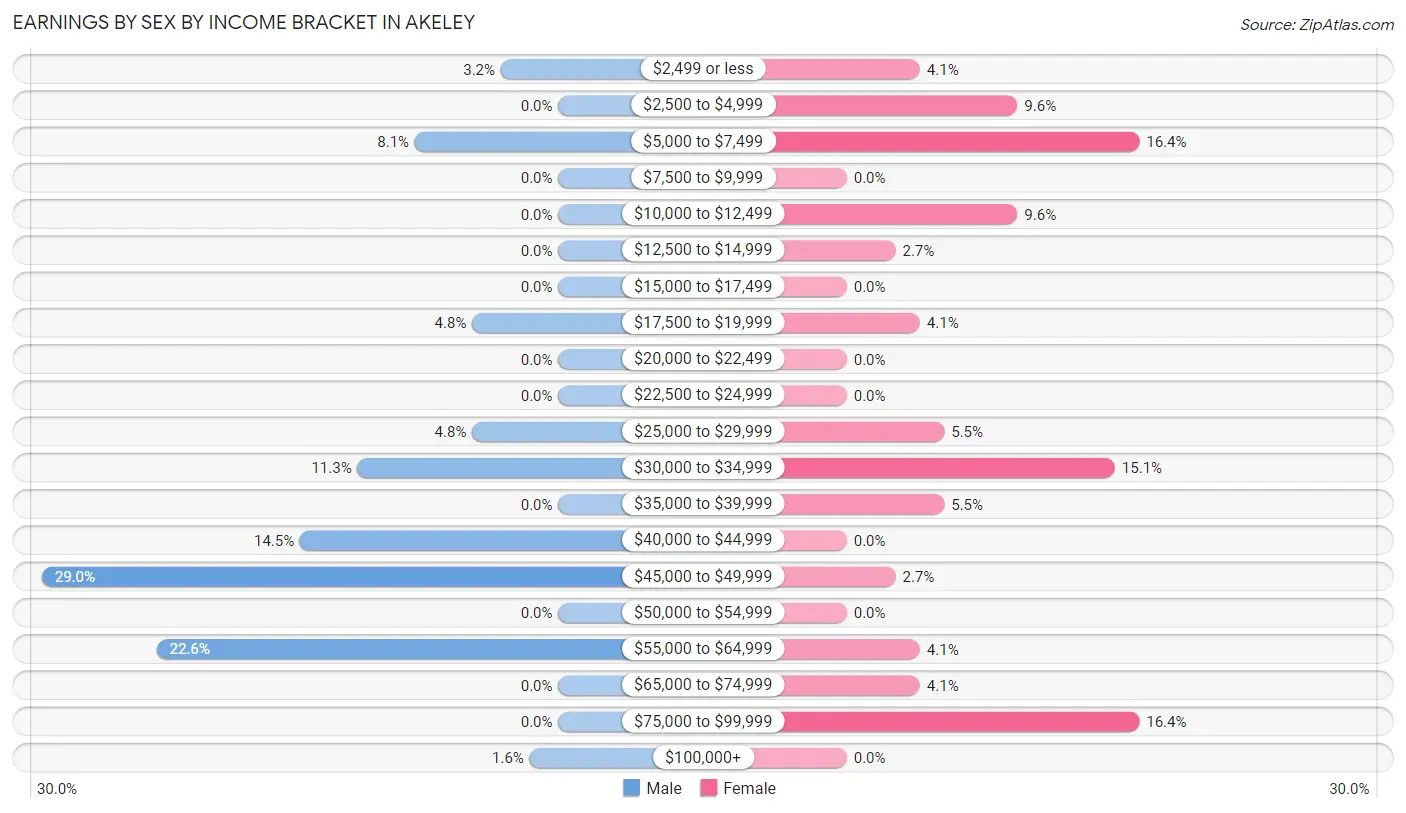
| Income | Male | Female |
| $2,499 or less | 2 (3.2%) | 3 (4.1%) |
| $2,500 to $4,999 | 0 (0.0%) | 7 (9.6%) |
| $5,000 to $7,499 | 5 (8.1%) | 12 (16.4%) |
| $7,500 to $9,999 | 0 (0.0%) | 0 (0.0%) |
| $10,000 to $12,499 | 0 (0.0%) | 7 (9.6%) |
| $12,500 to $14,999 | 0 (0.0%) | 2 (2.7%) |
| $15,000 to $17,499 | 0 (0.0%) | 0 (0.0%) |
| $17,500 to $19,999 | 3 (4.8%) | 3 (4.1%) |
| $20,000 to $22,499 | 0 (0.0%) | 0 (0.0%) |
| $22,500 to $24,999 | 0 (0.0%) | 0 (0.0%) |
| $25,000 to $29,999 | 3 (4.8%) | 4 (5.5%) |
| $30,000 to $34,999 | 7 (11.3%) | 11 (15.1%) |
| $35,000 to $39,999 | 0 (0.0%) | 4 (5.5%) |
| $40,000 to $44,999 | 9 (14.5%) | 0 (0.0%) |
| $45,000 to $49,999 | 18 (29.0%) | 2 (2.7%) |
| $50,000 to $54,999 | 0 (0.0%) | 0 (0.0%) |
| $55,000 to $64,999 | 14 (22.6%) | 3 (4.1%) |
| $65,000 to $74,999 | 0 (0.0%) | 3 (4.1%) |
| $75,000 to $99,999 | 0 (0.0%) | 12 (16.4%) |
| $100,000+ | 1 (1.6%) | 0 (0.0%) |
| Total | 62 (100.0%) | 73 (100.0%) |
Earnings by Sex by Educational Attainment in Akeley
Average earnings in Akeley are $45,795 for men and $27,813 for women, a difference of 39.3%. Men with an educational attainment of college or associate's degree enjoy the highest average annual earnings of $62,841, while those with bachelor's degree education earn the least with $34,583. Women with an educational attainment of bachelor's degree earn the most with the average annual earnings of $80,625, while those with college or associate's degree education have the smallest earnings of $11,250.
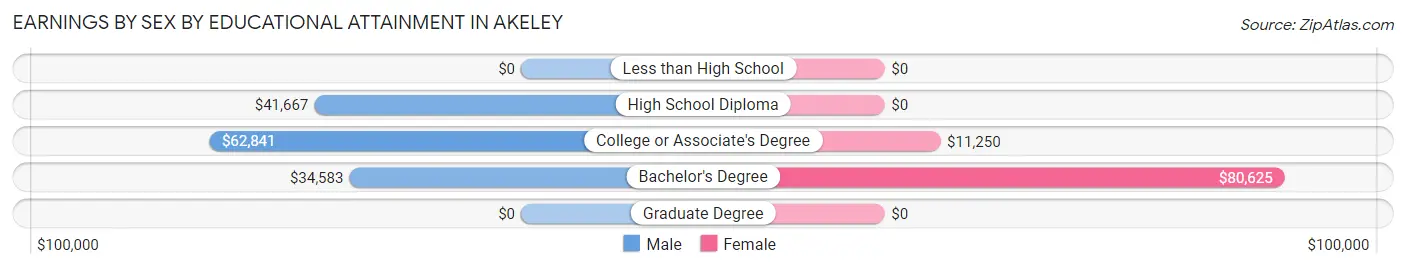
| Educational Attainment | Male Income | Female Income |
| Less than High School | - | - |
| High School Diploma | $41,667 | $0 |
| College or Associate's Degree | $62,841 | $11,250 |
| Bachelor's Degree | $34,583 | $80,625 |
| Graduate Degree | - | - |
| Total | $45,795 | $27,813 |
Family Income in Akeley
Family Income Brackets in Akeley
According to the Akeley family income data, there are 38 families falling into the $50,000 to $74,999 income range, which is the most common income bracket and makes up 46.3% of all families.
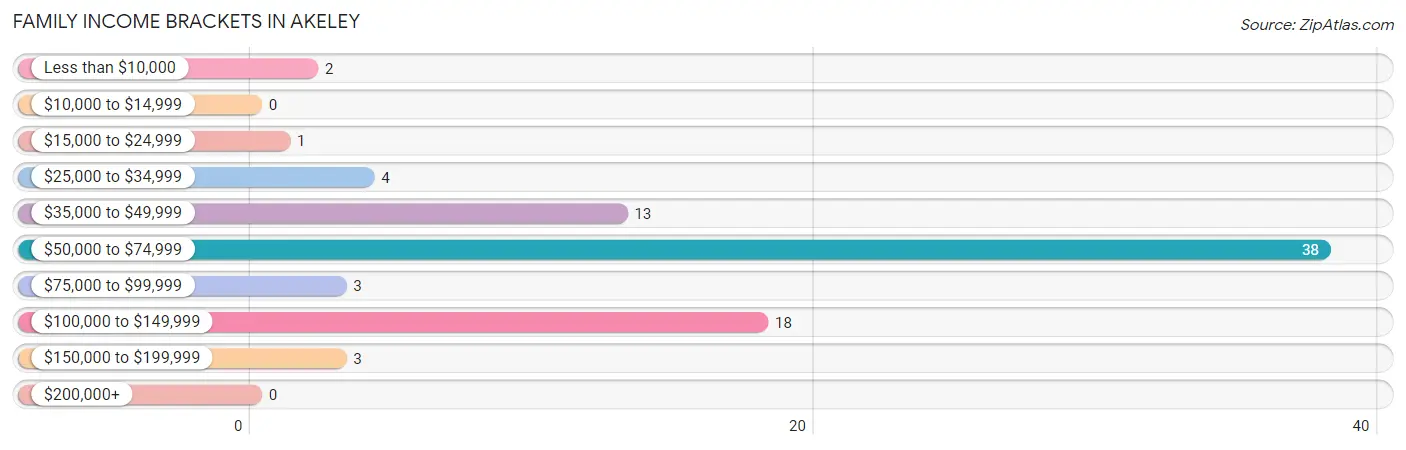
| Income Bracket | # Families | % Families |
| Less than $10,000 | 2 | 2.4% |
| $10,000 to $14,999 | 0 | 0.0% |
| $15,000 to $24,999 | 1 | 1.2% |
| $25,000 to $34,999 | 4 | 4.9% |
| $35,000 to $49,999 | 13 | 15.9% |
| $50,000 to $74,999 | 38 | 46.3% |
| $75,000 to $99,999 | 3 | 3.7% |
| $100,000 to $149,999 | 18 | 22.0% |
| $150,000 to $199,999 | 3 | 3.7% |
| $200,000+ | 0 | 0.0% |
Family Income by Famaliy Size in Akeley
3-person families (10 | 12.2%) account for the highest median family income in Akeley with $61,250 per family, while 2-person families (45 | 54.9%) have the highest median income of $26,518 per family member.
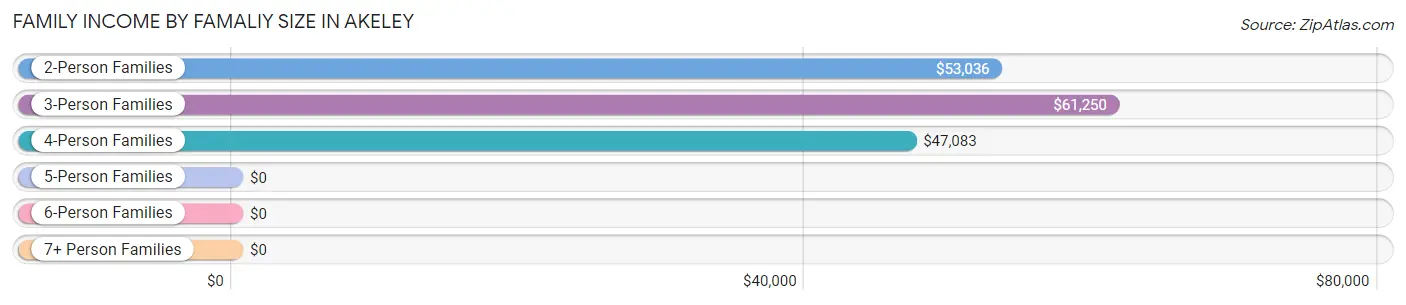
| Income Bracket | # Families | Median Income |
| 2-Person Families | 45 (54.9%) | $53,036 |
| 3-Person Families | 10 (12.2%) | $61,250 |
| 4-Person Families | 15 (18.3%) | $47,083 |
| 5-Person Families | 12 (14.6%) | $0 |
| 6-Person Families | 0 (0.0%) | $0 |
| 7+ Person Families | 0 (0.0%) | $0 |
| Total | 82 (100.0%) | $55,313 |
Family Income by Number of Earners in Akeley
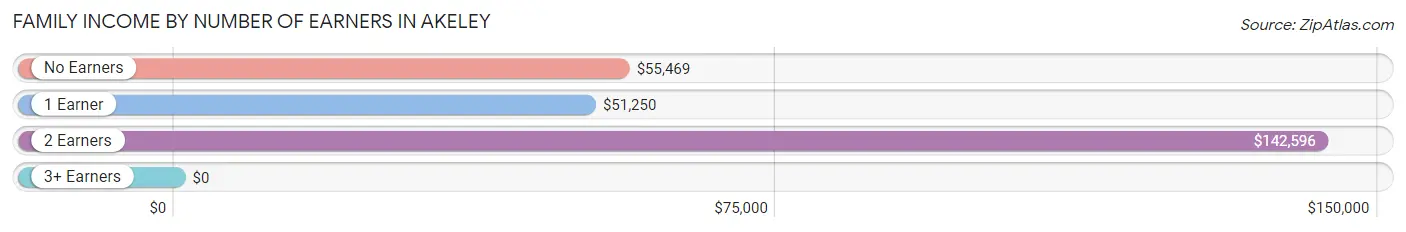
| Number of Earners | # Families | Median Income |
| No Earners | 23 (28.1%) | $55,469 |
| 1 Earner | 31 (37.8%) | $51,250 |
| 2 Earners | 25 (30.5%) | $142,596 |
| 3+ Earners | 3 (3.7%) | $0 |
| Total | 82 (100.0%) | $55,313 |
Household Income in Akeley
Household Income Brackets in Akeley
With 41 households falling in the category, the $50,000 to $74,999 income range is the most frequent in Akeley, accounting for 24.0% of all households.
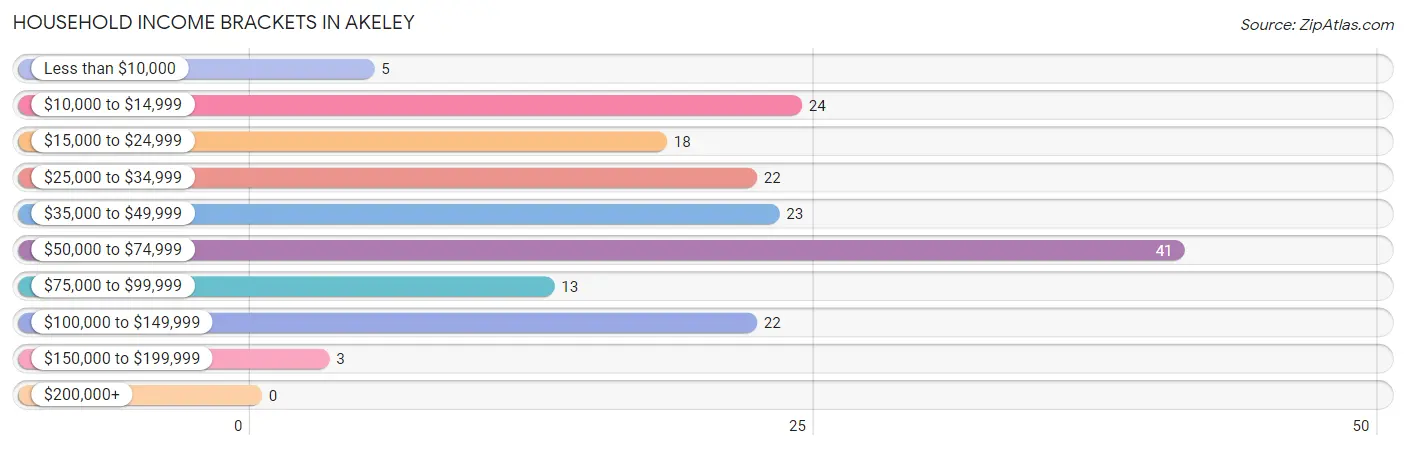
| Income Bracket | # Households | % Households |
| Less than $10,000 | 5 | 2.9% |
| $10,000 to $14,999 | 24 | 14.0% |
| $15,000 to $24,999 | 18 | 10.5% |
| $25,000 to $34,999 | 22 | 12.9% |
| $35,000 to $49,999 | 23 | 13.5% |
| $50,000 to $74,999 | 41 | 24.0% |
| $75,000 to $99,999 | 13 | 7.6% |
| $100,000 to $149,999 | 22 | 12.9% |
| $150,000 to $199,999 | 3 | 1.8% |
| $200,000+ | 0 | 0.0% |
Household Income by Householder Age in Akeley
The median household income in Akeley is $47,083, with the highest median household income of $84,091 found in the 25 to 44 years age bracket for the primary householder. A total of 42 households (24.6%) fall into this category.
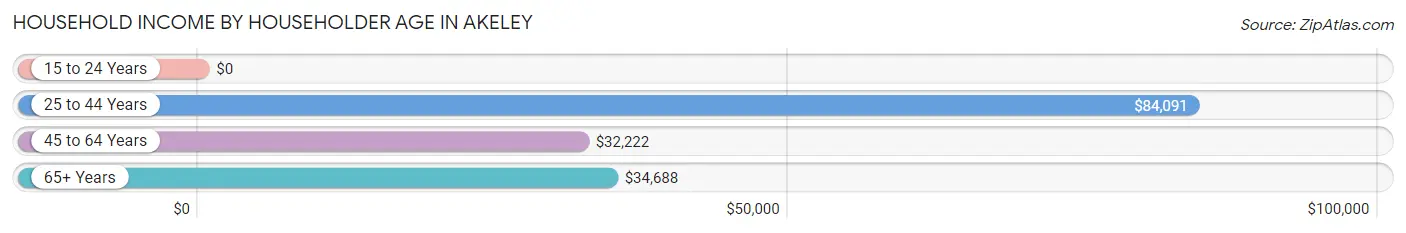
| Income Bracket | # Households | Median Income |
| 15 to 24 Years | 0 (0.0%) | $0 |
| 25 to 44 Years | 42 (24.6%) | $84,091 |
| 45 to 64 Years | 60 (35.1%) | $32,222 |
| 65+ Years | 69 (40.4%) | $34,688 |
| Total | 171 (100.0%) | $47,083 |
Poverty in Akeley
Income Below Poverty by Sex and Age in Akeley
With 21.0% poverty level for males and 16.2% for females among the residents of Akeley, 12 to 14 year old males and 75 year old and over females are the most vulnerable to poverty, with 4 males (100.0%) and 11 females (44.0%) in their respective age groups living below the poverty level.
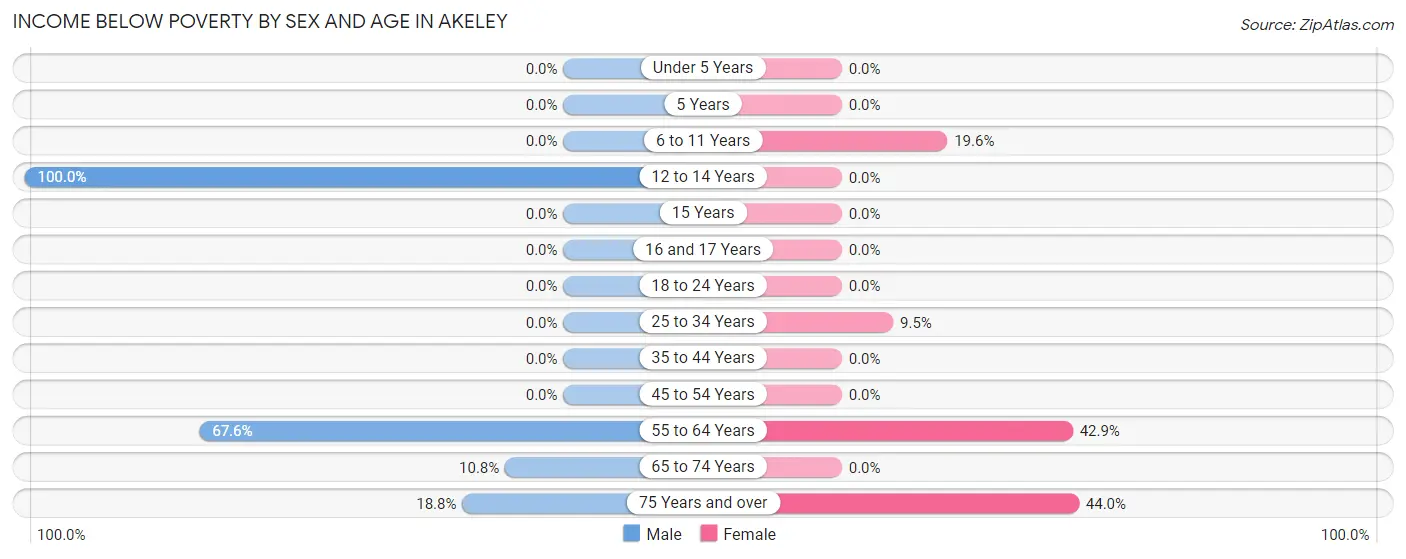
| Age Bracket | Male | Female |
| Under 5 Years | 0 (0.0%) | 0 (0.0%) |
| 5 Years | 0 (0.0%) | 0 (0.0%) |
| 6 to 11 Years | 0 (0.0%) | 9 (19.6%) |
| 12 to 14 Years | 4 (100.0%) | 0 (0.0%) |
| 15 Years | 0 (0.0%) | 0 (0.0%) |
| 16 and 17 Years | 0 (0.0%) | 0 (0.0%) |
| 18 to 24 Years | 0 (0.0%) | 0 (0.0%) |
| 25 to 34 Years | 0 (0.0%) | 2 (9.5%) |
| 35 to 44 Years | 0 (0.0%) | 0 (0.0%) |
| 45 to 54 Years | 0 (0.0%) | 0 (0.0%) |
| 55 to 64 Years | 25 (67.6%) | 9 (42.9%) |
| 65 to 74 Years | 4 (10.8%) | 0 (0.0%) |
| 75 Years and over | 3 (18.8%) | 11 (44.0%) |
| Total | 36 (21.0%) | 31 (16.2%) |
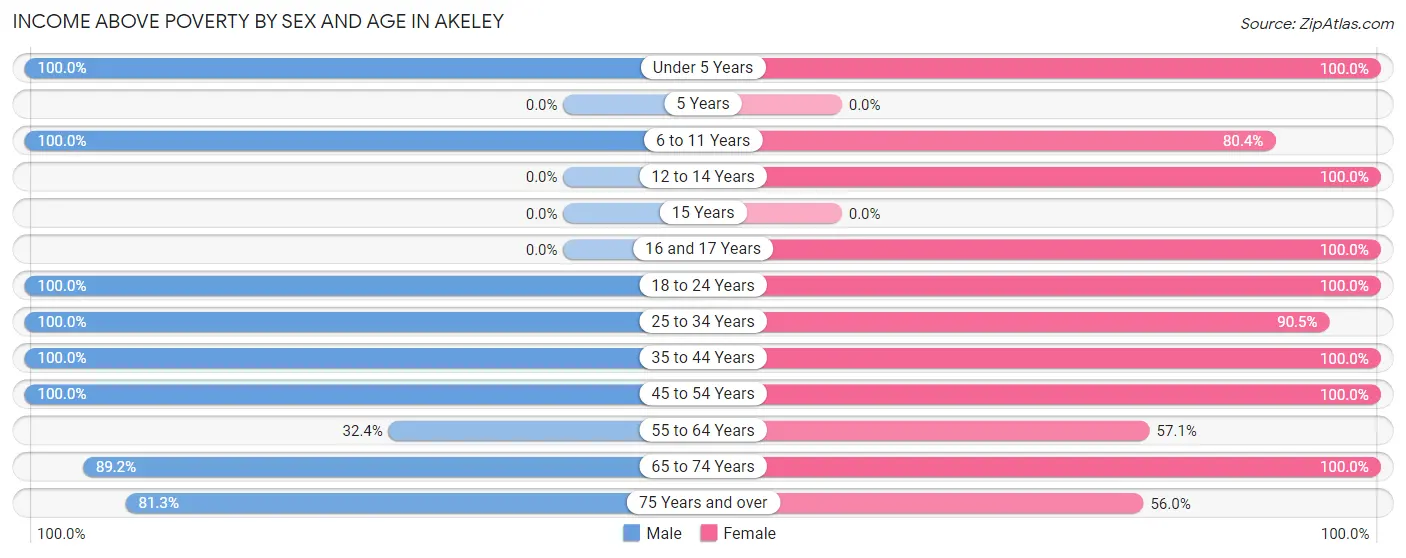
Income Above Poverty by Sex and Age in Akeley
According to the poverty statistics in Akeley, males aged under 5 years and females aged under 5 years are the age groups that are most secure financially, with 100.0% of males and 100.0% of females in these age groups living above the poverty line.
| Age Bracket | Male | Female |
| Under 5 Years | 10 (100.0%) | 3 (100.0%) |
| 5 Years | 0 (0.0%) | 0 (0.0%) |
| 6 to 11 Years | 21 (100.0%) | 37 (80.4%) |
| 12 to 14 Years | 0 (0.0%) | 2 (100.0%) |
| 15 Years | 0 (0.0%) | 0 (0.0%) |
| 16 and 17 Years | 0 (0.0%) | 6 (100.0%) |
| 18 to 24 Years | 3 (100.0%) | 10 (100.0%) |
| 25 to 34 Years | 22 (100.0%) | 19 (90.5%) |
| 35 to 44 Years | 17 (100.0%) | 18 (100.0%) |
| 45 to 54 Years | 4 (100.0%) | 17 (100.0%) |
| 55 to 64 Years | 12 (32.4%) | 12 (57.1%) |
| 65 to 74 Years | 33 (89.2%) | 23 (100.0%) |
| 75 Years and over | 13 (81.2%) | 14 (56.0%) |
| Total | 135 (78.9%) | 161 (83.9%) |
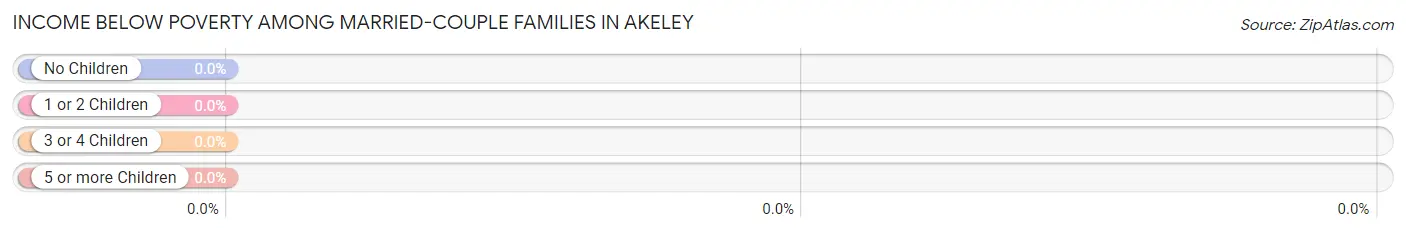
Income Below Poverty Among Married-Couple Families in Akeley
| Children | Above Poverty | Below Poverty |
| No Children | 32 (100.0%) | 0 (0.0%) |
| 1 or 2 Children | 10 (100.0%) | 0 (0.0%) |
| 3 or 4 Children | 12 (100.0%) | 0 (0.0%) |
| 5 or more Children | 0 (0.0%) | 0 (0.0%) |
| Total | 54 (100.0%) | 0 (0.0%) |
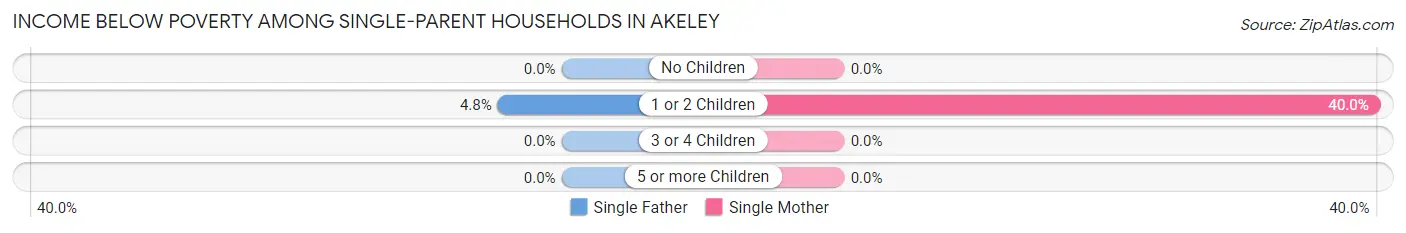
Income Below Poverty Among Single-Parent Households in Akeley
According to the poverty data in Akeley, 4.8% or 1 single-father households and 28.6% or 2 single-mother households are living below the poverty line. Among single-father households, those with 1 or 2 children have the highest poverty rate, with 1 households (4.8%) experiencing poverty. Likewise, among single-mother households, those with 1 or 2 children have the highest poverty rate, with 2 households (40.0%) falling below the poverty line.
| Children | Single Father | Single Mother |
| No Children | 0 (0.0%) | 0 (0.0%) |
| 1 or 2 Children | 1 (4.8%) | 2 (40.0%) |
| 3 or 4 Children | 0 (0.0%) | 0 (0.0%) |
| 5 or more Children | 0 (0.0%) | 0 (0.0%) |
| Total | 1 (4.8%) | 2 (28.6%) |
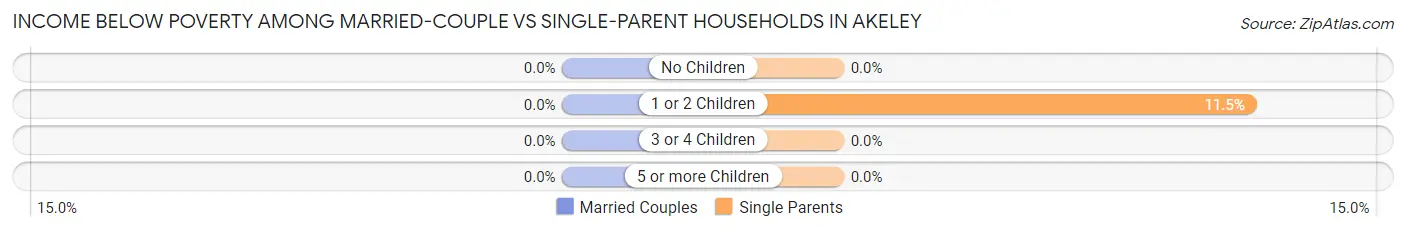
Income Below Poverty Among Married-Couple vs Single-Parent Households in Akeley
| Children | Married-Couple Families | Single-Parent Households |
| No Children | 0 (0.0%) | 0 (0.0%) |
| 1 or 2 Children | 0 (0.0%) | 3 (11.5%) |
| 3 or 4 Children | 0 (0.0%) | 0 (0.0%) |
| 5 or more Children | 0 (0.0%) | 0 (0.0%) |
| Total | 0 (0.0%) | 3 (10.7%) |
Employment Characteristics in Akeley
Employment by Class of Employer in Akeley
Among the 117 employed individuals in Akeley, private company employees (81 | 69.2%), not-for-profit organizations (9 | 7.7%), and local government employees (8 | 6.8%) make up the most common classes of employment.
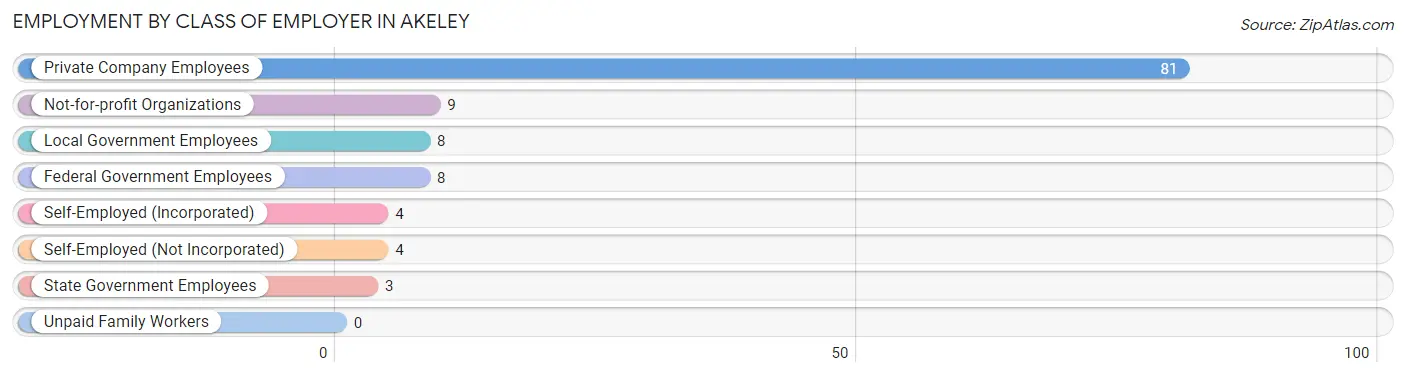
| Employer Class | # Employees | % Employees |
| Private Company Employees | 81 | 69.2% |
| Self-Employed (Incorporated) | 4 | 3.4% |
| Self-Employed (Not Incorporated) | 4 | 3.4% |
| Not-for-profit Organizations | 9 | 7.7% |
| Local Government Employees | 8 | 6.8% |
| State Government Employees | 3 | 2.6% |
| Federal Government Employees | 8 | 6.8% |
| Unpaid Family Workers | 0 | 0.0% |
| Total | 117 | 100.0% |
Employment Status by Age in Akeley
According to the labor force statistics for Akeley, out of the total population over 16 years of age (277), 45.5% or 126 individuals are in the labor force, with 5.6% or 7 of them unemployed. The age group with the highest labor force participation rate is 16 to 19 years, with 100.0% or 9 individuals in the labor force. Within the labor force, the 45 to 54 years age range has the highest percentage of unemployed individuals, with 33.3% or 7 of them being unemployed.
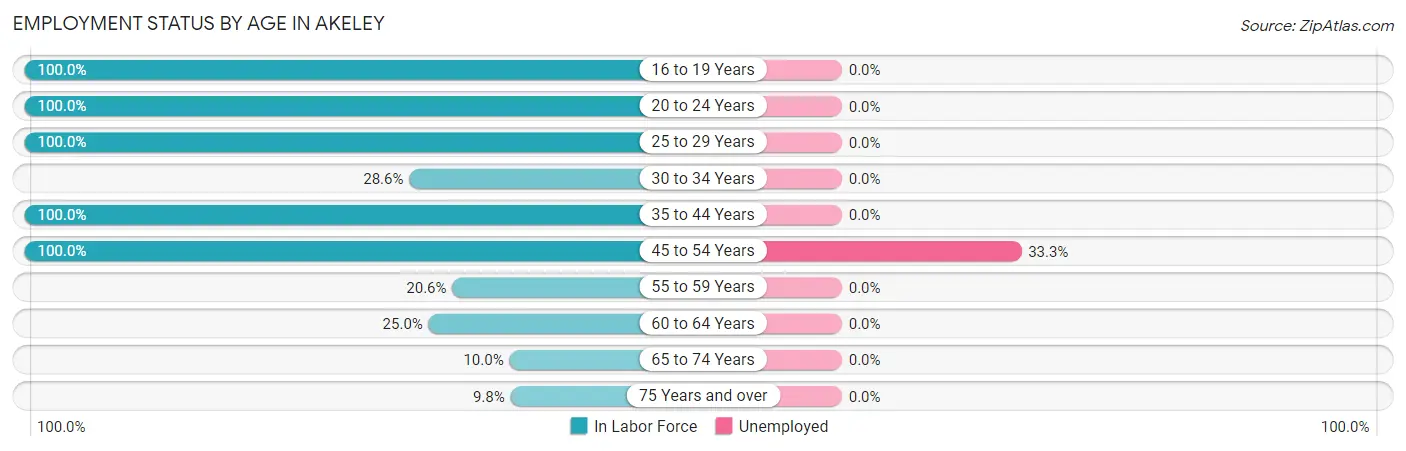
| Age Bracket | In Labor Force | Unemployed |
| 16 to 19 Years | 9 (100.0%) | 0 (0.0%) |
| 20 to 24 Years | 10 (100.0%) | 0 (0.0%) |
| 25 to 29 Years | 22 (100.0%) | 0 (0.0%) |
| 30 to 34 Years | 6 (28.6%) | 0 (0.0%) |
| 35 to 44 Years | 35 (100.0%) | 0 (0.0%) |
| 45 to 54 Years | 21 (100.0%) | 7 (33.3%) |
| 55 to 59 Years | 7 (20.6%) | 0 (0.0%) |
| 60 to 64 Years | 6 (25.0%) | 0 (0.0%) |
| 65 to 74 Years | 6 (10.0%) | 0 (0.0%) |
| 75 Years and over | 4 (9.8%) | 0 (0.0%) |
| Total | 126 (45.5%) | 7 (5.6%) |
Employment Status by Educational Attainment in Akeley
According to labor force statistics for Akeley, 61.8% of individuals (97) out of the total population between 25 and 64 years of age (157) are in the labor force, with 7.2% or 7 of them being unemployed. The group with the highest labor force participation rate are those with the educational attainment of bachelor's degree or higher, with 100.0% or 26 individuals in the labor force. Within the labor force, individuals with high school diploma education have the highest percentage of unemployment, with 18.9% or 7 of them being unemployed.
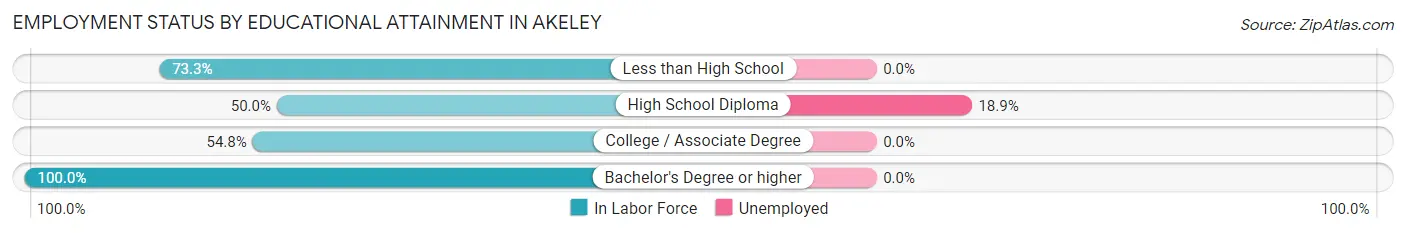
| Educational Attainment | In Labor Force | Unemployed |
| Less than High School | 11 (73.3%) | 0 (0.0%) |
| High School Diploma | 37 (50.0%) | 14 (18.9%) |
| College / Associate Degree | 23 (54.8%) | 0 (0.0%) |
| Bachelor's Degree or higher | 26 (100.0%) | 0 (0.0%) |
| Total | 97 (61.8%) | 11 (7.2%) |
Employment Occupations by Sex in Akeley
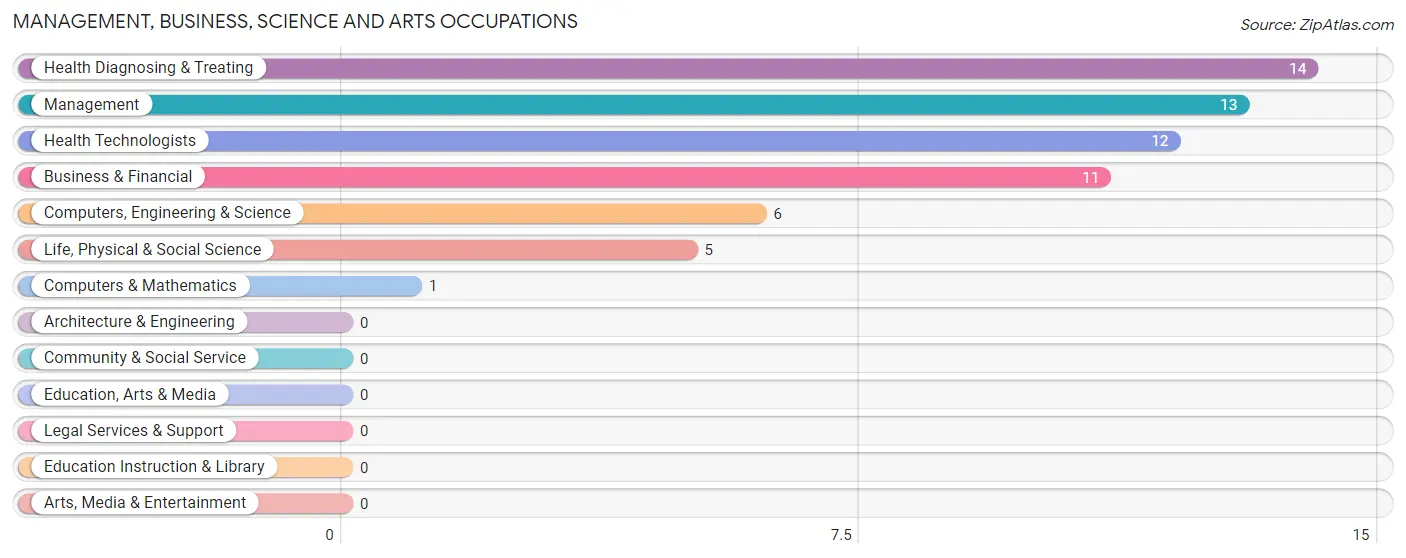
Management, Business, Science and Arts Occupations
The most common Management, Business, Science and Arts occupations in Akeley are Health Diagnosing & Treating (14 | 11.8%), Management (13 | 10.9%), Health Technologists (12 | 10.1%), Business & Financial (11 | 9.2%), and Computers, Engineering & Science (6 | 5.0%).
Management, Business, Science and Arts Occupations by Sex
Within the Management, Business, Science and Arts occupations in Akeley, the most male-oriented occupations are Business & Financial (100.0%), Computers, Engineering & Science (100.0%), and Computers & Mathematics (100.0%), while the most female-oriented occupations are Health Diagnosing & Treating (100.0%), Health Technologists (100.0%), and Management (76.9%).
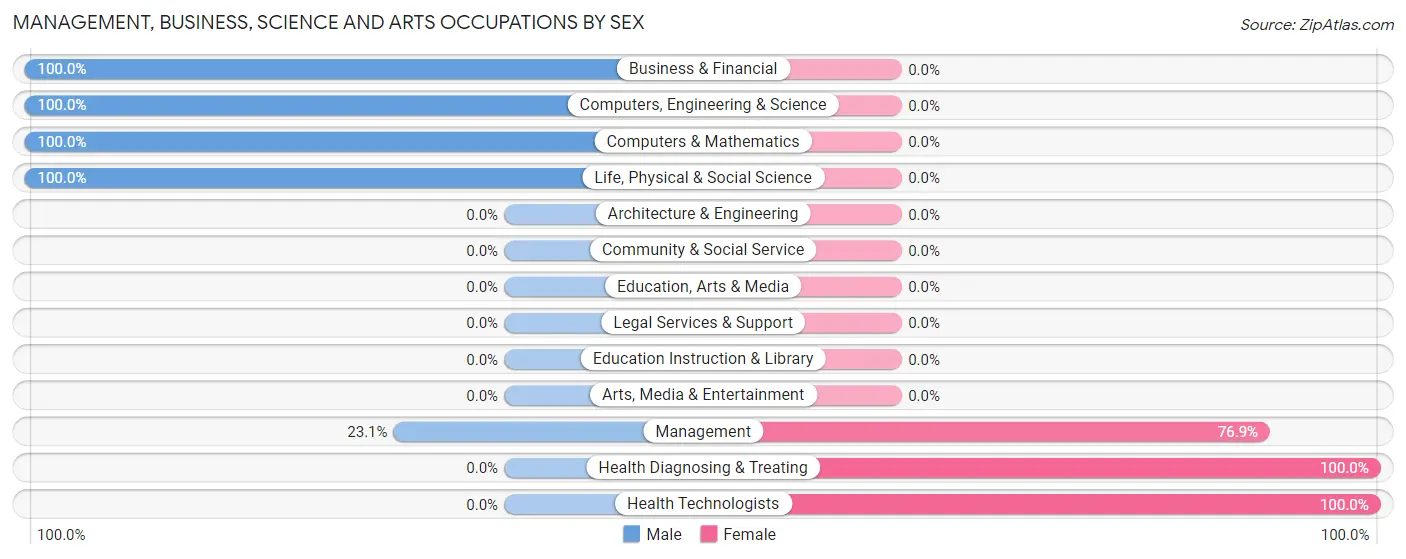
| Occupation | Male | Female |
| Management | 3 (23.1%) | 10 (76.9%) |
| Business & Financial | 11 (100.0%) | 0 (0.0%) |
| Computers, Engineering & Science | 6 (100.0%) | 0 (0.0%) |
| Computers & Mathematics | 1 (100.0%) | 0 (0.0%) |
| Architecture & Engineering | 0 (0.0%) | 0 (0.0%) |
| Life, Physical & Social Science | 5 (100.0%) | 0 (0.0%) |
| Community & Social Service | 0 (0.0%) | 0 (0.0%) |
| Education, Arts & Media | 0 (0.0%) | 0 (0.0%) |
| Legal Services & Support | 0 (0.0%) | 0 (0.0%) |
| Education Instruction & Library | 0 (0.0%) | 0 (0.0%) |
| Arts, Media & Entertainment | 0 (0.0%) | 0 (0.0%) |
| Health Diagnosing & Treating | 0 (0.0%) | 14 (100.0%) |
| Health Technologists | 0 (0.0%) | 12 (100.0%) |
| Total (Category) | 20 (45.5%) | 24 (54.5%) |
| Total (Overall) | 62 (52.1%) | 57 (47.9%) |
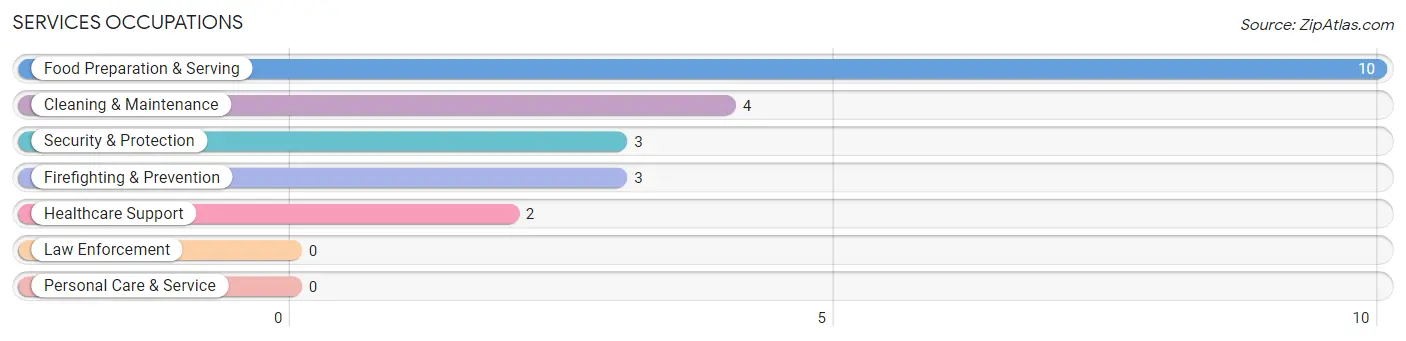
Services Occupations
The most common Services occupations in Akeley are Food Preparation & Serving (10 | 8.4%), Cleaning & Maintenance (4 | 3.4%), Security & Protection (3 | 2.5%), Firefighting & Prevention (3 | 2.5%), and Healthcare Support (2 | 1.7%).
Services Occupations by Sex
Within the Services occupations in Akeley, the most male-oriented occupations are Security & Protection (100.0%), Firefighting & Prevention (100.0%), and Cleaning & Maintenance (50.0%), while the most female-oriented occupations are Healthcare Support (100.0%), Food Preparation & Serving (100.0%), and Cleaning & Maintenance (50.0%).
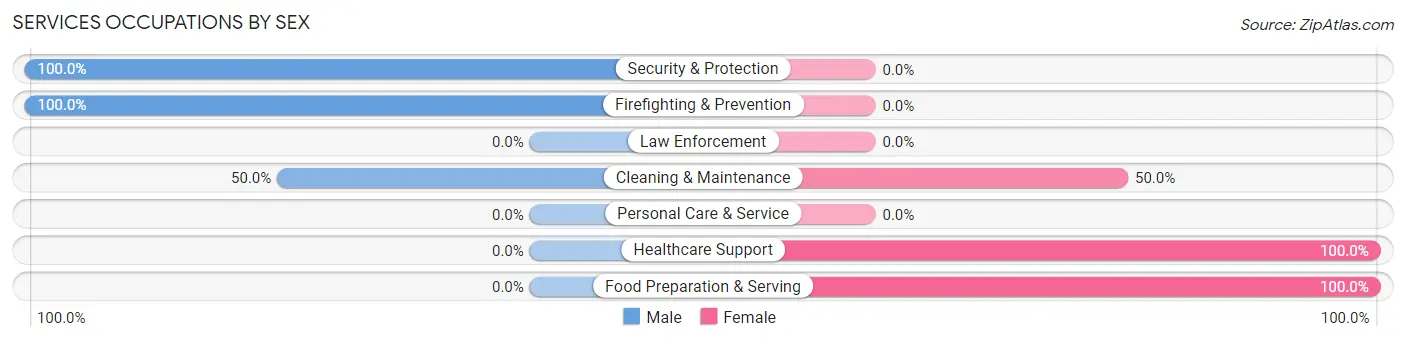
| Occupation | Male | Female |
| Healthcare Support | 0 (0.0%) | 2 (100.0%) |
| Security & Protection | 3 (100.0%) | 0 (0.0%) |
| Firefighting & Prevention | 3 (100.0%) | 0 (0.0%) |
| Law Enforcement | 0 (0.0%) | 0 (0.0%) |
| Food Preparation & Serving | 0 (0.0%) | 10 (100.0%) |
| Cleaning & Maintenance | 2 (50.0%) | 2 (50.0%) |
| Personal Care & Service | 0 (0.0%) | 0 (0.0%) |
| Total (Category) | 5 (26.3%) | 14 (73.7%) |
| Total (Overall) | 62 (52.1%) | 57 (47.9%) |
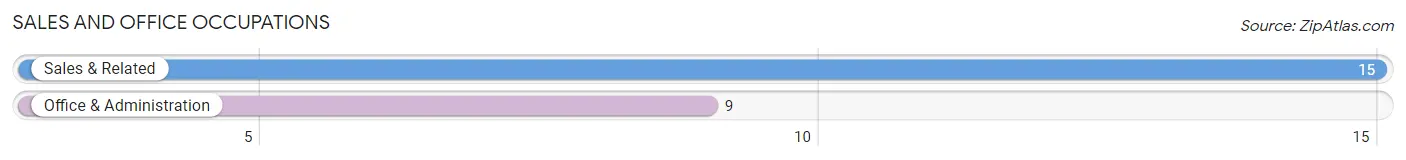
Sales and Office Occupations
The most common Sales and Office occupations in Akeley are Sales & Related (15 | 12.6%), and Office & Administration (9 | 7.6%).
Sales and Office Occupations by Sex
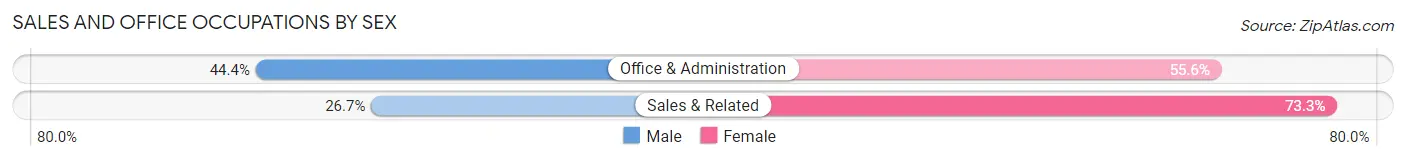
| Occupation | Male | Female |
| Sales & Related | 4 (26.7%) | 11 (73.3%) |
| Office & Administration | 4 (44.4%) | 5 (55.6%) |
| Total (Category) | 8 (33.3%) | 16 (66.7%) |
| Total (Overall) | 62 (52.1%) | 57 (47.9%) |
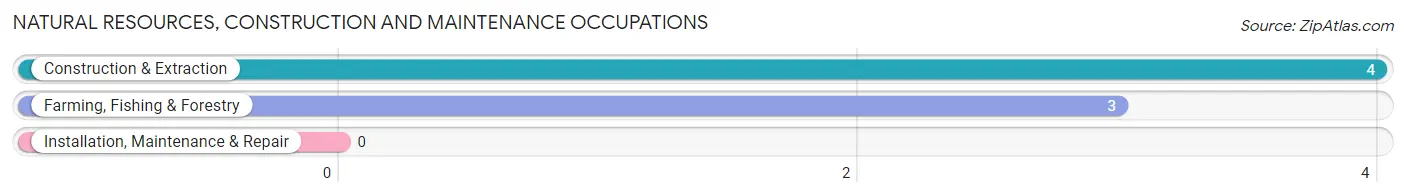
Natural Resources, Construction and Maintenance Occupations
The most common Natural Resources, Construction and Maintenance occupations in Akeley are Construction & Extraction (4 | 3.4%), and Farming, Fishing & Forestry (3 | 2.5%).
Natural Resources, Construction and Maintenance Occupations by Sex
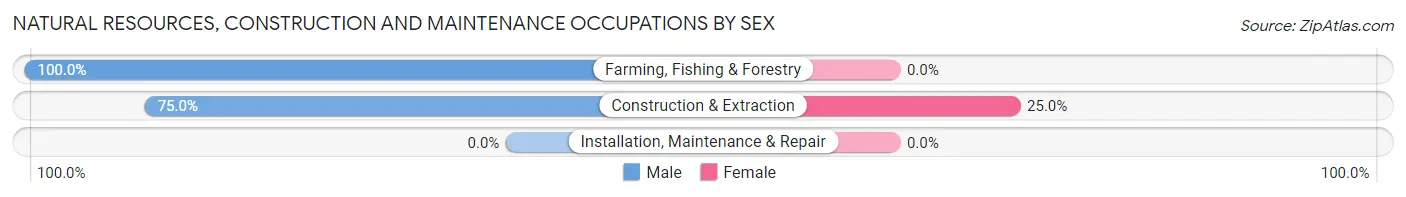
| Occupation | Male | Female |
| Farming, Fishing & Forestry | 3 (100.0%) | 0 (0.0%) |
| Construction & Extraction | 3 (75.0%) | 1 (25.0%) |
| Installation, Maintenance & Repair | 0 (0.0%) | 0 (0.0%) |
| Total (Category) | 6 (85.7%) | 1 (14.3%) |
| Total (Overall) | 62 (52.1%) | 57 (47.9%) |
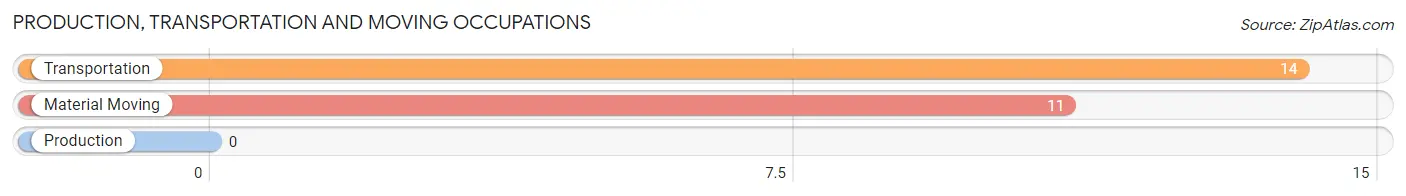
Production, Transportation and Moving Occupations
The most common Production, Transportation and Moving occupations in Akeley are Transportation (14 | 11.8%), and Material Moving (11 | 9.2%).
Production, Transportation and Moving Occupations by Sex
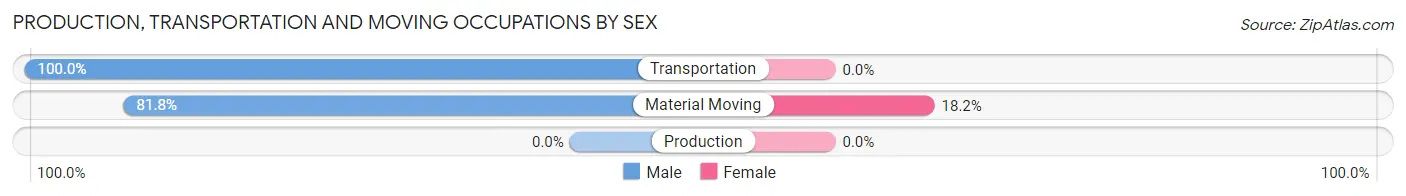
| Occupation | Male | Female |
| Production | 0 (0.0%) | 0 (0.0%) |
| Transportation | 14 (100.0%) | 0 (0.0%) |
| Material Moving | 9 (81.8%) | 2 (18.2%) |
| Total (Category) | 23 (92.0%) | 2 (8.0%) |
| Total (Overall) | 62 (52.1%) | 57 (47.9%) |
Employment Industries by Sex in Akeley
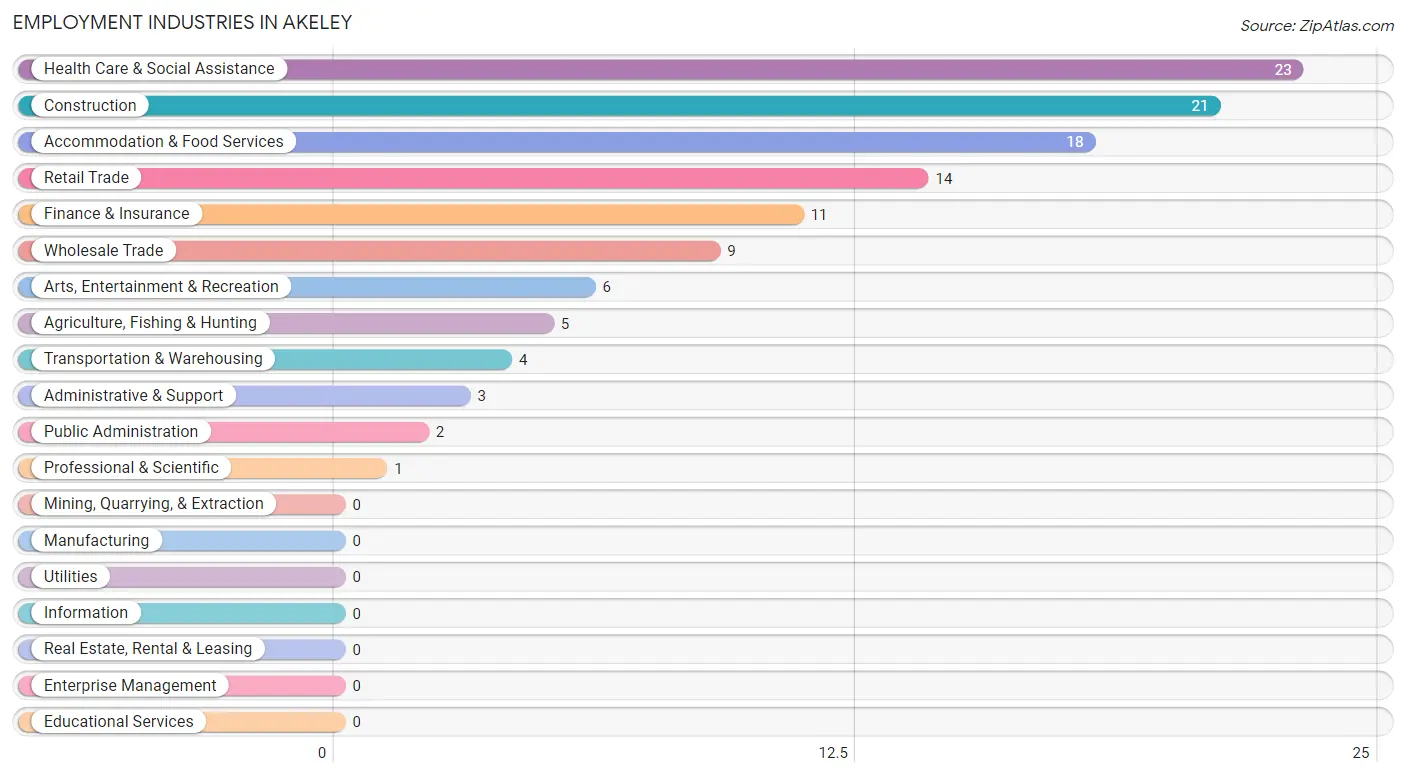
Employment Industries in Akeley
The major employment industries in Akeley include Health Care & Social Assistance (23 | 19.3%), Construction (21 | 17.6%), Accommodation & Food Services (18 | 15.1%), Retail Trade (14 | 11.8%), and Finance & Insurance (11 | 9.2%).
Employment Industries by Sex in Akeley
The Akeley industries that see more men than women are Agriculture, Fishing & Hunting (100.0%), Finance & Insurance (100.0%), and Professional & Scientific (100.0%), whereas the industries that tend to have a higher number of women are Accommodation & Food Services (100.0%), Health Care & Social Assistance (82.6%), and Wholesale Trade (66.7%).
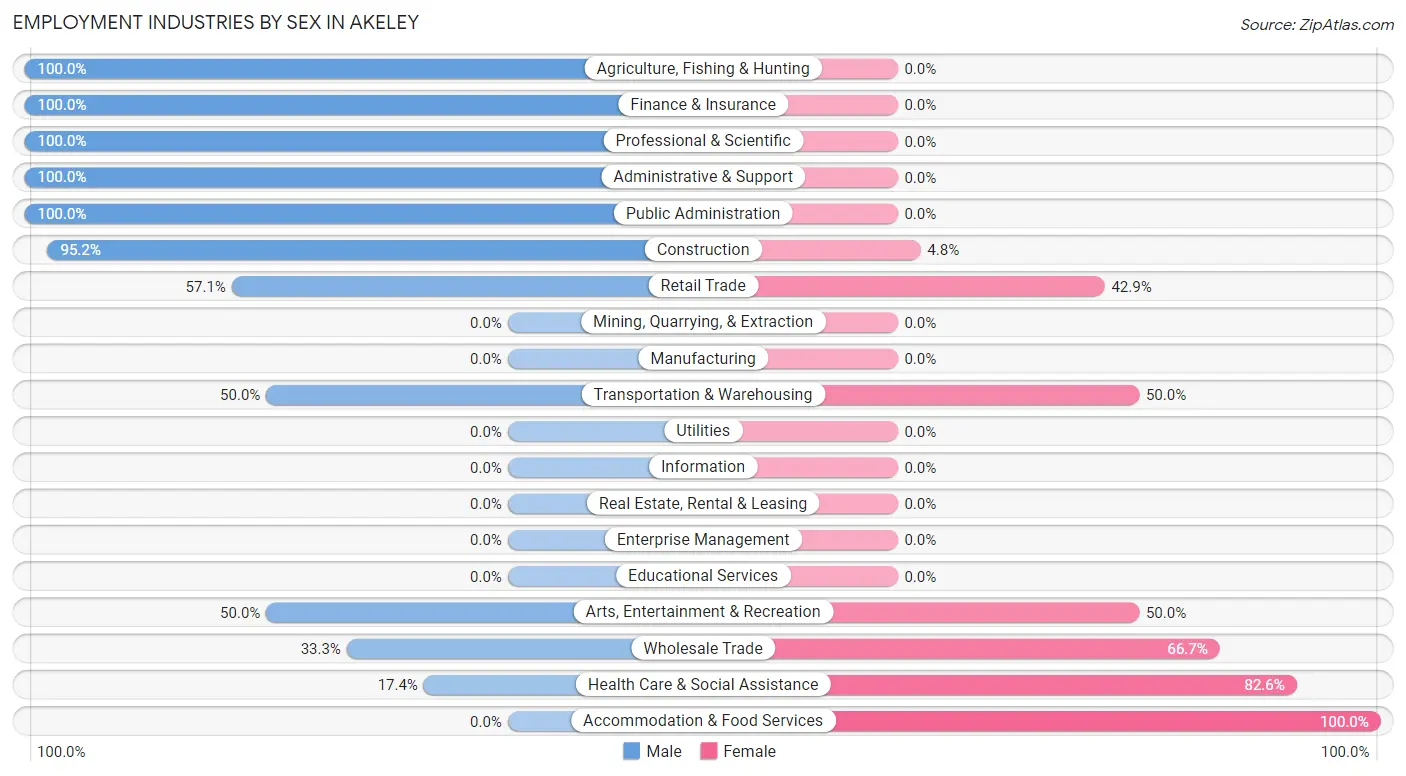
| Industry | Male | Female |
| Agriculture, Fishing & Hunting | 5 (100.0%) | 0 (0.0%) |
| Mining, Quarrying, & Extraction | 0 (0.0%) | 0 (0.0%) |
| Construction | 20 (95.2%) | 1 (4.8%) |
| Manufacturing | 0 (0.0%) | 0 (0.0%) |
| Wholesale Trade | 3 (33.3%) | 6 (66.7%) |
| Retail Trade | 8 (57.1%) | 6 (42.9%) |
| Transportation & Warehousing | 2 (50.0%) | 2 (50.0%) |
| Utilities | 0 (0.0%) | 0 (0.0%) |
| Information | 0 (0.0%) | 0 (0.0%) |
| Finance & Insurance | 11 (100.0%) | 0 (0.0%) |
| Real Estate, Rental & Leasing | 0 (0.0%) | 0 (0.0%) |
| Professional & Scientific | 1 (100.0%) | 0 (0.0%) |
| Enterprise Management | 0 (0.0%) | 0 (0.0%) |
| Administrative & Support | 3 (100.0%) | 0 (0.0%) |
| Educational Services | 0 (0.0%) | 0 (0.0%) |
| Health Care & Social Assistance | 4 (17.4%) | 19 (82.6%) |
| Arts, Entertainment & Recreation | 3 (50.0%) | 3 (50.0%) |
| Accommodation & Food Services | 0 (0.0%) | 18 (100.0%) |
| Public Administration | 2 (100.0%) | 0 (0.0%) |
| Total | 62 (52.1%) | 57 (47.9%) |
Education in Akeley
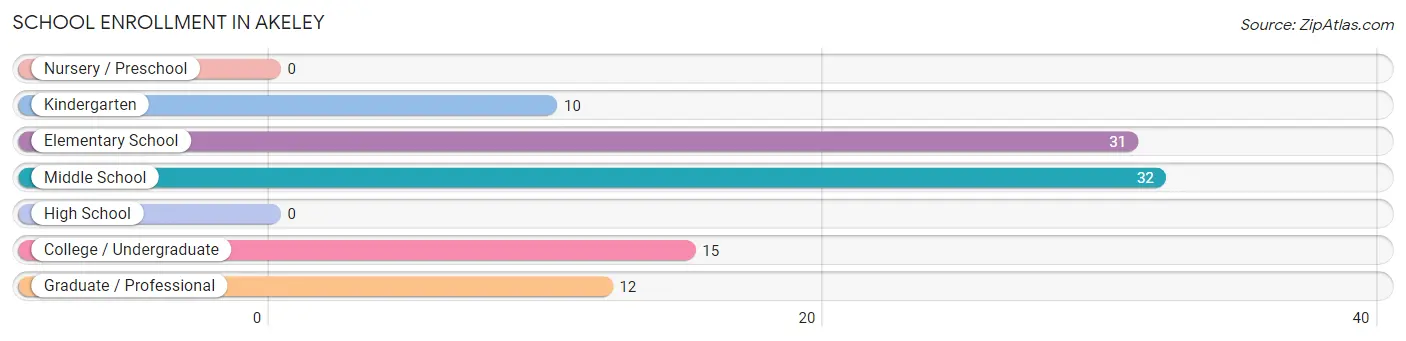
School Enrollment in Akeley
The most common levels of schooling among the 100 students in Akeley are middle school (32 | 32.0%), elementary school (31 | 31.0%), and college / undergraduate (15 | 15.0%).
| School Level | # Students | % Students |
| Nursery / Preschool | 0 | 0.0% |
| Kindergarten | 10 | 10.0% |
| Elementary School | 31 | 31.0% |
| Middle School | 32 | 32.0% |
| High School | 0 | 0.0% |
| College / Undergraduate | 15 | 15.0% |
| Graduate / Professional | 12 | 12.0% |
| Total | 100 | 100.0% |
School Enrollment by Age by Funding Source in Akeley
Out of a total of 100 students who are enrolled in schools in Akeley, 56 (56.0%) attend a private institution, while the remaining 44 (44.0%) are enrolled in public schools. The age group of 35 years and over has the highest likelihood of being enrolled in private schools, with 23 (100.0% in the age bracket) enrolled. Conversely, the age group of 25 to 34 year olds has the lowest likelihood of being enrolled in a private school, with 4 (100.0% in the age bracket) attending a public institution.
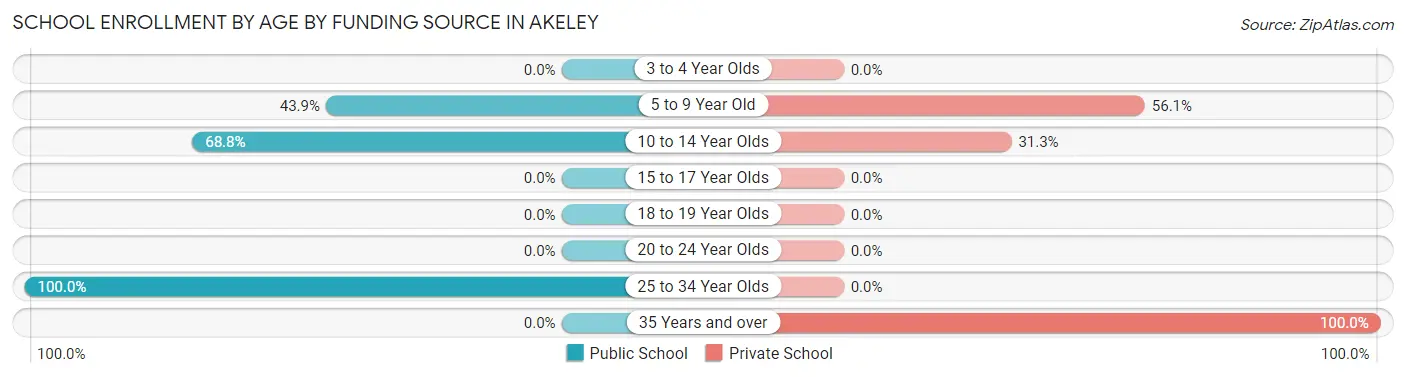
| Age Bracket | Public School | Private School |
| 3 to 4 Year Olds | 0 (0.0%) | 0 (0.0%) |
| 5 to 9 Year Old | 18 (43.9%) | 23 (56.1%) |
| 10 to 14 Year Olds | 22 (68.8%) | 10 (31.2%) |
| 15 to 17 Year Olds | 0 (0.0%) | 0 (0.0%) |
| 18 to 19 Year Olds | 0 (0.0%) | 0 (0.0%) |
| 20 to 24 Year Olds | 0 (0.0%) | 0 (0.0%) |
| 25 to 34 Year Olds | 4 (100.0%) | 0 (0.0%) |
| 35 Years and over | 0 (0.0%) | 23 (100.0%) |
| Total | 44 (44.0%) | 56 (56.0%) |
Educational Attainment by Field of Study in Akeley
Science & technology (15 | 34.1%), education (10 | 22.7%), bio, nature & agricultural (8 | 18.2%), business (5 | 11.4%), and social sciences (3 | 6.8%) are the most common fields of study among 44 individuals in Akeley who have obtained a bachelor's degree or higher.
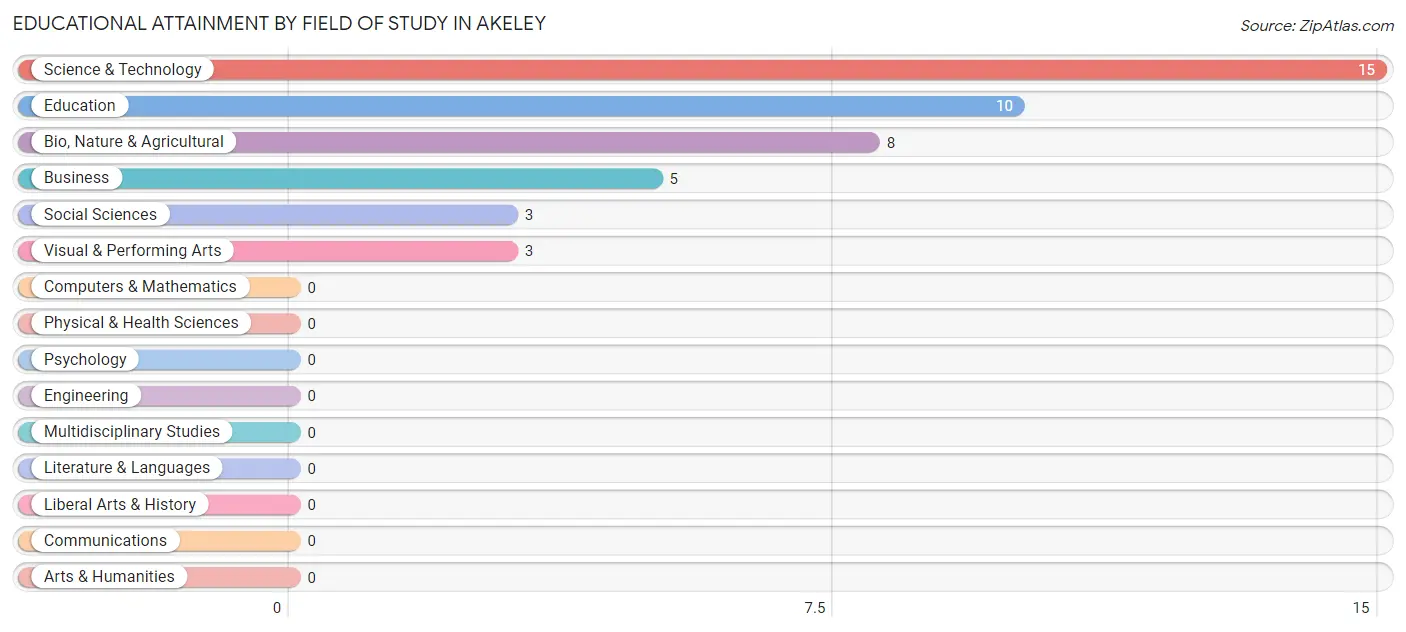
| Field of Study | # Graduates | % Graduates |
| Computers & Mathematics | 0 | 0.0% |
| Bio, Nature & Agricultural | 8 | 18.2% |
| Physical & Health Sciences | 0 | 0.0% |
| Psychology | 0 | 0.0% |
| Social Sciences | 3 | 6.8% |
| Engineering | 0 | 0.0% |
| Multidisciplinary Studies | 0 | 0.0% |
| Science & Technology | 15 | 34.1% |
| Business | 5 | 11.4% |
| Education | 10 | 22.7% |
| Literature & Languages | 0 | 0.0% |
| Liberal Arts & History | 0 | 0.0% |
| Visual & Performing Arts | 3 | 6.8% |
| Communications | 0 | 0.0% |
| Arts & Humanities | 0 | 0.0% |
| Total | 44 | 100.0% |
Transportation & Commute in Akeley
Vehicle Availability by Sex in Akeley
The most prevalent vehicle ownership categories in Akeley are males with 3 vehicles (22, accounting for 35.5%) and females with 3 vehicles (17, making up 40.0%).
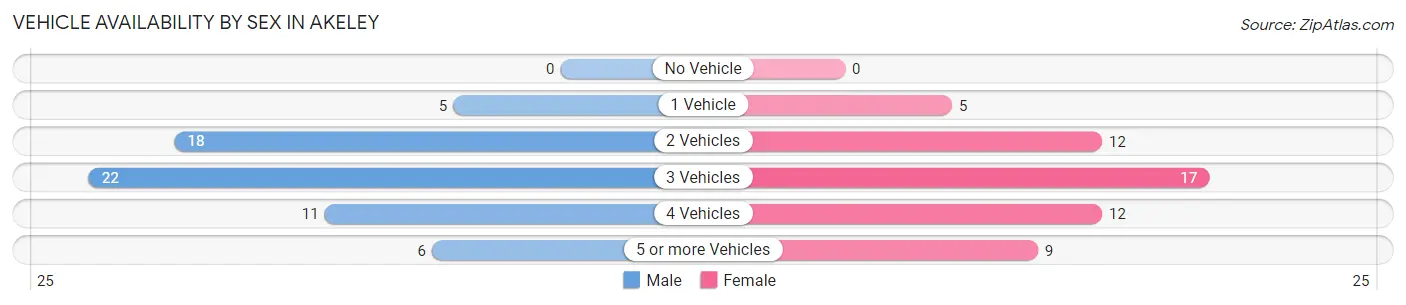
| Vehicles Available | Male | Female |
| No Vehicle | 0 (0.0%) | 0 (0.0%) |
| 1 Vehicle | 5 (8.1%) | 5 (9.1%) |
| 2 Vehicles | 18 (29.0%) | 12 (21.8%) |
| 3 Vehicles | 22 (35.5%) | 17 (30.9%) |
| 4 Vehicles | 11 (17.7%) | 12 (21.8%) |
| 5 or more Vehicles | 6 (9.7%) | 9 (16.4%) |
| Total | 62 (100.0%) | 55 (100.0%) |
Commute Time in Akeley
The most frequently occuring commute durations in Akeley are 15 to 19 minutes (17 commuters, 15.7%), 35 to 39 minutes (17 commuters, 15.7%), and 20 to 24 minutes (12 commuters, 11.1%).
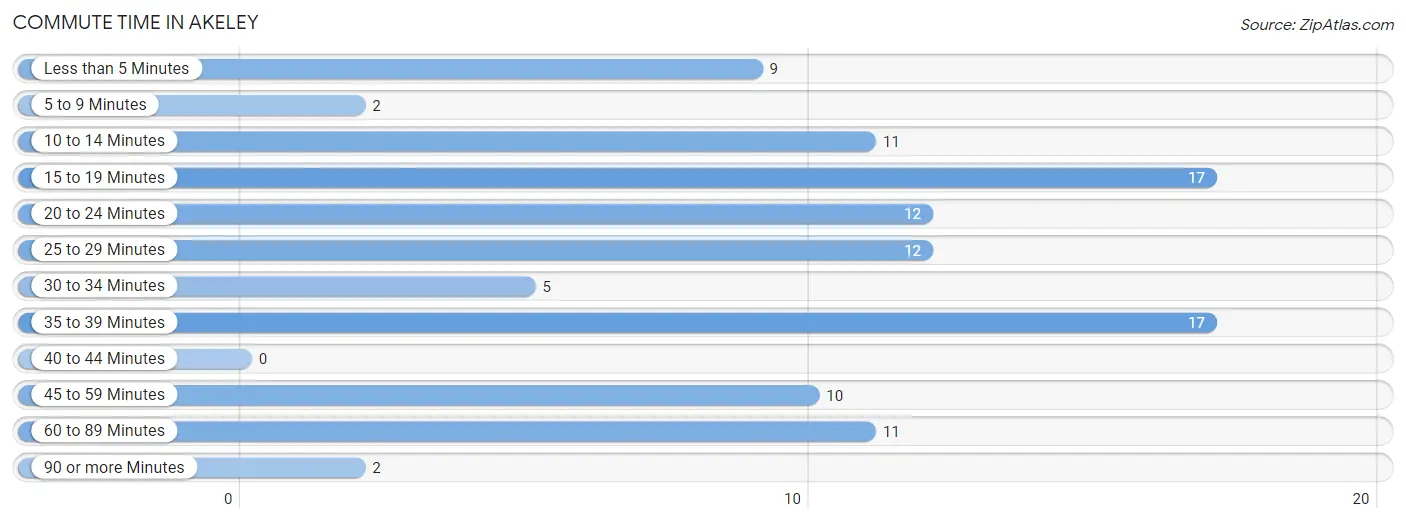
| Commute Time | # Commuters | % Commuters |
| Less than 5 Minutes | 9 | 8.3% |
| 5 to 9 Minutes | 2 | 1.8% |
| 10 to 14 Minutes | 11 | 10.2% |
| 15 to 19 Minutes | 17 | 15.7% |
| 20 to 24 Minutes | 12 | 11.1% |
| 25 to 29 Minutes | 12 | 11.1% |
| 30 to 34 Minutes | 5 | 4.6% |
| 35 to 39 Minutes | 17 | 15.7% |
| 40 to 44 Minutes | 0 | 0.0% |
| 45 to 59 Minutes | 10 | 9.3% |
| 60 to 89 Minutes | 11 | 10.2% |
| 90 or more Minutes | 2 | 1.8% |
Commute Time by Sex in Akeley
The most common commute times in Akeley are 15 to 19 minutes (15 commuters, 25.9%) for males and 25 to 29 minutes (12 commuters, 24.0%) for females.
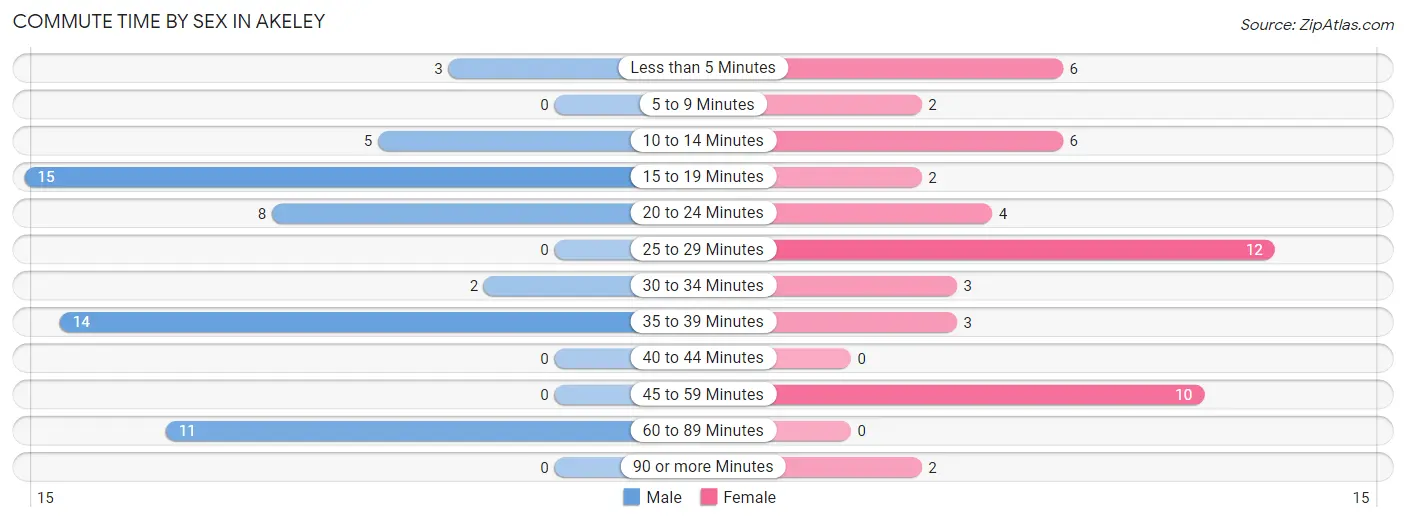
| Commute Time | Male | Female |
| Less than 5 Minutes | 3 (5.2%) | 6 (12.0%) |
| 5 to 9 Minutes | 0 (0.0%) | 2 (4.0%) |
| 10 to 14 Minutes | 5 (8.6%) | 6 (12.0%) |
| 15 to 19 Minutes | 15 (25.9%) | 2 (4.0%) |
| 20 to 24 Minutes | 8 (13.8%) | 4 (8.0%) |
| 25 to 29 Minutes | 0 (0.0%) | 12 (24.0%) |
| 30 to 34 Minutes | 2 (3.5%) | 3 (6.0%) |
| 35 to 39 Minutes | 14 (24.1%) | 3 (6.0%) |
| 40 to 44 Minutes | 0 (0.0%) | 0 (0.0%) |
| 45 to 59 Minutes | 0 (0.0%) | 10 (20.0%) |
| 60 to 89 Minutes | 11 (19.0%) | 0 (0.0%) |
| 90 or more Minutes | 0 (0.0%) | 2 (4.0%) |
Time of Departure to Work by Sex in Akeley
The most frequent times of departure to work in Akeley are 9:00 AM to 9:59 AM (22, 37.9%) for males and 4:00 PM to 11:59 PM (13, 26.0%) for females.
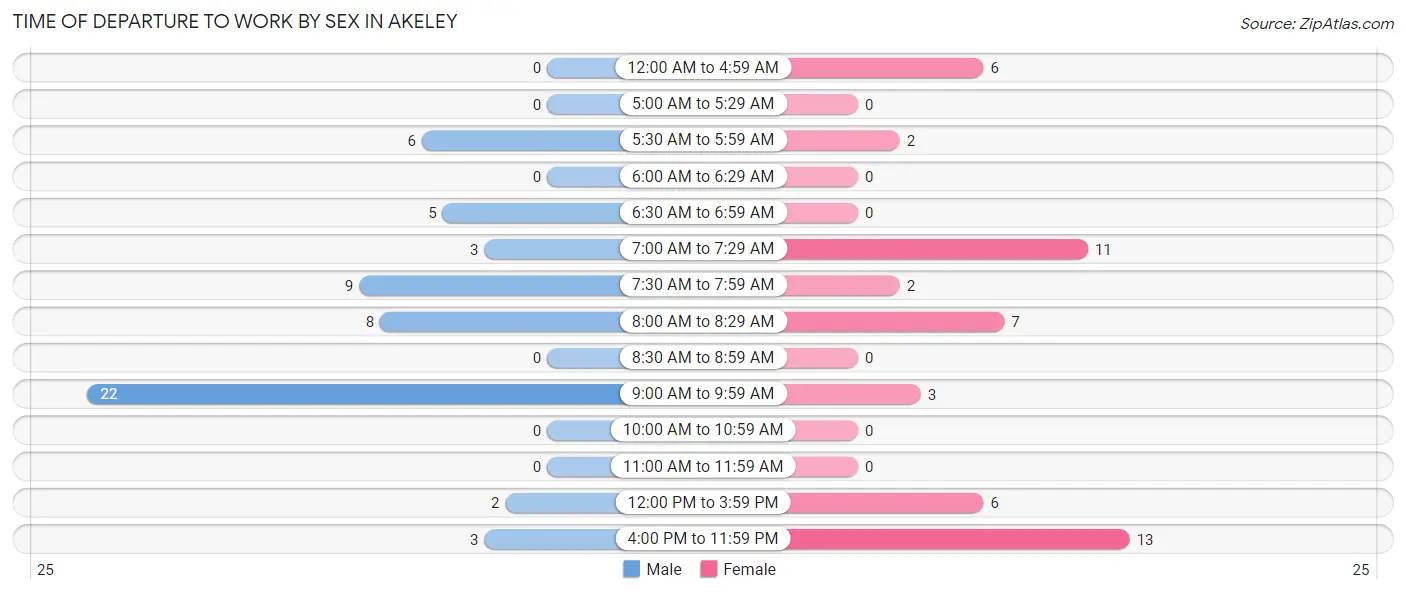
| Time of Departure | Male | Female |
| 12:00 AM to 4:59 AM | 0 (0.0%) | 6 (12.0%) |
| 5:00 AM to 5:29 AM | 0 (0.0%) | 0 (0.0%) |
| 5:30 AM to 5:59 AM | 6 (10.3%) | 2 (4.0%) |
| 6:00 AM to 6:29 AM | 0 (0.0%) | 0 (0.0%) |
| 6:30 AM to 6:59 AM | 5 (8.6%) | 0 (0.0%) |
| 7:00 AM to 7:29 AM | 3 (5.2%) | 11 (22.0%) |
| 7:30 AM to 7:59 AM | 9 (15.5%) | 2 (4.0%) |
| 8:00 AM to 8:29 AM | 8 (13.8%) | 7 (14.0%) |
| 8:30 AM to 8:59 AM | 0 (0.0%) | 0 (0.0%) |
| 9:00 AM to 9:59 AM | 22 (37.9%) | 3 (6.0%) |
| 10:00 AM to 10:59 AM | 0 (0.0%) | 0 (0.0%) |
| 11:00 AM to 11:59 AM | 0 (0.0%) | 0 (0.0%) |
| 12:00 PM to 3:59 PM | 2 (3.5%) | 6 (12.0%) |
| 4:00 PM to 11:59 PM | 3 (5.2%) | 13 (26.0%) |
| Total | 58 (100.0%) | 50 (100.0%) |
Housing Occupancy in Akeley
Occupancy by Ownership in Akeley
Of the total 171 dwellings in Akeley, owner-occupied units account for 142 (83.0%), while renter-occupied units make up 29 (17.0%).
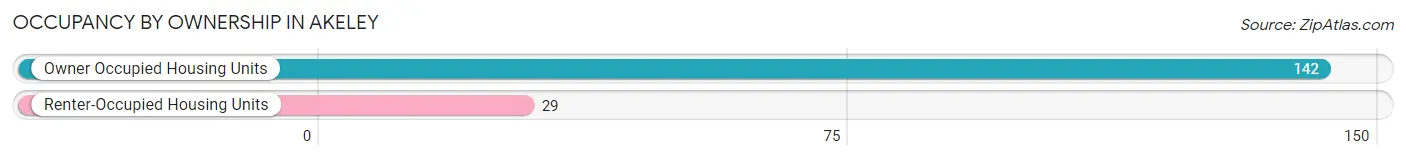
| Occupancy | # Housing Units | % Housing Units |
| Owner Occupied Housing Units | 142 | 83.0% |
| Renter-Occupied Housing Units | 29 | 17.0% |
| Total Occupied Housing Units | 171 | 100.0% |
Occupancy by Household Size in Akeley
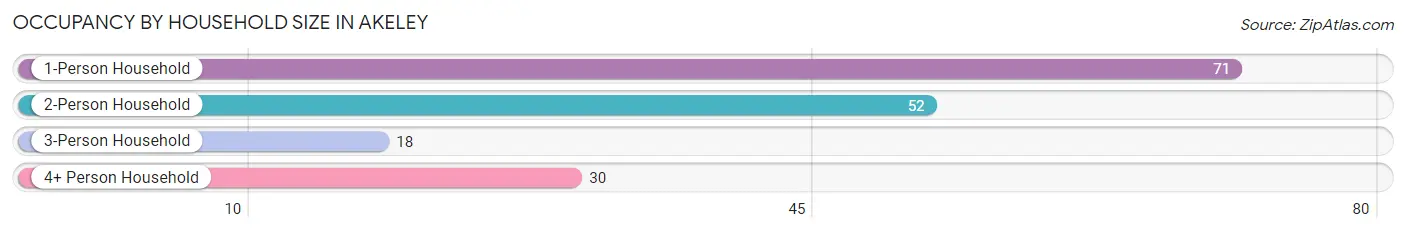
| Household Size | # Housing Units | % Housing Units |
| 1-Person Household | 71 | 41.5% |
| 2-Person Household | 52 | 30.4% |
| 3-Person Household | 18 | 10.5% |
| 4+ Person Household | 30 | 17.5% |
| Total Housing Units | 171 | 100.0% |
Occupancy by Ownership by Household Size in Akeley
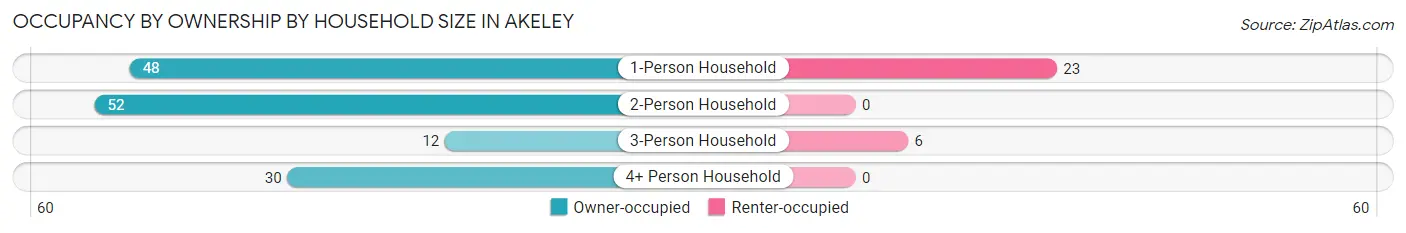
| Household Size | Owner-occupied | Renter-occupied |
| 1-Person Household | 48 (67.6%) | 23 (32.4%) |
| 2-Person Household | 52 (100.0%) | 0 (0.0%) |
| 3-Person Household | 12 (66.7%) | 6 (33.3%) |
| 4+ Person Household | 30 (100.0%) | 0 (0.0%) |
| Total Housing Units | 142 (83.0%) | 29 (17.0%) |
Occupancy by Educational Attainment in Akeley
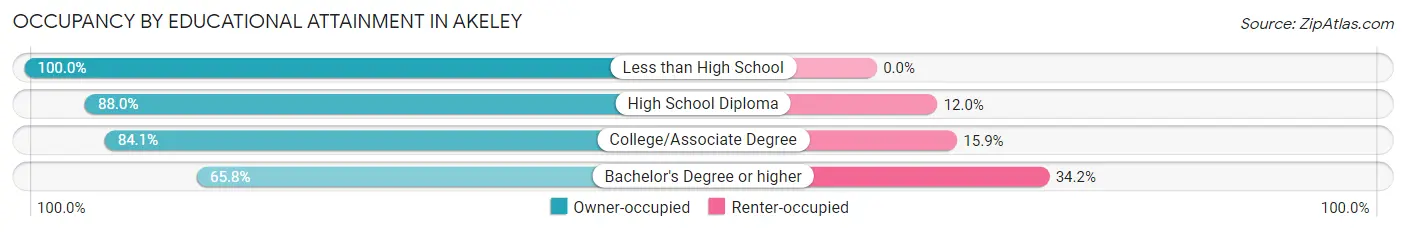
| Household Size | Owner-occupied | Renter-occupied |
| Less than High School | 14 (100.0%) | 0 (0.0%) |
| High School Diploma | 66 (88.0%) | 9 (12.0%) |
| College/Associate Degree | 37 (84.1%) | 7 (15.9%) |
| Bachelor's Degree or higher | 25 (65.8%) | 13 (34.2%) |
Occupancy by Age of Householder in Akeley
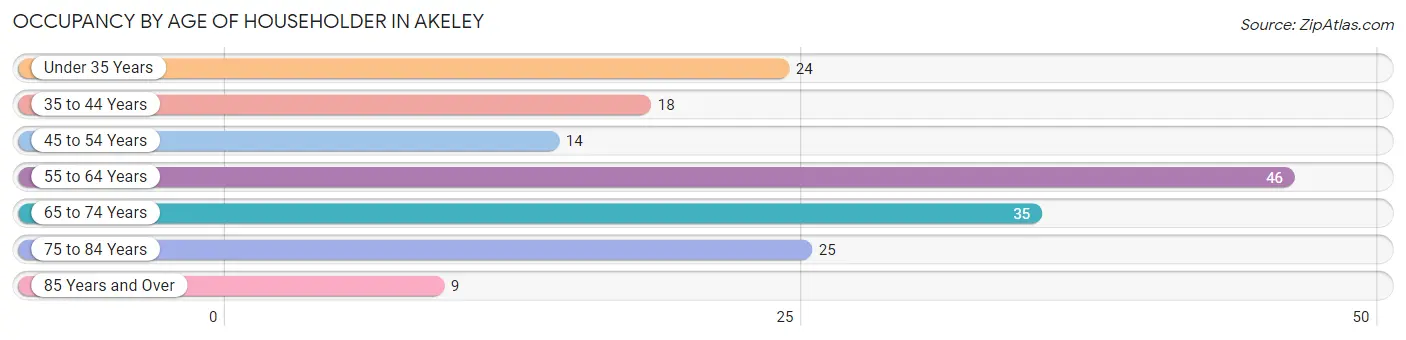
| Age Bracket | # Households | % Households |
| Under 35 Years | 24 | 14.0% |
| 35 to 44 Years | 18 | 10.5% |
| 45 to 54 Years | 14 | 8.2% |
| 55 to 64 Years | 46 | 26.9% |
| 65 to 74 Years | 35 | 20.5% |
| 75 to 84 Years | 25 | 14.6% |
| 85 Years and Over | 9 | 5.3% |
| Total | 171 | 100.0% |
Housing Finances in Akeley
Median Income by Occupancy in Akeley
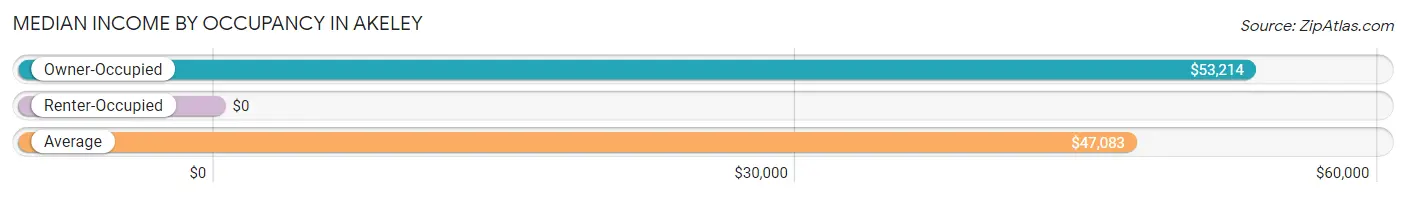
| Occupancy Type | # Households | Median Income |
| Owner-Occupied | 142 (83.0%) | $53,214 |
| Renter-Occupied | 29 (17.0%) | $0 |
| Average | 171 (100.0%) | $47,083 |
Occupancy by Householder Income Bracket in Akeley
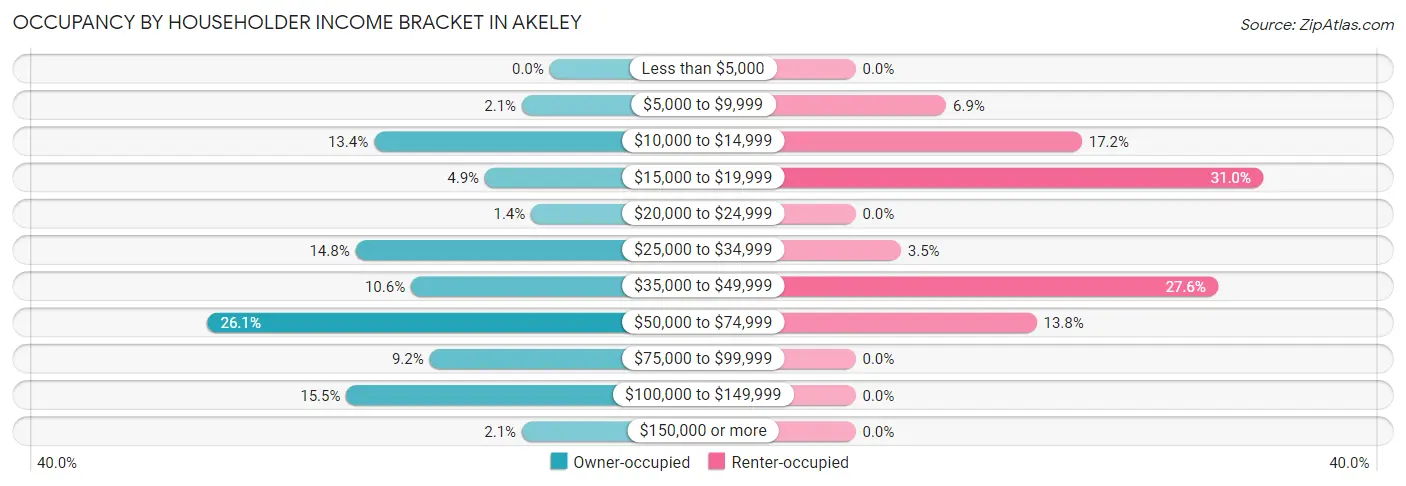
| Income Bracket | Owner-occupied | Renter-occupied |
| Less than $5,000 | 0 (0.0%) | 0 (0.0%) |
| $5,000 to $9,999 | 3 (2.1%) | 2 (6.9%) |
| $10,000 to $14,999 | 19 (13.4%) | 5 (17.2%) |
| $15,000 to $19,999 | 7 (4.9%) | 9 (31.0%) |
| $20,000 to $24,999 | 2 (1.4%) | 0 (0.0%) |
| $25,000 to $34,999 | 21 (14.8%) | 1 (3.5%) |
| $35,000 to $49,999 | 15 (10.6%) | 8 (27.6%) |
| $50,000 to $74,999 | 37 (26.1%) | 4 (13.8%) |
| $75,000 to $99,999 | 13 (9.1%) | 0 (0.0%) |
| $100,000 to $149,999 | 22 (15.5%) | 0 (0.0%) |
| $150,000 or more | 3 (2.1%) | 0 (0.0%) |
| Total | 142 (100.0%) | 29 (100.0%) |
Monthly Housing Cost Tiers in Akeley
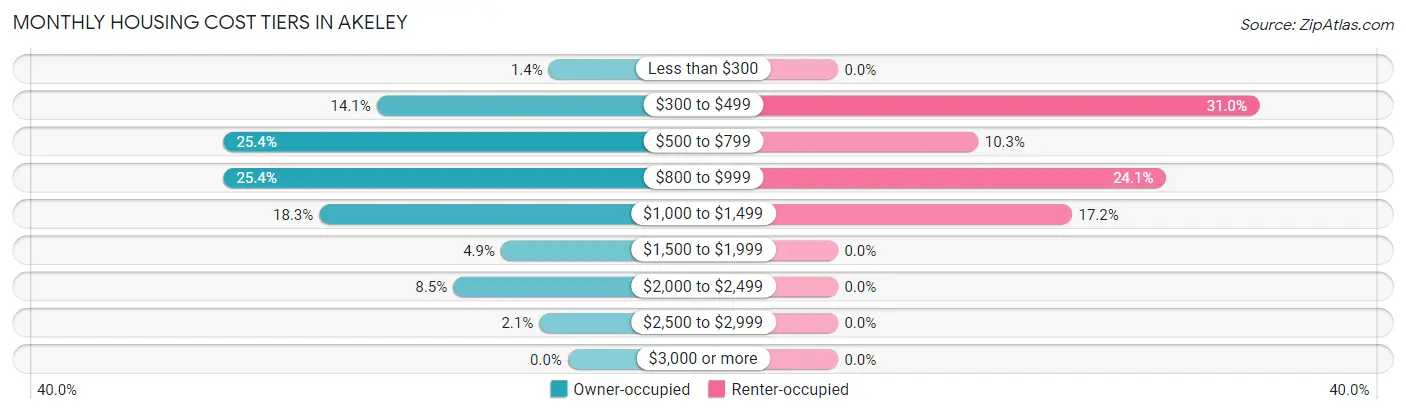
| Monthly Cost | Owner-occupied | Renter-occupied |
| Less than $300 | 2 (1.4%) | 0 (0.0%) |
| $300 to $499 | 20 (14.1%) | 9 (31.0%) |
| $500 to $799 | 36 (25.4%) | 3 (10.3%) |
| $800 to $999 | 36 (25.4%) | 7 (24.1%) |
| $1,000 to $1,499 | 26 (18.3%) | 5 (17.2%) |
| $1,500 to $1,999 | 7 (4.9%) | 0 (0.0%) |
| $2,000 to $2,499 | 12 (8.5%) | 0 (0.0%) |
| $2,500 to $2,999 | 3 (2.1%) | 0 (0.0%) |
| $3,000 or more | 0 (0.0%) | 0 (0.0%) |
| Total | 142 (100.0%) | 29 (100.0%) |
Physical Housing Characteristics in Akeley
Housing Structures in Akeley
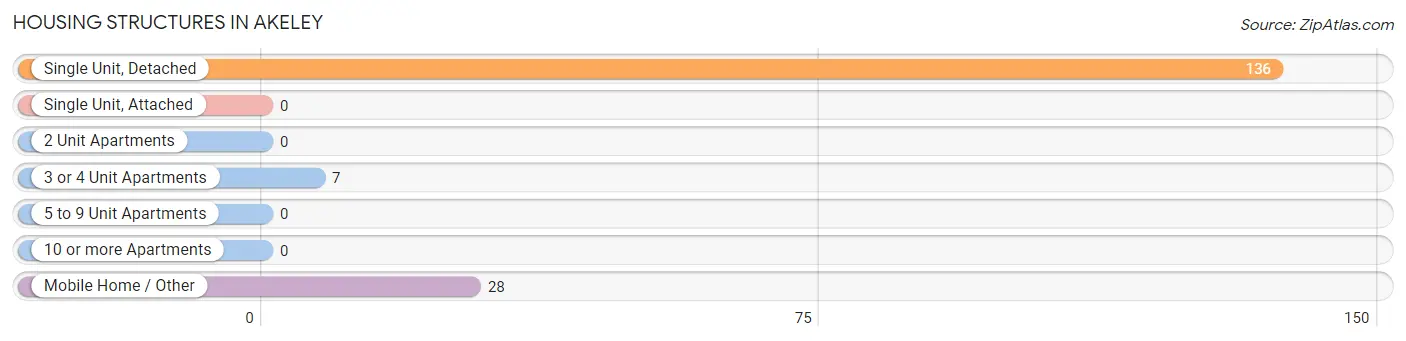
| Structure Type | # Housing Units | % Housing Units |
| Single Unit, Detached | 136 | 79.5% |
| Single Unit, Attached | 0 | 0.0% |
| 2 Unit Apartments | 0 | 0.0% |
| 3 or 4 Unit Apartments | 7 | 4.1% |
| 5 to 9 Unit Apartments | 0 | 0.0% |
| 10 or more Apartments | 0 | 0.0% |
| Mobile Home / Other | 28 | 16.4% |
| Total | 171 | 100.0% |
Housing Structures by Occupancy in Akeley
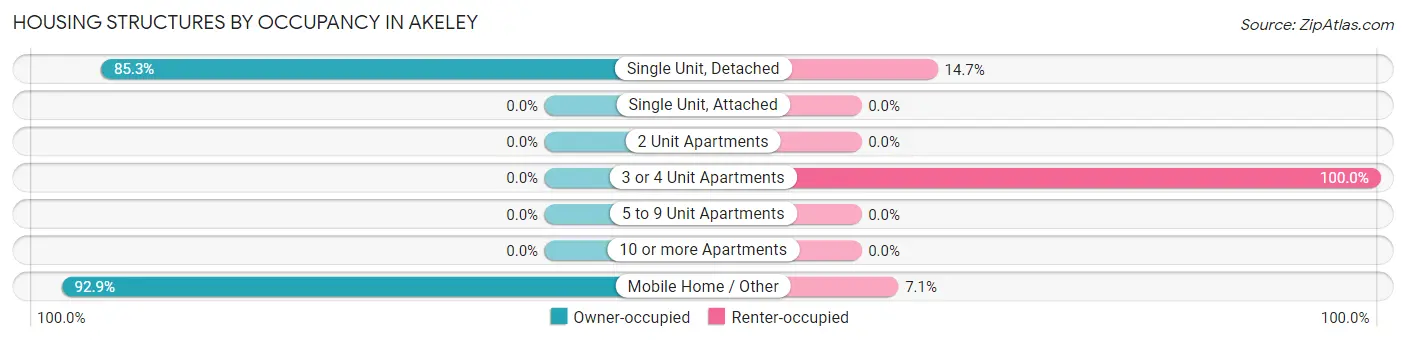
| Structure Type | Owner-occupied | Renter-occupied |
| Single Unit, Detached | 116 (85.3%) | 20 (14.7%) |
| Single Unit, Attached | 0 (0.0%) | 0 (0.0%) |
| 2 Unit Apartments | 0 (0.0%) | 0 (0.0%) |
| 3 or 4 Unit Apartments | 0 (0.0%) | 7 (100.0%) |
| 5 to 9 Unit Apartments | 0 (0.0%) | 0 (0.0%) |
| 10 or more Apartments | 0 (0.0%) | 0 (0.0%) |
| Mobile Home / Other | 26 (92.9%) | 2 (7.1%) |
| Total | 142 (83.0%) | 29 (17.0%) |
Housing Structures by Number of Rooms in Akeley
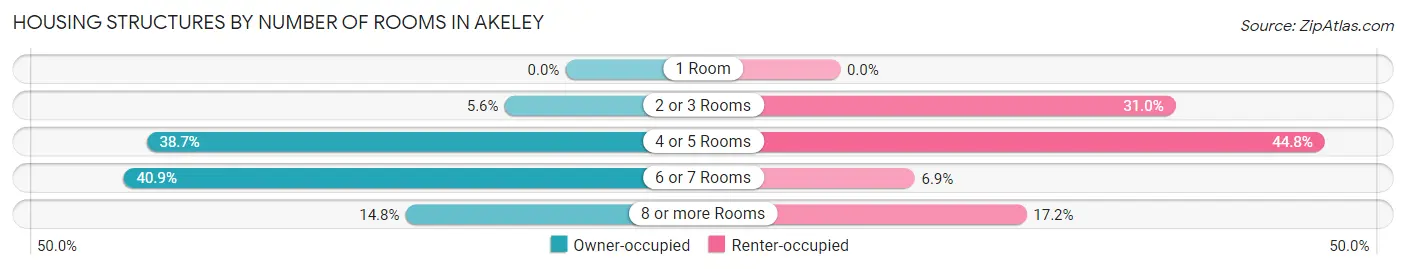
| Number of Rooms | Owner-occupied | Renter-occupied |
| 1 Room | 0 (0.0%) | 0 (0.0%) |
| 2 or 3 Rooms | 8 (5.6%) | 9 (31.0%) |
| 4 or 5 Rooms | 55 (38.7%) | 13 (44.8%) |
| 6 or 7 Rooms | 58 (40.8%) | 2 (6.9%) |
| 8 or more Rooms | 21 (14.8%) | 5 (17.2%) |
| Total | 142 (100.0%) | 29 (100.0%) |
Housing Structure by Heating Type in Akeley
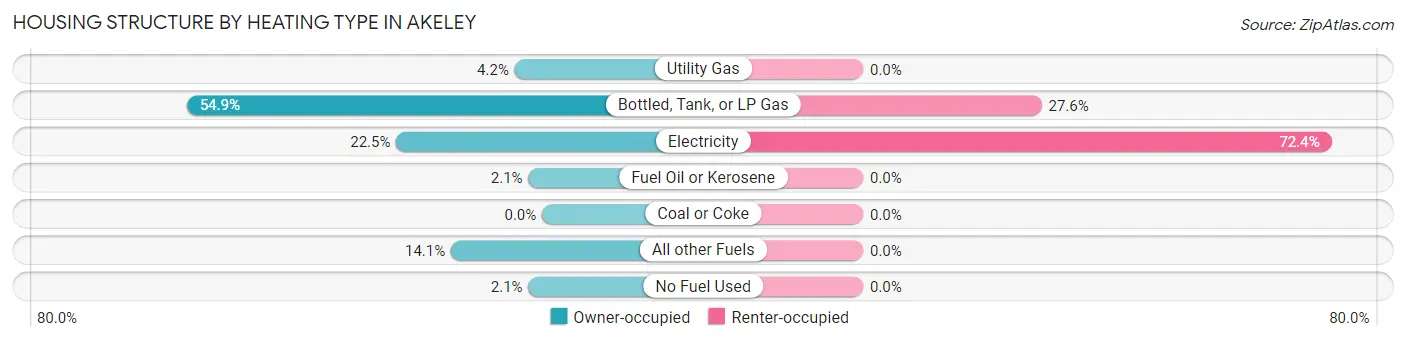
| Heating Type | Owner-occupied | Renter-occupied |
| Utility Gas | 6 (4.2%) | 0 (0.0%) |
| Bottled, Tank, or LP Gas | 78 (54.9%) | 8 (27.6%) |
| Electricity | 32 (22.5%) | 21 (72.4%) |
| Fuel Oil or Kerosene | 3 (2.1%) | 0 (0.0%) |
| Coal or Coke | 0 (0.0%) | 0 (0.0%) |
| All other Fuels | 20 (14.1%) | 0 (0.0%) |
| No Fuel Used | 3 (2.1%) | 0 (0.0%) |
| Total | 142 (100.0%) | 29 (100.0%) |
Household Vehicle Usage in Akeley
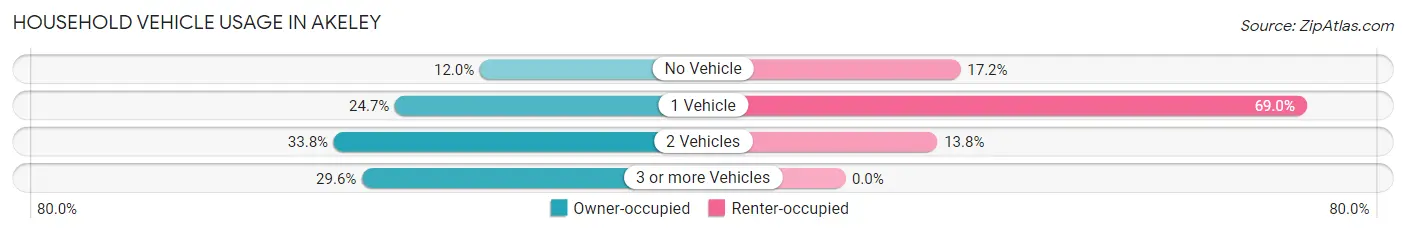
| Vehicles per Household | Owner-occupied | Renter-occupied |
| No Vehicle | 17 (12.0%) | 5 (17.2%) |
| 1 Vehicle | 35 (24.6%) | 20 (69.0%) |
| 2 Vehicles | 48 (33.8%) | 4 (13.8%) |
| 3 or more Vehicles | 42 (29.6%) | 0 (0.0%) |
| Total | 142 (100.0%) | 29 (100.0%) |
Real Estate & Mortgages in Akeley
Real Estate and Mortgage Overview in Akeley
| Characteristic | Without Mortgage | With Mortgage |
| Housing Units | 51 | 91 |
| Median Property Value | $97,500 | $118,800 |
| Median Household Income | $30,795 | $3 |
| Monthly Housing Costs | $535 | $0 |
| Real Estate Taxes | $1,141 | $0 |
Property Value by Mortgage Status in Akeley
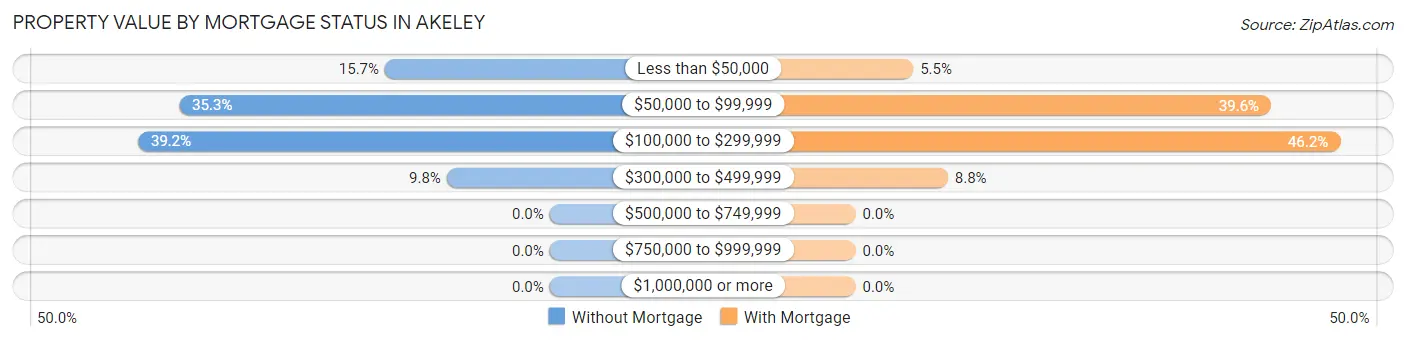
| Property Value | Without Mortgage | With Mortgage |
| Less than $50,000 | 8 (15.7%) | 5 (5.5%) |
| $50,000 to $99,999 | 18 (35.3%) | 36 (39.6%) |
| $100,000 to $299,999 | 20 (39.2%) | 42 (46.2%) |
| $300,000 to $499,999 | 5 (9.8%) | 8 (8.8%) |
| $500,000 to $749,999 | 0 (0.0%) | 0 (0.0%) |
| $750,000 to $999,999 | 0 (0.0%) | 0 (0.0%) |
| $1,000,000 or more | 0 (0.0%) | 0 (0.0%) |
| Total | 51 (100.0%) | 91 (100.0%) |
Household Income by Mortgage Status in Akeley
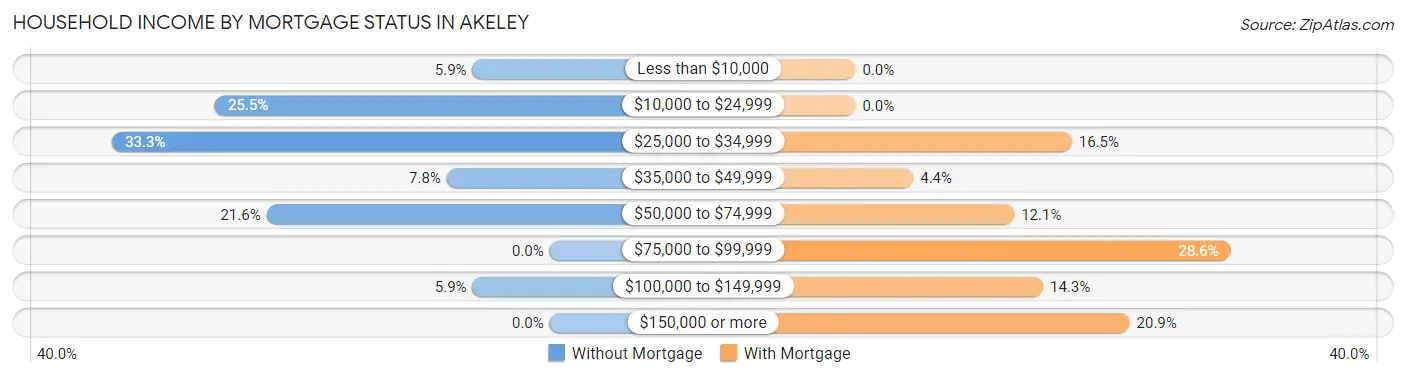
| Household Income | Without Mortgage | With Mortgage |
| Less than $10,000 | 3 (5.9%) | 0 (0.0%) |
| $10,000 to $24,999 | 13 (25.5%) | 0 (0.0%) |
| $25,000 to $34,999 | 17 (33.3%) | 15 (16.5%) |
| $35,000 to $49,999 | 4 (7.8%) | 4 (4.4%) |
| $50,000 to $74,999 | 11 (21.6%) | 11 (12.1%) |
| $75,000 to $99,999 | 0 (0.0%) | 26 (28.6%) |
| $100,000 to $149,999 | 3 (5.9%) | 13 (14.3%) |
| $150,000 or more | 0 (0.0%) | 19 (20.9%) |
| Total | 51 (100.0%) | 91 (100.0%) |
Property Value to Household Income Ratio in Akeley
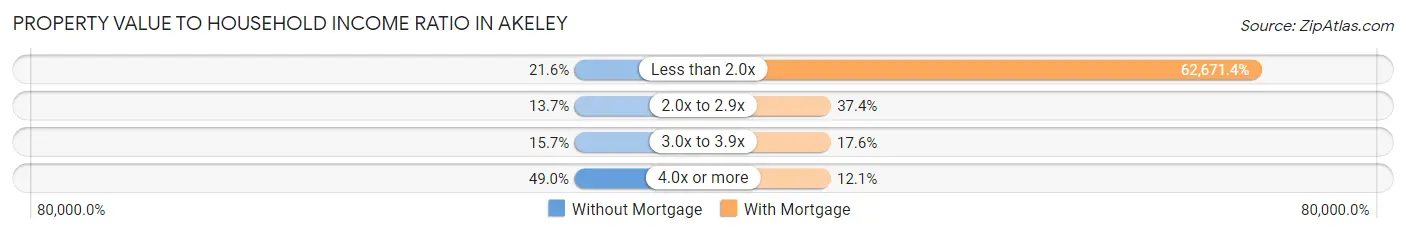
| Value-to-Income Ratio | Without Mortgage | With Mortgage |
| Less than 2.0x | 11 (21.6%) | 57,031 (62,671.4%) |
| 2.0x to 2.9x | 7 (13.7%) | 34 (37.4%) |
| 3.0x to 3.9x | 8 (15.7%) | 16 (17.6%) |
| 4.0x or more | 25 (49.0%) | 11 (12.1%) |
| Total | 51 (100.0%) | 91 (100.0%) |
Real Estate Taxes by Mortgage Status in Akeley
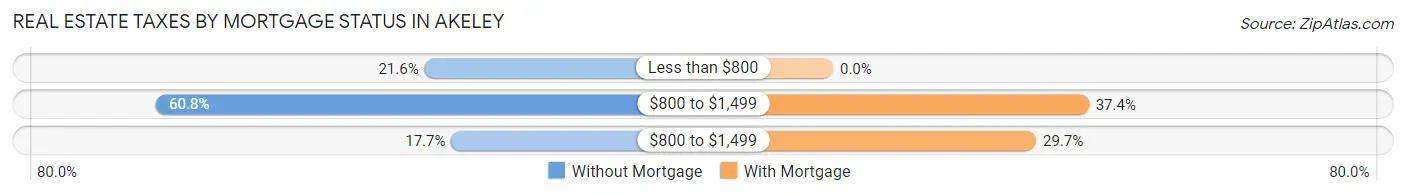
| Property Taxes | Without Mortgage | With Mortgage |
| Less than $800 | 11 (21.6%) | 0 (0.0%) |
| $800 to $1,499 | 31 (60.8%) | 34 (37.4%) |
| $800 to $1,499 | 9 (17.6%) | 27 (29.7%) |
| Total | 51 (100.0%) | 91 (100.0%) |
Health & Disability in Akeley
Health Insurance Coverage by Age in Akeley
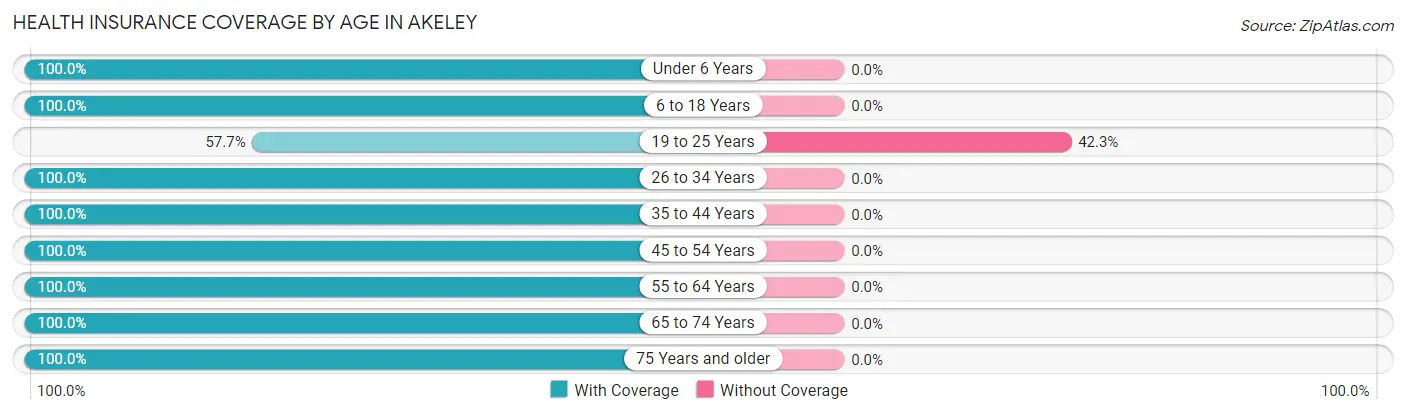
| Age Bracket | With Coverage | Without Coverage |
| Under 6 Years | 13 (100.0%) | 0 (0.0%) |
| 6 to 18 Years | 79 (100.0%) | 0 (0.0%) |
| 19 to 25 Years | 15 (57.7%) | 11 (42.3%) |
| 26 to 34 Years | 30 (100.0%) | 0 (0.0%) |
| 35 to 44 Years | 35 (100.0%) | 0 (0.0%) |
| 45 to 54 Years | 21 (100.0%) | 0 (0.0%) |
| 55 to 64 Years | 58 (100.0%) | 0 (0.0%) |
| 65 to 74 Years | 60 (100.0%) | 0 (0.0%) |
| 75 Years and older | 41 (100.0%) | 0 (0.0%) |
| Total | 352 (97.0%) | 11 (3.0%) |
Health Insurance Coverage by Citizenship Status in Akeley
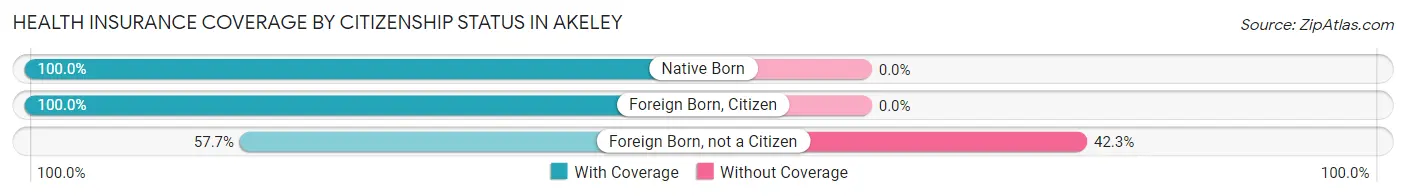
| Citizenship Status | With Coverage | Without Coverage |
| Native Born | 13 (100.0%) | 0 (0.0%) |
| Foreign Born, Citizen | 79 (100.0%) | 0 (0.0%) |
| Foreign Born, not a Citizen | 15 (57.7%) | 11 (42.3%) |
Health Insurance Coverage by Household Income in Akeley
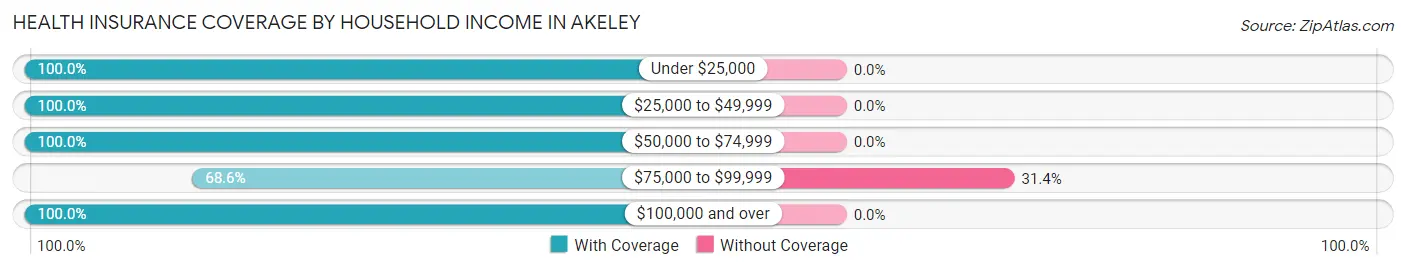
| Household Income | With Coverage | Without Coverage |
| Under $25,000 | 60 (100.0%) | 0 (0.0%) |
| $25,000 to $49,999 | 97 (100.0%) | 0 (0.0%) |
| $50,000 to $74,999 | 77 (100.0%) | 0 (0.0%) |
| $75,000 to $99,999 | 24 (68.6%) | 11 (31.4%) |
| $100,000 and over | 94 (100.0%) | 0 (0.0%) |
Public vs Private Health Insurance Coverage by Age in Akeley
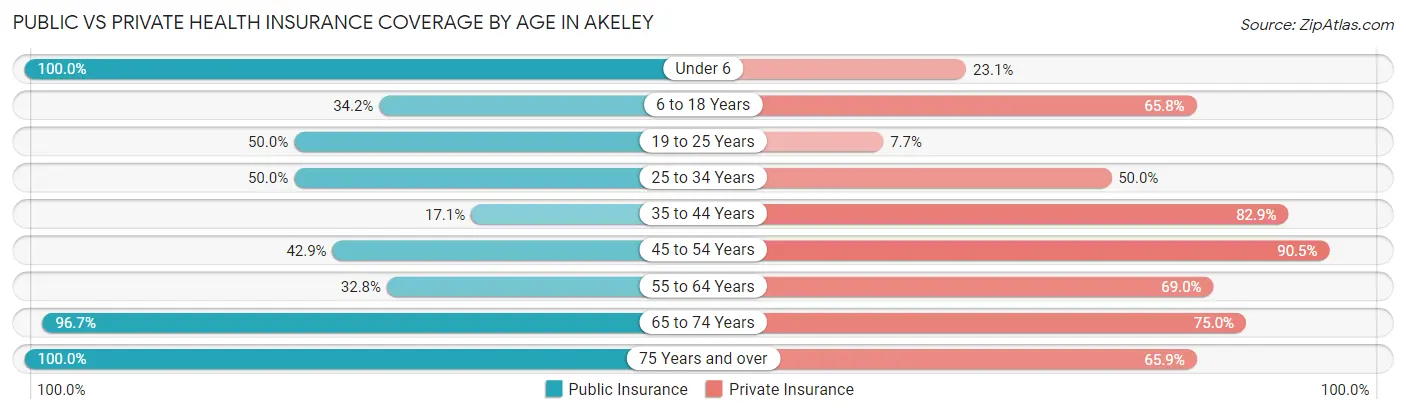
| Age Bracket | Public Insurance | Private Insurance |
| Under 6 | 13 (100.0%) | 3 (23.1%) |
| 6 to 18 Years | 27 (34.2%) | 52 (65.8%) |
| 19 to 25 Years | 13 (50.0%) | 2 (7.7%) |
| 25 to 34 Years | 15 (50.0%) | 15 (50.0%) |
| 35 to 44 Years | 6 (17.1%) | 29 (82.9%) |
| 45 to 54 Years | 9 (42.9%) | 19 (90.5%) |
| 55 to 64 Years | 19 (32.8%) | 40 (69.0%) |
| 65 to 74 Years | 58 (96.7%) | 45 (75.0%) |
| 75 Years and over | 41 (100.0%) | 27 (65.8%) |
| Total | 201 (55.4%) | 232 (63.9%) |
Disability Status by Sex by Age in Akeley
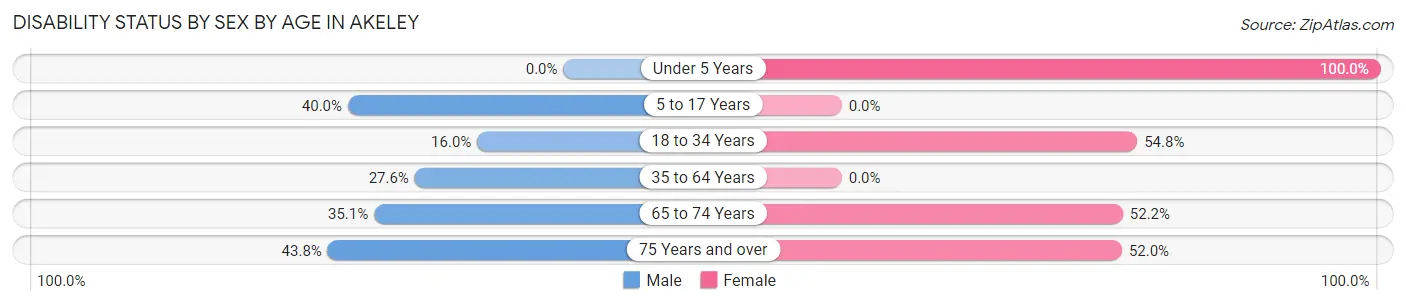
| Age Bracket | Male | Female |
| Under 5 Years | 0 (0.0%) | 3 (100.0%) |
| 5 to 17 Years | 10 (40.0%) | 0 (0.0%) |
| 18 to 34 Years | 4 (16.0%) | 17 (54.8%) |
| 35 to 64 Years | 16 (27.6%) | 0 (0.0%) |
| 65 to 74 Years | 13 (35.1%) | 12 (52.2%) |
| 75 Years and over | 7 (43.8%) | 13 (52.0%) |
Disability Class by Sex by Age in Akeley
Disability Class: Hearing Difficulty
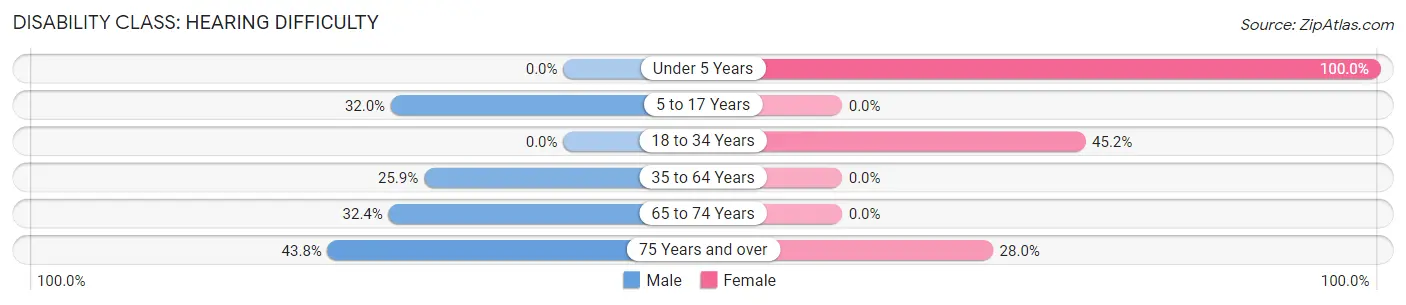
| Age Bracket | Male | Female |
| Under 5 Years | 0 (0.0%) | 3 (100.0%) |
| 5 to 17 Years | 8 (32.0%) | 0 (0.0%) |
| 18 to 34 Years | 0 (0.0%) | 14 (45.2%) |
| 35 to 64 Years | 15 (25.9%) | 0 (0.0%) |
| 65 to 74 Years | 12 (32.4%) | 0 (0.0%) |
| 75 Years and over | 7 (43.8%) | 7 (28.0%) |
Disability Class: Vision Difficulty
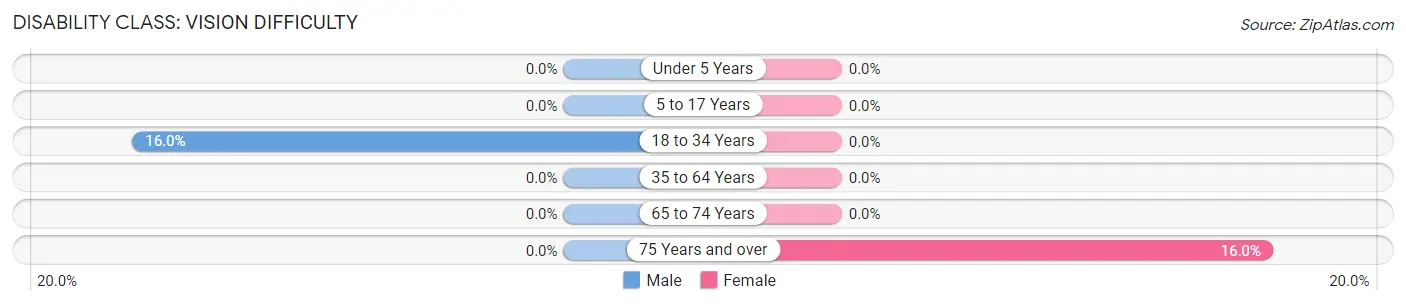
| Age Bracket | Male | Female |
| Under 5 Years | 0 (0.0%) | 0 (0.0%) |
| 5 to 17 Years | 0 (0.0%) | 0 (0.0%) |
| 18 to 34 Years | 4 (16.0%) | 0 (0.0%) |
| 35 to 64 Years | 0 (0.0%) | 0 (0.0%) |
| 65 to 74 Years | 0 (0.0%) | 0 (0.0%) |
| 75 Years and over | 0 (0.0%) | 4 (16.0%) |
Disability Class: Cognitive Difficulty
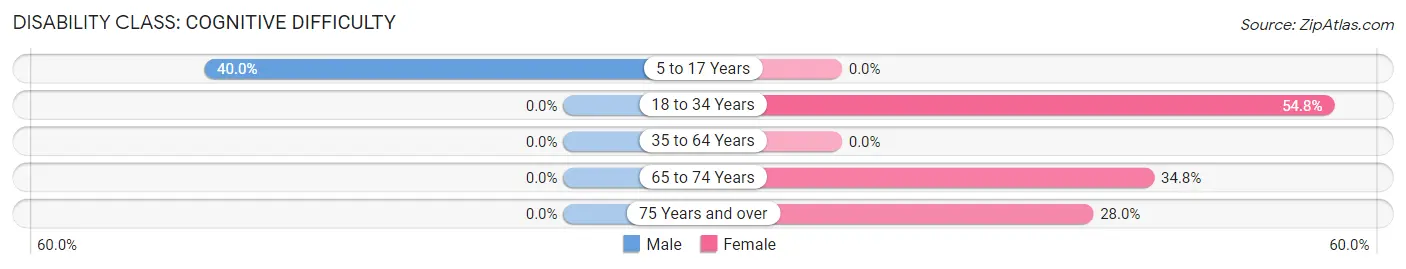
| Age Bracket | Male | Female |
| 5 to 17 Years | 10 (40.0%) | 0 (0.0%) |
| 18 to 34 Years | 0 (0.0%) | 17 (54.8%) |
| 35 to 64 Years | 0 (0.0%) | 0 (0.0%) |
| 65 to 74 Years | 0 (0.0%) | 8 (34.8%) |
| 75 Years and over | 0 (0.0%) | 7 (28.0%) |
Disability Class: Ambulatory Difficulty
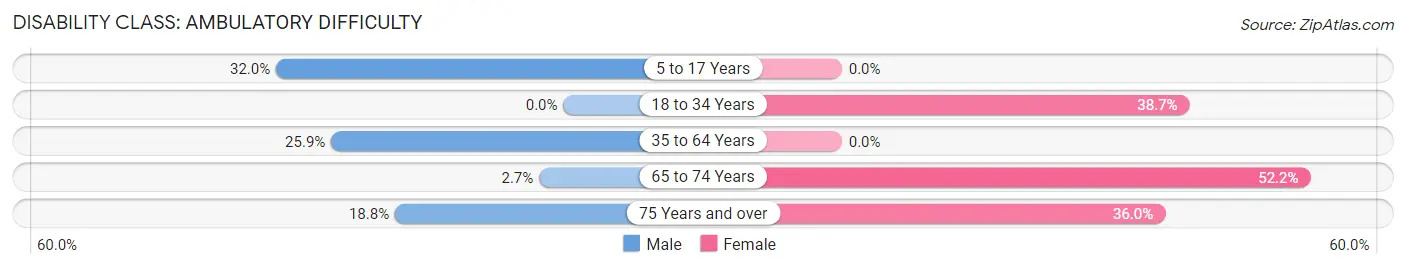
| Age Bracket | Male | Female |
| 5 to 17 Years | 8 (32.0%) | 0 (0.0%) |
| 18 to 34 Years | 0 (0.0%) | 12 (38.7%) |
| 35 to 64 Years | 15 (25.9%) | 0 (0.0%) |
| 65 to 74 Years | 1 (2.7%) | 12 (52.2%) |
| 75 Years and over | 3 (18.8%) | 9 (36.0%) |
Disability Class: Self-Care Difficulty
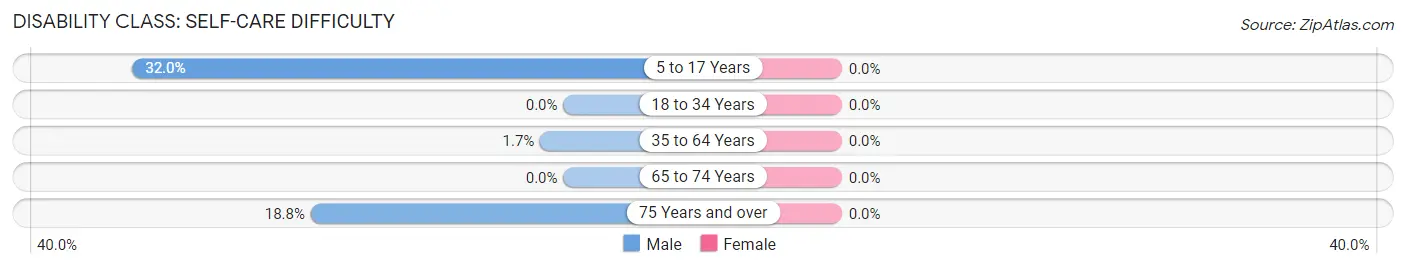
| Age Bracket | Male | Female |
| 5 to 17 Years | 8 (32.0%) | 0 (0.0%) |
| 18 to 34 Years | 0 (0.0%) | 0 (0.0%) |
| 35 to 64 Years | 1 (1.7%) | 0 (0.0%) |
| 65 to 74 Years | 0 (0.0%) | 0 (0.0%) |
| 75 Years and over | 3 (18.8%) | 0 (0.0%) |
Technology Access in Akeley
Computing Device Access in Akeley
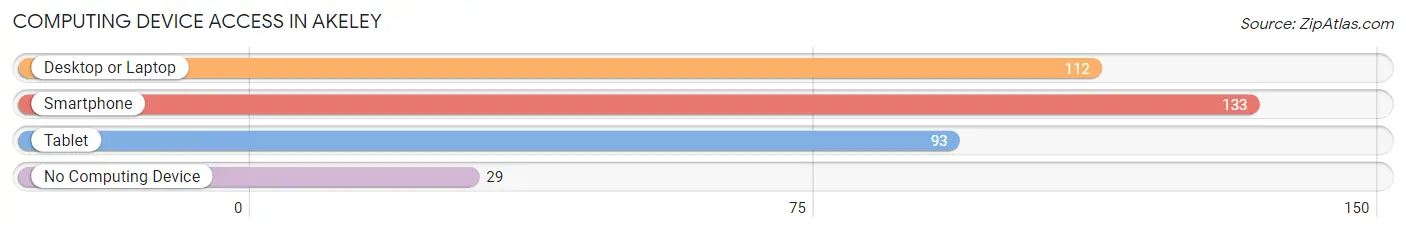
| Device Type | # Households | % Households |
| Desktop or Laptop | 112 | 65.5% |
| Smartphone | 133 | 77.8% |
| Tablet | 93 | 54.4% |
| No Computing Device | 29 | 17.0% |
| Total | 171 | 100.0% |
Internet Access in Akeley
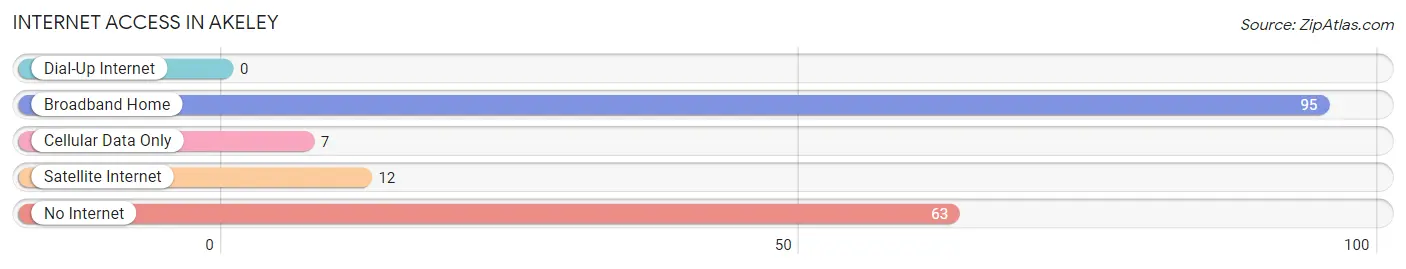
| Internet Type | # Households | % Households |
| Dial-Up Internet | 0 | 0.0% |
| Broadband Home | 95 | 55.6% |
| Cellular Data Only | 7 | 4.1% |
| Satellite Internet | 12 | 7.0% |
| No Internet | 63 | 36.8% |
| Total | 171 | 100.0% |
Akeley Summary
Akeley is a small city located in Hubbard County, Minnesota. It is situated on the south shore of Big Sand Lake, and is part of the Park Rapids Micropolitan Statistical Area. The city has a population of approximately 500 people, and is known for its small-town charm and outdoor recreation opportunities.
Geography
Akeley is located in the northern part of Minnesota, in Hubbard County. It is situated on the south shore of Big Sand Lake, and is part of the Park Rapids Micropolitan Statistical Area. The city is surrounded by forests and lakes, and is located near the headwaters of the Mississippi River. The terrain is mostly flat, with some rolling hills. The climate is humid continental, with cold winters and warm summers.
History
Akeley was founded in 1883 by a group of settlers from Wisconsin. The city was named after a local settler, John Akeley, who was a prominent figure in the area. The city was incorporated in 1887, and the first post office was established in 1888.
In the early 1900s, Akeley was a thriving logging and farming community. The city was home to several sawmills, and the lumber industry was the main source of income for many of the residents. The city also had a thriving agricultural industry, with many farmers growing potatoes, corn, and other crops.
In the 1950s, the city began to experience a decline in population as many of the residents moved away in search of better economic opportunities. However, in recent years, the city has seen a resurgence in population as people have moved back to the area to take advantage of the outdoor recreation opportunities.
Economy
The economy of Akeley is largely based on tourism and outdoor recreation. The city is home to several resorts and campgrounds, and is a popular destination for fishing, hunting, and other outdoor activities. The city also has a thriving retail sector, with several stores and restaurants located in the downtown area.
The city is also home to several manufacturing companies, including a furniture factory and a woodworking shop. The city is also home to a number of small businesses, including a bakery, a hardware store, and a grocery store.
Demographics
As of the 2010 census, the population of Akeley was 498 people. The racial makeup of the city was 97.2% White, 0.2% African American, 0.4% Native American, 0.2% Asian, 0.2% from other races, and 1.9% from two or more races. Hispanic or Latino of any race were 0.8% of the population.
The median income for a household in the city was $37,500, and the median income for a family was $45,000. The per capita income for the city was $19,845. About 11.2% of families and 14.2% of the population were below the poverty line, including 18.2% of those under age 18 and 8.3% of those age 65 or over.
Conclusion
Akeley is a small city located in Hubbard County, Minnesota. It is situated on the south shore of Big Sand Lake, and is part of the Park Rapids Micropolitan Statistical Area. The city has a population of approximately 500 people, and is known for its small-town charm and outdoor recreation opportunities. The economy of Akeley is largely based on tourism and outdoor recreation, and the city is home to several resorts and campgrounds. The racial makeup of the city is mostly White, with a small percentage of African American, Native American, and Asian residents. The median income for a household in the city is $37,500, and the per capita income is $19,845.
Common Questions
What is the Total Population of Akeley?
Total Population of Akeley is 363.
What is the Total Male Population of Akeley?
Total Male Population of Akeley is 171.
What is the Total Female Population of Akeley?
Total Female Population of Akeley is 192.
What is the Ratio of Males per 100 Females in Akeley?
There are 89.06 Males per 100 Females in Akeley.
What is the Ratio of Females per 100 Males in Akeley?
There are 112.28 Females per 100 Males in Akeley.
What is the Median Population Age in Akeley?
Median Population Age in Akeley is 44.5 Years.
What is the Average Family Size in Akeley
Average Family Size in Akeley is 3.0 People.
What is the Average Household Size in Akeley
Average Household Size in Akeley is 2.1 People.
What is Per Capita Income in Akeley?
Per Capita income in Akeley is $25,044.
What is the Median Family Income in Akeley?
Median Family Income in Akeley is $55,313.
What is the Median Household income in Akeley?
Median Household Income in Akeley is $47,083.
What is Income or Wage Gap in Akeley?
Income or Wage Gap in Akeley is 36.1%.
Women in Akeley earn 63.9 cents for every dollar earned by a man.
What is Inequality or Gini Index in Akeley?
Inequality or Gini Index in Akeley is 0.40.
How Large is the Labor Force in Akeley?
There are 126 People in the Labor Forcein in Akeley.
What is the Percentage of People in the Labor Force in Akeley?
45.5% of People are in the Labor Force in Akeley.
What is the Unemployment Rate in Akeley?
Unemployment Rate in Akeley is 5.6%.