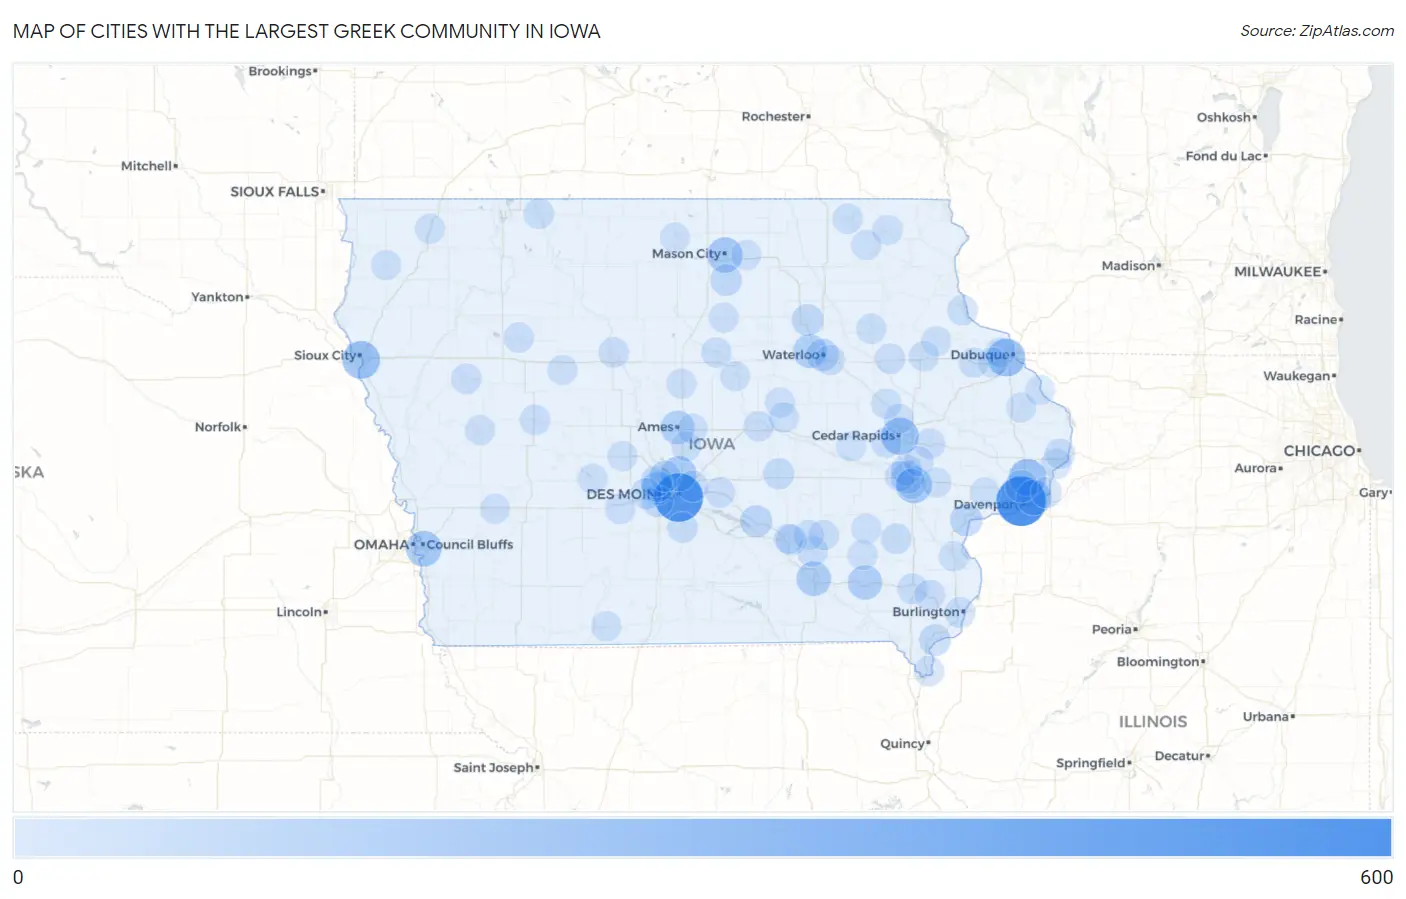
Cities with the Largest Greek Community in Iowa
RELATED REPORTS & OPTIONS
Greek
Iowa
Compare Cities
Map of Cities with the Largest Greek Community in Iowa
0
600
Cities with the Largest Greek Community in Iowa
| City | Greek | vs State | vs National | |
| 1. | Davenport | 560 | 5,736(9.76%)#1 | 1,230,319(0.05%)#266 |
| 2. | Des Moines | 529 | 5,736(9.22%)#2 | 1,230,319(0.04%)#289 |
| 3. | Dubuque | 223 | 5,736(3.89%)#3 | 1,230,319(0.02%)#932 |
| 4. | Sioux City | 214 | 5,736(3.73%)#4 | 1,230,319(0.02%)#981 |
| 5. | Cedar Rapids | 204 | 5,736(3.56%)#5 | 1,230,319(0.02%)#1,033 |
| 6. | Park View | 201 | 5,736(3.50%)#6 | 1,230,319(0.02%)#1,057 |
| 7. | Iowa City | 173 | 5,736(3.02%)#7 | 1,230,319(0.01%)#1,218 |
| 8. | Council Bluffs | 157 | 5,736(2.74%)#8 | 1,230,319(0.01%)#1,347 |
| 9. | Mason City | 150 | 5,736(2.62%)#9 | 1,230,319(0.01%)#1,408 |
| 10. | Bettendorf | 148 | 5,736(2.58%)#10 | 1,230,319(0.01%)#1,429 |
| 11. | Ankeny | 145 | 5,736(2.53%)#11 | 1,230,319(0.01%)#1,462 |
| 12. | Ottumwa | 128 | 5,736(2.23%)#12 | 1,230,319(0.01%)#1,625 |
| 13. | Fairfield | 117 | 5,736(2.04%)#13 | 1,230,319(0.01%)#1,755 |
| 14. | Cedar Falls | 108 | 5,736(1.88%)#14 | 1,230,319(0.01%)#1,879 |
| 15. | Ames | 105 | 5,736(1.83%)#15 | 1,230,319(0.01%)#1,909 |
| 16. | Coralville | 73 | 5,736(1.27%)#16 | 1,230,319(0.01%)#2,482 |
| 17. | Eldridge | 70 | 5,736(1.22%)#17 | 1,230,319(0.01%)#2,585 |
| 18. | Muscatine | 68 | 5,736(1.19%)#18 | 1,230,319(0.01%)#2,628 |
| 19. | Waterloo | 65 | 5,736(1.13%)#19 | 1,230,319(0.01%)#2,702 |
| 20. | Pella | 58 | 5,736(1.01%)#20 | 1,230,319(0.00%)#2,941 |
| 21. | Clive | 54 | 5,736(0.94%)#21 | 1,230,319(0.00%)#3,069 |
| 22. | Waverly | 49 | 5,736(0.85%)#22 | 1,230,319(0.00%)#3,251 |
| 23. | West Des Moines | 47 | 5,736(0.82%)#23 | 1,230,319(0.00%)#3,307 |
| 24. | Fort Madison | 47 | 5,736(0.82%)#24 | 1,230,319(0.00%)#3,324 |
| 25. | Rockwell | 47 | 5,736(0.82%)#25 | 1,230,319(0.00%)#3,342 |
| 26. | Urbandale | 41 | 5,736(0.71%)#26 | 1,230,319(0.00%)#3,551 |
| 27. | Grimes | 39 | 5,736(0.68%)#27 | 1,230,319(0.00%)#3,647 |
| 28. | Johnston | 36 | 5,736(0.63%)#28 | 1,230,319(0.00%)#3,793 |
| 29. | Waukee | 35 | 5,736(0.61%)#29 | 1,230,319(0.00%)#3,841 |
| 30. | Altoona | 35 | 5,736(0.61%)#30 | 1,230,319(0.00%)#3,845 |
| 31. | Grinnell | 31 | 5,736(0.54%)#31 | 1,230,319(0.00%)#4,097 |
| 32. | Fremont | 24 | 5,736(0.42%)#32 | 1,230,319(0.00%)#4,646 |
| 33. | Le Claire | 23 | 5,736(0.40%)#33 | 1,230,319(0.00%)#4,693 |
| 34. | University Park | 22 | 5,736(0.38%)#34 | 1,230,319(0.00%)#4,829 |
| 35. | North Liberty | 21 | 5,736(0.37%)#35 | 1,230,319(0.00%)#4,838 |
| 36. | Indianola | 21 | 5,736(0.37%)#36 | 1,230,319(0.00%)#4,842 |
| 37. | Burlington | 19 | 5,736(0.33%)#37 | 1,230,319(0.00%)#5,041 |
| 38. | Washington | 19 | 5,736(0.33%)#38 | 1,230,319(0.00%)#5,076 |
| 39. | Mount Pleasant | 18 | 5,736(0.31%)#39 | 1,230,319(0.00%)#5,183 |
| 40. | Carroll | 17 | 5,736(0.30%)#40 | 1,230,319(0.00%)#5,288 |
| 41. | Keokuk | 17 | 5,736(0.30%)#41 | 1,230,319(0.00%)#5,291 |
| 42. | Ida Grove | 16 | 5,736(0.28%)#42 | 1,230,319(0.00%)#5,499 |
| 43. | Guttenberg | 16 | 5,736(0.28%)#43 | 1,230,319(0.00%)#5,506 |
| 44. | Earlham | 16 | 5,736(0.28%)#44 | 1,230,319(0.00%)#5,512 |
| 45. | Fort Dodge | 15 | 5,736(0.26%)#45 | 1,230,319(0.00%)#5,548 |
| 46. | Camanche | 15 | 5,736(0.26%)#46 | 1,230,319(0.00%)#5,605 |
| 47. | Fairfax | 15 | 5,736(0.26%)#47 | 1,230,319(0.00%)#5,631 |
| 48. | Tiffin | 14 | 5,736(0.24%)#48 | 1,230,319(0.00%)#5,733 |
| 49. | Evansdale | 13 | 5,736(0.23%)#49 | 1,230,319(0.00%)#5,887 |
| 50. | New London | 13 | 5,736(0.23%)#50 | 1,230,319(0.00%)#5,922 |
| 51. | Winthrop | 13 | 5,736(0.23%)#51 | 1,230,319(0.00%)#5,949 |
| 52. | Marshalltown | 12 | 5,736(0.21%)#52 | 1,230,319(0.00%)#5,973 |
| 53. | Iowa Falls | 12 | 5,736(0.21%)#53 | 1,230,319(0.00%)#6,026 |
| 54. | Lisbon | 12 | 5,736(0.21%)#54 | 1,230,319(0.00%)#6,068 |
| 55. | Downey | 12 | 5,736(0.21%)#55 | 1,230,319(0.00%)#6,114 |
| 56. | Clinton | 11 | 5,736(0.19%)#56 | 1,230,319(0.00%)#6,127 |
| 57. | Estherville | 11 | 5,736(0.19%)#57 | 1,230,319(0.00%)#6,170 |
| 58. | Newell | 11 | 5,736(0.19%)#58 | 1,230,319(0.00%)#6,286 |
| 59. | Manchester | 10 | 5,736(0.17%)#59 | 1,230,319(0.00%)#6,376 |
| 60. | Cresco | 10 | 5,736(0.17%)#60 | 1,230,319(0.00%)#6,387 |
| 61. | Center Point | 10 | 5,736(0.17%)#61 | 1,230,319(0.00%)#6,410 |
| 62. | Farley | 10 | 5,736(0.17%)#62 | 1,230,319(0.00%)#6,428 |
| 63. | Prairie City | 10 | 5,736(0.17%)#63 | 1,230,319(0.00%)#6,429 |
| 64. | Delta | 10 | 5,736(0.17%)#64 | 1,230,319(0.00%)#6,487 |
| 65. | Oelwein | 9 | 5,736(0.16%)#65 | 1,230,319(0.00%)#6,553 |
| 66. | Rose Hill | 9 | 5,736(0.16%)#66 | 1,230,319(0.00%)#6,699 |
| 67. | Denison | 7 | 5,736(0.12%)#67 | 1,230,319(0.00%)#6,973 |
| 68. | Perry | 7 | 5,736(0.12%)#68 | 1,230,319(0.00%)#6,975 |
| 69. | Decorah | 7 | 5,736(0.12%)#69 | 1,230,319(0.00%)#6,976 |
| 70. | Nevada | 7 | 5,736(0.12%)#70 | 1,230,319(0.00%)#6,980 |
| 71. | Solon | 7 | 5,736(0.12%)#71 | 1,230,319(0.00%)#7,030 |
| 72. | Panora | 7 | 5,736(0.12%)#72 | 1,230,319(0.00%)#7,082 |
| 73. | Keota | 7 | 5,736(0.12%)#73 | 1,230,319(0.00%)#7,120 |
| 74. | Hampton | 6 | 5,736(0.10%)#74 | 1,230,319(0.00%)#7,209 |
| 75. | Robins | 6 | 5,736(0.10%)#75 | 1,230,319(0.00%)#7,217 |
| 76. | Durant | 6 | 5,736(0.10%)#76 | 1,230,319(0.00%)#7,274 |
| 77. | Mount Ayr | 6 | 5,736(0.10%)#77 | 1,230,319(0.00%)#7,279 |
| 78. | Gladbrook | 6 | 5,736(0.10%)#78 | 1,230,319(0.00%)#7,344 |
| 79. | Cambridge | 6 | 5,736(0.10%)#79 | 1,230,319(0.00%)#7,350 |
| 80. | Garwin | 6 | 5,736(0.10%)#80 | 1,230,319(0.00%)#7,373 |
| 81. | Ellsworth | 6 | 5,736(0.10%)#81 | 1,230,319(0.00%)#7,382 |
| 82. | Ashton | 6 | 5,736(0.10%)#82 | 1,230,319(0.00%)#7,383 |
| 83. | Richland | 6 | 5,736(0.10%)#83 | 1,230,319(0.00%)#7,386 |
| 84. | Oskaloosa | 5 | 5,736(0.09%)#84 | 1,230,319(0.00%)#7,440 |
| 85. | Asbury | 5 | 5,736(0.09%)#85 | 1,230,319(0.00%)#7,460 |
| 86. | Forest City | 5 | 5,736(0.09%)#86 | 1,230,319(0.00%)#7,470 |
| 87. | Eldora | 5 | 5,736(0.09%)#87 | 1,230,319(0.00%)#7,507 |
| 88. | West Branch | 5 | 5,736(0.09%)#88 | 1,230,319(0.00%)#7,517 |
| 89. | Bellevue | 5 | 5,736(0.09%)#89 | 1,230,319(0.00%)#7,538 |
| 90. | Peosta | 5 | 5,736(0.09%)#90 | 1,230,319(0.00%)#7,556 |
| 91. | University Heights | 5 | 5,736(0.09%)#91 | 1,230,319(0.00%)#7,582 |
| 92. | Walnut | 5 | 5,736(0.09%)#92 | 1,230,319(0.00%)#7,618 |
| 93. | Blairstown | 5 | 5,736(0.09%)#93 | 1,230,319(0.00%)#7,635 |
| 94. | Andrew | 5 | 5,736(0.09%)#94 | 1,230,319(0.00%)#7,661 |
| 95. | Spillville | 5 | 5,736(0.09%)#95 | 1,230,319(0.00%)#7,669 |
| 96. | Sioux Center | 4 | 5,736(0.07%)#96 | 1,230,319(0.00%)#7,711 |
| 97. | Rockwell City | 4 | 5,736(0.07%)#97 | 1,230,319(0.00%)#7,775 |
| 98. | Wapello | 4 | 5,736(0.07%)#98 | 1,230,319(0.00%)#7,799 |
| 99. | Nora Springs | 4 | 5,736(0.07%)#99 | 1,230,319(0.00%)#7,841 |
| 100. | Greeley | 4 | 5,736(0.07%)#100 | 1,230,319(0.00%)#7,944 |
Common Questions
What are the Top 10 Cities with the Largest Greek Community in Iowa?
Top 10 Cities with the Largest Greek Community in Iowa are:
#1
560
#2
529
#3
223
#4
214
#5
204
#6
201
#7
173
#8
157
#9
150
#10
148
What city has the Largest Greek Community in Iowa?
Davenport has the Largest Greek Community in Iowa with 560.
What is the Total Greek Population in the State of Iowa?
Total Greek Population in Iowa is 5,736.
What is the Total Greek Population in the United States?
Total Greek Population in the United States is 1,230,319.