Waukee, IA
Waukee Map
Waukee Overview
25,045
TOTAL POPULATION
12,385
MALE POPULATION
12,660
FEMALE POPULATION
97.83
MALES / 100 FEMALES
102.22
FEMALES / 100 MALES
34.3
MEDIAN AGE
3.1
AVG FAMILY SIZE
2.5
AVG HOUSEHOLD SIZE
$51,536
PER CAPITA INCOME
$146,357
AVG FAMILY INCOME
$106,846
AVG HOUSEHOLD INCOME
31.1%
WAGE / INCOME GAP [ % ]
68.9¢/ $1
WAGE / INCOME GAP [ $ ]
$10,117
FAMILY INCOME DEFICIT
0.42
INEQUALITY / GINI INDEX
14,559
LABOR FORCE [ PEOPLE ]
79.4%
PERCENT IN LABOR FORCE
3.1%
UNEMPLOYMENT RATE
Waukee Zip Codes
Waukee Area Codes
Race in Waukee
The most populous races in Waukee are White / Caucasian (20,881 | 83.4%), Asian (1,626 | 6.5%), and Two or more Races (1,381 | 5.5%).
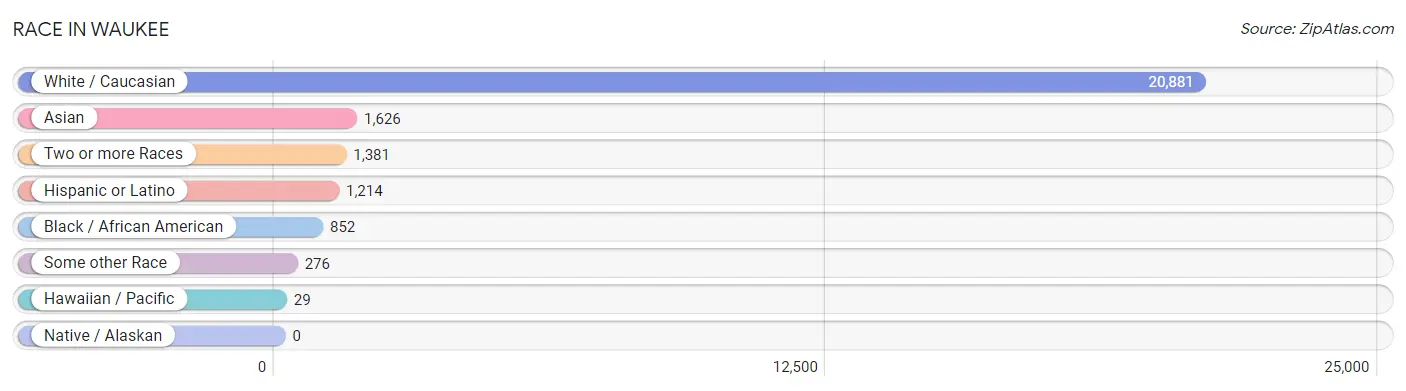
| Race | # Population | % Population |
| Asian | 1,626 | 6.5% |
| Black / African American | 852 | 3.4% |
| Hawaiian / Pacific | 29 | 0.1% |
| Hispanic or Latino | 1,214 | 4.9% |
| Native / Alaskan | 0 | 0.0% |
| White / Caucasian | 20,881 | 83.4% |
| Two or more Races | 1,381 | 5.5% |
| Some other Race | 276 | 1.1% |
| Total | 25,045 | 100.0% |
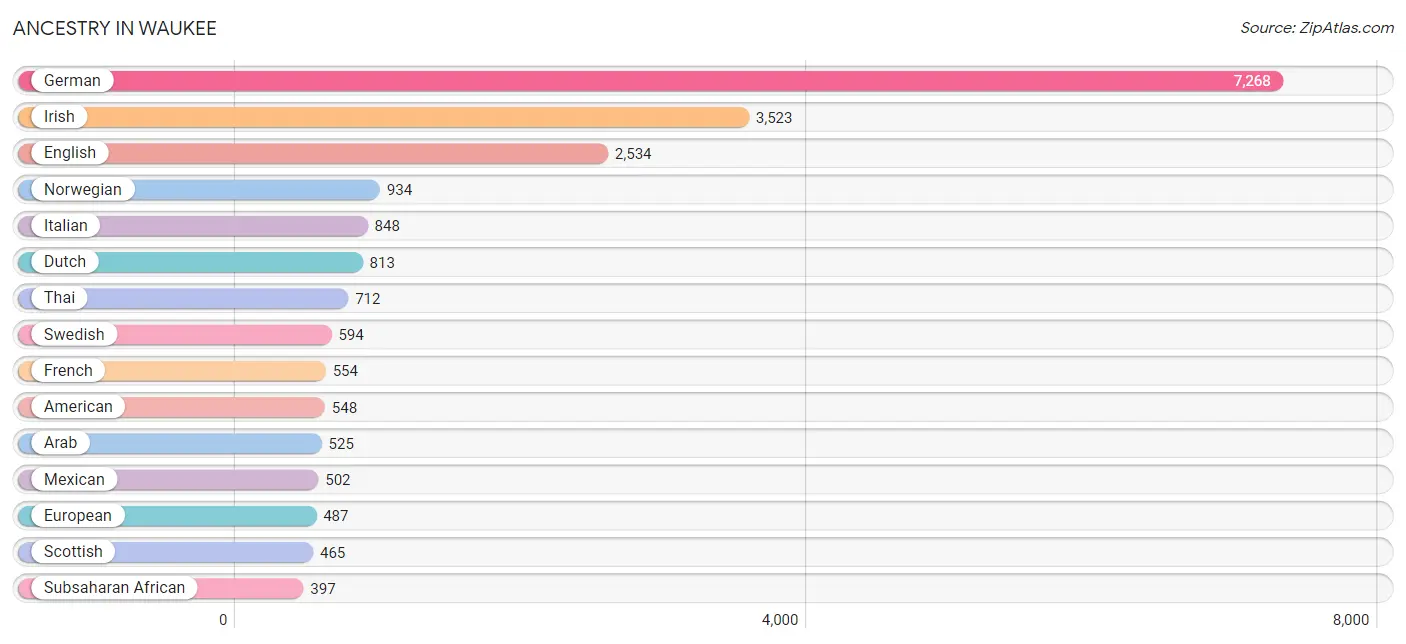
Ancestry in Waukee
The most populous ancestries reported in Waukee are German (7,268 | 29.0%), Irish (3,523 | 14.1%), English (2,534 | 10.1%), Norwegian (934 | 3.7%), and Italian (848 | 3.4%), together accounting for 60.3% of all Waukee residents.
| Ancestry | # Population | % Population |
| African | 270 | 1.1% |
| American | 548 | 2.2% |
| Arab | 525 | 2.1% |
| Austrian | 101 | 0.4% |
| Belgian | 15 | 0.1% |
| Brazilian | 3 | 0.0% |
| British | 219 | 0.9% |
| Burmese | 155 | 0.6% |
| Central American | 265 | 1.1% |
| Cherokee | 121 | 0.5% |
| Colombian | 134 | 0.5% |
| Croatian | 19 | 0.1% |
| Czech | 153 | 0.6% |
| Czechoslovakian | 81 | 0.3% |
| Danish | 348 | 1.4% |
| Dominican | 11 | 0.0% |
| Dutch | 813 | 3.3% |
| Eastern European | 5 | 0.0% |
| Egyptian | 53 | 0.2% |
| English | 2,534 | 10.1% |
| European | 487 | 1.9% |
| Finnish | 94 | 0.4% |
| French | 554 | 2.2% |
| French Canadian | 33 | 0.1% |
| German | 7,268 | 29.0% |
| Greek | 35 | 0.1% |
| Guatemalan | 88 | 0.4% |
| Hungarian | 57 | 0.2% |
| Indian (Asian) | 147 | 0.6% |
| Irish | 3,523 | 14.1% |
| Italian | 848 | 3.4% |
| Kenyan | 40 | 0.2% |
| Korean | 190 | 0.8% |
| Luxembourger | 32 | 0.1% |
| Malaysian | 190 | 0.8% |
| Mexican | 502 | 2.0% |
| Mongolian | 36 | 0.1% |
| Native Hawaiian | 10 | 0.0% |
| Nicaraguan | 177 | 0.7% |
| Nigerian | 32 | 0.1% |
| Northern European | 48 | 0.2% |
| Norwegian | 934 | 3.7% |
| Pakistani | 8 | 0.0% |
| Peruvian | 107 | 0.4% |
| Polish | 237 | 0.9% |
| Puerto Rican | 153 | 0.6% |
| Romanian | 20 | 0.1% |
| Russian | 65 | 0.3% |
| Scandinavian | 203 | 0.8% |
| Scotch-Irish | 118 | 0.5% |
| Scottish | 465 | 1.9% |
| Slavic | 154 | 0.6% |
| Slovak | 38 | 0.2% |
| Slovene | 151 | 0.6% |
| South American | 241 | 1.0% |
| Sri Lankan | 100 | 0.4% |
| Subsaharan African | 397 | 1.6% |
| Swedish | 594 | 2.4% |
| Swiss | 204 | 0.8% |
| Thai | 712 | 2.8% |
| Turkish | 20 | 0.1% |
| Ugandan | 55 | 0.2% |
| Ukrainian | 15 | 0.1% |
| Welsh | 30 | 0.1% |
| Yugoslavian | 145 | 0.6% | View All 65 Rows |
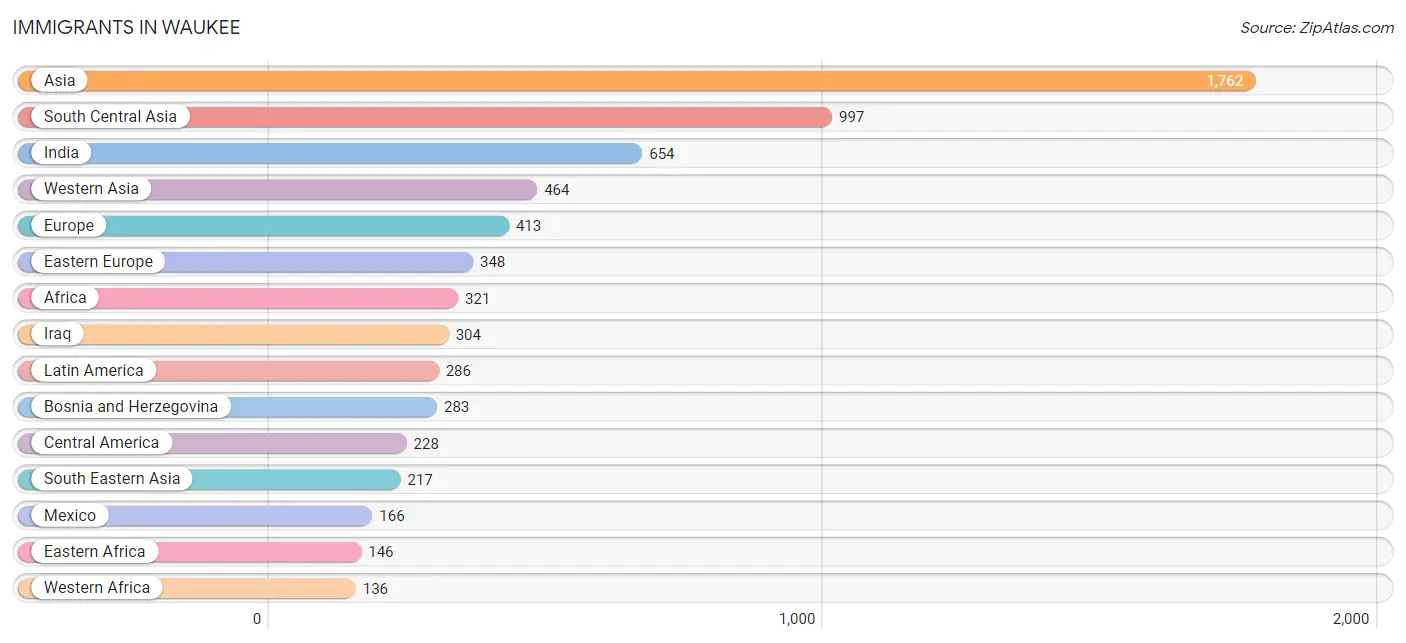
Immigrants in Waukee
The most numerous immigrant groups reported in Waukee came from Asia (1,762 | 7.0%), South Central Asia (997 | 4.0%), India (654 | 2.6%), Western Asia (464 | 1.8%), and Europe (413 | 1.7%), together accounting for 17.1% of all Waukee residents.
| Immigration Origin | # Population | % Population |
| Africa | 321 | 1.3% |
| Asia | 1,762 | 7.0% |
| Australia | 17 | 0.1% |
| Austria | 19 | 0.1% |
| Bosnia and Herzegovina | 283 | 1.1% |
| Canada | 35 | 0.1% |
| Caribbean | 11 | 0.0% |
| Central America | 228 | 0.9% |
| China | 27 | 0.1% |
| Colombia | 47 | 0.2% |
| Croatia | 25 | 0.1% |
| Dominican Republic | 11 | 0.0% |
| Eastern Africa | 146 | 0.6% |
| Eastern Asia | 84 | 0.3% |
| Eastern Europe | 348 | 1.4% |
| Egypt | 39 | 0.2% |
| Europe | 413 | 1.7% |
| Germany | 46 | 0.2% |
| India | 654 | 2.6% |
| Iraq | 304 | 1.2% |
| Jordan | 78 | 0.3% |
| Kenya | 114 | 0.5% |
| Korea | 57 | 0.2% |
| Kuwait | 40 | 0.2% |
| Laos | 86 | 0.3% |
| Latin America | 286 | 1.1% |
| Malaysia | 14 | 0.1% |
| Mexico | 166 | 0.7% |
| Nepal | 121 | 0.5% |
| Nicaragua | 62 | 0.3% |
| Nigeria | 67 | 0.3% |
| Northern Africa | 39 | 0.2% |
| Oceania | 17 | 0.1% |
| Philippines | 80 | 0.3% |
| Romania | 20 | 0.1% |
| Russia | 20 | 0.1% |
| Sierra Leone | 35 | 0.1% |
| South America | 47 | 0.2% |
| South Central Asia | 997 | 4.0% |
| South Eastern Asia | 217 | 0.9% |
| Syria | 34 | 0.1% |
| Turkey | 8 | 0.0% |
| Uganda | 32 | 0.1% |
| Vietnam | 37 | 0.2% |
| Western Africa | 136 | 0.5% |
| Western Asia | 464 | 1.8% |
| Western Europe | 65 | 0.3% | View All 47 Rows |
Sex and Age in Waukee
Sex and Age in Waukee
The most populous age groups in Waukee are 35 to 39 Years (1,216 | 9.8%) for men and 35 to 39 Years (1,263 | 10.0%) for women.
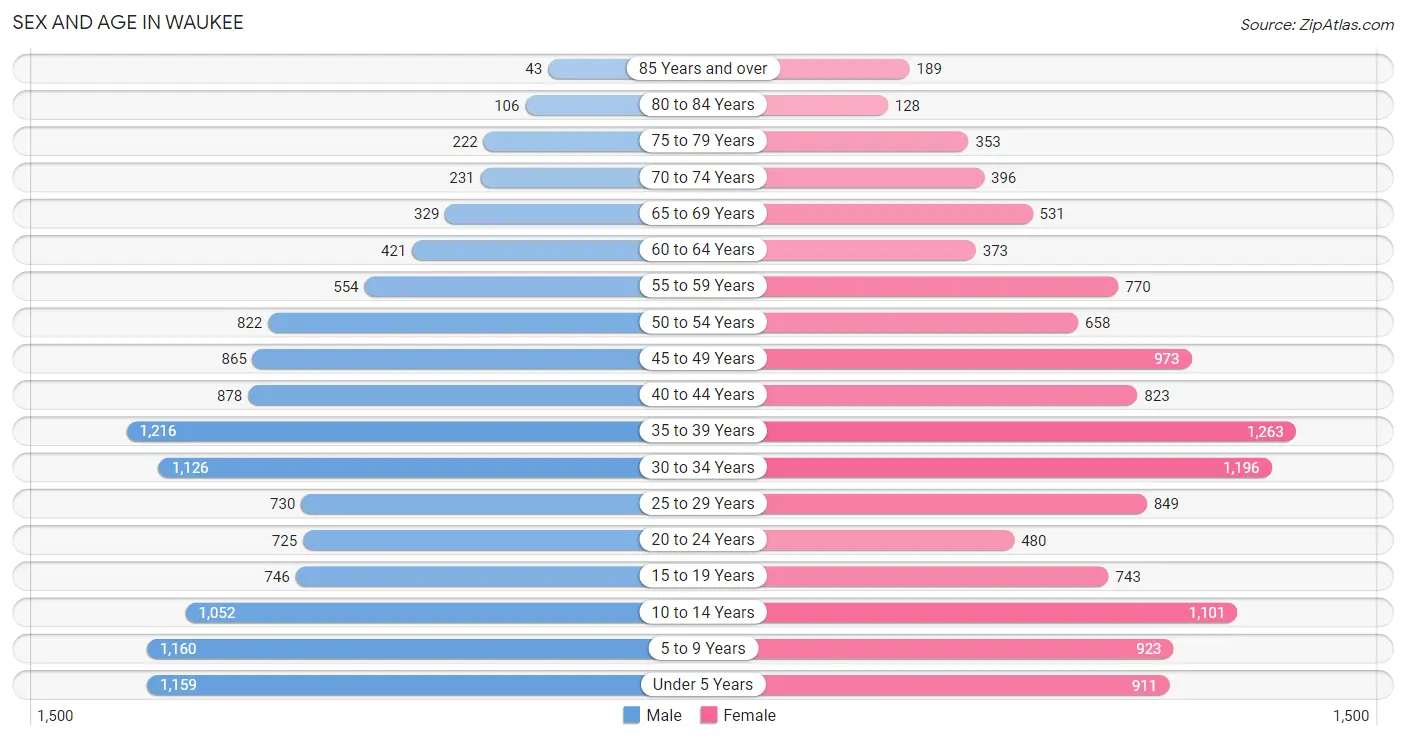
| Age Bracket | Male | Female |
| Under 5 Years | 1,159 (9.4%) | 911 (7.2%) |
| 5 to 9 Years | 1,160 (9.4%) | 923 (7.3%) |
| 10 to 14 Years | 1,052 (8.5%) | 1,101 (8.7%) |
| 15 to 19 Years | 746 (6.0%) | 743 (5.9%) |
| 20 to 24 Years | 725 (5.9%) | 480 (3.8%) |
| 25 to 29 Years | 730 (5.9%) | 849 (6.7%) |
| 30 to 34 Years | 1,126 (9.1%) | 1,196 (9.5%) |
| 35 to 39 Years | 1,216 (9.8%) | 1,263 (10.0%) |
| 40 to 44 Years | 878 (7.1%) | 823 (6.5%) |
| 45 to 49 Years | 865 (7.0%) | 973 (7.7%) |
| 50 to 54 Years | 822 (6.6%) | 658 (5.2%) |
| 55 to 59 Years | 554 (4.5%) | 770 (6.1%) |
| 60 to 64 Years | 421 (3.4%) | 373 (2.9%) |
| 65 to 69 Years | 329 (2.7%) | 531 (4.2%) |
| 70 to 74 Years | 231 (1.9%) | 396 (3.1%) |
| 75 to 79 Years | 222 (1.8%) | 353 (2.8%) |
| 80 to 84 Years | 106 (0.9%) | 128 (1.0%) |
| 85 Years and over | 43 (0.4%) | 189 (1.5%) |
| Total | 12,385 (100.0%) | 12,660 (100.0%) |
Families and Households in Waukee
Median Family Size in Waukee
The median family size in Waukee is 3.12 persons per family, with married-couple families (5,356 | 82.5%) accounting for the largest median family size of 3.23 persons per family. On the other hand, single male/father families (370 | 5.7%) represent the smallest median family size with 2.58 persons per family.
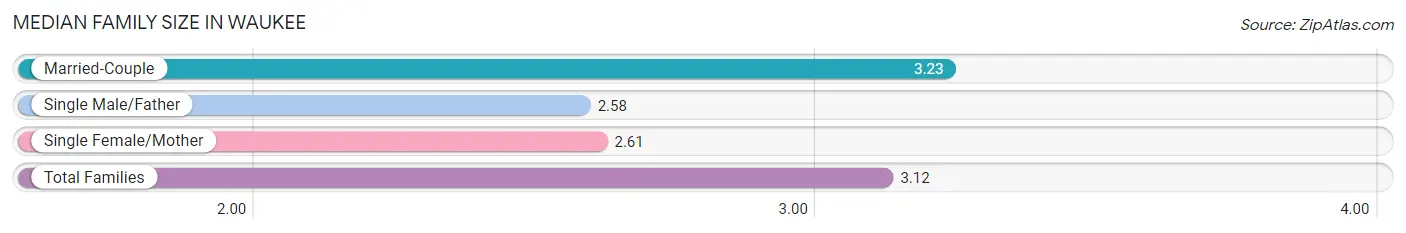
| Family Type | # Families | Family Size |
| Married-Couple | 5,356 (82.5%) | 3.23 |
| Single Male/Father | 370 (5.7%) | 2.58 |
| Single Female/Mother | 765 (11.8%) | 2.61 |
| Total Families | 6,491 (100.0%) | 3.12 |
Median Household Size in Waukee
The median household size in Waukee is 2.52 persons per household, with married-couple households (5,356 | 54.0%) accounting for the largest median household size of 3.24 persons per household. non-family households (3,433 | 34.6%) represent the smallest median household size with 1.28 persons per household.
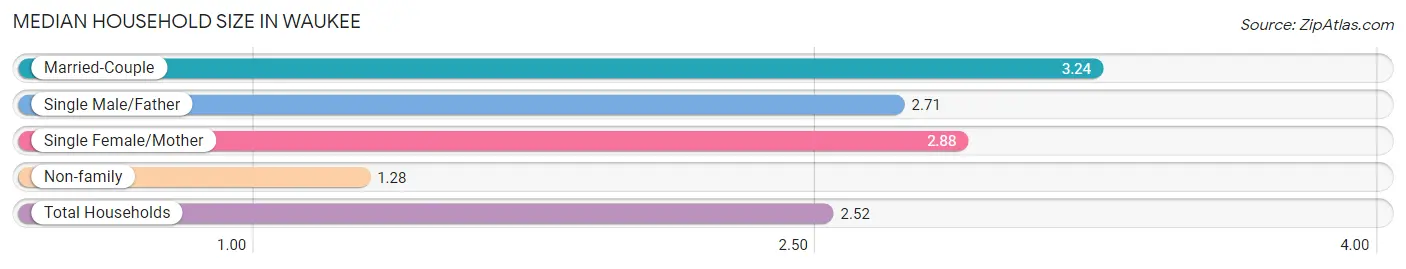
| Household Type | # Households | Household Size |
| Married-Couple | 5,356 (54.0%) | 3.24 |
| Single Male/Father | 370 (3.7%) | 2.71 |
| Single Female/Mother | 765 (7.7%) | 2.88 |
| Non-family | 3,433 (34.6%) | 1.28 |
| Total Households | 9,924 (100.0%) | 2.52 |
Household Size by Marriage Status in Waukee
Out of a total of 9,924 households in Waukee, 6,491 (65.4%) are family households, while 3,433 (34.6%) are nonfamily households. The most numerous type of family households are 2-person households, comprising 2,244, and the most common type of nonfamily households are 1-person households, comprising 2,545.
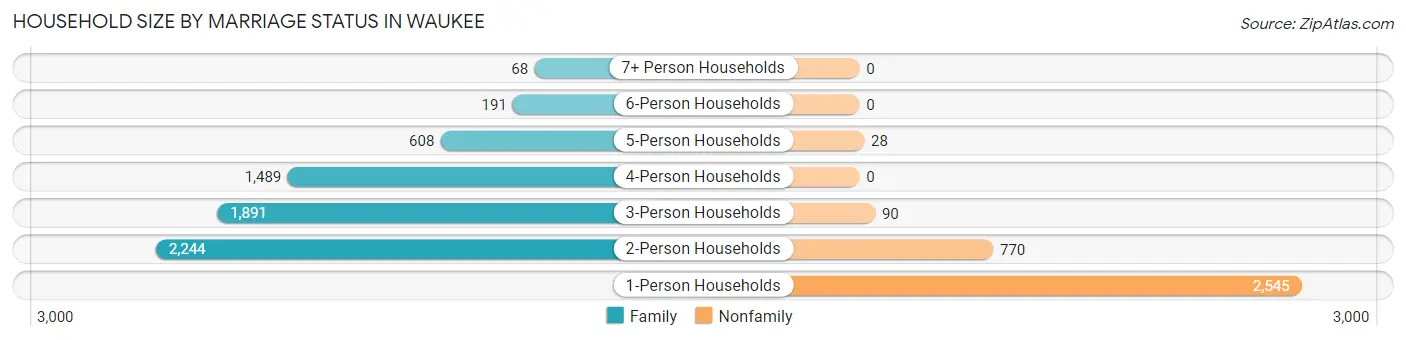
| Household Size | Family Households | Nonfamily Households |
| 1-Person Households | - | 2,545 (25.6%) |
| 2-Person Households | 2,244 (22.6%) | 770 (7.8%) |
| 3-Person Households | 1,891 (19.1%) | 90 (0.9%) |
| 4-Person Households | 1,489 (15.0%) | 0 (0.0%) |
| 5-Person Households | 608 (6.1%) | 28 (0.3%) |
| 6-Person Households | 191 (1.9%) | 0 (0.0%) |
| 7+ Person Households | 68 (0.7%) | 0 (0.0%) |
| Total | 6,491 (65.4%) | 3,433 (34.6%) |
Female Fertility in Waukee
Fertility by Age in Waukee
Average fertility rate in Waukee is 74.0 births per 1,000 women. Women in the age bracket of 20 to 34 years have the highest fertility rate with 149.0 births per 1,000 women. Women in the age bracket of 20 to 34 years acount for 78.0% of all women with births.
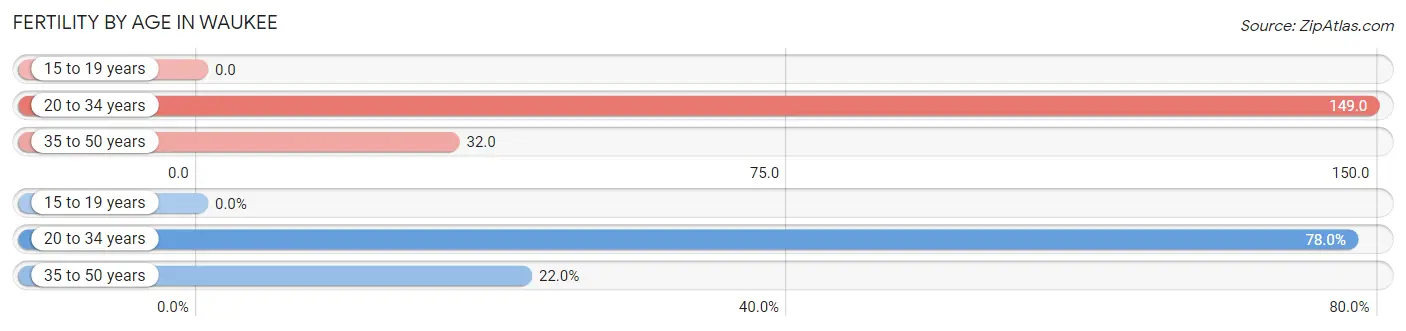
| Age Bracket | Women with Births | Births / 1,000 Women |
| 15 to 19 years | 0 (0.0%) | 0.0 |
| 20 to 34 years | 376 (78.0%) | 149.0 |
| 35 to 50 years | 106 (22.0%) | 32.0 |
| Total | 482 (100.0%) | 74.0 |
Fertility by Age by Marriage Status in Waukee
88.4% of women with births (482) in Waukee are married. The highest percentage of unmarried women with births falls into 20 to 34 years age bracket with 14.9% of them unmarried at the time of birth, while the lowest percentage of unmarried women with births belong to 35 to 50 years age bracket with 0.0% of them unmarried.
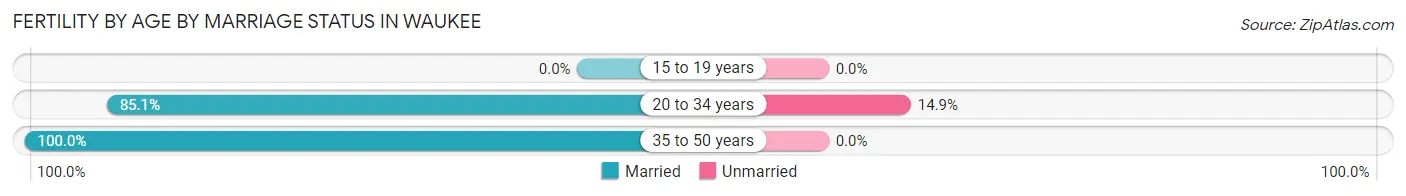
| Age Bracket | Married | Unmarried |
| 15 to 19 years | 0 (0.0%) | 0 (0.0%) |
| 20 to 34 years | 320 (85.1%) | 56 (14.9%) |
| 35 to 50 years | 106 (100.0%) | 0 (0.0%) |
| Total | 426 (88.4%) | 56 (11.6%) |
Fertility by Education in Waukee
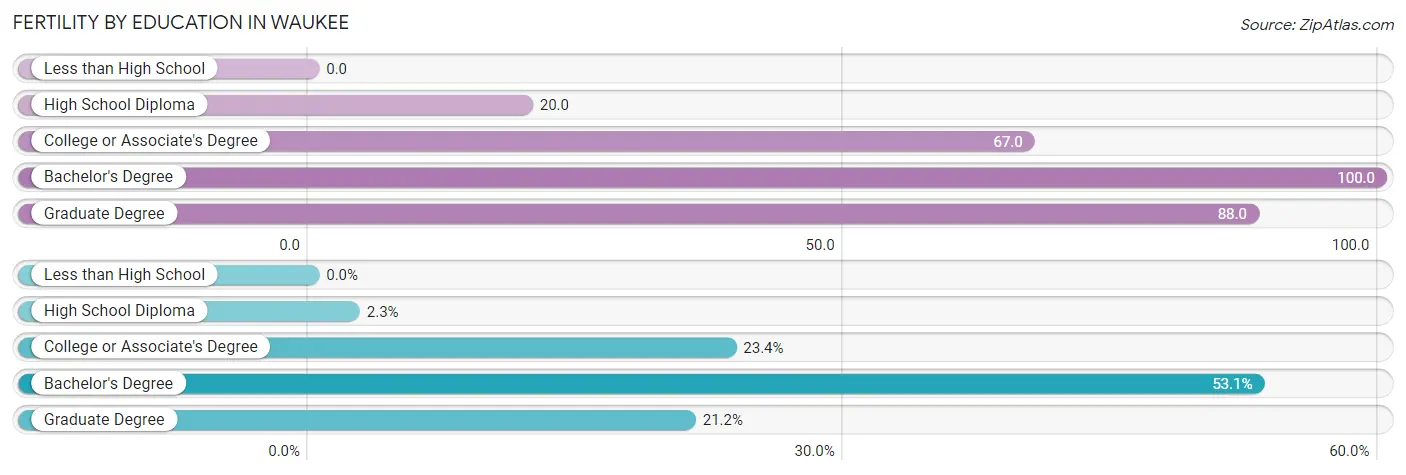
| Educational Attainment | Women with Births | Births / 1,000 Women |
| Less than High School | 0 (0.0%) | 0.0 |
| High School Diploma | 11 (2.3%) | 20.0 |
| College or Associate's Degree | 113 (23.4%) | 67.0 |
| Bachelor's Degree | 256 (53.1%) | 100.0 |
| Graduate Degree | 102 (21.2%) | 88.0 |
| Total | 482 (100.0%) | 74.0 |
Fertility by Education by Marriage Status in Waukee
11.6% of women with births in Waukee are unmarried. Women with the educational attainment of high school diploma are most likely to be married with 100.0% of them married at childbirth, while women with the educational attainment of college or associate's degree are least likely to be married with 28.3% of them unmarried at childbirth.
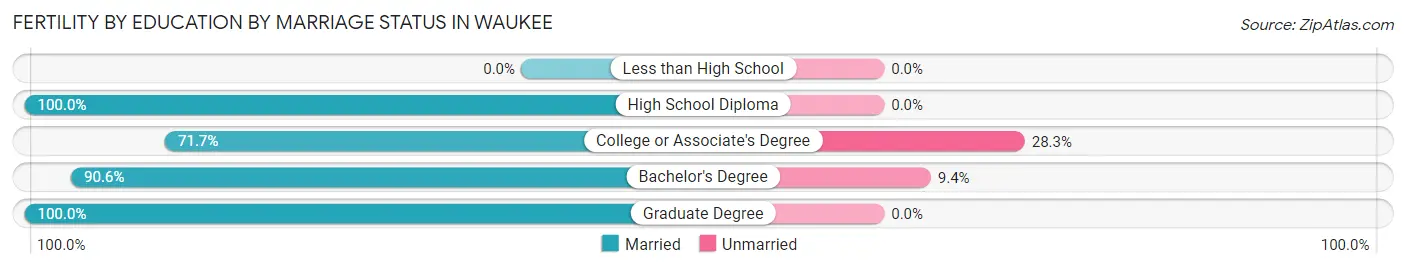
| Educational Attainment | Married | Unmarried |
| Less than High School | 0 (0.0%) | 0 (0.0%) |
| High School Diploma | 11 (100.0%) | 0 (0.0%) |
| College or Associate's Degree | 81 (71.7%) | 32 (28.3%) |
| Bachelor's Degree | 232 (90.6%) | 24 (9.4%) |
| Graduate Degree | 102 (100.0%) | 0 (0.0%) |
| Total | 426 (88.4%) | 56 (11.6%) |
Income in Waukee
Income Overview in Waukee
Per Capita Income in Waukee is $51,536, while median incomes of families and households are $146,357 and $106,846 respectively.
| Characteristic | Number | Measure |
| Per Capita Income | 25,045 | $51,536 |
| Median Family Income | 6,491 | $146,357 |
| Mean Family Income | 6,491 | $162,527 |
| Median Household Income | 9,924 | $106,846 |
| Mean Household Income | 9,924 | $131,058 |
| Income Deficit | 6,491 | $10,117 |
| Wage / Income Gap (%) | 25,045 | 31.07% |
| Wage / Income Gap ($) | 25,045 | 68.93¢ per $1 |
| Gini / Inequality Index | 25,045 | 0.42 |
Earnings by Sex in Waukee
Average Earnings in Waukee are $60,771, $74,423 for men and $51,302 for women, a difference of 31.1%.
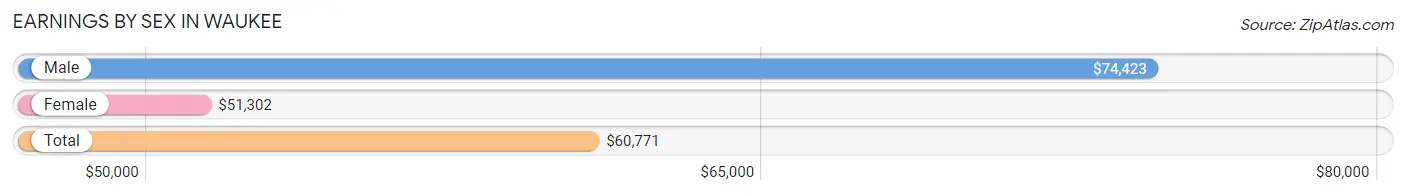
| Sex | Number | Average Earnings |
| Male | 7,743 (52.2%) | $74,423 |
| Female | 7,100 (47.8%) | $51,302 |
| Total | 14,843 (100.0%) | $60,771 |
Earnings by Sex by Income Bracket in Waukee
The most common earnings brackets in Waukee are $100,000+ for men (2,466 | 31.9%) and $100,000+ for women (949 | 13.4%).
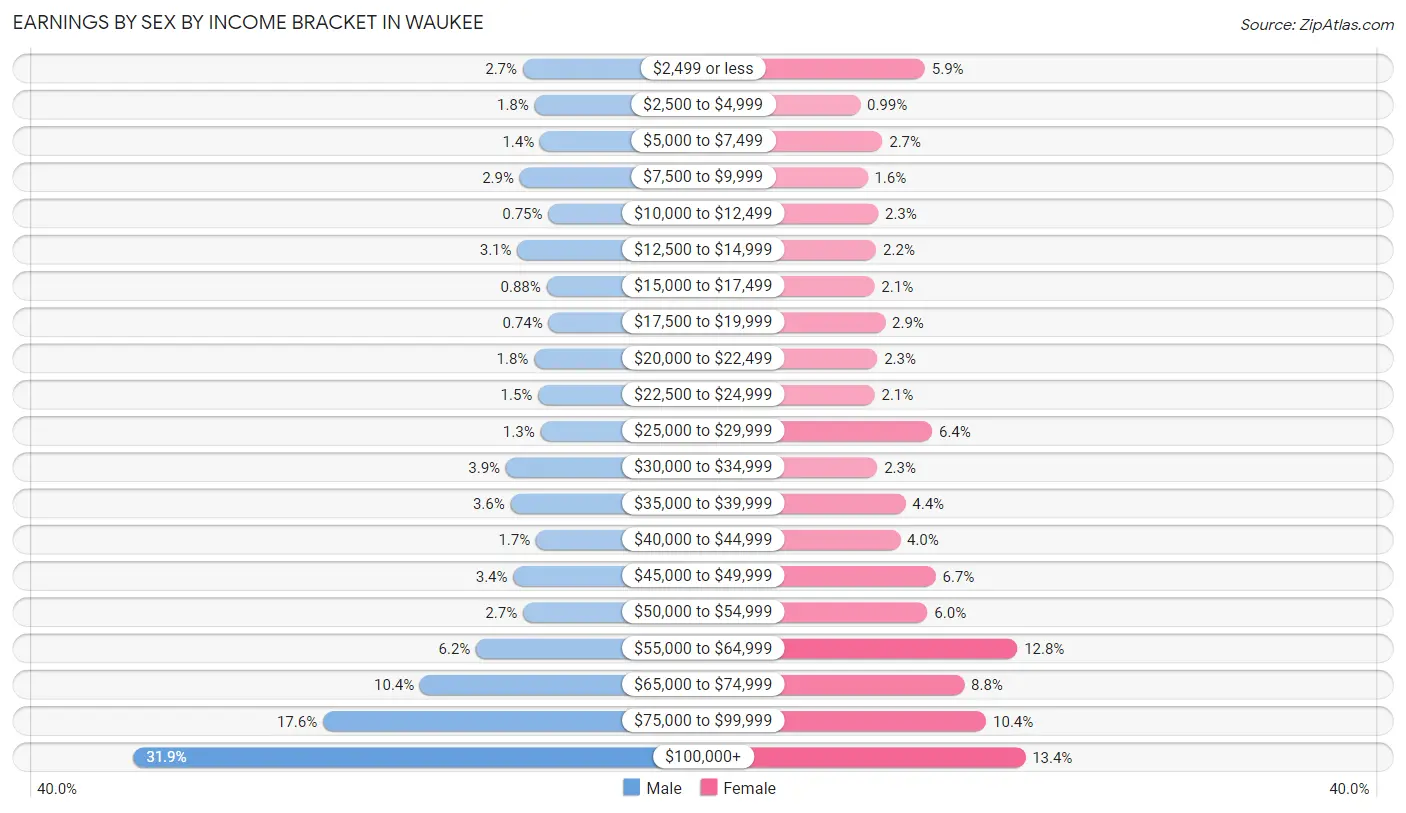
| Income | Male | Female |
| $2,499 or less | 206 (2.7%) | 415 (5.9%) |
| $2,500 to $4,999 | 138 (1.8%) | 70 (1.0%) |
| $5,000 to $7,499 | 106 (1.4%) | 189 (2.7%) |
| $7,500 to $9,999 | 224 (2.9%) | 110 (1.5%) |
| $10,000 to $12,499 | 58 (0.7%) | 166 (2.3%) |
| $12,500 to $14,999 | 238 (3.1%) | 156 (2.2%) |
| $15,000 to $17,499 | 68 (0.9%) | 147 (2.1%) |
| $17,500 to $19,999 | 57 (0.7%) | 204 (2.9%) |
| $20,000 to $22,499 | 140 (1.8%) | 162 (2.3%) |
| $22,500 to $24,999 | 117 (1.5%) | 148 (2.1%) |
| $25,000 to $29,999 | 104 (1.3%) | 454 (6.4%) |
| $30,000 to $34,999 | 304 (3.9%) | 162 (2.3%) |
| $35,000 to $39,999 | 277 (3.6%) | 312 (4.4%) |
| $40,000 to $44,999 | 129 (1.7%) | 283 (4.0%) |
| $45,000 to $49,999 | 261 (3.4%) | 472 (6.7%) |
| $50,000 to $54,999 | 205 (2.6%) | 429 (6.0%) |
| $55,000 to $64,999 | 477 (6.2%) | 907 (12.8%) |
| $65,000 to $74,999 | 802 (10.4%) | 624 (8.8%) |
| $75,000 to $99,999 | 1,366 (17.6%) | 741 (10.4%) |
| $100,000+ | 2,466 (31.9%) | 949 (13.4%) |
| Total | 7,743 (100.0%) | 7,100 (100.0%) |
Earnings by Sex by Educational Attainment in Waukee
Average earnings in Waukee are $83,959 for men and $55,763 for women, a difference of 33.6%. Men with an educational attainment of graduate degree enjoy the highest average annual earnings of $110,789, while those with less than high school education earn the least with $34,955. Women with an educational attainment of graduate degree earn the most with the average annual earnings of $76,429, while those with high school diploma education have the smallest earnings of $35,914.
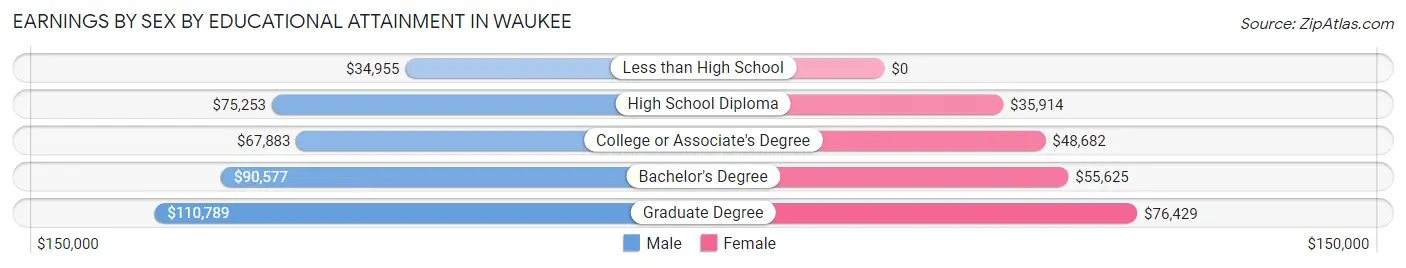
| Educational Attainment | Male Income | Female Income |
| Less than High School | $34,955 | $0 |
| High School Diploma | $75,253 | $35,914 |
| College or Associate's Degree | $67,883 | $48,682 |
| Bachelor's Degree | $90,577 | $55,625 |
| Graduate Degree | $110,789 | $76,429 |
| Total | $83,959 | $55,763 |
Family Income in Waukee
Family Income Brackets in Waukee
According to the Waukee family income data, there are 1,616 families falling into the $150,000 to $199,999 income range, which is the most common income bracket and makes up 24.9% of all families. Conversely, the less than $10,000 income bracket is the least frequent group with only 65 families (1.0%) belonging to this category.
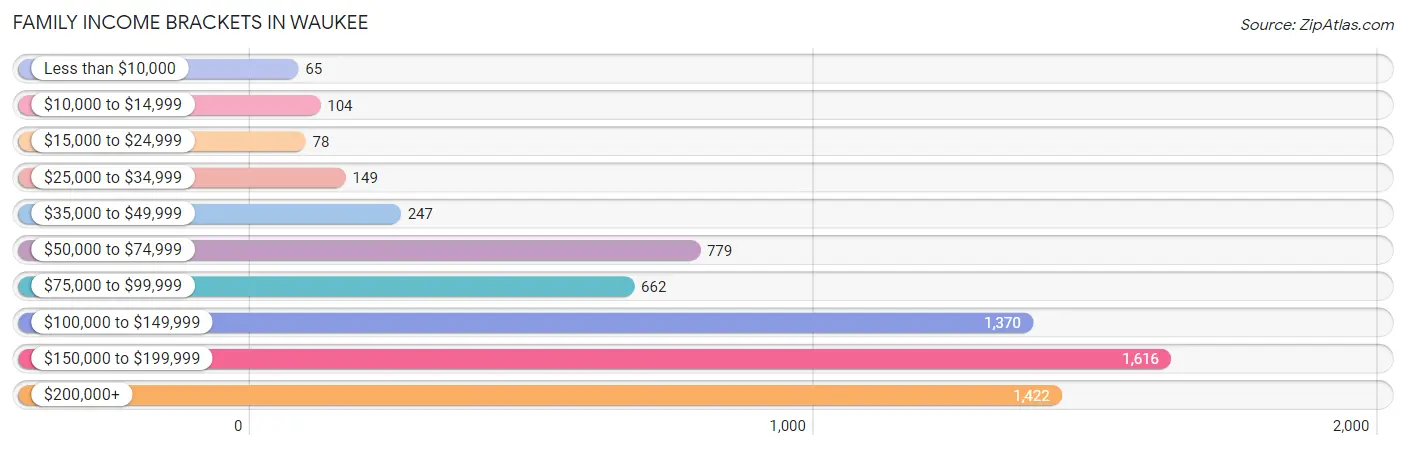
| Income Bracket | # Families | % Families |
| Less than $10,000 | 65 | 1.0% |
| $10,000 to $14,999 | 104 | 1.6% |
| $15,000 to $24,999 | 78 | 1.2% |
| $25,000 to $34,999 | 149 | 2.3% |
| $35,000 to $49,999 | 247 | 3.8% |
| $50,000 to $74,999 | 779 | 12.0% |
| $75,000 to $99,999 | 662 | 10.2% |
| $100,000 to $149,999 | 1,370 | 21.1% |
| $150,000 to $199,999 | 1,616 | 24.9% |
| $200,000+ | 1,422 | 21.9% |
Family Income by Famaliy Size in Waukee
7+ person families (68 | 1.1%) account for the highest median family income in Waukee with $205,750 per family, while 2-person families (2,430 | 37.4%) have the highest median income of $61,222 per family member.
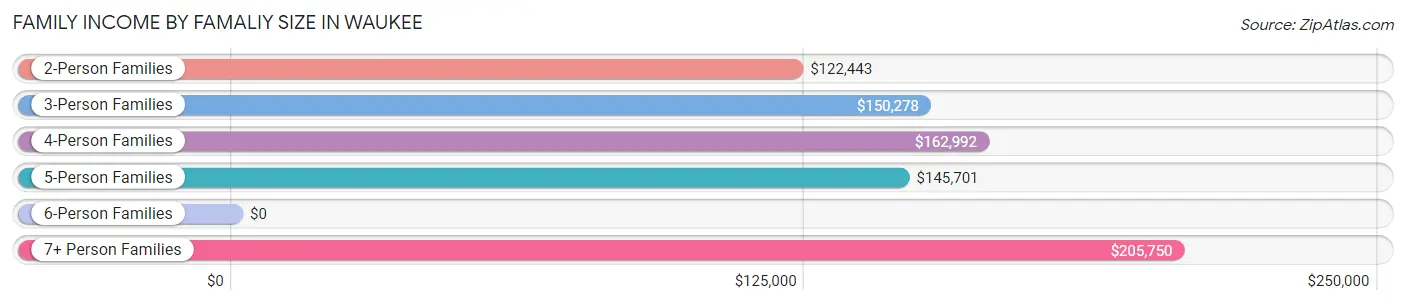
| Income Bracket | # Families | Median Income |
| 2-Person Families | 2,430 (37.4%) | $122,443 |
| 3-Person Families | 1,782 (27.5%) | $150,278 |
| 4-Person Families | 1,479 (22.8%) | $162,992 |
| 5-Person Families | 541 (8.3%) | $145,701 |
| 6-Person Families | 191 (2.9%) | $0 |
| 7+ Person Families | 68 (1.1%) | $205,750 |
| Total | 6,491 (100.0%) | $146,357 |
Family Income by Number of Earners in Waukee
The median family income in Waukee is $146,357, with families comprising 3+ earners (562) having the highest median family income of $164,345, while families with no earners (361) have the lowest median family income of $83,285, accounting for 8.7% and 5.6% of families, respectively.
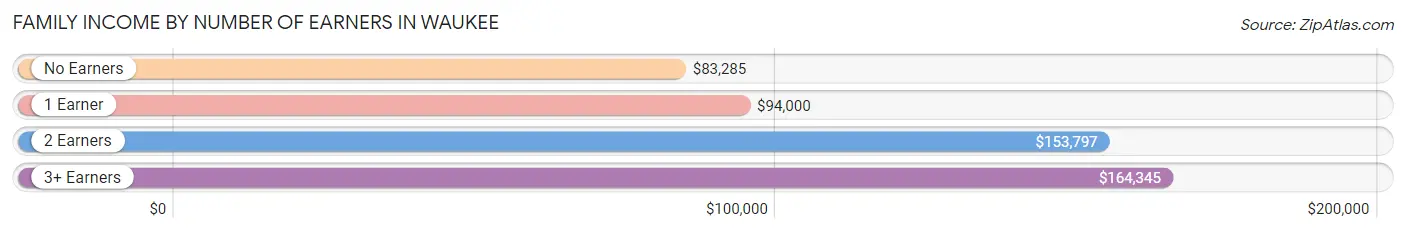
| Number of Earners | # Families | Median Income |
| No Earners | 361 (5.6%) | $83,285 |
| 1 Earner | 1,836 (28.3%) | $94,000 |
| 2 Earners | 3,732 (57.5%) | $153,797 |
| 3+ Earners | 562 (8.7%) | $164,345 |
| Total | 6,491 (100.0%) | $146,357 |
Household Income in Waukee
Household Income Brackets in Waukee
With 2,024 households falling in the category, the $100,000 to $149,999 income range is the most frequent in Waukee, accounting for 20.4% of all households. In contrast, only 169 households (1.7%) fall into the $10,000 to $14,999 income bracket, making it the least populous group.
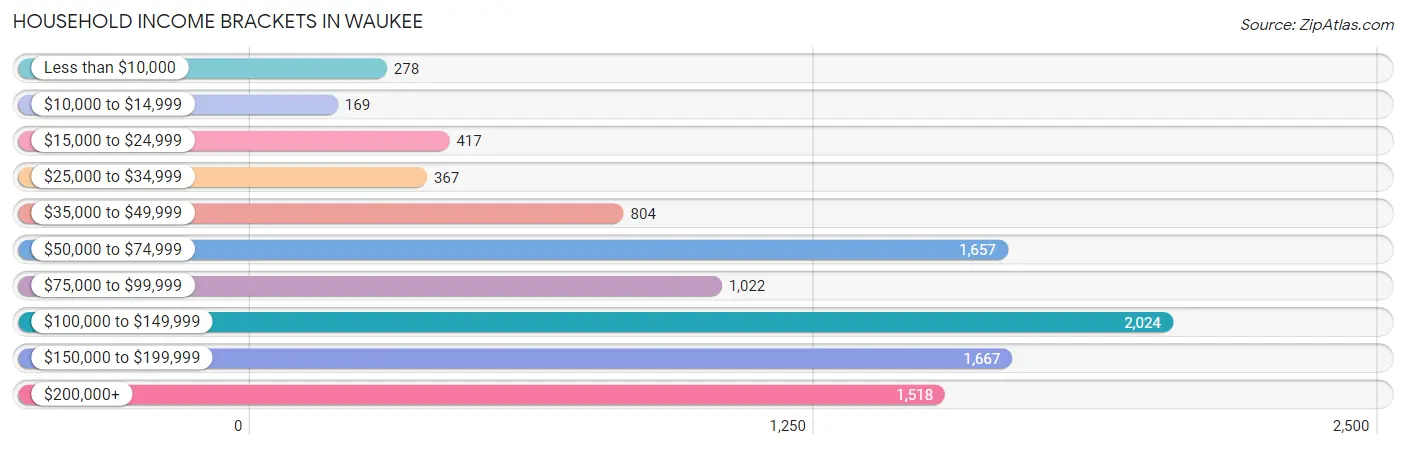
| Income Bracket | # Households | % Households |
| Less than $10,000 | 278 | 2.8% |
| $10,000 to $14,999 | 169 | 1.7% |
| $15,000 to $24,999 | 417 | 4.2% |
| $25,000 to $34,999 | 367 | 3.7% |
| $35,000 to $49,999 | 804 | 8.1% |
| $50,000 to $74,999 | 1,657 | 16.7% |
| $75,000 to $99,999 | 1,022 | 10.3% |
| $100,000 to $149,999 | 2,024 | 20.4% |
| $150,000 to $199,999 | 1,667 | 16.8% |
| $200,000+ | 1,518 | 15.3% |
Household Income by Householder Age in Waukee
The median household income in Waukee is $106,846, with the highest median household income of $130,484 found in the 45 to 64 years age bracket for the primary householder. A total of 3,058 households (30.8%) fall into this category. Meanwhile, the 15 to 24 years age bracket for the primary householder has the lowest median household income of $45,592, with 491 households (5.0%) in this group.
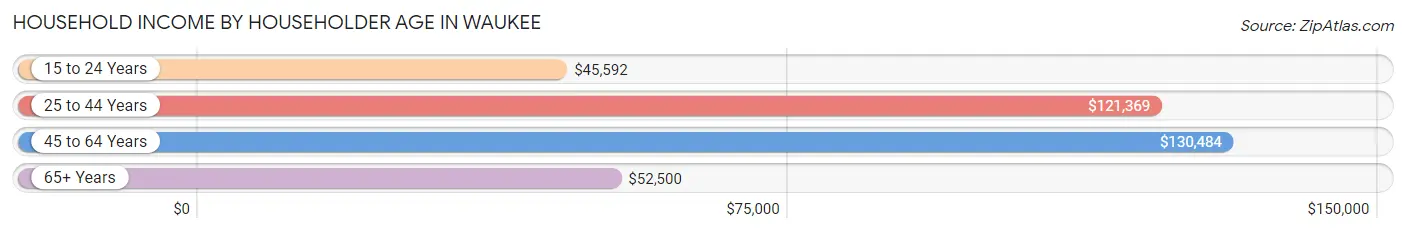
| Income Bracket | # Households | Median Income |
| 15 to 24 Years | 491 (5.0%) | $45,592 |
| 25 to 44 Years | 4,725 (47.6%) | $121,369 |
| 45 to 64 Years | 3,058 (30.8%) | $130,484 |
| 65+ Years | 1,650 (16.6%) | $52,500 |
| Total | 9,924 (100.0%) | $106,846 |
Poverty in Waukee
Income Below Poverty by Sex and Age in Waukee
With 5.7% poverty level for males and 5.9% for females among the residents of Waukee, 18 to 24 year old males and 75 year old and over females are the most vulnerable to poverty, with 178 males (18.0%) and 93 females (14.9%) in their respective age groups living below the poverty level.
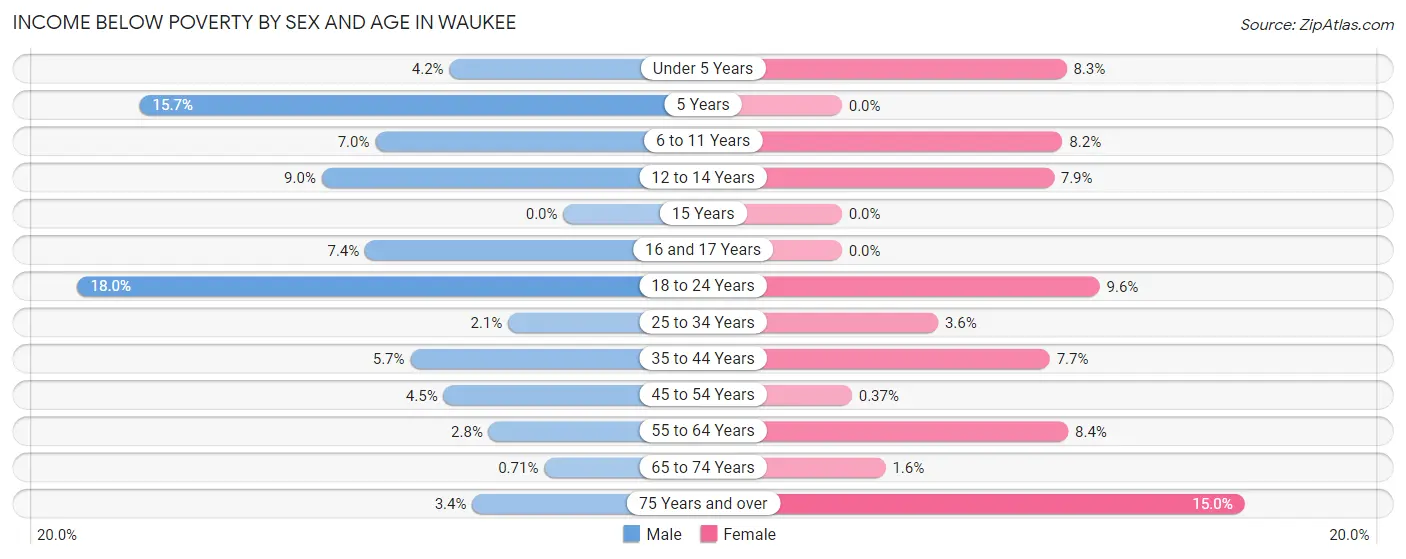
| Age Bracket | Male | Female |
| Under 5 Years | 49 (4.2%) | 76 (8.3%) |
| 5 Years | 28 (15.7%) | 0 (0.0%) |
| 6 to 11 Years | 89 (7.0%) | 111 (8.2%) |
| 12 to 14 Years | 68 (9.0%) | 42 (7.9%) |
| 15 Years | 0 (0.0%) | 0 (0.0%) |
| 16 and 17 Years | 22 (7.4%) | 0 (0.0%) |
| 18 to 24 Years | 178 (18.0%) | 66 (9.6%) |
| 25 to 34 Years | 38 (2.1%) | 73 (3.6%) |
| 35 to 44 Years | 119 (5.7%) | 161 (7.7%) |
| 45 to 54 Years | 75 (4.4%) | 6 (0.4%) |
| 55 to 64 Years | 27 (2.8%) | 96 (8.4%) |
| 65 to 74 Years | 4 (0.7%) | 15 (1.6%) |
| 75 Years and over | 12 (3.4%) | 93 (14.9%) |
| Total | 709 (5.7%) | 739 (5.9%) |
Income Above Poverty by Sex and Age in Waukee
According to the poverty statistics in Waukee, males aged 15 years and females aged 5 years are the age groups that are most secure financially, with 100.0% of males and 100.0% of females in these age groups living above the poverty line.
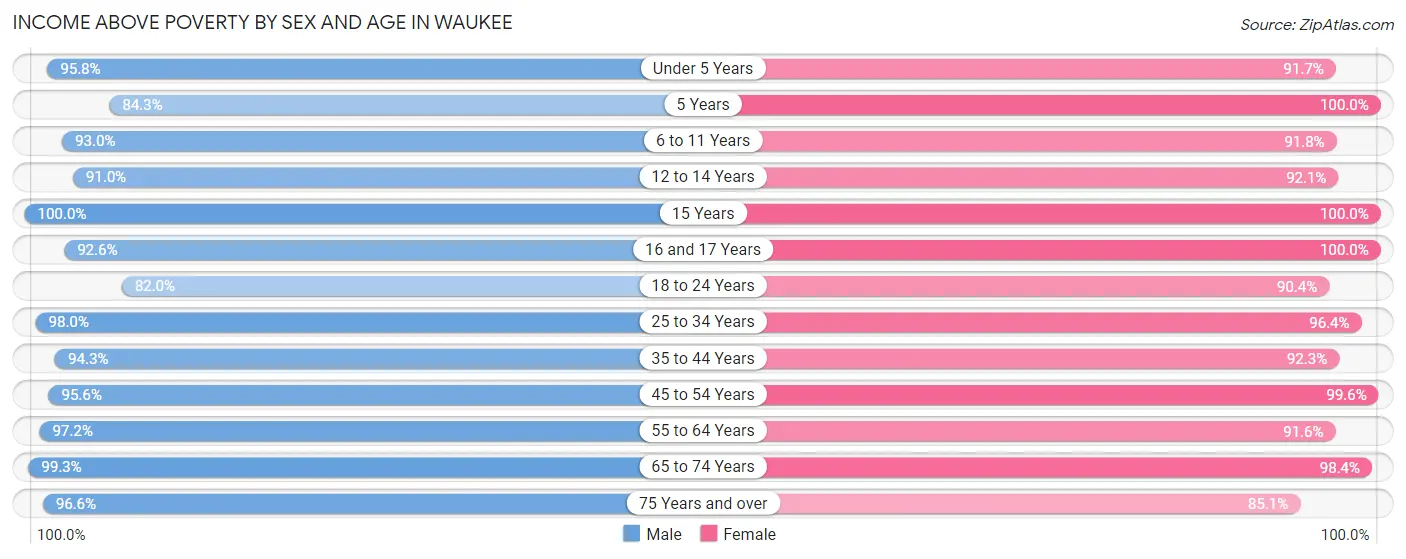
| Age Bracket | Male | Female |
| Under 5 Years | 1,110 (95.8%) | 835 (91.7%) |
| 5 Years | 150 (84.3%) | 134 (100.0%) |
| 6 to 11 Years | 1,186 (93.0%) | 1,245 (91.8%) |
| 12 to 14 Years | 690 (91.0%) | 492 (92.1%) |
| 15 Years | 185 (100.0%) | 218 (100.0%) |
| 16 and 17 Years | 277 (92.6%) | 315 (100.0%) |
| 18 to 24 Years | 809 (82.0%) | 624 (90.4%) |
| 25 to 34 Years | 1,818 (98.0%) | 1,972 (96.4%) |
| 35 to 44 Years | 1,975 (94.3%) | 1,925 (92.3%) |
| 45 to 54 Years | 1,612 (95.6%) | 1,625 (99.6%) |
| 55 to 64 Years | 948 (97.2%) | 1,047 (91.6%) |
| 65 to 74 Years | 556 (99.3%) | 912 (98.4%) |
| 75 Years and over | 343 (96.6%) | 529 (85.1%) |
| Total | 11,659 (94.3%) | 11,873 (94.1%) |
Income Below Poverty Among Married-Couple Families in Waukee
The poverty statistics for married-couple families in Waukee show that 1.4% or 75 of the total 5,356 families live below the poverty line. Families with 3 or 4 children have the highest poverty rate of 8.0%, comprising of 43 families. On the other hand, families with 1 or 2 children have the lowest poverty rate of 0.0%, which includes 0 families.
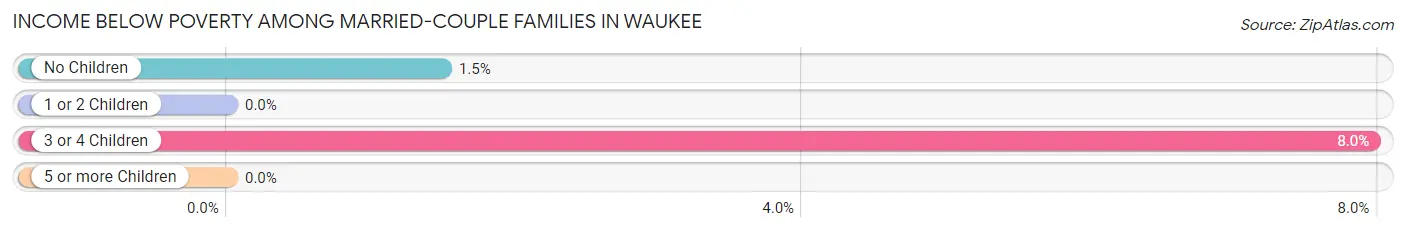
| Children | Above Poverty | Below Poverty |
| No Children | 2,118 (98.5%) | 32 (1.5%) |
| 1 or 2 Children | 2,653 (100.0%) | 0 (0.0%) |
| 3 or 4 Children | 497 (92.0%) | 43 (8.0%) |
| 5 or more Children | 13 (100.0%) | 0 (0.0%) |
| Total | 5,281 (98.6%) | 75 (1.4%) |
Income Below Poverty Among Single-Parent Households in Waukee
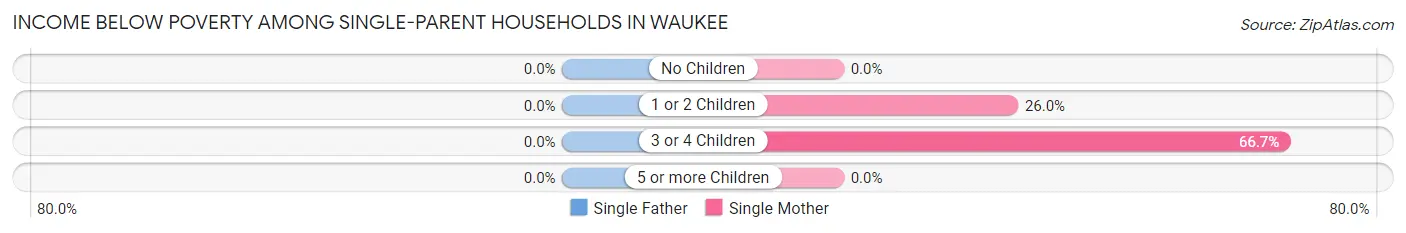
| Children | Single Father | Single Mother |
| No Children | 0 (0.0%) | 0 (0.0%) |
| 1 or 2 Children | 0 (0.0%) | 154 (26.0%) |
| 3 or 4 Children | 0 (0.0%) | 20 (66.7%) |
| 5 or more Children | 0 (0.0%) | 0 (0.0%) |
| Total | 0 (0.0%) | 174 (22.8%) |
Income Below Poverty Among Married-Couple vs Single-Parent Households in Waukee
The poverty data for Waukee shows that 75 of the married-couple family households (1.4%) and 174 of the single-parent households (15.3%) are living below the poverty level. Within the married-couple family households, those with 3 or 4 children have the highest poverty rate, with 43 households (8.0%) falling below the poverty line. Among the single-parent households, those with 3 or 4 children have the highest poverty rate, with 20 household (21.7%) living below poverty.
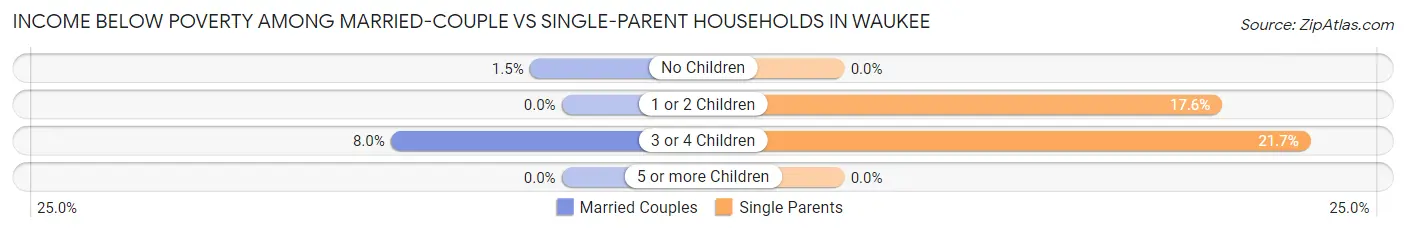
| Children | Married-Couple Families | Single-Parent Households |
| No Children | 32 (1.5%) | 0 (0.0%) |
| 1 or 2 Children | 0 (0.0%) | 154 (17.6%) |
| 3 or 4 Children | 43 (8.0%) | 20 (21.7%) |
| 5 or more Children | 0 (0.0%) | 0 (0.0%) |
| Total | 75 (1.4%) | 174 (15.3%) |
Employment Characteristics in Waukee
Employment by Class of Employer in Waukee
Among the 13,926 employed individuals in Waukee, private company employees (10,372 | 74.5%), not-for-profit organizations (1,025 | 7.4%), and local government employees (740 | 5.3%) make up the most common classes of employment.
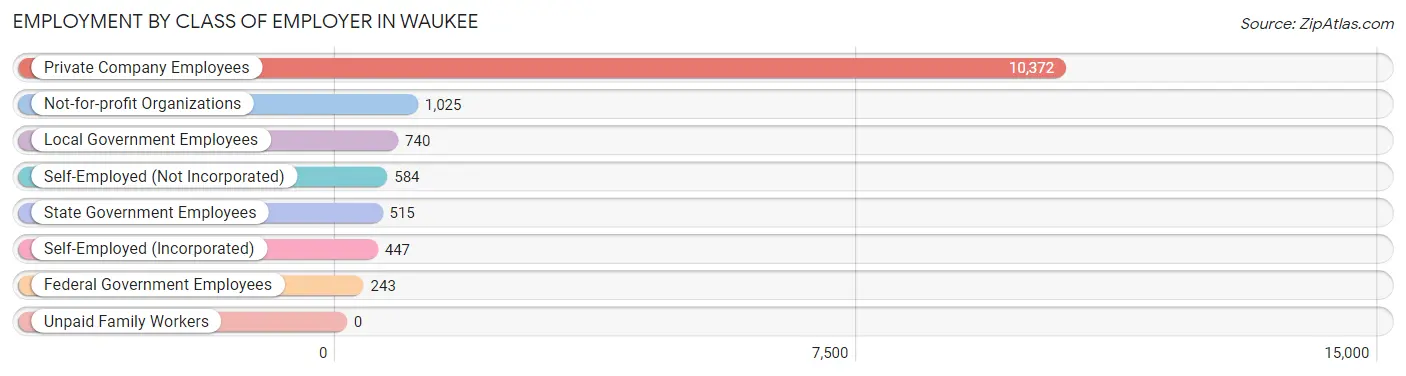
| Employer Class | # Employees | % Employees |
| Private Company Employees | 10,372 | 74.5% |
| Self-Employed (Incorporated) | 447 | 3.2% |
| Self-Employed (Not Incorporated) | 584 | 4.2% |
| Not-for-profit Organizations | 1,025 | 7.4% |
| Local Government Employees | 740 | 5.3% |
| State Government Employees | 515 | 3.7% |
| Federal Government Employees | 243 | 1.7% |
| Unpaid Family Workers | 0 | 0.0% |
| Total | 13,926 | 100.0% |
Employment Status by Age in Waukee
According to the labor force statistics for Waukee, out of the total population over 16 years of age (18,336), 79.4% or 14,559 individuals are in the labor force, with 3.1% or 451 of them unemployed. The age group with the highest labor force participation rate is 20 to 24 years, with 97.9% or 1,180 individuals in the labor force. Within the labor force, the 16 to 19 years age range has the highest percentage of unemployed individuals, with 29.6% or 223 of them being unemployed.
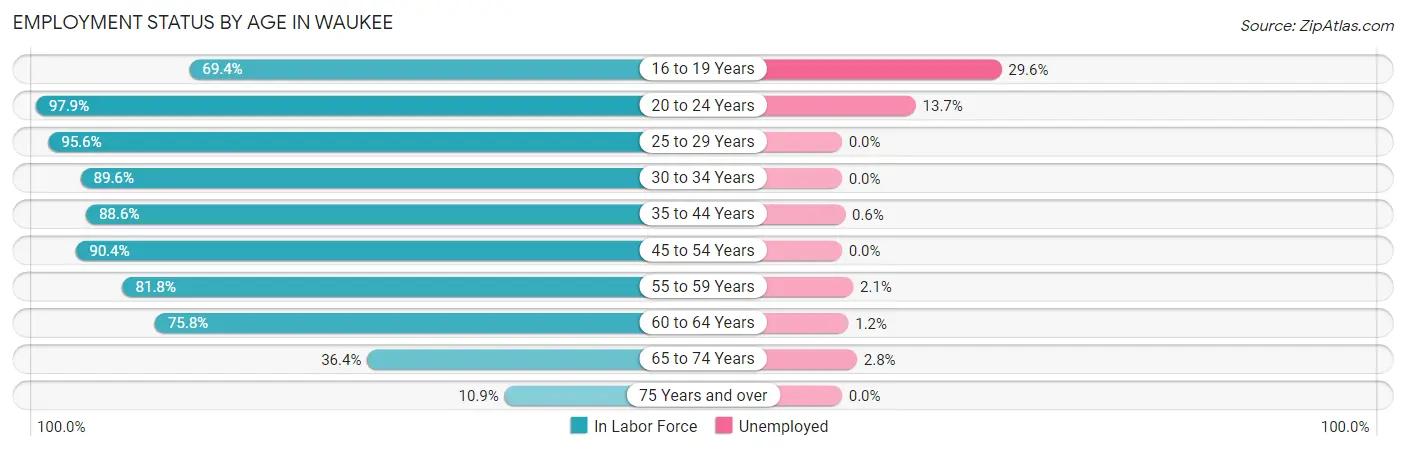
| Age Bracket | In Labor Force | Unemployed |
| 16 to 19 Years | 754 (69.4%) | 223 (29.6%) |
| 20 to 24 Years | 1,180 (97.9%) | 162 (13.7%) |
| 25 to 29 Years | 1,510 (95.6%) | 0 (0.0%) |
| 30 to 34 Years | 2,081 (89.6%) | 0 (0.0%) |
| 35 to 44 Years | 3,703 (88.6%) | 22 (0.6%) |
| 45 to 54 Years | 2,999 (90.4%) | 0 (0.0%) |
| 55 to 59 Years | 1,083 (81.8%) | 23 (2.1%) |
| 60 to 64 Years | 602 (75.8%) | 7 (1.2%) |
| 65 to 74 Years | 541 (36.4%) | 15 (2.8%) |
| 75 Years and over | 113 (10.9%) | 0 (0.0%) |
| Total | 14,559 (79.4%) | 451 (3.1%) |
Employment Status by Educational Attainment in Waukee
According to labor force statistics for Waukee, 88.6% of individuals (11,976) out of the total population between 25 and 64 years of age (13,517) are in the labor force, with 0.4% or 48 of them being unemployed. The group with the highest labor force participation rate are those with the educational attainment of bachelor's degree or higher, with 91.5% or 7,799 individuals in the labor force. Within the labor force, individuals with college / associate degree education have the highest percentage of unemployment, with 0.6% or 17 of them being unemployed.
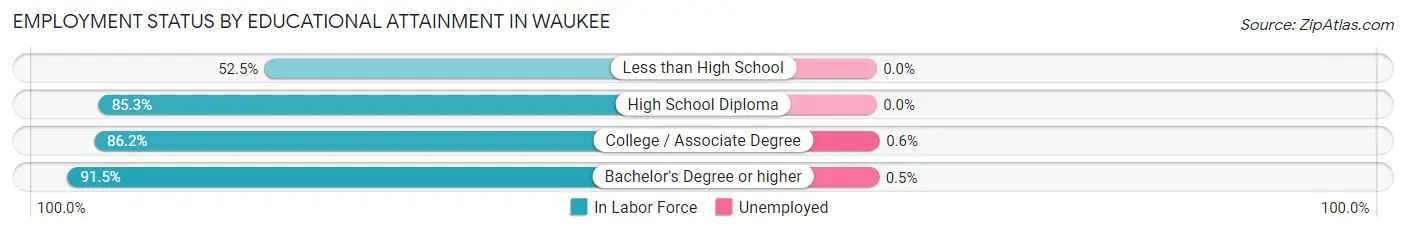
| Educational Attainment | In Labor Force | Unemployed |
| Less than High School | 170 (52.5%) | 0 (0.0%) |
| High School Diploma | 1,158 (85.3%) | 0 (0.0%) |
| College / Associate Degree | 2,856 (86.2%) | 20 (0.6%) |
| Bachelor's Degree or higher | 7,799 (91.5%) | 43 (0.5%) |
| Total | 11,976 (88.6%) | 54 (0.4%) |
Employment Occupations by Sex in Waukee
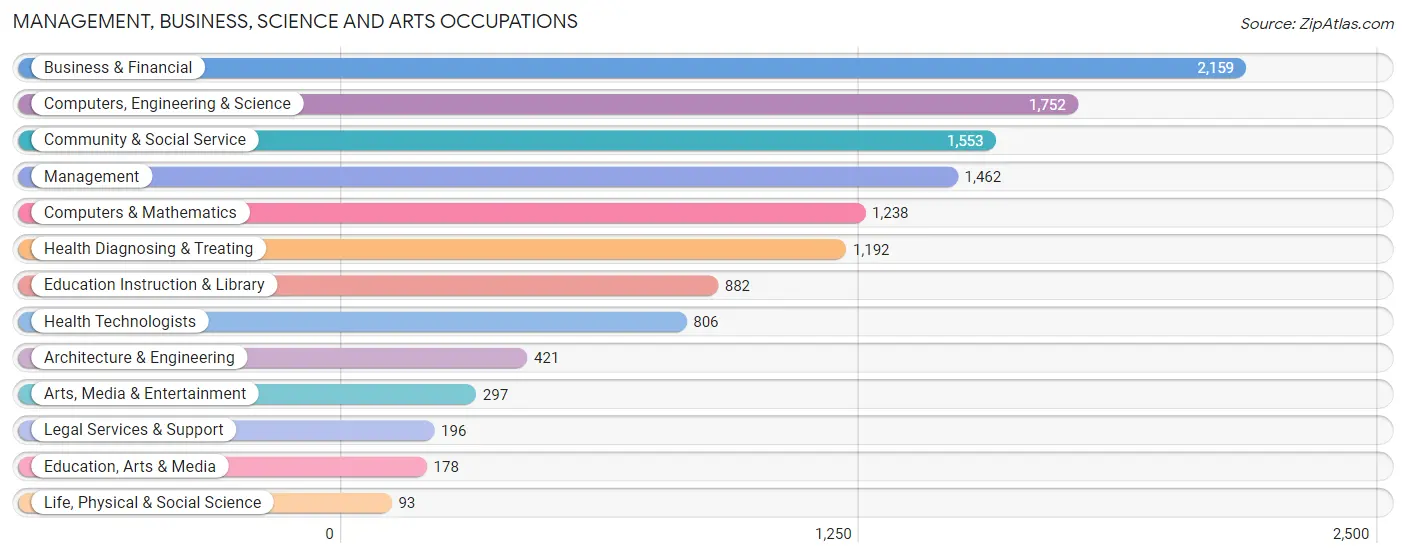
Management, Business, Science and Arts Occupations
The most common Management, Business, Science and Arts occupations in Waukee are Business & Financial (2,159 | 15.3%), Computers, Engineering & Science (1,752 | 12.4%), Community & Social Service (1,553 | 11.0%), Management (1,462 | 10.4%), and Computers & Mathematics (1,238 | 8.8%).
Management, Business, Science and Arts Occupations by Sex
Within the Management, Business, Science and Arts occupations in Waukee, the most male-oriented occupations are Architecture & Engineering (96.0%), Life, Physical & Social Science (87.1%), and Computers, Engineering & Science (77.9%), while the most female-oriented occupations are Education Instruction & Library (86.4%), Education, Arts & Media (83.7%), and Health Technologists (83.6%).
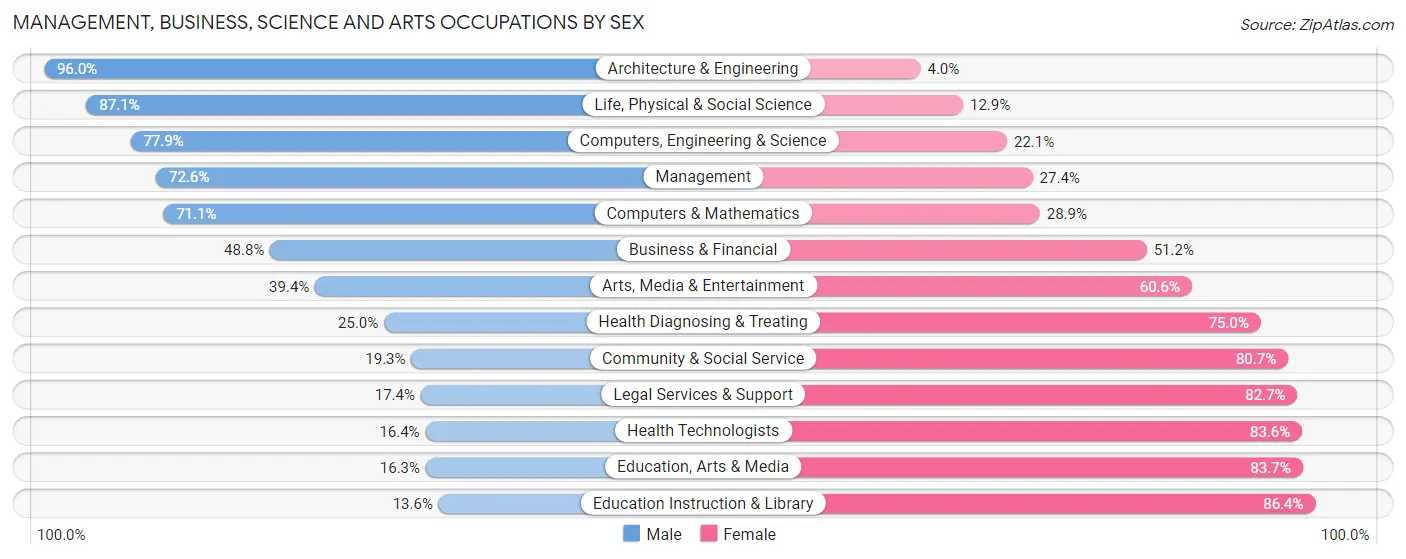
| Occupation | Male | Female |
| Management | 1,061 (72.6%) | 401 (27.4%) |
| Business & Financial | 1,053 (48.8%) | 1,106 (51.2%) |
| Computers, Engineering & Science | 1,365 (77.9%) | 387 (22.1%) |
| Computers & Mathematics | 880 (71.1%) | 358 (28.9%) |
| Architecture & Engineering | 404 (96.0%) | 17 (4.0%) |
| Life, Physical & Social Science | 81 (87.1%) | 12 (12.9%) |
| Community & Social Service | 300 (19.3%) | 1,253 (80.7%) |
| Education, Arts & Media | 29 (16.3%) | 149 (83.7%) |
| Legal Services & Support | 34 (17.3%) | 162 (82.7%) |
| Education Instruction & Library | 120 (13.6%) | 762 (86.4%) |
| Arts, Media & Entertainment | 117 (39.4%) | 180 (60.6%) |
| Health Diagnosing & Treating | 298 (25.0%) | 894 (75.0%) |
| Health Technologists | 132 (16.4%) | 674 (83.6%) |
| Total (Category) | 4,077 (50.2%) | 4,041 (49.8%) |
| Total (Overall) | 7,375 (52.2%) | 6,740 (47.7%) |
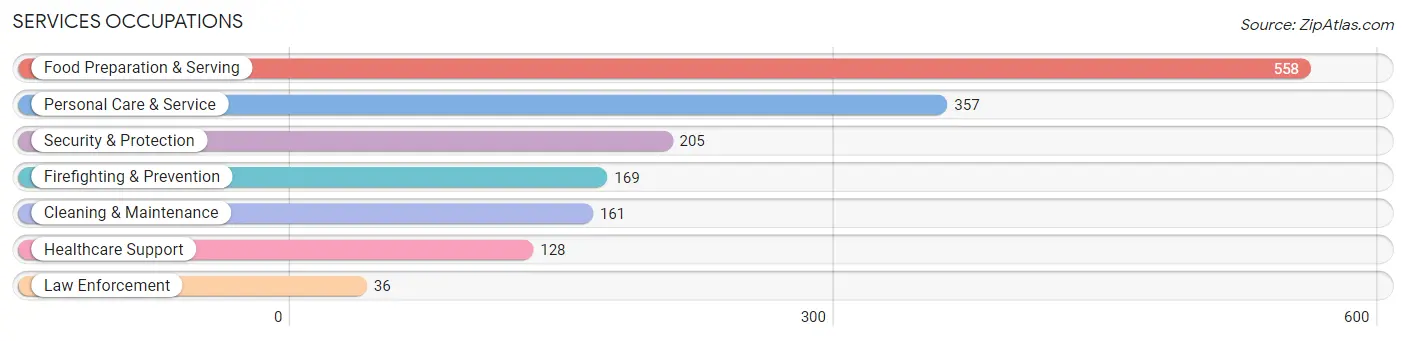
Services Occupations
The most common Services occupations in Waukee are Food Preparation & Serving (558 | 4.0%), Personal Care & Service (357 | 2.5%), Security & Protection (205 | 1.5%), Firefighting & Prevention (169 | 1.2%), and Cleaning & Maintenance (161 | 1.1%).
Services Occupations by Sex
Within the Services occupations in Waukee, the most male-oriented occupations are Law Enforcement (100.0%), Cleaning & Maintenance (82.6%), and Security & Protection (67.3%), while the most female-oriented occupations are Healthcare Support (100.0%), Personal Care & Service (88.8%), and Food Preparation & Serving (73.1%).
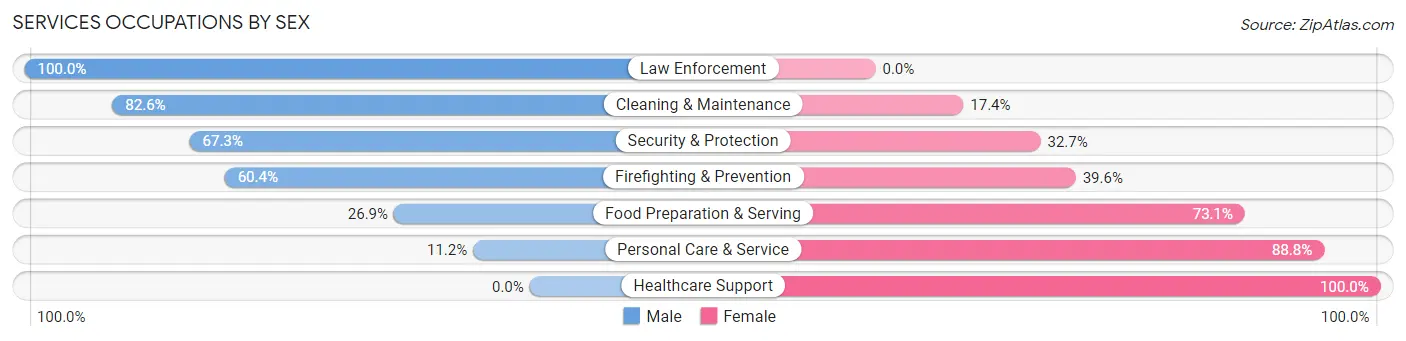
| Occupation | Male | Female |
| Healthcare Support | 0 (0.0%) | 128 (100.0%) |
| Security & Protection | 138 (67.3%) | 67 (32.7%) |
| Firefighting & Prevention | 102 (60.4%) | 67 (39.6%) |
| Law Enforcement | 36 (100.0%) | 0 (0.0%) |
| Food Preparation & Serving | 150 (26.9%) | 408 (73.1%) |
| Cleaning & Maintenance | 133 (82.6%) | 28 (17.4%) |
| Personal Care & Service | 40 (11.2%) | 317 (88.8%) |
| Total (Category) | 461 (32.7%) | 948 (67.3%) |
| Total (Overall) | 7,375 (52.2%) | 6,740 (47.7%) |
Sales and Office Occupations
The most common Sales and Office occupations in Waukee are Office & Administration (1,381 | 9.8%), and Sales & Related (1,330 | 9.4%).

Sales and Office Occupations by Sex
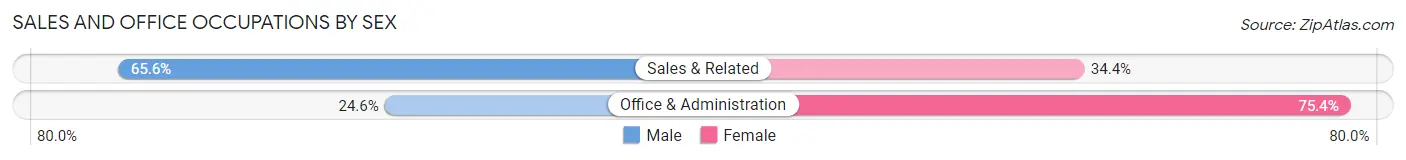
| Occupation | Male | Female |
| Sales & Related | 873 (65.6%) | 457 (34.4%) |
| Office & Administration | 340 (24.6%) | 1,041 (75.4%) |
| Total (Category) | 1,213 (44.7%) | 1,498 (55.3%) |
| Total (Overall) | 7,375 (52.2%) | 6,740 (47.7%) |
Natural Resources, Construction and Maintenance Occupations
The most common Natural Resources, Construction and Maintenance occupations in Waukee are Construction & Extraction (303 | 2.1%), Installation, Maintenance & Repair (217 | 1.5%), and Farming, Fishing & Forestry (106 | 0.7%).

Natural Resources, Construction and Maintenance Occupations by Sex
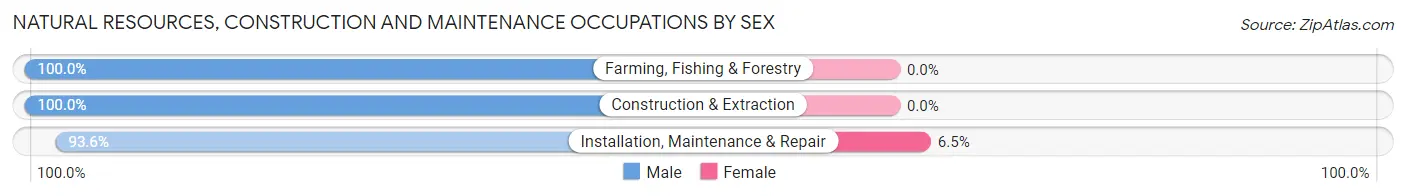
| Occupation | Male | Female |
| Farming, Fishing & Forestry | 106 (100.0%) | 0 (0.0%) |
| Construction & Extraction | 303 (100.0%) | 0 (0.0%) |
| Installation, Maintenance & Repair | 203 (93.5%) | 14 (6.5%) |
| Total (Category) | 612 (97.8%) | 14 (2.2%) |
| Total (Overall) | 7,375 (52.2%) | 6,740 (47.7%) |
Production, Transportation and Moving Occupations
The most common Production, Transportation and Moving occupations in Waukee are Production (673 | 4.8%), Material Moving (313 | 2.2%), and Transportation (265 | 1.9%).
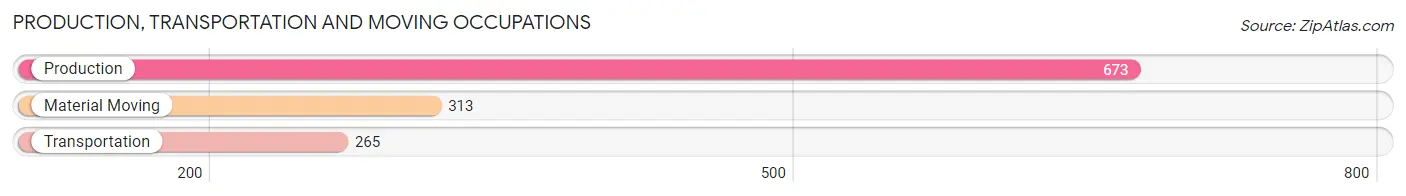
Production, Transportation and Moving Occupations by Sex
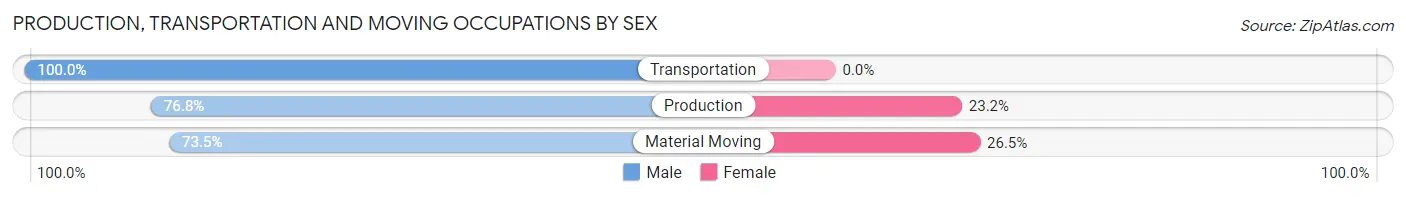
| Occupation | Male | Female |
| Production | 517 (76.8%) | 156 (23.2%) |
| Transportation | 265 (100.0%) | 0 (0.0%) |
| Material Moving | 230 (73.5%) | 83 (26.5%) |
| Total (Category) | 1,012 (80.9%) | 239 (19.1%) |
| Total (Overall) | 7,375 (52.2%) | 6,740 (47.7%) |
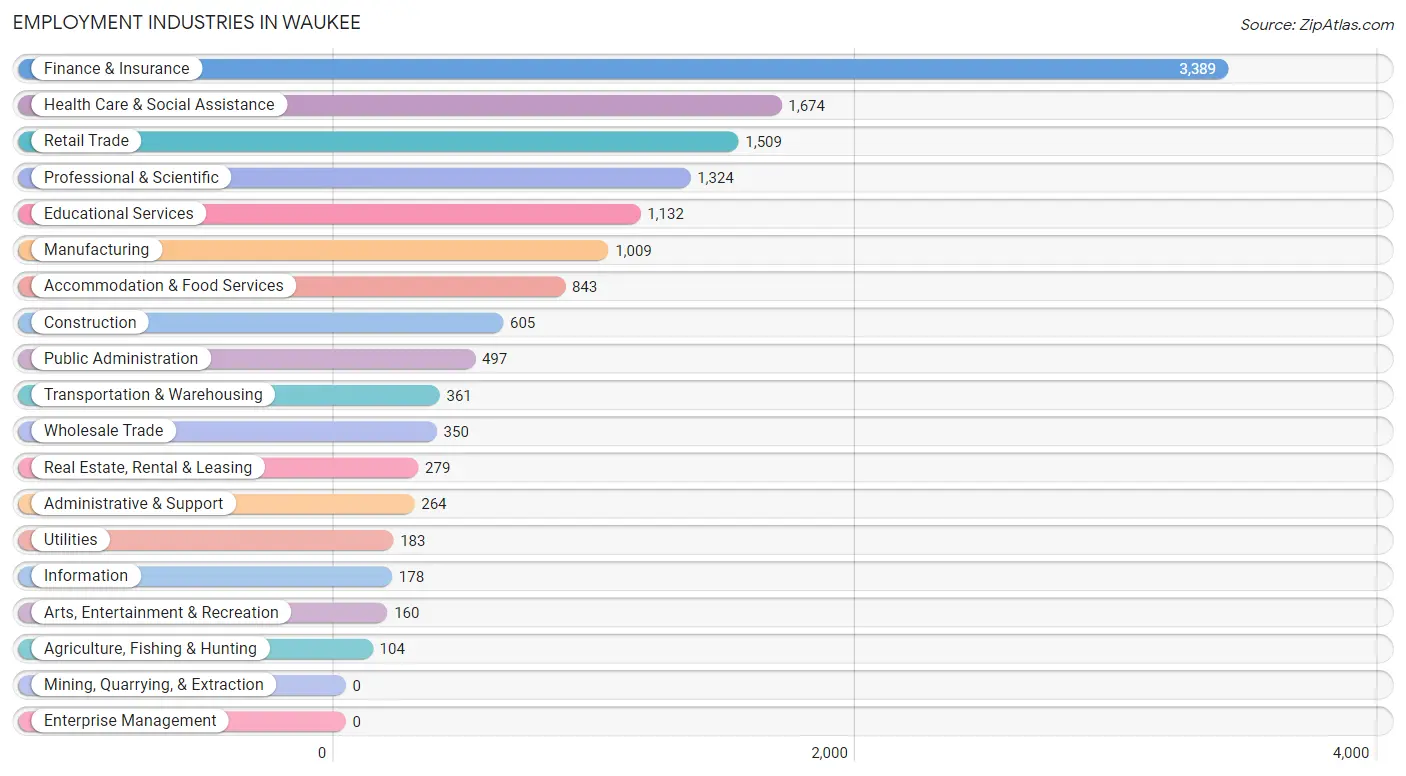
Employment Industries by Sex in Waukee
Employment Industries in Waukee
The major employment industries in Waukee include Finance & Insurance (3,389 | 24.0%), Health Care & Social Assistance (1,674 | 11.9%), Retail Trade (1,509 | 10.7%), Professional & Scientific (1,324 | 9.4%), and Educational Services (1,132 | 8.0%).
Employment Industries by Sex in Waukee
The Waukee industries that see more men than women are Wholesale Trade (90.6%), Agriculture, Fishing & Hunting (90.4%), and Construction (87.9%), whereas the industries that tend to have a higher number of women are Health Care & Social Assistance (78.5%), Educational Services (75.6%), and Public Administration (60.6%).
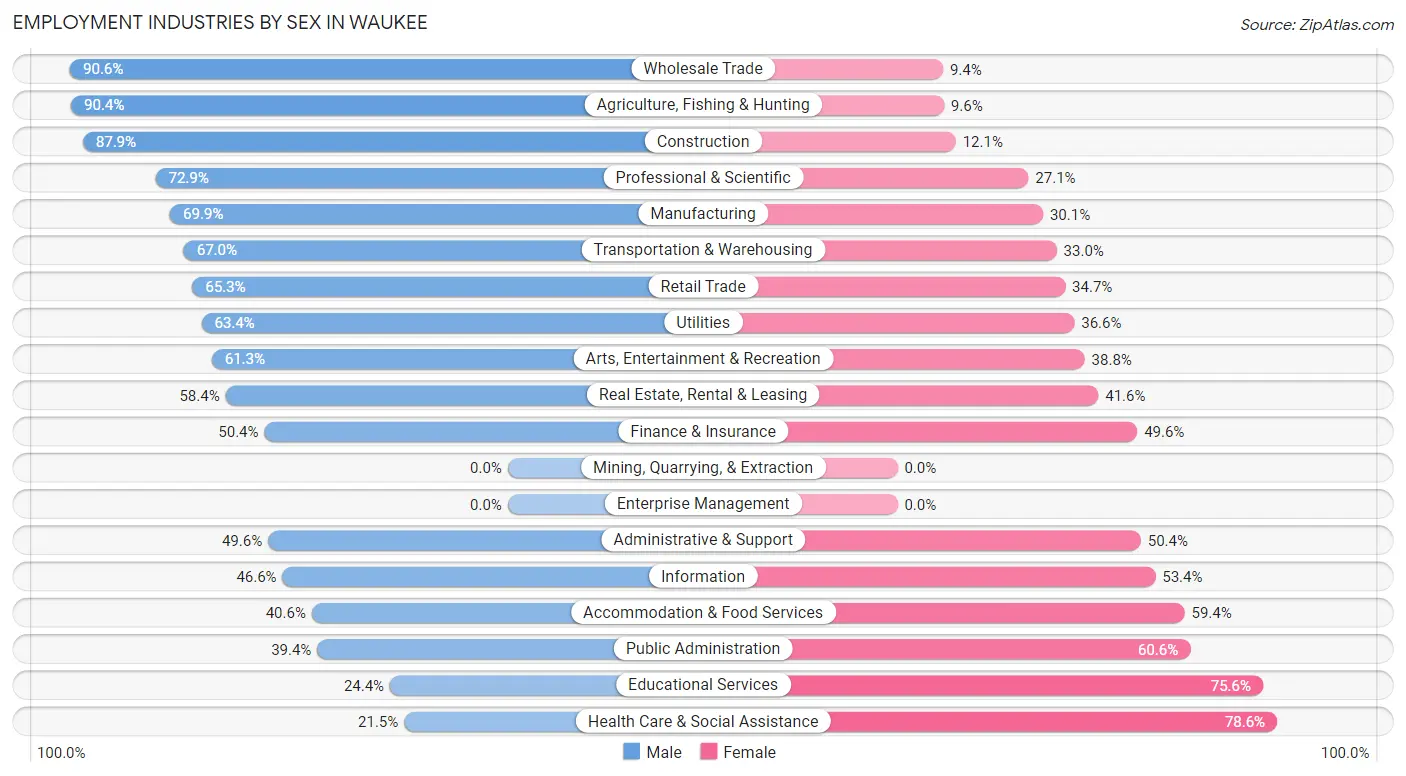
| Industry | Male | Female |
| Agriculture, Fishing & Hunting | 94 (90.4%) | 10 (9.6%) |
| Mining, Quarrying, & Extraction | 0 (0.0%) | 0 (0.0%) |
| Construction | 532 (87.9%) | 73 (12.1%) |
| Manufacturing | 705 (69.9%) | 304 (30.1%) |
| Wholesale Trade | 317 (90.6%) | 33 (9.4%) |
| Retail Trade | 985 (65.3%) | 524 (34.7%) |
| Transportation & Warehousing | 242 (67.0%) | 119 (33.0%) |
| Utilities | 116 (63.4%) | 67 (36.6%) |
| Information | 83 (46.6%) | 95 (53.4%) |
| Finance & Insurance | 1,707 (50.4%) | 1,682 (49.6%) |
| Real Estate, Rental & Leasing | 163 (58.4%) | 116 (41.6%) |
| Professional & Scientific | 965 (72.9%) | 359 (27.1%) |
| Enterprise Management | 0 (0.0%) | 0 (0.0%) |
| Administrative & Support | 131 (49.6%) | 133 (50.4%) |
| Educational Services | 276 (24.4%) | 856 (75.6%) |
| Health Care & Social Assistance | 359 (21.4%) | 1,315 (78.5%) |
| Arts, Entertainment & Recreation | 98 (61.3%) | 62 (38.8%) |
| Accommodation & Food Services | 342 (40.6%) | 501 (59.4%) |
| Public Administration | 196 (39.4%) | 301 (60.6%) |
| Total | 7,375 (52.2%) | 6,740 (47.7%) |
Education in Waukee
School Enrollment in Waukee
The most common levels of schooling among the 6,214 students in Waukee are elementary school (1,836 | 29.5%), middle school (1,714 | 27.6%), and high school (1,247 | 20.1%).
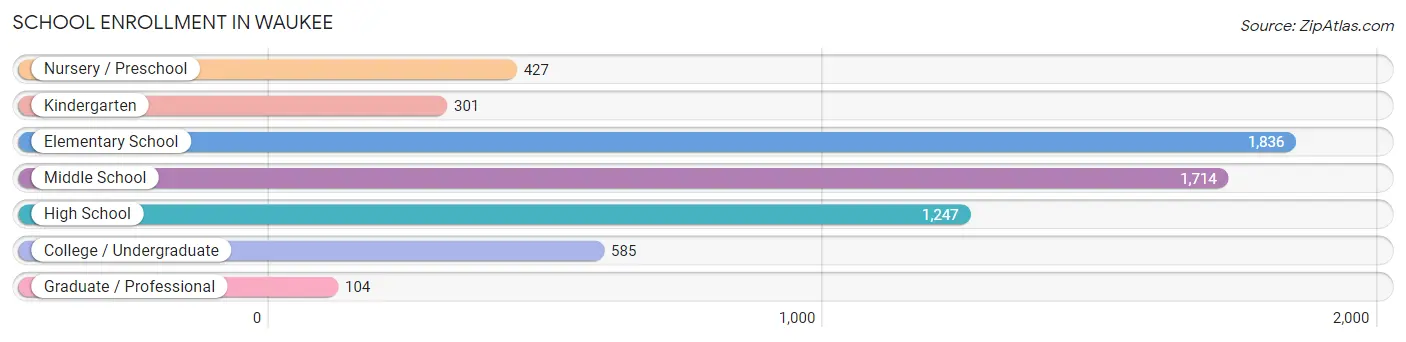
| School Level | # Students | % Students |
| Nursery / Preschool | 427 | 6.9% |
| Kindergarten | 301 | 4.8% |
| Elementary School | 1,836 | 29.5% |
| Middle School | 1,714 | 27.6% |
| High School | 1,247 | 20.1% |
| College / Undergraduate | 585 | 9.4% |
| Graduate / Professional | 104 | 1.7% |
| Total | 6,214 | 100.0% |
School Enrollment by Age by Funding Source in Waukee
Out of a total of 6,214 students who are enrolled in schools in Waukee, 752 (12.1%) attend a private institution, while the remaining 5,462 (87.9%) are enrolled in public schools. The age group of 3 to 4 year olds has the highest likelihood of being enrolled in private schools, with 181 (62.2% in the age bracket) enrolled. Conversely, the age group of 5 to 9 year old has the lowest likelihood of being enrolled in a private school, with 1,946 (94.7% in the age bracket) attending a public institution.
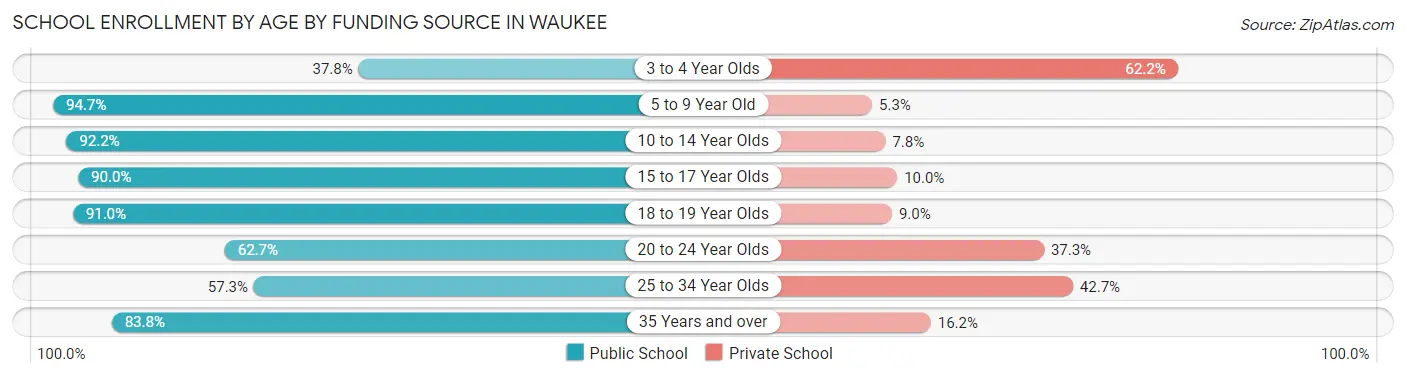
| Age Bracket | Public School | Private School |
| 3 to 4 Year Olds | 110 (37.8%) | 181 (62.2%) |
| 5 to 9 Year Old | 1,946 (94.7%) | 109 (5.3%) |
| 10 to 14 Year Olds | 1,941 (92.2%) | 164 (7.8%) |
| 15 to 17 Year Olds | 912 (90.0%) | 101 (10.0%) |
| 18 to 19 Year Olds | 172 (91.0%) | 17 (9.0%) |
| 20 to 24 Year Olds | 116 (62.7%) | 69 (37.3%) |
| 25 to 34 Year Olds | 106 (57.3%) | 79 (42.7%) |
| 35 Years and over | 160 (83.8%) | 31 (16.2%) |
| Total | 5,462 (87.9%) | 752 (12.1%) |
Educational Attainment by Field of Study in Waukee
Business (2,718 | 26.6%), education (1,021 | 10.0%), bio, nature & agricultural (995 | 9.8%), science & technology (916 | 9.0%), and engineering (739 | 7.2%) are the most common fields of study among 10,206 individuals in Waukee who have obtained a bachelor's degree or higher.
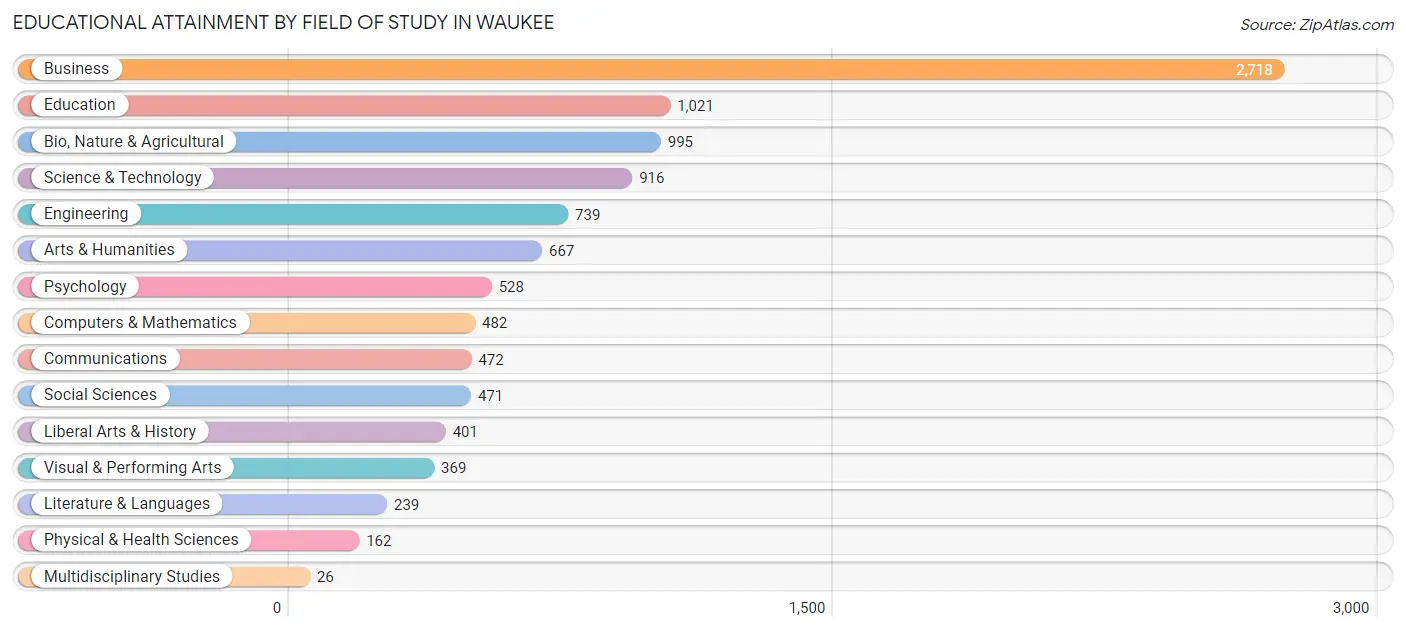
| Field of Study | # Graduates | % Graduates |
| Computers & Mathematics | 482 | 4.7% |
| Bio, Nature & Agricultural | 995 | 9.8% |
| Physical & Health Sciences | 162 | 1.6% |
| Psychology | 528 | 5.2% |
| Social Sciences | 471 | 4.6% |
| Engineering | 739 | 7.2% |
| Multidisciplinary Studies | 26 | 0.3% |
| Science & Technology | 916 | 9.0% |
| Business | 2,718 | 26.6% |
| Education | 1,021 | 10.0% |
| Literature & Languages | 239 | 2.3% |
| Liberal Arts & History | 401 | 3.9% |
| Visual & Performing Arts | 369 | 3.6% |
| Communications | 472 | 4.6% |
| Arts & Humanities | 667 | 6.5% |
| Total | 10,206 | 100.0% |
Transportation & Commute in Waukee
Vehicle Availability by Sex in Waukee
The most prevalent vehicle ownership categories in Waukee are males with 2 vehicles (4,110, accounting for 56.7%) and females with 2 vehicles (3,710, making up 61.6%).
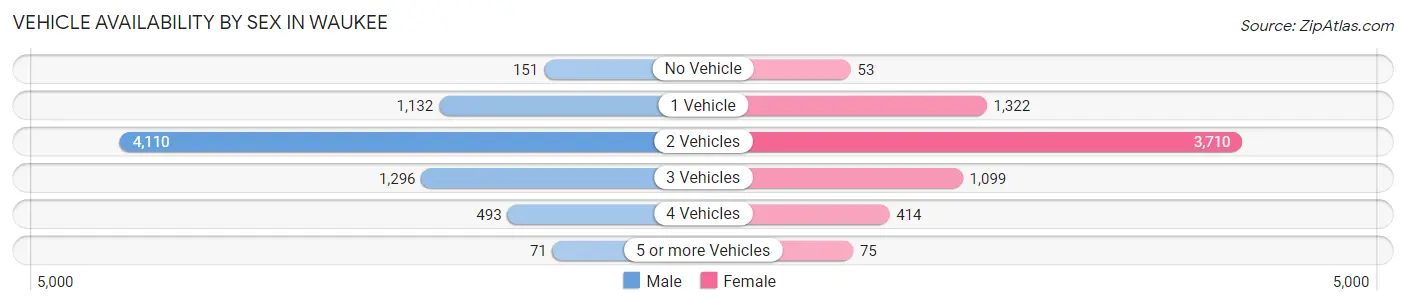
| Vehicles Available | Male | Female |
| No Vehicle | 151 (2.1%) | 53 (0.8%) |
| 1 Vehicle | 1,132 (15.6%) | 1,322 (19.8%) |
| 2 Vehicles | 4,110 (56.7%) | 3,710 (55.6%) |
| 3 Vehicles | 1,296 (17.9%) | 1,099 (16.5%) |
| 4 Vehicles | 493 (6.8%) | 414 (6.2%) |
| 5 or more Vehicles | 71 (1.0%) | 75 (1.1%) |
| Total | 7,253 (100.0%) | 6,673 (100.0%) |
Commute Time in Waukee
The most frequently occuring commute durations in Waukee are 15 to 19 minutes (2,609 commuters, 22.5%), 20 to 24 minutes (2,315 commuters, 20.0%), and 10 to 14 minutes (1,964 commuters, 17.0%).
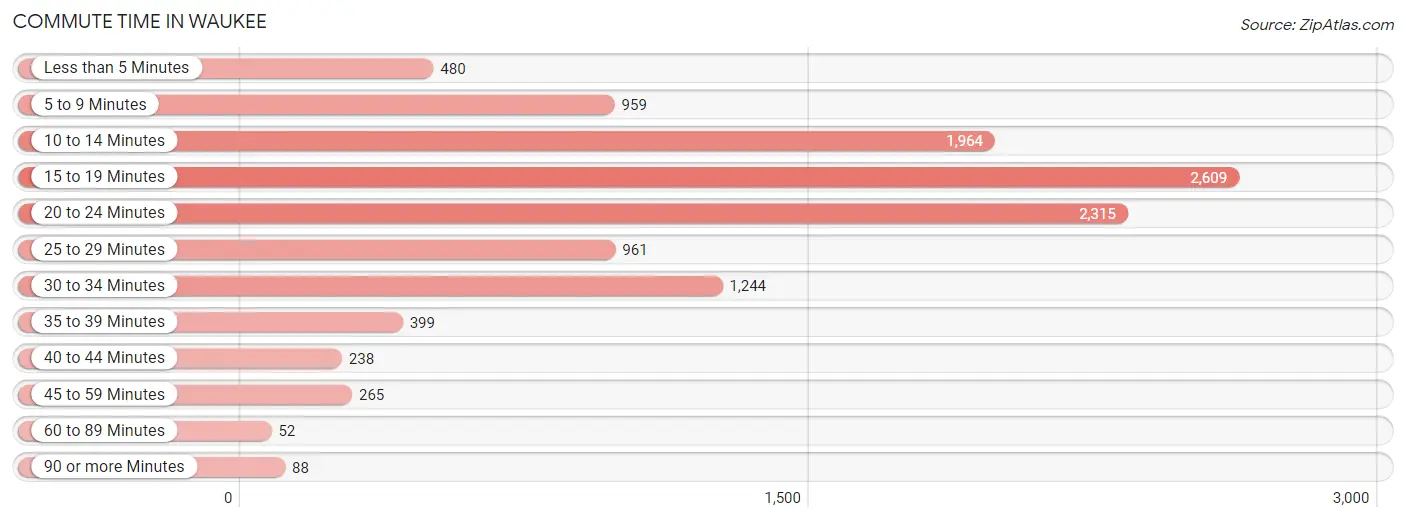
| Commute Time | # Commuters | % Commuters |
| Less than 5 Minutes | 480 | 4.2% |
| 5 to 9 Minutes | 959 | 8.3% |
| 10 to 14 Minutes | 1,964 | 17.0% |
| 15 to 19 Minutes | 2,609 | 22.5% |
| 20 to 24 Minutes | 2,315 | 20.0% |
| 25 to 29 Minutes | 961 | 8.3% |
| 30 to 34 Minutes | 1,244 | 10.7% |
| 35 to 39 Minutes | 399 | 3.5% |
| 40 to 44 Minutes | 238 | 2.1% |
| 45 to 59 Minutes | 265 | 2.3% |
| 60 to 89 Minutes | 52 | 0.4% |
| 90 or more Minutes | 88 | 0.8% |
Commute Time by Sex in Waukee
The most common commute times in Waukee are 20 to 24 minutes (1,355 commuters, 22.4%) for males and 15 to 19 minutes (1,379 commuters, 24.9%) for females.
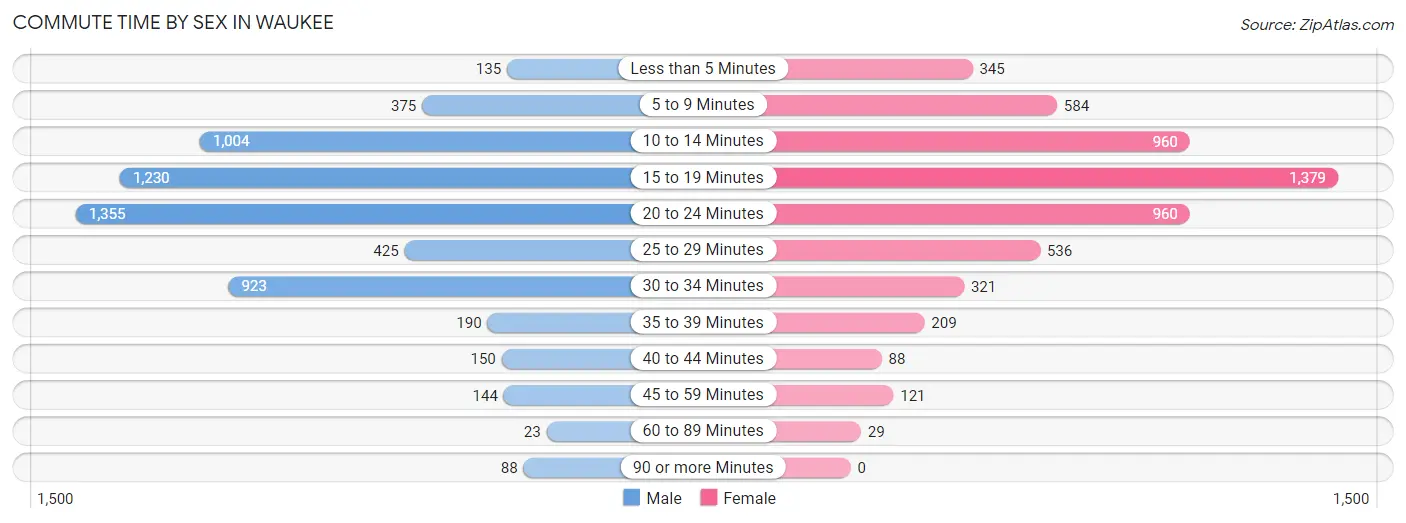
| Commute Time | Male | Female |
| Less than 5 Minutes | 135 (2.2%) | 345 (6.2%) |
| 5 to 9 Minutes | 375 (6.2%) | 584 (10.6%) |
| 10 to 14 Minutes | 1,004 (16.6%) | 960 (17.3%) |
| 15 to 19 Minutes | 1,230 (20.4%) | 1,379 (24.9%) |
| 20 to 24 Minutes | 1,355 (22.4%) | 960 (17.3%) |
| 25 to 29 Minutes | 425 (7.0%) | 536 (9.7%) |
| 30 to 34 Minutes | 923 (15.3%) | 321 (5.8%) |
| 35 to 39 Minutes | 190 (3.1%) | 209 (3.8%) |
| 40 to 44 Minutes | 150 (2.5%) | 88 (1.6%) |
| 45 to 59 Minutes | 144 (2.4%) | 121 (2.2%) |
| 60 to 89 Minutes | 23 (0.4%) | 29 (0.5%) |
| 90 or more Minutes | 88 (1.5%) | 0 (0.0%) |
Time of Departure to Work by Sex in Waukee
The most frequent times of departure to work in Waukee are 6:30 AM to 6:59 AM (1,063, 17.6%) for males and 7:30 AM to 7:59 AM (1,287, 23.3%) for females.
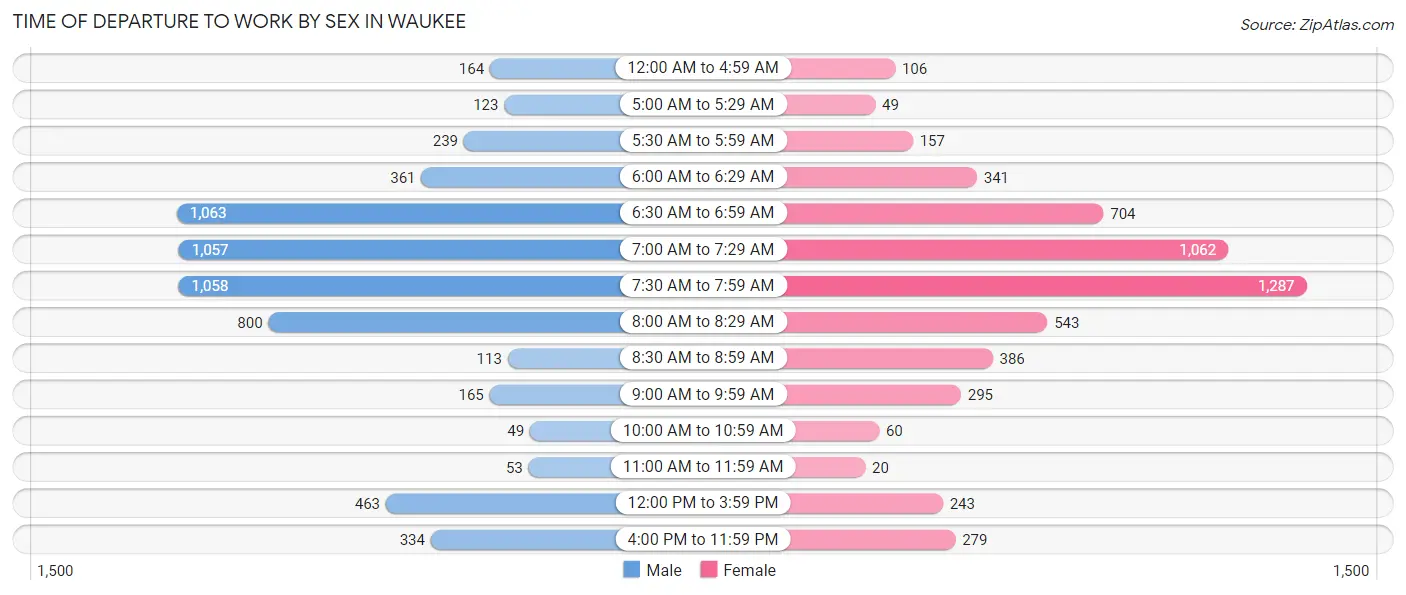
| Time of Departure | Male | Female |
| 12:00 AM to 4:59 AM | 164 (2.7%) | 106 (1.9%) |
| 5:00 AM to 5:29 AM | 123 (2.0%) | 49 (0.9%) |
| 5:30 AM to 5:59 AM | 239 (4.0%) | 157 (2.8%) |
| 6:00 AM to 6:29 AM | 361 (6.0%) | 341 (6.2%) |
| 6:30 AM to 6:59 AM | 1,063 (17.6%) | 704 (12.7%) |
| 7:00 AM to 7:29 AM | 1,057 (17.5%) | 1,062 (19.2%) |
| 7:30 AM to 7:59 AM | 1,058 (17.5%) | 1,287 (23.3%) |
| 8:00 AM to 8:29 AM | 800 (13.2%) | 543 (9.8%) |
| 8:30 AM to 8:59 AM | 113 (1.9%) | 386 (7.0%) |
| 9:00 AM to 9:59 AM | 165 (2.7%) | 295 (5.3%) |
| 10:00 AM to 10:59 AM | 49 (0.8%) | 60 (1.1%) |
| 11:00 AM to 11:59 AM | 53 (0.9%) | 20 (0.4%) |
| 12:00 PM to 3:59 PM | 463 (7.7%) | 243 (4.4%) |
| 4:00 PM to 11:59 PM | 334 (5.5%) | 279 (5.0%) |
| Total | 6,042 (100.0%) | 5,532 (100.0%) |
Housing Occupancy in Waukee
Occupancy by Ownership in Waukee
Of the total 9,924 dwellings in Waukee, owner-occupied units account for 7,012 (70.7%), while renter-occupied units make up 2,912 (29.3%).
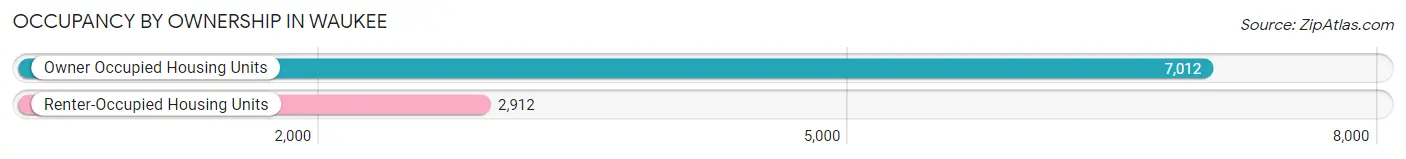
| Occupancy | # Housing Units | % Housing Units |
| Owner Occupied Housing Units | 7,012 | 70.7% |
| Renter-Occupied Housing Units | 2,912 | 29.3% |
| Total Occupied Housing Units | 9,924 | 100.0% |
Occupancy by Household Size in Waukee
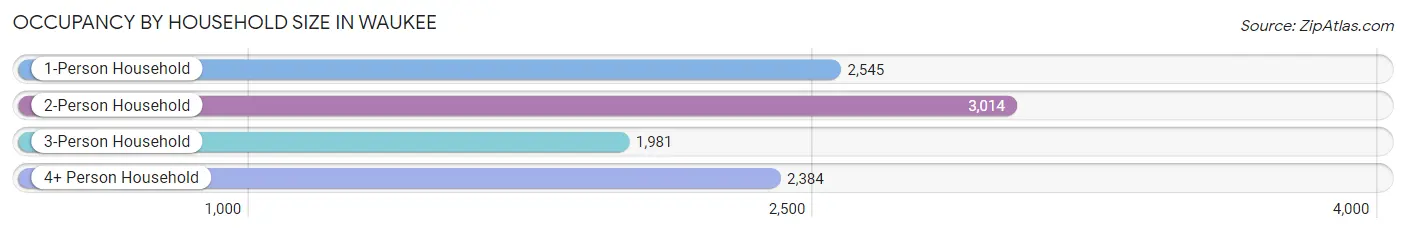
| Household Size | # Housing Units | % Housing Units |
| 1-Person Household | 2,545 | 25.6% |
| 2-Person Household | 3,014 | 30.4% |
| 3-Person Household | 1,981 | 20.0% |
| 4+ Person Household | 2,384 | 24.0% |
| Total Housing Units | 9,924 | 100.0% |
Occupancy by Ownership by Household Size in Waukee
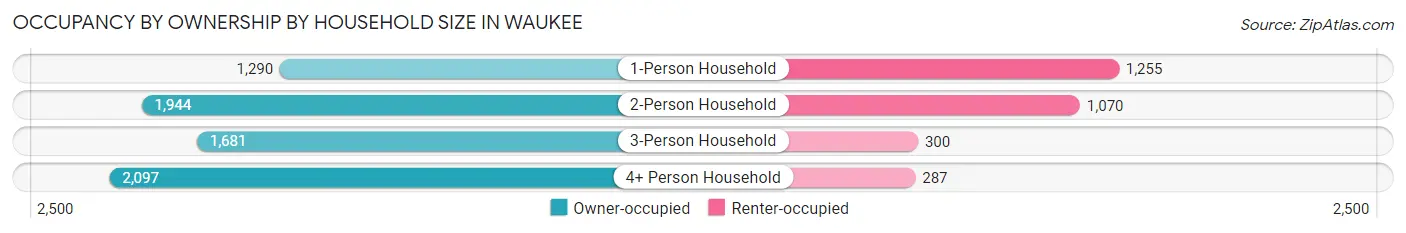
| Household Size | Owner-occupied | Renter-occupied |
| 1-Person Household | 1,290 (50.7%) | 1,255 (49.3%) |
| 2-Person Household | 1,944 (64.5%) | 1,070 (35.5%) |
| 3-Person Household | 1,681 (84.9%) | 300 (15.1%) |
| 4+ Person Household | 2,097 (88.0%) | 287 (12.0%) |
| Total Housing Units | 7,012 (70.7%) | 2,912 (29.3%) |
Occupancy by Educational Attainment in Waukee
| Household Size | Owner-occupied | Renter-occupied |
| Less than High School | 35 (31.0%) | 78 (69.0%) |
| High School Diploma | 827 (59.9%) | 554 (40.1%) |
| College/Associate Degree | 1,476 (54.6%) | 1,226 (45.4%) |
| Bachelor's Degree or higher | 4,674 (81.6%) | 1,054 (18.4%) |
Occupancy by Age of Householder in Waukee
| Age Bracket | # Households | % Households |
| Under 35 Years | 2,701 | 27.2% |
| 35 to 44 Years | 2,515 | 25.3% |
| 45 to 54 Years | 1,801 | 18.1% |
| 55 to 64 Years | 1,257 | 12.7% |
| 65 to 74 Years | 930 | 9.4% |
| 75 to 84 Years | 538 | 5.4% |
| 85 Years and Over | 182 | 1.8% |
| Total | 9,924 | 100.0% |
Housing Finances in Waukee
Median Income by Occupancy in Waukee
| Occupancy Type | # Households | Median Income |
| Owner-Occupied | 7,012 (70.7%) | $135,091 |
| Renter-Occupied | 2,912 (29.3%) | $61,147 |
| Average | 9,924 (100.0%) | $106,846 |
Occupancy by Householder Income Bracket in Waukee
| Income Bracket | Owner-occupied | Renter-occupied |
| Less than $5,000 | 131 (1.9%) | 57 (2.0%) |
| $5,000 to $9,999 | 54 (0.8%) | 31 (1.1%) |
| $10,000 to $14,999 | 67 (1.0%) | 99 (3.4%) |
| $15,000 to $19,999 | 51 (0.7%) | 192 (6.6%) |
| $20,000 to $24,999 | 62 (0.9%) | 116 (4.0%) |
| $25,000 to $34,999 | 112 (1.6%) | 257 (8.8%) |
| $35,000 to $49,999 | 511 (7.3%) | 292 (10.0%) |
| $50,000 to $74,999 | 853 (12.2%) | 807 (27.7%) |
| $75,000 to $99,999 | 677 (9.7%) | 345 (11.8%) |
| $100,000 to $149,999 | 1,484 (21.2%) | 540 (18.5%) |
| $150,000 or more | 3,010 (42.9%) | 176 (6.0%) |
| Total | 7,012 (100.0%) | 2,912 (100.0%) |
Monthly Housing Cost Tiers in Waukee
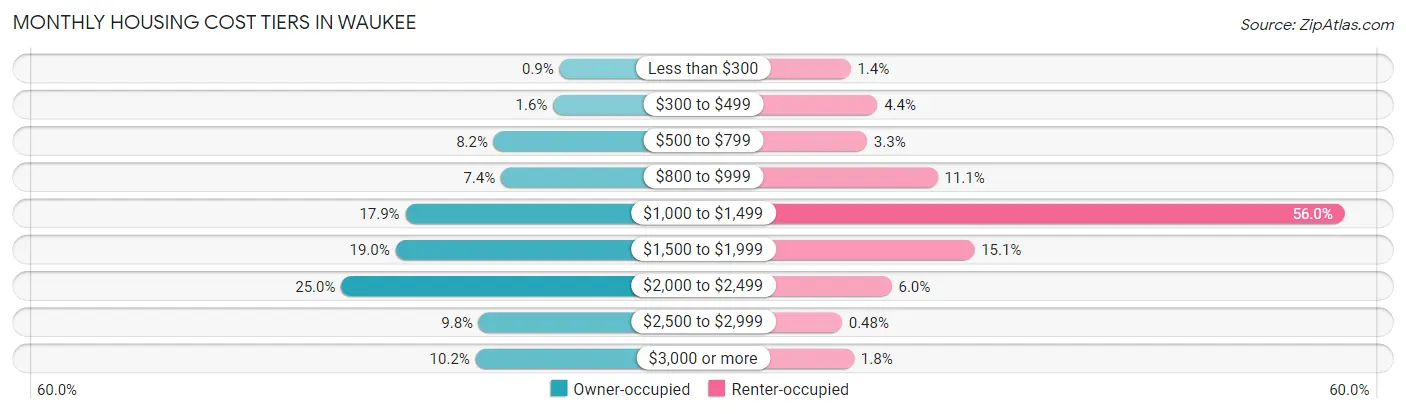
| Monthly Cost | Owner-occupied | Renter-occupied |
| Less than $300 | 63 (0.9%) | 42 (1.4%) |
| $300 to $499 | 113 (1.6%) | 128 (4.4%) |
| $500 to $799 | 573 (8.2%) | 95 (3.3%) |
| $800 to $999 | 517 (7.4%) | 322 (11.1%) |
| $1,000 to $1,499 | 1,257 (17.9%) | 1,632 (56.0%) |
| $1,500 to $1,999 | 1,334 (19.0%) | 440 (15.1%) |
| $2,000 to $2,499 | 1,754 (25.0%) | 174 (6.0%) |
| $2,500 to $2,999 | 688 (9.8%) | 14 (0.5%) |
| $3,000 or more | 713 (10.2%) | 53 (1.8%) |
| Total | 7,012 (100.0%) | 2,912 (100.0%) |
Physical Housing Characteristics in Waukee
Housing Structures in Waukee
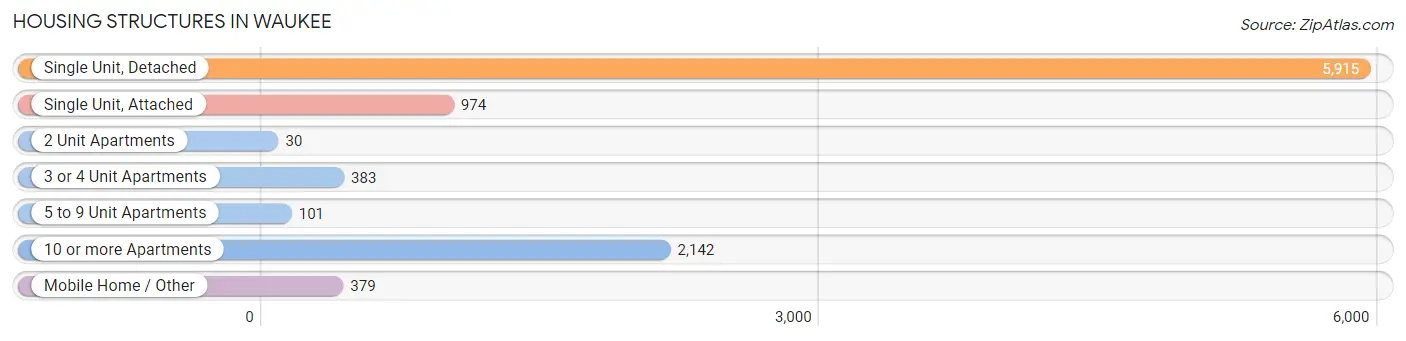
| Structure Type | # Housing Units | % Housing Units |
| Single Unit, Detached | 5,915 | 59.6% |
| Single Unit, Attached | 974 | 9.8% |
| 2 Unit Apartments | 30 | 0.3% |
| 3 or 4 Unit Apartments | 383 | 3.9% |
| 5 to 9 Unit Apartments | 101 | 1.0% |
| 10 or more Apartments | 2,142 | 21.6% |
| Mobile Home / Other | 379 | 3.8% |
| Total | 9,924 | 100.0% |
Housing Structures by Occupancy in Waukee
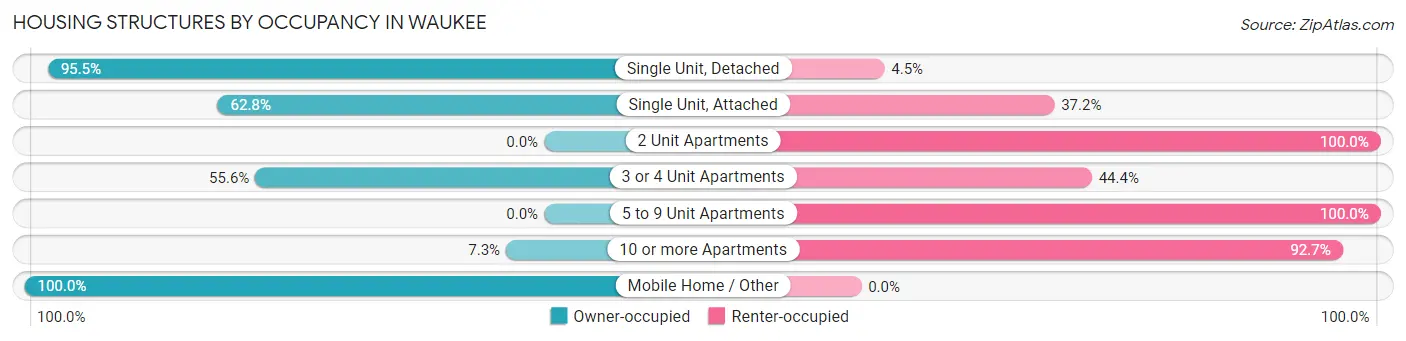
| Structure Type | Owner-occupied | Renter-occupied |
| Single Unit, Detached | 5,651 (95.5%) | 264 (4.5%) |
| Single Unit, Attached | 612 (62.8%) | 362 (37.2%) |
| 2 Unit Apartments | 0 (0.0%) | 30 (100.0%) |
| 3 or 4 Unit Apartments | 213 (55.6%) | 170 (44.4%) |
| 5 to 9 Unit Apartments | 0 (0.0%) | 101 (100.0%) |
| 10 or more Apartments | 157 (7.3%) | 1,985 (92.7%) |
| Mobile Home / Other | 379 (100.0%) | 0 (0.0%) |
| Total | 7,012 (70.7%) | 2,912 (29.3%) |
Housing Structures by Number of Rooms in Waukee
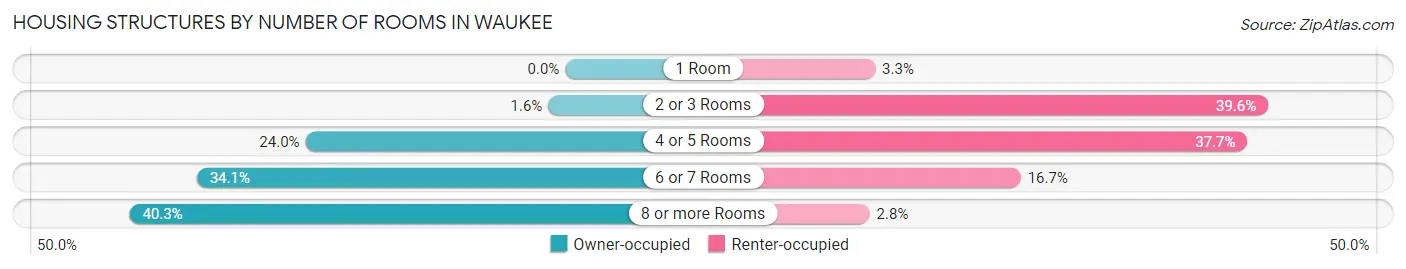
| Number of Rooms | Owner-occupied | Renter-occupied |
| 1 Room | 0 (0.0%) | 95 (3.3%) |
| 2 or 3 Rooms | 111 (1.6%) | 1,153 (39.6%) |
| 4 or 5 Rooms | 1,685 (24.0%) | 1,097 (37.7%) |
| 6 or 7 Rooms | 2,390 (34.1%) | 487 (16.7%) |
| 8 or more Rooms | 2,826 (40.3%) | 80 (2.8%) |
| Total | 7,012 (100.0%) | 2,912 (100.0%) |
Housing Structure by Heating Type in Waukee
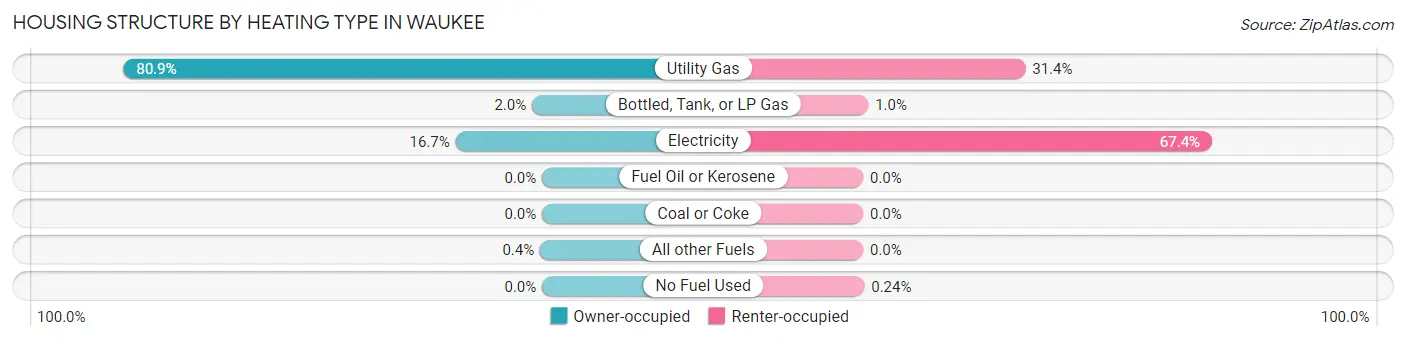
| Heating Type | Owner-occupied | Renter-occupied |
| Utility Gas | 5,674 (80.9%) | 913 (31.4%) |
| Bottled, Tank, or LP Gas | 137 (1.9%) | 29 (1.0%) |
| Electricity | 1,173 (16.7%) | 1,963 (67.4%) |
| Fuel Oil or Kerosene | 0 (0.0%) | 0 (0.0%) |
| Coal or Coke | 0 (0.0%) | 0 (0.0%) |
| All other Fuels | 28 (0.4%) | 0 (0.0%) |
| No Fuel Used | 0 (0.0%) | 7 (0.2%) |
| Total | 7,012 (100.0%) | 2,912 (100.0%) |
Household Vehicle Usage in Waukee
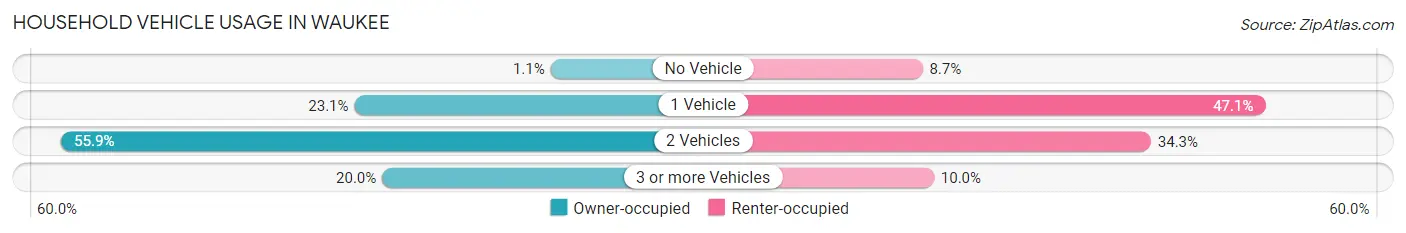
| Vehicles per Household | Owner-occupied | Renter-occupied |
| No Vehicle | 76 (1.1%) | 253 (8.7%) |
| 1 Vehicle | 1,617 (23.1%) | 1,371 (47.1%) |
| 2 Vehicles | 3,920 (55.9%) | 998 (34.3%) |
| 3 or more Vehicles | 1,399 (20.0%) | 290 (10.0%) |
| Total | 7,012 (100.0%) | 2,912 (100.0%) |
Real Estate & Mortgages in Waukee
Real Estate and Mortgage Overview in Waukee
| Characteristic | Without Mortgage | With Mortgage |
| Housing Units | 1,349 | 5,663 |
| Median Property Value | $279,300 | $312,400 |
| Median Household Income | $87,161 | $2,566 |
| Monthly Housing Costs | $811 | $680 |
| Real Estate Taxes | $4,989 | $209 |
Property Value by Mortgage Status in Waukee
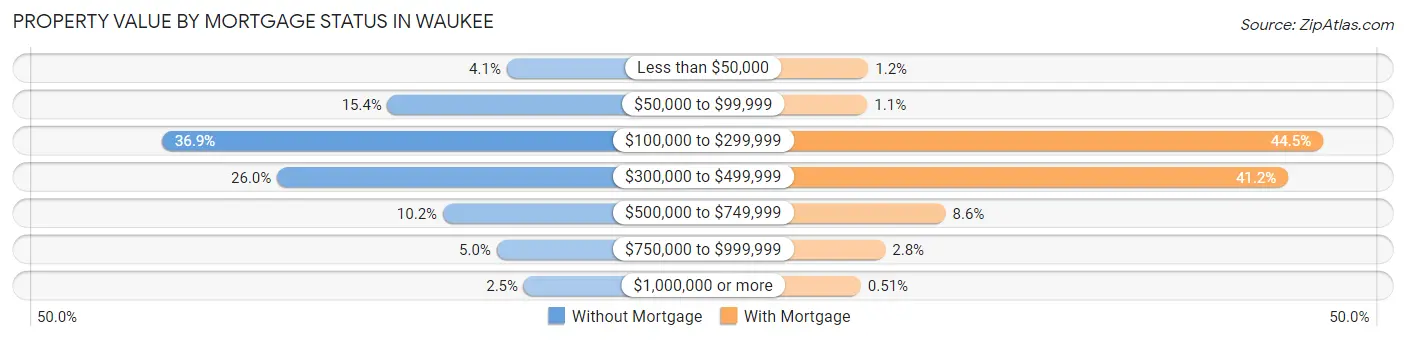
| Property Value | Without Mortgage | With Mortgage |
| Less than $50,000 | 55 (4.1%) | 69 (1.2%) |
| $50,000 to $99,999 | 208 (15.4%) | 64 (1.1%) |
| $100,000 to $299,999 | 498 (36.9%) | 2,521 (44.5%) |
| $300,000 to $499,999 | 350 (26.0%) | 2,333 (41.2%) |
| $500,000 to $749,999 | 137 (10.2%) | 486 (8.6%) |
| $750,000 to $999,999 | 68 (5.0%) | 161 (2.8%) |
| $1,000,000 or more | 33 (2.5%) | 29 (0.5%) |
| Total | 1,349 (100.0%) | 5,663 (100.0%) |
Household Income by Mortgage Status in Waukee
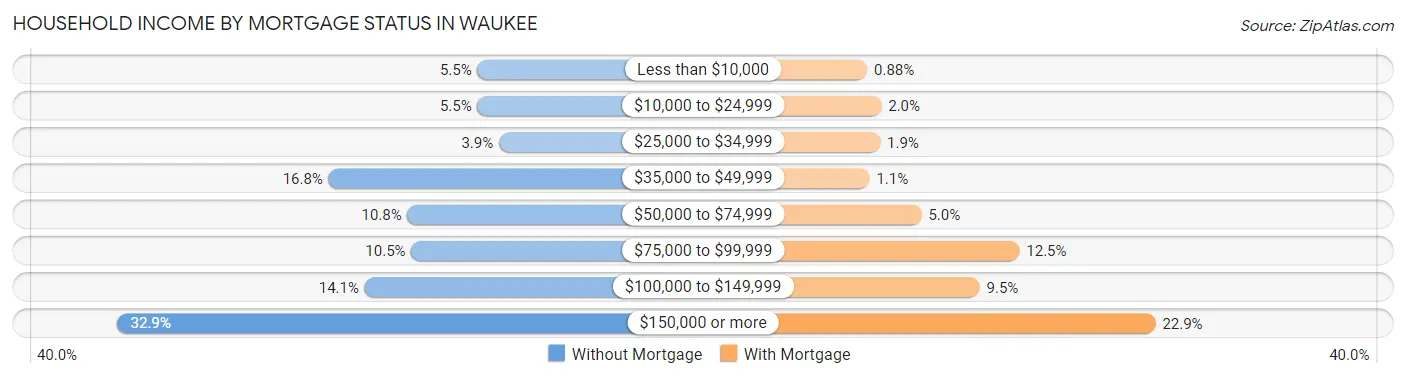
| Household Income | Without Mortgage | With Mortgage |
| Less than $10,000 | 74 (5.5%) | 50 (0.9%) |
| $10,000 to $24,999 | 74 (5.5%) | 111 (2.0%) |
| $25,000 to $34,999 | 52 (3.8%) | 106 (1.9%) |
| $35,000 to $49,999 | 227 (16.8%) | 60 (1.1%) |
| $50,000 to $74,999 | 146 (10.8%) | 284 (5.0%) |
| $75,000 to $99,999 | 142 (10.5%) | 707 (12.5%) |
| $100,000 to $149,999 | 190 (14.1%) | 535 (9.5%) |
| $150,000 or more | 444 (32.9%) | 1,294 (22.9%) |
| Total | 1,349 (100.0%) | 5,663 (100.0%) |
Property Value to Household Income Ratio in Waukee
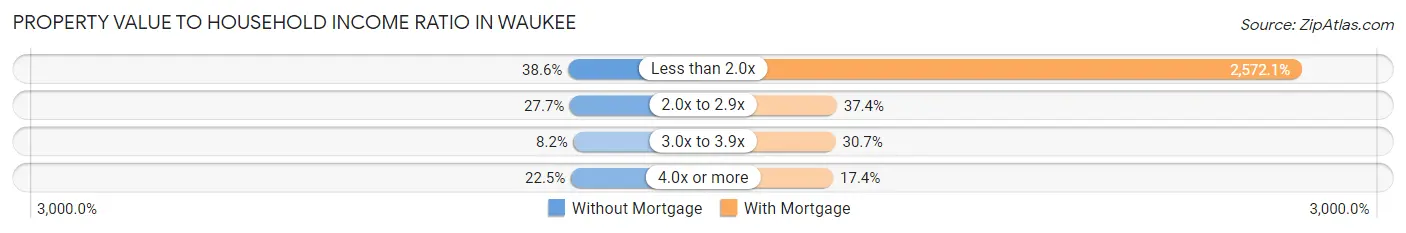
| Value-to-Income Ratio | Without Mortgage | With Mortgage |
| Less than 2.0x | 520 (38.6%) | 145,655 (2,572.1%) |
| 2.0x to 2.9x | 374 (27.7%) | 2,118 (37.4%) |
| 3.0x to 3.9x | 111 (8.2%) | 1,740 (30.7%) |
| 4.0x or more | 303 (22.5%) | 984 (17.4%) |
| Total | 1,349 (100.0%) | 5,663 (100.0%) |
Real Estate Taxes by Mortgage Status in Waukee
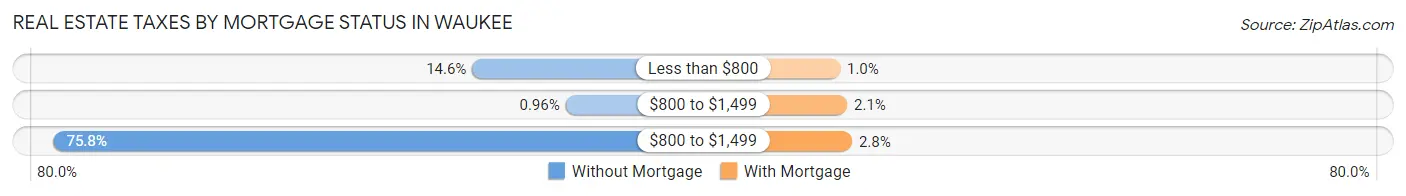
| Property Taxes | Without Mortgage | With Mortgage |
| Less than $800 | 197 (14.6%) | 58 (1.0%) |
| $800 to $1,499 | 13 (1.0%) | 116 (2.1%) |
| $800 to $1,499 | 1,022 (75.8%) | 157 (2.8%) |
| Total | 1,349 (100.0%) | 5,663 (100.0%) |
Health & Disability in Waukee
Health Insurance Coverage by Age in Waukee
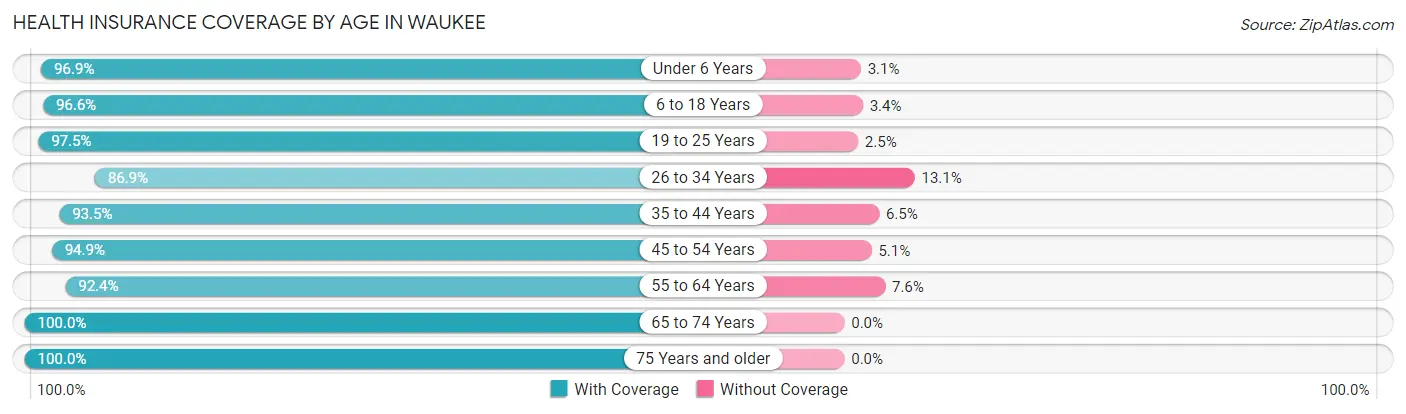
| Age Bracket | With Coverage | Without Coverage |
| Under 6 Years | 2,309 (96.9%) | 73 (3.1%) |
| 6 to 18 Years | 5,016 (96.6%) | 178 (3.4%) |
| 19 to 25 Years | 1,842 (97.5%) | 48 (2.5%) |
| 26 to 34 Years | 2,984 (86.9%) | 450 (13.1%) |
| 35 to 44 Years | 3,910 (93.5%) | 270 (6.5%) |
| 45 to 54 Years | 3,150 (94.9%) | 168 (5.1%) |
| 55 to 64 Years | 1,957 (92.4%) | 161 (7.6%) |
| 65 to 74 Years | 1,487 (100.0%) | 0 (0.0%) |
| 75 Years and older | 977 (100.0%) | 0 (0.0%) |
| Total | 23,632 (94.6%) | 1,348 (5.4%) |
Health Insurance Coverage by Citizenship Status in Waukee
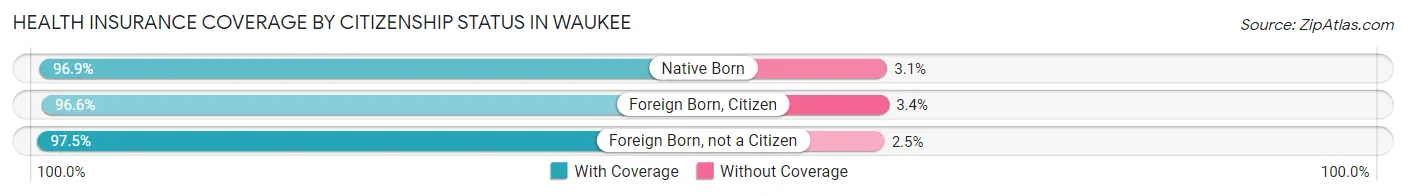
| Citizenship Status | With Coverage | Without Coverage |
| Native Born | 2,309 (96.9%) | 73 (3.1%) |
| Foreign Born, Citizen | 5,016 (96.6%) | 178 (3.4%) |
| Foreign Born, not a Citizen | 1,842 (97.5%) | 48 (2.5%) |
Health Insurance Coverage by Household Income in Waukee
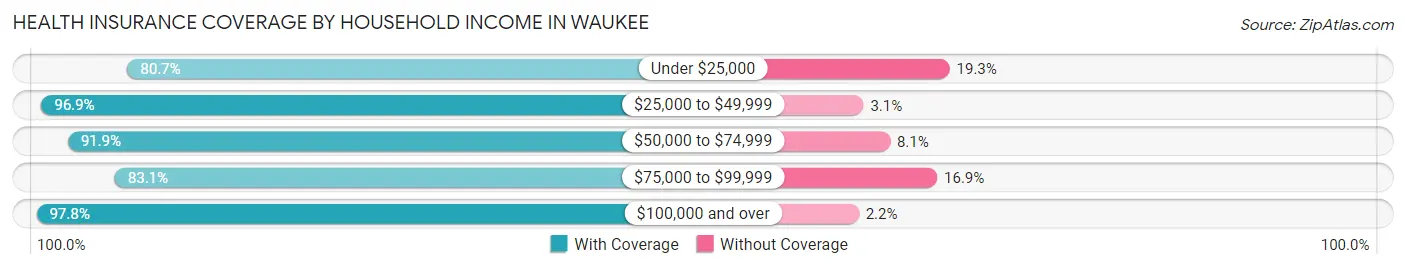
| Household Income | With Coverage | Without Coverage |
| Under $25,000 | 1,094 (80.7%) | 261 (19.3%) |
| $25,000 to $49,999 | 1,917 (96.9%) | 62 (3.1%) |
| $50,000 to $74,999 | 2,986 (91.9%) | 263 (8.1%) |
| $75,000 to $99,999 | 1,989 (83.1%) | 405 (16.9%) |
| $100,000 and over | 15,646 (97.8%) | 357 (2.2%) |
Public vs Private Health Insurance Coverage by Age in Waukee
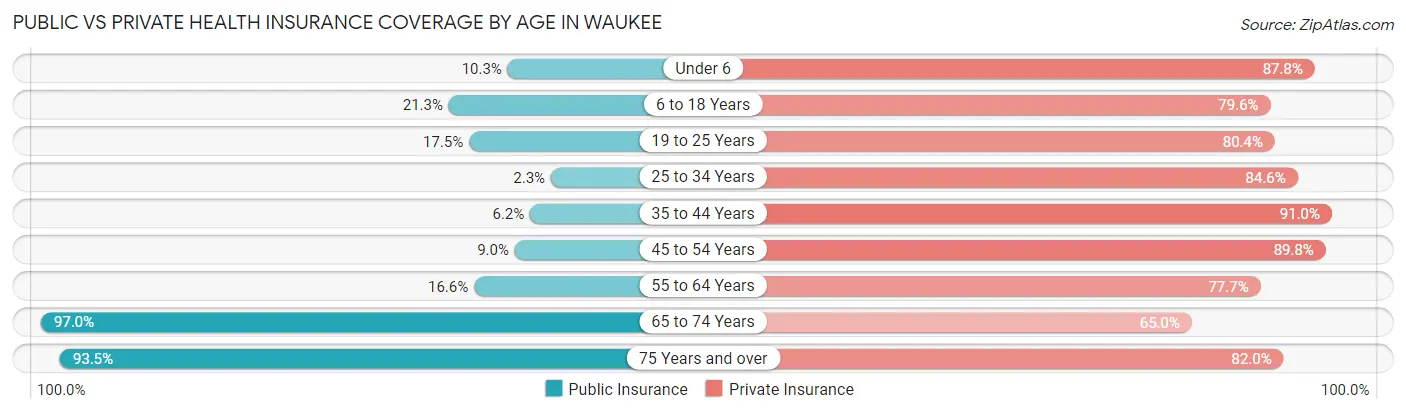
| Age Bracket | Public Insurance | Private Insurance |
| Under 6 | 246 (10.3%) | 2,091 (87.8%) |
| 6 to 18 Years | 1,104 (21.3%) | 4,132 (79.5%) |
| 19 to 25 Years | 331 (17.5%) | 1,519 (80.4%) |
| 25 to 34 Years | 79 (2.3%) | 2,905 (84.6%) |
| 35 to 44 Years | 258 (6.2%) | 3,802 (91.0%) |
| 45 to 54 Years | 299 (9.0%) | 2,980 (89.8%) |
| 55 to 64 Years | 351 (16.6%) | 1,646 (77.7%) |
| 65 to 74 Years | 1,442 (97.0%) | 966 (65.0%) |
| 75 Years and over | 913 (93.4%) | 801 (82.0%) |
| Total | 5,023 (20.1%) | 20,842 (83.4%) |
Disability Status by Sex by Age in Waukee
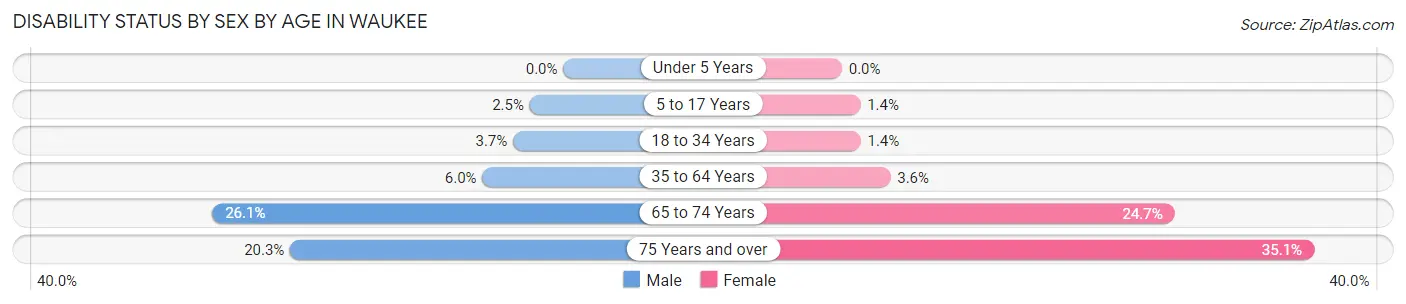
| Age Bracket | Male | Female |
| Under 5 Years | 0 (0.0%) | 0 (0.0%) |
| 5 to 17 Years | 67 (2.5%) | 35 (1.4%) |
| 18 to 34 Years | 106 (3.7%) | 38 (1.4%) |
| 35 to 64 Years | 286 (6.0%) | 175 (3.6%) |
| 65 to 74 Years | 146 (26.1%) | 229 (24.7%) |
| 75 Years and over | 72 (20.3%) | 218 (35.0%) |
Disability Class by Sex by Age in Waukee
Disability Class: Hearing Difficulty
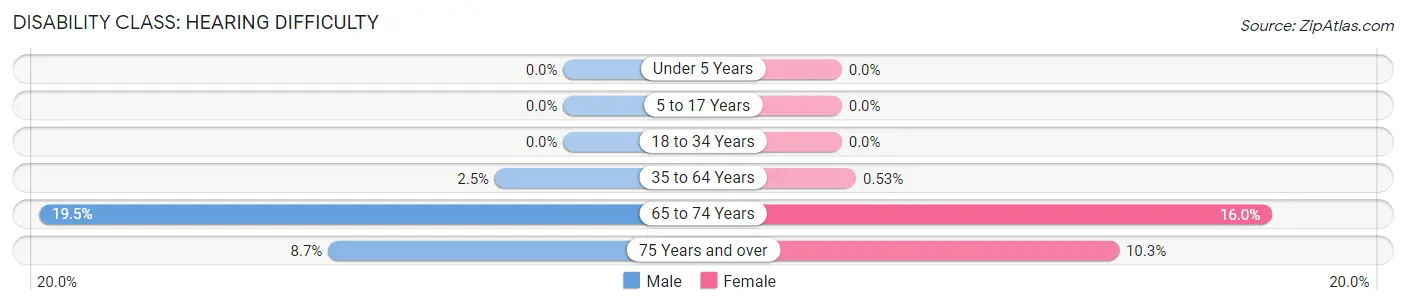
| Age Bracket | Male | Female |
| Under 5 Years | 0 (0.0%) | 0 (0.0%) |
| 5 to 17 Years | 0 (0.0%) | 0 (0.0%) |
| 18 to 34 Years | 0 (0.0%) | 0 (0.0%) |
| 35 to 64 Years | 121 (2.5%) | 26 (0.5%) |
| 65 to 74 Years | 109 (19.5%) | 148 (16.0%) |
| 75 Years and over | 31 (8.7%) | 64 (10.3%) |
Disability Class: Vision Difficulty
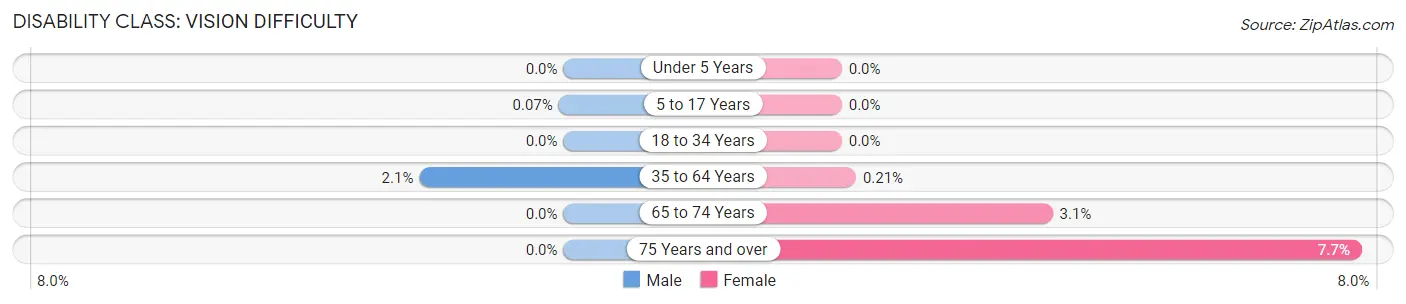
| Age Bracket | Male | Female |
| Under 5 Years | 0 (0.0%) | 0 (0.0%) |
| 5 to 17 Years | 2 (0.1%) | 0 (0.0%) |
| 18 to 34 Years | 0 (0.0%) | 0 (0.0%) |
| 35 to 64 Years | 102 (2.1%) | 10 (0.2%) |
| 65 to 74 Years | 0 (0.0%) | 29 (3.1%) |
| 75 Years and over | 0 (0.0%) | 48 (7.7%) |
Disability Class: Cognitive Difficulty
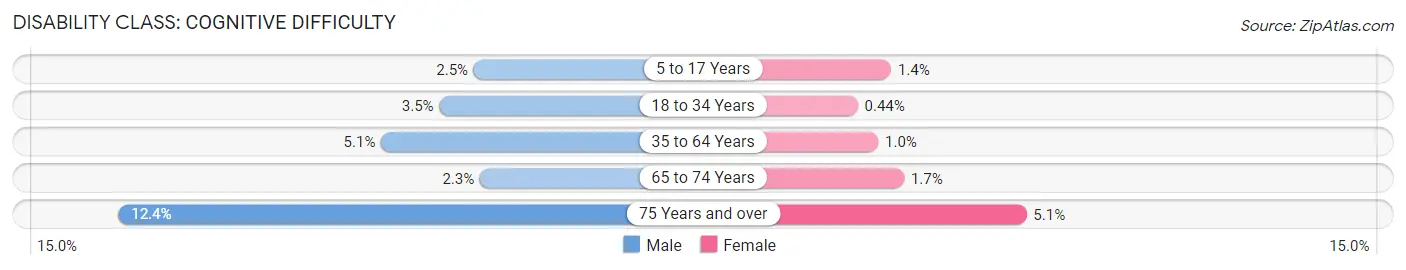
| Age Bracket | Male | Female |
| 5 to 17 Years | 67 (2.5%) | 35 (1.4%) |
| 18 to 34 Years | 98 (3.5%) | 12 (0.4%) |
| 35 to 64 Years | 241 (5.1%) | 49 (1.0%) |
| 65 to 74 Years | 13 (2.3%) | 16 (1.7%) |
| 75 Years and over | 44 (12.4%) | 32 (5.1%) |
Disability Class: Ambulatory Difficulty
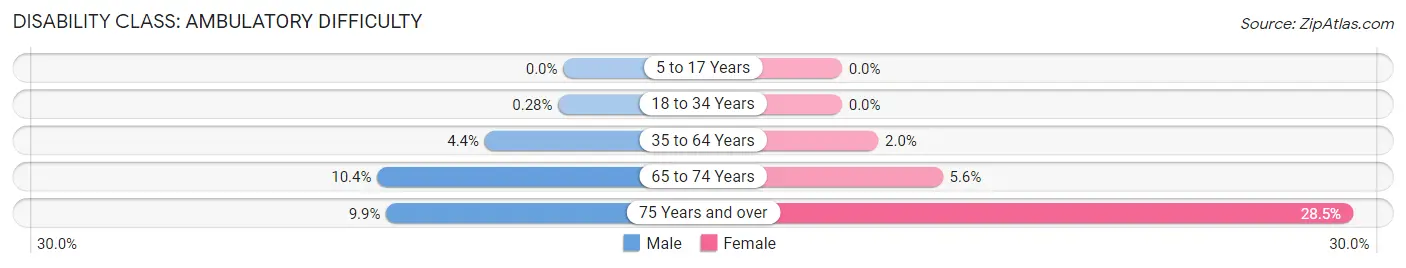
| Age Bracket | Male | Female |
| 5 to 17 Years | 0 (0.0%) | 0 (0.0%) |
| 18 to 34 Years | 8 (0.3%) | 0 (0.0%) |
| 35 to 64 Years | 208 (4.4%) | 98 (2.0%) |
| 65 to 74 Years | 58 (10.4%) | 52 (5.6%) |
| 75 Years and over | 35 (9.9%) | 177 (28.5%) |
Disability Class: Self-Care Difficulty
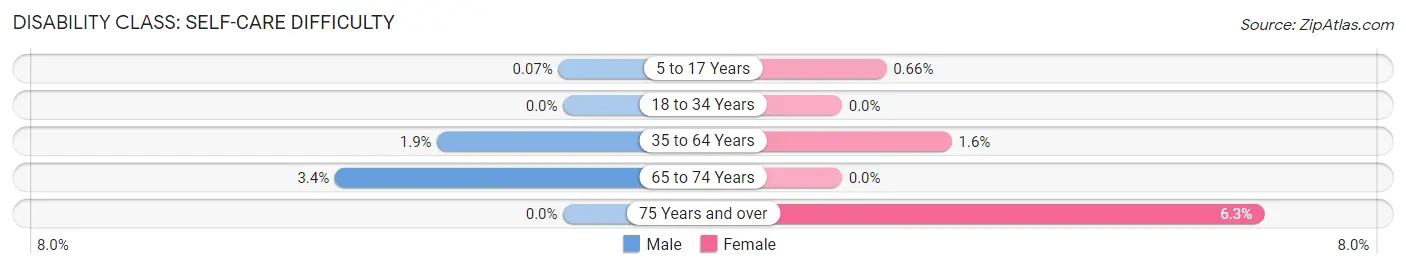
| Age Bracket | Male | Female |
| 5 to 17 Years | 2 (0.1%) | 17 (0.7%) |
| 18 to 34 Years | 0 (0.0%) | 0 (0.0%) |
| 35 to 64 Years | 89 (1.9%) | 79 (1.6%) |
| 65 to 74 Years | 19 (3.4%) | 0 (0.0%) |
| 75 Years and over | 0 (0.0%) | 39 (6.3%) |
Technology Access in Waukee
Computing Device Access in Waukee
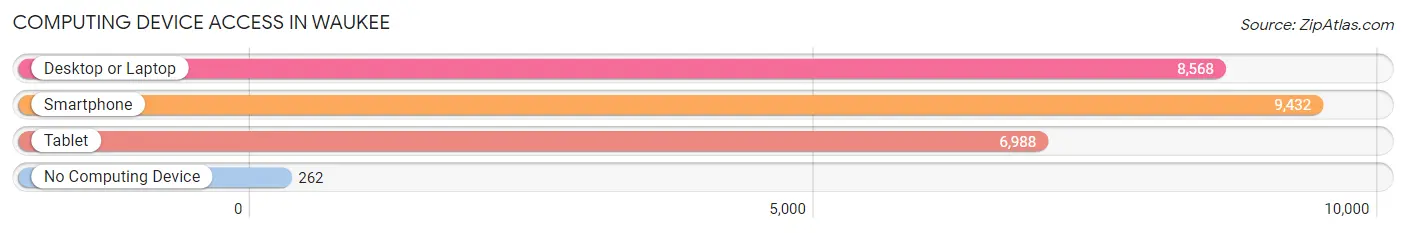
| Device Type | # Households | % Households |
| Desktop or Laptop | 8,568 | 86.3% |
| Smartphone | 9,432 | 95.0% |
| Tablet | 6,988 | 70.4% |
| No Computing Device | 262 | 2.6% |
| Total | 9,924 | 100.0% |
Internet Access in Waukee
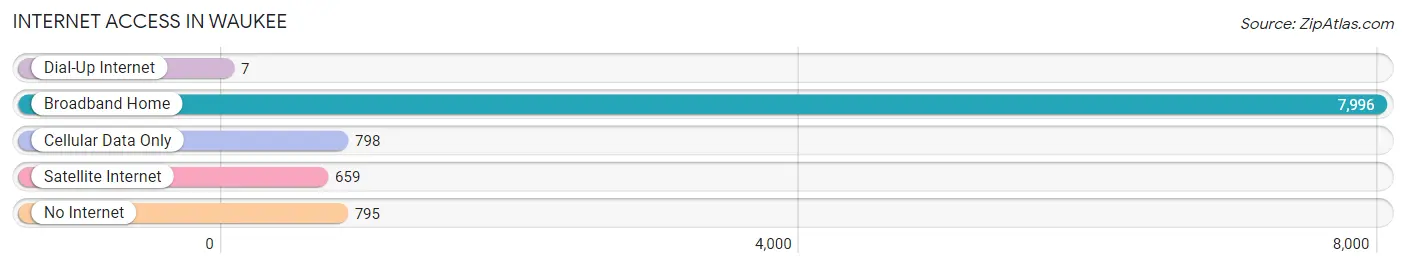
| Internet Type | # Households | % Households |
| Dial-Up Internet | 7 | 0.1% |
| Broadband Home | 7,996 | 80.6% |
| Cellular Data Only | 798 | 8.0% |
| Satellite Internet | 659 | 6.6% |
| No Internet | 795 | 8.0% |
| Total | 9,924 | 100.0% |
Waukee Summary
Waukee, Iowa is a city located in Dallas County, Iowa, United States. It is part of the Des Moines–West Des Moines Metropolitan Statistical Area. The population was 17,043 at the 2010 census, an increase of 169.2% from the 2000 census.
History
The area that is now Waukee was first settled in 1845 by a group of settlers from Pennsylvania. The town was originally called Waukeetown, after the Waukee Indians who lived in the area. The town was officially incorporated in 1876.
In the early 1900s, Waukee was a small farming community. The town was known for its large grain elevators and its many churches. In the 1950s, Waukee began to experience a population boom as people moved to the area from other parts of Iowa and the Midwest.
Geography
Waukee is located at 41°35′N 93°48′W (41.58, -93.80). According to the United States Census Bureau, the city has a total area of 11.2 square miles (29.0 km2), all of it land.
Economy
Waukee is a growing city with a diverse economy. The city is home to several large employers, including Hy-Vee, Wells Fargo, and John Deere. The city also has a thriving retail sector, with several large shopping centers and a variety of restaurants.
The city is also home to several technology companies, including Microsoft, Google, and Apple. The city is also home to several medical facilities, including MercyOne Waukee Medical Center and the Waukee Family Health Center.
Demographics
As of the 2010 census, there were 17,043 people, 6,541 households, and 4,717 families residing in the city. The population density was 1,521.3 people per square mile (586.3/km2). There were 6,890 housing units at an average density of 615.3 per square mile (237.2/km2). The racial makeup of the city was 90.2% White, 2.3% African American, 0.3% Native American, 4.2% Asian, 0.7% from other races, and 2.5% from two or more races. Hispanic or Latino of any race were 2.9% of the population.
There were 6,541 households, out of which 37.2% had children under the age of 18 living with them, 58.2% were married couples living together, 8.7% had a female householder with no husband present, and 29.3% were non-families. 24.2% of all households were made up of individuals, and 8.2% had someone living alone who was 65 years of age or older. The average household size was 2.60 and the average family size was 3.12.
In the city, the population was spread out, with 28.2% under the age of 18, 6.7% from 18 to 24, 32.2% from 25 to 44, 22.2% from 45 to 64, and 10.7% who were 65 years of age or older. The median age was 36 years. For every 100 females, there were 95.2 males. For every 100 females age 18 and over, there were 92.2 males.
The median income for a household in the city was $62,917, and the median income for a family was $72,917. Males had a median income of $50,000 versus $35,000 for females. The per capita income for the city was $27,917. About 3.2% of families and 4.7% of the population were below the poverty line, including 5.3% of those under age 18 and 4.2% of those age 65 or over.
Common Questions
What is the Total Population of Waukee?
Total Population of Waukee is 25,045.
What is the Total Male Population of Waukee?
Total Male Population of Waukee is 12,385.
What is the Total Female Population of Waukee?
Total Female Population of Waukee is 12,660.
What is the Ratio of Males per 100 Females in Waukee?
There are 97.83 Males per 100 Females in Waukee.
What is the Ratio of Females per 100 Males in Waukee?
There are 102.22 Females per 100 Males in Waukee.
What is the Median Population Age in Waukee?
Median Population Age in Waukee is 34.3 Years.
What is the Average Family Size in Waukee
Average Family Size in Waukee is 3.1 People.
What is the Average Household Size in Waukee
Average Household Size in Waukee is 2.5 People.
What is Per Capita Income in Waukee?
Per Capita income in Waukee is $51,536.
What is the Median Family Income in Waukee?
Median Family Income in Waukee is $146,357.
What is the Median Household income in Waukee?
Median Household Income in Waukee is $106,846.
What is Income or Wage Gap in Waukee?
Income or Wage Gap in Waukee is 31.1%.
Women in Waukee earn 68.9 cents for every dollar earned by a man.
What is Family Income Deficit in Waukee?
Family Income Deficit in Waukee is $10,117.
Families that are below poverty line in Waukee earn $10,117 less on average than the poverty threshold level.
What is Inequality or Gini Index in Waukee?
Inequality or Gini Index in Waukee is 0.42.
How Large is the Labor Force in Waukee?
There are 14,559 People in the Labor Forcein in Waukee.
What is the Percentage of People in the Labor Force in Waukee?
79.4% of People are in the Labor Force in Waukee.
What is the Unemployment Rate in Waukee?
Unemployment Rate in Waukee is 3.1%.