Cities with the Highest Percentage of Population Employed in Legal Services & Support in Iowa
RELATED REPORTS & OPTIONS
Legal Services & Support
Iowa
Compare Cities
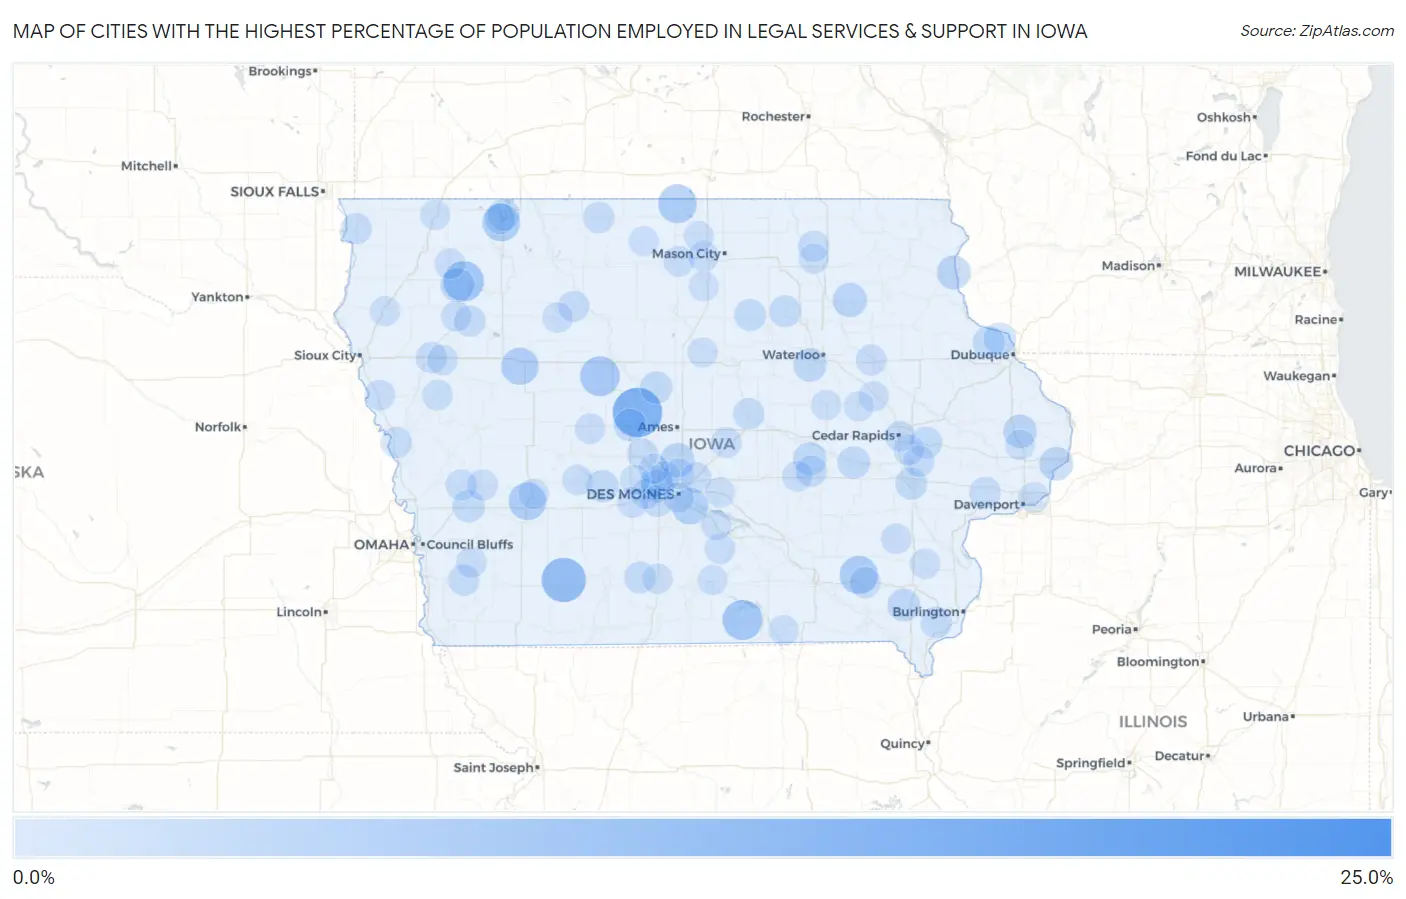
Map of Cities with the Highest Percentage of Population Employed in Legal Services & Support in Iowa
0.0%
25.0%
Cities with the Highest Percentage of Population Employed in Legal Services & Support in Iowa
| City | % Employed | vs State | vs National | |
| 1. | Wever | 22.2% | 0.75%(+21.5)#1 | 1.2%(+21.0)#47 |
| 2. | Fraser | 13.0% | 0.75%(+12.3)#2 | 1.2%(+11.9)#141 |
| 3. | Prescott | 9.8% | 0.75%(+9.04)#3 | 1.2%(+8.61)#237 |
| 4. | Sutherland | 7.3% | 0.75%(+6.60)#4 | 1.2%(+6.16)#399 |
| 5. | Plano | 7.1% | 0.75%(+6.40)#5 | 1.2%(+5.96)#429 |
| 6. | Callender | 6.9% | 0.75%(+6.19)#6 | 1.2%(+5.75)#448 |
| 7. | Scarville | 6.2% | 0.75%(+5.50)#7 | 1.2%(+5.07)#561 |
| 8. | Maharishi Vedic City | 5.9% | 0.75%(+5.20)#8 | 1.2%(+4.76)#616 |
| 9. | Brayton | 5.7% | 0.75%(+4.97)#9 | 1.2%(+4.53)#660 |
| 10. | West Okoboji | 5.7% | 0.75%(+4.93)#10 | 1.2%(+4.49)#666 |
| 11. | Sac City | 5.4% | 0.75%(+4.68)#11 | 1.2%(+4.24)#725 |
| 12. | Carlisle | 4.9% | 0.75%(+4.16)#12 | 1.2%(+3.72)#866 |
| 13. | Alleman | 3.6% | 0.75%(+2.83)#13 | 1.2%(+2.39)#1,482 |
| 14. | Sumner | 3.6% | 0.75%(+2.82)#14 | 1.2%(+2.38)#1,494 |
| 15. | Calumet | 3.4% | 0.75%(+2.70)#15 | 1.2%(+2.26)#1,573 |
| 16. | Mcgregor | 3.4% | 0.75%(+2.68)#16 | 1.2%(+2.24)#1,589 |
| 17. | Camanche | 3.3% | 0.75%(+2.52)#17 | 1.2%(+2.08)#1,707 |
| 18. | Delmar | 3.2% | 0.75%(+2.43)#18 | 1.2%(+1.99)#1,780 |
| 19. | Holiday Lake | 3.1% | 0.75%(+2.32)#19 | 1.2%(+1.88)#1,865 |
| 20. | Hudson | 3.0% | 0.75%(+2.25)#20 | 1.2%(+1.82)#1,932 |
| 21. | Salem | 2.8% | 0.75%(+2.07)#21 | 1.2%(+1.63)#2,107 |
| 22. | Ogden | 2.6% | 0.75%(+1.89)#22 | 1.2%(+1.45)#2,296 |
| 23. | Marengo | 2.6% | 0.75%(+1.89)#23 | 1.2%(+1.45)#2,297 |
| 24. | Linden | 2.6% | 0.75%(+1.89)#24 | 1.2%(+1.45)#2,303 |
| 25. | Stanhope | 2.6% | 0.75%(+1.88)#25 | 1.2%(+1.44)#2,318 |
| 26. | Urbandale | 2.6% | 0.75%(+1.86)#26 | 1.2%(+1.42)#2,338 |
| 27. | Shelby | 2.5% | 0.75%(+1.78)#27 | 1.2%(+1.34)#2,426 |
| 28. | Sherrill | 2.5% | 0.75%(+1.71)#28 | 1.2%(+1.28)#2,493 |
| 29. | Rickardsville | 2.4% | 0.75%(+1.67)#29 | 1.2%(+1.24)#2,557 |
| 30. | University Heights | 2.3% | 0.75%(+1.56)#30 | 1.2%(+1.13)#2,707 |
| 31. | Dumont | 2.3% | 0.75%(+1.53)#31 | 1.2%(+1.09)#2,756 |
| 32. | Grimes | 2.2% | 0.75%(+1.44)#32 | 1.2%(+1.00)#2,893 |
| 33. | Mount Vernon | 2.2% | 0.75%(+1.43)#33 | 1.2%(+0.995)#2,903 |
| 34. | Clarksville | 2.2% | 0.75%(+1.43)#34 | 1.2%(+0.990)#2,914 |
| 35. | Okoboji | 2.2% | 0.75%(+1.41)#35 | 1.2%(+0.969)#2,956 |
| 36. | Murray | 2.1% | 0.75%(+1.32)#36 | 1.2%(+0.881)#3,102 |
| 37. | Denmark | 2.1% | 0.75%(+1.31)#37 | 1.2%(+0.875)#3,112 |
| 38. | Solon | 2.0% | 0.75%(+1.23)#38 | 1.2%(+0.790)#3,266 |
| 39. | Swea City | 2.0% | 0.75%(+1.21)#39 | 1.2%(+0.771)#3,303 |
| 40. | Albion | 1.9% | 0.75%(+1.19)#40 | 1.2%(+0.750)#3,336 |
| 41. | Brooklyn | 1.9% | 0.75%(+1.18)#41 | 1.2%(+0.739)#3,354 |
| 42. | Durant | 1.9% | 0.75%(+1.15)#42 | 1.2%(+0.712)#3,410 |
| 43. | Hastings | 1.9% | 0.75%(+1.14)#43 | 1.2%(+0.703)#3,435 |
| 44. | Inwood | 1.9% | 0.75%(+1.14)#44 | 1.2%(+0.699)#3,444 |
| 45. | Portsmouth | 1.9% | 0.75%(+1.11)#45 | 1.2%(+0.668)#3,511 |
| 46. | Aurelia | 1.8% | 0.75%(+1.08)#46 | 1.2%(+0.645)#3,570 |
| 47. | Correctionville | 1.8% | 0.75%(+1.08)#47 | 1.2%(+0.641)#3,584 |
| 48. | Blencoe | 1.8% | 0.75%(+1.07)#48 | 1.2%(+0.634)#3,602 |
| 49. | Rolfe | 1.8% | 0.75%(+1.04)#49 | 1.2%(+0.602)#3,672 |
| 50. | West Des Moines | 1.8% | 0.75%(+1.03)#50 | 1.2%(+0.591)#3,701 |
| 51. | Alta Vista | 1.8% | 0.75%(+1.01)#51 | 1.2%(+0.571)#3,746 |
| 52. | Wahpeton | 1.7% | 0.75%(+0.979)#52 | 1.2%(+0.540)#3,814 |
| 53. | Fairfield | 1.7% | 0.75%(+0.976)#53 | 1.2%(+0.538)#3,826 |
| 54. | Independence | 1.7% | 0.75%(+0.948)#54 | 1.2%(+0.509)#3,907 |
| 55. | De Soto | 1.7% | 0.75%(+0.925)#55 | 1.2%(+0.486)#3,959 |
| 56. | Garner | 1.7% | 0.75%(+0.925)#56 | 1.2%(+0.486)#3,960 |
| 57. | Woodward | 1.7% | 0.75%(+0.921)#57 | 1.2%(+0.483)#3,971 |
| 58. | Harlan | 1.6% | 0.75%(+0.904)#58 | 1.2%(+0.465)#4,004 |
| 59. | Bettendorf | 1.6% | 0.75%(+0.903)#59 | 1.2%(+0.465)#4,006 |
| 60. | Primghar | 1.6% | 0.75%(+0.859)#60 | 1.2%(+0.420)#4,114 |
| 61. | Clear Lake | 1.6% | 0.75%(+0.842)#61 | 1.2%(+0.404)#4,151 |
| 62. | Rhodes | 1.6% | 0.75%(+0.805)#62 | 1.2%(+0.367)#4,250 |
| 63. | Sloan | 1.5% | 0.75%(+0.763)#63 | 1.2%(+0.325)#4,382 |
| 64. | Cushing | 1.5% | 0.75%(+0.747)#64 | 1.2%(+0.309)#4,432 |
| 65. | Guthrie Center | 1.5% | 0.75%(+0.732)#65 | 1.2%(+0.294)#4,485 |
| 66. | Danbury | 1.5% | 0.75%(+0.714)#66 | 1.2%(+0.276)#4,547 |
| 67. | Washington | 1.5% | 0.75%(+0.705)#67 | 1.2%(+0.267)#4,570 |
| 68. | Melcher Dallas | 1.4% | 0.75%(+0.704)#68 | 1.2%(+0.265)#4,575 |
| 69. | Henderson | 1.4% | 0.75%(+0.704)#69 | 1.2%(+0.265)#4,577 |
| 70. | Ely | 1.4% | 0.75%(+0.698)#70 | 1.2%(+0.259)#4,602 |
| 71. | Cherokee | 1.4% | 0.75%(+0.684)#71 | 1.2%(+0.245)#4,643 |
| 72. | Ankeny | 1.4% | 0.75%(+0.664)#72 | 1.2%(+0.225)#4,713 |
| 73. | Malcom | 1.4% | 0.75%(+0.653)#73 | 1.2%(+0.215)#4,752 |
| 74. | Cedar Rapids | 1.4% | 0.75%(+0.650)#74 | 1.2%(+0.212)#4,757 |
| 75. | Waukee | 1.4% | 0.75%(+0.643)#75 | 1.2%(+0.205)#4,781 |
| 76. | Bondurant | 1.4% | 0.75%(+0.636)#76 | 1.2%(+0.197)#4,803 |
| 77. | Jefferson | 1.4% | 0.75%(+0.628)#77 | 1.2%(+0.190)#4,828 |
| 78. | Pocahontas | 1.4% | 0.75%(+0.618)#78 | 1.2%(+0.179)#4,858 |
| 79. | Des Moines | 1.3% | 0.75%(+0.591)#79 | 1.2%(+0.153)#4,942 |
| 80. | Osceola | 1.3% | 0.75%(+0.575)#80 | 1.2%(+0.137)#5,002 |
| 81. | Exira | 1.3% | 0.75%(+0.570)#81 | 1.2%(+0.132)#5,015 |
| 82. | Winfield | 1.3% | 0.75%(+0.567)#82 | 1.2%(+0.129)#5,024 |
| 83. | Dysart | 1.3% | 0.75%(+0.563)#83 | 1.2%(+0.125)#5,033 |
| 84. | Pleasantville | 1.3% | 0.75%(+0.553)#84 | 1.2%(+0.115)#5,065 |
| 85. | North Washington | 1.3% | 0.75%(+0.553)#85 | 1.2%(+0.115)#5,070 |
| 86. | Johnston | 1.3% | 0.75%(+0.545)#86 | 1.2%(+0.107)#5,094 |
| 87. | Urbana | 1.3% | 0.75%(+0.526)#87 | 1.2%(+0.088)#5,158 |
| 88. | Le Mars | 1.3% | 0.75%(+0.524)#88 | 1.2%(+0.085)#5,168 |
| 89. | Granger | 1.3% | 0.75%(+0.519)#89 | 1.2%(+0.081)#5,194 |
| 90. | Thornton | 1.2% | 0.75%(+0.489)#90 | 1.2%(+0.051)#5,307 |
| 91. | Welton | 1.2% | 0.75%(+0.489)#91 | 1.2%(+0.051)#5,308 |
| 92. | Alden | 1.2% | 0.75%(+0.483)#92 | 1.2%(+0.045)#5,339 |
| 93. | Woden | 1.2% | 0.75%(+0.474)#93 | 1.2%(+0.036)#5,380 |
| 94. | Vinton | 1.2% | 0.75%(+0.470)#94 | 1.2%(+0.031)#5,396 |
| 95. | Moulton | 1.2% | 0.75%(+0.464)#95 | 1.2%(+0.026)#5,423 |
| 96. | Prairie City | 1.2% | 0.75%(+0.461)#96 | 1.2%(+0.022)#5,435 |
| 97. | Chariton | 1.2% | 0.75%(+0.446)#97 | 1.2%(+0.008)#5,481 |
| 98. | Dallas Center | 1.2% | 0.75%(+0.444)#98 | 1.2%(+0.005)#5,498 |
| 99. | Sibley | 1.2% | 0.75%(+0.430)#99 | 1.2%(-0.008)#5,541 |
| 100. | Fertile | 1.2% | 0.75%(+0.424)#100 | 1.2%(-0.014)#5,571 |
Common Questions
What are the Top 10 Cities with the Highest Percentage of Population Employed in Legal Services & Support in Iowa?
Top 10 Cities with the Highest Percentage of Population Employed in Legal Services & Support in Iowa are:
#1
13.0%
#2
9.8%
#3
7.3%
#4
7.1%
#5
6.9%
#6
6.2%
#7
5.9%
#8
5.7%
#9
5.7%
#10
5.4%
What city has the Highest Percentage of Population Employed in Legal Services & Support in Iowa?
Fraser has the Highest Percentage of Population Employed in Legal Services & Support in Iowa with 13.0%.
What is the Percentage of Population Employed in Legal Services & Support in the State of Iowa?
Percentage of Population Employed in Legal Services & Support in Iowa is 0.75%.
What is the Percentage of Population Employed in Legal Services & Support in the United States?
Percentage of Population Employed in Legal Services & Support in the United States is 1.2%.