Council Bluffs, IA
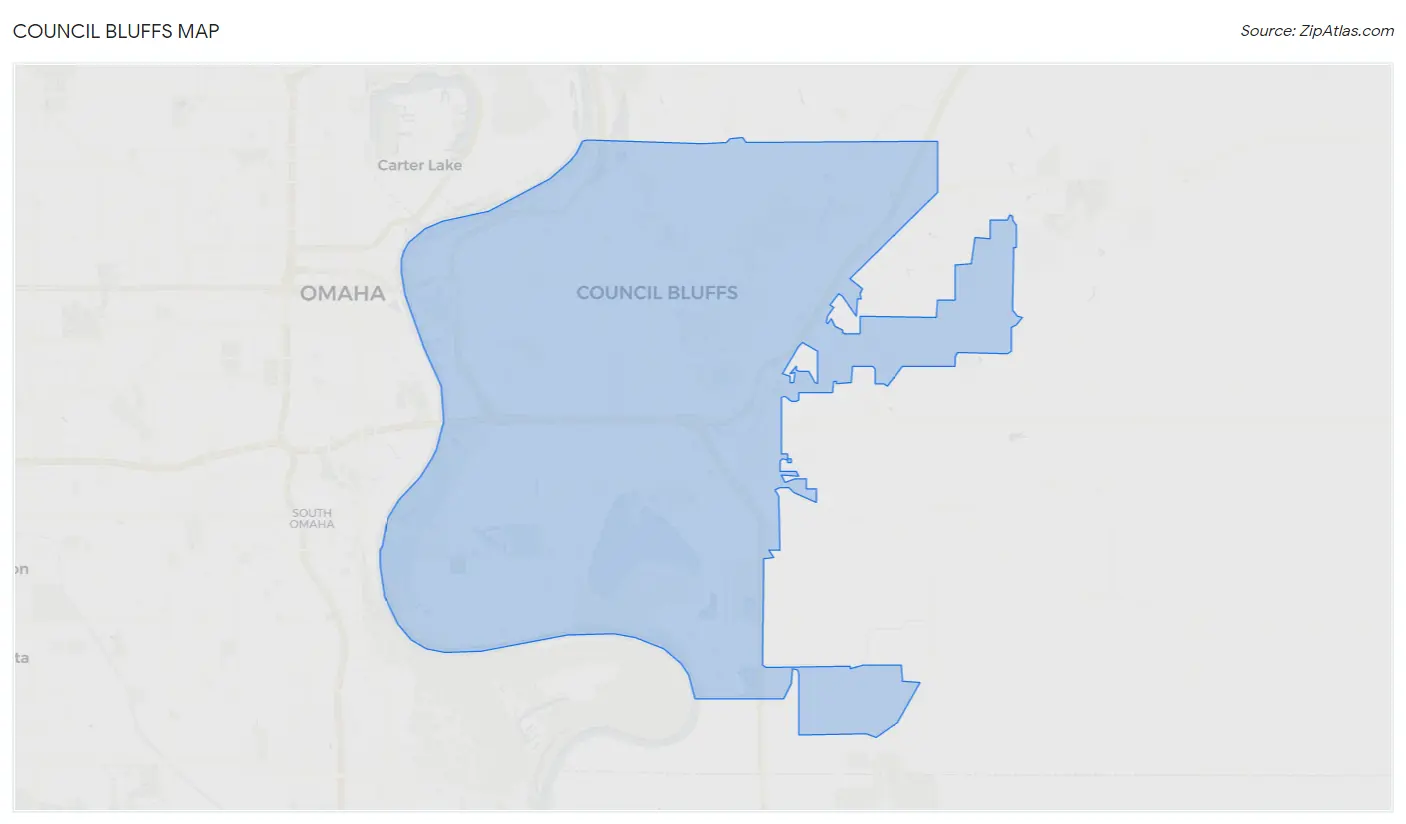
Council Bluffs Map
Council Bluffs Overview
62,670
TOTAL POPULATION
30,880
MALE POPULATION
31,790
FEMALE POPULATION
97.14
MALES / 100 FEMALES
102.95
FEMALES / 100 MALES
38.4
MEDIAN AGE
3.0
AVG FAMILY SIZE
2.4
AVG HOUSEHOLD SIZE
$31,946
PER CAPITA INCOME
$74,876
AVG FAMILY INCOME
$61,181
AVG HOUSEHOLD INCOME
24.9%
WAGE / INCOME GAP [ % ]
75.1¢/ $1
WAGE / INCOME GAP [ $ ]
$12,393
FAMILY INCOME DEFICIT
0.43
INEQUALITY / GINI INDEX
32,081
LABOR FORCE [ PEOPLE ]
63.5%
PERCENT IN LABOR FORCE
4.2%
UNEMPLOYMENT RATE
Council Bluffs Area Codes
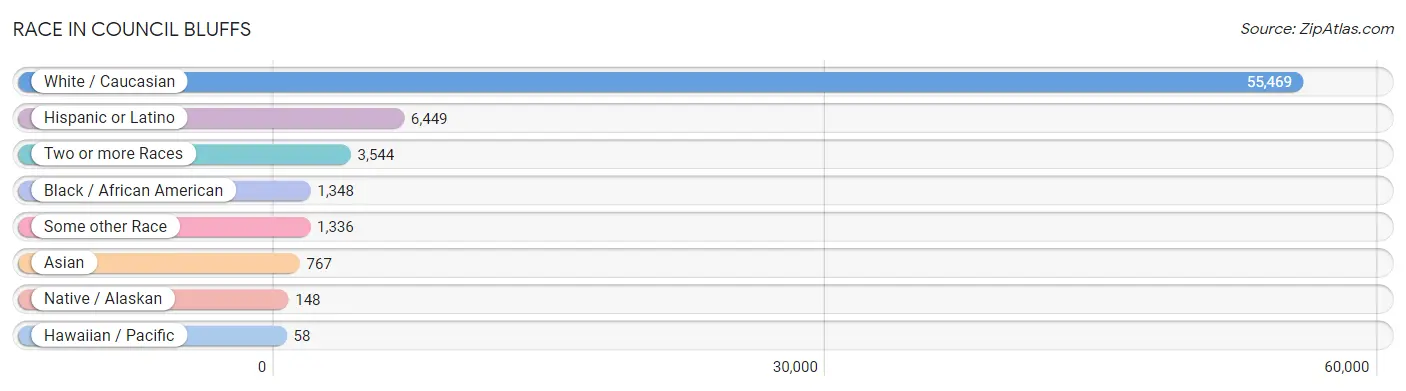
Race in Council Bluffs
The most populous races in Council Bluffs are White / Caucasian (55,469 | 88.5%), Hispanic or Latino (6,449 | 10.3%), and Two or more Races (3,544 | 5.7%).
| Race | # Population | % Population |
| Asian | 767 | 1.2% |
| Black / African American | 1,348 | 2.1% |
| Hawaiian / Pacific | 58 | 0.1% |
| Hispanic or Latino | 6,449 | 10.3% |
| Native / Alaskan | 148 | 0.2% |
| White / Caucasian | 55,469 | 88.5% |
| Two or more Races | 3,544 | 5.7% |
| Some other Race | 1,336 | 2.1% |
| Total | 62,670 | 100.0% |
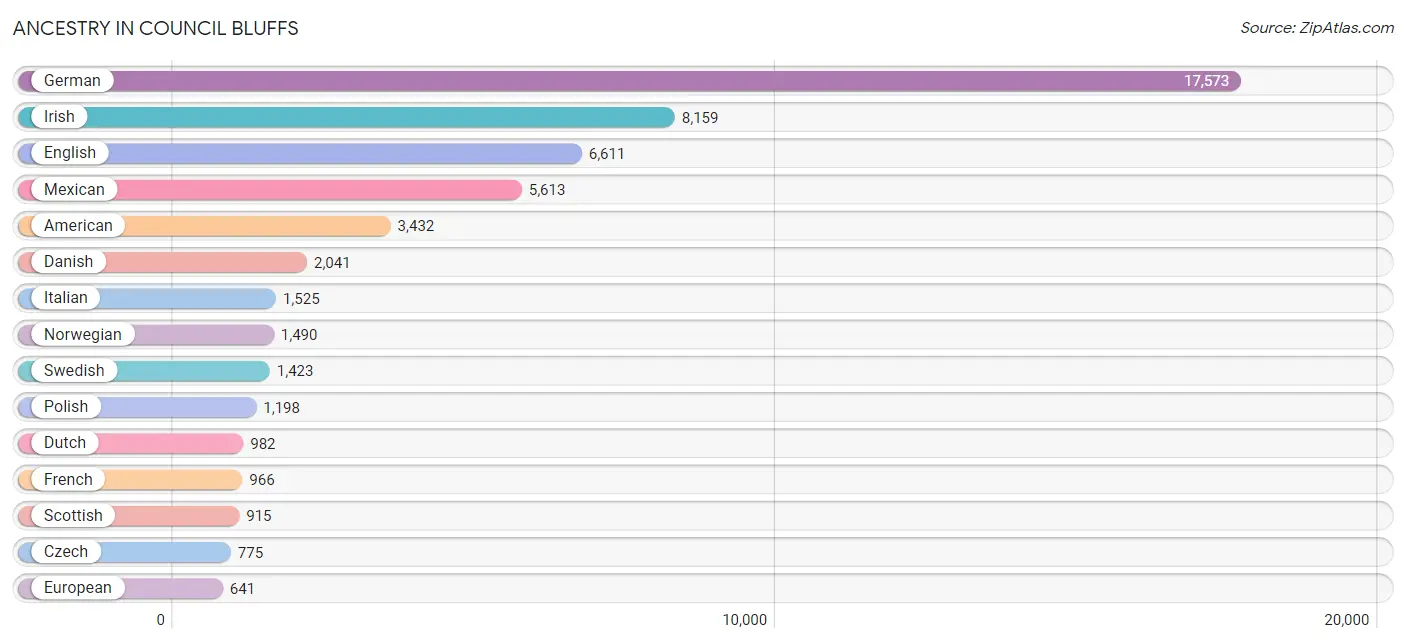
Ancestry in Council Bluffs
The most populous ancestries reported in Council Bluffs are German (17,573 | 28.0%), Irish (8,159 | 13.0%), English (6,611 | 10.5%), Mexican (5,613 | 9.0%), and American (3,432 | 5.5%), together accounting for 66.0% of all Council Bluffs residents.
| Ancestry | # Population | % Population |
| African | 193 | 0.3% |
| American | 3,432 | 5.5% |
| Apache | 29 | 0.1% |
| Arab | 36 | 0.1% |
| Argentinean | 11 | 0.0% |
| Armenian | 5 | 0.0% |
| Australian | 53 | 0.1% |
| Austrian | 56 | 0.1% |
| Belgian | 28 | 0.0% |
| Bhutanese | 94 | 0.2% |
| British | 245 | 0.4% |
| Bulgarian | 34 | 0.1% |
| Burmese | 130 | 0.2% |
| Canadian | 35 | 0.1% |
| Central American | 396 | 0.6% |
| Central American Indian | 29 | 0.1% |
| Cherokee | 83 | 0.1% |
| Cheyenne | 18 | 0.0% |
| Chippewa | 2 | 0.0% |
| Choctaw | 8 | 0.0% |
| Costa Rican | 16 | 0.0% |
| Creek | 16 | 0.0% |
| Croatian | 73 | 0.1% |
| Cuban | 76 | 0.1% |
| Czech | 775 | 1.2% |
| Czechoslovakian | 113 | 0.2% |
| Danish | 2,041 | 3.3% |
| Delaware | 8 | 0.0% |
| Dutch | 982 | 1.6% |
| Eastern European | 39 | 0.1% |
| English | 6,611 | 10.5% |
| Estonian | 12 | 0.0% |
| Ethiopian | 1 | 0.0% |
| European | 641 | 1.0% |
| Finnish | 14 | 0.0% |
| French | 966 | 1.5% |
| French Canadian | 90 | 0.1% |
| German | 17,573 | 28.0% |
| German Russian | 10 | 0.0% |
| Greek | 157 | 0.3% |
| Guatemalan | 284 | 0.4% |
| Honduran | 38 | 0.1% |
| Hungarian | 67 | 0.1% |
| Icelander | 66 | 0.1% |
| Indian (Asian) | 372 | 0.6% |
| Iranian | 20 | 0.0% |
| Irish | 8,159 | 13.0% |
| Italian | 1,525 | 2.4% |
| Kenyan | 1 | 0.0% |
| Korean | 260 | 0.4% |
| Lebanese | 9 | 0.0% |
| Lithuanian | 19 | 0.0% |
| Luxembourger | 118 | 0.2% |
| Malaysian | 27 | 0.0% |
| Mexican | 5,613 | 9.0% |
| Mexican American Indian | 65 | 0.1% |
| Moroccan | 6 | 0.0% |
| Native Hawaiian | 17 | 0.0% |
| Navajo | 17 | 0.0% |
| Nigerian | 12 | 0.0% |
| Northern European | 21 | 0.0% |
| Norwegian | 1,490 | 2.4% |
| Pakistani | 72 | 0.1% |
| Paraguayan | 13 | 0.0% |
| Pennsylvania German | 37 | 0.1% |
| Polish | 1,198 | 1.9% |
| Portuguese | 68 | 0.1% |
| Potawatomi | 30 | 0.1% |
| Puerto Rican | 170 | 0.3% |
| Romanian | 45 | 0.1% |
| Russian | 117 | 0.2% |
| Salvadoran | 58 | 0.1% |
| Samoan | 51 | 0.1% |
| Scandinavian | 175 | 0.3% |
| Scotch-Irish | 282 | 0.4% |
| Scottish | 915 | 1.5% |
| Serbian | 8 | 0.0% |
| Sioux | 24 | 0.0% |
| Slovak | 7 | 0.0% |
| South American | 24 | 0.0% |
| Spaniard | 19 | 0.0% |
| Sri Lankan | 83 | 0.1% |
| Subsaharan African | 219 | 0.4% |
| Sudanese | 12 | 0.0% |
| Swedish | 1,423 | 2.3% |
| Swiss | 116 | 0.2% |
| Syrian | 21 | 0.0% |
| Thai | 104 | 0.2% |
| Ukrainian | 46 | 0.1% |
| Welsh | 277 | 0.4% | View All 90 Rows |
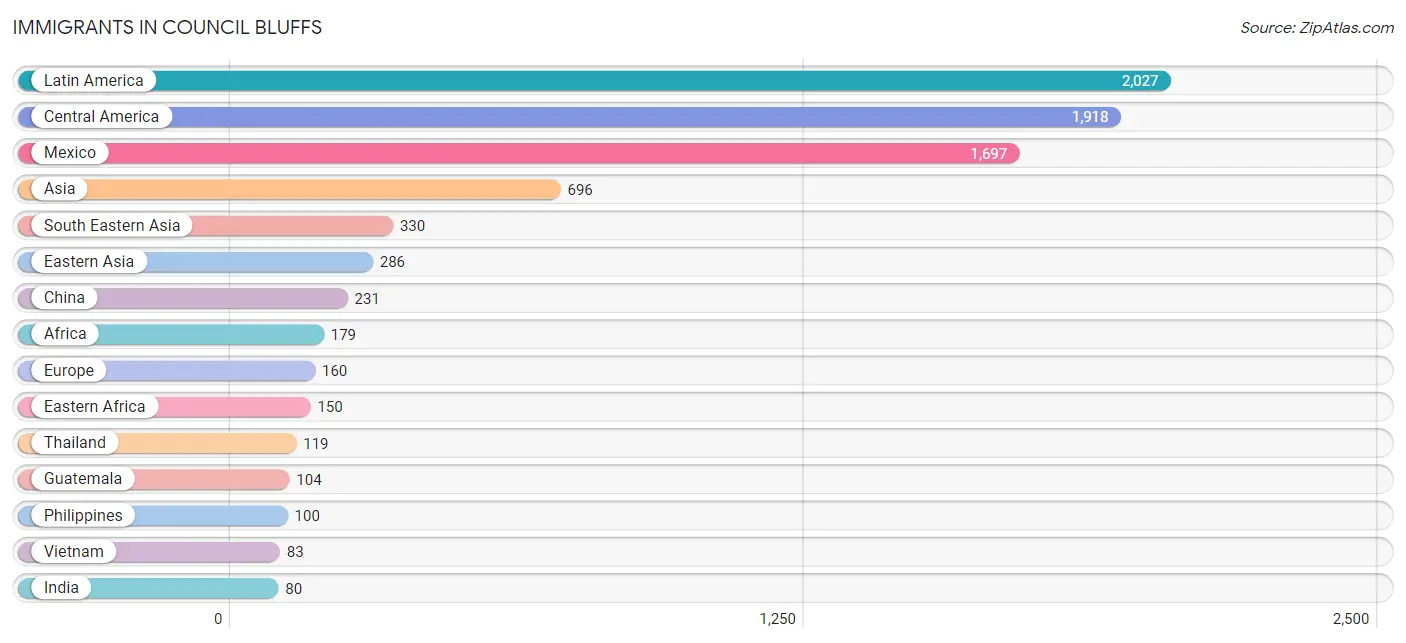
Immigrants in Council Bluffs
The most numerous immigrant groups reported in Council Bluffs came from Latin America (2,027 | 3.2%), Central America (1,918 | 3.1%), Mexico (1,697 | 2.7%), Asia (696 | 1.1%), and South Eastern Asia (330 | 0.5%), together accounting for 10.6% of all Council Bluffs residents.
| Immigration Origin | # Population | % Population |
| Africa | 179 | 0.3% |
| Asia | 696 | 1.1% |
| Australia | 23 | 0.0% |
| Brazil | 15 | 0.0% |
| Cambodia | 28 | 0.0% |
| Canada | 32 | 0.1% |
| Caribbean | 69 | 0.1% |
| Central America | 1,918 | 3.1% |
| China | 231 | 0.4% |
| Colombia | 18 | 0.0% |
| Congo | 6 | 0.0% |
| Costa Rica | 16 | 0.0% |
| Cuba | 69 | 0.1% |
| Eastern Africa | 150 | 0.2% |
| Eastern Asia | 286 | 0.5% |
| Eastern Europe | 42 | 0.1% |
| El Salvador | 36 | 0.1% |
| England | 38 | 0.1% |
| Eritrea | 3 | 0.0% |
| Ethiopia | 1 | 0.0% |
| Europe | 160 | 0.3% |
| Germany | 40 | 0.1% |
| Guatemala | 104 | 0.2% |
| Honduras | 53 | 0.1% |
| Hong Kong | 21 | 0.0% |
| India | 80 | 0.1% |
| Japan | 5 | 0.0% |
| Korea | 50 | 0.1% |
| Latin America | 2,027 | 3.2% |
| Mexico | 1,697 | 2.7% |
| Micronesia | 4 | 0.0% |
| Middle Africa | 6 | 0.0% |
| Morocco | 6 | 0.0% |
| Northern Africa | 18 | 0.0% |
| Northern Europe | 63 | 0.1% |
| Oceania | 34 | 0.1% |
| Panama | 12 | 0.0% |
| Philippines | 100 | 0.2% |
| Romania | 9 | 0.0% |
| South America | 40 | 0.1% |
| South Central Asia | 80 | 0.1% |
| South Eastern Asia | 330 | 0.5% |
| Southern Europe | 15 | 0.0% |
| Spain | 15 | 0.0% |
| Sudan | 12 | 0.0% |
| Thailand | 119 | 0.2% |
| Ukraine | 21 | 0.0% |
| Vietnam | 83 | 0.1% |
| Western Europe | 40 | 0.1% | View All 49 Rows |
Sex and Age in Council Bluffs
Sex and Age in Council Bluffs
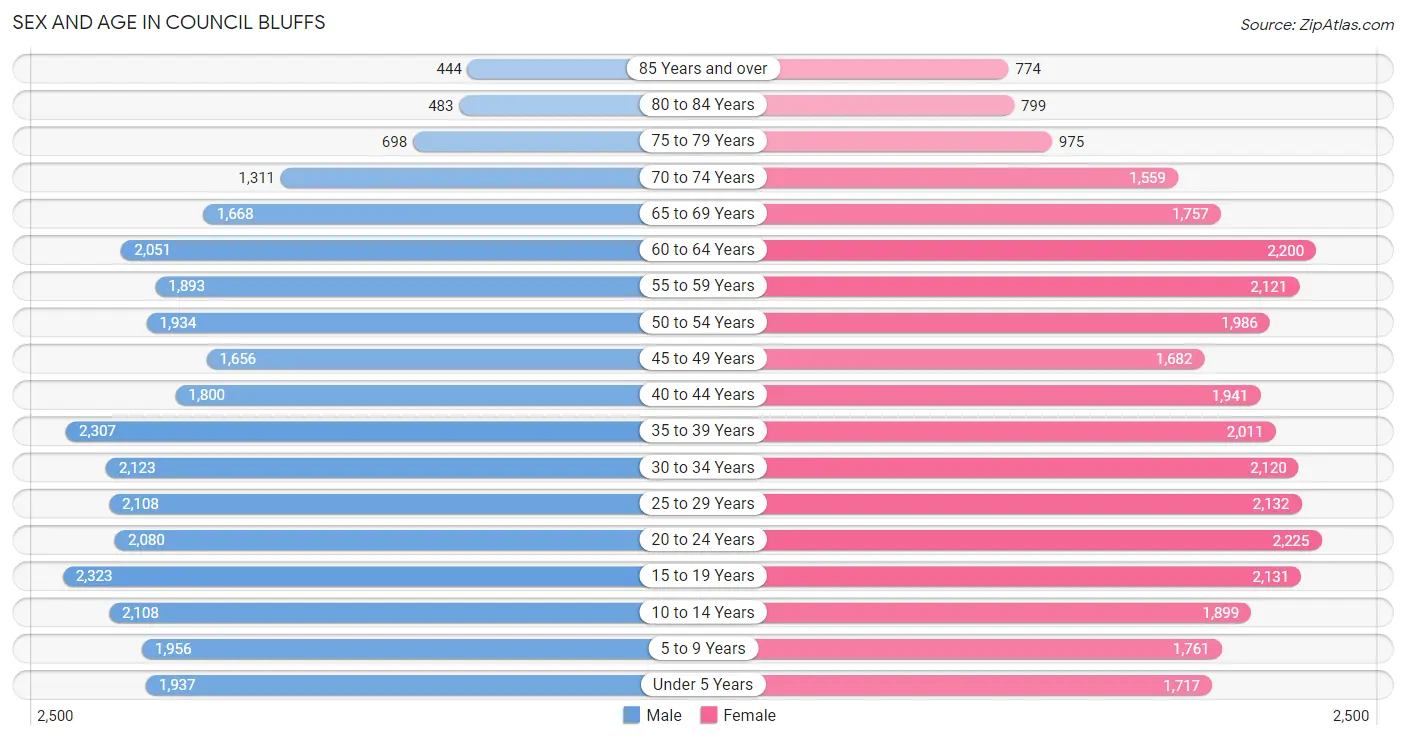
The most populous age groups in Council Bluffs are 15 to 19 Years (2,323 | 7.5%) for men and 20 to 24 Years (2,225 | 7.0%) for women.
| Age Bracket | Male | Female |
| Under 5 Years | 1,937 (6.3%) | 1,717 (5.4%) |
| 5 to 9 Years | 1,956 (6.3%) | 1,761 (5.5%) |
| 10 to 14 Years | 2,108 (6.8%) | 1,899 (6.0%) |
| 15 to 19 Years | 2,323 (7.5%) | 2,131 (6.7%) |
| 20 to 24 Years | 2,080 (6.7%) | 2,225 (7.0%) |
| 25 to 29 Years | 2,108 (6.8%) | 2,132 (6.7%) |
| 30 to 34 Years | 2,123 (6.9%) | 2,120 (6.7%) |
| 35 to 39 Years | 2,307 (7.5%) | 2,011 (6.3%) |
| 40 to 44 Years | 1,800 (5.8%) | 1,941 (6.1%) |
| 45 to 49 Years | 1,656 (5.4%) | 1,682 (5.3%) |
| 50 to 54 Years | 1,934 (6.3%) | 1,986 (6.2%) |
| 55 to 59 Years | 1,893 (6.1%) | 2,121 (6.7%) |
| 60 to 64 Years | 2,051 (6.6%) | 2,200 (6.9%) |
| 65 to 69 Years | 1,668 (5.4%) | 1,757 (5.5%) |
| 70 to 74 Years | 1,311 (4.3%) | 1,559 (4.9%) |
| 75 to 79 Years | 698 (2.3%) | 975 (3.1%) |
| 80 to 84 Years | 483 (1.6%) | 799 (2.5%) |
| 85 Years and over | 444 (1.4%) | 774 (2.4%) |
| Total | 30,880 (100.0%) | 31,790 (100.0%) |
Families and Households in Council Bluffs
Median Family Size in Council Bluffs
The median family size in Council Bluffs is 3.03 persons per family, with married-couple families (10,017 | 66.3%) accounting for the largest median family size of 3.08 persons per family. On the other hand, single male/father families (1,358 | 9.0%) represent the smallest median family size with 2.65 persons per family.

| Family Type | # Families | Family Size |
| Married-Couple | 10,017 (66.3%) | 3.08 |
| Single Male/Father | 1,358 (9.0%) | 2.65 |
| Single Female/Mother | 3,726 (24.7%) | 3.01 |
| Total Families | 15,101 (100.0%) | 3.03 |
Median Household Size in Council Bluffs
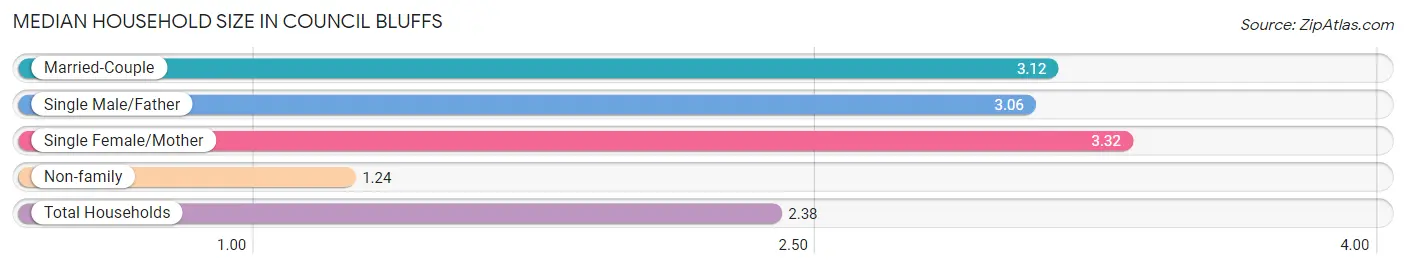
The median household size in Council Bluffs is 2.38 persons per household, with single female/mother households (3,726 | 14.6%) accounting for the largest median household size of 3.32 persons per household. non-family households (10,378 | 40.7%) represent the smallest median household size with 1.24 persons per household.
| Household Type | # Households | Household Size |
| Married-Couple | 10,017 (39.3%) | 3.12 |
| Single Male/Father | 1,358 (5.3%) | 3.06 |
| Single Female/Mother | 3,726 (14.6%) | 3.32 |
| Non-family | 10,378 (40.7%) | 1.24 |
| Total Households | 25,479 (100.0%) | 2.38 |
Household Size by Marriage Status in Council Bluffs
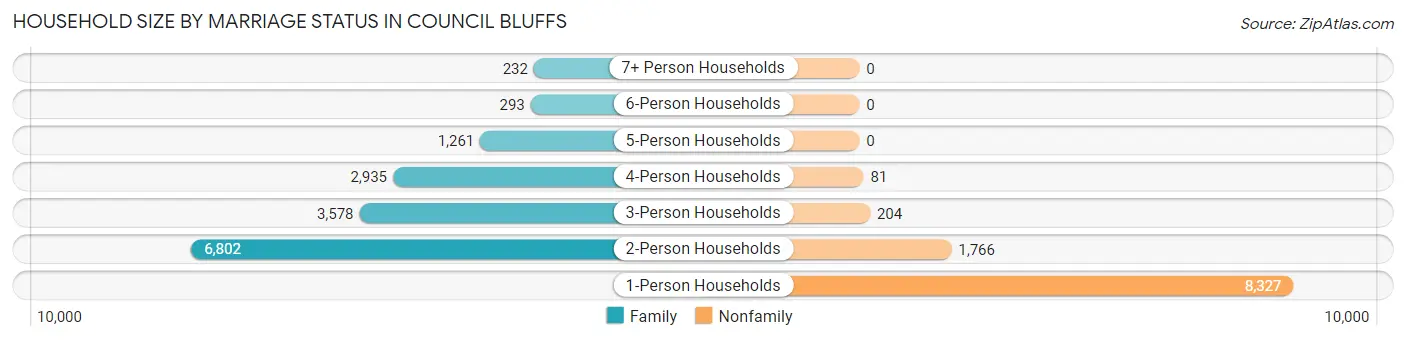
Out of a total of 25,479 households in Council Bluffs, 15,101 (59.3%) are family households, while 10,378 (40.7%) are nonfamily households. The most numerous type of family households are 2-person households, comprising 6,802, and the most common type of nonfamily households are 1-person households, comprising 8,327.
| Household Size | Family Households | Nonfamily Households |
| 1-Person Households | - | 8,327 (32.7%) |
| 2-Person Households | 6,802 (26.7%) | 1,766 (6.9%) |
| 3-Person Households | 3,578 (14.0%) | 204 (0.8%) |
| 4-Person Households | 2,935 (11.5%) | 81 (0.3%) |
| 5-Person Households | 1,261 (5.0%) | 0 (0.0%) |
| 6-Person Households | 293 (1.1%) | 0 (0.0%) |
| 7+ Person Households | 232 (0.9%) | 0 (0.0%) |
| Total | 15,101 (59.3%) | 10,378 (40.7%) |
Female Fertility in Council Bluffs
Fertility by Age in Council Bluffs
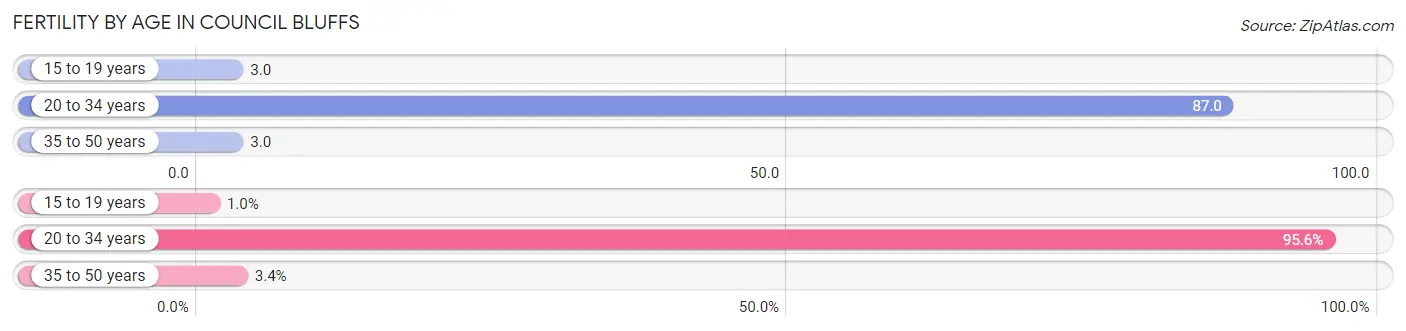
Average fertility rate in Council Bluffs is 41.0 births per 1,000 women. Women in the age bracket of 20 to 34 years have the highest fertility rate with 87.0 births per 1,000 women. Women in the age bracket of 20 to 34 years acount for 95.6% of all women with births.
| Age Bracket | Women with Births | Births / 1,000 Women |
| 15 to 19 years | 6 (1.0%) | 3.0 |
| 20 to 34 years | 566 (95.6%) | 87.0 |
| 35 to 50 years | 20 (3.4%) | 3.0 |
| Total | 592 (100.0%) | 41.0 |
Fertility by Age by Marriage Status in Council Bluffs
41.4% of women with births (592) in Council Bluffs are married. The highest percentage of unmarried women with births falls into 15 to 19 years age bracket with 100.0% of them unmarried at the time of birth, while the lowest percentage of unmarried women with births belong to 35 to 50 years age bracket with 45.0% of them unmarried.
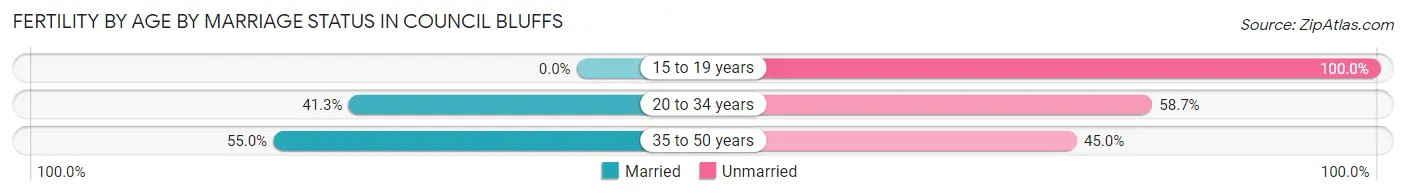
| Age Bracket | Married | Unmarried |
| 15 to 19 years | 0 (0.0%) | 6 (100.0%) |
| 20 to 34 years | 234 (41.3%) | 332 (58.7%) |
| 35 to 50 years | 11 (55.0%) | 9 (45.0%) |
| Total | 245 (41.4%) | 347 (58.6%) |
Fertility by Education in Council Bluffs
Average fertility rate in Council Bluffs is 41.0 births per 1,000 women. Women with the education attainment of less than high school have the highest fertility rate of 74.0 births per 1,000 women, while women with the education attainment of graduate degree have the lowest fertility at 4.0 births per 1,000 women. Women with the education attainment of less than high school represent 29.9% of all women with births.
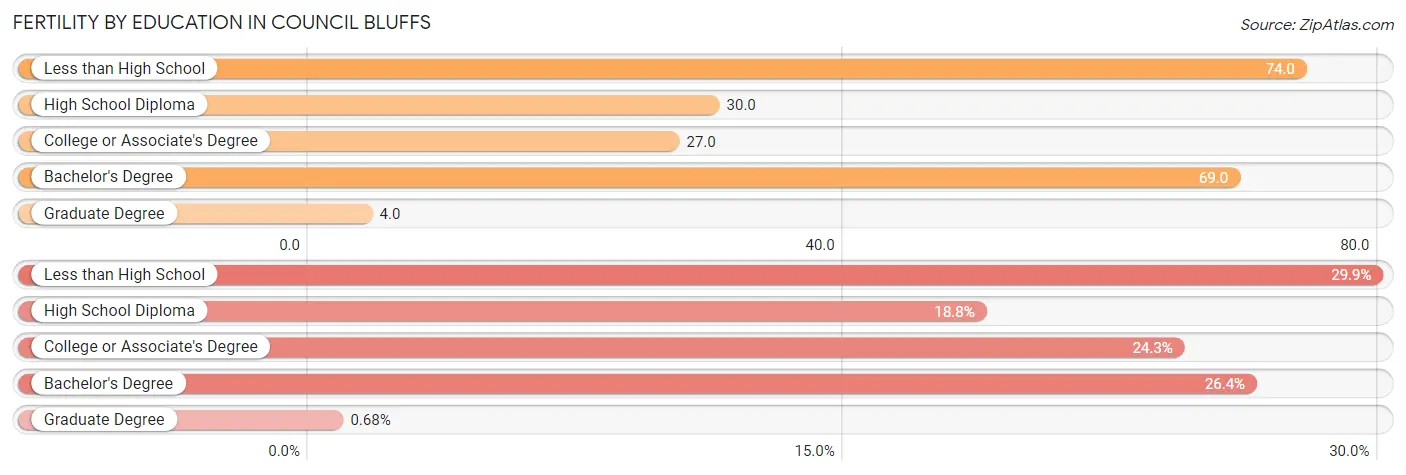
| Educational Attainment | Women with Births | Births / 1,000 Women |
| Less than High School | 177 (29.9%) | 74.0 |
| High School Diploma | 111 (18.8%) | 30.0 |
| College or Associate's Degree | 144 (24.3%) | 27.0 |
| Bachelor's Degree | 156 (26.4%) | 69.0 |
| Graduate Degree | 4 (0.7%) | 4.0 |
| Total | 592 (100.0%) | 41.0 |
Fertility by Education by Marriage Status in Council Bluffs
58.6% of women with births in Council Bluffs are unmarried. Women with the educational attainment of graduate degree are most likely to be married with 100.0% of them married at childbirth, while women with the educational attainment of less than high school are least likely to be married with 92.7% of them unmarried at childbirth.
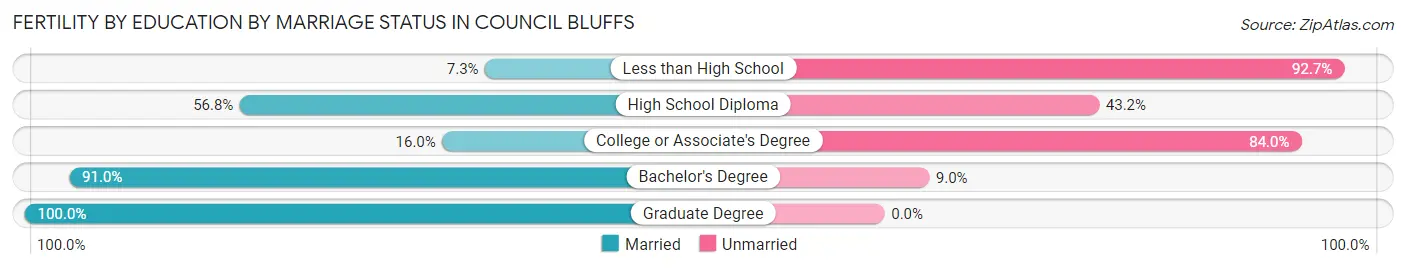
| Educational Attainment | Married | Unmarried |
| Less than High School | 13 (7.3%) | 164 (92.7%) |
| High School Diploma | 63 (56.8%) | 48 (43.2%) |
| College or Associate's Degree | 23 (16.0%) | 121 (84.0%) |
| Bachelor's Degree | 142 (91.0%) | 14 (9.0%) |
| Graduate Degree | 4 (100.0%) | 0 (0.0%) |
| Total | 245 (41.4%) | 347 (58.6%) |
Income in Council Bluffs
Income Overview in Council Bluffs
Per Capita Income in Council Bluffs is $31,946, while median incomes of families and households are $74,876 and $61,181 respectively.
| Characteristic | Number | Measure |
| Per Capita Income | 62,670 | $31,946 |
| Median Family Income | 15,101 | $74,876 |
| Mean Family Income | 15,101 | $90,681 |
| Median Household Income | 25,479 | $61,181 |
| Mean Household Income | 25,479 | $77,367 |
| Income Deficit | 15,101 | $12,393 |
| Wage / Income Gap (%) | 62,670 | 24.88% |
| Wage / Income Gap ($) | 62,670 | 75.12¢ per $1 |
| Gini / Inequality Index | 62,670 | 0.43 |
Earnings by Sex in Council Bluffs
Average Earnings in Council Bluffs are $38,060, $44,902 for men and $33,730 for women, a difference of 24.9%.
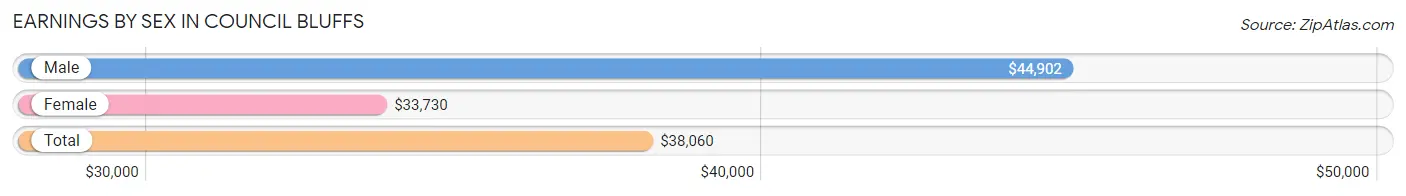
| Sex | Number | Average Earnings |
| Male | 17,001 (50.8%) | $44,902 |
| Female | 16,484 (49.2%) | $33,730 |
| Total | 33,485 (100.0%) | $38,060 |
Earnings by Sex by Income Bracket in Council Bluffs
The most common earnings brackets in Council Bluffs are $100,000+ for men (1,853 | 10.9%) and $35,000 to $39,999 for women (1,457 | 8.8%).
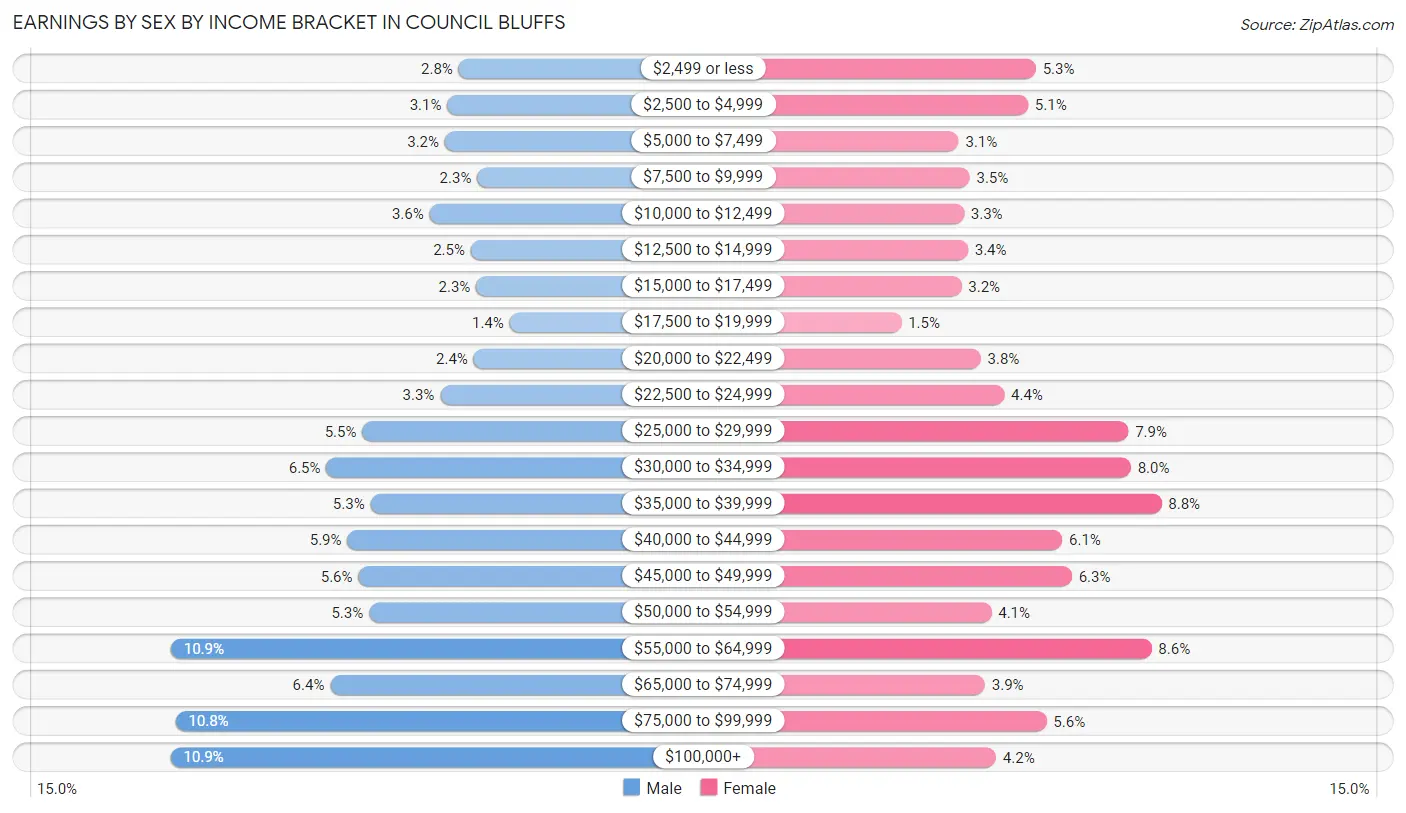
| Income | Male | Female |
| $2,499 or less | 476 (2.8%) | 875 (5.3%) |
| $2,500 to $4,999 | 531 (3.1%) | 839 (5.1%) |
| $5,000 to $7,499 | 543 (3.2%) | 517 (3.1%) |
| $7,500 to $9,999 | 388 (2.3%) | 568 (3.5%) |
| $10,000 to $12,499 | 616 (3.6%) | 543 (3.3%) |
| $12,500 to $14,999 | 418 (2.5%) | 560 (3.4%) |
| $15,000 to $17,499 | 392 (2.3%) | 531 (3.2%) |
| $17,500 to $19,999 | 233 (1.4%) | 252 (1.5%) |
| $20,000 to $22,499 | 405 (2.4%) | 619 (3.8%) |
| $22,500 to $24,999 | 564 (3.3%) | 729 (4.4%) |
| $25,000 to $29,999 | 937 (5.5%) | 1,304 (7.9%) |
| $30,000 to $34,999 | 1,108 (6.5%) | 1,316 (8.0%) |
| $35,000 to $39,999 | 897 (5.3%) | 1,457 (8.8%) |
| $40,000 to $44,999 | 1,009 (5.9%) | 997 (6.0%) |
| $45,000 to $49,999 | 955 (5.6%) | 1,042 (6.3%) |
| $50,000 to $54,999 | 905 (5.3%) | 669 (4.1%) |
| $55,000 to $64,999 | 1,851 (10.9%) | 1,411 (8.6%) |
| $65,000 to $74,999 | 1,090 (6.4%) | 640 (3.9%) |
| $75,000 to $99,999 | 1,830 (10.8%) | 925 (5.6%) |
| $100,000+ | 1,853 (10.9%) | 690 (4.2%) |
| Total | 17,001 (100.0%) | 16,484 (100.0%) |
Earnings by Sex by Educational Attainment in Council Bluffs
Average earnings in Council Bluffs are $51,178 for men and $37,334 for women, a difference of 27.1%. Men with an educational attainment of graduate degree enjoy the highest average annual earnings of $82,241, while those with less than high school education earn the least with $42,906. Women with an educational attainment of graduate degree earn the most with the average annual earnings of $66,845, while those with high school diploma education have the smallest earnings of $29,803.
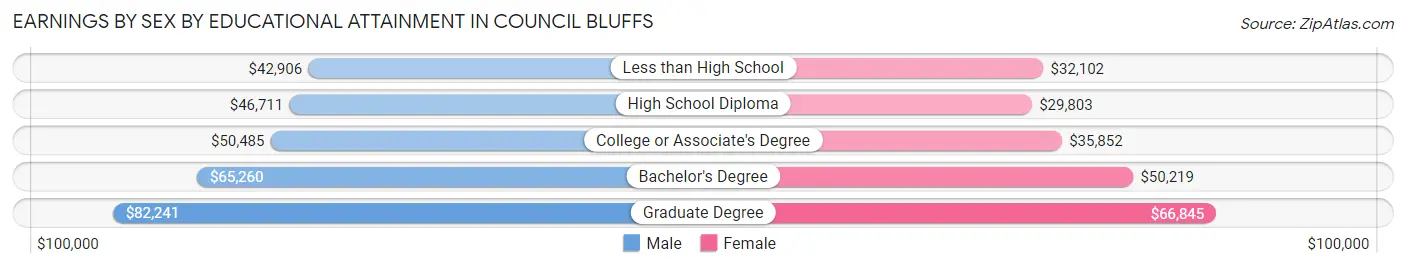
| Educational Attainment | Male Income | Female Income |
| Less than High School | $42,906 | $32,102 |
| High School Diploma | $46,711 | $29,803 |
| College or Associate's Degree | $50,485 | $35,852 |
| Bachelor's Degree | $65,260 | $50,219 |
| Graduate Degree | $82,241 | $66,845 |
| Total | $51,178 | $37,334 |
Family Income in Council Bluffs
Family Income Brackets in Council Bluffs
According to the Council Bluffs family income data, there are 2,960 families falling into the $50,000 to $74,999 income range, which is the most common income bracket and makes up 19.6% of all families. Conversely, the $10,000 to $14,999 income bracket is the least frequent group with only 423 families (2.8%) belonging to this category.
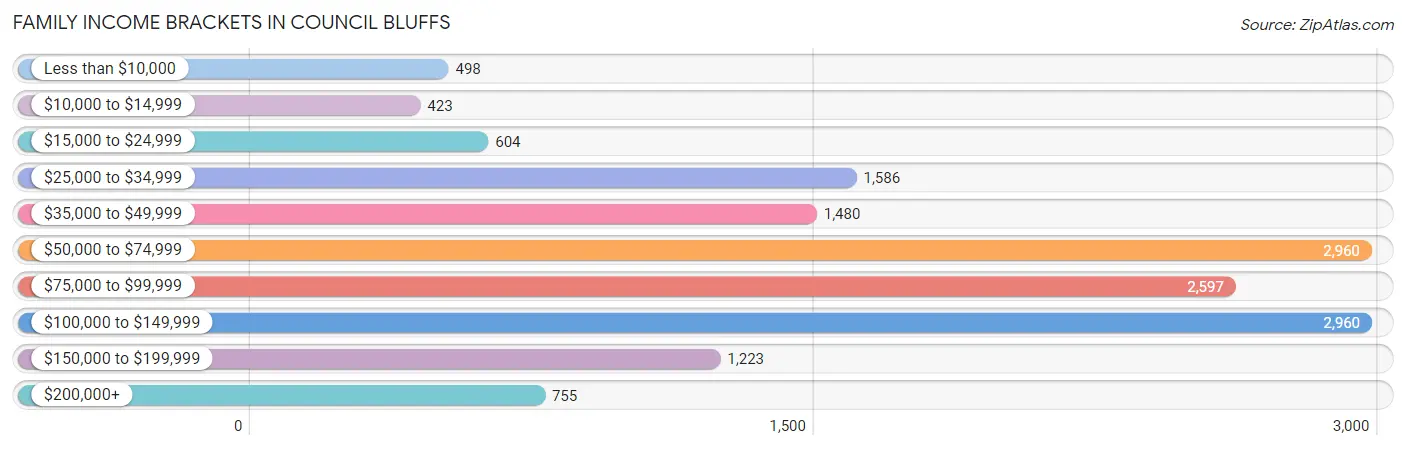
| Income Bracket | # Families | % Families |
| Less than $10,000 | 498 | 3.3% |
| $10,000 to $14,999 | 423 | 2.8% |
| $15,000 to $24,999 | 604 | 4.0% |
| $25,000 to $34,999 | 1,586 | 10.5% |
| $35,000 to $49,999 | 1,480 | 9.8% |
| $50,000 to $74,999 | 2,960 | 19.6% |
| $75,000 to $99,999 | 2,597 | 17.2% |
| $100,000 to $149,999 | 2,960 | 19.6% |
| $150,000 to $199,999 | 1,223 | 8.1% |
| $200,000+ | 755 | 5.0% |
Family Income by Famaliy Size in Council Bluffs
7+ person families (150 | 1.0%) account for the highest median family income in Council Bluffs with $142,917 per family, while 2-person families (7,689 | 50.9%) have the highest median income of $34,830 per family member.
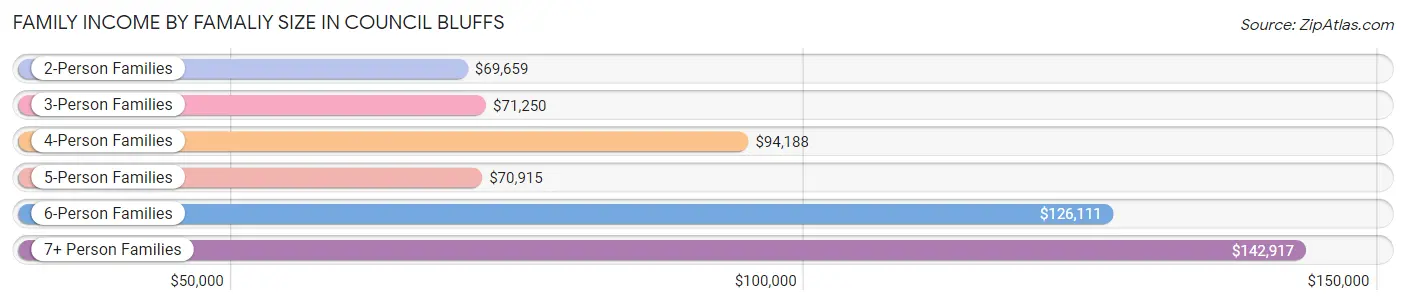
| Income Bracket | # Families | Median Income |
| 2-Person Families | 7,689 (50.9%) | $69,659 |
| 3-Person Families | 3,249 (21.5%) | $71,250 |
| 4-Person Families | 2,691 (17.8%) | $94,188 |
| 5-Person Families | 1,050 (7.0%) | $70,915 |
| 6-Person Families | 272 (1.8%) | $126,111 |
| 7+ Person Families | 150 (1.0%) | $142,917 |
| Total | 15,101 (100.0%) | $74,876 |
Family Income by Number of Earners in Council Bluffs
The median family income in Council Bluffs is $74,876, with families comprising 3+ earners (1,503) having the highest median family income of $138,750, while families with no earners (2,680) have the lowest median family income of $42,461, accounting for 10.0% and 17.7% of families, respectively.
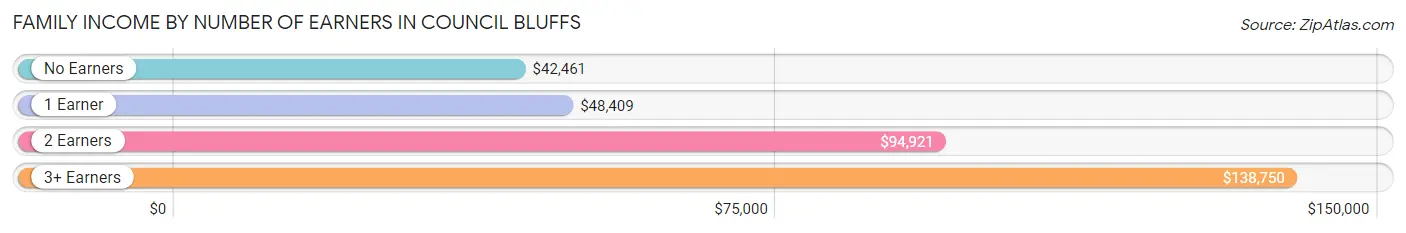
| Number of Earners | # Families | Median Income |
| No Earners | 2,680 (17.7%) | $42,461 |
| 1 Earner | 4,780 (31.7%) | $48,409 |
| 2 Earners | 6,138 (40.6%) | $94,921 |
| 3+ Earners | 1,503 (10.0%) | $138,750 |
| Total | 15,101 (100.0%) | $74,876 |
Household Income in Council Bluffs
Household Income Brackets in Council Bluffs
With 4,943 households falling in the category, the $50,000 to $74,999 income range is the most frequent in Council Bluffs, accounting for 19.4% of all households. In contrast, only 968 households (3.8%) fall into the $200,000+ income bracket, making it the least populous group.
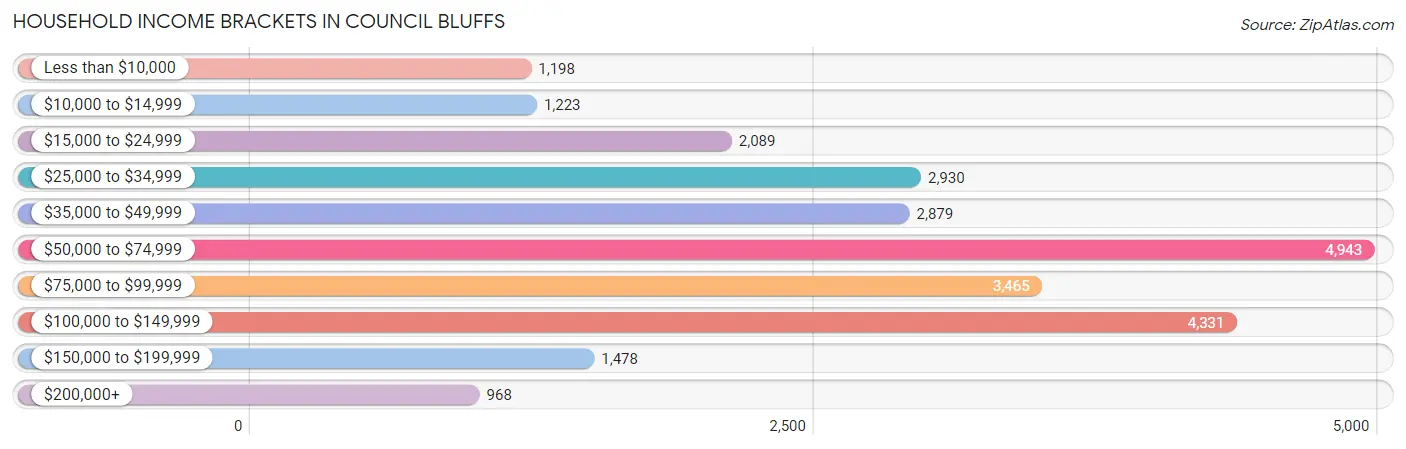
| Income Bracket | # Households | % Households |
| Less than $10,000 | 1,198 | 4.7% |
| $10,000 to $14,999 | 1,223 | 4.8% |
| $15,000 to $24,999 | 2,089 | 8.2% |
| $25,000 to $34,999 | 2,930 | 11.5% |
| $35,000 to $49,999 | 2,879 | 11.3% |
| $50,000 to $74,999 | 4,943 | 19.4% |
| $75,000 to $99,999 | 3,465 | 13.6% |
| $100,000 to $149,999 | 4,331 | 17.0% |
| $150,000 to $199,999 | 1,478 | 5.8% |
| $200,000+ | 968 | 3.8% |
Household Income by Householder Age in Council Bluffs
The median household income in Council Bluffs is $61,181, with the highest median household income of $71,158 found in the 25 to 44 years age bracket for the primary householder. A total of 7,909 households (31.0%) fall into this category. Meanwhile, the 65+ years age bracket for the primary householder has the lowest median household income of $42,458, with 6,789 households (26.7%) in this group.
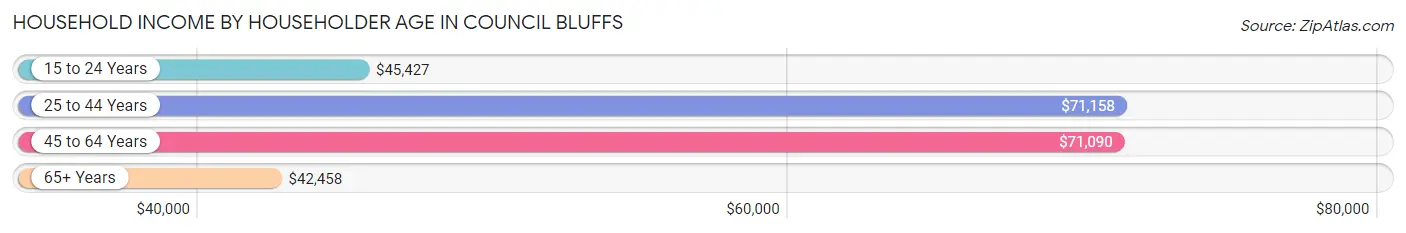
| Income Bracket | # Households | Median Income |
| 15 to 24 Years | 1,299 (5.1%) | $45,427 |
| 25 to 44 Years | 7,909 (31.0%) | $71,158 |
| 45 to 64 Years | 9,482 (37.2%) | $71,090 |
| 65+ Years | 6,789 (26.7%) | $42,458 |
| Total | 25,479 (100.0%) | $61,181 |
Poverty in Council Bluffs
Income Below Poverty by Sex and Age in Council Bluffs
With 12.0% poverty level for males and 15.1% for females among the residents of Council Bluffs, 15 year old males and under 5 year old females are the most vulnerable to poverty, with 174 males (35.2%) and 385 females (22.6%) in their respective age groups living below the poverty level.
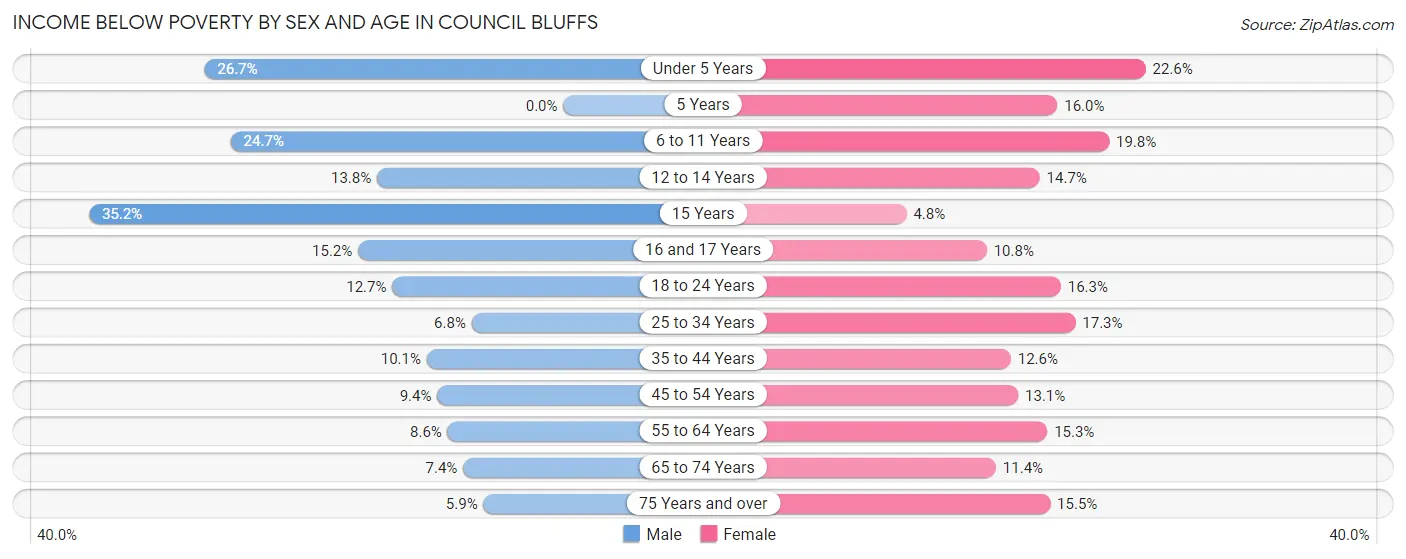
| Age Bracket | Male | Female |
| Under 5 Years | 496 (26.7%) | 385 (22.6%) |
| 5 Years | 0 (0.0%) | 96 (16.0%) |
| 6 to 11 Years | 646 (24.7%) | 387 (19.8%) |
| 12 to 14 Years | 152 (13.8%) | 156 (14.7%) |
| 15 Years | 174 (35.2%) | 13 (4.8%) |
| 16 and 17 Years | 128 (15.2%) | 99 (10.8%) |
| 18 to 24 Years | 300 (12.7%) | 448 (16.3%) |
| 25 to 34 Years | 280 (6.8%) | 729 (17.3%) |
| 35 to 44 Years | 412 (10.1%) | 493 (12.6%) |
| 45 to 54 Years | 329 (9.4%) | 477 (13.1%) |
| 55 to 64 Years | 338 (8.6%) | 659 (15.2%) |
| 65 to 74 Years | 218 (7.4%) | 375 (11.4%) |
| 75 Years and over | 95 (5.9%) | 365 (15.5%) |
| Total | 3,568 (12.0%) | 4,682 (15.1%) |
Income Above Poverty by Sex and Age in Council Bluffs
According to the poverty statistics in Council Bluffs, males aged 5 years and females aged 15 years are the age groups that are most secure financially, with 100.0% of males and 95.2% of females in these age groups living above the poverty line.
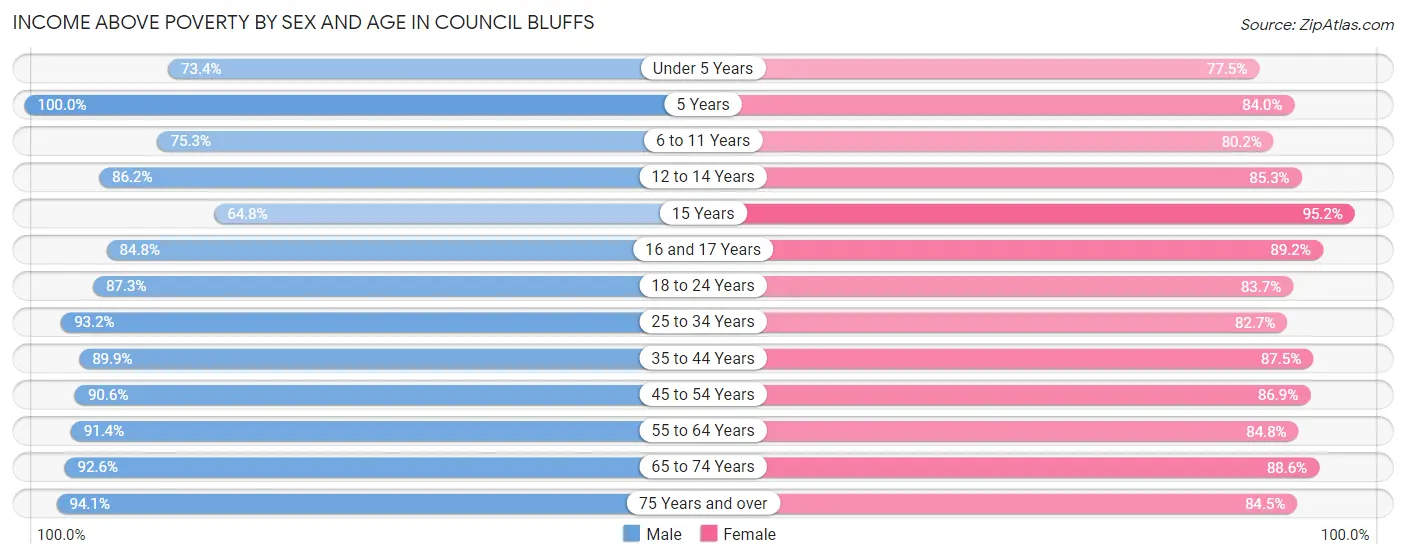
| Age Bracket | Male | Female |
| Under 5 Years | 1,365 (73.4%) | 1,322 (77.4%) |
| 5 Years | 278 (100.0%) | 504 (84.0%) |
| 6 to 11 Years | 1,969 (75.3%) | 1,564 (80.2%) |
| 12 to 14 Years | 947 (86.2%) | 906 (85.3%) |
| 15 Years | 320 (64.8%) | 258 (95.2%) |
| 16 and 17 Years | 712 (84.8%) | 821 (89.2%) |
| 18 to 24 Years | 2,063 (87.3%) | 2,307 (83.7%) |
| 25 to 34 Years | 3,836 (93.2%) | 3,476 (82.7%) |
| 35 to 44 Years | 3,652 (89.9%) | 3,434 (87.5%) |
| 45 to 54 Years | 3,187 (90.6%) | 3,166 (86.9%) |
| 55 to 64 Years | 3,599 (91.4%) | 3,662 (84.8%) |
| 65 to 74 Years | 2,711 (92.6%) | 2,902 (88.6%) |
| 75 Years and over | 1,506 (94.1%) | 1,994 (84.5%) |
| Total | 26,145 (88.0%) | 26,316 (84.9%) |
Income Below Poverty Among Married-Couple Families in Council Bluffs
The poverty statistics for married-couple families in Council Bluffs show that 4.0% or 397 of the total 10,017 families live below the poverty line. Families with 3 or 4 children have the highest poverty rate of 7.5%, comprising of 52 families. On the other hand, families with no children have the lowest poverty rate of 3.3%, which includes 210 families.
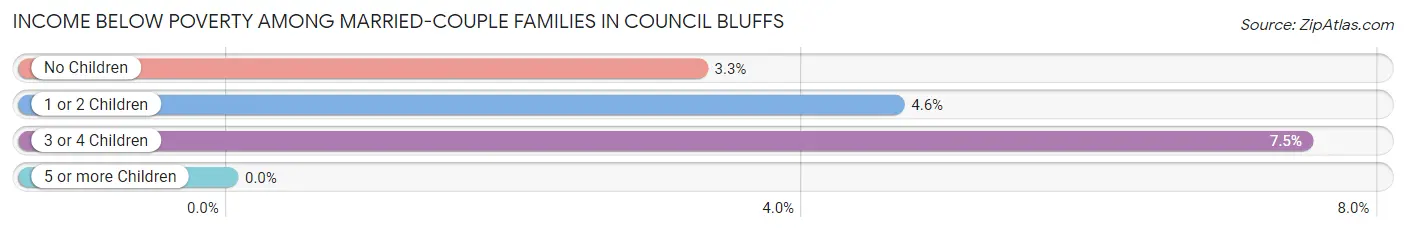
| Children | Above Poverty | Below Poverty |
| No Children | 6,204 (96.7%) | 210 (3.3%) |
| 1 or 2 Children | 2,774 (95.4%) | 135 (4.6%) |
| 3 or 4 Children | 642 (92.5%) | 52 (7.5%) |
| 5 or more Children | 0 (0.0%) | 0 (0.0%) |
| Total | 9,620 (96.0%) | 397 (4.0%) |
Income Below Poverty Among Single-Parent Households in Council Bluffs
According to the poverty data in Council Bluffs, 14.1% or 191 single-father households and 23.7% or 885 single-mother households are living below the poverty line. Among single-father households, those with 3 or 4 children have the highest poverty rate, with 58 households (32.4%) experiencing poverty. Likewise, among single-mother households, those with 3 or 4 children have the highest poverty rate, with 452 households (69.3%) falling below the poverty line.
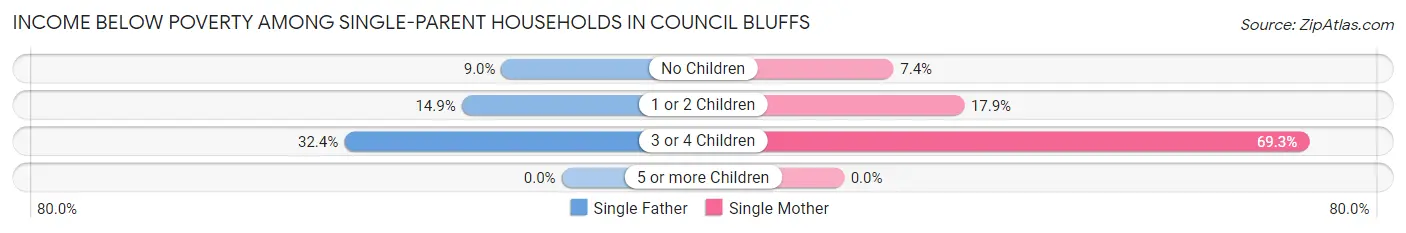
| Children | Single Father | Single Mother |
| No Children | 64 (9.0%) | 83 (7.4%) |
| 1 or 2 Children | 69 (14.9%) | 350 (17.9%) |
| 3 or 4 Children | 58 (32.4%) | 452 (69.3%) |
| 5 or more Children | 0 (0.0%) | 0 (0.0%) |
| Total | 191 (14.1%) | 885 (23.7%) |
Income Below Poverty Among Married-Couple vs Single-Parent Households in Council Bluffs
The poverty data for Council Bluffs shows that 397 of the married-couple family households (4.0%) and 1,076 of the single-parent households (21.2%) are living below the poverty level. Within the married-couple family households, those with 3 or 4 children have the highest poverty rate, with 52 households (7.5%) falling below the poverty line. Among the single-parent households, those with 3 or 4 children have the highest poverty rate, with 510 household (61.4%) living below poverty.
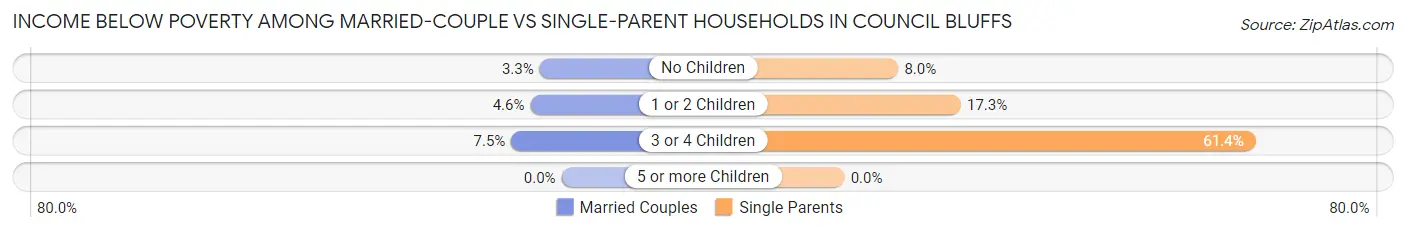
| Children | Married-Couple Families | Single-Parent Households |
| No Children | 210 (3.3%) | 147 (8.0%) |
| 1 or 2 Children | 135 (4.6%) | 419 (17.3%) |
| 3 or 4 Children | 52 (7.5%) | 510 (61.4%) |
| 5 or more Children | 0 (0.0%) | 0 (0.0%) |
| Total | 397 (4.0%) | 1,076 (21.2%) |
Employment Characteristics in Council Bluffs
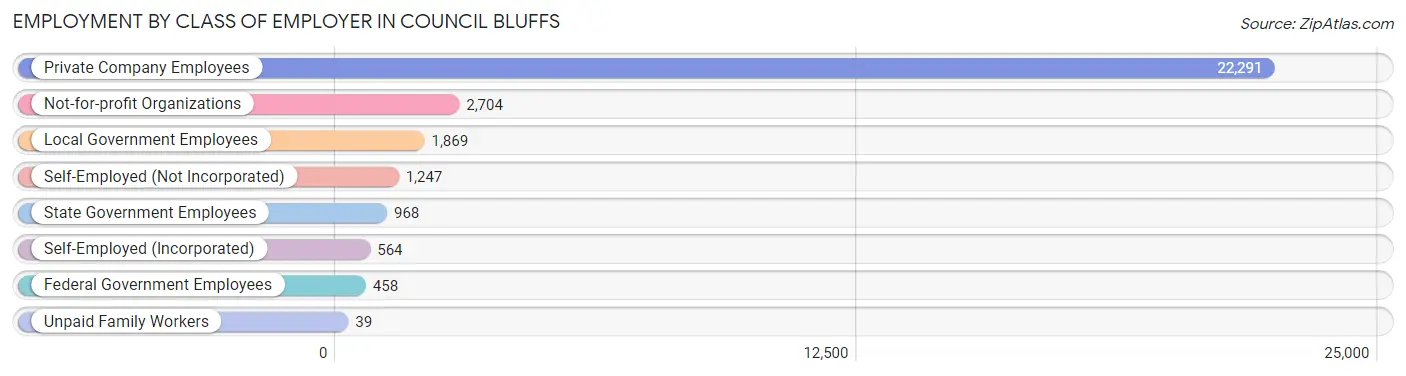
Employment by Class of Employer in Council Bluffs
Among the 30,140 employed individuals in Council Bluffs, private company employees (22,291 | 74.0%), not-for-profit organizations (2,704 | 9.0%), and local government employees (1,869 | 6.2%) make up the most common classes of employment.
| Employer Class | # Employees | % Employees |
| Private Company Employees | 22,291 | 74.0% |
| Self-Employed (Incorporated) | 564 | 1.9% |
| Self-Employed (Not Incorporated) | 1,247 | 4.1% |
| Not-for-profit Organizations | 2,704 | 9.0% |
| Local Government Employees | 1,869 | 6.2% |
| State Government Employees | 968 | 3.2% |
| Federal Government Employees | 458 | 1.5% |
| Unpaid Family Workers | 39 | 0.1% |
| Total | 30,140 | 100.0% |
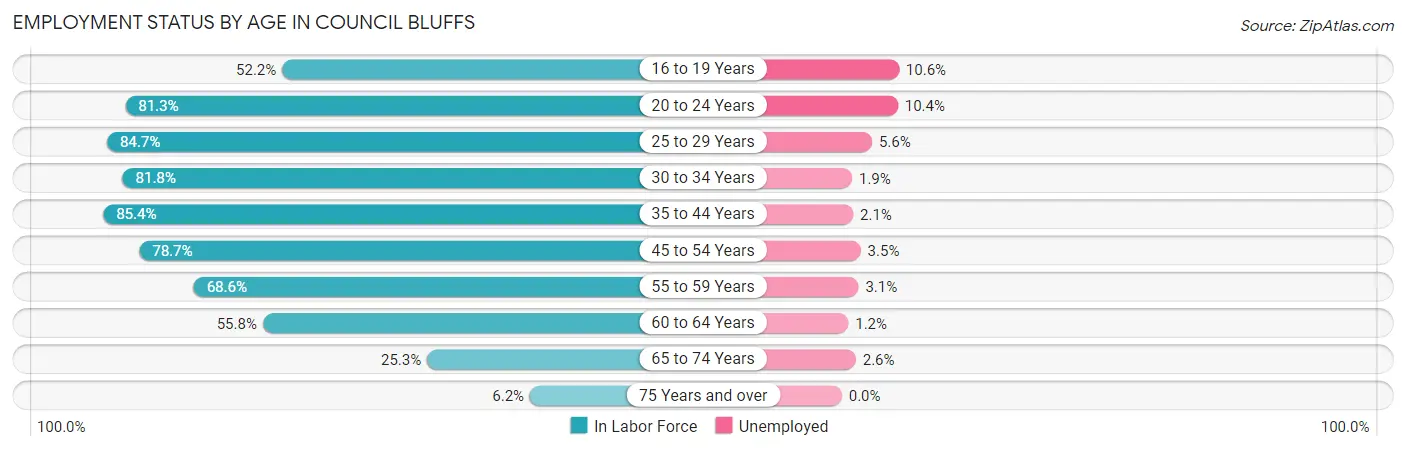
Employment Status by Age in Council Bluffs
According to the labor force statistics for Council Bluffs, out of the total population over 16 years of age (50,522), 63.5% or 32,081 individuals are in the labor force, with 4.2% or 1,347 of them unemployed. The age group with the highest labor force participation rate is 35 to 44 years, with 85.4% or 6,882 individuals in the labor force. Within the labor force, the 16 to 19 years age range has the highest percentage of unemployed individuals, with 10.6% or 204 of them being unemployed.
| Age Bracket | In Labor Force | Unemployed |
| 16 to 19 Years | 1,923 (52.2%) | 204 (10.6%) |
| 20 to 24 Years | 3,500 (81.3%) | 364 (10.4%) |
| 25 to 29 Years | 3,591 (84.7%) | 201 (5.6%) |
| 30 to 34 Years | 3,471 (81.8%) | 66 (1.9%) |
| 35 to 44 Years | 6,882 (85.4%) | 145 (2.1%) |
| 45 to 54 Years | 5,712 (78.7%) | 200 (3.5%) |
| 55 to 59 Years | 2,754 (68.6%) | 85 (3.1%) |
| 60 to 64 Years | 2,372 (55.8%) | 28 (1.2%) |
| 65 to 74 Years | 1,593 (25.3%) | 41 (2.6%) |
| 75 Years and over | 259 (6.2%) | 0 (0.0%) |
| Total | 32,081 (63.5%) | 1,347 (4.2%) |
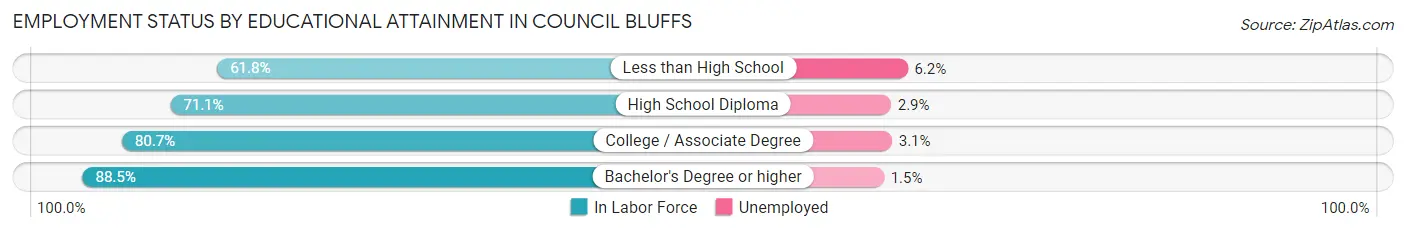
Employment Status by Educational Attainment in Council Bluffs
According to labor force statistics for Council Bluffs, 77.3% of individuals (24,786) out of the total population between 25 and 64 years of age (32,065) are in the labor force, with 2.9% or 719 of them being unemployed. The group with the highest labor force participation rate are those with the educational attainment of bachelor's degree or higher, with 88.5% or 6,284 individuals in the labor force. Within the labor force, individuals with less than high school education have the highest percentage of unemployment, with 6.2% or 143 of them being unemployed.
| Educational Attainment | In Labor Force | Unemployed |
| Less than High School | 2,306 (61.8%) | 231 (6.2%) |
| High School Diploma | 7,000 (71.1%) | 286 (2.9%) |
| College / Associate Degree | 9,190 (80.7%) | 353 (3.1%) |
| Bachelor's Degree or higher | 6,284 (88.5%) | 106 (1.5%) |
| Total | 24,786 (77.3%) | 930 (2.9%) |
Employment Occupations by Sex in Council Bluffs
Management, Business, Science and Arts Occupations
The most common Management, Business, Science and Arts occupations in Council Bluffs are Management (2,973 | 9.7%), Community & Social Service (2,754 | 9.0%), Health Diagnosing & Treating (1,719 | 5.6%), Computers, Engineering & Science (1,416 | 4.6%), and Business & Financial (1,398 | 4.6%).
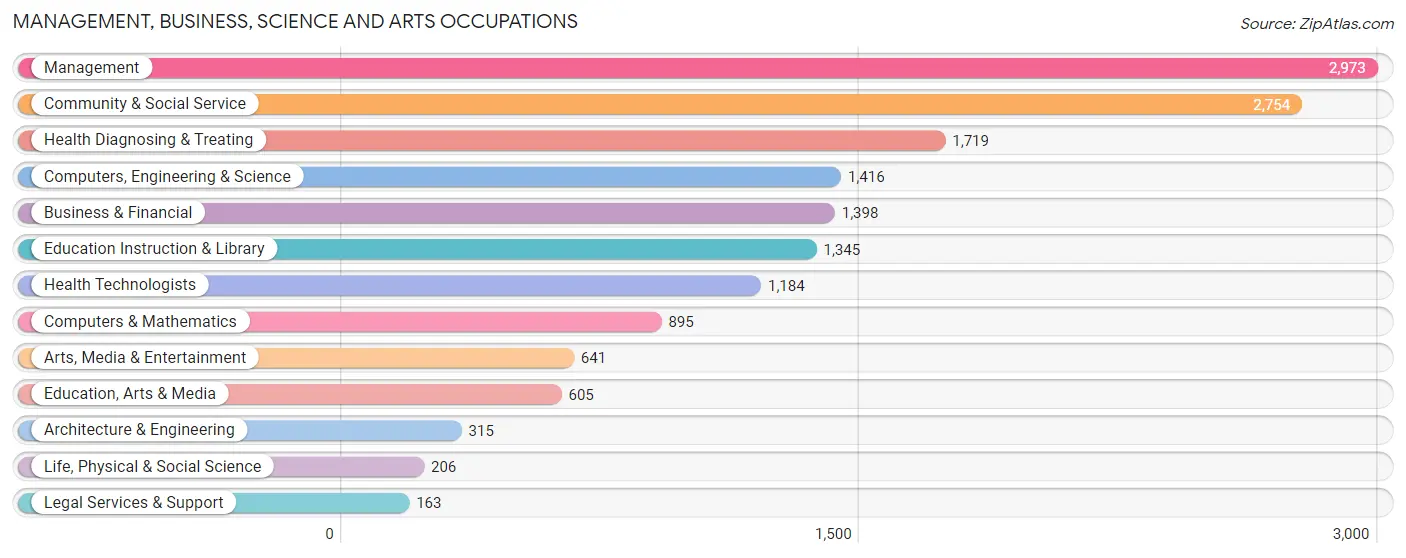
Management, Business, Science and Arts Occupations by Sex
Within the Management, Business, Science and Arts occupations in Council Bluffs, the most male-oriented occupations are Architecture & Engineering (98.7%), Legal Services & Support (72.4%), and Computers, Engineering & Science (71.7%), while the most female-oriented occupations are Health Technologists (82.4%), Education Instruction & Library (82.2%), and Health Diagnosing & Treating (79.2%).
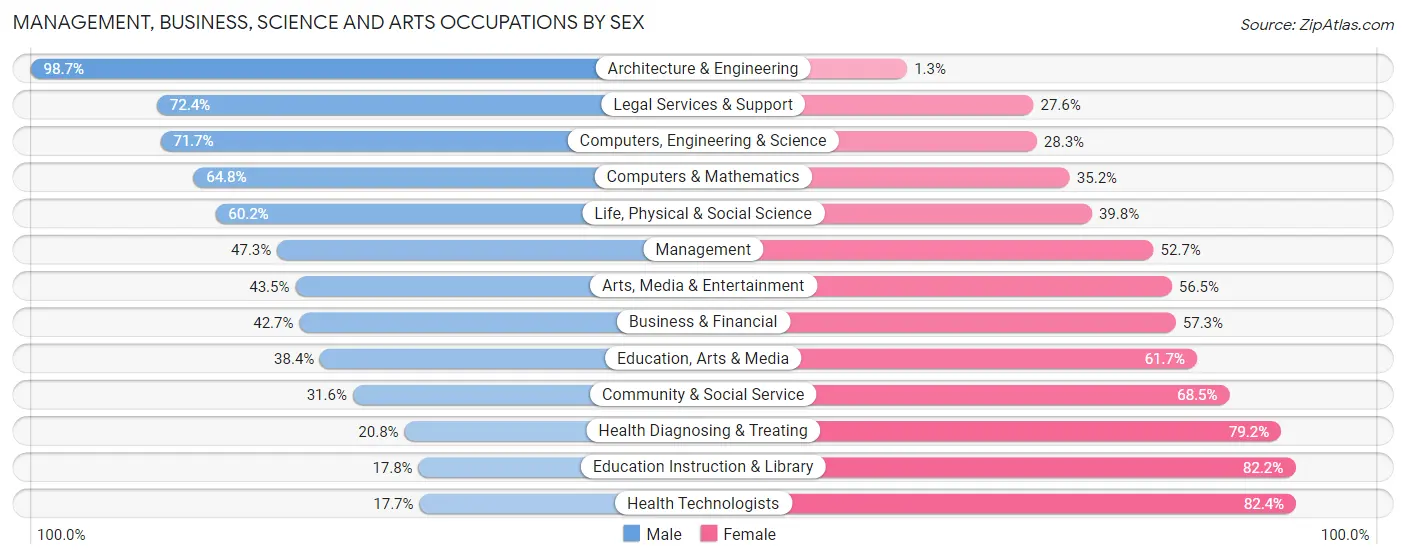
| Occupation | Male | Female |
| Management | 1,407 (47.3%) | 1,566 (52.7%) |
| Business & Financial | 597 (42.7%) | 801 (57.3%) |
| Computers, Engineering & Science | 1,015 (71.7%) | 401 (28.3%) |
| Computers & Mathematics | 580 (64.8%) | 315 (35.2%) |
| Architecture & Engineering | 311 (98.7%) | 4 (1.3%) |
| Life, Physical & Social Science | 124 (60.2%) | 82 (39.8%) |
| Community & Social Service | 869 (31.6%) | 1,885 (68.4%) |
| Education, Arts & Media | 232 (38.4%) | 373 (61.7%) |
| Legal Services & Support | 118 (72.4%) | 45 (27.6%) |
| Education Instruction & Library | 240 (17.8%) | 1,105 (82.2%) |
| Arts, Media & Entertainment | 279 (43.5%) | 362 (56.5%) |
| Health Diagnosing & Treating | 357 (20.8%) | 1,362 (79.2%) |
| Health Technologists | 209 (17.6%) | 975 (82.4%) |
| Total (Category) | 4,245 (41.4%) | 6,015 (58.6%) |
| Total (Overall) | 15,504 (50.5%) | 15,184 (49.5%) |
Services Occupations
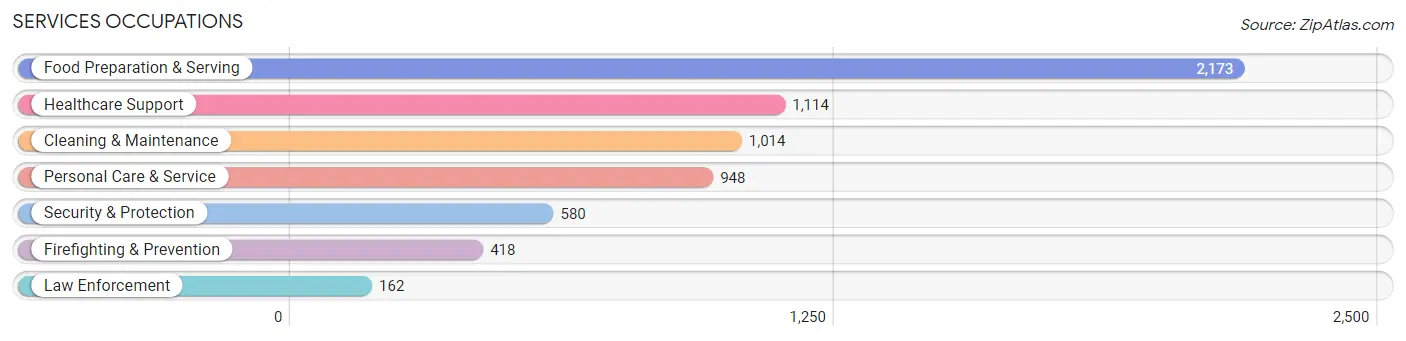
The most common Services occupations in Council Bluffs are Food Preparation & Serving (2,173 | 7.1%), Healthcare Support (1,114 | 3.6%), Cleaning & Maintenance (1,014 | 3.3%), Personal Care & Service (948 | 3.1%), and Security & Protection (580 | 1.9%).
Services Occupations by Sex
Within the Services occupations in Council Bluffs, the most male-oriented occupations are Firefighting & Prevention (94.5%), Security & Protection (90.7%), and Law Enforcement (80.9%), while the most female-oriented occupations are Personal Care & Service (89.7%), Healthcare Support (84.7%), and Food Preparation & Serving (64.4%).
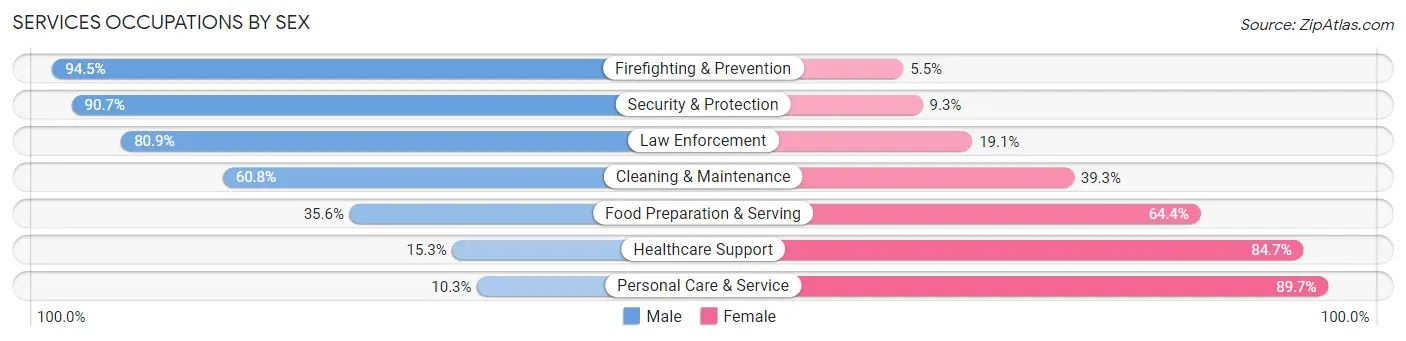
| Occupation | Male | Female |
| Healthcare Support | 170 (15.3%) | 944 (84.7%) |
| Security & Protection | 526 (90.7%) | 54 (9.3%) |
| Firefighting & Prevention | 395 (94.5%) | 23 (5.5%) |
| Law Enforcement | 131 (80.9%) | 31 (19.1%) |
| Food Preparation & Serving | 774 (35.6%) | 1,399 (64.4%) |
| Cleaning & Maintenance | 616 (60.8%) | 398 (39.3%) |
| Personal Care & Service | 98 (10.3%) | 850 (89.7%) |
| Total (Category) | 2,184 (37.5%) | 3,645 (62.5%) |
| Total (Overall) | 15,504 (50.5%) | 15,184 (49.5%) |
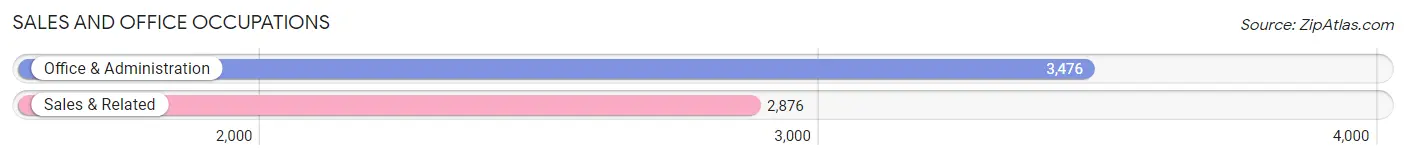
Sales and Office Occupations
The most common Sales and Office occupations in Council Bluffs are Office & Administration (3,476 | 11.3%), and Sales & Related (2,876 | 9.4%).
Sales and Office Occupations by Sex
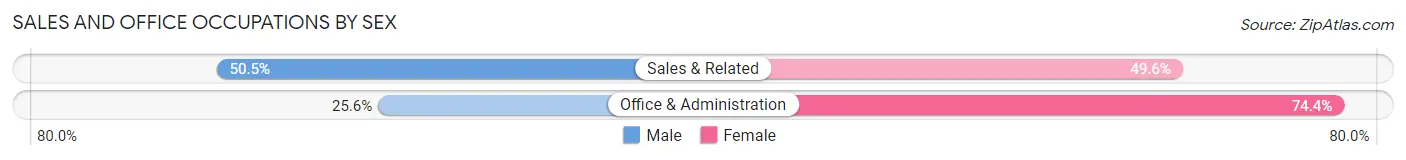
| Occupation | Male | Female |
| Sales & Related | 1,451 (50.4%) | 1,425 (49.5%) |
| Office & Administration | 891 (25.6%) | 2,585 (74.4%) |
| Total (Category) | 2,342 (36.9%) | 4,010 (63.1%) |
| Total (Overall) | 15,504 (50.5%) | 15,184 (49.5%) |
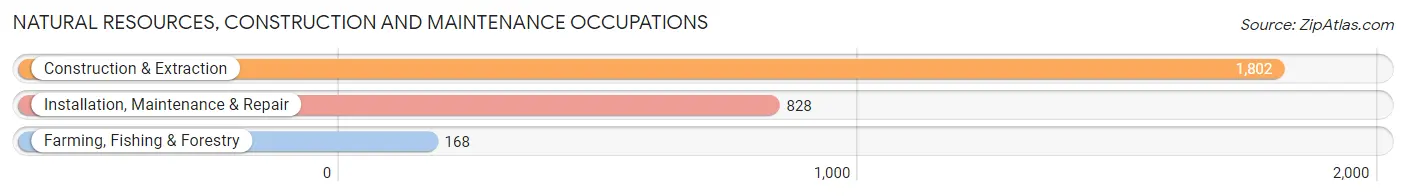
Natural Resources, Construction and Maintenance Occupations
The most common Natural Resources, Construction and Maintenance occupations in Council Bluffs are Construction & Extraction (1,802 | 5.9%), Installation, Maintenance & Repair (828 | 2.7%), and Farming, Fishing & Forestry (168 | 0.5%).
Natural Resources, Construction and Maintenance Occupations by Sex
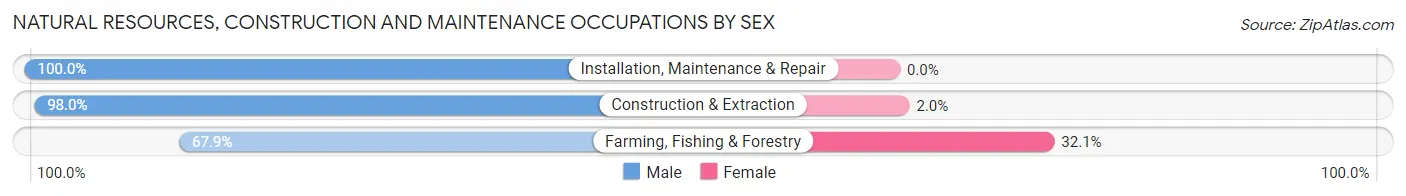
| Occupation | Male | Female |
| Farming, Fishing & Forestry | 114 (67.9%) | 54 (32.1%) |
| Construction & Extraction | 1,766 (98.0%) | 36 (2.0%) |
| Installation, Maintenance & Repair | 828 (100.0%) | 0 (0.0%) |
| Total (Category) | 2,708 (96.8%) | 90 (3.2%) |
| Total (Overall) | 15,504 (50.5%) | 15,184 (49.5%) |
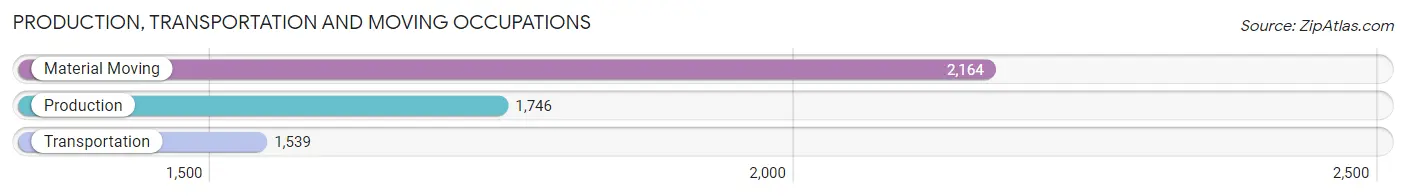
Production, Transportation and Moving Occupations
The most common Production, Transportation and Moving occupations in Council Bluffs are Material Moving (2,164 | 7.0%), Production (1,746 | 5.7%), and Transportation (1,539 | 5.0%).
Production, Transportation and Moving Occupations by Sex
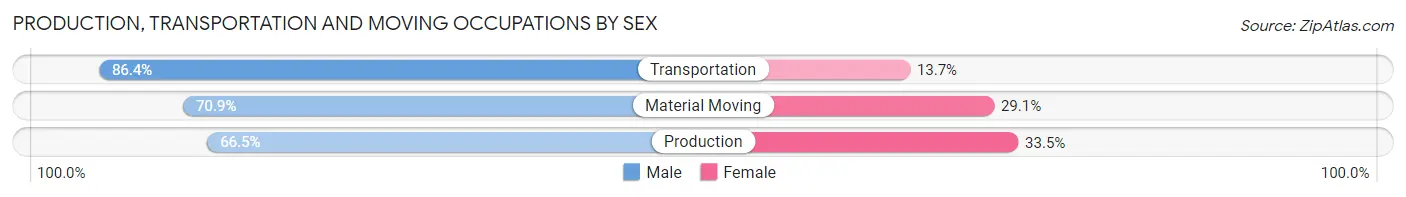
| Occupation | Male | Female |
| Production | 1,161 (66.5%) | 585 (33.5%) |
| Transportation | 1,329 (86.4%) | 210 (13.7%) |
| Material Moving | 1,535 (70.9%) | 629 (29.1%) |
| Total (Category) | 4,025 (73.9%) | 1,424 (26.1%) |
| Total (Overall) | 15,504 (50.5%) | 15,184 (49.5%) |
Employment Industries by Sex in Council Bluffs
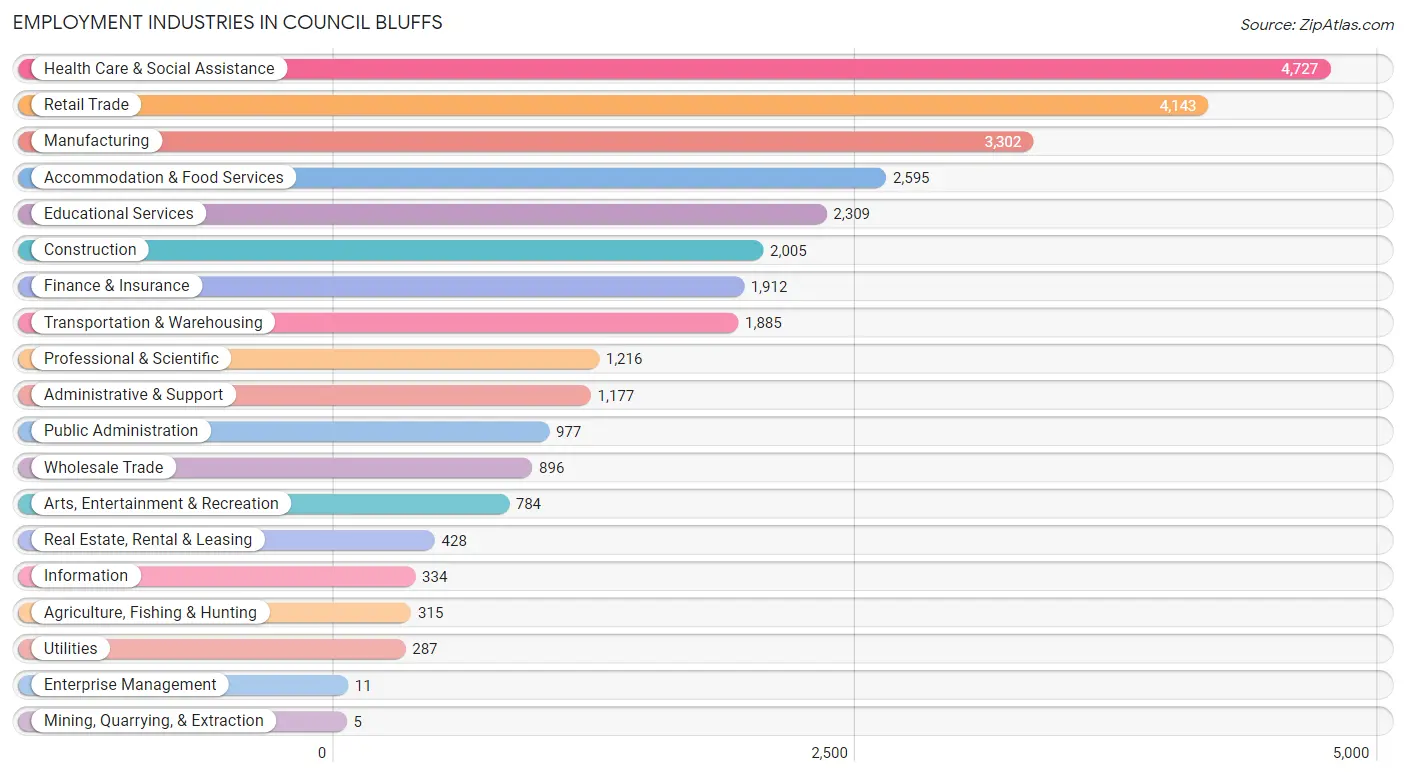
Employment Industries in Council Bluffs
The major employment industries in Council Bluffs include Health Care & Social Assistance (4,727 | 15.4%), Retail Trade (4,143 | 13.5%), Manufacturing (3,302 | 10.8%), Accommodation & Food Services (2,595 | 8.5%), and Educational Services (2,309 | 7.5%).
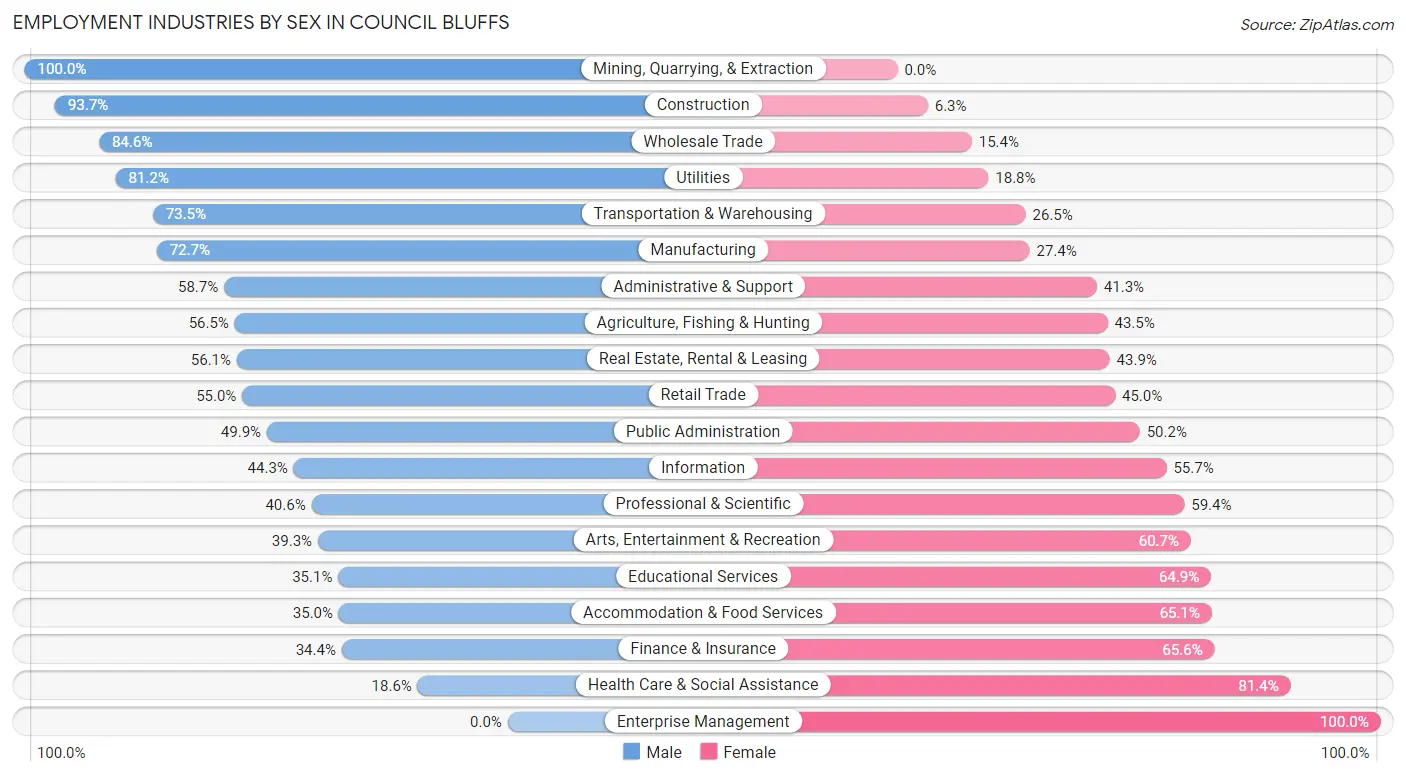
Employment Industries by Sex in Council Bluffs
The Council Bluffs industries that see more men than women are Mining, Quarrying, & Extraction (100.0%), Construction (93.7%), and Wholesale Trade (84.6%), whereas the industries that tend to have a higher number of women are Enterprise Management (100.0%), Health Care & Social Assistance (81.4%), and Finance & Insurance (65.6%).
| Industry | Male | Female |
| Agriculture, Fishing & Hunting | 178 (56.5%) | 137 (43.5%) |
| Mining, Quarrying, & Extraction | 5 (100.0%) | 0 (0.0%) |
| Construction | 1,879 (93.7%) | 126 (6.3%) |
| Manufacturing | 2,399 (72.7%) | 903 (27.4%) |
| Wholesale Trade | 758 (84.6%) | 138 (15.4%) |
| Retail Trade | 2,277 (55.0%) | 1,866 (45.0%) |
| Transportation & Warehousing | 1,385 (73.5%) | 500 (26.5%) |
| Utilities | 233 (81.2%) | 54 (18.8%) |
| Information | 148 (44.3%) | 186 (55.7%) |
| Finance & Insurance | 657 (34.4%) | 1,255 (65.6%) |
| Real Estate, Rental & Leasing | 240 (56.1%) | 188 (43.9%) |
| Professional & Scientific | 494 (40.6%) | 722 (59.4%) |
| Enterprise Management | 0 (0.0%) | 11 (100.0%) |
| Administrative & Support | 691 (58.7%) | 486 (41.3%) |
| Educational Services | 810 (35.1%) | 1,499 (64.9%) |
| Health Care & Social Assistance | 881 (18.6%) | 3,846 (81.4%) |
| Arts, Entertainment & Recreation | 308 (39.3%) | 476 (60.7%) |
| Accommodation & Food Services | 907 (34.9%) | 1,688 (65.0%) |
| Public Administration | 487 (49.8%) | 490 (50.1%) |
| Total | 15,504 (50.5%) | 15,184 (49.5%) |
Education in Council Bluffs
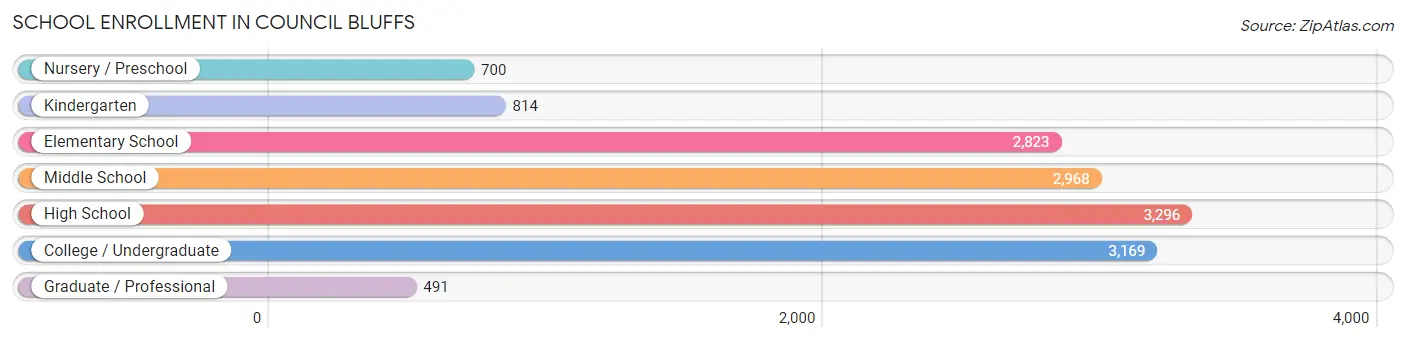
School Enrollment in Council Bluffs
The most common levels of schooling among the 14,261 students in Council Bluffs are high school (3,296 | 23.1%), college / undergraduate (3,169 | 22.2%), and middle school (2,968 | 20.8%).
| School Level | # Students | % Students |
| Nursery / Preschool | 700 | 4.9% |
| Kindergarten | 814 | 5.7% |
| Elementary School | 2,823 | 19.8% |
| Middle School | 2,968 | 20.8% |
| High School | 3,296 | 23.1% |
| College / Undergraduate | 3,169 | 22.2% |
| Graduate / Professional | 491 | 3.4% |
| Total | 14,261 | 100.0% |
School Enrollment by Age by Funding Source in Council Bluffs
Out of a total of 14,261 students who are enrolled in schools in Council Bluffs, 1,512 (10.6%) attend a private institution, while the remaining 12,749 (89.4%) are enrolled in public schools. The age group of 3 to 4 year olds has the highest likelihood of being enrolled in private schools, with 126 (25.8% in the age bracket) enrolled. Conversely, the age group of 10 to 14 year olds has the lowest likelihood of being enrolled in a private school, with 3,516 (93.8% in the age bracket) attending a public institution.
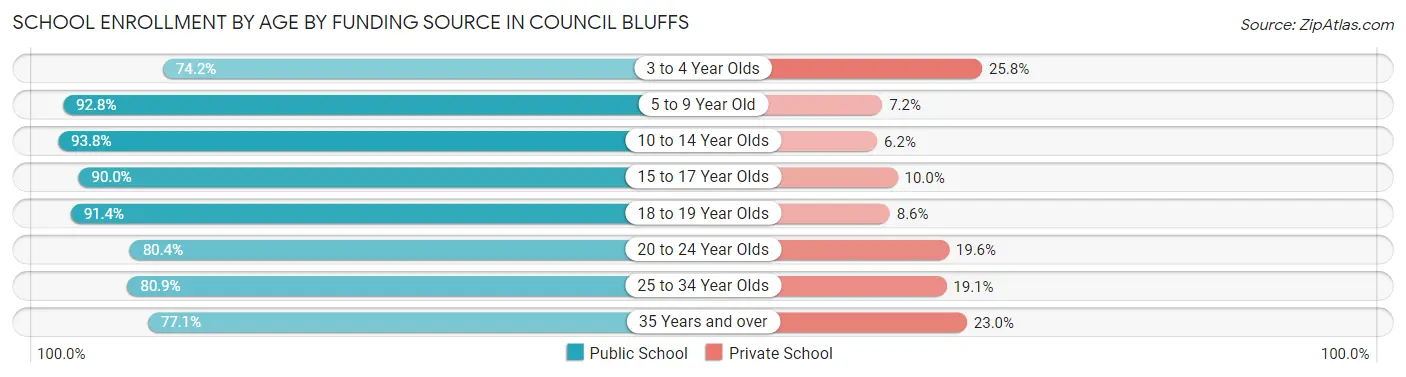
| Age Bracket | Public School | Private School |
| 3 to 4 Year Olds | 363 (74.2%) | 126 (25.8%) |
| 5 to 9 Year Old | 3,195 (92.8%) | 247 (7.2%) |
| 10 to 14 Year Olds | 3,516 (93.8%) | 234 (6.2%) |
| 15 to 17 Year Olds | 2,216 (90.0%) | 247 (10.0%) |
| 18 to 19 Year Olds | 1,330 (91.4%) | 125 (8.6%) |
| 20 to 24 Year Olds | 952 (80.4%) | 232 (19.6%) |
| 25 to 34 Year Olds | 723 (80.9%) | 171 (19.1%) |
| 35 Years and over | 450 (77.0%) | 134 (23.0%) |
| Total | 12,749 (89.4%) | 1,512 (10.6%) |
Educational Attainment by Field of Study in Council Bluffs
Business (2,489 | 25.0%), education (1,725 | 17.3%), science & technology (1,086 | 10.9%), arts & humanities (910 | 9.1%), and bio, nature & agricultural (601 | 6.0%) are the most common fields of study among 9,967 individuals in Council Bluffs who have obtained a bachelor's degree or higher.
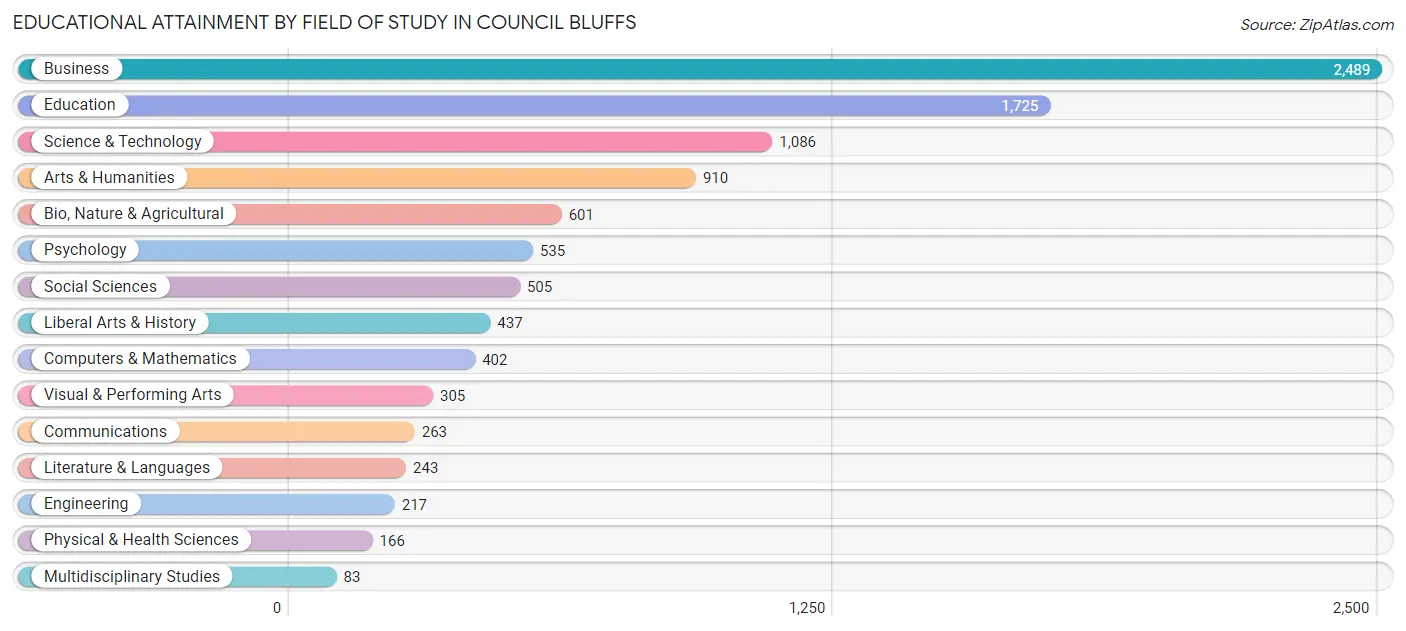
| Field of Study | # Graduates | % Graduates |
| Computers & Mathematics | 402 | 4.0% |
| Bio, Nature & Agricultural | 601 | 6.0% |
| Physical & Health Sciences | 166 | 1.7% |
| Psychology | 535 | 5.4% |
| Social Sciences | 505 | 5.1% |
| Engineering | 217 | 2.2% |
| Multidisciplinary Studies | 83 | 0.8% |
| Science & Technology | 1,086 | 10.9% |
| Business | 2,489 | 25.0% |
| Education | 1,725 | 17.3% |
| Literature & Languages | 243 | 2.4% |
| Liberal Arts & History | 437 | 4.4% |
| Visual & Performing Arts | 305 | 3.1% |
| Communications | 263 | 2.6% |
| Arts & Humanities | 910 | 9.1% |
| Total | 9,967 | 100.0% |
Transportation & Commute in Council Bluffs
Vehicle Availability by Sex in Council Bluffs
The most prevalent vehicle ownership categories in Council Bluffs are males with 2 vehicles (6,656, accounting for 44.5%) and females with 2 vehicles (5,995, making up 45.3%).
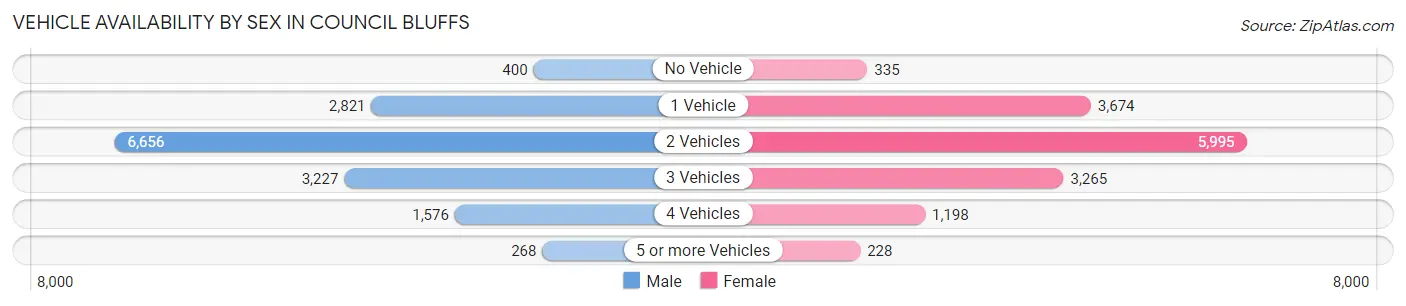
| Vehicles Available | Male | Female |
| No Vehicle | 400 (2.7%) | 335 (2.3%) |
| 1 Vehicle | 2,821 (18.9%) | 3,674 (25.0%) |
| 2 Vehicles | 6,656 (44.5%) | 5,995 (40.8%) |
| 3 Vehicles | 3,227 (21.6%) | 3,265 (22.2%) |
| 4 Vehicles | 1,576 (10.5%) | 1,198 (8.2%) |
| 5 or more Vehicles | 268 (1.8%) | 228 (1.5%) |
| Total | 14,948 (100.0%) | 14,695 (100.0%) |
Commute Time in Council Bluffs
The most frequently occuring commute durations in Council Bluffs are 10 to 14 minutes (5,810 commuters, 20.6%), 15 to 19 minutes (5,591 commuters, 19.8%), and 20 to 24 minutes (5,190 commuters, 18.4%).
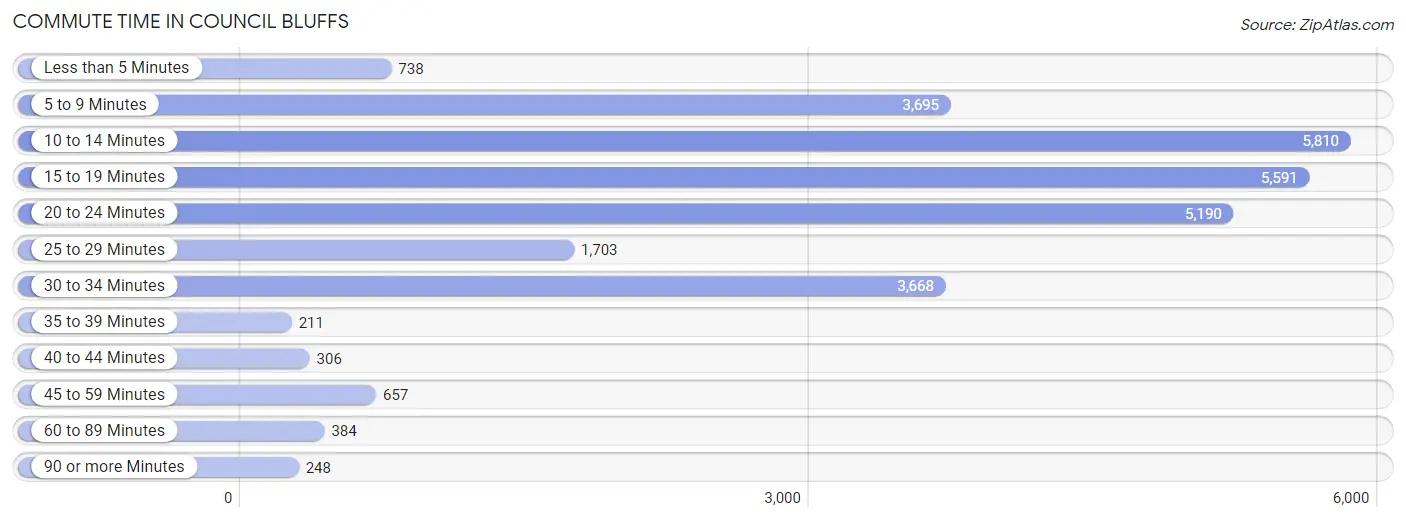
| Commute Time | # Commuters | % Commuters |
| Less than 5 Minutes | 738 | 2.6% |
| 5 to 9 Minutes | 3,695 | 13.1% |
| 10 to 14 Minutes | 5,810 | 20.6% |
| 15 to 19 Minutes | 5,591 | 19.8% |
| 20 to 24 Minutes | 5,190 | 18.4% |
| 25 to 29 Minutes | 1,703 | 6.0% |
| 30 to 34 Minutes | 3,668 | 13.0% |
| 35 to 39 Minutes | 211 | 0.7% |
| 40 to 44 Minutes | 306 | 1.1% |
| 45 to 59 Minutes | 657 | 2.3% |
| 60 to 89 Minutes | 384 | 1.4% |
| 90 or more Minutes | 248 | 0.9% |
Commute Time by Sex in Council Bluffs
The most common commute times in Council Bluffs are 10 to 14 minutes (2,953 commuters, 20.5%) for males and 15 to 19 minutes (2,885 commuters, 20.9%) for females.
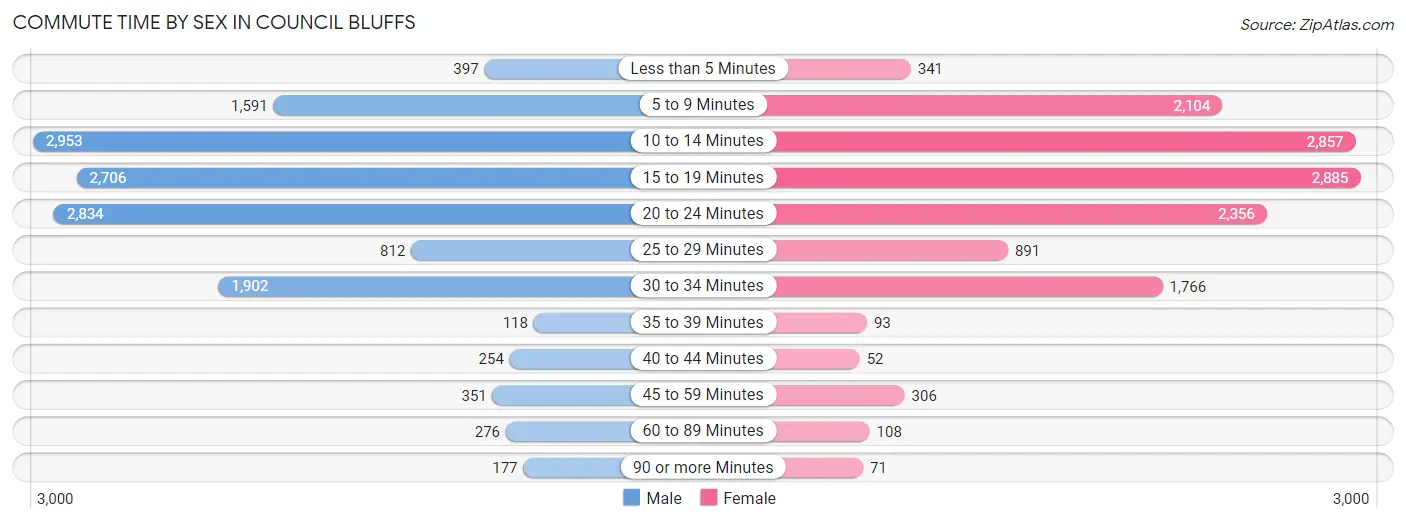
| Commute Time | Male | Female |
| Less than 5 Minutes | 397 (2.8%) | 341 (2.5%) |
| 5 to 9 Minutes | 1,591 (11.1%) | 2,104 (15.2%) |
| 10 to 14 Minutes | 2,953 (20.5%) | 2,857 (20.7%) |
| 15 to 19 Minutes | 2,706 (18.8%) | 2,885 (20.9%) |
| 20 to 24 Minutes | 2,834 (19.7%) | 2,356 (17.0%) |
| 25 to 29 Minutes | 812 (5.7%) | 891 (6.4%) |
| 30 to 34 Minutes | 1,902 (13.2%) | 1,766 (12.8%) |
| 35 to 39 Minutes | 118 (0.8%) | 93 (0.7%) |
| 40 to 44 Minutes | 254 (1.8%) | 52 (0.4%) |
| 45 to 59 Minutes | 351 (2.4%) | 306 (2.2%) |
| 60 to 89 Minutes | 276 (1.9%) | 108 (0.8%) |
| 90 or more Minutes | 177 (1.2%) | 71 (0.5%) |
Time of Departure to Work by Sex in Council Bluffs
The most frequent times of departure to work in Council Bluffs are 7:00 AM to 7:29 AM (2,116, 14.7%) for males and 7:30 AM to 7:59 AM (2,341, 16.9%) for females.
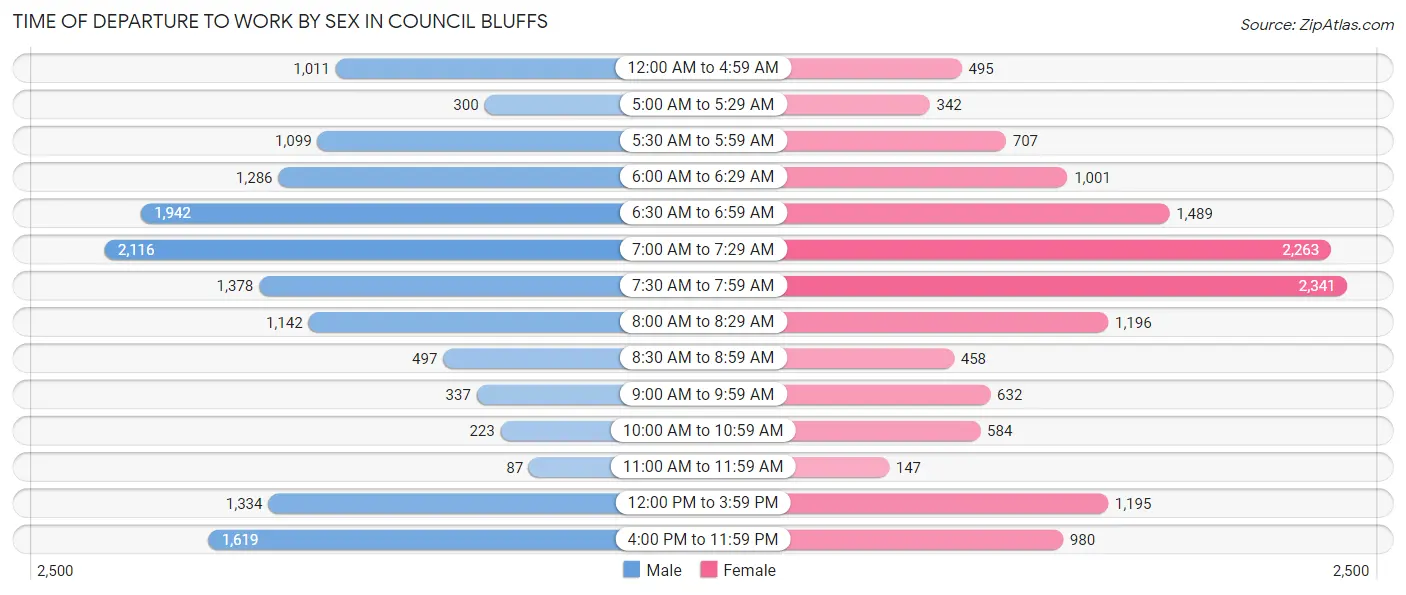
| Time of Departure | Male | Female |
| 12:00 AM to 4:59 AM | 1,011 (7.0%) | 495 (3.6%) |
| 5:00 AM to 5:29 AM | 300 (2.1%) | 342 (2.5%) |
| 5:30 AM to 5:59 AM | 1,099 (7.6%) | 707 (5.1%) |
| 6:00 AM to 6:29 AM | 1,286 (8.9%) | 1,001 (7.2%) |
| 6:30 AM to 6:59 AM | 1,942 (13.5%) | 1,489 (10.8%) |
| 7:00 AM to 7:29 AM | 2,116 (14.7%) | 2,263 (16.4%) |
| 7:30 AM to 7:59 AM | 1,378 (9.6%) | 2,341 (16.9%) |
| 8:00 AM to 8:29 AM | 1,142 (8.0%) | 1,196 (8.6%) |
| 8:30 AM to 8:59 AM | 497 (3.5%) | 458 (3.3%) |
| 9:00 AM to 9:59 AM | 337 (2.4%) | 632 (4.6%) |
| 10:00 AM to 10:59 AM | 223 (1.5%) | 584 (4.2%) |
| 11:00 AM to 11:59 AM | 87 (0.6%) | 147 (1.1%) |
| 12:00 PM to 3:59 PM | 1,334 (9.3%) | 1,195 (8.6%) |
| 4:00 PM to 11:59 PM | 1,619 (11.3%) | 980 (7.1%) |
| Total | 14,371 (100.0%) | 13,830 (100.0%) |
Housing Occupancy in Council Bluffs
Occupancy by Ownership in Council Bluffs
Of the total 25,479 dwellings in Council Bluffs, owner-occupied units account for 16,152 (63.4%), while renter-occupied units make up 9,327 (36.6%).
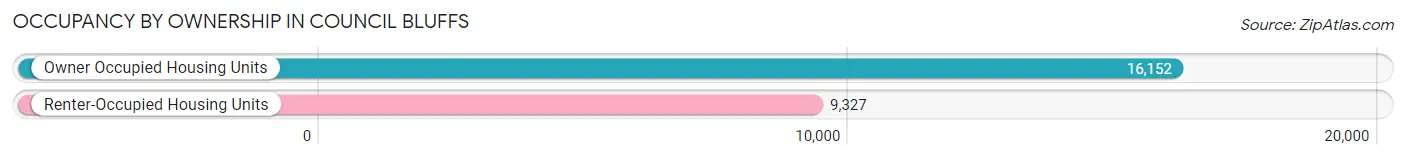
| Occupancy | # Housing Units | % Housing Units |
| Owner Occupied Housing Units | 16,152 | 63.4% |
| Renter-Occupied Housing Units | 9,327 | 36.6% |
| Total Occupied Housing Units | 25,479 | 100.0% |
Occupancy by Household Size in Council Bluffs
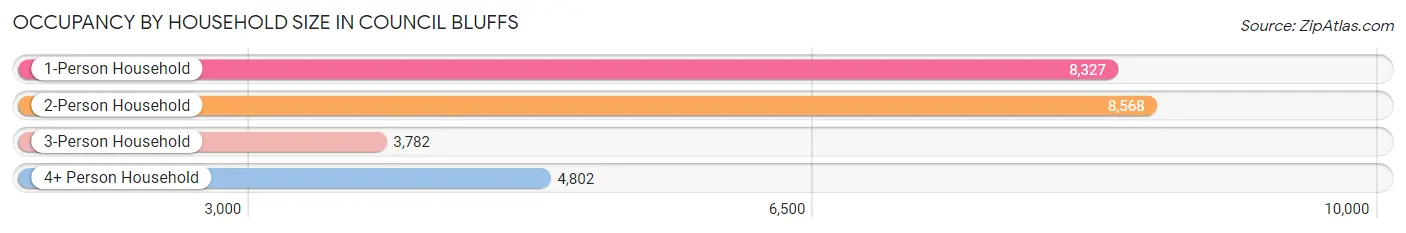
| Household Size | # Housing Units | % Housing Units |
| 1-Person Household | 8,327 | 32.7% |
| 2-Person Household | 8,568 | 33.6% |
| 3-Person Household | 3,782 | 14.8% |
| 4+ Person Household | 4,802 | 18.9% |
| Total Housing Units | 25,479 | 100.0% |
Occupancy by Ownership by Household Size in Council Bluffs
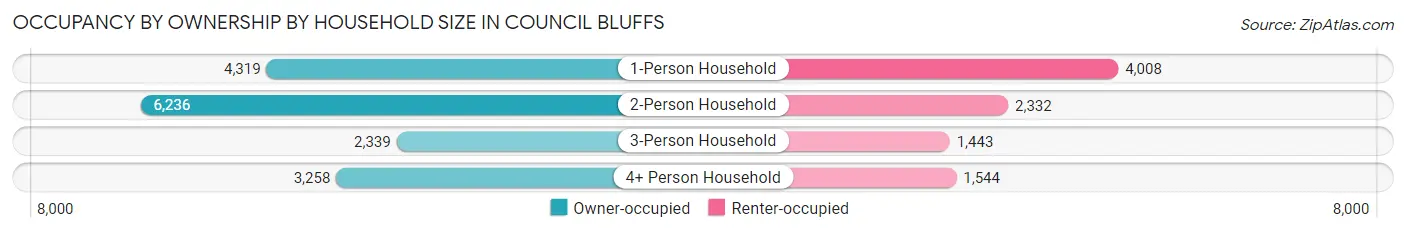
| Household Size | Owner-occupied | Renter-occupied |
| 1-Person Household | 4,319 (51.9%) | 4,008 (48.1%) |
| 2-Person Household | 6,236 (72.8%) | 2,332 (27.2%) |
| 3-Person Household | 2,339 (61.9%) | 1,443 (38.2%) |
| 4+ Person Household | 3,258 (67.8%) | 1,544 (32.2%) |
| Total Housing Units | 16,152 (63.4%) | 9,327 (36.6%) |
Occupancy by Educational Attainment in Council Bluffs
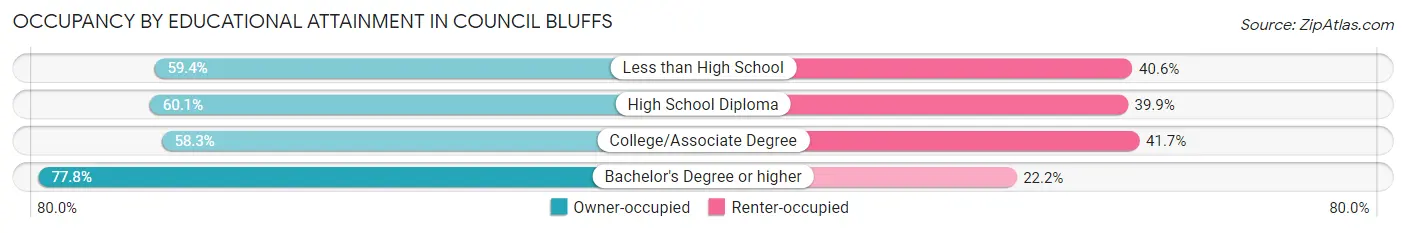
| Household Size | Owner-occupied | Renter-occupied |
| Less than High School | 1,340 (59.4%) | 916 (40.6%) |
| High School Diploma | 4,795 (60.1%) | 3,179 (39.9%) |
| College/Associate Degree | 5,514 (58.3%) | 3,946 (41.7%) |
| Bachelor's Degree or higher | 4,503 (77.8%) | 1,286 (22.2%) |
Occupancy by Age of Householder in Council Bluffs
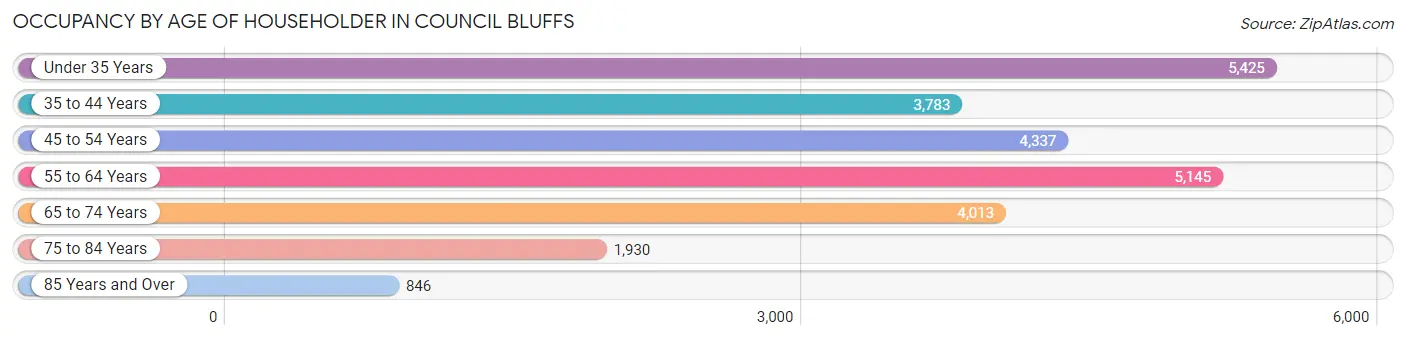
| Age Bracket | # Households | % Households |
| Under 35 Years | 5,425 | 21.3% |
| 35 to 44 Years | 3,783 | 14.8% |
| 45 to 54 Years | 4,337 | 17.0% |
| 55 to 64 Years | 5,145 | 20.2% |
| 65 to 74 Years | 4,013 | 15.8% |
| 75 to 84 Years | 1,930 | 7.6% |
| 85 Years and Over | 846 | 3.3% |
| Total | 25,479 | 100.0% |
Housing Finances in Council Bluffs
Median Income by Occupancy in Council Bluffs
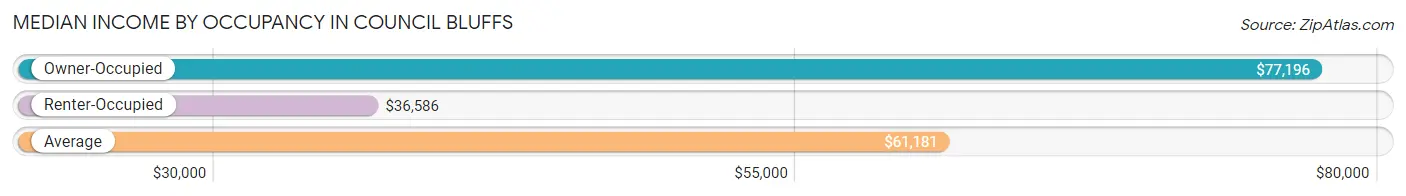
| Occupancy Type | # Households | Median Income |
| Owner-Occupied | 16,152 (63.4%) | $77,196 |
| Renter-Occupied | 9,327 (36.6%) | $36,586 |
| Average | 25,479 (100.0%) | $61,181 |
Occupancy by Householder Income Bracket in Council Bluffs
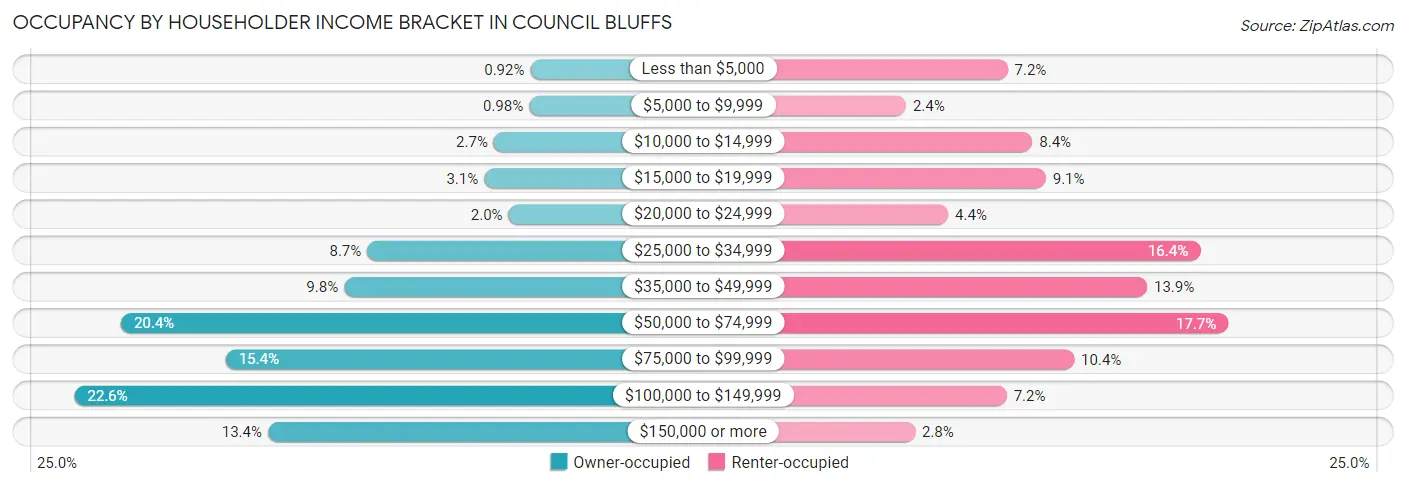
| Income Bracket | Owner-occupied | Renter-occupied |
| Less than $5,000 | 148 (0.9%) | 675 (7.2%) |
| $5,000 to $9,999 | 159 (1.0%) | 224 (2.4%) |
| $10,000 to $14,999 | 429 (2.7%) | 785 (8.4%) |
| $15,000 to $19,999 | 504 (3.1%) | 845 (9.1%) |
| $20,000 to $24,999 | 317 (2.0%) | 411 (4.4%) |
| $25,000 to $34,999 | 1,404 (8.7%) | 1,530 (16.4%) |
| $35,000 to $49,999 | 1,581 (9.8%) | 1,295 (13.9%) |
| $50,000 to $74,999 | 3,296 (20.4%) | 1,655 (17.7%) |
| $75,000 to $99,999 | 2,491 (15.4%) | 971 (10.4%) |
| $100,000 to $149,999 | 3,655 (22.6%) | 672 (7.2%) |
| $150,000 or more | 2,168 (13.4%) | 264 (2.8%) |
| Total | 16,152 (100.0%) | 9,327 (100.0%) |
Monthly Housing Cost Tiers in Council Bluffs
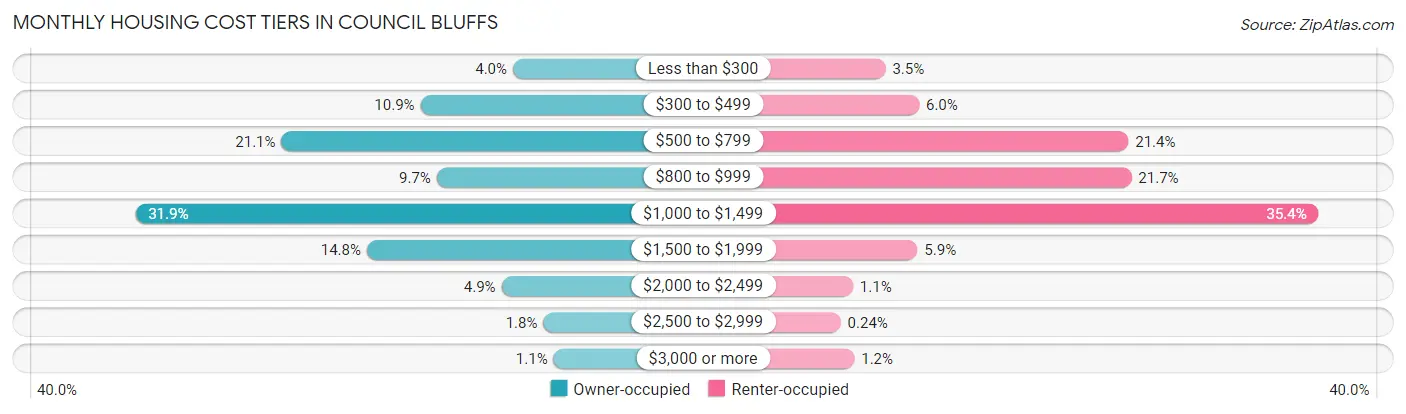
| Monthly Cost | Owner-occupied | Renter-occupied |
| Less than $300 | 652 (4.0%) | 330 (3.5%) |
| $300 to $499 | 1,752 (10.8%) | 561 (6.0%) |
| $500 to $799 | 3,407 (21.1%) | 1,998 (21.4%) |
| $800 to $999 | 1,558 (9.7%) | 2,019 (21.6%) |
| $1,000 to $1,499 | 5,145 (31.9%) | 3,305 (35.4%) |
| $1,500 to $1,999 | 2,390 (14.8%) | 549 (5.9%) |
| $2,000 to $2,499 | 788 (4.9%) | 106 (1.1%) |
| $2,500 to $2,999 | 291 (1.8%) | 22 (0.2%) |
| $3,000 or more | 169 (1.1%) | 116 (1.2%) |
| Total | 16,152 (100.0%) | 9,327 (100.0%) |
Physical Housing Characteristics in Council Bluffs
Housing Structures in Council Bluffs
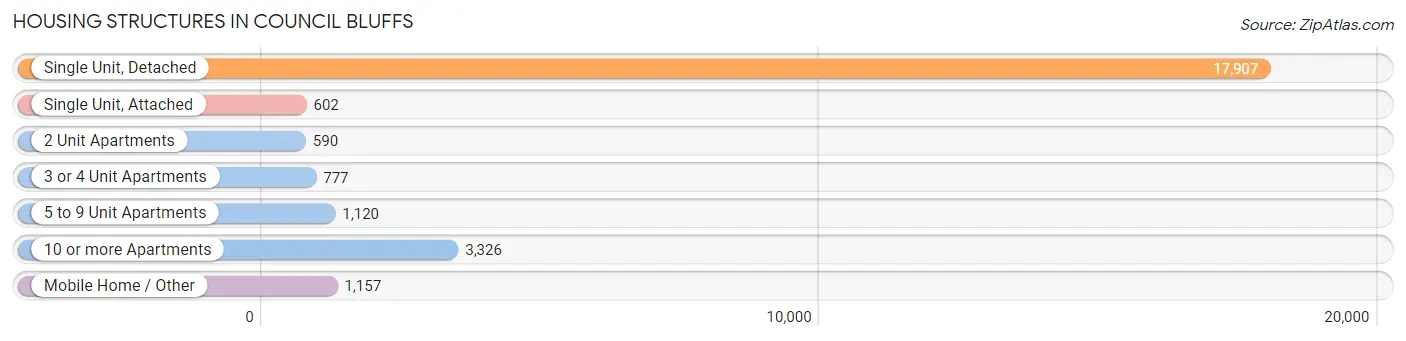
| Structure Type | # Housing Units | % Housing Units |
| Single Unit, Detached | 17,907 | 70.3% |
| Single Unit, Attached | 602 | 2.4% |
| 2 Unit Apartments | 590 | 2.3% |
| 3 or 4 Unit Apartments | 777 | 3.0% |
| 5 to 9 Unit Apartments | 1,120 | 4.4% |
| 10 or more Apartments | 3,326 | 13.1% |
| Mobile Home / Other | 1,157 | 4.5% |
| Total | 25,479 | 100.0% |
Housing Structures by Occupancy in Council Bluffs
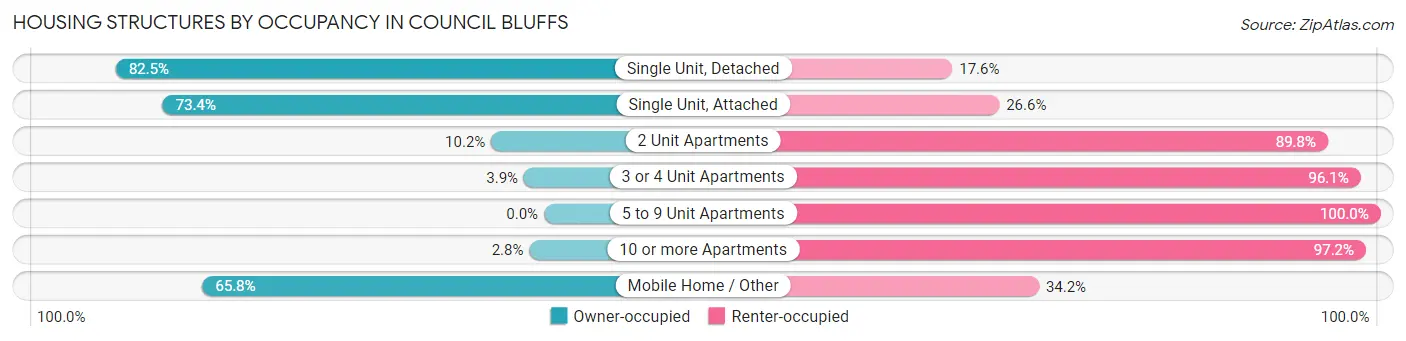
| Structure Type | Owner-occupied | Renter-occupied |
| Single Unit, Detached | 14,765 (82.5%) | 3,142 (17.5%) |
| Single Unit, Attached | 442 (73.4%) | 160 (26.6%) |
| 2 Unit Apartments | 60 (10.2%) | 530 (89.8%) |
| 3 or 4 Unit Apartments | 30 (3.9%) | 747 (96.1%) |
| 5 to 9 Unit Apartments | 0 (0.0%) | 1,120 (100.0%) |
| 10 or more Apartments | 94 (2.8%) | 3,232 (97.2%) |
| Mobile Home / Other | 761 (65.8%) | 396 (34.2%) |
| Total | 16,152 (63.4%) | 9,327 (36.6%) |
Housing Structures by Number of Rooms in Council Bluffs
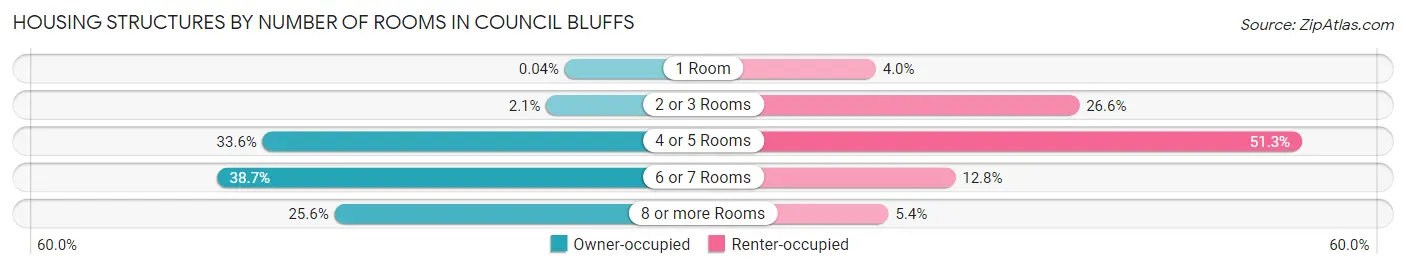
| Number of Rooms | Owner-occupied | Renter-occupied |
| 1 Room | 6 (0.0%) | 371 (4.0%) |
| 2 or 3 Rooms | 337 (2.1%) | 2,477 (26.6%) |
| 4 or 5 Rooms | 5,424 (33.6%) | 4,782 (51.3%) |
| 6 or 7 Rooms | 6,248 (38.7%) | 1,194 (12.8%) |
| 8 or more Rooms | 4,137 (25.6%) | 503 (5.4%) |
| Total | 16,152 (100.0%) | 9,327 (100.0%) |
Housing Structure by Heating Type in Council Bluffs
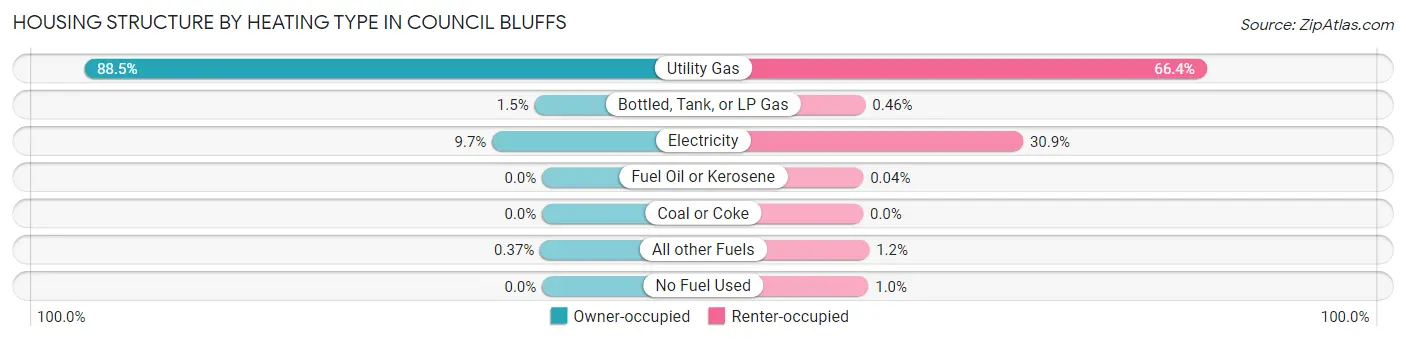
| Heating Type | Owner-occupied | Renter-occupied |
| Utility Gas | 14,297 (88.5%) | 6,192 (66.4%) |
| Bottled, Tank, or LP Gas | 237 (1.5%) | 43 (0.5%) |
| Electricity | 1,559 (9.7%) | 2,882 (30.9%) |
| Fuel Oil or Kerosene | 0 (0.0%) | 4 (0.0%) |
| Coal or Coke | 0 (0.0%) | 0 (0.0%) |
| All other Fuels | 59 (0.4%) | 112 (1.2%) |
| No Fuel Used | 0 (0.0%) | 94 (1.0%) |
| Total | 16,152 (100.0%) | 9,327 (100.0%) |
Household Vehicle Usage in Council Bluffs
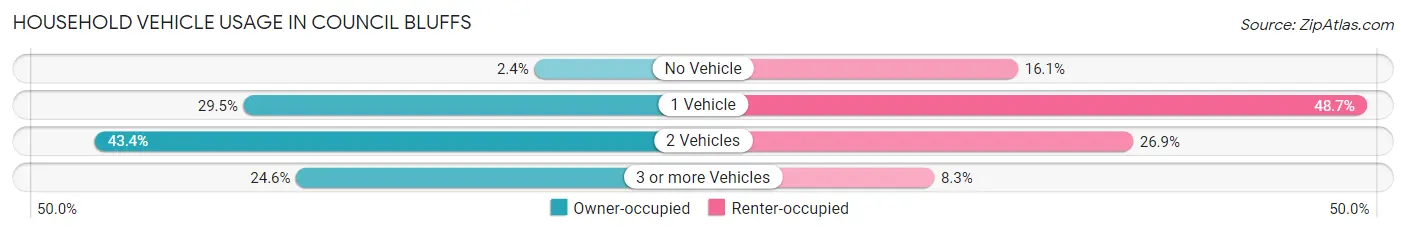
| Vehicles per Household | Owner-occupied | Renter-occupied |
| No Vehicle | 387 (2.4%) | 1,505 (16.1%) |
| 1 Vehicle | 4,771 (29.5%) | 4,541 (48.7%) |
| 2 Vehicles | 7,016 (43.4%) | 2,506 (26.9%) |
| 3 or more Vehicles | 3,978 (24.6%) | 775 (8.3%) |
| Total | 16,152 (100.0%) | 9,327 (100.0%) |
Real Estate & Mortgages in Council Bluffs
Real Estate and Mortgage Overview in Council Bluffs
| Characteristic | Without Mortgage | With Mortgage |
| Housing Units | 6,256 | 9,896 |
| Median Property Value | $135,400 | $160,900 |
| Median Household Income | $53,006 | $1,752 |
| Monthly Housing Costs | $570 | $169 |
| Real Estate Taxes | $2,643 | $179 |
Property Value by Mortgage Status in Council Bluffs
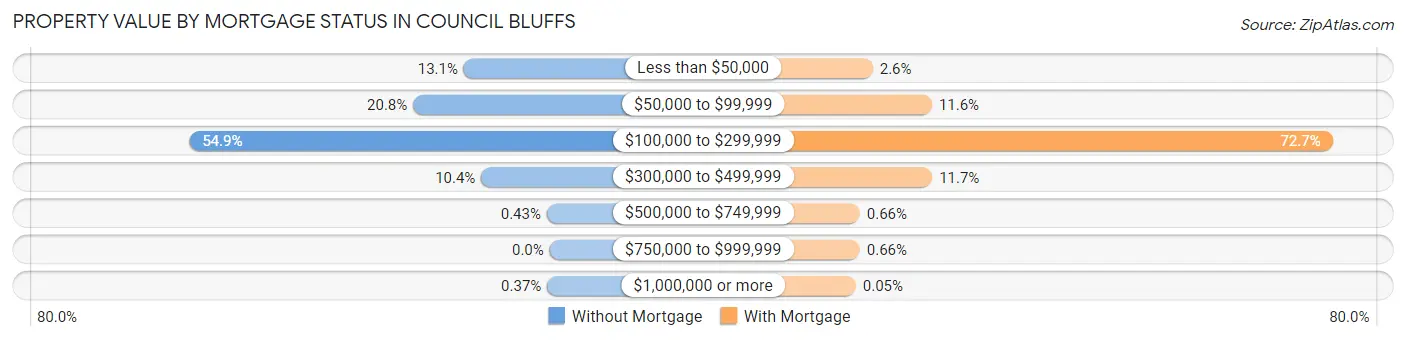
| Property Value | Without Mortgage | With Mortgage |
| Less than $50,000 | 818 (13.1%) | 260 (2.6%) |
| $50,000 to $99,999 | 1,301 (20.8%) | 1,152 (11.6%) |
| $100,000 to $299,999 | 3,435 (54.9%) | 7,193 (72.7%) |
| $300,000 to $499,999 | 652 (10.4%) | 1,156 (11.7%) |
| $500,000 to $749,999 | 27 (0.4%) | 65 (0.7%) |
| $750,000 to $999,999 | 0 (0.0%) | 65 (0.7%) |
| $1,000,000 or more | 23 (0.4%) | 5 (0.1%) |
| Total | 6,256 (100.0%) | 9,896 (100.0%) |
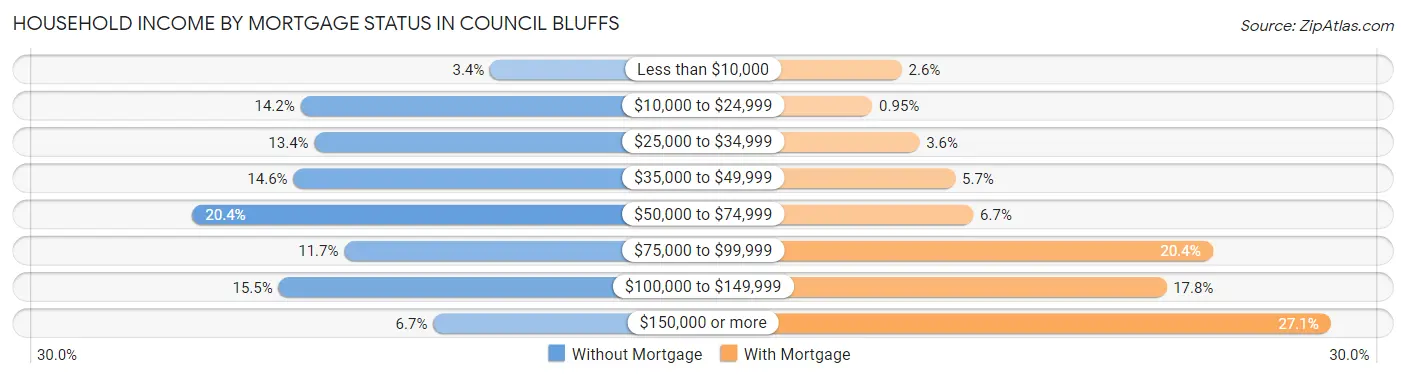
Household Income by Mortgage Status in Council Bluffs
| Household Income | Without Mortgage | With Mortgage |
| Less than $10,000 | 213 (3.4%) | 260 (2.6%) |
| $10,000 to $24,999 | 890 (14.2%) | 94 (0.9%) |
| $25,000 to $34,999 | 841 (13.4%) | 360 (3.6%) |
| $35,000 to $49,999 | 916 (14.6%) | 563 (5.7%) |
| $50,000 to $74,999 | 1,277 (20.4%) | 665 (6.7%) |
| $75,000 to $99,999 | 734 (11.7%) | 2,019 (20.4%) |
| $100,000 to $149,999 | 969 (15.5%) | 1,757 (17.7%) |
| $150,000 or more | 416 (6.7%) | 2,686 (27.1%) |
| Total | 6,256 (100.0%) | 9,896 (100.0%) |
Property Value to Household Income Ratio in Council Bluffs
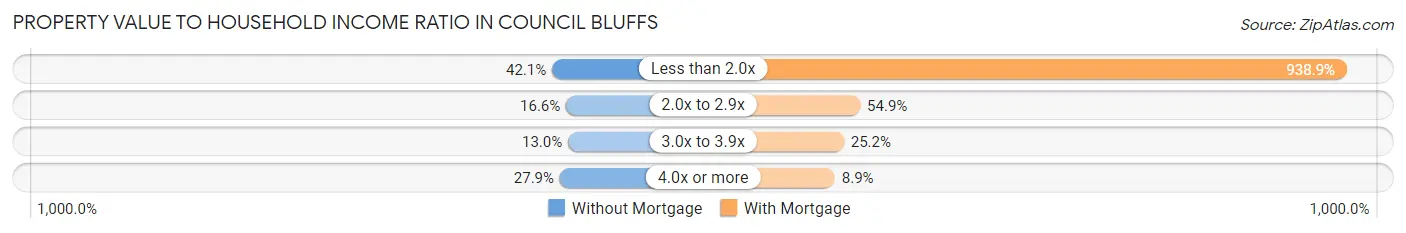
| Value-to-Income Ratio | Without Mortgage | With Mortgage |
| Less than 2.0x | 2,631 (42.1%) | 92,909 (938.9%) |
| 2.0x to 2.9x | 1,037 (16.6%) | 5,437 (54.9%) |
| 3.0x to 3.9x | 814 (13.0%) | 2,498 (25.2%) |
| 4.0x or more | 1,748 (27.9%) | 885 (8.9%) |
| Total | 6,256 (100.0%) | 9,896 (100.0%) |
Real Estate Taxes by Mortgage Status in Council Bluffs
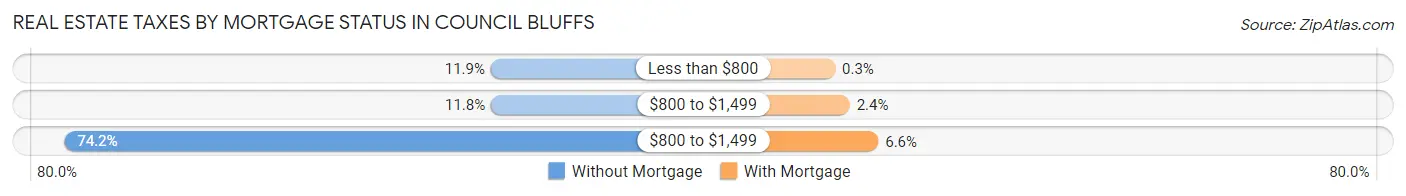
| Property Taxes | Without Mortgage | With Mortgage |
| Less than $800 | 743 (11.9%) | 30 (0.3%) |
| $800 to $1,499 | 741 (11.8%) | 241 (2.4%) |
| $800 to $1,499 | 4,642 (74.2%) | 654 (6.6%) |
| Total | 6,256 (100.0%) | 9,896 (100.0%) |
Health & Disability in Council Bluffs
Health Insurance Coverage by Age in Council Bluffs
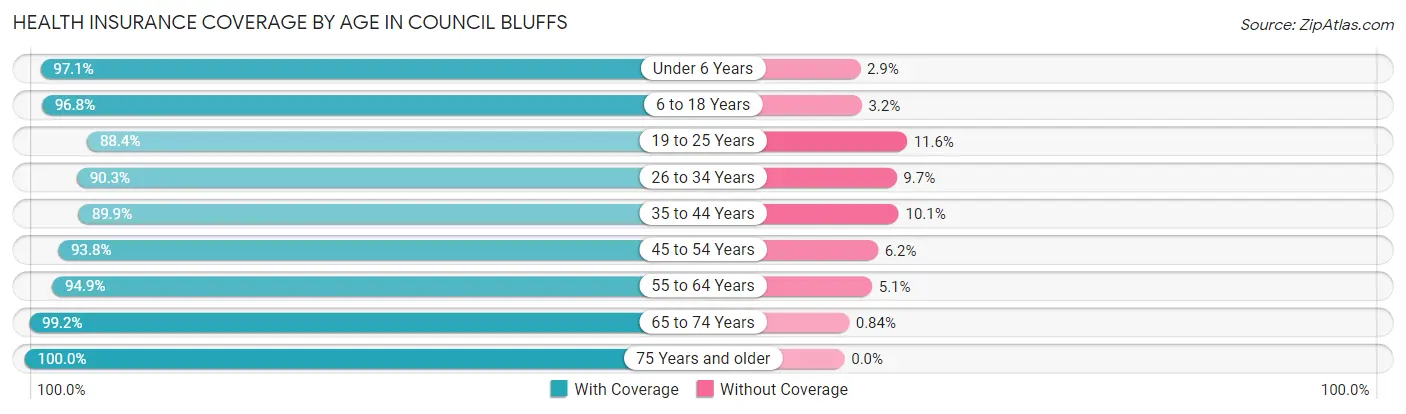
| Age Bracket | With Coverage | Without Coverage |
| Under 6 Years | 4,404 (97.1%) | 133 (2.9%) |
| 6 to 18 Years | 9,974 (96.8%) | 330 (3.2%) |
| 19 to 25 Years | 5,270 (88.4%) | 694 (11.6%) |
| 26 to 34 Years | 6,791 (90.3%) | 731 (9.7%) |
| 35 to 44 Years | 7,182 (89.9%) | 809 (10.1%) |
| 45 to 54 Years | 6,713 (93.8%) | 446 (6.2%) |
| 55 to 64 Years | 7,834 (94.9%) | 424 (5.1%) |
| 65 to 74 Years | 6,154 (99.2%) | 52 (0.8%) |
| 75 Years and older | 3,960 (100.0%) | 0 (0.0%) |
| Total | 58,282 (94.2%) | 3,619 (5.9%) |
Health Insurance Coverage by Citizenship Status in Council Bluffs
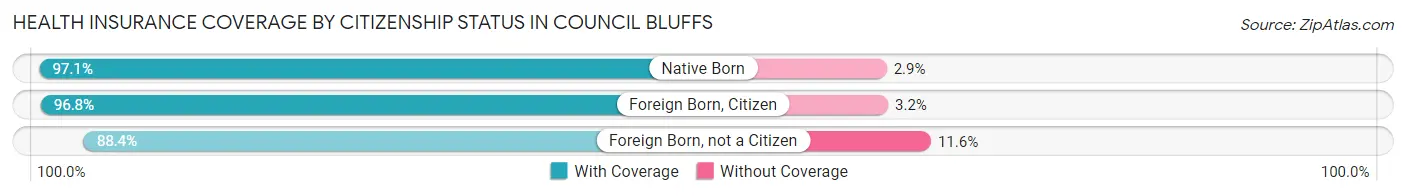
| Citizenship Status | With Coverage | Without Coverage |
| Native Born | 4,404 (97.1%) | 133 (2.9%) |
| Foreign Born, Citizen | 9,974 (96.8%) | 330 (3.2%) |
| Foreign Born, not a Citizen | 5,270 (88.4%) | 694 (11.6%) |
Health Insurance Coverage by Household Income in Council Bluffs
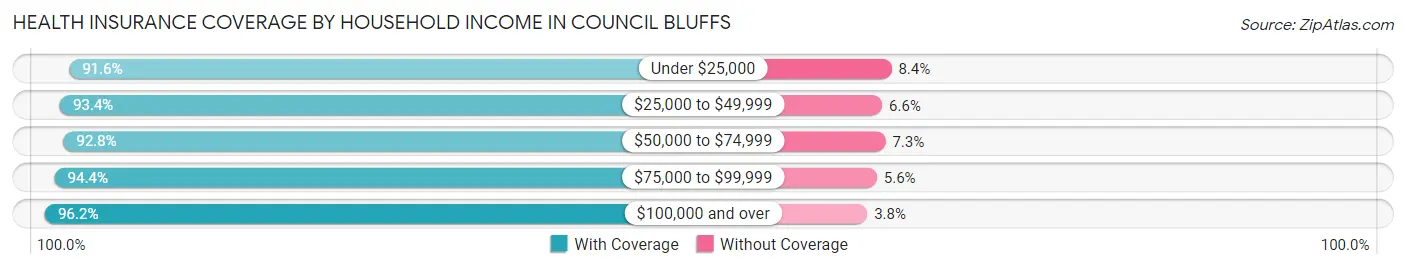
| Household Income | With Coverage | Without Coverage |
| Under $25,000 | 6,589 (91.6%) | 602 (8.4%) |
| $25,000 to $49,999 | 10,534 (93.4%) | 748 (6.6%) |
| $50,000 to $74,999 | 10,865 (92.7%) | 849 (7.2%) |
| $75,000 to $99,999 | 9,026 (94.4%) | 538 (5.6%) |
| $100,000 and over | 20,103 (96.2%) | 801 (3.8%) |
Public vs Private Health Insurance Coverage by Age in Council Bluffs
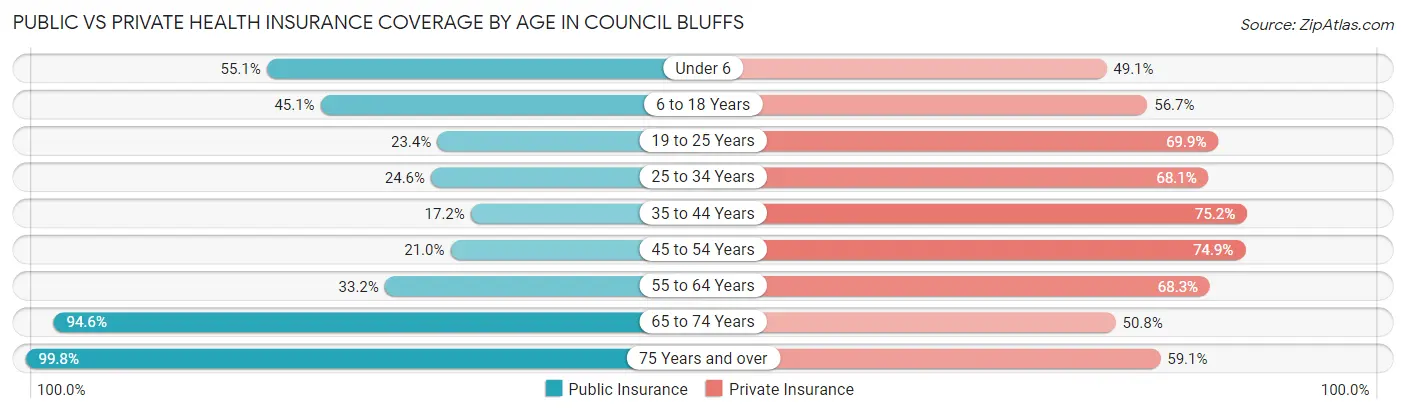
| Age Bracket | Public Insurance | Private Insurance |
| Under 6 | 2,499 (55.1%) | 2,228 (49.1%) |
| 6 to 18 Years | 4,646 (45.1%) | 5,843 (56.7%) |
| 19 to 25 Years | 1,398 (23.4%) | 4,167 (69.9%) |
| 25 to 34 Years | 1,850 (24.6%) | 5,120 (68.1%) |
| 35 to 44 Years | 1,376 (17.2%) | 6,010 (75.2%) |
| 45 to 54 Years | 1,503 (21.0%) | 5,360 (74.9%) |
| 55 to 64 Years | 2,740 (33.2%) | 5,642 (68.3%) |
| 65 to 74 Years | 5,872 (94.6%) | 3,153 (50.8%) |
| 75 Years and over | 3,953 (99.8%) | 2,341 (59.1%) |
| Total | 25,837 (41.7%) | 39,864 (64.4%) |
Disability Status by Sex by Age in Council Bluffs
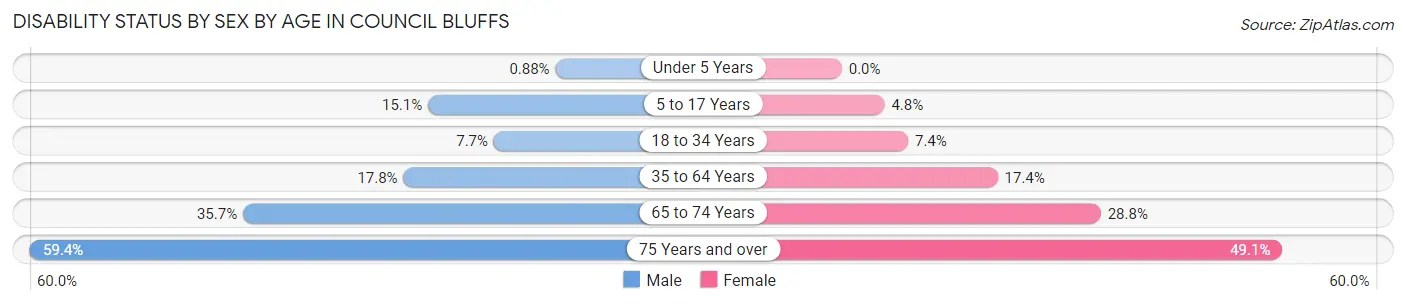
| Age Bracket | Male | Female |
| Under 5 Years | 17 (0.9%) | 0 (0.0%) |
| 5 to 17 Years | 811 (15.1%) | 230 (4.8%) |
| 18 to 34 Years | 553 (7.7%) | 539 (7.4%) |
| 35 to 64 Years | 2,051 (17.8%) | 2,063 (17.3%) |
| 65 to 74 Years | 1,045 (35.7%) | 945 (28.8%) |
| 75 Years and over | 951 (59.4%) | 1,157 (49.0%) |
Disability Class by Sex by Age in Council Bluffs
Disability Class: Hearing Difficulty
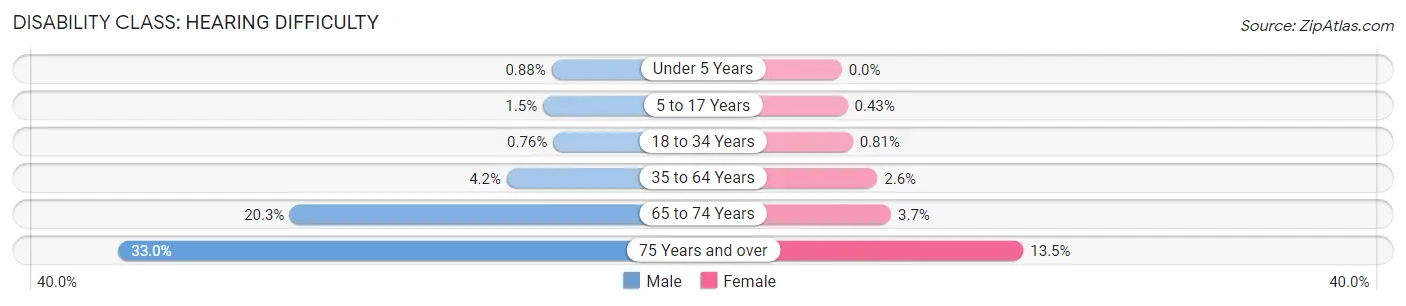
| Age Bracket | Male | Female |
| Under 5 Years | 17 (0.9%) | 0 (0.0%) |
| 5 to 17 Years | 81 (1.5%) | 21 (0.4%) |
| 18 to 34 Years | 54 (0.8%) | 59 (0.8%) |
| 35 to 64 Years | 484 (4.2%) | 314 (2.6%) |
| 65 to 74 Years | 594 (20.3%) | 120 (3.7%) |
| 75 Years and over | 529 (33.0%) | 318 (13.5%) |
Disability Class: Vision Difficulty
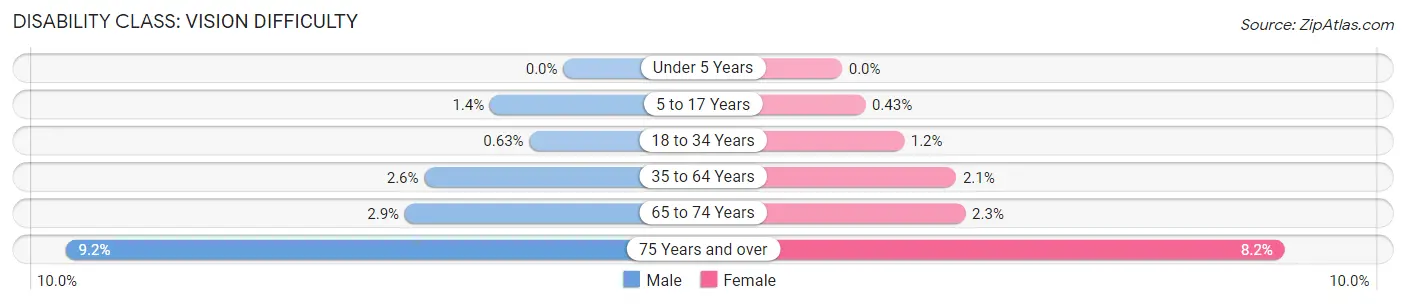
| Age Bracket | Male | Female |
| Under 5 Years | 0 (0.0%) | 0 (0.0%) |
| 5 to 17 Years | 73 (1.4%) | 21 (0.4%) |
| 18 to 34 Years | 45 (0.6%) | 84 (1.1%) |
| 35 to 64 Years | 297 (2.6%) | 252 (2.1%) |
| 65 to 74 Years | 86 (2.9%) | 75 (2.3%) |
| 75 Years and over | 148 (9.2%) | 194 (8.2%) |
Disability Class: Cognitive Difficulty
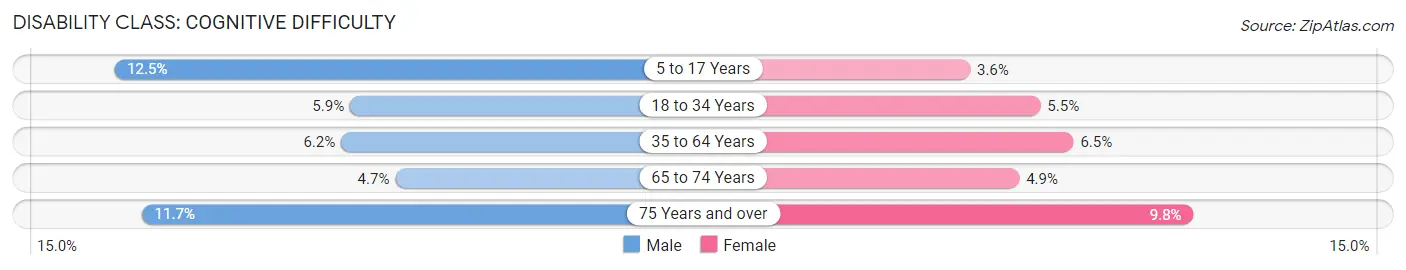
| Age Bracket | Male | Female |
| 5 to 17 Years | 673 (12.5%) | 173 (3.6%) |
| 18 to 34 Years | 424 (5.9%) | 404 (5.5%) |
| 35 to 64 Years | 713 (6.2%) | 767 (6.5%) |
| 65 to 74 Years | 137 (4.7%) | 162 (4.9%) |
| 75 Years and over | 188 (11.7%) | 231 (9.8%) |
Disability Class: Ambulatory Difficulty
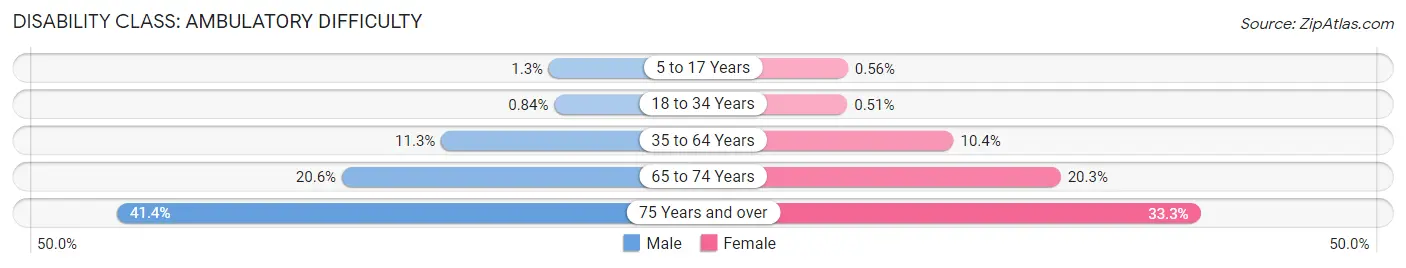
| Age Bracket | Male | Female |
| 5 to 17 Years | 72 (1.3%) | 27 (0.6%) |
| 18 to 34 Years | 60 (0.8%) | 37 (0.5%) |
| 35 to 64 Years | 1,306 (11.3%) | 1,233 (10.4%) |
| 65 to 74 Years | 602 (20.5%) | 666 (20.3%) |
| 75 Years and over | 663 (41.4%) | 785 (33.3%) |
Disability Class: Self-Care Difficulty
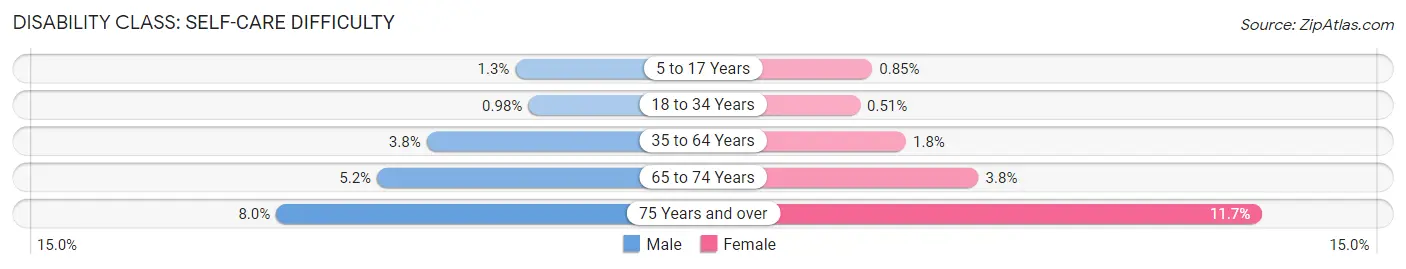
| Age Bracket | Male | Female |
| 5 to 17 Years | 72 (1.3%) | 41 (0.9%) |
| 18 to 34 Years | 70 (1.0%) | 37 (0.5%) |
| 35 to 64 Years | 439 (3.8%) | 213 (1.8%) |
| 65 to 74 Years | 152 (5.2%) | 125 (3.8%) |
| 75 Years and over | 128 (8.0%) | 276 (11.7%) |
Technology Access in Council Bluffs
Computing Device Access in Council Bluffs
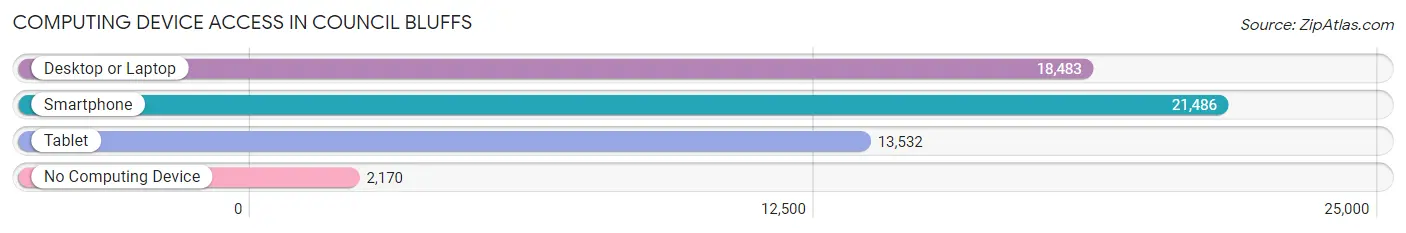
| Device Type | # Households | % Households |
| Desktop or Laptop | 18,483 | 72.5% |
| Smartphone | 21,486 | 84.3% |
| Tablet | 13,532 | 53.1% |
| No Computing Device | 2,170 | 8.5% |
| Total | 25,479 | 100.0% |
Internet Access in Council Bluffs
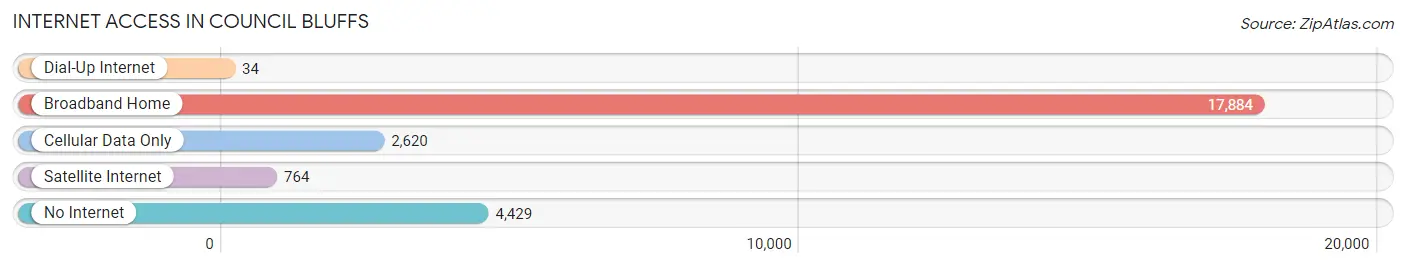
| Internet Type | # Households | % Households |
| Dial-Up Internet | 34 | 0.1% |
| Broadband Home | 17,884 | 70.2% |
| Cellular Data Only | 2,620 | 10.3% |
| Satellite Internet | 764 | 3.0% |
| No Internet | 4,429 | 17.4% |
| Total | 25,479 | 100.0% |
Council Bluffs Summary
City of Council Bluffs Iowa
Council Bluffs, Iowa is a city located in Pottawattamie County, Iowa, United States. It is located on the east bank of the Missouri River, across from Omaha, Nebraska. The city is the most populous in Southwest Iowa, with a population of 62,230 as of the 2020 census.
History
The area that is now Council Bluffs was first settled by Native Americans in the late 1700s. The first European settlers arrived in the area in 1846, and the city was officially incorporated in 1853. The city was named after the Council Bluff, a prominent bluff overlooking the Missouri River.
The city was an important stop on the Oregon Trail, and it was also a major hub for the Union Pacific Railroad. During the Civil War, the city was a major supply center for the Union Army.
In the late 19th century, Council Bluffs became a major industrial center, with several large factories and mills. The city was also a major center for the meatpacking industry.
Geography
Council Bluffs is located in the Loess Hills region of Iowa, at the confluence of the Missouri and Platte Rivers. The city is located in the western part of the state, about 20 miles south of Omaha, Nebraska.
The city has a total area of 28.2 square miles, of which 27.9 square miles is land and 0.3 square miles is water. The city is located at an elevation of 1,068 feet above sea level.
Economy
Council Bluffs is a major economic center in Southwest Iowa. The city is home to several large employers, including Tyson Foods, Hormel Foods, and Wells Fargo. The city is also home to several major retail centers, including the Mall of the Bluffs and the Council Bluffs Outlet Mall.
The city is also home to several major medical centers, including the Jennie Edmundson Hospital and the Methodist Jennie Edmundson Hospital.
Demographics
As of the 2020 census, the population of Council Bluffs was 62,230. The racial makeup of the city was 79.2% White, 11.2% African American, 0.7% Native American, 2.2% Asian, 0.1% Pacific Islander, 4.2% from other races, and 2.6% from two or more races. Hispanic or Latino of any race were 8.7% of the population.
The median household income in Council Bluffs was $45,945, and the median family income was $54,945. The per capita income for the city was $23,945. About 11.2% of the population was below the poverty line.
Common Questions
What is the Total Population of Council Bluffs?
Total Population of Council Bluffs is 62,670.
What is the Total Male Population of Council Bluffs?
Total Male Population of Council Bluffs is 30,880.
What is the Total Female Population of Council Bluffs?
Total Female Population of Council Bluffs is 31,790.
What is the Ratio of Males per 100 Females in Council Bluffs?
There are 97.14 Males per 100 Females in Council Bluffs.
What is the Ratio of Females per 100 Males in Council Bluffs?
There are 102.95 Females per 100 Males in Council Bluffs.
What is the Median Population Age in Council Bluffs?
Median Population Age in Council Bluffs is 38.4 Years.
What is the Average Family Size in Council Bluffs
Average Family Size in Council Bluffs is 3.0 People.
What is the Average Household Size in Council Bluffs
Average Household Size in Council Bluffs is 2.4 People.
What is Per Capita Income in Council Bluffs?
Per Capita income in Council Bluffs is $31,946.
What is the Median Family Income in Council Bluffs?
Median Family Income in Council Bluffs is $74,876.
What is the Median Household income in Council Bluffs?
Median Household Income in Council Bluffs is $61,181.
What is Income or Wage Gap in Council Bluffs?
Income or Wage Gap in Council Bluffs is 24.9%.
Women in Council Bluffs earn 75.1 cents for every dollar earned by a man.
What is Family Income Deficit in Council Bluffs?
Family Income Deficit in Council Bluffs is $12,393.
Families that are below poverty line in Council Bluffs earn $12,393 less on average than the poverty threshold level.
What is Inequality or Gini Index in Council Bluffs?
Inequality or Gini Index in Council Bluffs is 0.43.
How Large is the Labor Force in Council Bluffs?
There are 32,081 People in the Labor Forcein in Council Bluffs.
What is the Percentage of People in the Labor Force in Council Bluffs?
63.5% of People are in the Labor Force in Council Bluffs.
What is the Unemployment Rate in Council Bluffs?
Unemployment Rate in Council Bluffs is 4.2%.