Louisville, GA
Louisville Map
Louisville Overview
2,704
TOTAL POPULATION
1,459
MALE POPULATION
1,245
FEMALE POPULATION
117.19
MALES / 100 FEMALES
85.33
FEMALES / 100 MALES
33.0
MEDIAN AGE
3.3
AVG FAMILY SIZE
2.6
AVG HOUSEHOLD SIZE
$25,088
PER CAPITA INCOME
$49,475
AVG FAMILY INCOME
$43,194
AVG HOUSEHOLD INCOME
17.2%
WAGE / INCOME GAP [ % ]
82.8¢/ $1
WAGE / INCOME GAP [ $ ]
0.55
INEQUALITY / GINI INDEX
1,013
LABOR FORCE [ PEOPLE ]
48.3%
PERCENT IN LABOR FORCE
3.1%
UNEMPLOYMENT RATE
Louisville Zip Codes
Louisville Area Codes
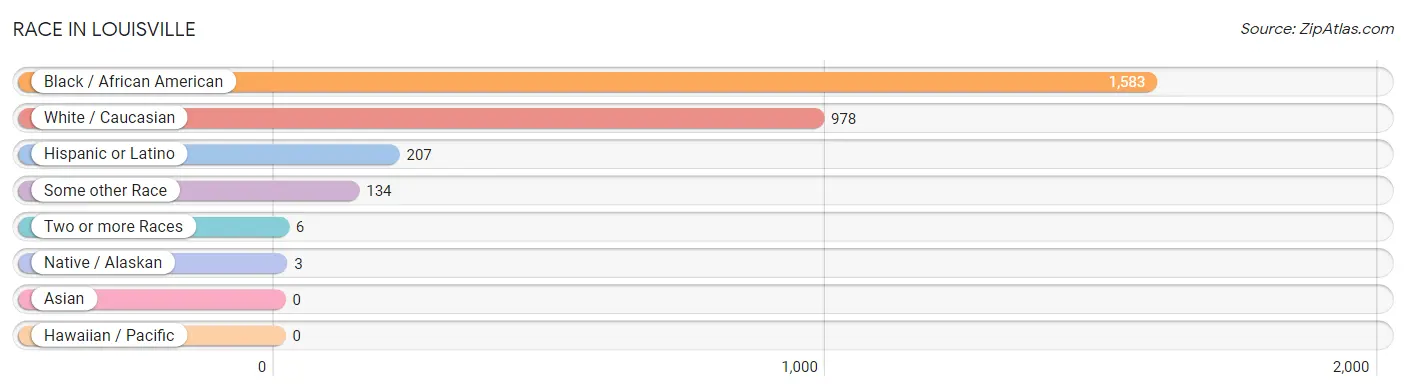
Race in Louisville
The most populous races in Louisville are Black / African American (1,583 | 58.5%), White / Caucasian (978 | 36.2%), and Hispanic or Latino (207 | 7.7%).
| Race | # Population | % Population |
| Asian | 0 | 0.0% |
| Black / African American | 1,583 | 58.5% |
| Hawaiian / Pacific | 0 | 0.0% |
| Hispanic or Latino | 207 | 7.7% |
| Native / Alaskan | 3 | 0.1% |
| White / Caucasian | 978 | 36.2% |
| Two or more Races | 6 | 0.2% |
| Some other Race | 134 | 5.0% |
| Total | 2,704 | 100.0% |
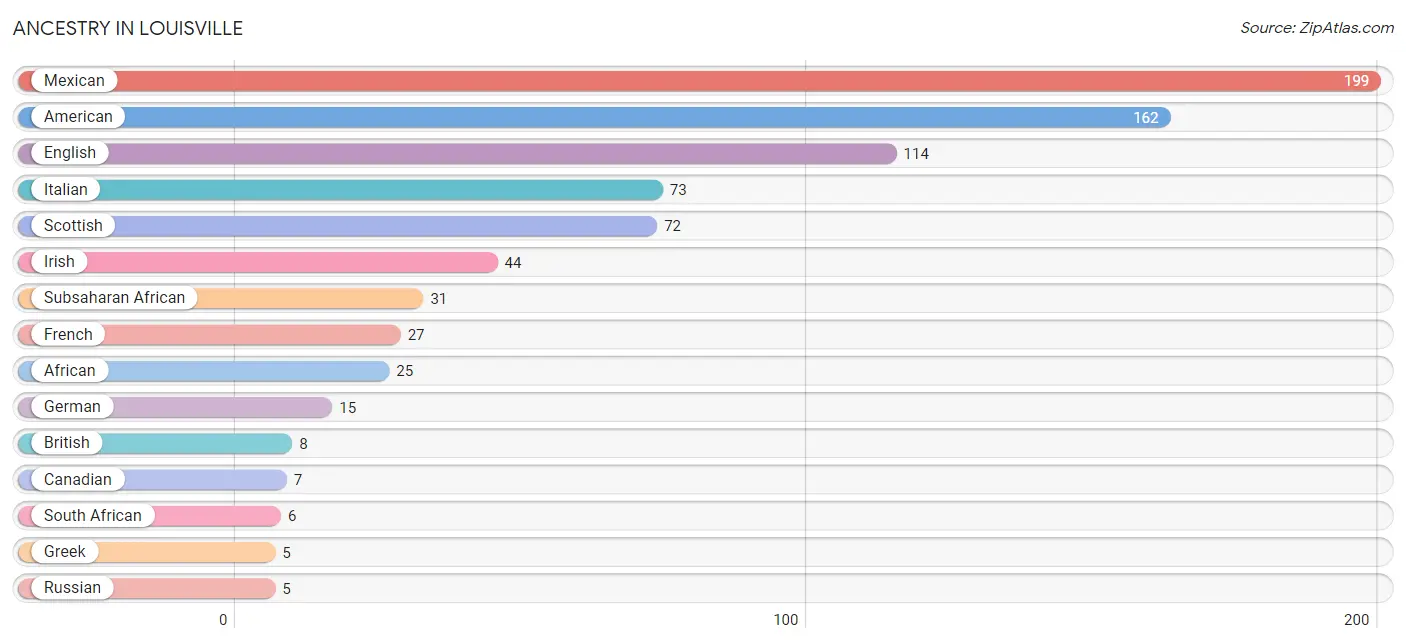
Ancestry in Louisville
The most populous ancestries reported in Louisville are Mexican (199 | 7.4%), American (162 | 6.0%), English (114 | 4.2%), Italian (73 | 2.7%), and Scottish (72 | 2.7%), together accounting for 22.9% of all Louisville residents.
| Ancestry | # Population | % Population |
| African | 25 | 0.9% |
| American | 162 | 6.0% |
| British | 8 | 0.3% |
| Canadian | 7 | 0.3% |
| Cherokee | 3 | 0.1% |
| English | 114 | 4.2% |
| French | 27 | 1.0% |
| German | 15 | 0.5% |
| Greek | 5 | 0.2% |
| Irish | 44 | 1.6% |
| Italian | 73 | 2.7% |
| Mexican | 199 | 7.4% |
| Russian | 5 | 0.2% |
| Scottish | 72 | 2.7% |
| South African | 6 | 0.2% |
| Subsaharan African | 31 | 1.1% | View All 16 Rows |
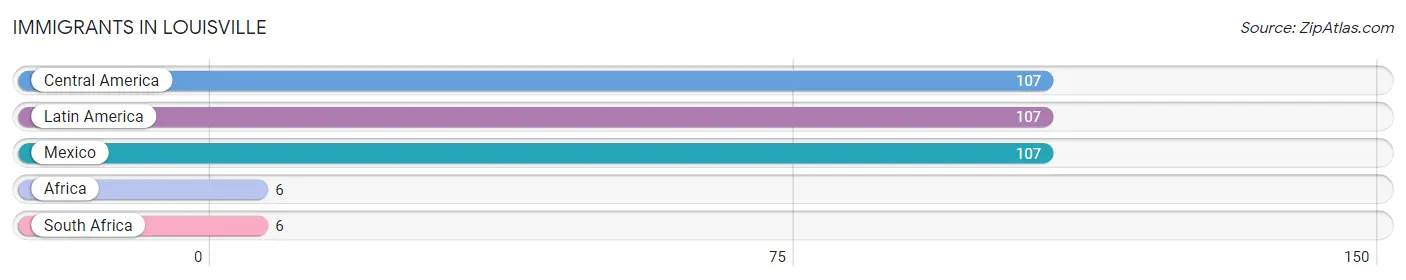
Immigrants in Louisville
The most numerous immigrant groups reported in Louisville came from Central America (107 | 4.0%), Latin America (107 | 4.0%), Mexico (107 | 4.0%), Africa (6 | 0.2%), and South Africa (6 | 0.2%), together accounting for 12.3% of all Louisville residents.
| Immigration Origin | # Population | % Population |
| Africa | 6 | 0.2% |
| Central America | 107 | 4.0% |
| Latin America | 107 | 4.0% |
| Mexico | 107 | 4.0% |
| South Africa | 6 | 0.2% | View All 5 Rows |
Sex and Age in Louisville
Sex and Age in Louisville
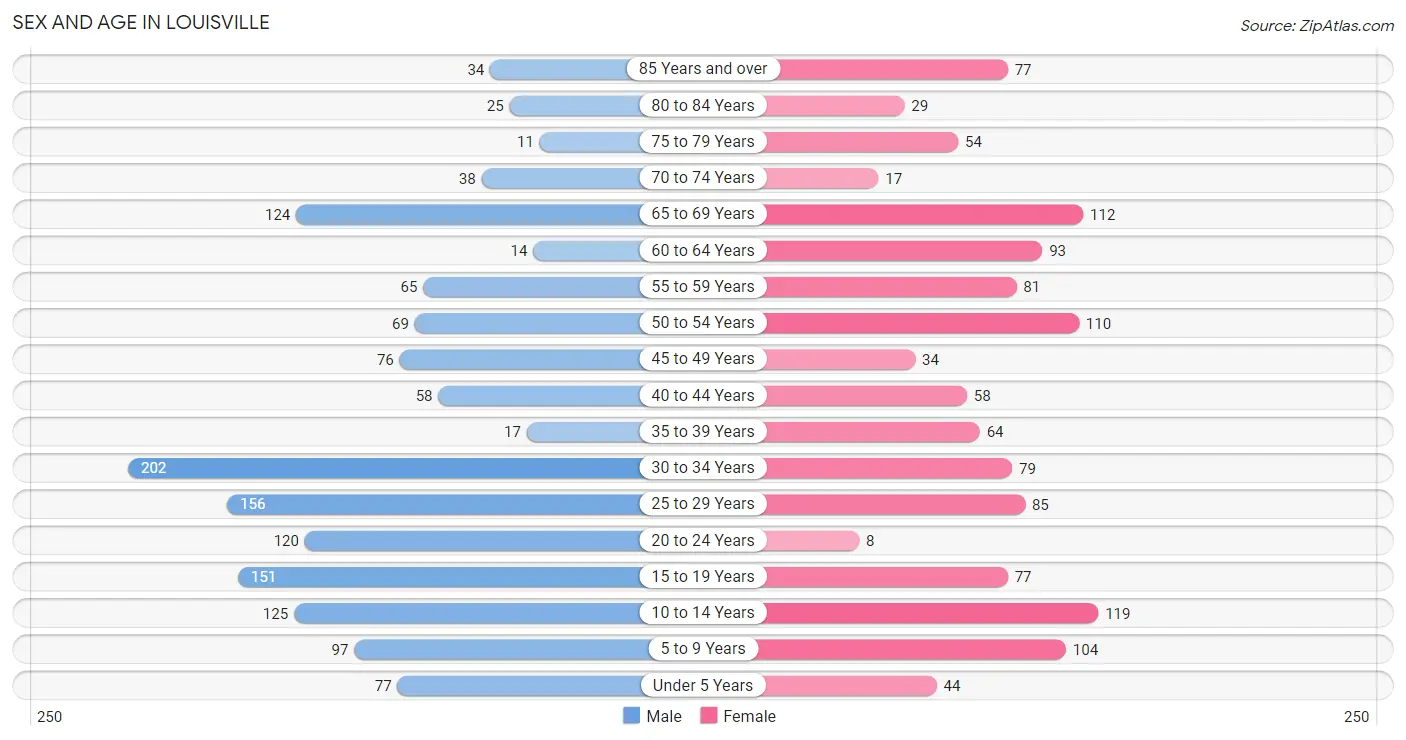
The most populous age groups in Louisville are 30 to 34 Years (202 | 13.9%) for men and 10 to 14 Years (119 | 9.6%) for women.
| Age Bracket | Male | Female |
| Under 5 Years | 77 (5.3%) | 44 (3.5%) |
| 5 to 9 Years | 97 (6.7%) | 104 (8.4%) |
| 10 to 14 Years | 125 (8.6%) | 119 (9.6%) |
| 15 to 19 Years | 151 (10.3%) | 77 (6.2%) |
| 20 to 24 Years | 120 (8.2%) | 8 (0.6%) |
| 25 to 29 Years | 156 (10.7%) | 85 (6.8%) |
| 30 to 34 Years | 202 (13.9%) | 79 (6.4%) |
| 35 to 39 Years | 17 (1.2%) | 64 (5.1%) |
| 40 to 44 Years | 58 (4.0%) | 58 (4.7%) |
| 45 to 49 Years | 76 (5.2%) | 34 (2.7%) |
| 50 to 54 Years | 69 (4.7%) | 110 (8.8%) |
| 55 to 59 Years | 65 (4.5%) | 81 (6.5%) |
| 60 to 64 Years | 14 (1.0%) | 93 (7.5%) |
| 65 to 69 Years | 124 (8.5%) | 112 (9.0%) |
| 70 to 74 Years | 38 (2.6%) | 17 (1.4%) |
| 75 to 79 Years | 11 (0.7%) | 54 (4.3%) |
| 80 to 84 Years | 25 (1.7%) | 29 (2.3%) |
| 85 Years and over | 34 (2.3%) | 77 (6.2%) |
| Total | 1,459 (100.0%) | 1,245 (100.0%) |
Families and Households in Louisville
Median Family Size in Louisville
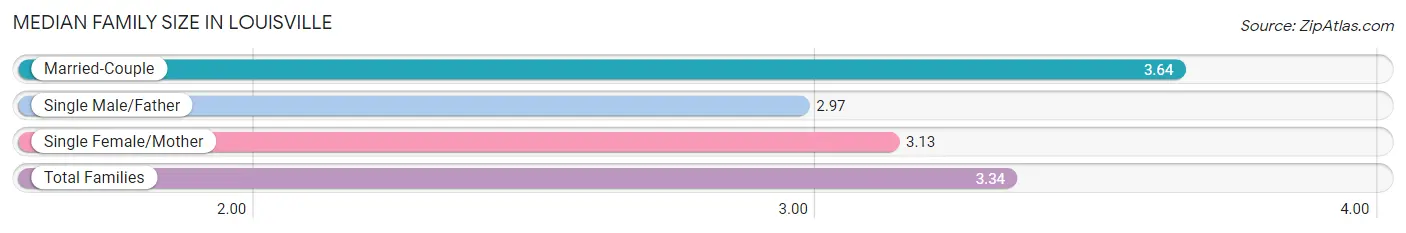
The median family size in Louisville is 3.34 persons per family, with married-couple families (278 | 43.8%) accounting for the largest median family size of 3.64 persons per family. On the other hand, single male/father families (79 | 12.4%) represent the smallest median family size with 2.97 persons per family.
| Family Type | # Families | Family Size |
| Married-Couple | 278 (43.8%) | 3.64 |
| Single Male/Father | 79 (12.4%) | 2.97 |
| Single Female/Mother | 278 (43.8%) | 3.13 |
| Total Families | 635 (100.0%) | 3.34 |
Median Household Size in Louisville
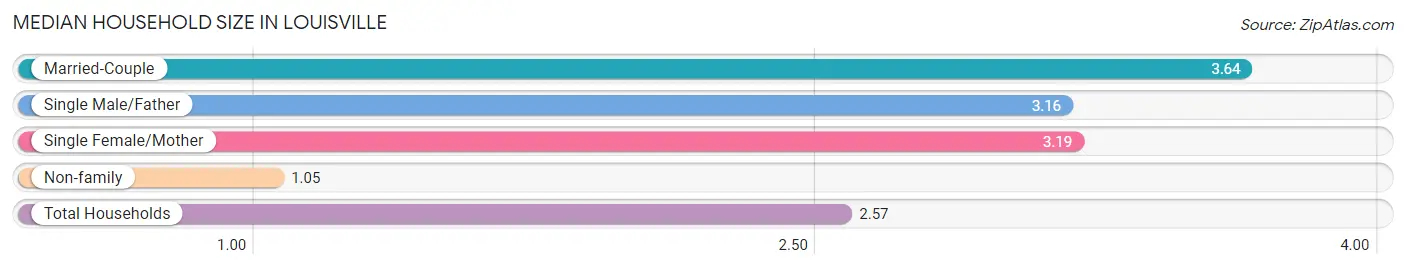
The median household size in Louisville is 2.57 persons per household, with married-couple households (278 | 28.4%) accounting for the largest median household size of 3.64 persons per household. non-family households (342 | 35.0%) represent the smallest median household size with 1.05 persons per household.
| Household Type | # Households | Household Size |
| Married-Couple | 278 (28.4%) | 3.64 |
| Single Male/Father | 79 (8.1%) | 3.16 |
| Single Female/Mother | 278 (28.4%) | 3.19 |
| Non-family | 342 (35.0%) | 1.05 |
| Total Households | 977 (100.0%) | 2.57 |
Household Size by Marriage Status in Louisville
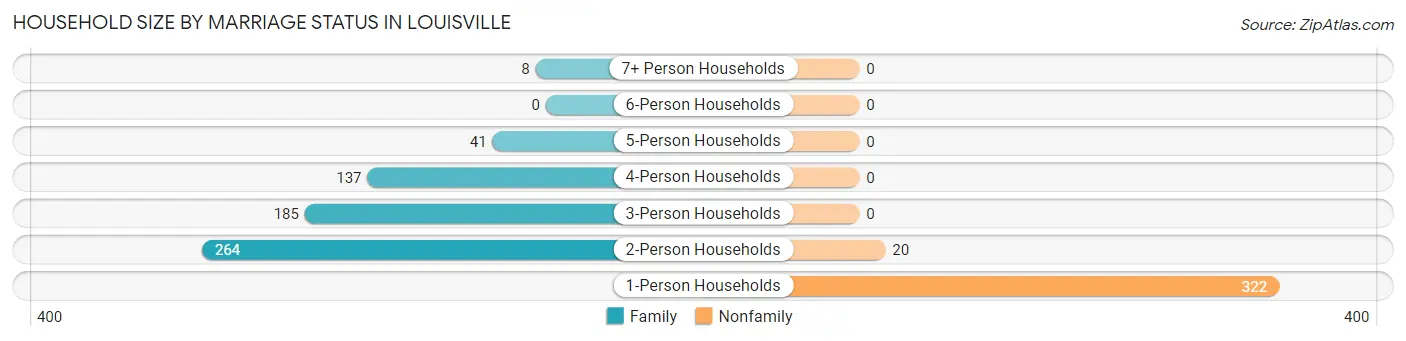
Out of a total of 977 households in Louisville, 635 (65.0%) are family households, while 342 (35.0%) are nonfamily households. The most numerous type of family households are 2-person households, comprising 264, and the most common type of nonfamily households are 1-person households, comprising 322.
| Household Size | Family Households | Nonfamily Households |
| 1-Person Households | - | 322 (33.0%) |
| 2-Person Households | 264 (27.0%) | 20 (2.1%) |
| 3-Person Households | 185 (18.9%) | 0 (0.0%) |
| 4-Person Households | 137 (14.0%) | 0 (0.0%) |
| 5-Person Households | 41 (4.2%) | 0 (0.0%) |
| 6-Person Households | 0 (0.0%) | 0 (0.0%) |
| 7+ Person Households | 8 (0.8%) | 0 (0.0%) |
| Total | 635 (65.0%) | 342 (35.0%) |
Female Fertility in Louisville
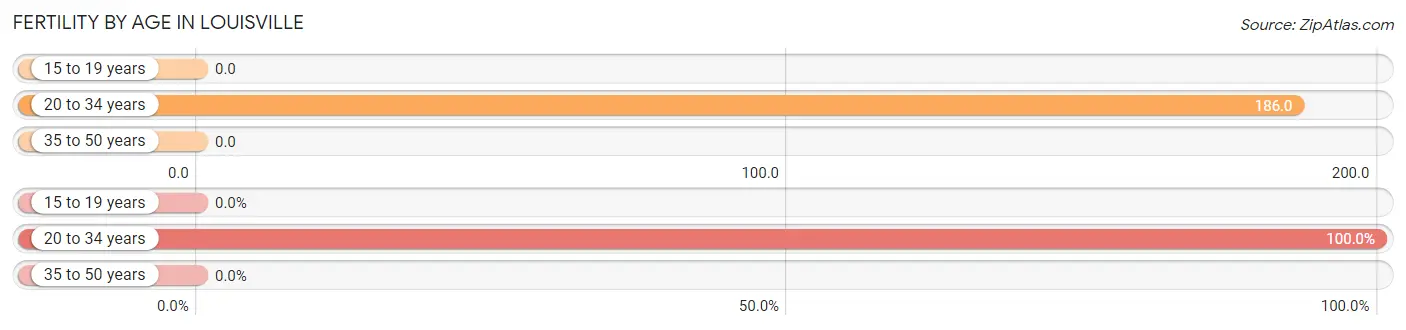
Fertility by Age in Louisville
Average fertility rate in Louisville is 74.0 births per 1,000 women. Women in the age bracket of 20 to 34 years have the highest fertility rate with 186.0 births per 1,000 women. Women in the age bracket of 20 to 34 years acount for 100.0% of all women with births.
| Age Bracket | Women with Births | Births / 1,000 Women |
| 15 to 19 years | 0 (0.0%) | 0.0 |
| 20 to 34 years | 32 (100.0%) | 186.0 |
| 35 to 50 years | 0 (0.0%) | 0.0 |
| Total | 32 (100.0%) | 74.0 |
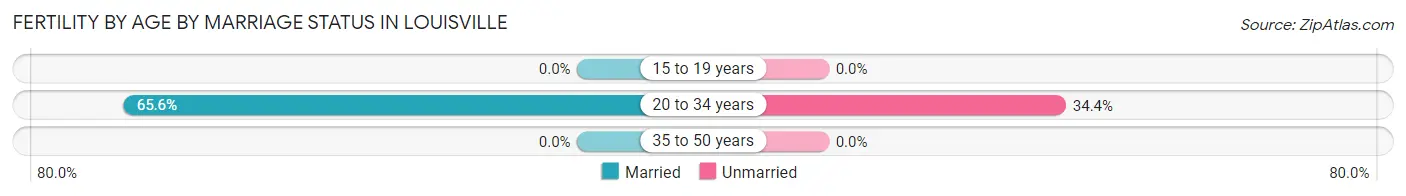
Fertility by Age by Marriage Status in Louisville
65.6% of women with births (32) in Louisville are married. The highest percentage of unmarried women with births falls into 20 to 34 years age bracket with 34.4% of them unmarried at the time of birth, while the lowest percentage of unmarried women with births belong to 20 to 34 years age bracket with 34.4% of them unmarried.
| Age Bracket | Married | Unmarried |
| 15 to 19 years | 0 (0.0%) | 0 (0.0%) |
| 20 to 34 years | 21 (65.6%) | 11 (34.4%) |
| 35 to 50 years | 0 (0.0%) | 0 (0.0%) |
| Total | 21 (65.6%) | 11 (34.4%) |
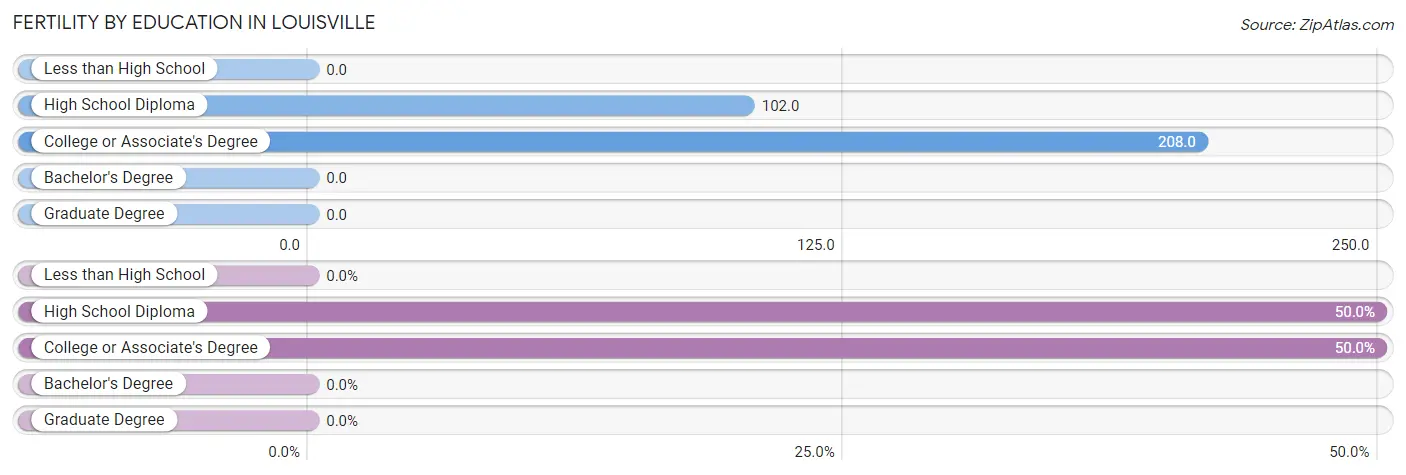
Fertility by Education in Louisville
| Educational Attainment | Women with Births | Births / 1,000 Women |
| Less than High School | 0 (0.0%) | 0.0 |
| High School Diploma | 16 (50.0%) | 102.0 |
| College or Associate's Degree | 16 (50.0%) | 208.0 |
| Bachelor's Degree | 0 (0.0%) | 0.0 |
| Graduate Degree | 0 (0.0%) | 0.0 |
| Total | 32 (100.0%) | 74.0 |
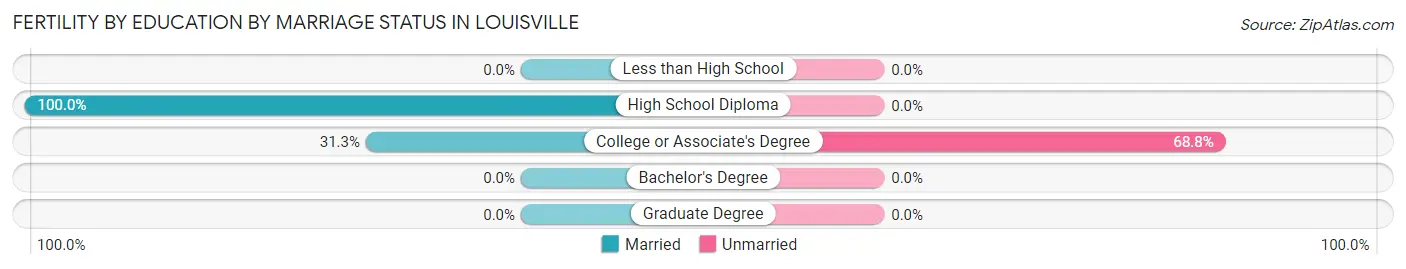
Fertility by Education by Marriage Status in Louisville
34.4% of women with births in Louisville are unmarried. Women with the educational attainment of high school diploma are most likely to be married with 100.0% of them married at childbirth, while women with the educational attainment of college or associate's degree are least likely to be married with 68.8% of them unmarried at childbirth.
| Educational Attainment | Married | Unmarried |
| Less than High School | 0 (0.0%) | 0 (0.0%) |
| High School Diploma | 16 (100.0%) | 0 (0.0%) |
| College or Associate's Degree | 5 (31.2%) | 11 (68.8%) |
| Bachelor's Degree | 0 (0.0%) | 0 (0.0%) |
| Graduate Degree | 0 (0.0%) | 0 (0.0%) |
| Total | 21 (65.6%) | 11 (34.4%) |
Income in Louisville
Income Overview in Louisville
Per Capita Income in Louisville is $25,088, while median incomes of families and households are $49,475 and $43,194 respectively.
| Characteristic | Number | Measure |
| Per Capita Income | 2,704 | $25,088 |
| Median Family Income | 635 | $49,475 |
| Mean Family Income | 635 | $57,977 |
| Median Household Income | 977 | $43,194 |
| Mean Household Income | 977 | $65,087 |
| Income Deficit | 635 | $0 |
| Wage / Income Gap (%) | 2,704 | 17.21% |
| Wage / Income Gap ($) | 2,704 | 82.79¢ per $1 |
| Gini / Inequality Index | 2,704 | 0.55 |
Earnings by Sex in Louisville
Average Earnings in Louisville are $24,605, $23,182 for men and $28,000 for women, a difference of 17.2%.
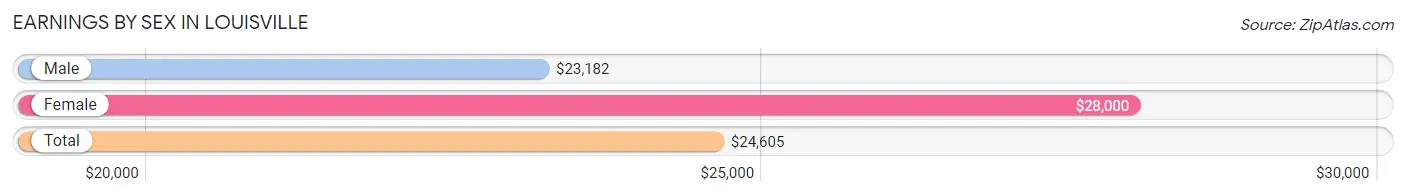
| Sex | Number | Average Earnings |
| Male | 736 (63.8%) | $23,182 |
| Female | 418 (36.2%) | $28,000 |
| Total | 1,154 (100.0%) | $24,605 |
Earnings by Sex by Income Bracket in Louisville
The most common earnings brackets in Louisville are $10,000 to $12,499 for men (124 | 16.9%) and $25,000 to $29,999 for women (54 | 12.9%).
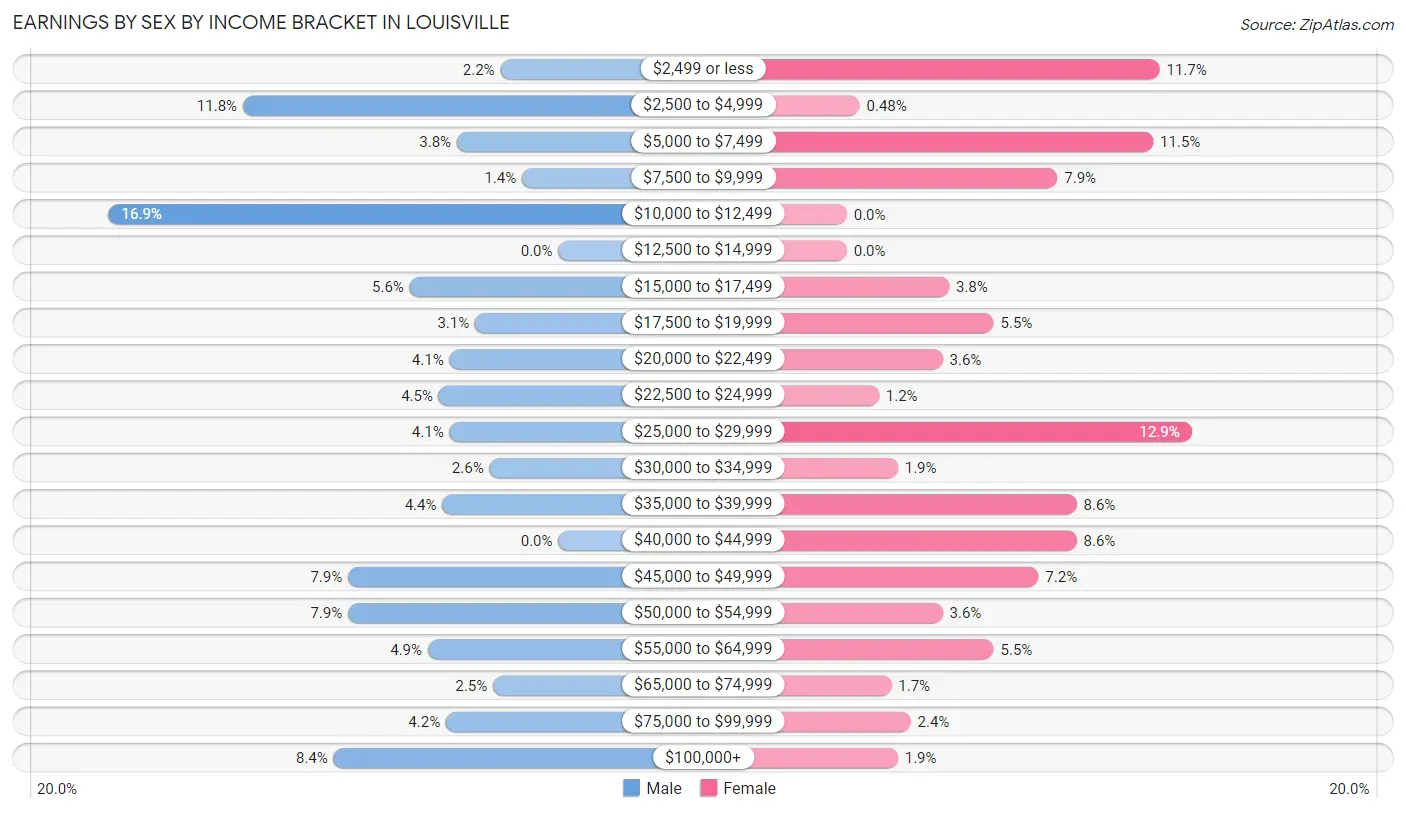
| Income | Male | Female |
| $2,499 or less | 16 (2.2%) | 49 (11.7%) |
| $2,500 to $4,999 | 87 (11.8%) | 2 (0.5%) |
| $5,000 to $7,499 | 28 (3.8%) | 48 (11.5%) |
| $7,500 to $9,999 | 10 (1.4%) | 33 (7.9%) |
| $10,000 to $12,499 | 124 (16.9%) | 0 (0.0%) |
| $12,500 to $14,999 | 0 (0.0%) | 0 (0.0%) |
| $15,000 to $17,499 | 41 (5.6%) | 16 (3.8%) |
| $17,500 to $19,999 | 23 (3.1%) | 23 (5.5%) |
| $20,000 to $22,499 | 30 (4.1%) | 15 (3.6%) |
| $22,500 to $24,999 | 33 (4.5%) | 5 (1.2%) |
| $25,000 to $29,999 | 30 (4.1%) | 54 (12.9%) |
| $30,000 to $34,999 | 19 (2.6%) | 8 (1.9%) |
| $35,000 to $39,999 | 32 (4.3%) | 36 (8.6%) |
| $40,000 to $44,999 | 0 (0.0%) | 36 (8.6%) |
| $45,000 to $49,999 | 58 (7.9%) | 30 (7.2%) |
| $50,000 to $54,999 | 58 (7.9%) | 15 (3.6%) |
| $55,000 to $64,999 | 36 (4.9%) | 23 (5.5%) |
| $65,000 to $74,999 | 18 (2.5%) | 7 (1.7%) |
| $75,000 to $99,999 | 31 (4.2%) | 10 (2.4%) |
| $100,000+ | 62 (8.4%) | 8 (1.9%) |
| Total | 736 (100.0%) | 418 (100.0%) |
Earnings by Sex by Educational Attainment in Louisville
Average earnings in Louisville are $35,250 for men and $28,389 for women, a difference of 19.5%. Men with an educational attainment of bachelor's degree enjoy the highest average annual earnings of $76,250, while those with less than high school education earn the least with $16,555. Women with an educational attainment of bachelor's degree earn the most with the average annual earnings of $52,604, while those with less than high school education have the smallest earnings of $19,722.
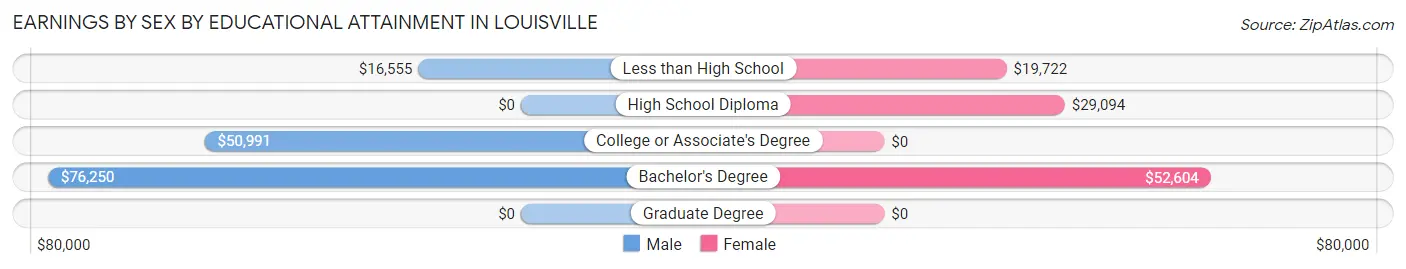
| Educational Attainment | Male Income | Female Income |
| Less than High School | $16,555 | $19,722 |
| High School Diploma | - | - |
| College or Associate's Degree | $50,991 | $0 |
| Bachelor's Degree | $76,250 | $52,604 |
| Graduate Degree | - | - |
| Total | $35,250 | $28,389 |
Family Income in Louisville
Family Income Brackets in Louisville
According to the Louisville family income data, there are 137 families falling into the $35,000 to $49,999 income range, which is the most common income bracket and makes up 21.6% of all families. Conversely, the $200,000+ income bracket is the least frequent group with only 8 families (1.3%) belonging to this category.
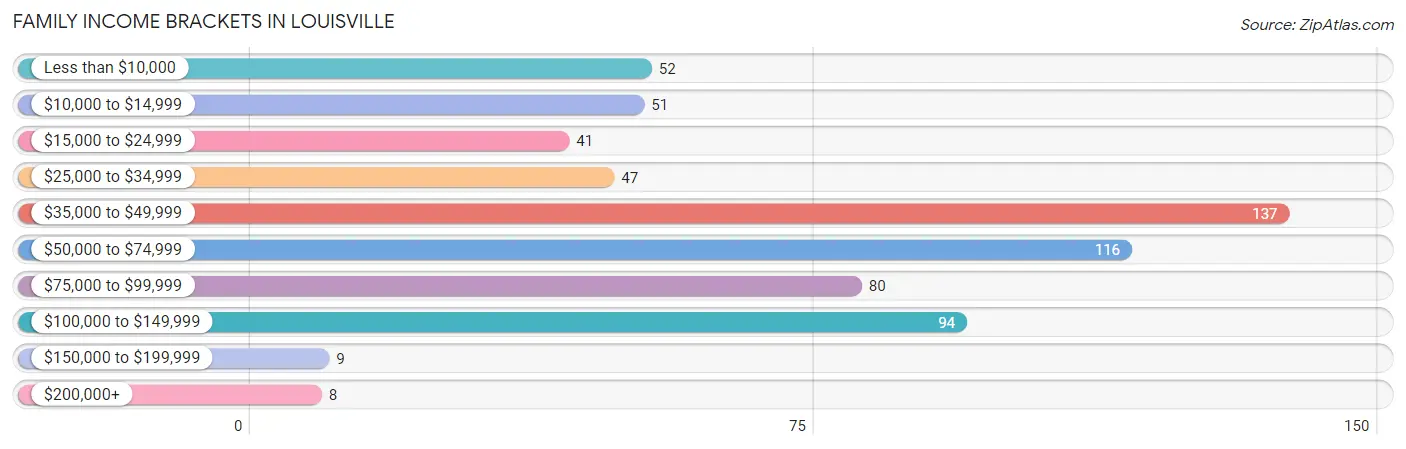
| Income Bracket | # Families | % Families |
| Less than $10,000 | 52 | 8.2% |
| $10,000 to $14,999 | 51 | 8.0% |
| $15,000 to $24,999 | 41 | 6.5% |
| $25,000 to $34,999 | 47 | 7.4% |
| $35,000 to $49,999 | 137 | 21.6% |
| $50,000 to $74,999 | 116 | 18.3% |
| $75,000 to $99,999 | 80 | 12.6% |
| $100,000 to $149,999 | 94 | 14.8% |
| $150,000 to $199,999 | 9 | 1.4% |
| $200,000+ | 8 | 1.3% |
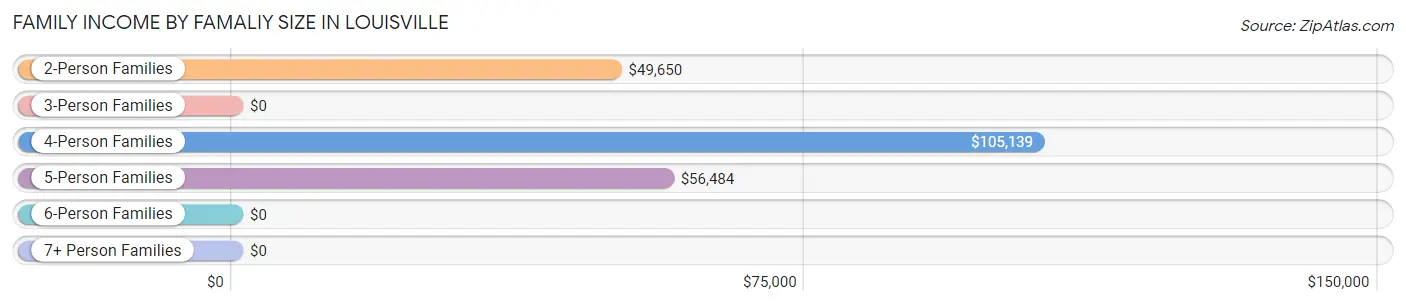
Family Income by Famaliy Size in Louisville
4-person families (94 | 14.8%) account for the highest median family income in Louisville with $105,139 per family, while 4-person families (94 | 14.8%) have the highest median income of $26,285 per family member.
| Income Bracket | # Families | Median Income |
| 2-Person Families | 264 (41.6%) | $49,650 |
| 3-Person Families | 228 (35.9%) | $0 |
| 4-Person Families | 94 (14.8%) | $105,139 |
| 5-Person Families | 41 (6.5%) | $56,484 |
| 6-Person Families | 0 (0.0%) | $0 |
| 7+ Person Families | 8 (1.3%) | $0 |
| Total | 635 (100.0%) | $49,475 |
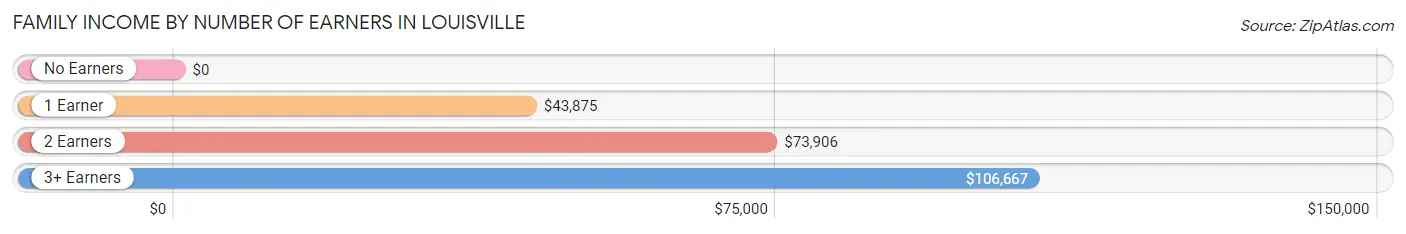
Family Income by Number of Earners in Louisville
| Number of Earners | # Families | Median Income |
| No Earners | 120 (18.9%) | $0 |
| 1 Earner | 248 (39.1%) | $43,875 |
| 2 Earners | 211 (33.2%) | $73,906 |
| 3+ Earners | 56 (8.8%) | $106,667 |
| Total | 635 (100.0%) | $49,475 |
Household Income in Louisville
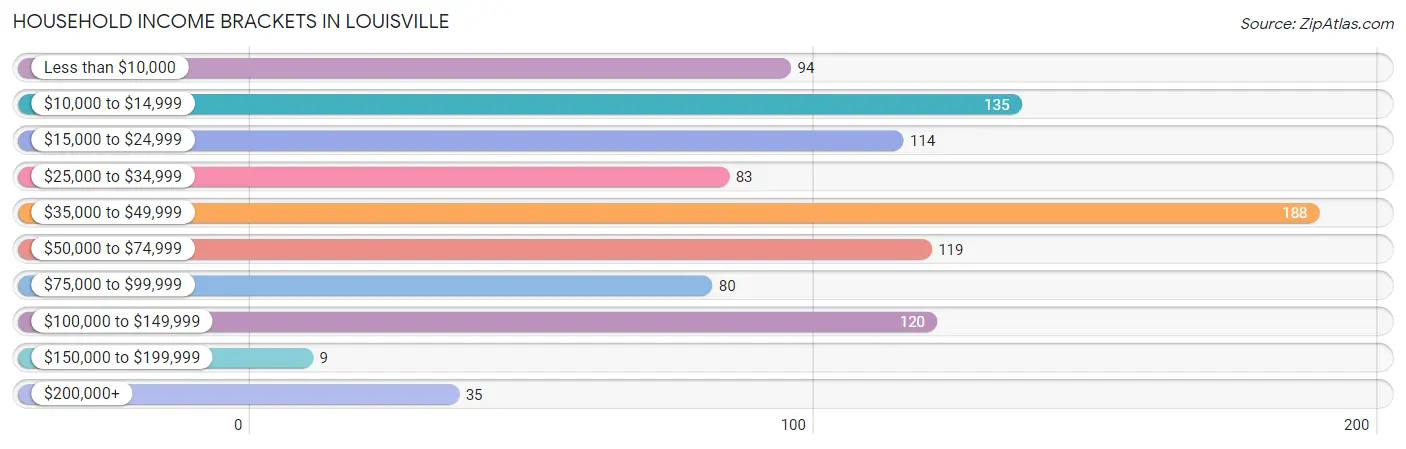
Household Income Brackets in Louisville
With 188 households falling in the category, the $35,000 to $49,999 income range is the most frequent in Louisville, accounting for 19.2% of all households. In contrast, only 9 households (0.9%) fall into the $150,000 to $199,999 income bracket, making it the least populous group.
| Income Bracket | # Households | % Households |
| Less than $10,000 | 94 | 9.6% |
| $10,000 to $14,999 | 135 | 13.8% |
| $15,000 to $24,999 | 114 | 11.7% |
| $25,000 to $34,999 | 83 | 8.5% |
| $35,000 to $49,999 | 188 | 19.2% |
| $50,000 to $74,999 | 119 | 12.2% |
| $75,000 to $99,999 | 80 | 8.2% |
| $100,000 to $149,999 | 120 | 12.3% |
| $150,000 to $199,999 | 9 | 0.9% |
| $200,000+ | 35 | 3.6% |
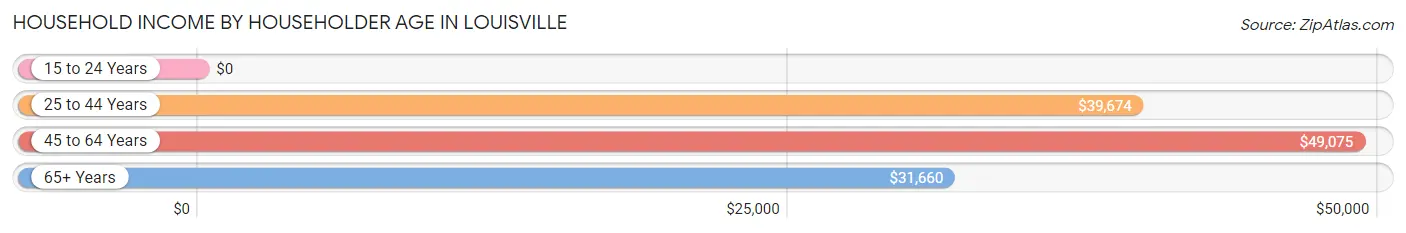
Household Income by Householder Age in Louisville
The median household income in Louisville is $43,194, with the highest median household income of $49,075 found in the 45 to 64 years age bracket for the primary householder. A total of 335 households (34.3%) fall into this category. Meanwhile, the 15 to 24 years age bracket for the primary householder has the lowest median household income of $0, with 17 households (1.7%) in this group.
| Income Bracket | # Households | Median Income |
| 15 to 24 Years | 17 (1.7%) | $0 |
| 25 to 44 Years | 284 (29.1%) | $39,674 |
| 45 to 64 Years | 335 (34.3%) | $49,075 |
| 65+ Years | 341 (34.9%) | $31,660 |
| Total | 977 (100.0%) | $43,194 |
Poverty in Louisville
Income Below Poverty by Sex and Age in Louisville
With 16.5% poverty level for males and 27.8% for females among the residents of Louisville, under 5 year old males and 25 to 34 year old females are the most vulnerable to poverty, with 45 males (58.4%) and 89 females (54.3%) in their respective age groups living below the poverty level.
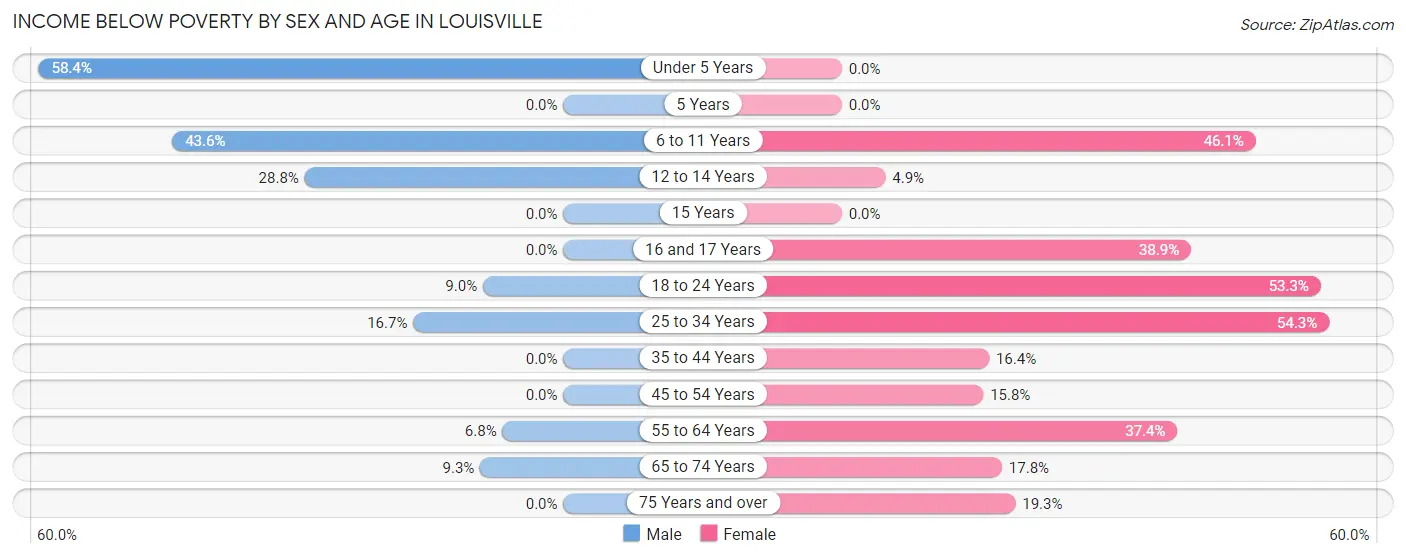
| Age Bracket | Male | Female |
| Under 5 Years | 45 (58.4%) | 0 (0.0%) |
| 5 Years | 0 (0.0%) | 0 (0.0%) |
| 6 to 11 Years | 71 (43.6%) | 53 (46.1%) |
| 12 to 14 Years | 17 (28.8%) | 5 (4.9%) |
| 15 Years | 0 (0.0%) | 0 (0.0%) |
| 16 and 17 Years | 0 (0.0%) | 21 (38.9%) |
| 18 to 24 Years | 17 (8.9%) | 8 (53.3%) |
| 25 to 34 Years | 54 (16.7%) | 89 (54.3%) |
| 35 to 44 Years | 0 (0.0%) | 20 (16.4%) |
| 45 to 54 Years | 0 (0.0%) | 20 (15.8%) |
| 55 to 64 Years | 4 (6.8%) | 65 (37.4%) |
| 65 to 74 Years | 15 (9.3%) | 23 (17.8%) |
| 75 Years and over | 0 (0.0%) | 17 (19.3%) |
| Total | 223 (16.5%) | 321 (27.8%) |
Income Above Poverty by Sex and Age in Louisville
According to the poverty statistics in Louisville, males aged 15 years and females aged under 5 years are the age groups that are most secure financially, with 100.0% of males and 100.0% of females in these age groups living above the poverty line.
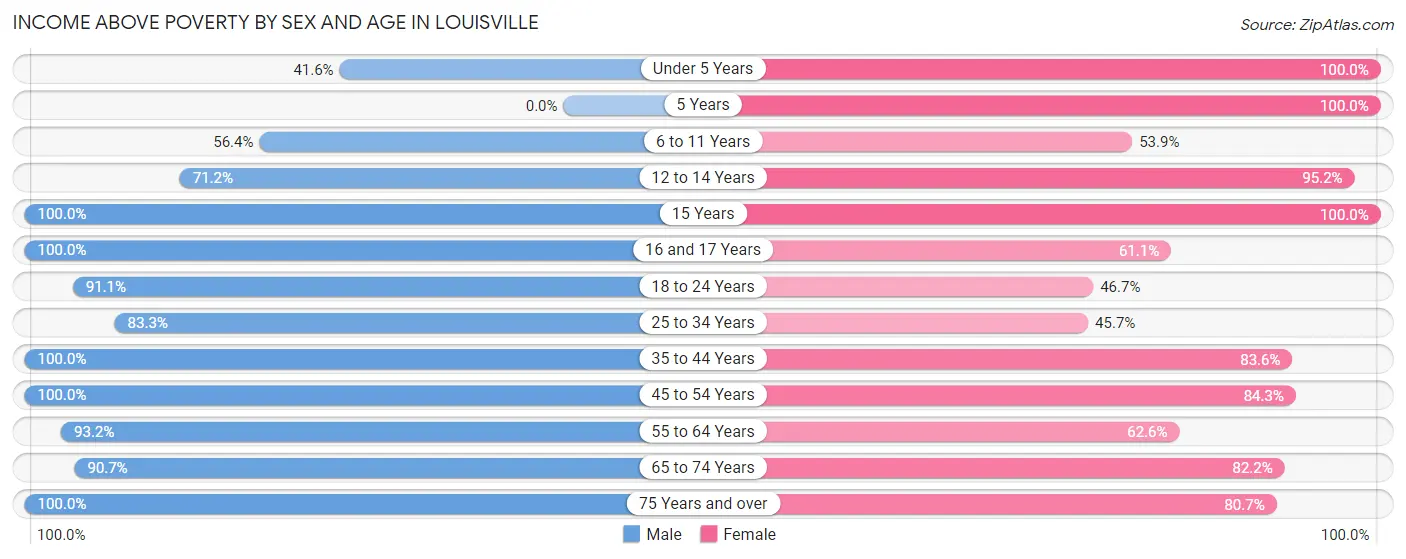
| Age Bracket | Male | Female |
| Under 5 Years | 32 (41.6%) | 44 (100.0%) |
| 5 Years | 0 (0.0%) | 5 (100.0%) |
| 6 to 11 Years | 92 (56.4%) | 62 (53.9%) |
| 12 to 14 Years | 42 (71.2%) | 98 (95.2%) |
| 15 Years | 24 (100.0%) | 16 (100.0%) |
| 16 and 17 Years | 53 (100.0%) | 33 (61.1%) |
| 18 to 24 Years | 173 (91.0%) | 7 (46.7%) |
| 25 to 34 Years | 269 (83.3%) | 75 (45.7%) |
| 35 to 44 Years | 70 (100.0%) | 102 (83.6%) |
| 45 to 54 Years | 131 (100.0%) | 107 (84.3%) |
| 55 to 64 Years | 55 (93.2%) | 109 (62.6%) |
| 65 to 74 Years | 147 (90.7%) | 106 (82.2%) |
| 75 Years and over | 42 (100.0%) | 71 (80.7%) |
| Total | 1,130 (83.5%) | 835 (72.2%) |
Income Below Poverty Among Married-Couple Families in Louisville
The poverty statistics for married-couple families in Louisville show that 14.7% or 41 of the total 278 families live below the poverty line. Families with 1 or 2 children have the highest poverty rate of 42.3%, comprising of 41 families. On the other hand, families with no children have the lowest poverty rate of 0.0%, which includes 0 families.
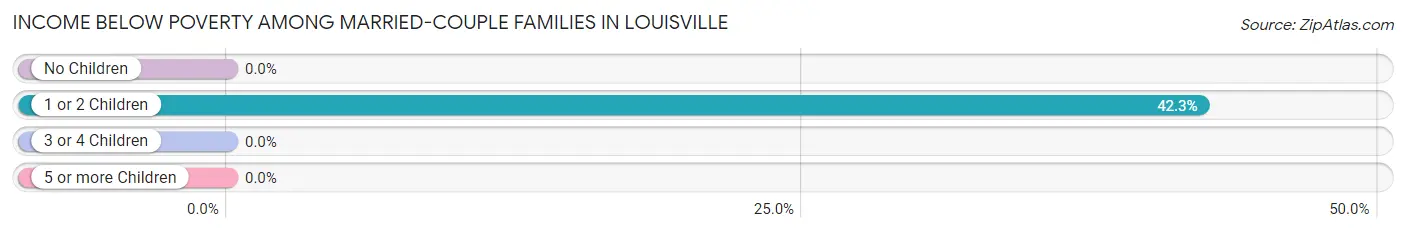
| Children | Above Poverty | Below Poverty |
| No Children | 149 (100.0%) | 0 (0.0%) |
| 1 or 2 Children | 56 (57.7%) | 41 (42.3%) |
| 3 or 4 Children | 32 (100.0%) | 0 (0.0%) |
| 5 or more Children | 0 (0.0%) | 0 (0.0%) |
| Total | 237 (85.3%) | 41 (14.7%) |
Income Below Poverty Among Single-Parent Households in Louisville
According to the poverty data in Louisville, 21.5% or 17 single-father households and 30.9% or 86 single-mother households are living below the poverty line. Among single-father households, those with 1 or 2 children have the highest poverty rate, with 17 households (39.5%) experiencing poverty. Likewise, among single-mother households, those with 1 or 2 children have the highest poverty rate, with 65 households (44.2%) falling below the poverty line.
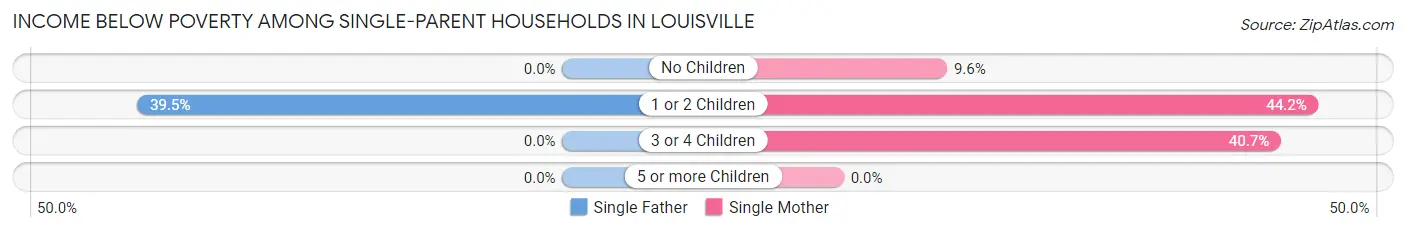
| Children | Single Father | Single Mother |
| No Children | 0 (0.0%) | 10 (9.6%) |
| 1 or 2 Children | 17 (39.5%) | 65 (44.2%) |
| 3 or 4 Children | 0 (0.0%) | 11 (40.7%) |
| 5 or more Children | 0 (0.0%) | 0 (0.0%) |
| Total | 17 (21.5%) | 86 (30.9%) |
Income Below Poverty Among Married-Couple vs Single-Parent Households in Louisville
The poverty data for Louisville shows that 41 of the married-couple family households (14.7%) and 103 of the single-parent households (28.8%) are living below the poverty level. Within the married-couple family households, those with 1 or 2 children have the highest poverty rate, with 41 households (42.3%) falling below the poverty line. Among the single-parent households, those with 1 or 2 children have the highest poverty rate, with 82 household (43.2%) living below poverty.
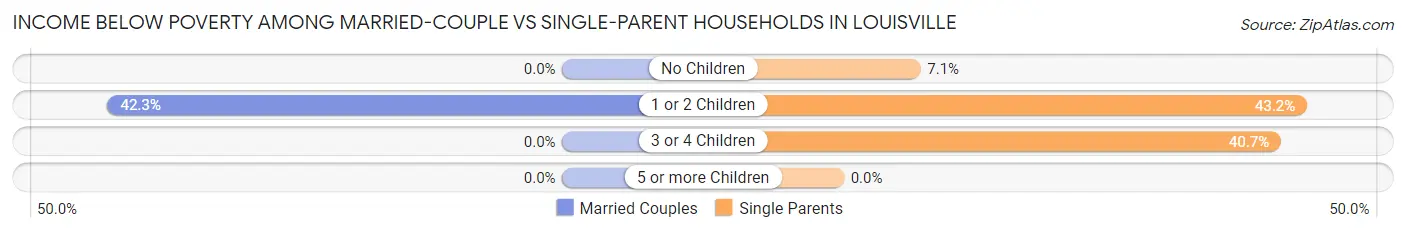
| Children | Married-Couple Families | Single-Parent Households |
| No Children | 0 (0.0%) | 10 (7.1%) |
| 1 or 2 Children | 41 (42.3%) | 82 (43.2%) |
| 3 or 4 Children | 0 (0.0%) | 11 (40.7%) |
| 5 or more Children | 0 (0.0%) | 0 (0.0%) |
| Total | 41 (14.7%) | 103 (28.8%) |
Employment Characteristics in Louisville
Employment by Class of Employer in Louisville
Among the 978 employed individuals in Louisville, private company employees (574 | 58.7%), local government employees (149 | 15.2%), and self-employed (not incorporated) (91 | 9.3%) make up the most common classes of employment.
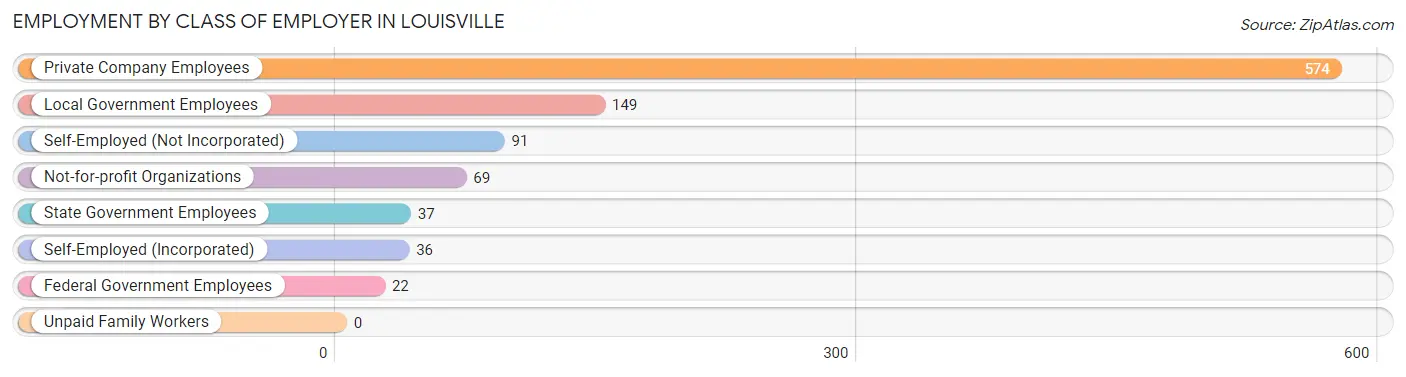
| Employer Class | # Employees | % Employees |
| Private Company Employees | 574 | 58.7% |
| Self-Employed (Incorporated) | 36 | 3.7% |
| Self-Employed (Not Incorporated) | 91 | 9.3% |
| Not-for-profit Organizations | 69 | 7.1% |
| Local Government Employees | 149 | 15.2% |
| State Government Employees | 37 | 3.8% |
| Federal Government Employees | 22 | 2.2% |
| Unpaid Family Workers | 0 | 0.0% |
| Total | 978 | 100.0% |
Employment Status by Age in Louisville
According to the labor force statistics for Louisville, out of the total population over 16 years of age (2,098), 48.3% or 1,013 individuals are in the labor force, with 3.1% or 31 of them unemployed. The age group with the highest labor force participation rate is 35 to 44 years, with 89.8% or 177 individuals in the labor force. Within the labor force, the 20 to 24 years age range has the highest percentage of unemployed individuals, with 34.8% or 23 of them being unemployed.
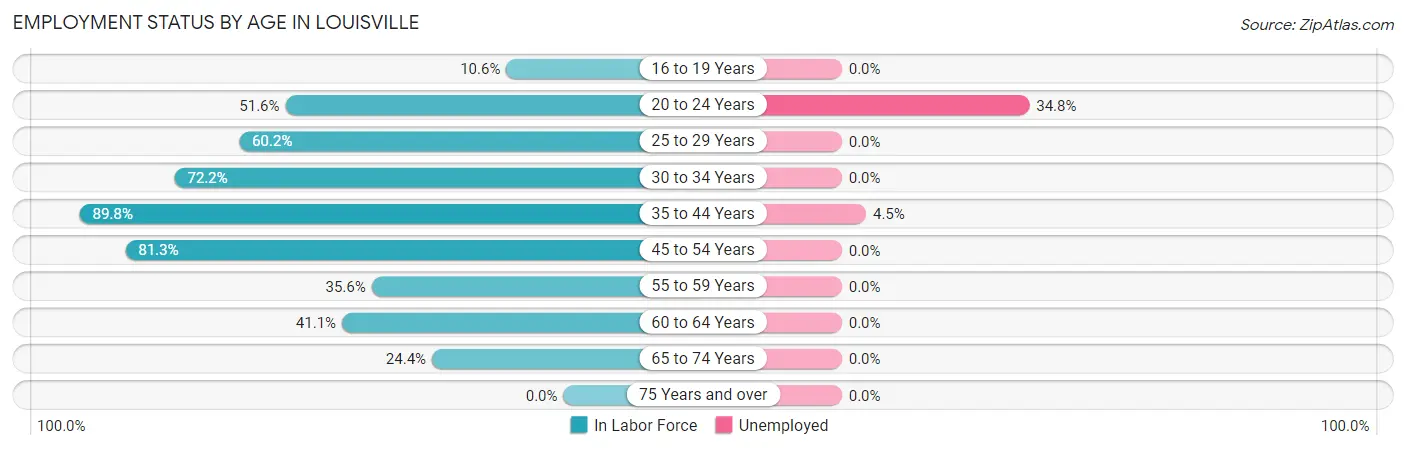
| Age Bracket | In Labor Force | Unemployed |
| 16 to 19 Years | 20 (10.6%) | 0 (0.0%) |
| 20 to 24 Years | 66 (51.6%) | 23 (34.8%) |
| 25 to 29 Years | 145 (60.2%) | 0 (0.0%) |
| 30 to 34 Years | 203 (72.2%) | 0 (0.0%) |
| 35 to 44 Years | 177 (89.8%) | 8 (4.5%) |
| 45 to 54 Years | 235 (81.3%) | 0 (0.0%) |
| 55 to 59 Years | 52 (35.6%) | 0 (0.0%) |
| 60 to 64 Years | 44 (41.1%) | 0 (0.0%) |
| 65 to 74 Years | 71 (24.4%) | 0 (0.0%) |
| 75 Years and over | 0 (0.0%) | 0 (0.0%) |
| Total | 1,013 (48.3%) | 31 (3.1%) |
Employment Status by Educational Attainment in Louisville
According to labor force statistics for Louisville, 67.9% of individuals (856) out of the total population between 25 and 64 years of age (1,261) are in the labor force, with 0.9% or 8 of them being unemployed. The group with the highest labor force participation rate are those with the educational attainment of bachelor's degree or higher, with 81.7% or 174 individuals in the labor force. Within the labor force, individuals with high school diploma education have the highest percentage of unemployment, with 2.1% or 8 of them being unemployed.
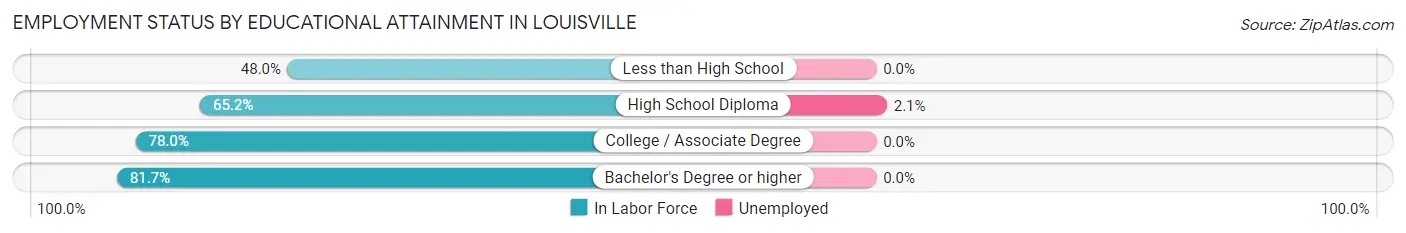
| Educational Attainment | In Labor Force | Unemployed |
| Less than High School | 98 (48.0%) | 0 (0.0%) |
| High School Diploma | 378 (65.2%) | 12 (2.1%) |
| College / Associate Degree | 206 (78.0%) | 0 (0.0%) |
| Bachelor's Degree or higher | 174 (81.7%) | 0 (0.0%) |
| Total | 856 (67.9%) | 11 (0.9%) |
Employment Occupations by Sex in Louisville
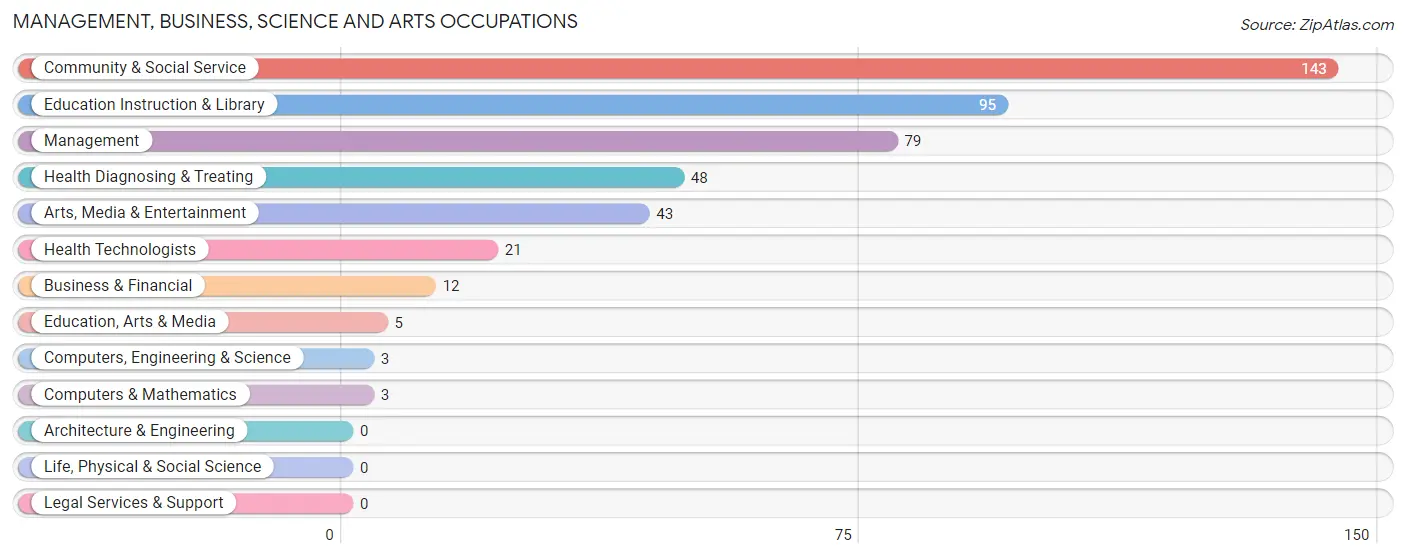
Management, Business, Science and Arts Occupations
The most common Management, Business, Science and Arts occupations in Louisville are Community & Social Service (143 | 14.6%), Education Instruction & Library (95 | 9.7%), Management (79 | 8.0%), Health Diagnosing & Treating (48 | 4.9%), and Arts, Media & Entertainment (43 | 4.4%).
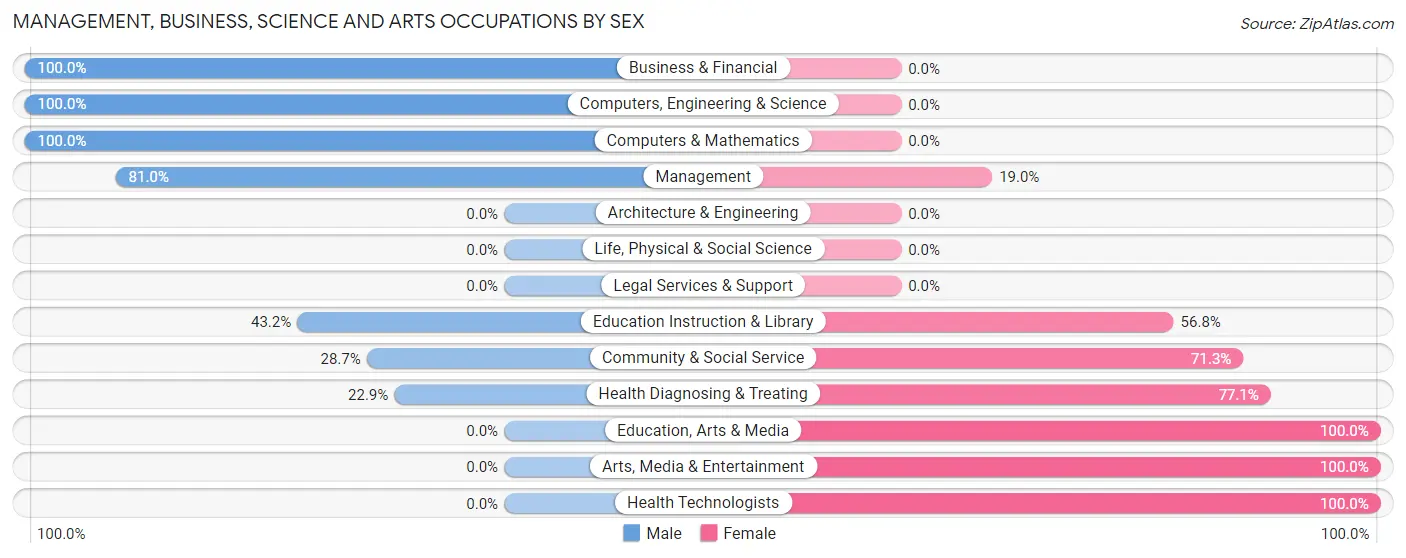
Management, Business, Science and Arts Occupations by Sex
Within the Management, Business, Science and Arts occupations in Louisville, the most male-oriented occupations are Business & Financial (100.0%), Computers, Engineering & Science (100.0%), and Computers & Mathematics (100.0%), while the most female-oriented occupations are Education, Arts & Media (100.0%), Arts, Media & Entertainment (100.0%), and Health Technologists (100.0%).
| Occupation | Male | Female |
| Management | 64 (81.0%) | 15 (19.0%) |
| Business & Financial | 12 (100.0%) | 0 (0.0%) |
| Computers, Engineering & Science | 3 (100.0%) | 0 (0.0%) |
| Computers & Mathematics | 3 (100.0%) | 0 (0.0%) |
| Architecture & Engineering | 0 (0.0%) | 0 (0.0%) |
| Life, Physical & Social Science | 0 (0.0%) | 0 (0.0%) |
| Community & Social Service | 41 (28.7%) | 102 (71.3%) |
| Education, Arts & Media | 0 (0.0%) | 5 (100.0%) |
| Legal Services & Support | 0 (0.0%) | 0 (0.0%) |
| Education Instruction & Library | 41 (43.2%) | 54 (56.8%) |
| Arts, Media & Entertainment | 0 (0.0%) | 43 (100.0%) |
| Health Diagnosing & Treating | 11 (22.9%) | 37 (77.1%) |
| Health Technologists | 0 (0.0%) | 21 (100.0%) |
| Total (Category) | 131 (46.0%) | 154 (54.0%) |
| Total (Overall) | 593 (60.4%) | 389 (39.6%) |
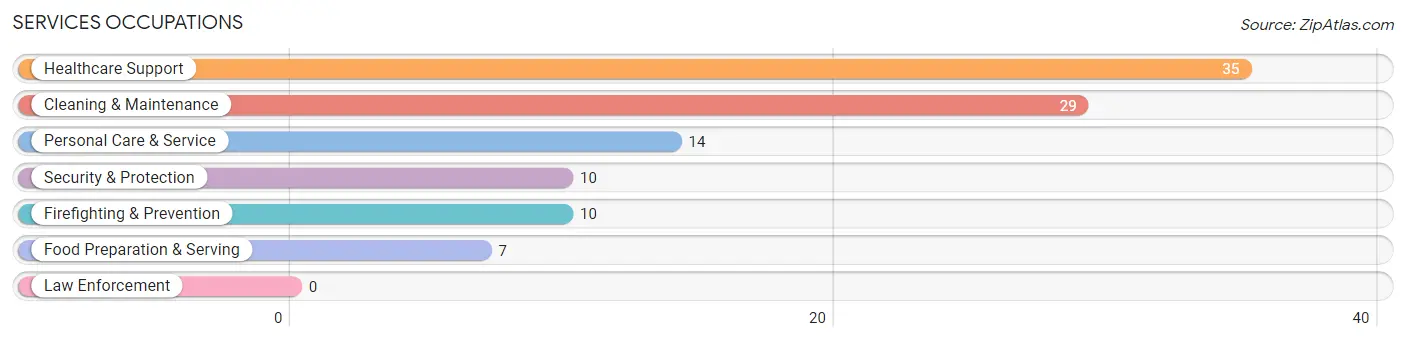
Services Occupations
The most common Services occupations in Louisville are Healthcare Support (35 | 3.6%), Cleaning & Maintenance (29 | 2.9%), Personal Care & Service (14 | 1.4%), Security & Protection (10 | 1.0%), and Firefighting & Prevention (10 | 1.0%).
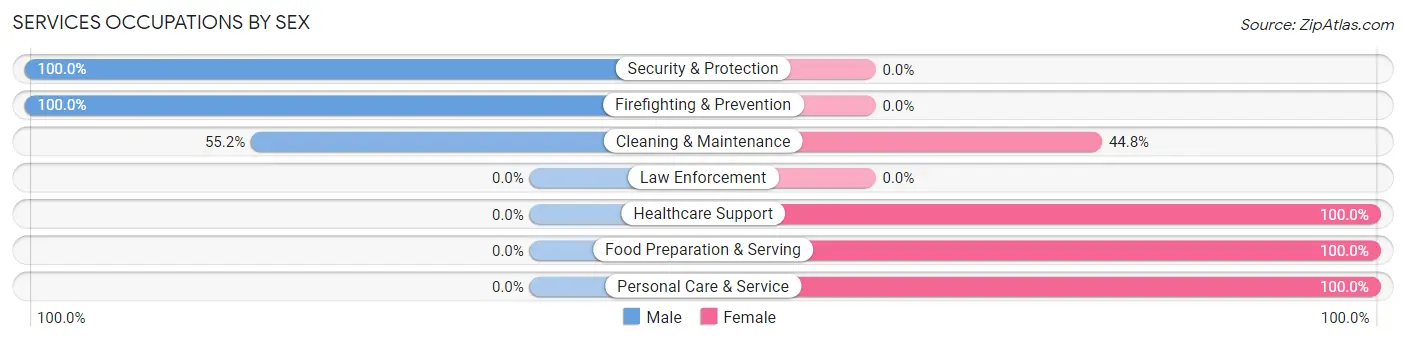
Services Occupations by Sex
Within the Services occupations in Louisville, the most male-oriented occupations are Security & Protection (100.0%), Firefighting & Prevention (100.0%), and Cleaning & Maintenance (55.2%), while the most female-oriented occupations are Healthcare Support (100.0%), Food Preparation & Serving (100.0%), and Personal Care & Service (100.0%).
| Occupation | Male | Female |
| Healthcare Support | 0 (0.0%) | 35 (100.0%) |
| Security & Protection | 10 (100.0%) | 0 (0.0%) |
| Firefighting & Prevention | 10 (100.0%) | 0 (0.0%) |
| Law Enforcement | 0 (0.0%) | 0 (0.0%) |
| Food Preparation & Serving | 0 (0.0%) | 7 (100.0%) |
| Cleaning & Maintenance | 16 (55.2%) | 13 (44.8%) |
| Personal Care & Service | 0 (0.0%) | 14 (100.0%) |
| Total (Category) | 26 (27.4%) | 69 (72.6%) |
| Total (Overall) | 593 (60.4%) | 389 (39.6%) |
Sales and Office Occupations
The most common Sales and Office occupations in Louisville are Office & Administration (79 | 8.0%), and Sales & Related (48 | 4.9%).

Sales and Office Occupations by Sex
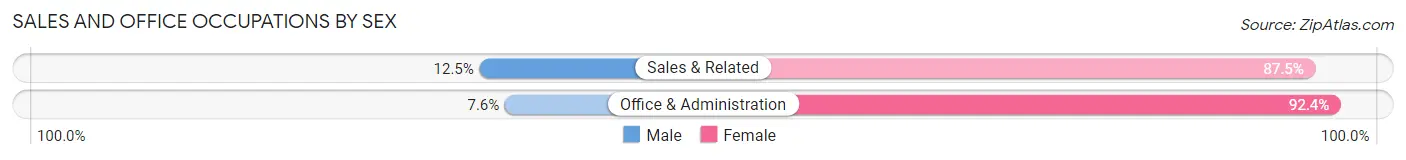
| Occupation | Male | Female |
| Sales & Related | 6 (12.5%) | 42 (87.5%) |
| Office & Administration | 6 (7.6%) | 73 (92.4%) |
| Total (Category) | 12 (9.5%) | 115 (90.5%) |
| Total (Overall) | 593 (60.4%) | 389 (39.6%) |
Natural Resources, Construction and Maintenance Occupations
The most common Natural Resources, Construction and Maintenance occupations in Louisville are Installation, Maintenance & Repair (65 | 6.6%), Farming, Fishing & Forestry (33 | 3.4%), and Construction & Extraction (31 | 3.2%).

Natural Resources, Construction and Maintenance Occupations by Sex

| Occupation | Male | Female |
| Farming, Fishing & Forestry | 11 (33.3%) | 22 (66.7%) |
| Construction & Extraction | 31 (100.0%) | 0 (0.0%) |
| Installation, Maintenance & Repair | 63 (96.9%) | 2 (3.1%) |
| Total (Category) | 105 (81.4%) | 24 (18.6%) |
| Total (Overall) | 593 (60.4%) | 389 (39.6%) |
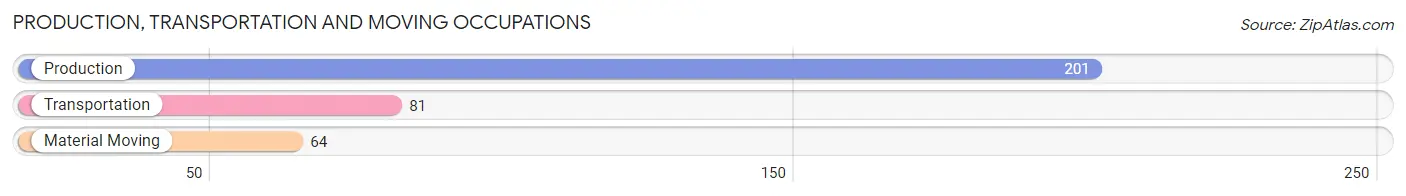
Production, Transportation and Moving Occupations
The most common Production, Transportation and Moving occupations in Louisville are Production (201 | 20.5%), Transportation (81 | 8.3%), and Material Moving (64 | 6.5%).
Production, Transportation and Moving Occupations by Sex
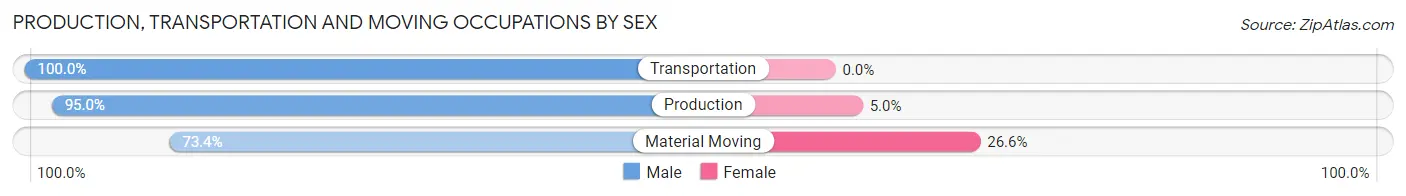
| Occupation | Male | Female |
| Production | 191 (95.0%) | 10 (5.0%) |
| Transportation | 81 (100.0%) | 0 (0.0%) |
| Material Moving | 47 (73.4%) | 17 (26.6%) |
| Total (Category) | 319 (92.2%) | 27 (7.8%) |
| Total (Overall) | 593 (60.4%) | 389 (39.6%) |
Employment Industries by Sex in Louisville
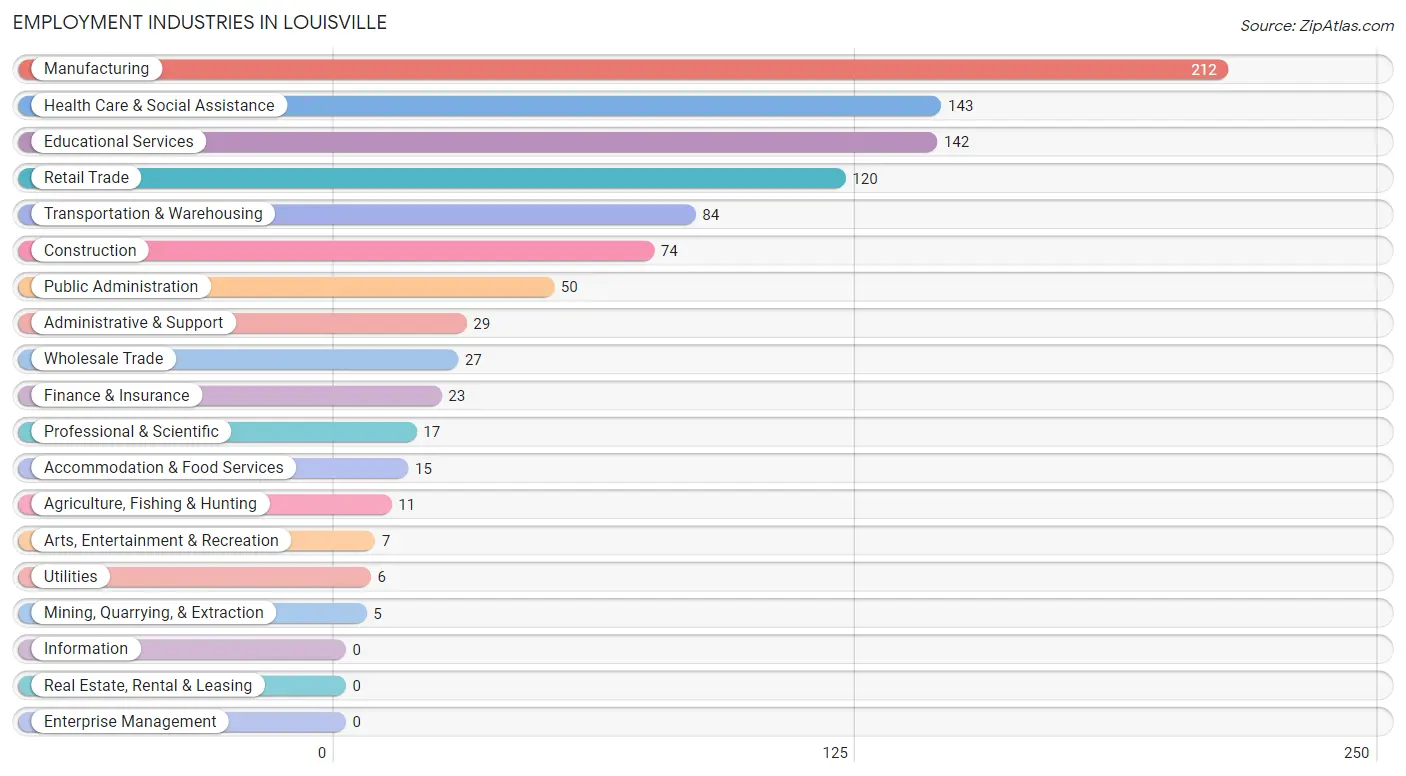
Employment Industries in Louisville
The major employment industries in Louisville include Manufacturing (212 | 21.6%), Health Care & Social Assistance (143 | 14.6%), Educational Services (142 | 14.5%), Retail Trade (120 | 12.2%), and Transportation & Warehousing (84 | 8.6%).
Employment Industries by Sex in Louisville
The Louisville industries that see more men than women are Mining, Quarrying, & Extraction (100.0%), Construction (100.0%), and Transportation & Warehousing (100.0%), whereas the industries that tend to have a higher number of women are Agriculture, Fishing & Hunting (100.0%), Finance & Insurance (100.0%), and Arts, Entertainment & Recreation (100.0%).
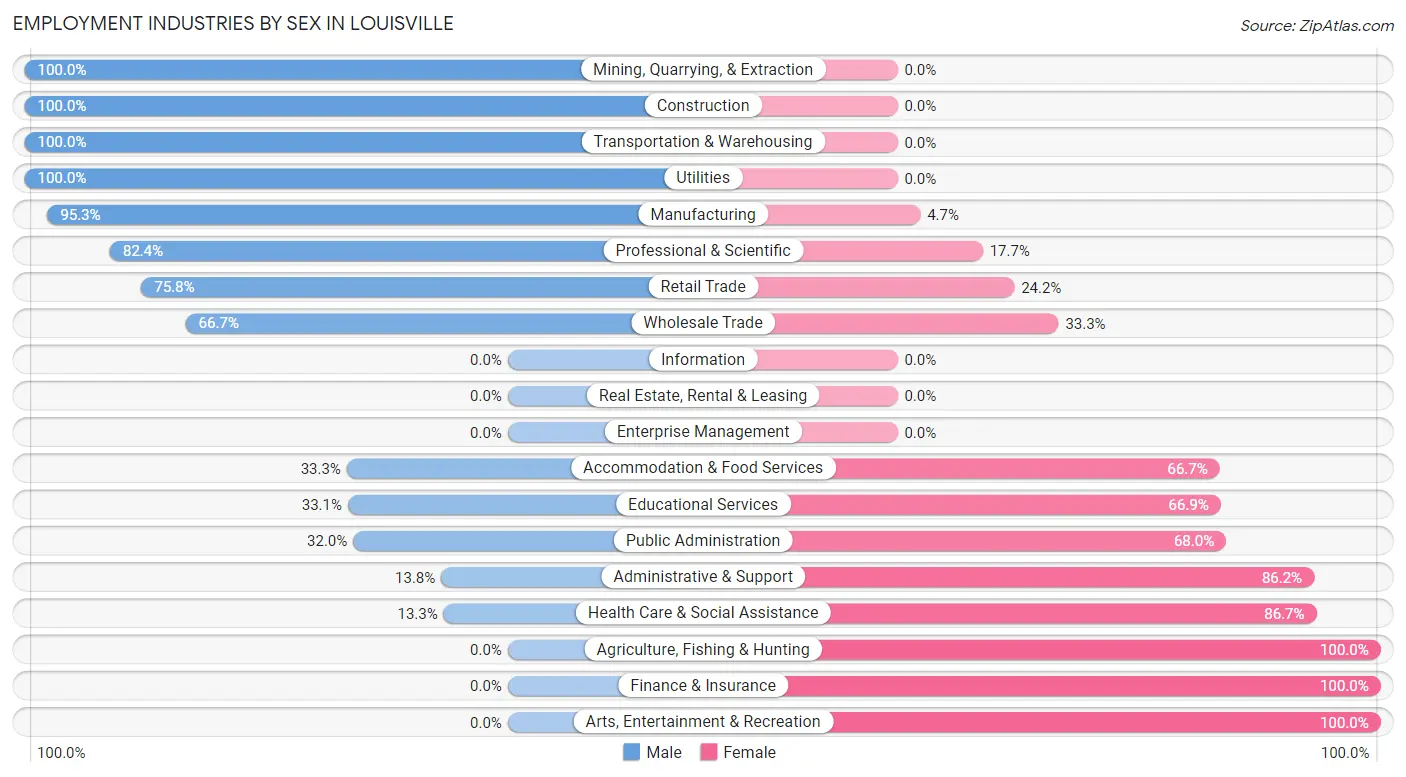
| Industry | Male | Female |
| Agriculture, Fishing & Hunting | 0 (0.0%) | 11 (100.0%) |
| Mining, Quarrying, & Extraction | 5 (100.0%) | 0 (0.0%) |
| Construction | 74 (100.0%) | 0 (0.0%) |
| Manufacturing | 202 (95.3%) | 10 (4.7%) |
| Wholesale Trade | 18 (66.7%) | 9 (33.3%) |
| Retail Trade | 91 (75.8%) | 29 (24.2%) |
| Transportation & Warehousing | 84 (100.0%) | 0 (0.0%) |
| Utilities | 6 (100.0%) | 0 (0.0%) |
| Information | 0 (0.0%) | 0 (0.0%) |
| Finance & Insurance | 0 (0.0%) | 23 (100.0%) |
| Real Estate, Rental & Leasing | 0 (0.0%) | 0 (0.0%) |
| Professional & Scientific | 14 (82.4%) | 3 (17.6%) |
| Enterprise Management | 0 (0.0%) | 0 (0.0%) |
| Administrative & Support | 4 (13.8%) | 25 (86.2%) |
| Educational Services | 47 (33.1%) | 95 (66.9%) |
| Health Care & Social Assistance | 19 (13.3%) | 124 (86.7%) |
| Arts, Entertainment & Recreation | 0 (0.0%) | 7 (100.0%) |
| Accommodation & Food Services | 5 (33.3%) | 10 (66.7%) |
| Public Administration | 16 (32.0%) | 34 (68.0%) |
| Total | 593 (60.4%) | 389 (39.6%) |
Education in Louisville
School Enrollment in Louisville
The most common levels of schooling among the 708 students in Louisville are high school (267 | 37.7%), middle school (172 | 24.3%), and elementary school (163 | 23.0%).
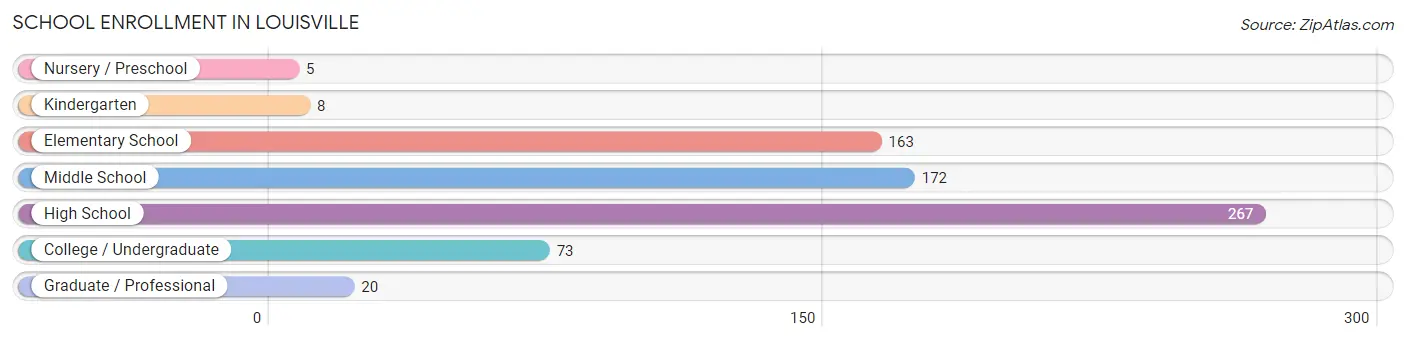
| School Level | # Students | % Students |
| Nursery / Preschool | 5 | 0.7% |
| Kindergarten | 8 | 1.1% |
| Elementary School | 163 | 23.0% |
| Middle School | 172 | 24.3% |
| High School | 267 | 37.7% |
| College / Undergraduate | 73 | 10.3% |
| Graduate / Professional | 20 | 2.8% |
| Total | 708 | 100.0% |
School Enrollment by Age by Funding Source in Louisville
Out of a total of 708 students who are enrolled in schools in Louisville, 209 (29.5%) attend a private institution, while the remaining 499 (70.5%) are enrolled in public schools. The age group of 18 to 19 year olds has the highest likelihood of being enrolled in private schools, with 41 (50.6% in the age bracket) enrolled. Conversely, the age group of 20 to 24 year olds has the lowest likelihood of being enrolled in a private school, with 17 (100.0% in the age bracket) attending a public institution.
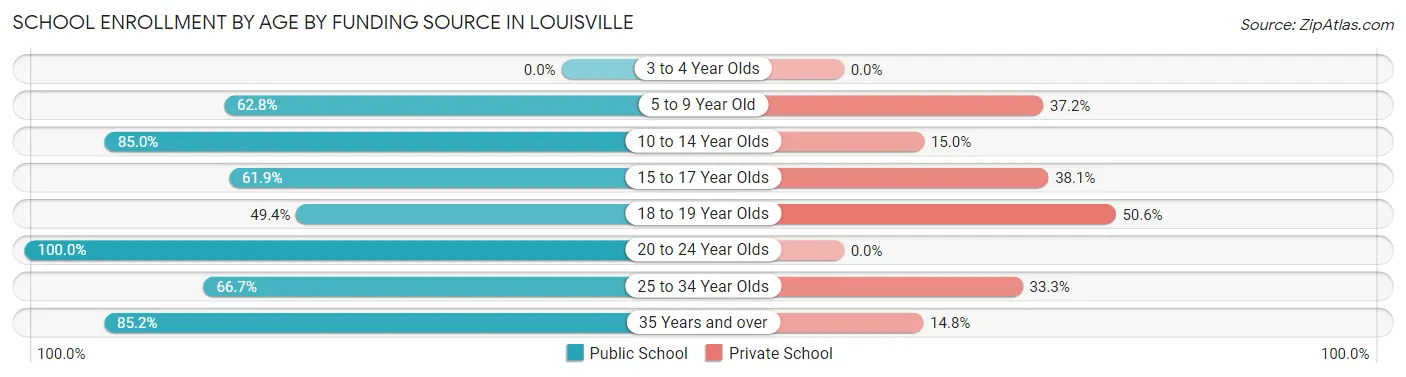
| Age Bracket | Public School | Private School |
| 3 to 4 Year Olds | 0 (0.0%) | 0 (0.0%) |
| 5 to 9 Year Old | 93 (62.8%) | 55 (37.2%) |
| 10 to 14 Year Olds | 199 (85.0%) | 35 (15.0%) |
| 15 to 17 Year Olds | 91 (61.9%) | 56 (38.1%) |
| 18 to 19 Year Olds | 40 (49.4%) | 41 (50.6%) |
| 20 to 24 Year Olds | 17 (100.0%) | 0 (0.0%) |
| 25 to 34 Year Olds | 36 (66.7%) | 18 (33.3%) |
| 35 Years and over | 23 (85.2%) | 4 (14.8%) |
| Total | 499 (70.5%) | 209 (29.5%) |
Educational Attainment by Field of Study in Louisville
Education (73 | 26.7%), business (70 | 25.6%), liberal arts & history (52 | 19.1%), science & technology (21 | 7.7%), and arts & humanities (14 | 5.1%) are the most common fields of study among 273 individuals in Louisville who have obtained a bachelor's degree or higher.
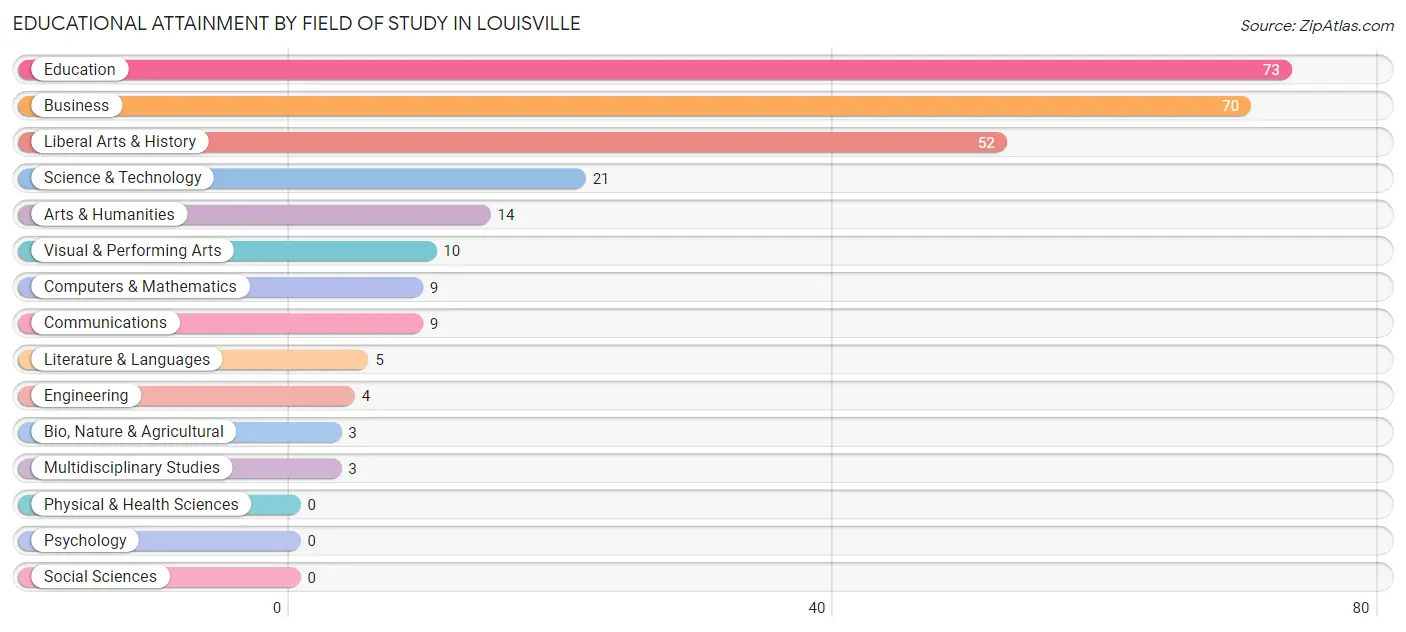
| Field of Study | # Graduates | % Graduates |
| Computers & Mathematics | 9 | 3.3% |
| Bio, Nature & Agricultural | 3 | 1.1% |
| Physical & Health Sciences | 0 | 0.0% |
| Psychology | 0 | 0.0% |
| Social Sciences | 0 | 0.0% |
| Engineering | 4 | 1.5% |
| Multidisciplinary Studies | 3 | 1.1% |
| Science & Technology | 21 | 7.7% |
| Business | 70 | 25.6% |
| Education | 73 | 26.7% |
| Literature & Languages | 5 | 1.8% |
| Liberal Arts & History | 52 | 19.1% |
| Visual & Performing Arts | 10 | 3.7% |
| Communications | 9 | 3.3% |
| Arts & Humanities | 14 | 5.1% |
| Total | 273 | 100.0% |
Transportation & Commute in Louisville
Vehicle Availability by Sex in Louisville
The most prevalent vehicle ownership categories in Louisville are males with 2 vehicles (305, accounting for 51.4%) and females with 2 vehicles (158, making up 79.2%).
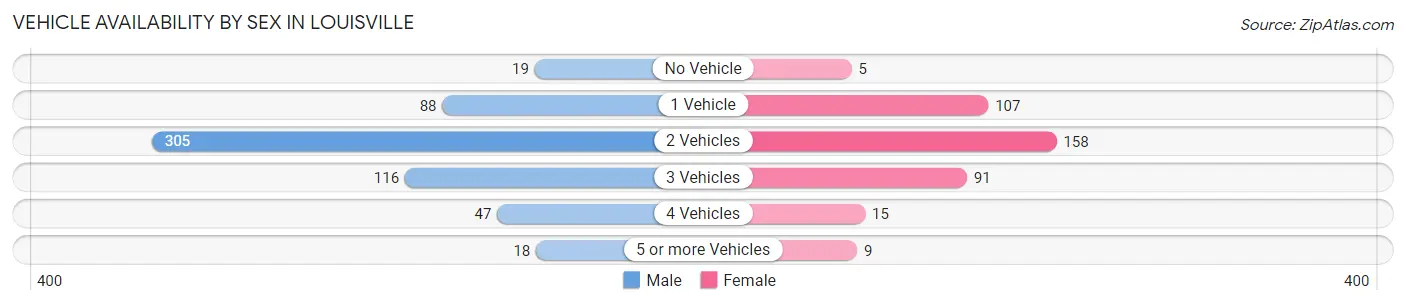
| Vehicles Available | Male | Female |
| No Vehicle | 19 (3.2%) | 5 (1.3%) |
| 1 Vehicle | 88 (14.8%) | 107 (27.8%) |
| 2 Vehicles | 305 (51.4%) | 158 (41.0%) |
| 3 Vehicles | 116 (19.6%) | 91 (23.6%) |
| 4 Vehicles | 47 (7.9%) | 15 (3.9%) |
| 5 or more Vehicles | 18 (3.0%) | 9 (2.3%) |
| Total | 593 (100.0%) | 385 (100.0%) |
Commute Time in Louisville
The most frequently occuring commute durations in Louisville are 30 to 34 minutes (193 commuters, 19.8%), 45 to 59 minutes (147 commuters, 15.1%), and 5 to 9 minutes (145 commuters, 14.9%).
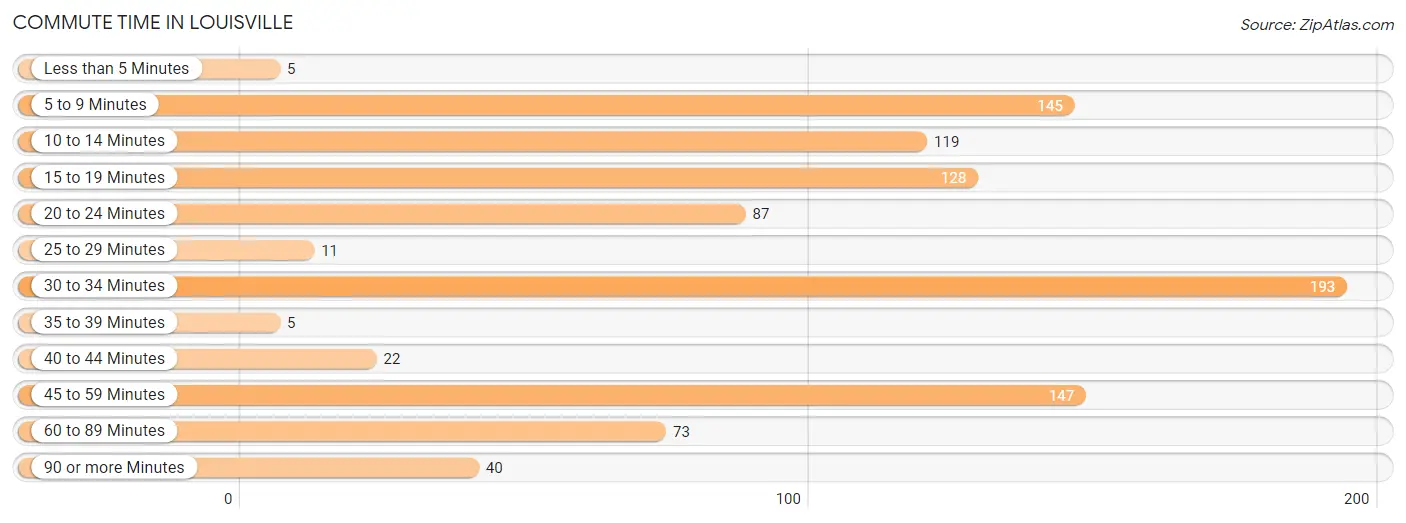
| Commute Time | # Commuters | % Commuters |
| Less than 5 Minutes | 5 | 0.5% |
| 5 to 9 Minutes | 145 | 14.9% |
| 10 to 14 Minutes | 119 | 12.2% |
| 15 to 19 Minutes | 128 | 13.1% |
| 20 to 24 Minutes | 87 | 8.9% |
| 25 to 29 Minutes | 11 | 1.1% |
| 30 to 34 Minutes | 193 | 19.8% |
| 35 to 39 Minutes | 5 | 0.5% |
| 40 to 44 Minutes | 22 | 2.3% |
| 45 to 59 Minutes | 147 | 15.1% |
| 60 to 89 Minutes | 73 | 7.5% |
| 90 or more Minutes | 40 | 4.1% |
Commute Time by Sex in Louisville
The most common commute times in Louisville are 30 to 34 minutes (140 commuters, 23.7%) for males and 10 to 14 minutes (84 commuters, 21.8%) for females.
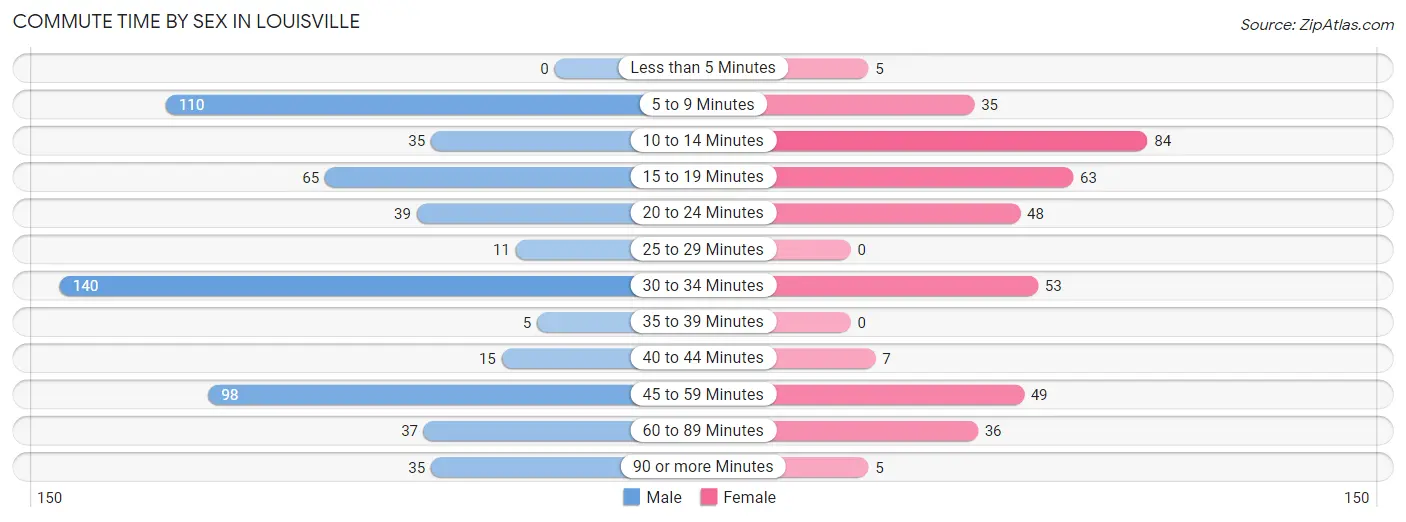
| Commute Time | Male | Female |
| Less than 5 Minutes | 0 (0.0%) | 5 (1.3%) |
| 5 to 9 Minutes | 110 (18.6%) | 35 (9.1%) |
| 10 to 14 Minutes | 35 (5.9%) | 84 (21.8%) |
| 15 to 19 Minutes | 65 (11.0%) | 63 (16.4%) |
| 20 to 24 Minutes | 39 (6.6%) | 48 (12.5%) |
| 25 to 29 Minutes | 11 (1.9%) | 0 (0.0%) |
| 30 to 34 Minutes | 140 (23.7%) | 53 (13.8%) |
| 35 to 39 Minutes | 5 (0.9%) | 0 (0.0%) |
| 40 to 44 Minutes | 15 (2.5%) | 7 (1.8%) |
| 45 to 59 Minutes | 98 (16.6%) | 49 (12.7%) |
| 60 to 89 Minutes | 37 (6.3%) | 36 (9.3%) |
| 90 or more Minutes | 35 (5.9%) | 5 (1.3%) |
Time of Departure to Work by Sex in Louisville
The most frequent times of departure to work in Louisville are 5:30 AM to 5:59 AM (143, 24.2%) for males and 7:00 AM to 7:29 AM (148, 38.4%) for females.
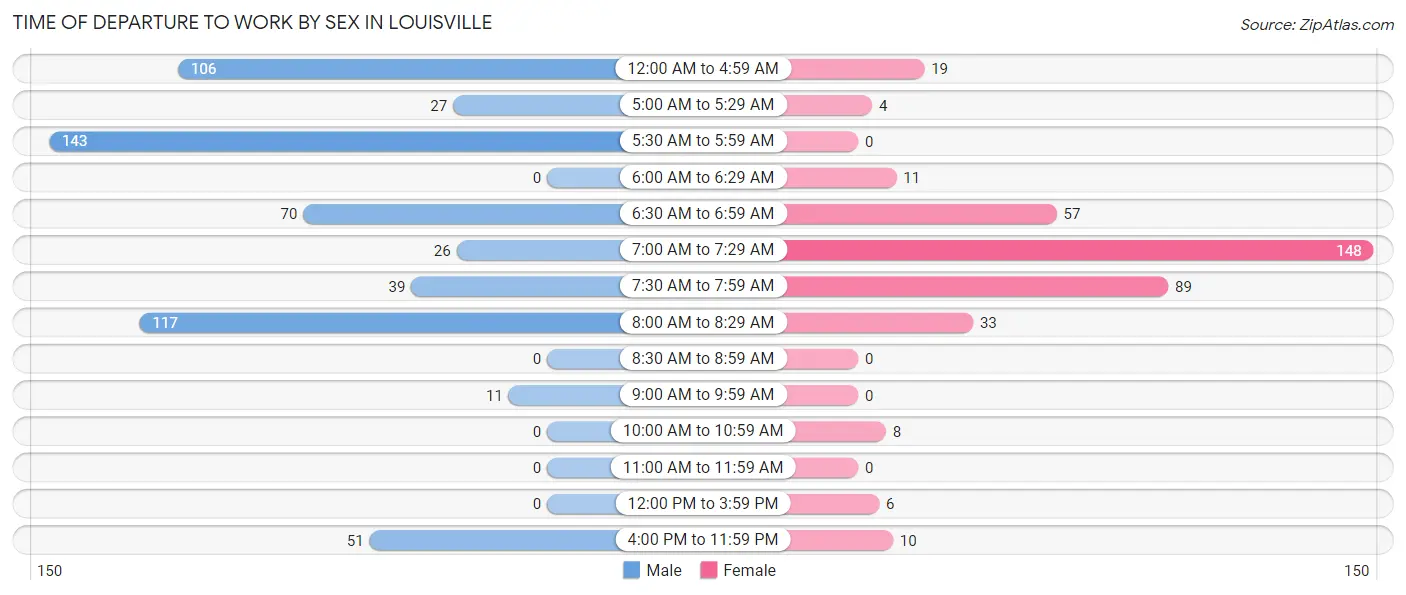
| Time of Departure | Male | Female |
| 12:00 AM to 4:59 AM | 106 (18.0%) | 19 (4.9%) |
| 5:00 AM to 5:29 AM | 27 (4.6%) | 4 (1.0%) |
| 5:30 AM to 5:59 AM | 143 (24.2%) | 0 (0.0%) |
| 6:00 AM to 6:29 AM | 0 (0.0%) | 11 (2.9%) |
| 6:30 AM to 6:59 AM | 70 (11.9%) | 57 (14.8%) |
| 7:00 AM to 7:29 AM | 26 (4.4%) | 148 (38.4%) |
| 7:30 AM to 7:59 AM | 39 (6.6%) | 89 (23.1%) |
| 8:00 AM to 8:29 AM | 117 (19.8%) | 33 (8.6%) |
| 8:30 AM to 8:59 AM | 0 (0.0%) | 0 (0.0%) |
| 9:00 AM to 9:59 AM | 11 (1.9%) | 0 (0.0%) |
| 10:00 AM to 10:59 AM | 0 (0.0%) | 8 (2.1%) |
| 11:00 AM to 11:59 AM | 0 (0.0%) | 0 (0.0%) |
| 12:00 PM to 3:59 PM | 0 (0.0%) | 6 (1.6%) |
| 4:00 PM to 11:59 PM | 51 (8.6%) | 10 (2.6%) |
| Total | 590 (100.0%) | 385 (100.0%) |
Housing Occupancy in Louisville
Occupancy by Ownership in Louisville
Of the total 977 dwellings in Louisville, owner-occupied units account for 549 (56.2%), while renter-occupied units make up 428 (43.8%).
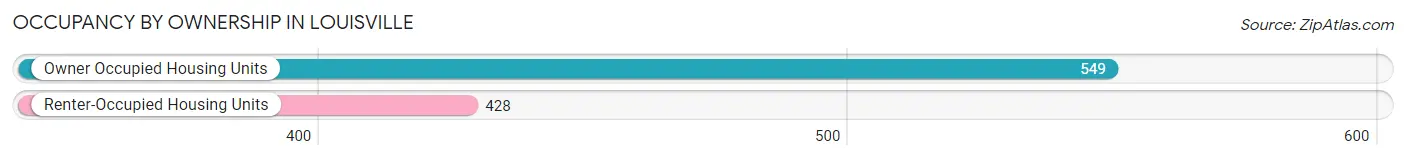
| Occupancy | # Housing Units | % Housing Units |
| Owner Occupied Housing Units | 549 | 56.2% |
| Renter-Occupied Housing Units | 428 | 43.8% |
| Total Occupied Housing Units | 977 | 100.0% |
Occupancy by Household Size in Louisville
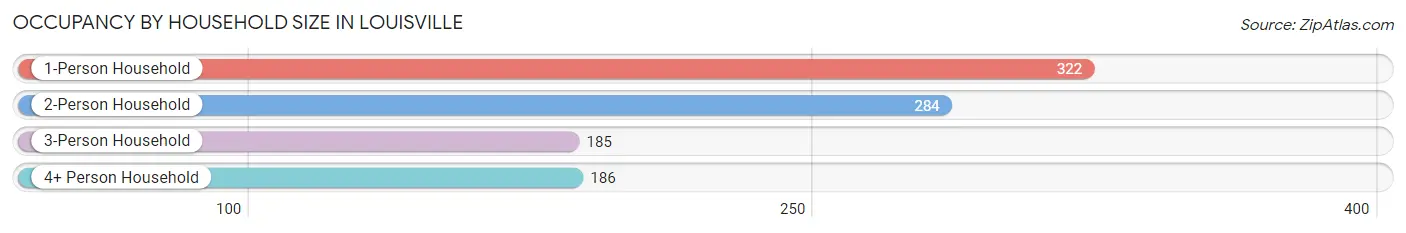
| Household Size | # Housing Units | % Housing Units |
| 1-Person Household | 322 | 33.0% |
| 2-Person Household | 284 | 29.1% |
| 3-Person Household | 185 | 18.9% |
| 4+ Person Household | 186 | 19.0% |
| Total Housing Units | 977 | 100.0% |
Occupancy by Ownership by Household Size in Louisville
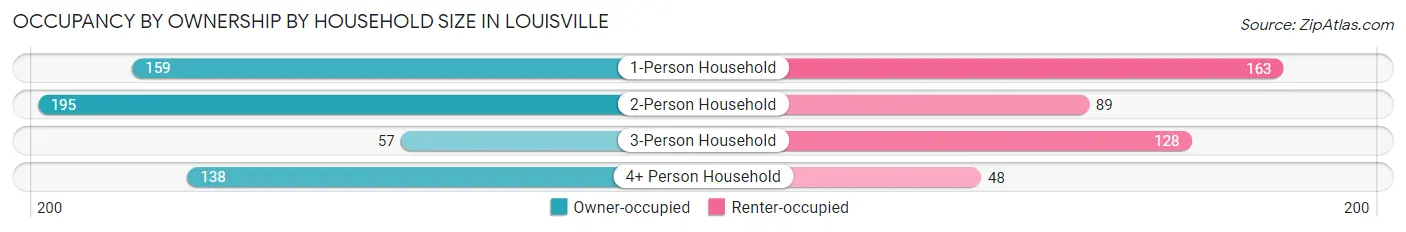
| Household Size | Owner-occupied | Renter-occupied |
| 1-Person Household | 159 (49.4%) | 163 (50.6%) |
| 2-Person Household | 195 (68.7%) | 89 (31.3%) |
| 3-Person Household | 57 (30.8%) | 128 (69.2%) |
| 4+ Person Household | 138 (74.2%) | 48 (25.8%) |
| Total Housing Units | 549 (56.2%) | 428 (43.8%) |
Occupancy by Educational Attainment in Louisville
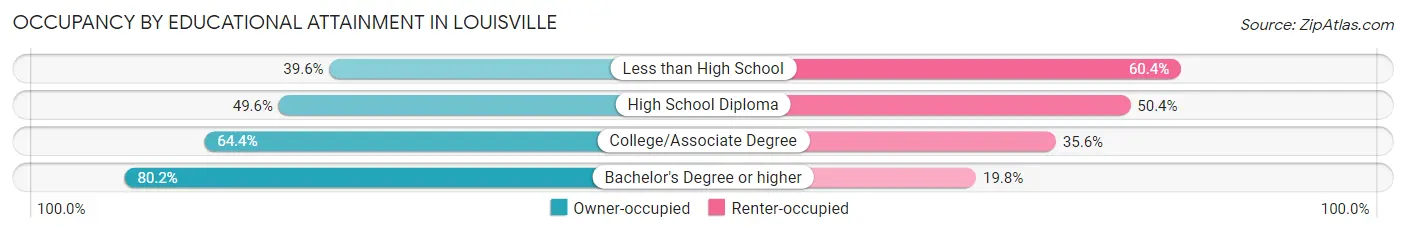
| Household Size | Owner-occupied | Renter-occupied |
| Less than High School | 91 (39.6%) | 139 (60.4%) |
| High School Diploma | 184 (49.6%) | 187 (50.4%) |
| College/Associate Degree | 112 (64.4%) | 62 (35.6%) |
| Bachelor's Degree or higher | 162 (80.2%) | 40 (19.8%) |
Occupancy by Age of Householder in Louisville
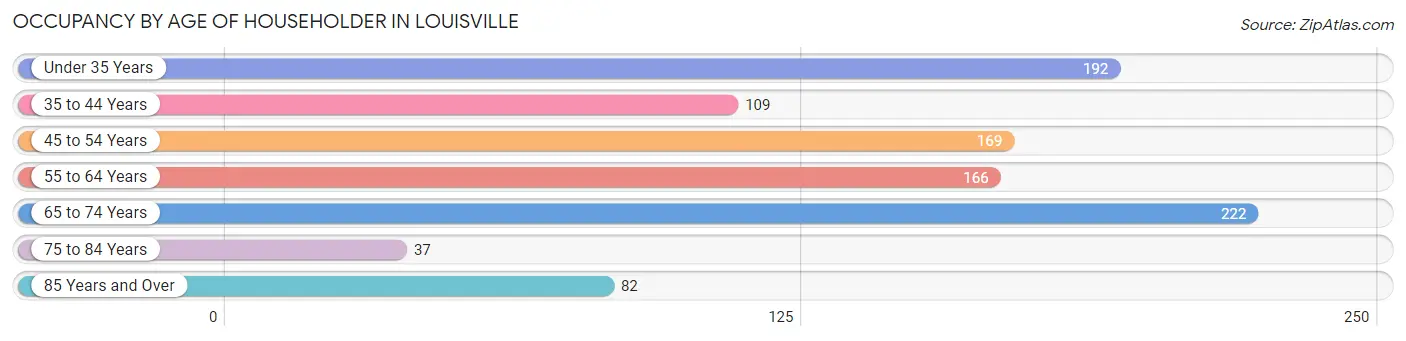
| Age Bracket | # Households | % Households |
| Under 35 Years | 192 | 19.7% |
| 35 to 44 Years | 109 | 11.2% |
| 45 to 54 Years | 169 | 17.3% |
| 55 to 64 Years | 166 | 17.0% |
| 65 to 74 Years | 222 | 22.7% |
| 75 to 84 Years | 37 | 3.8% |
| 85 Years and Over | 82 | 8.4% |
| Total | 977 | 100.0% |
Housing Finances in Louisville
Median Income by Occupancy in Louisville
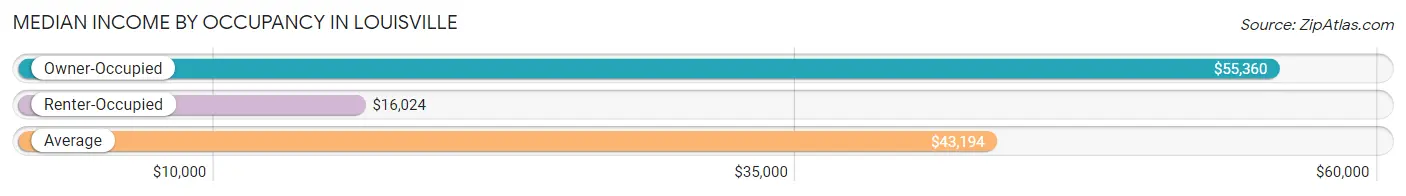
| Occupancy Type | # Households | Median Income |
| Owner-Occupied | 549 (56.2%) | $55,360 |
| Renter-Occupied | 428 (43.8%) | $16,024 |
| Average | 977 (100.0%) | $43,194 |
Occupancy by Householder Income Bracket in Louisville
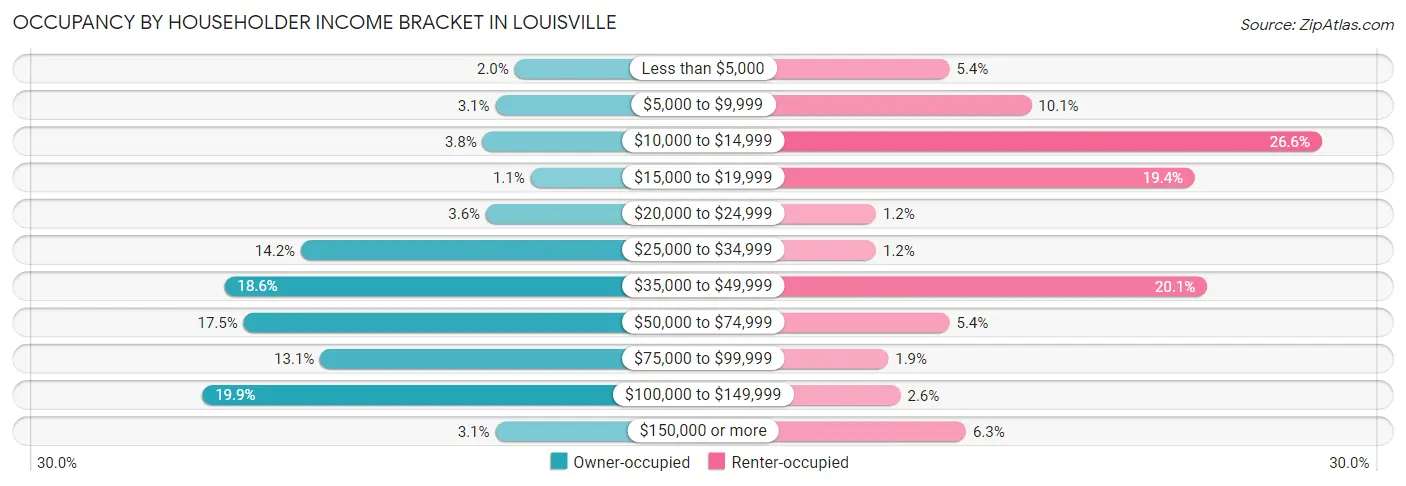
| Income Bracket | Owner-occupied | Renter-occupied |
| Less than $5,000 | 11 (2.0%) | 23 (5.4%) |
| $5,000 to $9,999 | 17 (3.1%) | 43 (10.1%) |
| $10,000 to $14,999 | 21 (3.8%) | 114 (26.6%) |
| $15,000 to $19,999 | 6 (1.1%) | 83 (19.4%) |
| $20,000 to $24,999 | 20 (3.6%) | 5 (1.2%) |
| $25,000 to $34,999 | 78 (14.2%) | 5 (1.2%) |
| $35,000 to $49,999 | 102 (18.6%) | 86 (20.1%) |
| $50,000 to $74,999 | 96 (17.5%) | 23 (5.4%) |
| $75,000 to $99,999 | 72 (13.1%) | 8 (1.9%) |
| $100,000 to $149,999 | 109 (19.9%) | 11 (2.6%) |
| $150,000 or more | 17 (3.1%) | 27 (6.3%) |
| Total | 549 (100.0%) | 428 (100.0%) |
Monthly Housing Cost Tiers in Louisville
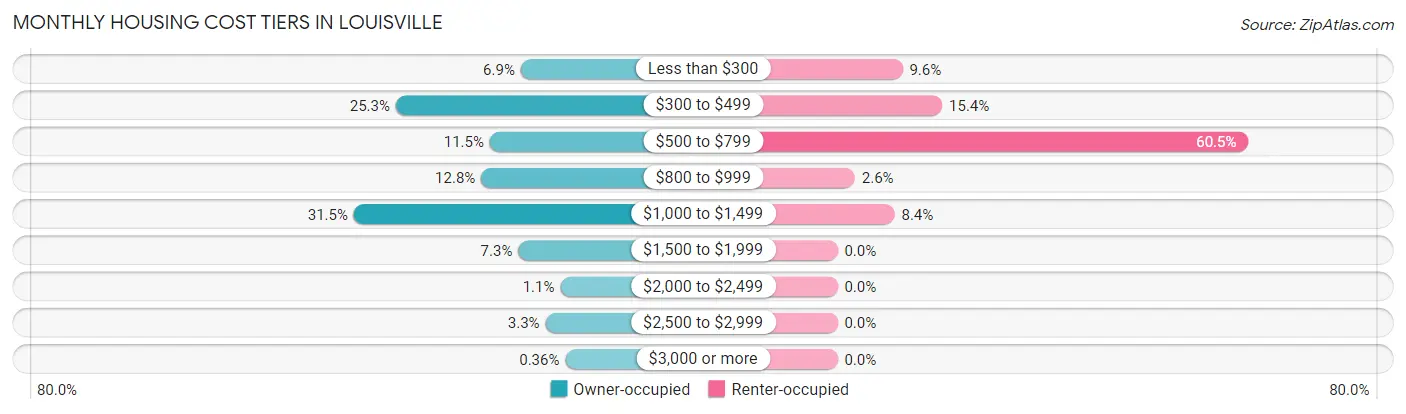
| Monthly Cost | Owner-occupied | Renter-occupied |
| Less than $300 | 38 (6.9%) | 41 (9.6%) |
| $300 to $499 | 139 (25.3%) | 66 (15.4%) |
| $500 to $799 | 63 (11.5%) | 259 (60.5%) |
| $800 to $999 | 70 (12.8%) | 11 (2.6%) |
| $1,000 to $1,499 | 173 (31.5%) | 36 (8.4%) |
| $1,500 to $1,999 | 40 (7.3%) | 0 (0.0%) |
| $2,000 to $2,499 | 6 (1.1%) | 0 (0.0%) |
| $2,500 to $2,999 | 18 (3.3%) | 0 (0.0%) |
| $3,000 or more | 2 (0.4%) | 0 (0.0%) |
| Total | 549 (100.0%) | 428 (100.0%) |
Physical Housing Characteristics in Louisville
Housing Structures in Louisville
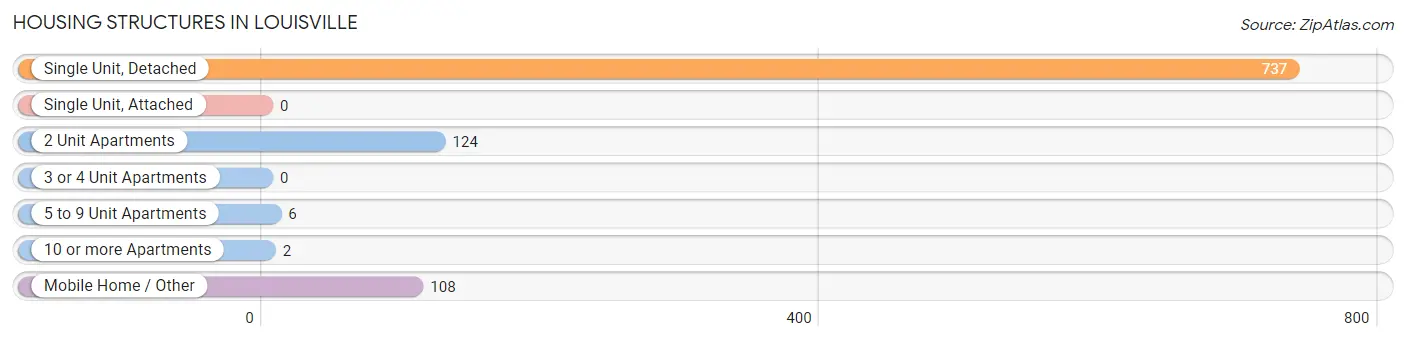
| Structure Type | # Housing Units | % Housing Units |
| Single Unit, Detached | 737 | 75.4% |
| Single Unit, Attached | 0 | 0.0% |
| 2 Unit Apartments | 124 | 12.7% |
| 3 or 4 Unit Apartments | 0 | 0.0% |
| 5 to 9 Unit Apartments | 6 | 0.6% |
| 10 or more Apartments | 2 | 0.2% |
| Mobile Home / Other | 108 | 11.1% |
| Total | 977 | 100.0% |
Housing Structures by Occupancy in Louisville
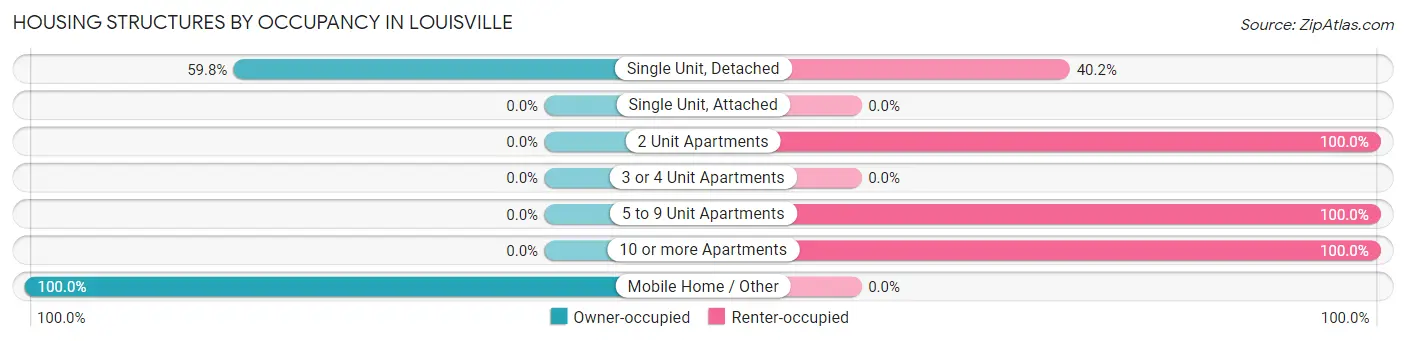
| Structure Type | Owner-occupied | Renter-occupied |
| Single Unit, Detached | 441 (59.8%) | 296 (40.2%) |
| Single Unit, Attached | 0 (0.0%) | 0 (0.0%) |
| 2 Unit Apartments | 0 (0.0%) | 124 (100.0%) |
| 3 or 4 Unit Apartments | 0 (0.0%) | 0 (0.0%) |
| 5 to 9 Unit Apartments | 0 (0.0%) | 6 (100.0%) |
| 10 or more Apartments | 0 (0.0%) | 2 (100.0%) |
| Mobile Home / Other | 108 (100.0%) | 0 (0.0%) |
| Total | 549 (56.2%) | 428 (43.8%) |
Housing Structures by Number of Rooms in Louisville
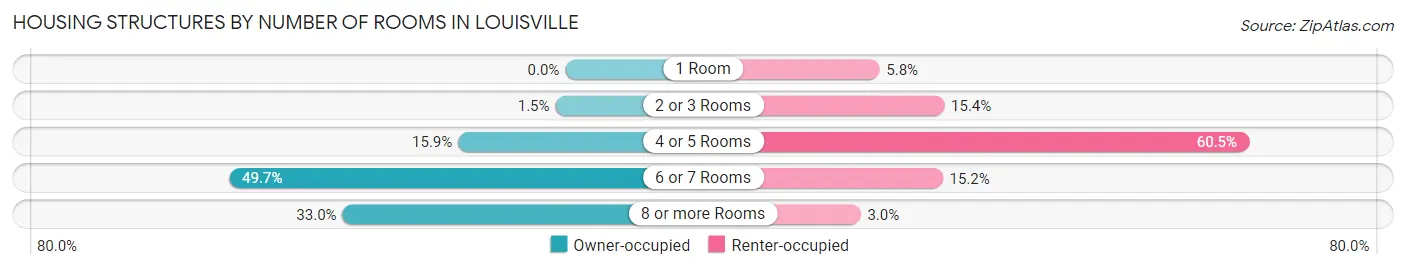
| Number of Rooms | Owner-occupied | Renter-occupied |
| 1 Room | 0 (0.0%) | 25 (5.8%) |
| 2 or 3 Rooms | 8 (1.5%) | 66 (15.4%) |
| 4 or 5 Rooms | 87 (15.9%) | 259 (60.5%) |
| 6 or 7 Rooms | 273 (49.7%) | 65 (15.2%) |
| 8 or more Rooms | 181 (33.0%) | 13 (3.0%) |
| Total | 549 (100.0%) | 428 (100.0%) |
Housing Structure by Heating Type in Louisville
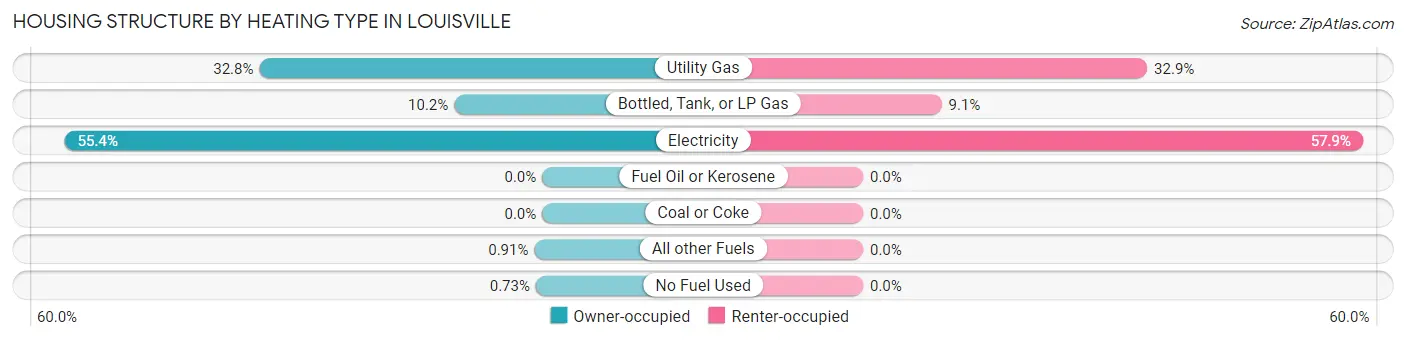
| Heating Type | Owner-occupied | Renter-occupied |
| Utility Gas | 180 (32.8%) | 141 (32.9%) |
| Bottled, Tank, or LP Gas | 56 (10.2%) | 39 (9.1%) |
| Electricity | 304 (55.4%) | 248 (57.9%) |
| Fuel Oil or Kerosene | 0 (0.0%) | 0 (0.0%) |
| Coal or Coke | 0 (0.0%) | 0 (0.0%) |
| All other Fuels | 5 (0.9%) | 0 (0.0%) |
| No Fuel Used | 4 (0.7%) | 0 (0.0%) |
| Total | 549 (100.0%) | 428 (100.0%) |
Household Vehicle Usage in Louisville
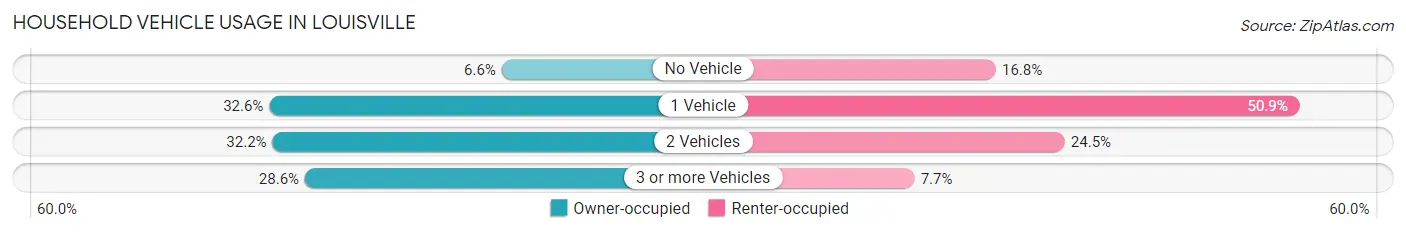
| Vehicles per Household | Owner-occupied | Renter-occupied |
| No Vehicle | 36 (6.6%) | 72 (16.8%) |
| 1 Vehicle | 179 (32.6%) | 218 (50.9%) |
| 2 Vehicles | 177 (32.2%) | 105 (24.5%) |
| 3 or more Vehicles | 157 (28.6%) | 33 (7.7%) |
| Total | 549 (100.0%) | 428 (100.0%) |
Real Estate & Mortgages in Louisville
Real Estate and Mortgage Overview in Louisville
| Characteristic | Without Mortgage | With Mortgage |
| Housing Units | 231 | 318 |
| Median Property Value | $142,500 | $118,100 |
| Median Household Income | $34,875 | $9 |
| Monthly Housing Costs | $397 | $2 |
| Real Estate Taxes | $693 | $23 |
Property Value by Mortgage Status in Louisville
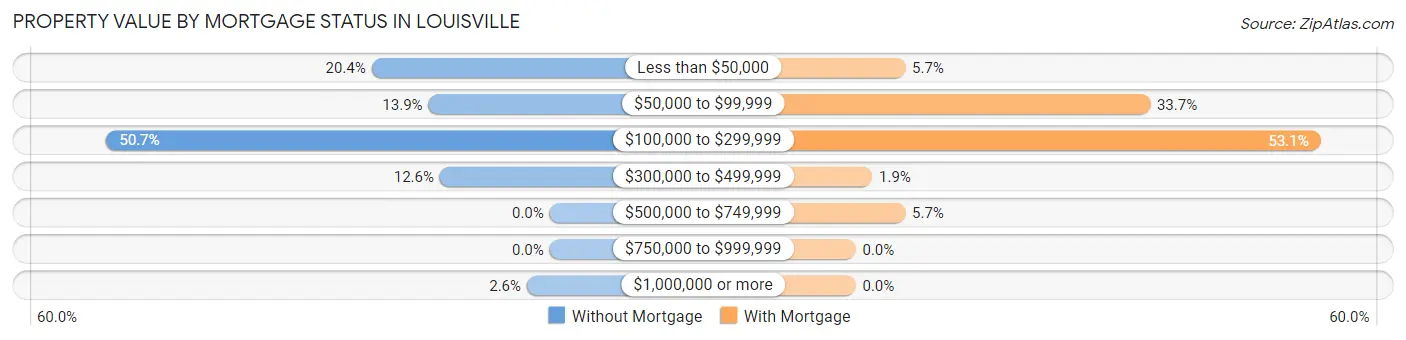
| Property Value | Without Mortgage | With Mortgage |
| Less than $50,000 | 47 (20.3%) | 18 (5.7%) |
| $50,000 to $99,999 | 32 (13.9%) | 107 (33.7%) |
| $100,000 to $299,999 | 117 (50.6%) | 169 (53.1%) |
| $300,000 to $499,999 | 29 (12.6%) | 6 (1.9%) |
| $500,000 to $749,999 | 0 (0.0%) | 18 (5.7%) |
| $750,000 to $999,999 | 0 (0.0%) | 0 (0.0%) |
| $1,000,000 or more | 6 (2.6%) | 0 (0.0%) |
| Total | 231 (100.0%) | 318 (100.0%) |
Household Income by Mortgage Status in Louisville
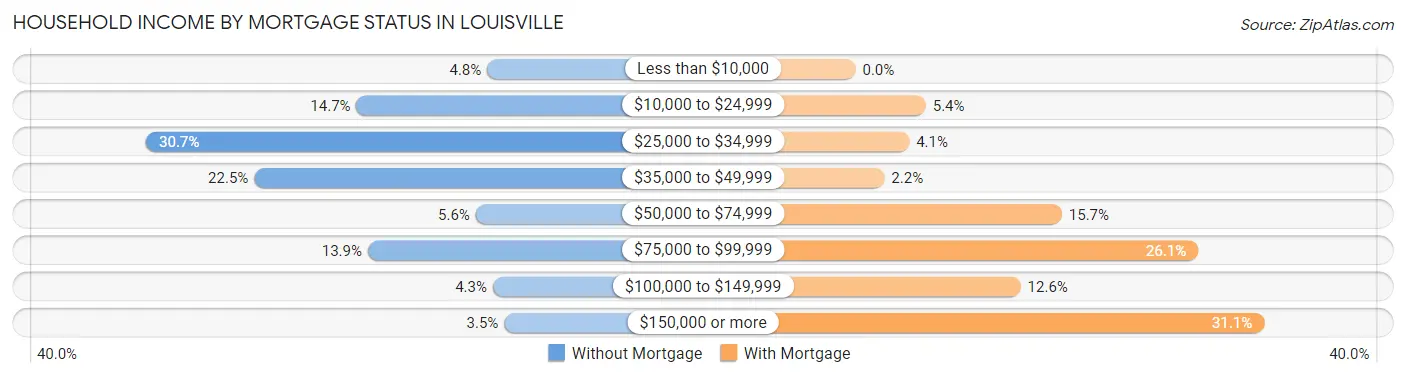
| Household Income | Without Mortgage | With Mortgage |
| Less than $10,000 | 11 (4.8%) | 0 (0.0%) |
| $10,000 to $24,999 | 34 (14.7%) | 17 (5.3%) |
| $25,000 to $34,999 | 71 (30.7%) | 13 (4.1%) |
| $35,000 to $49,999 | 52 (22.5%) | 7 (2.2%) |
| $50,000 to $74,999 | 13 (5.6%) | 50 (15.7%) |
| $75,000 to $99,999 | 32 (13.9%) | 83 (26.1%) |
| $100,000 to $149,999 | 10 (4.3%) | 40 (12.6%) |
| $150,000 or more | 8 (3.5%) | 99 (31.1%) |
| Total | 231 (100.0%) | 318 (100.0%) |
Property Value to Household Income Ratio in Louisville
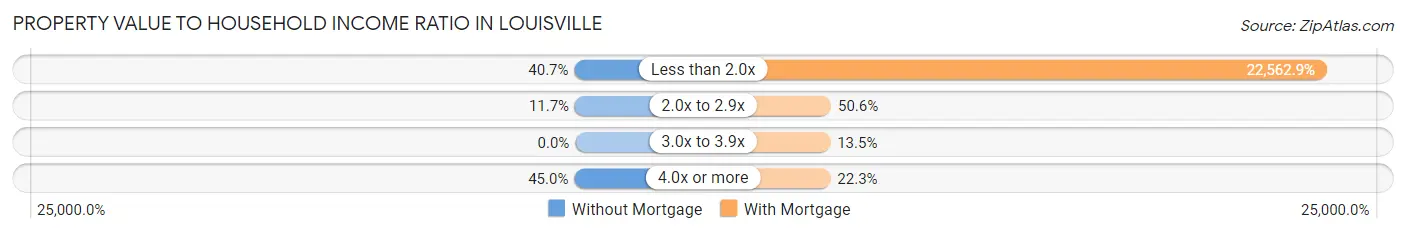
| Value-to-Income Ratio | Without Mortgage | With Mortgage |
| Less than 2.0x | 94 (40.7%) | 71,750 (22,562.9%) |
| 2.0x to 2.9x | 27 (11.7%) | 161 (50.6%) |
| 3.0x to 3.9x | 0 (0.0%) | 43 (13.5%) |
| 4.0x or more | 104 (45.0%) | 71 (22.3%) |
| Total | 231 (100.0%) | 318 (100.0%) |
Real Estate Taxes by Mortgage Status in Louisville
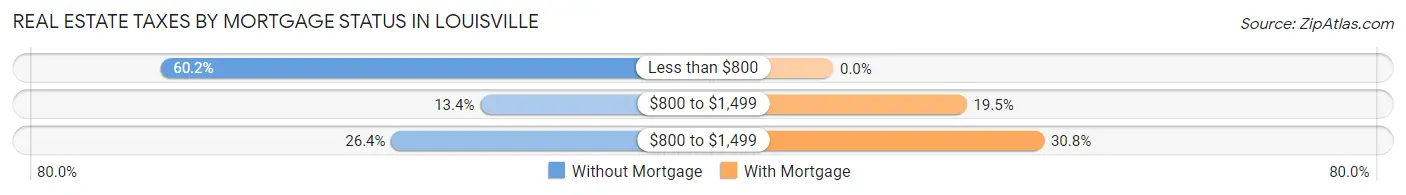
| Property Taxes | Without Mortgage | With Mortgage |
| Less than $800 | 139 (60.2%) | 0 (0.0%) |
| $800 to $1,499 | 31 (13.4%) | 62 (19.5%) |
| $800 to $1,499 | 61 (26.4%) | 98 (30.8%) |
| Total | 231 (100.0%) | 318 (100.0%) |
Health & Disability in Louisville
Health Insurance Coverage by Age in Louisville
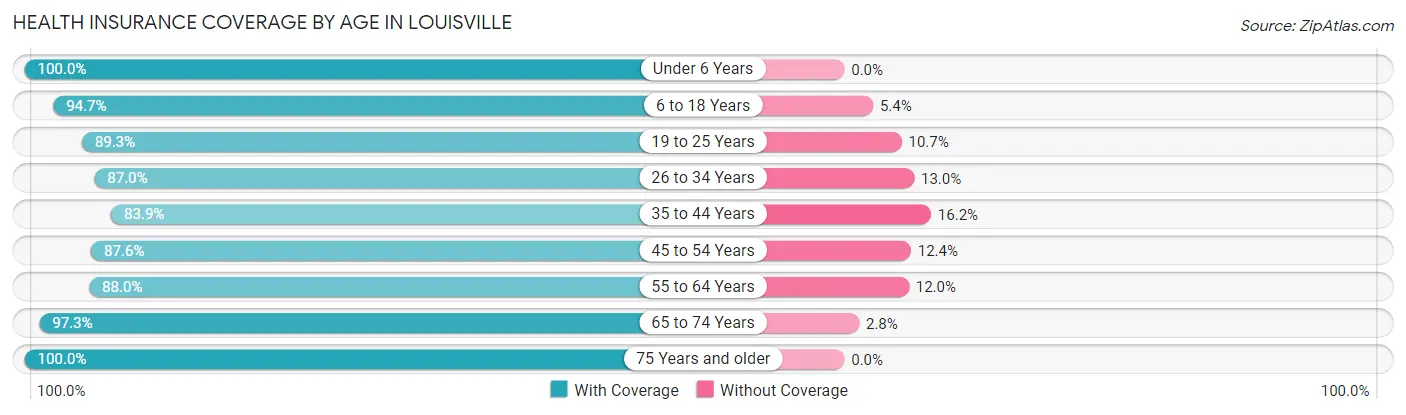
| Age Bracket | With Coverage | Without Coverage |
| Under 6 Years | 126 (100.0%) | 0 (0.0%) |
| 6 to 18 Years | 601 (94.7%) | 34 (5.3%) |
| 19 to 25 Years | 184 (89.3%) | 22 (10.7%) |
| 26 to 34 Years | 381 (87.0%) | 57 (13.0%) |
| 35 to 44 Years | 161 (83.9%) | 31 (16.2%) |
| 45 to 54 Years | 226 (87.6%) | 32 (12.4%) |
| 55 to 64 Years | 205 (88.0%) | 28 (12.0%) |
| 65 to 74 Years | 283 (97.3%) | 8 (2.8%) |
| 75 Years and older | 130 (100.0%) | 0 (0.0%) |
| Total | 2,297 (91.5%) | 212 (8.5%) |
Health Insurance Coverage by Citizenship Status in Louisville
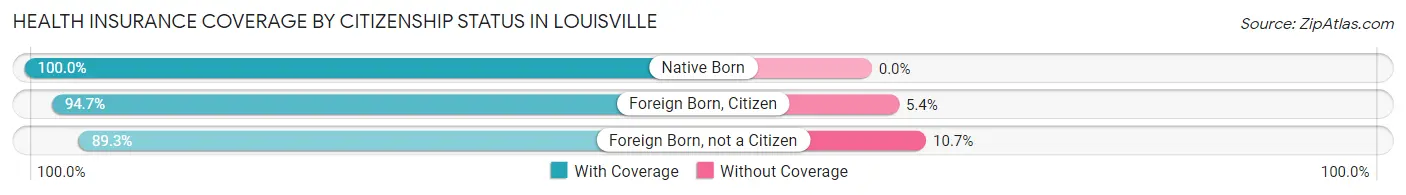
| Citizenship Status | With Coverage | Without Coverage |
| Native Born | 126 (100.0%) | 0 (0.0%) |
| Foreign Born, Citizen | 601 (94.7%) | 34 (5.3%) |
| Foreign Born, not a Citizen | 184 (89.3%) | 22 (10.7%) |
Health Insurance Coverage by Household Income in Louisville
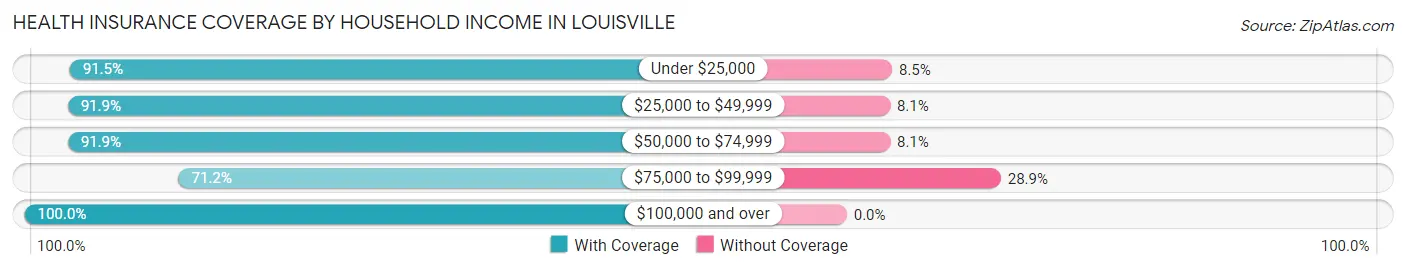
| Household Income | With Coverage | Without Coverage |
| Under $25,000 | 561 (91.5%) | 52 (8.5%) |
| $25,000 to $49,999 | 591 (91.9%) | 52 (8.1%) |
| $50,000 to $74,999 | 397 (91.9%) | 35 (8.1%) |
| $75,000 to $99,999 | 180 (71.2%) | 73 (28.8%) |
| $100,000 and over | 568 (100.0%) | 0 (0.0%) |
Public vs Private Health Insurance Coverage by Age in Louisville
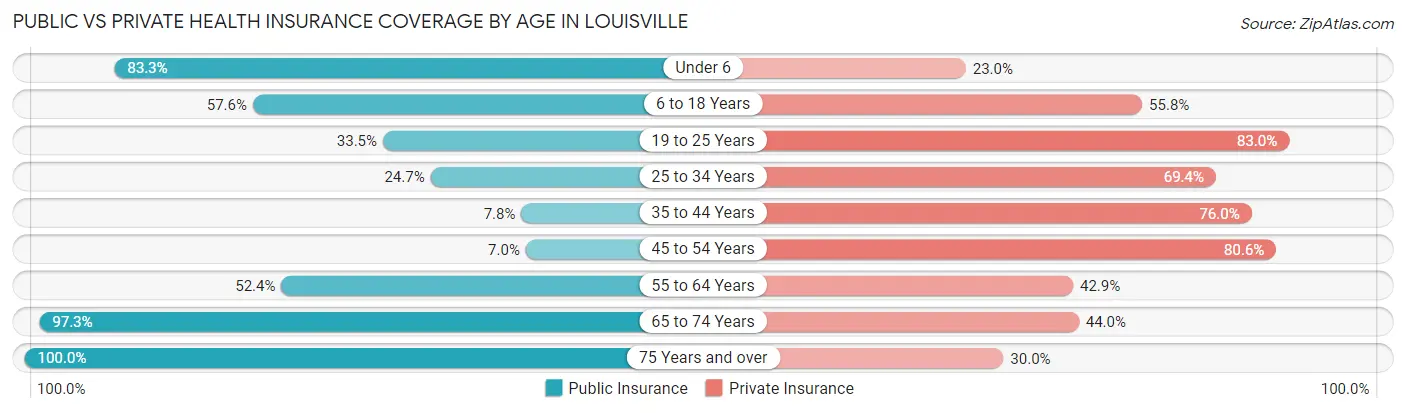
| Age Bracket | Public Insurance | Private Insurance |
| Under 6 | 105 (83.3%) | 29 (23.0%) |
| 6 to 18 Years | 366 (57.6%) | 354 (55.7%) |
| 19 to 25 Years | 69 (33.5%) | 171 (83.0%) |
| 25 to 34 Years | 108 (24.7%) | 304 (69.4%) |
| 35 to 44 Years | 15 (7.8%) | 146 (76.0%) |
| 45 to 54 Years | 18 (7.0%) | 208 (80.6%) |
| 55 to 64 Years | 122 (52.4%) | 100 (42.9%) |
| 65 to 74 Years | 283 (97.3%) | 128 (44.0%) |
| 75 Years and over | 130 (100.0%) | 39 (30.0%) |
| Total | 1,216 (48.5%) | 1,479 (59.0%) |
Disability Status by Sex by Age in Louisville
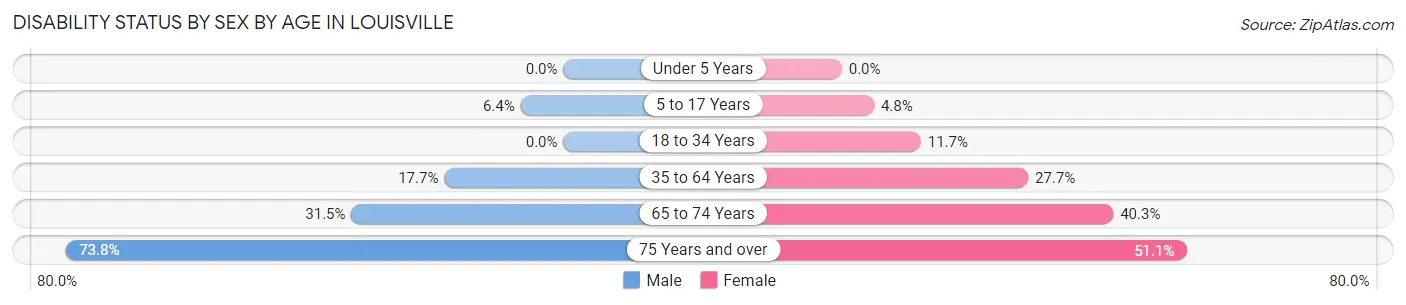
| Age Bracket | Male | Female |
| Under 5 Years | 0 (0.0%) | 0 (0.0%) |
| 5 to 17 Years | 19 (6.4%) | 14 (4.8%) |
| 18 to 34 Years | 0 (0.0%) | 21 (11.7%) |
| 35 to 64 Years | 46 (17.7%) | 117 (27.7%) |
| 65 to 74 Years | 51 (31.5%) | 52 (40.3%) |
| 75 Years and over | 31 (73.8%) | 45 (51.1%) |
Disability Class by Sex by Age in Louisville
Disability Class: Hearing Difficulty
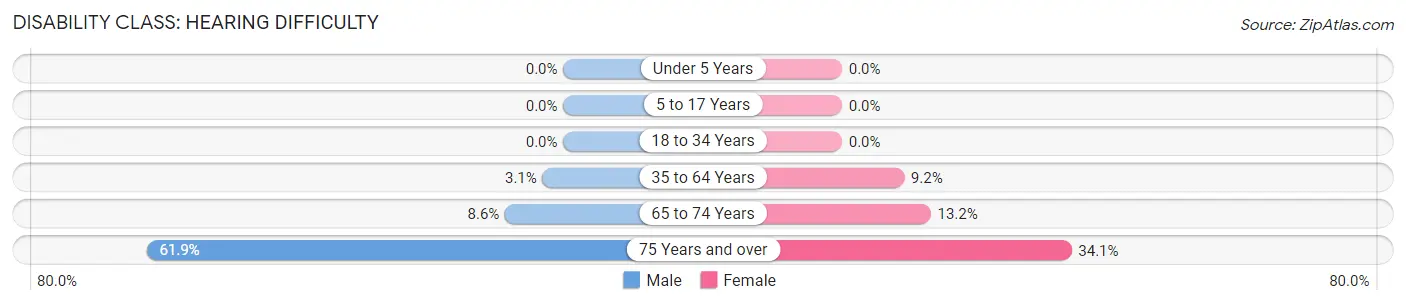
| Age Bracket | Male | Female |
| Under 5 Years | 0 (0.0%) | 0 (0.0%) |
| 5 to 17 Years | 0 (0.0%) | 0 (0.0%) |
| 18 to 34 Years | 0 (0.0%) | 0 (0.0%) |
| 35 to 64 Years | 8 (3.1%) | 39 (9.2%) |
| 65 to 74 Years | 14 (8.6%) | 17 (13.2%) |
| 75 Years and over | 26 (61.9%) | 30 (34.1%) |
Disability Class: Vision Difficulty
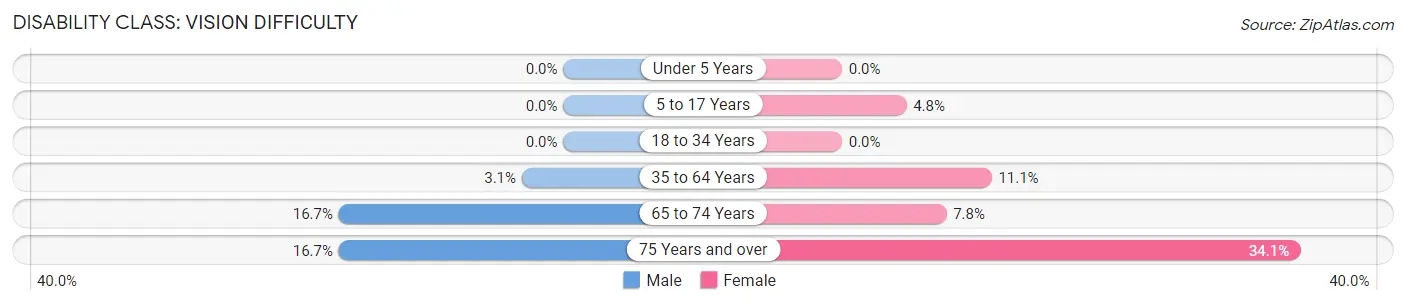
| Age Bracket | Male | Female |
| Under 5 Years | 0 (0.0%) | 0 (0.0%) |
| 5 to 17 Years | 0 (0.0%) | 14 (4.8%) |
| 18 to 34 Years | 0 (0.0%) | 0 (0.0%) |
| 35 to 64 Years | 8 (3.1%) | 47 (11.1%) |
| 65 to 74 Years | 27 (16.7%) | 10 (7.7%) |
| 75 Years and over | 7 (16.7%) | 30 (34.1%) |
Disability Class: Cognitive Difficulty
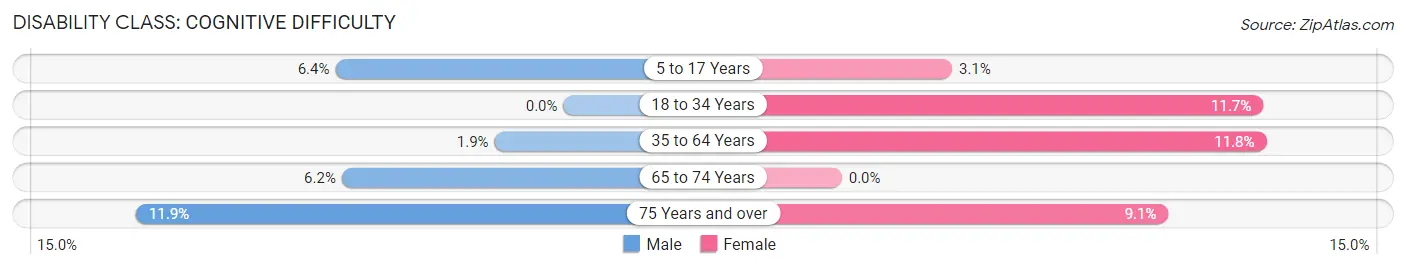
| Age Bracket | Male | Female |
| 5 to 17 Years | 19 (6.4%) | 9 (3.1%) |
| 18 to 34 Years | 0 (0.0%) | 21 (11.7%) |
| 35 to 64 Years | 5 (1.9%) | 50 (11.8%) |
| 65 to 74 Years | 10 (6.2%) | 0 (0.0%) |
| 75 Years and over | 5 (11.9%) | 8 (9.1%) |
Disability Class: Ambulatory Difficulty
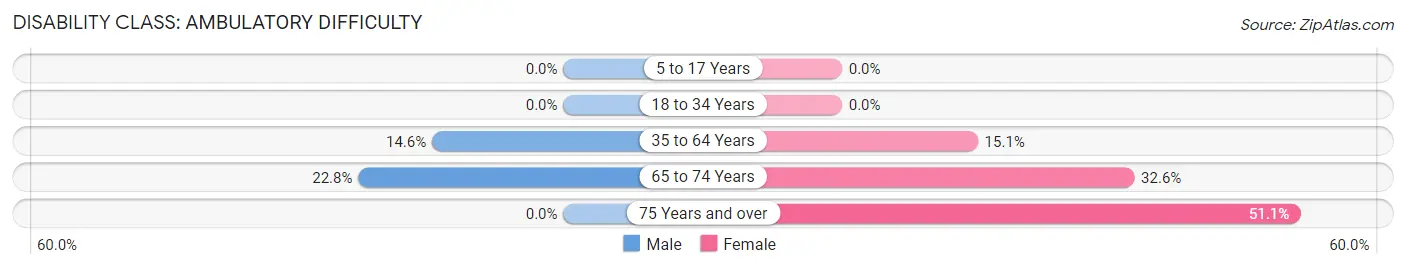
| Age Bracket | Male | Female |
| 5 to 17 Years | 0 (0.0%) | 0 (0.0%) |
| 18 to 34 Years | 0 (0.0%) | 0 (0.0%) |
| 35 to 64 Years | 38 (14.6%) | 64 (15.1%) |
| 65 to 74 Years | 37 (22.8%) | 42 (32.6%) |
| 75 Years and over | 0 (0.0%) | 45 (51.1%) |
Disability Class: Self-Care Difficulty
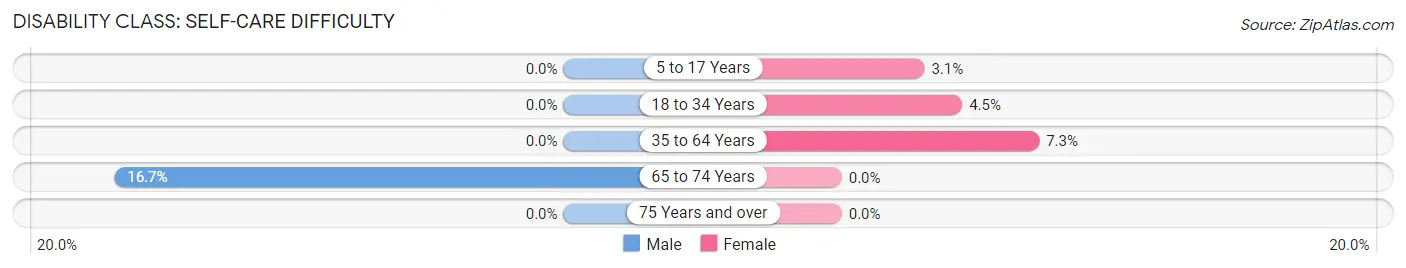
| Age Bracket | Male | Female |
| 5 to 17 Years | 0 (0.0%) | 9 (3.1%) |
| 18 to 34 Years | 0 (0.0%) | 8 (4.5%) |
| 35 to 64 Years | 0 (0.0%) | 31 (7.3%) |
| 65 to 74 Years | 27 (16.7%) | 0 (0.0%) |
| 75 Years and over | 0 (0.0%) | 0 (0.0%) |
Technology Access in Louisville
Computing Device Access in Louisville
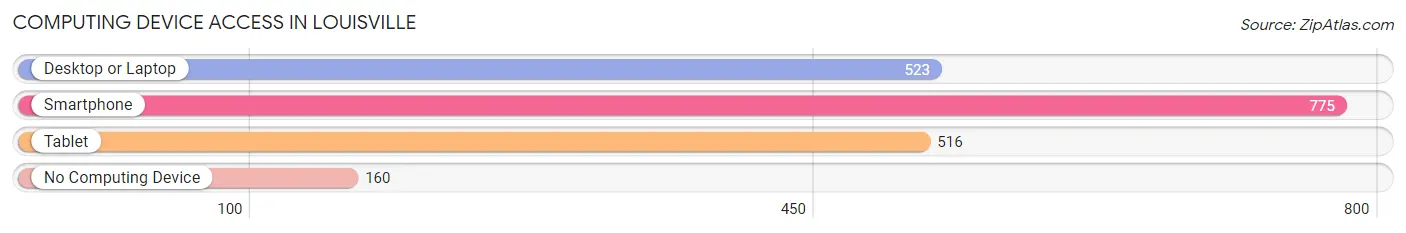
| Device Type | # Households | % Households |
| Desktop or Laptop | 523 | 53.5% |
| Smartphone | 775 | 79.3% |
| Tablet | 516 | 52.8% |
| No Computing Device | 160 | 16.4% |
| Total | 977 | 100.0% |
Internet Access in Louisville
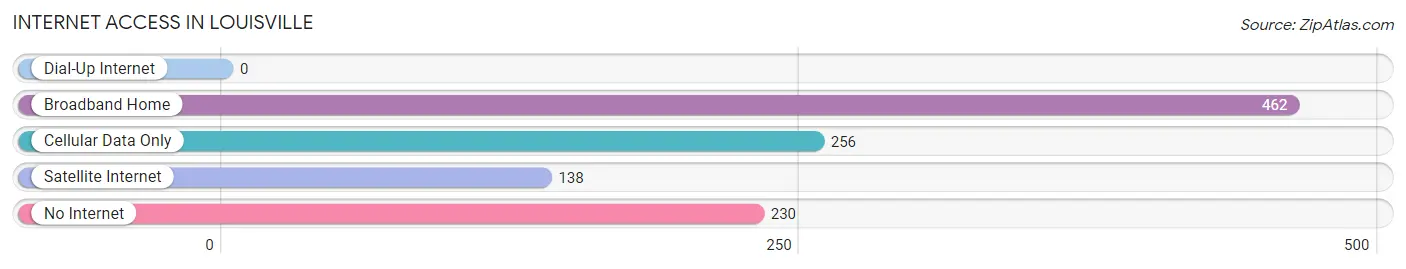
| Internet Type | # Households | % Households |
| Dial-Up Internet | 0 | 0.0% |
| Broadband Home | 462 | 47.3% |
| Cellular Data Only | 256 | 26.2% |
| Satellite Internet | 138 | 14.1% |
| No Internet | 230 | 23.5% |
| Total | 977 | 100.0% |
Louisville Summary
Louisville is a city located in Jefferson County, Georgia, United States. It is the county seat of Jefferson County and is located in the heart of the Piedmont region of Georgia. The city is situated on the banks of the Ogeechee River and is part of the Augusta-Richmond County Metropolitan Statistical Area. As of the 2010 census, the city had a population of 2,817.
History
The area that is now Louisville was first settled in the early 1800s by settlers from Virginia and North Carolina. The city was originally known as “Mulberry Grove” and was later renamed “Louisville” in honor of King Louis XVI of France. The city was incorporated in 1809 and was the county seat of Jefferson County.
During the Civil War, Louisville was the site of several battles, including the Battle of Louisville in 1864. The city was also the site of a major Confederate victory in the Battle of Griswoldville in 1864.
Geography
Louisville is located in the Piedmont region of Georgia at 33°45'N 82°45'W (33.75, -82.75). The city is situated on the banks of the Ogeechee River and is part of the Augusta-Richmond County Metropolitan Statistical Area. The city has a total area of 4.2 square miles, all of which is land.
Economy
The economy of Louisville is largely based on agriculture and manufacturing. The city is home to several large agricultural operations, including poultry farms, cattle farms, and vegetable farms. The city is also home to several manufacturing companies, including a paper mill, a furniture factory, and a textile mill.
Demographics
As of the 2010 census, there were 2,817 people, 1,093 households, and 745 families residing in the city. The population density was 672.2 people per square mile. The racial makeup of the city was 65.2% White, 30.2% African American, 0.3% Native American, 0.7% Asian, 0.1% Pacific Islander, 2.2% from other races, and 1.3% from two or more races. Hispanic or Latino of any race were 4.2% of the population.
The median income for a household in the city was $30,938, and the median income for a family was $37,813. Males had a median income of $30,000 versus $21,250 for females. The per capita income for the city was $15,945. About 17.2% of families and 20.2% of the population were below the poverty line, including 28.2% of those under age 18 and 16.2% of those age 65 or over.
Common Questions
What is the Total Population of Louisville?
Total Population of Louisville is 2,704.
What is the Total Male Population of Louisville?
Total Male Population of Louisville is 1,459.
What is the Total Female Population of Louisville?
Total Female Population of Louisville is 1,245.
What is the Ratio of Males per 100 Females in Louisville?
There are 117.19 Males per 100 Females in Louisville.
What is the Ratio of Females per 100 Males in Louisville?
There are 85.33 Females per 100 Males in Louisville.
What is the Median Population Age in Louisville?
Median Population Age in Louisville is 33.0 Years.
What is the Average Family Size in Louisville
Average Family Size in Louisville is 3.3 People.
What is the Average Household Size in Louisville
Average Household Size in Louisville is 2.6 People.
What is Per Capita Income in Louisville?
Per Capita income in Louisville is $25,088.
What is the Median Family Income in Louisville?
Median Family Income in Louisville is $49,475.
What is the Median Household income in Louisville?
Median Household Income in Louisville is $43,194.
What is Income or Wage Gap in Louisville?
Income or Wage Gap in Louisville is 17.2%.
Women in Louisville earn 82.8 cents for every dollar earned by a man.
What is Inequality or Gini Index in Louisville?
Inequality or Gini Index in Louisville is 0.55.
How Large is the Labor Force in Louisville?
There are 1,013 People in the Labor Forcein in Louisville.
What is the Percentage of People in the Labor Force in Louisville?
48.3% of People are in the Labor Force in Louisville.
What is the Unemployment Rate in Louisville?
Unemployment Rate in Louisville is 3.1%.