Davisboro, GA
Davisboro Map
Davisboro Overview
2,196
TOTAL POPULATION
1,744
MALE POPULATION
452
FEMALE POPULATION
385.84
MALES / 100 FEMALES
25.92
FEMALES / 100 MALES
37.5
MEDIAN AGE
3.6
AVG FAMILY SIZE
2.8
AVG HOUSEHOLD SIZE
$7,697
PER CAPITA INCOME
$46,633
AVG FAMILY INCOME
$45,647
AVG HOUSEHOLD INCOME
0.37
INEQUALITY / GINI INDEX
294
LABOR FORCE [ PEOPLE ]
15.3%
PERCENT IN LABOR FORCE
4.4%
UNEMPLOYMENT RATE
Davisboro Zip Codes
Davisboro Area Codes
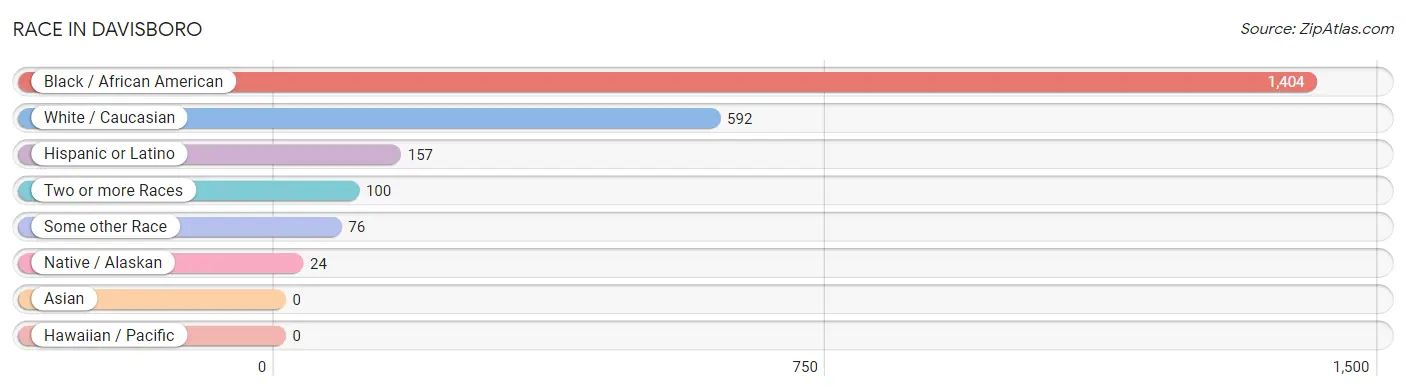
Race in Davisboro
The most populous races in Davisboro are Black / African American (1,404 | 63.9%), White / Caucasian (592 | 27.0%), and Hispanic or Latino (157 | 7.1%).
| Race | # Population | % Population |
| Asian | 0 | 0.0% |
| Black / African American | 1,404 | 63.9% |
| Hawaiian / Pacific | 0 | 0.0% |
| Hispanic or Latino | 157 | 7.1% |
| Native / Alaskan | 24 | 1.1% |
| White / Caucasian | 592 | 27.0% |
| Two or more Races | 100 | 4.5% |
| Some other Race | 76 | 3.5% |
| Total | 2,196 | 100.0% |
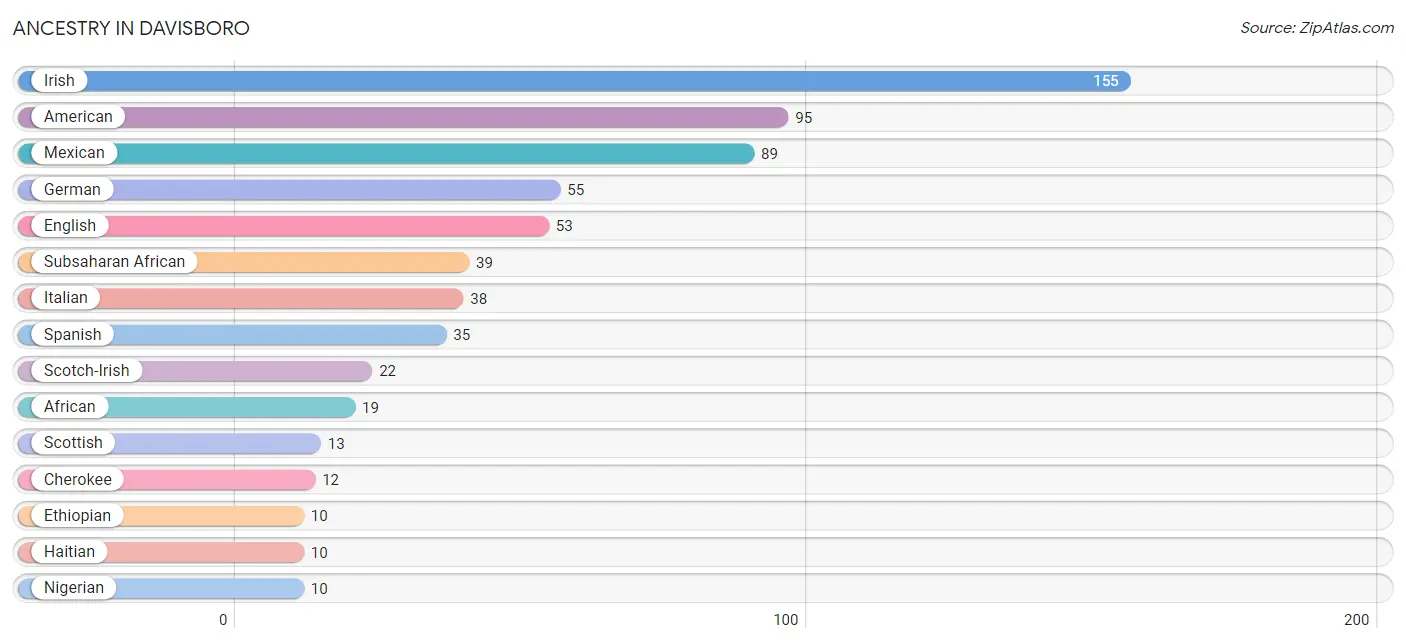
Ancestry in Davisboro
The most populous ancestries reported in Davisboro are Irish (155 | 7.1%), American (95 | 4.3%), Mexican (89 | 4.1%), German (55 | 2.5%), and English (53 | 2.4%), together accounting for 20.4% of all Davisboro residents.
| Ancestry | # Population | % Population |
| African | 19 | 0.9% |
| American | 95 | 4.3% |
| Arab | 6 | 0.3% |
| British | 6 | 0.3% |
| Central American | 6 | 0.3% |
| Cherokee | 12 | 0.5% |
| Cuban | 6 | 0.3% |
| Dutch | 6 | 0.3% |
| English | 53 | 2.4% |
| Ethiopian | 10 | 0.5% |
| French | 3 | 0.1% |
| German | 55 | 2.5% |
| Haitian | 10 | 0.5% |
| Irish | 155 | 7.1% |
| Israeli | 6 | 0.3% |
| Italian | 38 | 1.7% |
| Jamaican | 6 | 0.3% |
| Mexican | 89 | 4.1% |
| Mexican American Indian | 5 | 0.2% |
| Nigerian | 10 | 0.5% |
| Panamanian | 6 | 0.3% |
| Puerto Rican | 10 | 0.5% |
| Scandinavian | 1 | 0.1% |
| Scotch-Irish | 22 | 1.0% |
| Scottish | 13 | 0.6% |
| Spanish | 35 | 1.6% |
| Subsaharan African | 39 | 1.8% | View All 27 Rows |
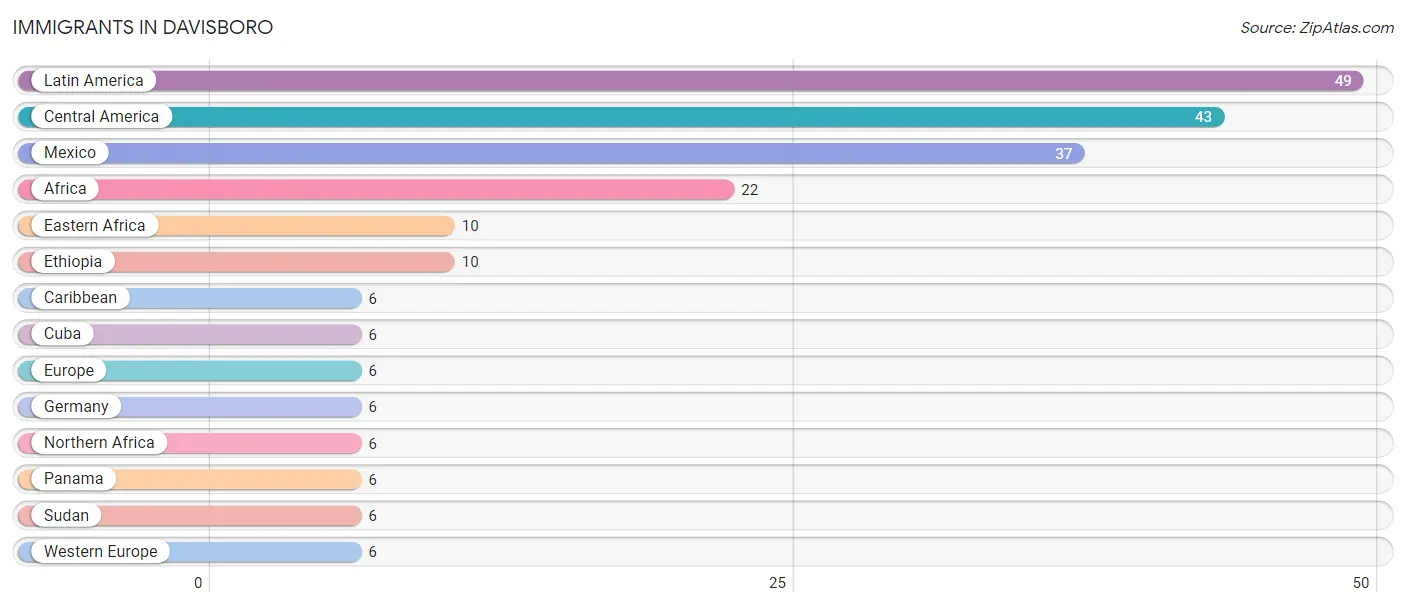
Immigrants in Davisboro
The most numerous immigrant groups reported in Davisboro came from Latin America (49 | 2.2%), Central America (43 | 2.0%), Mexico (37 | 1.7%), Africa (22 | 1.0%), and Eastern Africa (10 | 0.5%), together accounting for 7.3% of all Davisboro residents.
| Immigration Origin | # Population | % Population |
| Africa | 22 | 1.0% |
| Caribbean | 6 | 0.3% |
| Central America | 43 | 2.0% |
| Cuba | 6 | 0.3% |
| Eastern Africa | 10 | 0.5% |
| Ethiopia | 10 | 0.5% |
| Europe | 6 | 0.3% |
| Germany | 6 | 0.3% |
| Latin America | 49 | 2.2% |
| Mexico | 37 | 1.7% |
| Northern Africa | 6 | 0.3% |
| Panama | 6 | 0.3% |
| Sudan | 6 | 0.3% |
| Western Europe | 6 | 0.3% | View All 14 Rows |
Sex and Age in Davisboro
Sex and Age in Davisboro
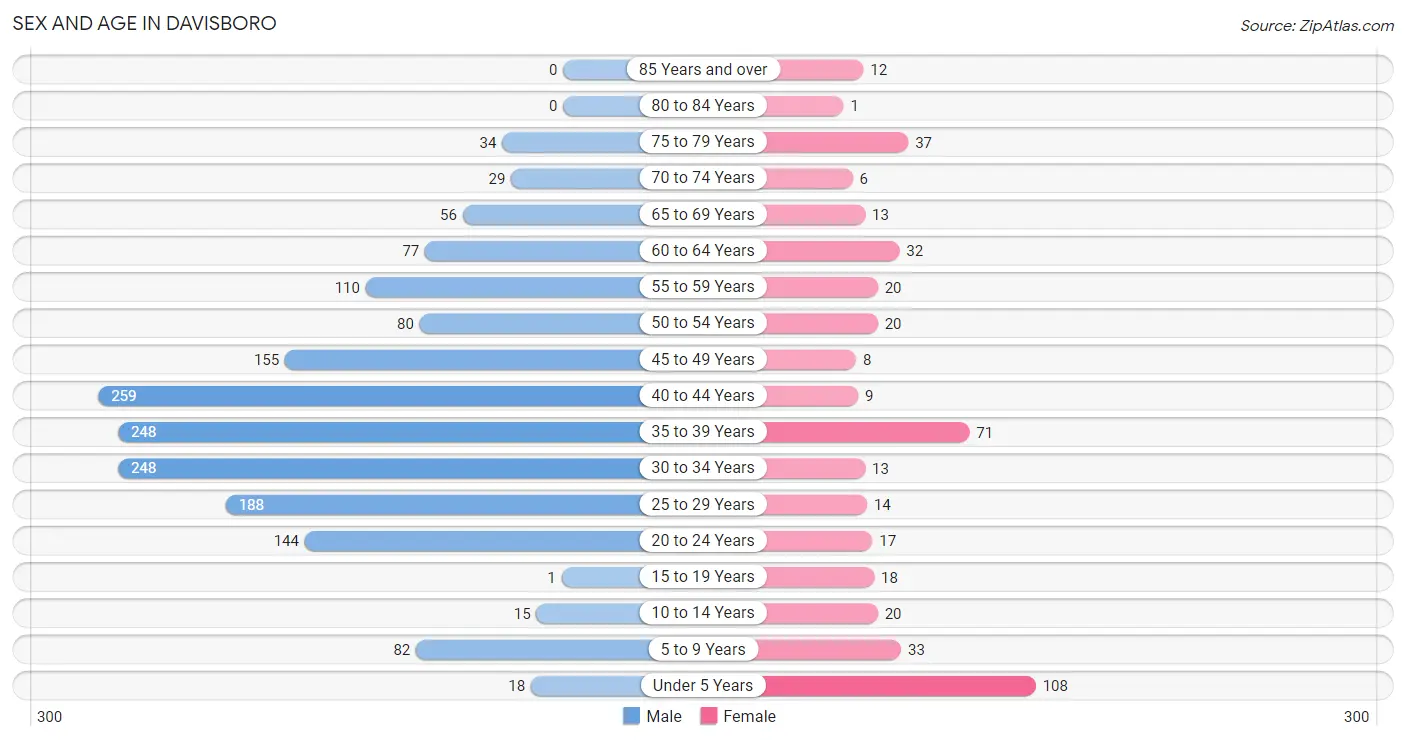
The most populous age groups in Davisboro are 40 to 44 Years (259 | 14.8%) for men and Under 5 Years (108 | 23.9%) for women.
| Age Bracket | Male | Female |
| Under 5 Years | 18 (1.0%) | 108 (23.9%) |
| 5 to 9 Years | 82 (4.7%) | 33 (7.3%) |
| 10 to 14 Years | 15 (0.9%) | 20 (4.4%) |
| 15 to 19 Years | 1 (0.1%) | 18 (4.0%) |
| 20 to 24 Years | 144 (8.3%) | 17 (3.8%) |
| 25 to 29 Years | 188 (10.8%) | 14 (3.1%) |
| 30 to 34 Years | 248 (14.2%) | 13 (2.9%) |
| 35 to 39 Years | 248 (14.2%) | 71 (15.7%) |
| 40 to 44 Years | 259 (14.8%) | 9 (2.0%) |
| 45 to 49 Years | 155 (8.9%) | 8 (1.8%) |
| 50 to 54 Years | 80 (4.6%) | 20 (4.4%) |
| 55 to 59 Years | 110 (6.3%) | 20 (4.4%) |
| 60 to 64 Years | 77 (4.4%) | 32 (7.1%) |
| 65 to 69 Years | 56 (3.2%) | 13 (2.9%) |
| 70 to 74 Years | 29 (1.7%) | 6 (1.3%) |
| 75 to 79 Years | 34 (1.9%) | 37 (8.2%) |
| 80 to 84 Years | 0 (0.0%) | 1 (0.2%) |
| 85 Years and over | 0 (0.0%) | 12 (2.6%) |
| Total | 1,744 (100.0%) | 452 (100.0%) |
Families and Households in Davisboro
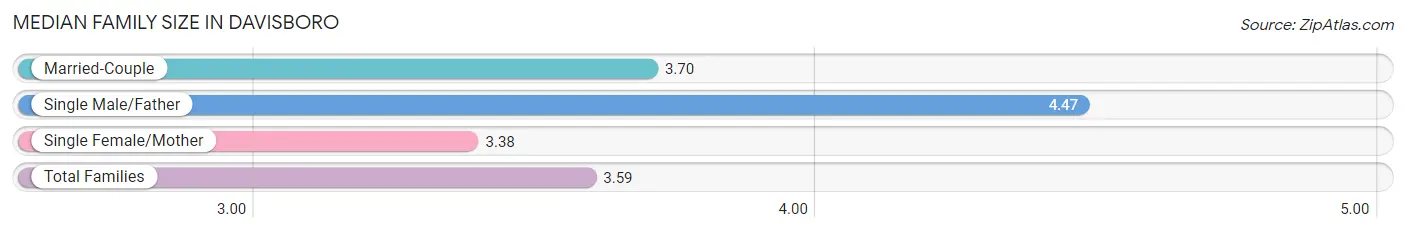
Median Family Size in Davisboro
The median family size in Davisboro is 3.59 persons per family, with single male/father families (15 | 9.3%) accounting for the largest median family size of 4.47 persons per family. On the other hand, single female/mother families (91 | 56.2%) represent the smallest median family size with 3.38 persons per family.
| Family Type | # Families | Family Size |
| Married-Couple | 56 (34.6%) | 3.70 |
| Single Male/Father | 15 (9.3%) | 4.47 |
| Single Female/Mother | 91 (56.2%) | 3.38 |
| Total Families | 162 (100.0%) | 3.59 |
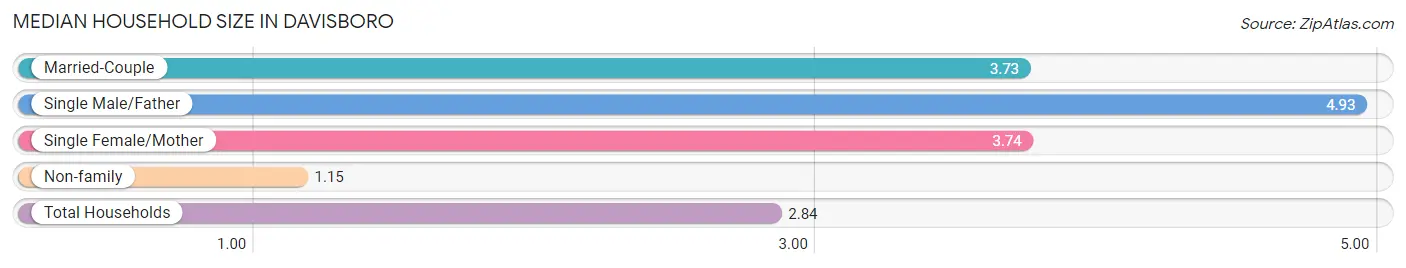
Median Household Size in Davisboro
The median household size in Davisboro is 2.84 persons per household, with single male/father households (15 | 5.8%) accounting for the largest median household size of 4.93 persons per household. non-family households (97 | 37.4%) represent the smallest median household size with 1.15 persons per household.
| Household Type | # Households | Household Size |
| Married-Couple | 56 (21.6%) | 3.73 |
| Single Male/Father | 15 (5.8%) | 4.93 |
| Single Female/Mother | 91 (35.1%) | 3.74 |
| Non-family | 97 (37.4%) | 1.15 |
| Total Households | 259 (100.0%) | 2.84 |
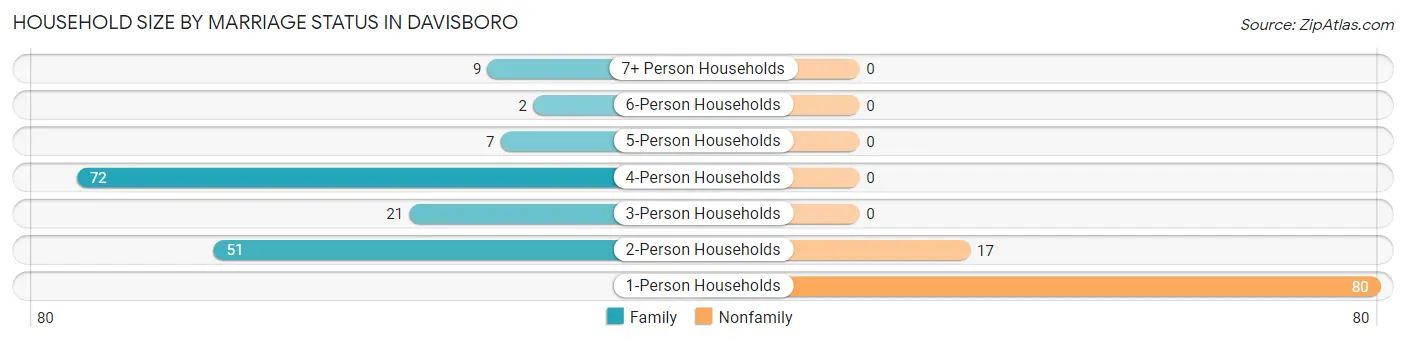
Household Size by Marriage Status in Davisboro
Out of a total of 259 households in Davisboro, 162 (62.5%) are family households, while 97 (37.4%) are nonfamily households. The most numerous type of family households are 4-person households, comprising 72, and the most common type of nonfamily households are 1-person households, comprising 80.
| Household Size | Family Households | Nonfamily Households |
| 1-Person Households | - | 80 (30.9%) |
| 2-Person Households | 51 (19.7%) | 17 (6.6%) |
| 3-Person Households | 21 (8.1%) | 0 (0.0%) |
| 4-Person Households | 72 (27.8%) | 0 (0.0%) |
| 5-Person Households | 7 (2.7%) | 0 (0.0%) |
| 6-Person Households | 2 (0.8%) | 0 (0.0%) |
| 7+ Person Households | 9 (3.5%) | 0 (0.0%) |
| Total | 162 (62.5%) | 97 (37.4%) |
Female Fertility in Davisboro
Fertility by Age in Davisboro
Average fertility rate in Davisboro is 19.0 births per 1,000 women. Women in the age bracket of 20 to 34 years have the highest fertility rate with 68.0 births per 1,000 women. Women in the age bracket of 20 to 34 years acount for 100.0% of all women with births.
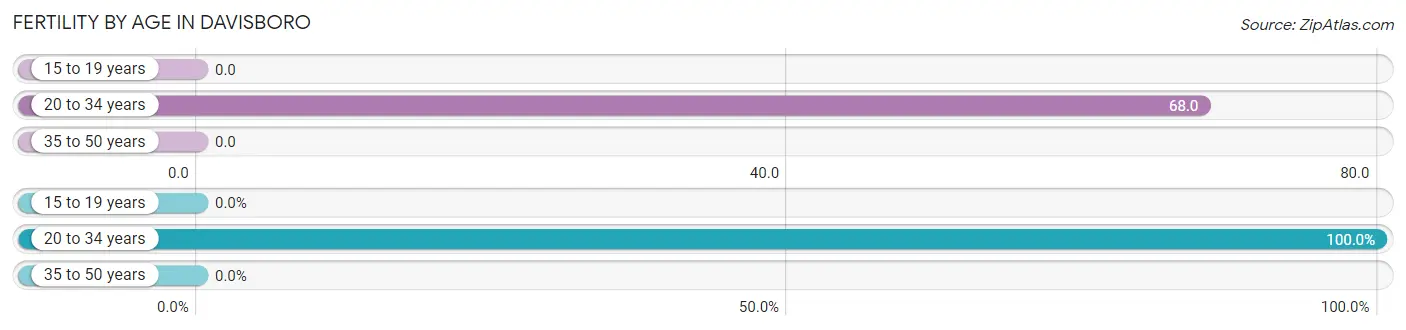
| Age Bracket | Women with Births | Births / 1,000 Women |
| 15 to 19 years | 0 (0.0%) | 0.0 |
| 20 to 34 years | 3 (100.0%) | 68.0 |
| 35 to 50 years | 0 (0.0%) | 0.0 |
| Total | 3 (100.0%) | 19.0 |
Fertility by Age by Marriage Status in Davisboro
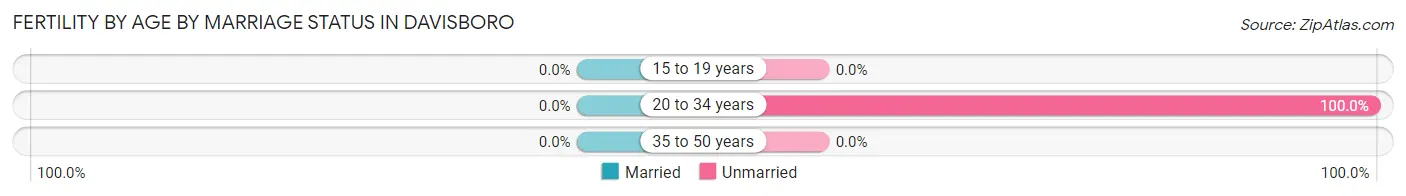
| Age Bracket | Married | Unmarried |
| 15 to 19 years | 0 (0.0%) | 0 (0.0%) |
| 20 to 34 years | 0 (0.0%) | 3 (100.0%) |
| 35 to 50 years | 0 (0.0%) | 0 (0.0%) |
| Total | 0 (0.0%) | 3 (100.0%) |
Fertility by Education in Davisboro
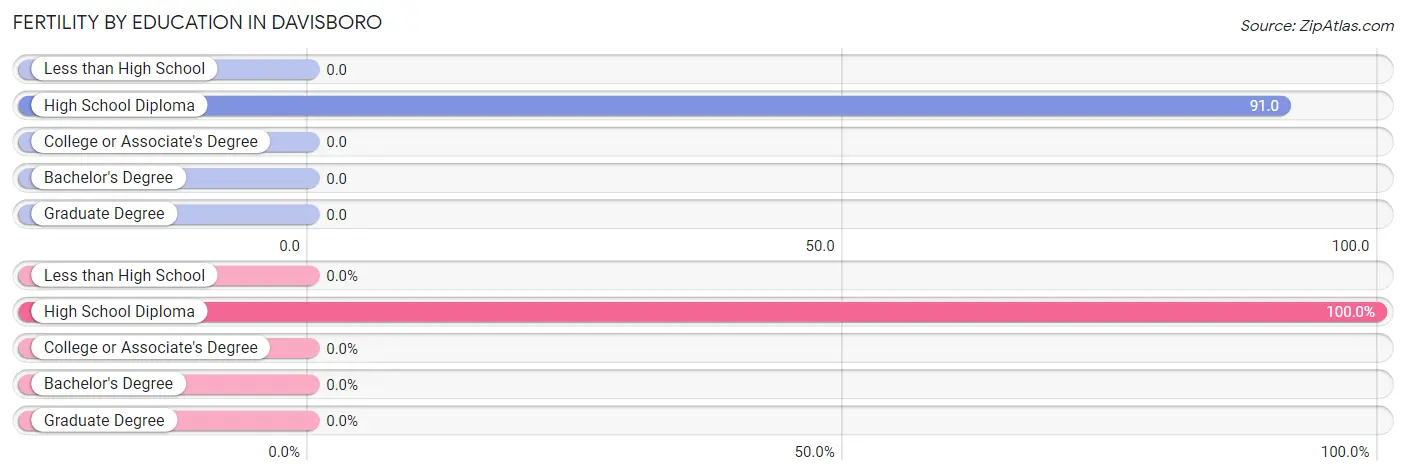
| Educational Attainment | Women with Births | Births / 1,000 Women |
| Less than High School | 0 (0.0%) | 0.0 |
| High School Diploma | 3 (100.0%) | 91.0 |
| College or Associate's Degree | 0 (0.0%) | 0.0 |
| Bachelor's Degree | 0 (0.0%) | 0.0 |
| Graduate Degree | 0 (0.0%) | 0.0 |
| Total | 3 (100.0%) | 19.0 |
Fertility by Education by Marriage Status in Davisboro
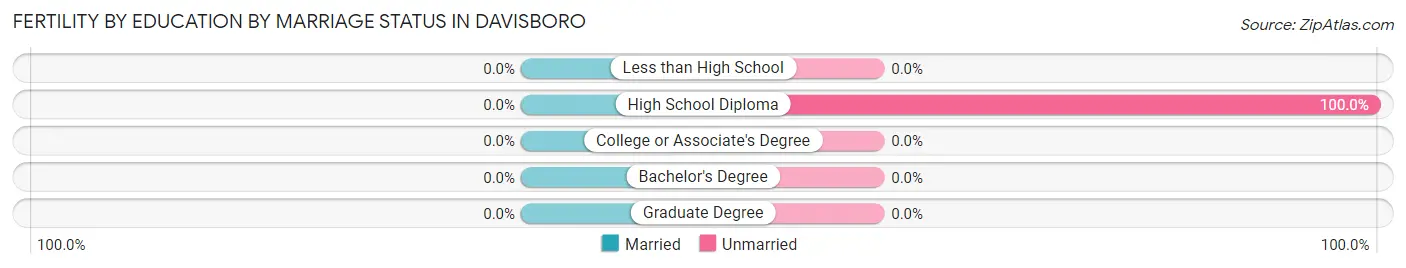
| Educational Attainment | Married | Unmarried |
| Less than High School | 0 (0.0%) | 0 (0.0%) |
| High School Diploma | 0 (0.0%) | 3 (100.0%) |
| College or Associate's Degree | 0 (0.0%) | 0 (0.0%) |
| Bachelor's Degree | 0 (0.0%) | 0 (0.0%) |
| Graduate Degree | 0 (0.0%) | 0 (0.0%) |
| Total | 0 (0.0%) | 3 (100.0%) |
Income in Davisboro
Income Overview in Davisboro
Per Capita Income in Davisboro is $7,697, while median incomes of families and households are $46,633 and $45,647 respectively.
| Characteristic | Number | Measure |
| Per Capita Income | 2,196 | $7,697 |
| Median Family Income | 162 | $46,633 |
| Mean Family Income | 162 | $58,905 |
| Median Household Income | 259 | $45,647 |
| Mean Household Income | 259 | $51,514 |
| Income Deficit | 162 | $0 |
| Wage / Income Gap (%) | 2,196 | 0.00% |
| Wage / Income Gap ($) | 2,196 | 100.00¢ per $1 |
| Gini / Inequality Index | 2,196 | 0.37 |
Earnings by Sex in Davisboro
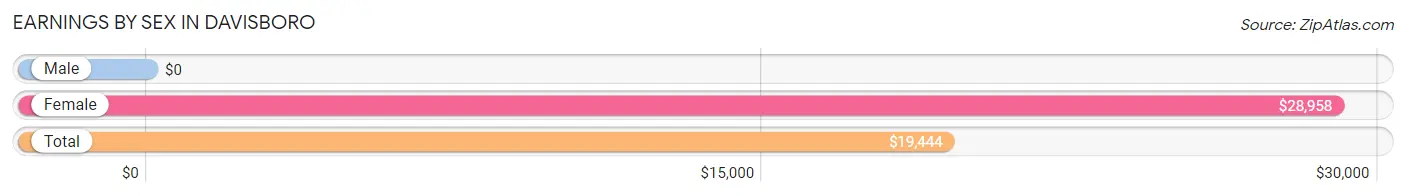
| Sex | Number | Average Earnings |
| Male | 242 (56.3%) | $0 |
| Female | 188 (43.7%) | $28,958 |
| Total | 430 (100.0%) | $19,444 |
Earnings by Sex by Income Bracket in Davisboro
The most common earnings brackets in Davisboro are $2,500 to $4,999 for men (54 | 22.3%) and $45,000 to $49,999 for women (49 | 26.1%).
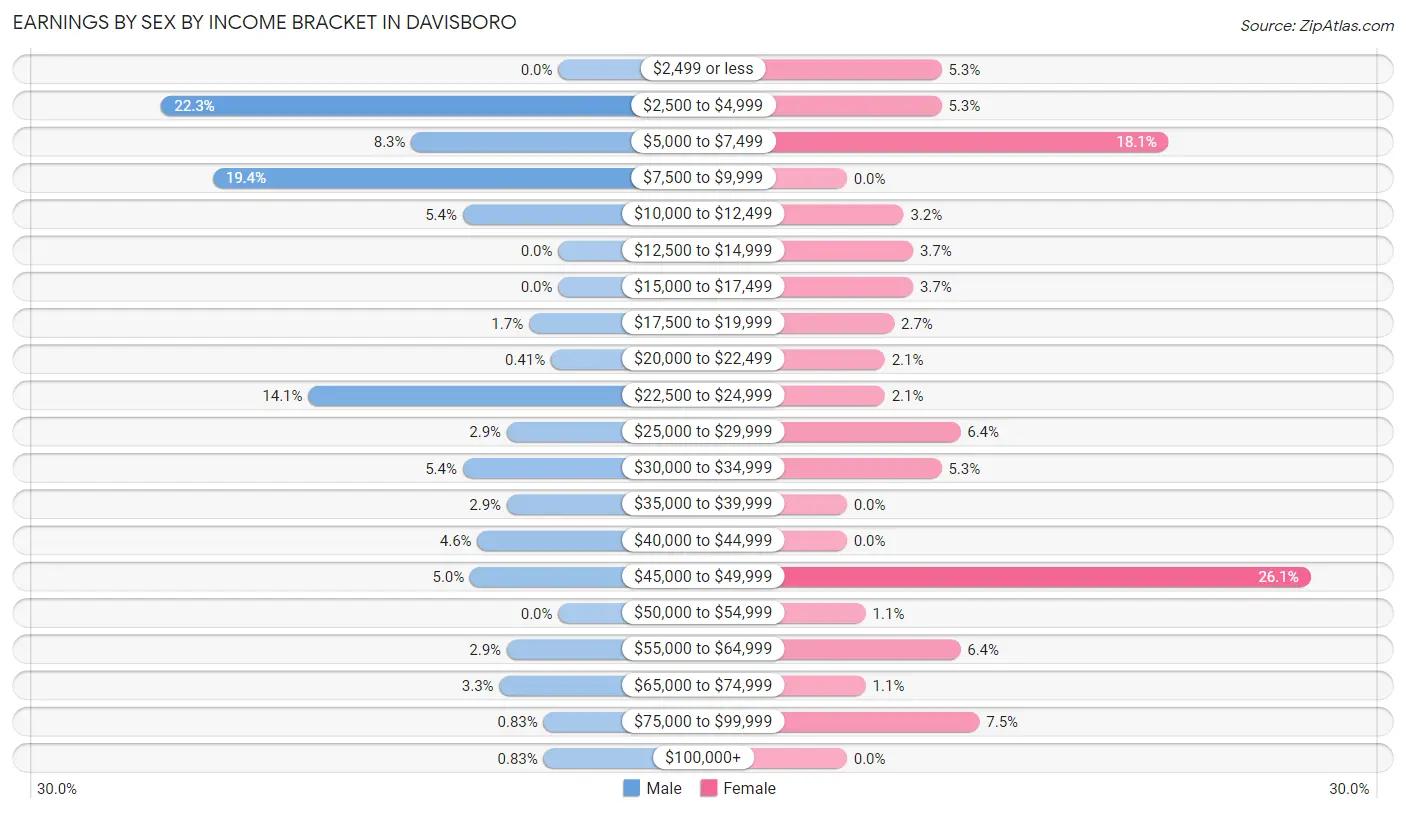
| Income | Male | Female |
| $2,499 or less | 0 (0.0%) | 10 (5.3%) |
| $2,500 to $4,999 | 54 (22.3%) | 10 (5.3%) |
| $5,000 to $7,499 | 20 (8.3%) | 34 (18.1%) |
| $7,500 to $9,999 | 47 (19.4%) | 0 (0.0%) |
| $10,000 to $12,499 | 13 (5.4%) | 6 (3.2%) |
| $12,500 to $14,999 | 0 (0.0%) | 7 (3.7%) |
| $15,000 to $17,499 | 0 (0.0%) | 7 (3.7%) |
| $17,500 to $19,999 | 4 (1.7%) | 5 (2.7%) |
| $20,000 to $22,499 | 1 (0.4%) | 4 (2.1%) |
| $22,500 to $24,999 | 34 (14.1%) | 4 (2.1%) |
| $25,000 to $29,999 | 7 (2.9%) | 12 (6.4%) |
| $30,000 to $34,999 | 13 (5.4%) | 10 (5.3%) |
| $35,000 to $39,999 | 7 (2.9%) | 0 (0.0%) |
| $40,000 to $44,999 | 11 (4.5%) | 0 (0.0%) |
| $45,000 to $49,999 | 12 (5.0%) | 49 (26.1%) |
| $50,000 to $54,999 | 0 (0.0%) | 2 (1.1%) |
| $55,000 to $64,999 | 7 (2.9%) | 12 (6.4%) |
| $65,000 to $74,999 | 8 (3.3%) | 2 (1.1%) |
| $75,000 to $99,999 | 2 (0.8%) | 14 (7.4%) |
| $100,000+ | 2 (0.8%) | 0 (0.0%) |
| Total | 242 (100.0%) | 188 (100.0%) |
Earnings by Sex by Educational Attainment in Davisboro
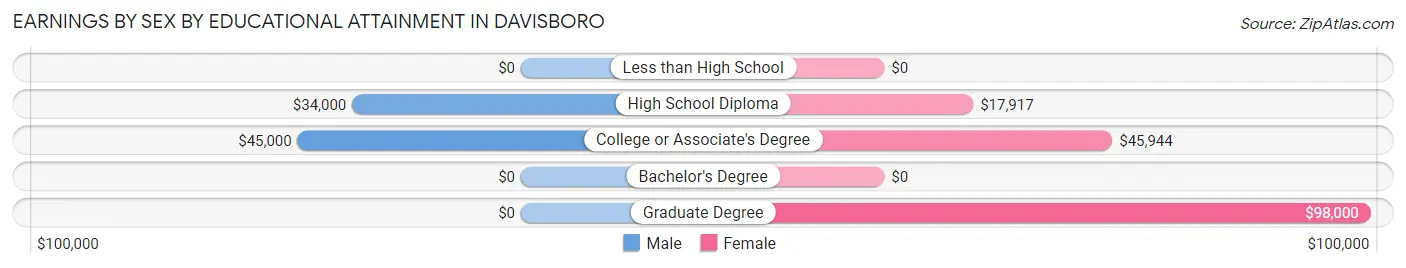
| Educational Attainment | Male Income | Female Income |
| Less than High School | - | - |
| High School Diploma | $34,000 | $17,917 |
| College or Associate's Degree | $45,000 | $45,944 |
| Bachelor's Degree | - | - |
| Graduate Degree | - | - |
| Total | - | - |
Family Income in Davisboro
Family Income Brackets in Davisboro
According to the Davisboro family income data, there are 61 families falling into the $35,000 to $49,999 income range, which is the most common income bracket and makes up 37.7% of all families.
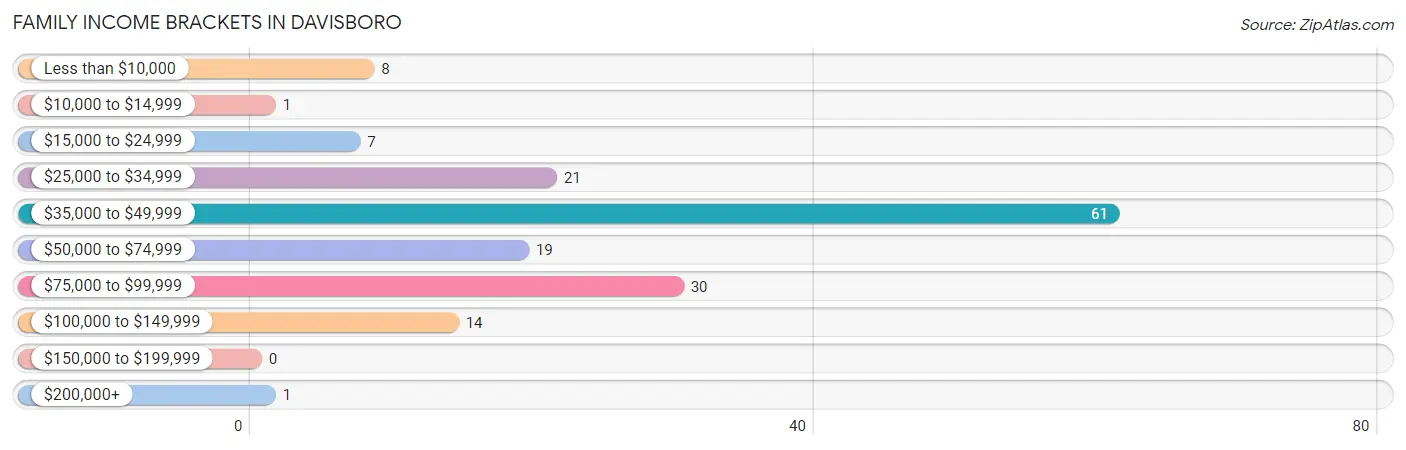
| Income Bracket | # Families | % Families |
| Less than $10,000 | 8 | 4.9% |
| $10,000 to $14,999 | 1 | 0.6% |
| $15,000 to $24,999 | 7 | 4.3% |
| $25,000 to $34,999 | 21 | 13.0% |
| $35,000 to $49,999 | 61 | 37.7% |
| $50,000 to $74,999 | 19 | 11.7% |
| $75,000 to $99,999 | 30 | 18.5% |
| $100,000 to $149,999 | 14 | 8.6% |
| $150,000 to $199,999 | 0 | 0.0% |
| $200,000+ | 1 | 0.6% |
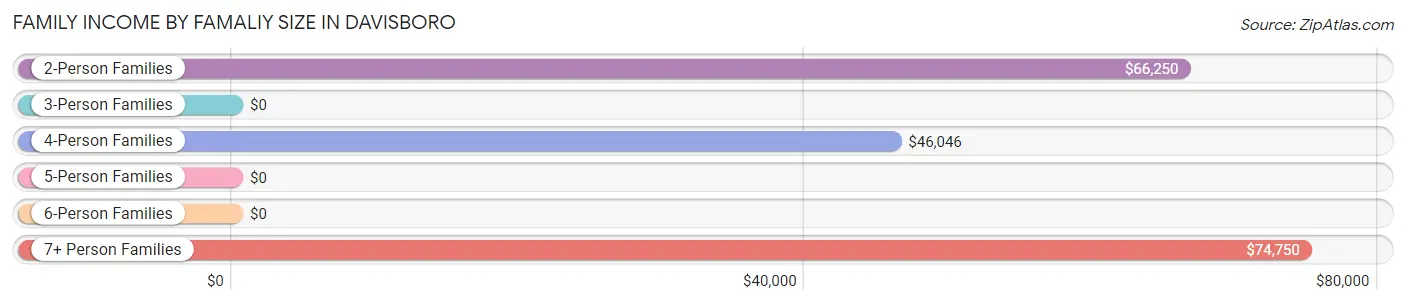
Family Income by Famaliy Size in Davisboro
7+ person families (9 | 5.6%) account for the highest median family income in Davisboro with $74,750 per family, while 2-person families (55 | 34.0%) have the highest median income of $33,125 per family member.
| Income Bracket | # Families | Median Income |
| 2-Person Families | 55 (34.0%) | $66,250 |
| 3-Person Families | 17 (10.5%) | $0 |
| 4-Person Families | 77 (47.5%) | $46,046 |
| 5-Person Families | 2 (1.2%) | $0 |
| 6-Person Families | 2 (1.2%) | $0 |
| 7+ Person Families | 9 (5.6%) | $74,750 |
| Total | 162 (100.0%) | $46,633 |
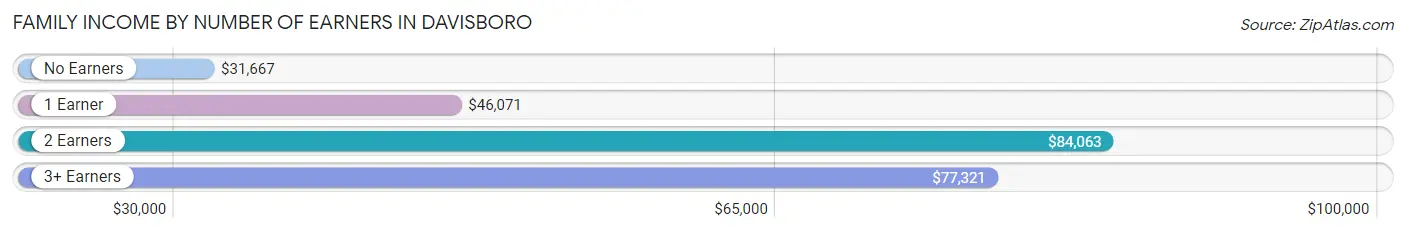
Family Income by Number of Earners in Davisboro
The median family income in Davisboro is $46,633, with families comprising 2 earners (17) having the highest median family income of $84,063, while families with no earners (18) have the lowest median family income of $31,667, accounting for 10.5% and 11.1% of families, respectively.
| Number of Earners | # Families | Median Income |
| No Earners | 18 (11.1%) | $31,667 |
| 1 Earner | 114 (70.4%) | $46,071 |
| 2 Earners | 17 (10.5%) | $84,063 |
| 3+ Earners | 13 (8.0%) | $77,321 |
| Total | 162 (100.0%) | $46,633 |
Household Income in Davisboro
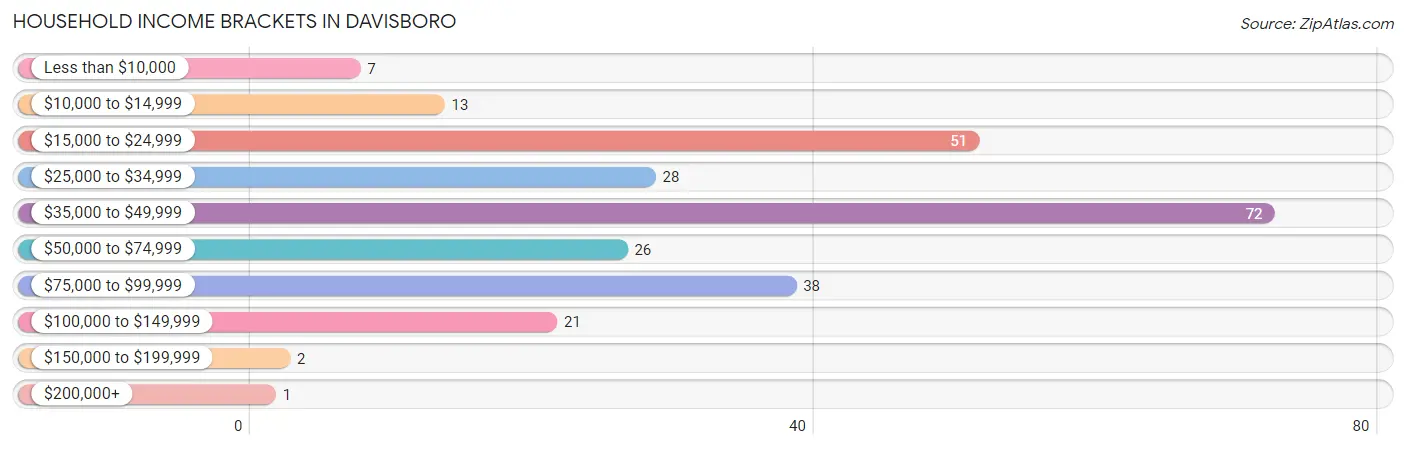
Household Income Brackets in Davisboro
With 72 households falling in the category, the $35,000 to $49,999 income range is the most frequent in Davisboro, accounting for 27.8% of all households. In contrast, only 1 households (0.4%) fall into the $200,000+ income bracket, making it the least populous group.
| Income Bracket | # Households | % Households |
| Less than $10,000 | 7 | 2.7% |
| $10,000 to $14,999 | 13 | 5.0% |
| $15,000 to $24,999 | 51 | 19.7% |
| $25,000 to $34,999 | 28 | 10.8% |
| $35,000 to $49,999 | 72 | 27.8% |
| $50,000 to $74,999 | 26 | 10.0% |
| $75,000 to $99,999 | 38 | 14.7% |
| $100,000 to $149,999 | 21 | 8.1% |
| $150,000 to $199,999 | 2 | 0.8% |
| $200,000+ | 1 | 0.4% |
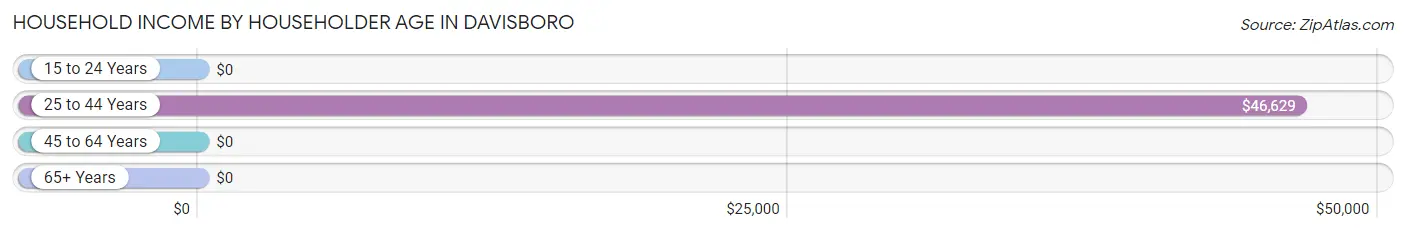
Household Income by Householder Age in Davisboro
The median household income in Davisboro is $45,647, with the highest median household income of $46,629 found in the 25 to 44 years age bracket for the primary householder. A total of 93 households (35.9%) fall into this category. Meanwhile, the 15 to 24 years age bracket for the primary householder has the lowest median household income of $0, with 10 households (3.9%) in this group.
| Income Bracket | # Households | Median Income |
| 15 to 24 Years | 10 (3.9%) | $0 |
| 25 to 44 Years | 93 (35.9%) | $46,629 |
| 45 to 64 Years | 68 (26.3%) | $0 |
| 65+ Years | 88 (34.0%) | $0 |
| Total | 259 (100.0%) | $45,647 |
Poverty in Davisboro
Income Below Poverty by Sex and Age in Davisboro
With 18.0% poverty level for males and 13.5% for females among the residents of Davisboro, 55 to 64 year old males and 6 to 11 year old females are the most vulnerable to poverty, with 15 males (45.5%) and 32 females (65.3%) in their respective age groups living below the poverty level.
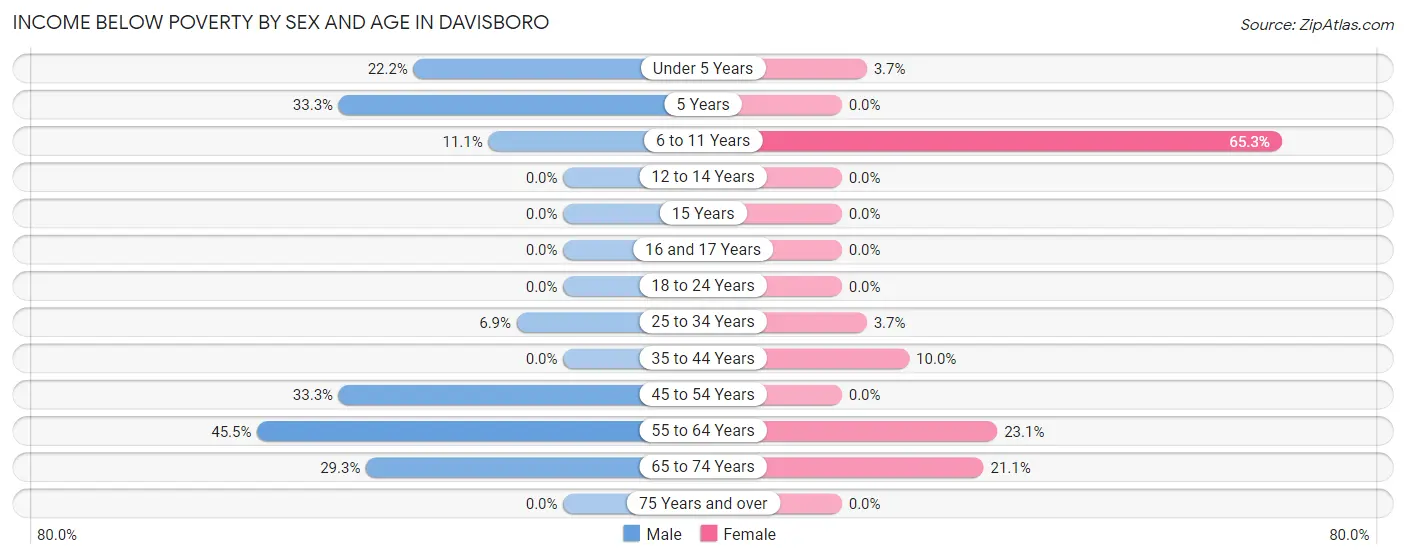
| Age Bracket | Male | Female |
| Under 5 Years | 4 (22.2%) | 4 (3.7%) |
| 5 Years | 4 (33.3%) | 0 (0.0%) |
| 6 to 11 Years | 8 (11.1%) | 32 (65.3%) |
| 12 to 14 Years | 0 (0.0%) | 0 (0.0%) |
| 15 Years | 0 (0.0%) | 0 (0.0%) |
| 16 and 17 Years | 0 (0.0%) | 0 (0.0%) |
| 18 to 24 Years | 0 (0.0%) | 0 (0.0%) |
| 25 to 34 Years | 4 (6.9%) | 1 (3.7%) |
| 35 to 44 Years | 0 (0.0%) | 8 (10.0%) |
| 45 to 54 Years | 4 (33.3%) | 0 (0.0%) |
| 55 to 64 Years | 15 (45.5%) | 12 (23.1%) |
| 65 to 74 Years | 12 (29.3%) | 4 (21.0%) |
| 75 Years and over | 0 (0.0%) | 0 (0.0%) |
| Total | 51 (18.0%) | 61 (13.5%) |
Income Above Poverty by Sex and Age in Davisboro
According to the poverty statistics in Davisboro, males aged 12 to 14 years and females aged 12 to 14 years are the age groups that are most secure financially, with 100.0% of males and 100.0% of females in these age groups living above the poverty line.
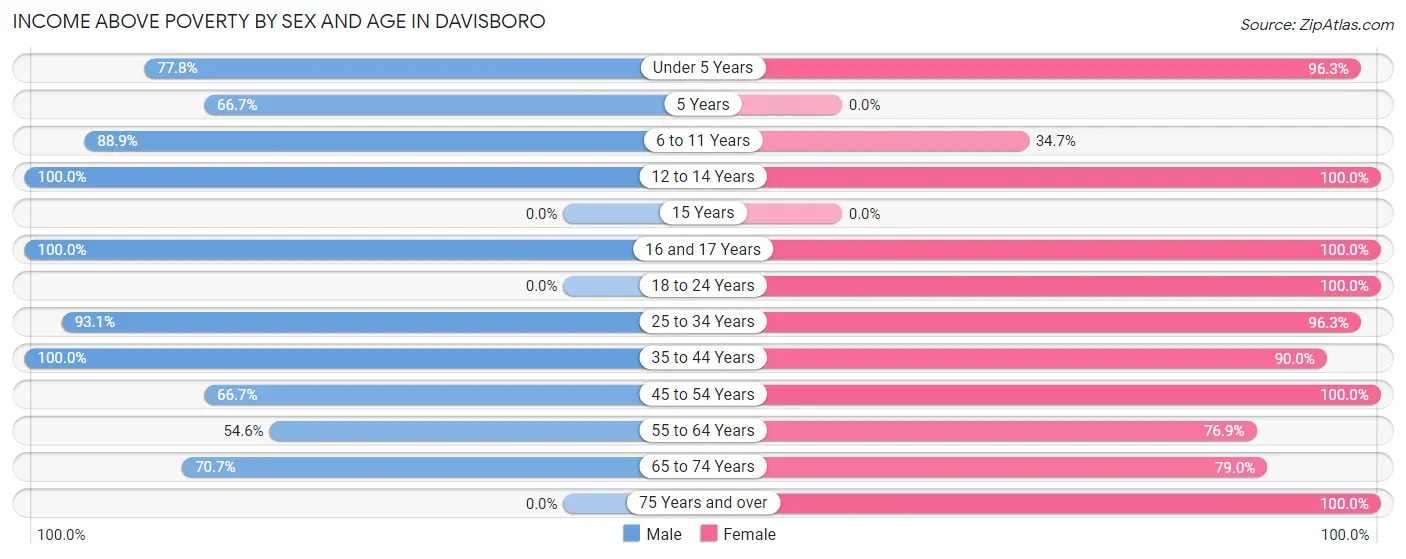
| Age Bracket | Male | Female |
| Under 5 Years | 14 (77.8%) | 104 (96.3%) |
| 5 Years | 8 (66.7%) | 0 (0.0%) |
| 6 to 11 Years | 64 (88.9%) | 17 (34.7%) |
| 12 to 14 Years | 13 (100.0%) | 4 (100.0%) |
| 15 Years | 0 (0.0%) | 0 (0.0%) |
| 16 and 17 Years | 1 (100.0%) | 2 (100.0%) |
| 18 to 24 Years | 0 (0.0%) | 33 (100.0%) |
| 25 to 34 Years | 54 (93.1%) | 26 (96.3%) |
| 35 to 44 Years | 23 (100.0%) | 72 (90.0%) |
| 45 to 54 Years | 8 (66.7%) | 28 (100.0%) |
| 55 to 64 Years | 18 (54.5%) | 40 (76.9%) |
| 65 to 74 Years | 29 (70.7%) | 15 (78.9%) |
| 75 Years and over | 0 (0.0%) | 50 (100.0%) |
| Total | 232 (82.0%) | 391 (86.5%) |
Income Below Poverty Among Married-Couple Families in Davisboro
The poverty statistics for married-couple families in Davisboro show that 12.5% or 7 of the total 56 families live below the poverty line. Families with no children have the highest poverty rate of 31.8%, comprising of 7 families. On the other hand, families with 1 or 2 children have the lowest poverty rate of 0.0%, which includes 0 families.
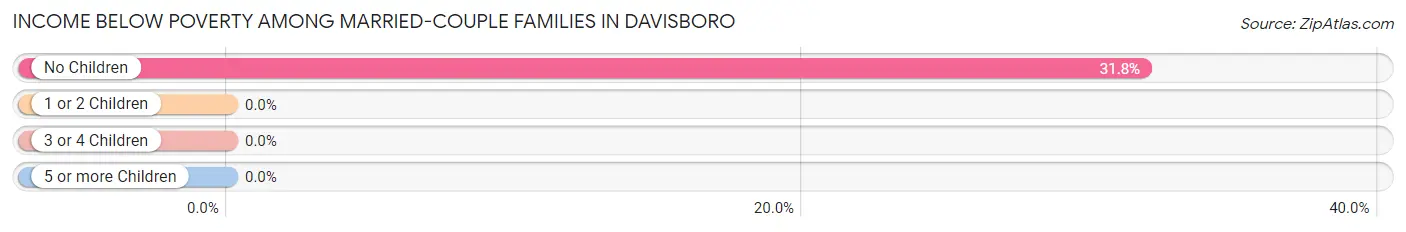
| Children | Above Poverty | Below Poverty |
| No Children | 15 (68.2%) | 7 (31.8%) |
| 1 or 2 Children | 29 (100.0%) | 0 (0.0%) |
| 3 or 4 Children | 0 (0.0%) | 0 (0.0%) |
| 5 or more Children | 5 (100.0%) | 0 (0.0%) |
| Total | 49 (87.5%) | 7 (12.5%) |
Income Below Poverty Among Single-Parent Households in Davisboro
According to the poverty data in Davisboro, 53.3% or 8 single-father households and 1.1% or 1 single-mother households are living below the poverty line. Among single-father households, those with 1 or 2 children have the highest poverty rate, with 4 households (66.7%) experiencing poverty. Likewise, among single-mother households, those with 3 or 4 children have the highest poverty rate, with 1 households (2.0%) falling below the poverty line.
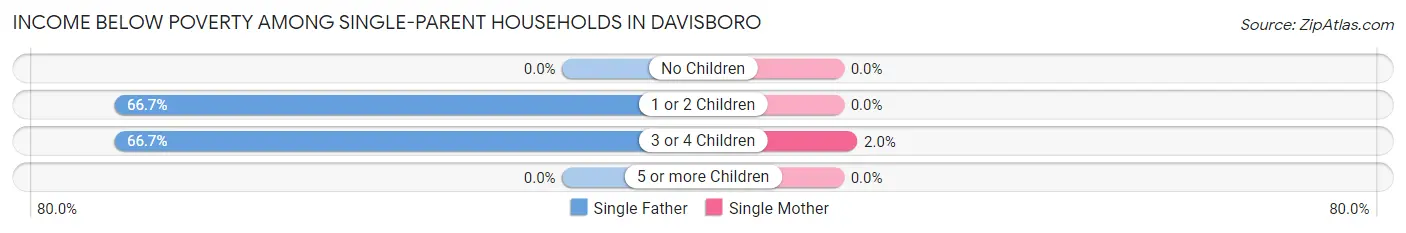
| Children | Single Father | Single Mother |
| No Children | 0 (0.0%) | 0 (0.0%) |
| 1 or 2 Children | 4 (66.7%) | 0 (0.0%) |
| 3 or 4 Children | 4 (66.7%) | 1 (2.0%) |
| 5 or more Children | 0 (0.0%) | 0 (0.0%) |
| Total | 8 (53.3%) | 1 (1.1%) |
Income Below Poverty Among Married-Couple vs Single-Parent Households in Davisboro
The poverty data for Davisboro shows that 7 of the married-couple family households (12.5%) and 9 of the single-parent households (8.5%) are living below the poverty level. Within the married-couple family households, those with no children have the highest poverty rate, with 7 households (31.8%) falling below the poverty line. Among the single-parent households, those with 1 or 2 children have the highest poverty rate, with 4 household (23.5%) living below poverty.
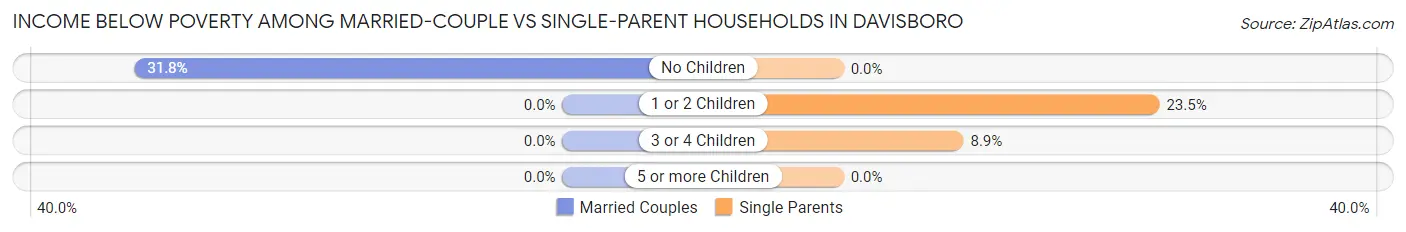
| Children | Married-Couple Families | Single-Parent Households |
| No Children | 7 (31.8%) | 0 (0.0%) |
| 1 or 2 Children | 0 (0.0%) | 4 (23.5%) |
| 3 or 4 Children | 0 (0.0%) | 5 (8.9%) |
| 5 or more Children | 0 (0.0%) | 0 (0.0%) |
| Total | 7 (12.5%) | 9 (8.5%) |
Employment Characteristics in Davisboro
Employment by Class of Employer in Davisboro
Among the 277 employed individuals in Davisboro, private company employees (184 | 66.4%), self-employed (not incorporated) (37 | 13.4%), and state government employees (22 | 7.9%) make up the most common classes of employment.
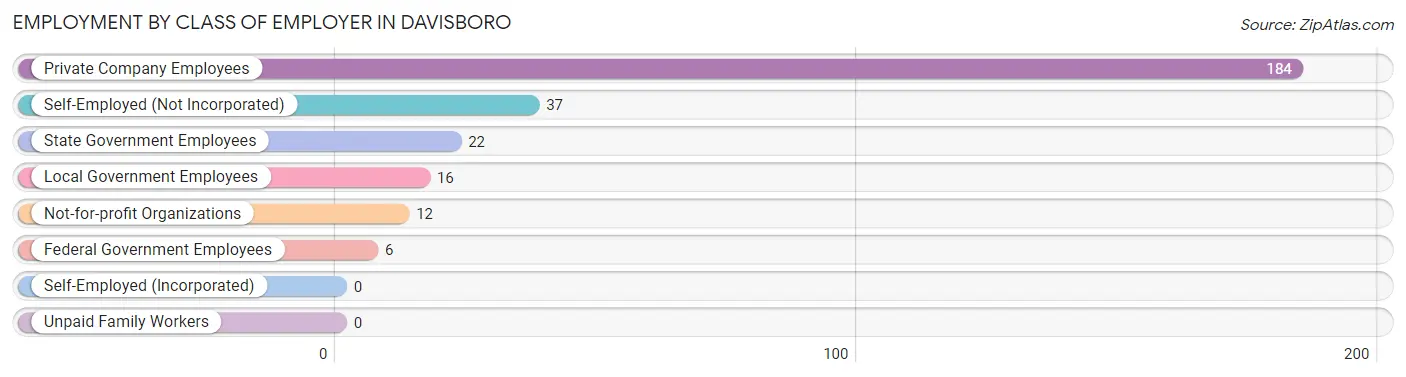
| Employer Class | # Employees | % Employees |
| Private Company Employees | 184 | 66.4% |
| Self-Employed (Incorporated) | 0 | 0.0% |
| Self-Employed (Not Incorporated) | 37 | 13.4% |
| Not-for-profit Organizations | 12 | 4.3% |
| Local Government Employees | 16 | 5.8% |
| State Government Employees | 22 | 7.9% |
| Federal Government Employees | 6 | 2.2% |
| Unpaid Family Workers | 0 | 0.0% |
| Total | 277 | 100.0% |
Employment Status by Age in Davisboro
According to the labor force statistics for Davisboro, out of the total population over 16 years of age (1,920), 15.3% or 294 individuals are in the labor force, with 4.4% or 13 of them unemployed. The age group with the highest labor force participation rate is 16 to 19 years, with 42.1% or 8 individuals in the labor force. Within the labor force, the 20 to 24 years age range has the highest percentage of unemployed individuals, with 60.0% or 3 of them being unemployed.
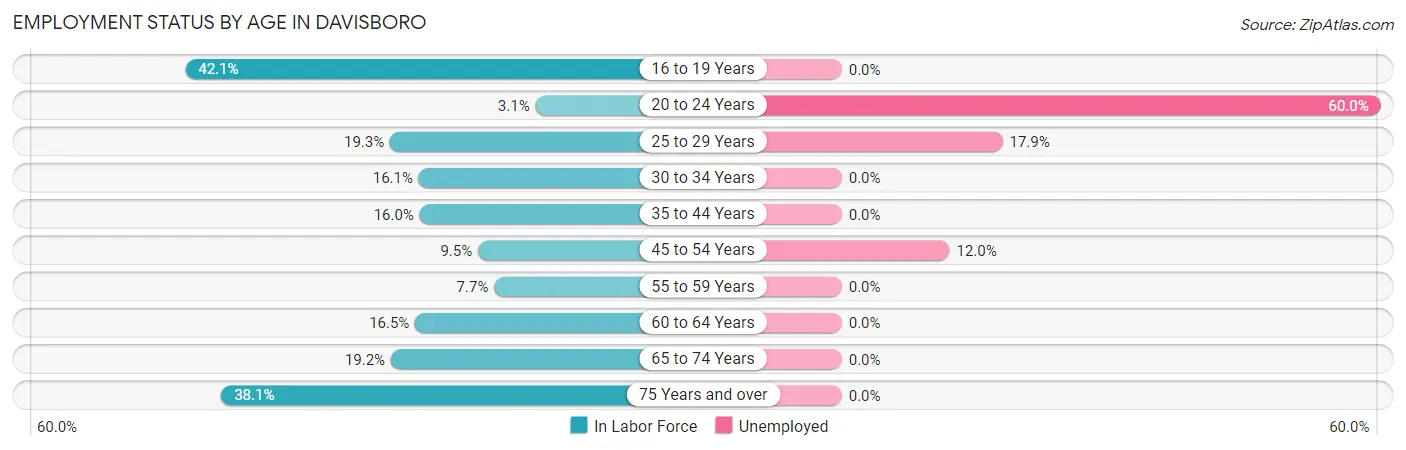
| Age Bracket | In Labor Force | Unemployed |
| 16 to 19 Years | 8 (42.1%) | 0 (0.0%) |
| 20 to 24 Years | 5 (3.1%) | 3 (60.0%) |
| 25 to 29 Years | 39 (19.3%) | 7 (17.9%) |
| 30 to 34 Years | 42 (16.1%) | 0 (0.0%) |
| 35 to 44 Years | 94 (16.0%) | 0 (0.0%) |
| 45 to 54 Years | 25 (9.5%) | 3 (12.0%) |
| 55 to 59 Years | 10 (7.7%) | 0 (0.0%) |
| 60 to 64 Years | 18 (16.5%) | 0 (0.0%) |
| 65 to 74 Years | 20 (19.2%) | 0 (0.0%) |
| 75 Years and over | 32 (38.1%) | 0 (0.0%) |
| Total | 294 (15.3%) | 13 (4.4%) |
Employment Status by Educational Attainment in Davisboro
According to labor force statistics for Davisboro, 14.7% of individuals (228) out of the total population between 25 and 64 years of age (1,552) are in the labor force, with 4.4% or 10 of them being unemployed. The group with the highest labor force participation rate are those with the educational attainment of bachelor's degree or higher, with 29.6% or 16 individuals in the labor force. Within the labor force, individuals with high school diploma education have the highest percentage of unemployment, with 11.5% or 7 of them being unemployed.
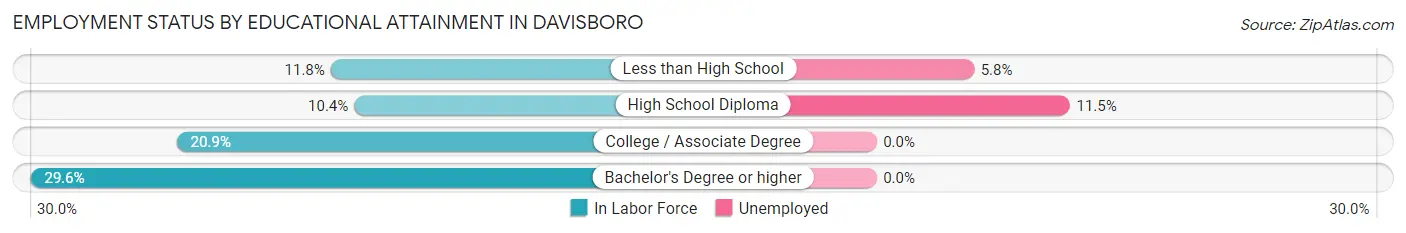
| Educational Attainment | In Labor Force | Unemployed |
| Less than High School | 52 (11.8%) | 25 (5.8%) |
| High School Diploma | 61 (10.4%) | 67 (11.5%) |
| College / Associate Degree | 99 (20.9%) | 0 (0.0%) |
| Bachelor's Degree or higher | 16 (29.6%) | 0 (0.0%) |
| Total | 228 (14.7%) | 68 (4.4%) |
Employment Occupations by Sex in Davisboro
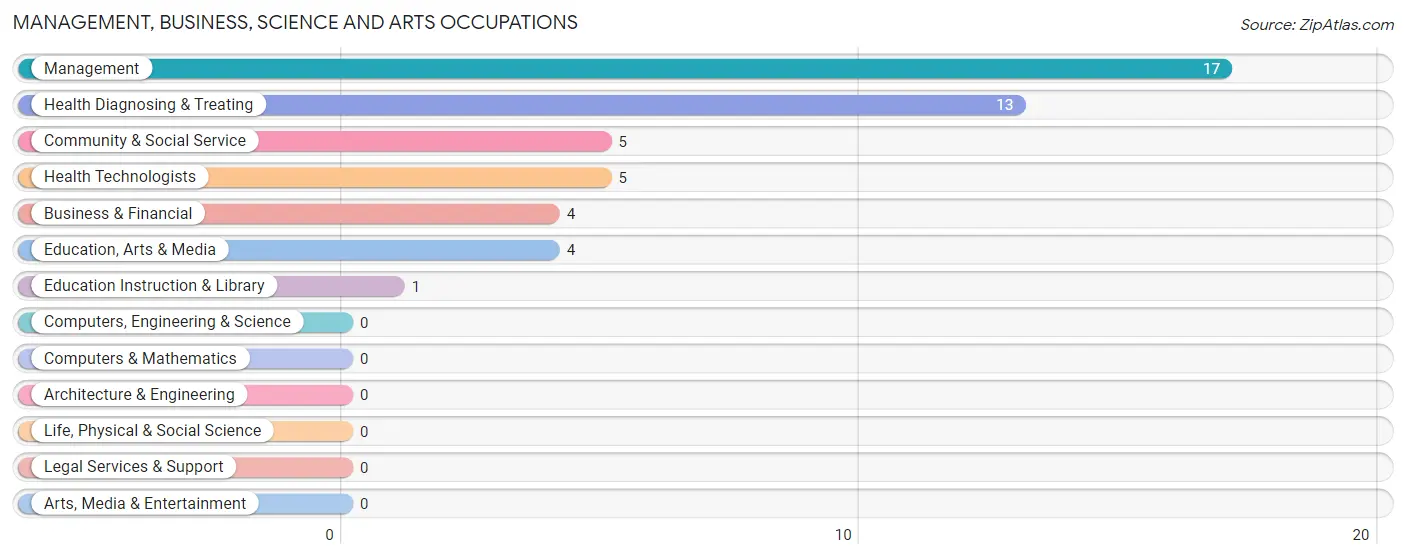
Management, Business, Science and Arts Occupations
The most common Management, Business, Science and Arts occupations in Davisboro are Management (17 | 6.1%), Health Diagnosing & Treating (13 | 4.6%), Community & Social Service (5 | 1.8%), Health Technologists (5 | 1.8%), and Business & Financial (4 | 1.4%).
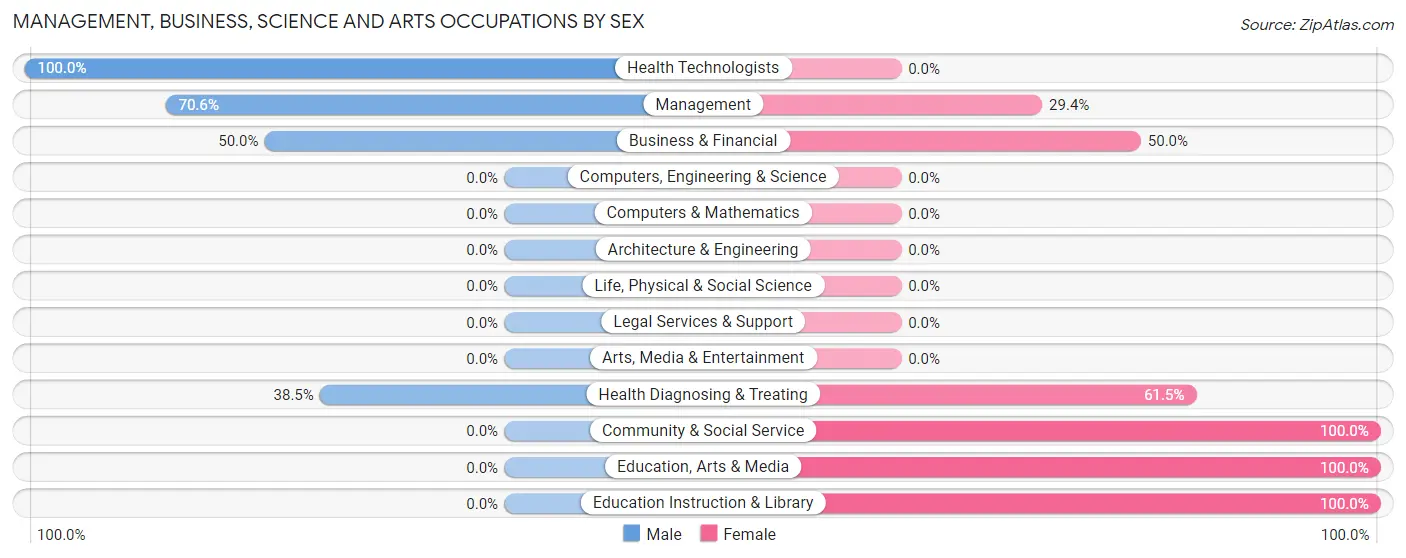
Management, Business, Science and Arts Occupations by Sex
Within the Management, Business, Science and Arts occupations in Davisboro, the most male-oriented occupations are Health Technologists (100.0%), Management (70.6%), and Business & Financial (50.0%), while the most female-oriented occupations are Community & Social Service (100.0%), Education, Arts & Media (100.0%), and Education Instruction & Library (100.0%).
| Occupation | Male | Female |
| Management | 12 (70.6%) | 5 (29.4%) |
| Business & Financial | 2 (50.0%) | 2 (50.0%) |
| Computers, Engineering & Science | 0 (0.0%) | 0 (0.0%) |
| Computers & Mathematics | 0 (0.0%) | 0 (0.0%) |
| Architecture & Engineering | 0 (0.0%) | 0 (0.0%) |
| Life, Physical & Social Science | 0 (0.0%) | 0 (0.0%) |
| Community & Social Service | 0 (0.0%) | 5 (100.0%) |
| Education, Arts & Media | 0 (0.0%) | 4 (100.0%) |
| Legal Services & Support | 0 (0.0%) | 0 (0.0%) |
| Education Instruction & Library | 0 (0.0%) | 1 (100.0%) |
| Arts, Media & Entertainment | 0 (0.0%) | 0 (0.0%) |
| Health Diagnosing & Treating | 5 (38.5%) | 8 (61.5%) |
| Health Technologists | 5 (100.0%) | 0 (0.0%) |
| Total (Category) | 19 (48.7%) | 20 (51.3%) |
| Total (Overall) | 105 (37.5%) | 175 (62.5%) |
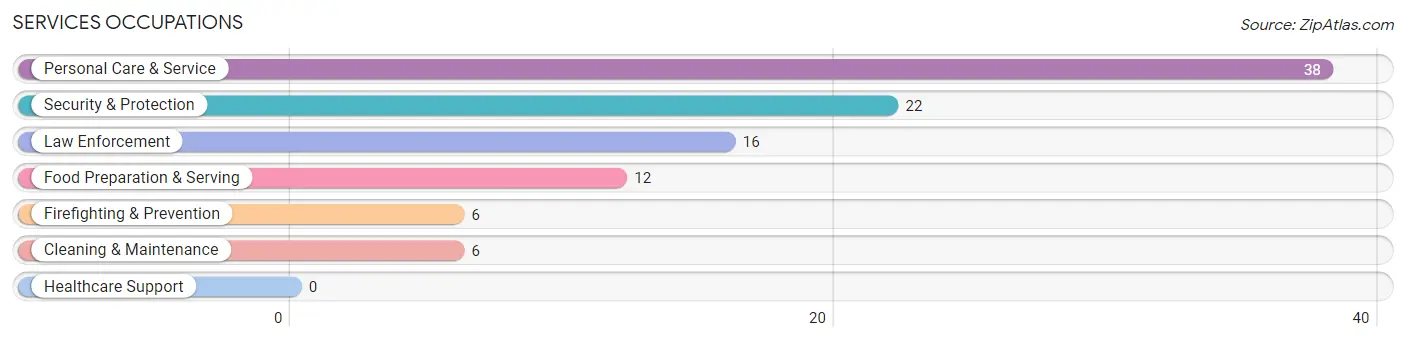
Services Occupations
The most common Services occupations in Davisboro are Personal Care & Service (38 | 13.6%), Security & Protection (22 | 7.9%), Law Enforcement (16 | 5.7%), Food Preparation & Serving (12 | 4.3%), and Firefighting & Prevention (6 | 2.1%).
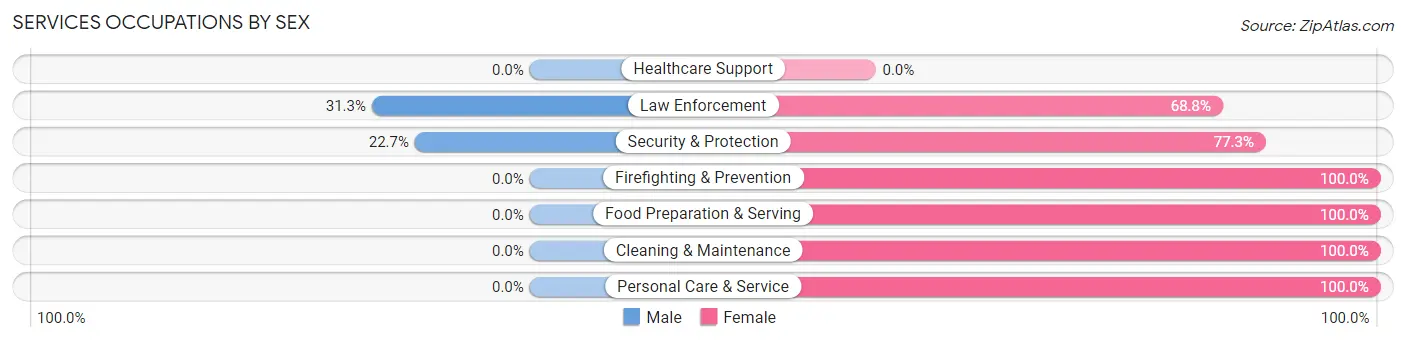
Services Occupations by Sex
Within the Services occupations in Davisboro, the most male-oriented occupations are Law Enforcement (31.2%), and Security & Protection (22.7%), while the most female-oriented occupations are Firefighting & Prevention (100.0%), Food Preparation & Serving (100.0%), and Cleaning & Maintenance (100.0%).
| Occupation | Male | Female |
| Healthcare Support | 0 (0.0%) | 0 (0.0%) |
| Security & Protection | 5 (22.7%) | 17 (77.3%) |
| Firefighting & Prevention | 0 (0.0%) | 6 (100.0%) |
| Law Enforcement | 5 (31.2%) | 11 (68.8%) |
| Food Preparation & Serving | 0 (0.0%) | 12 (100.0%) |
| Cleaning & Maintenance | 0 (0.0%) | 6 (100.0%) |
| Personal Care & Service | 0 (0.0%) | 38 (100.0%) |
| Total (Category) | 5 (6.4%) | 73 (93.6%) |
| Total (Overall) | 105 (37.5%) | 175 (62.5%) |
Sales and Office Occupations
The most common Sales and Office occupations in Davisboro are Office & Administration (17 | 6.1%), and Sales & Related (12 | 4.3%).
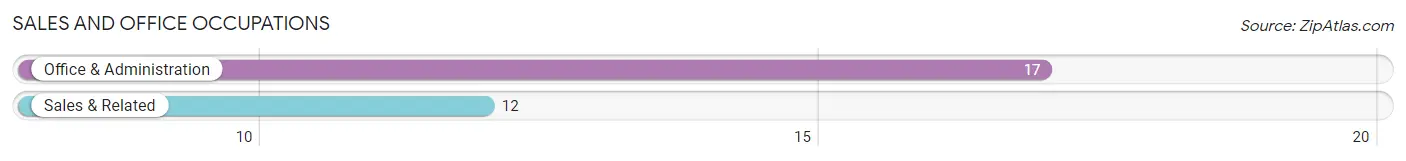
Sales and Office Occupations by Sex
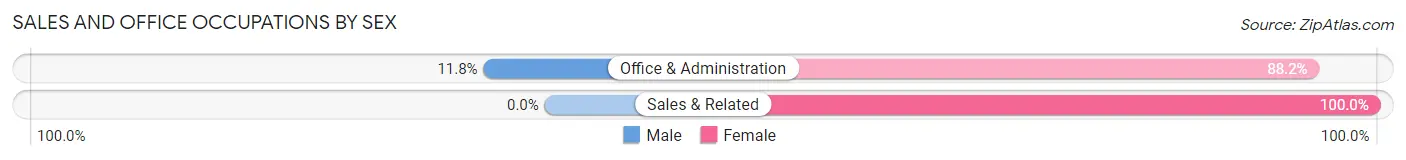
| Occupation | Male | Female |
| Sales & Related | 0 (0.0%) | 12 (100.0%) |
| Office & Administration | 2 (11.8%) | 15 (88.2%) |
| Total (Category) | 2 (6.9%) | 27 (93.1%) |
| Total (Overall) | 105 (37.5%) | 175 (62.5%) |
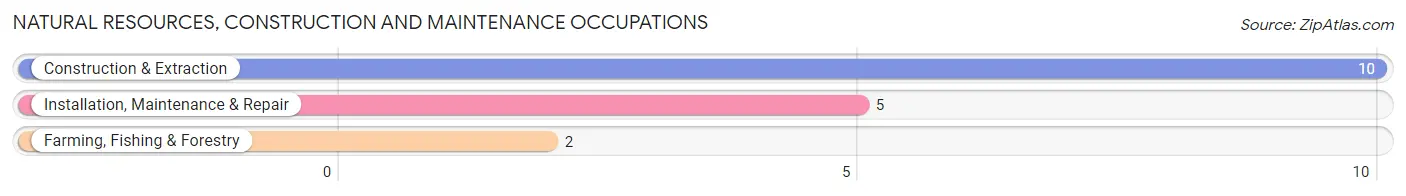
Natural Resources, Construction and Maintenance Occupations
The most common Natural Resources, Construction and Maintenance occupations in Davisboro are Construction & Extraction (10 | 3.6%), Installation, Maintenance & Repair (5 | 1.8%), and Farming, Fishing & Forestry (2 | 0.7%).
Natural Resources, Construction and Maintenance Occupations by Sex
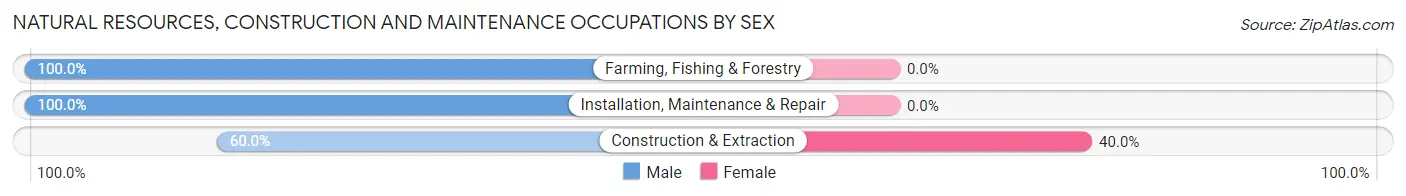
| Occupation | Male | Female |
| Farming, Fishing & Forestry | 2 (100.0%) | 0 (0.0%) |
| Construction & Extraction | 6 (60.0%) | 4 (40.0%) |
| Installation, Maintenance & Repair | 5 (100.0%) | 0 (0.0%) |
| Total (Category) | 13 (76.5%) | 4 (23.5%) |
| Total (Overall) | 105 (37.5%) | 175 (62.5%) |
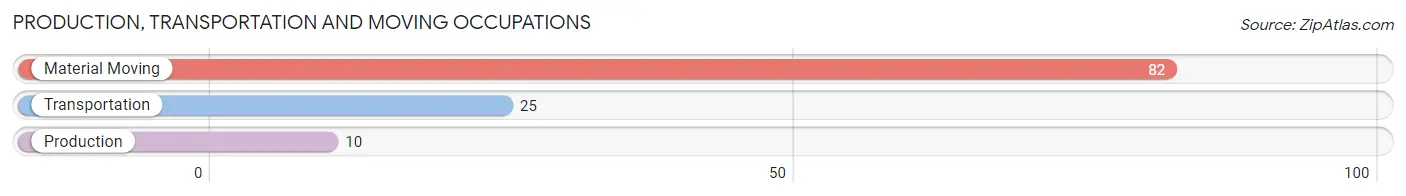
Production, Transportation and Moving Occupations
The most common Production, Transportation and Moving occupations in Davisboro are Material Moving (82 | 29.3%), Transportation (25 | 8.9%), and Production (10 | 3.6%).
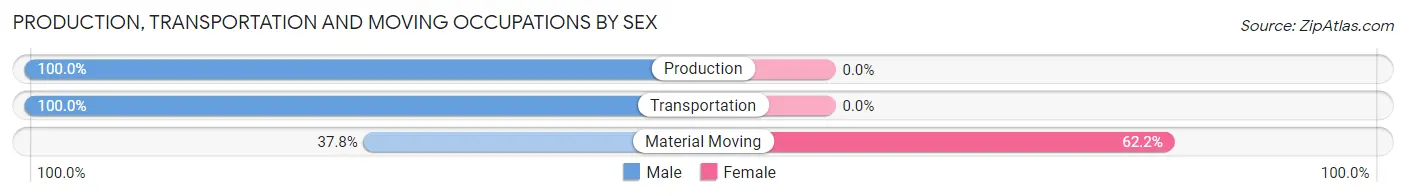
Production, Transportation and Moving Occupations by Sex
| Occupation | Male | Female |
| Production | 10 (100.0%) | 0 (0.0%) |
| Transportation | 25 (100.0%) | 0 (0.0%) |
| Material Moving | 31 (37.8%) | 51 (62.2%) |
| Total (Category) | 66 (56.4%) | 51 (43.6%) |
| Total (Overall) | 105 (37.5%) | 175 (62.5%) |
Employment Industries by Sex in Davisboro
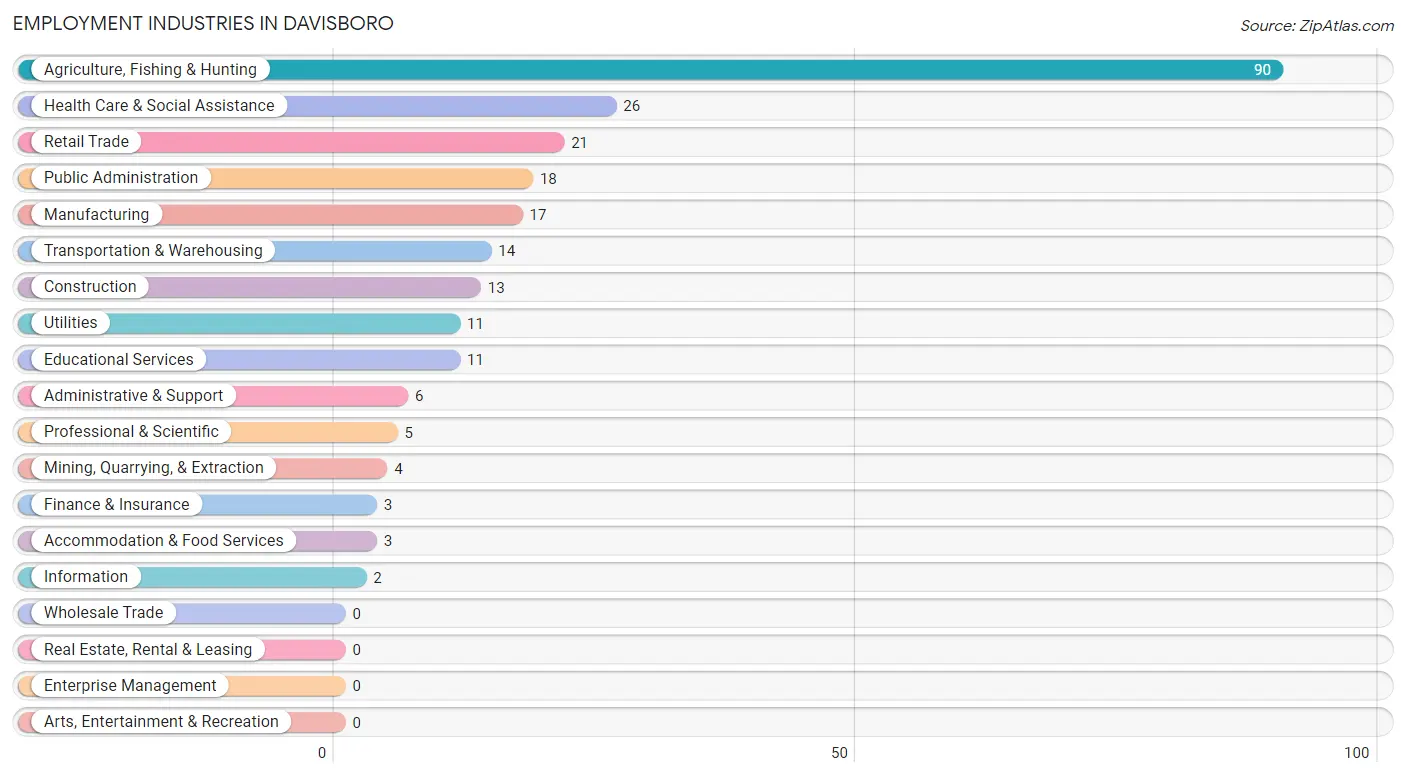
Employment Industries in Davisboro
The major employment industries in Davisboro include Agriculture, Fishing & Hunting (90 | 32.1%), Health Care & Social Assistance (26 | 9.3%), Retail Trade (21 | 7.5%), Public Administration (18 | 6.4%), and Manufacturing (17 | 6.1%).
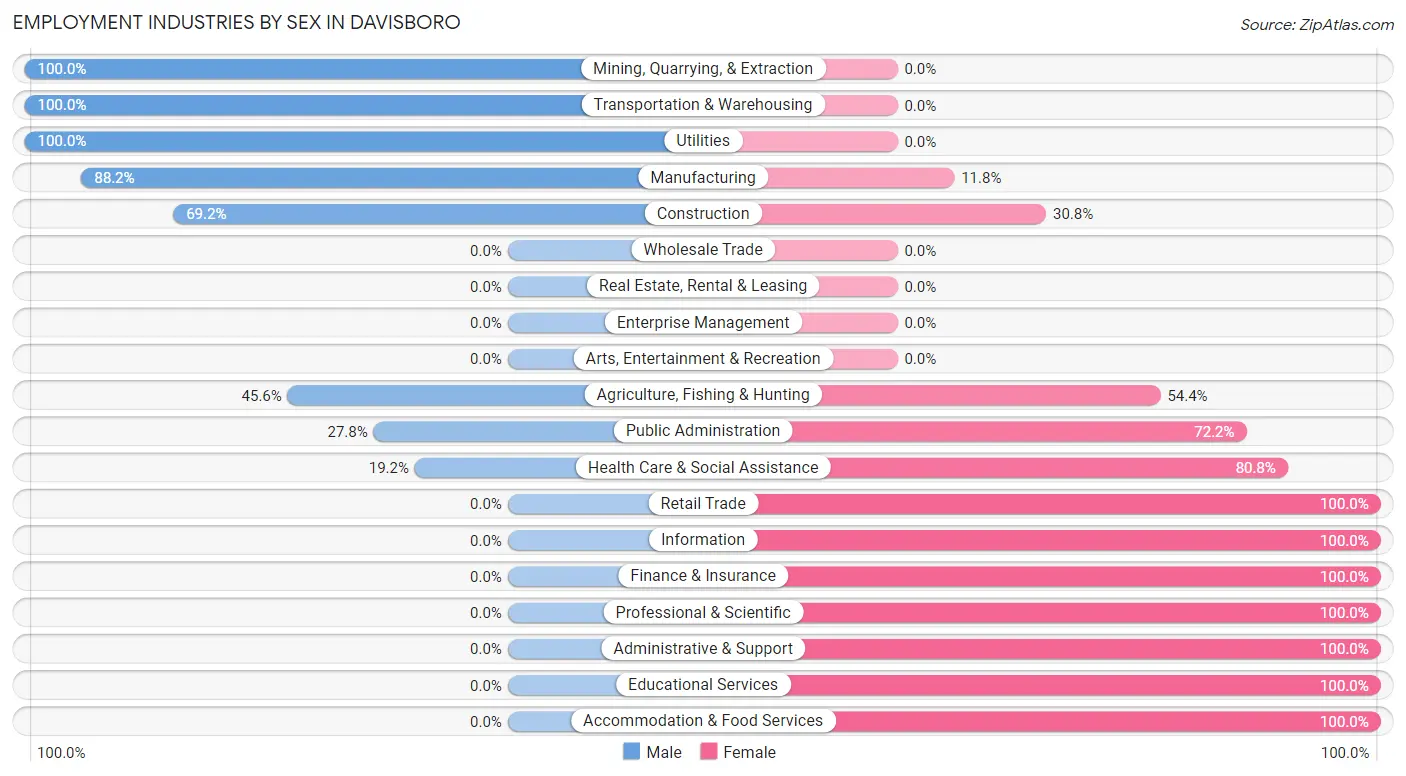
Employment Industries by Sex in Davisboro
The Davisboro industries that see more men than women are Mining, Quarrying, & Extraction (100.0%), Transportation & Warehousing (100.0%), and Utilities (100.0%), whereas the industries that tend to have a higher number of women are Retail Trade (100.0%), Information (100.0%), and Finance & Insurance (100.0%).
| Industry | Male | Female |
| Agriculture, Fishing & Hunting | 41 (45.6%) | 49 (54.4%) |
| Mining, Quarrying, & Extraction | 4 (100.0%) | 0 (0.0%) |
| Construction | 9 (69.2%) | 4 (30.8%) |
| Manufacturing | 15 (88.2%) | 2 (11.8%) |
| Wholesale Trade | 0 (0.0%) | 0 (0.0%) |
| Retail Trade | 0 (0.0%) | 21 (100.0%) |
| Transportation & Warehousing | 14 (100.0%) | 0 (0.0%) |
| Utilities | 11 (100.0%) | 0 (0.0%) |
| Information | 0 (0.0%) | 2 (100.0%) |
| Finance & Insurance | 0 (0.0%) | 3 (100.0%) |
| Real Estate, Rental & Leasing | 0 (0.0%) | 0 (0.0%) |
| Professional & Scientific | 0 (0.0%) | 5 (100.0%) |
| Enterprise Management | 0 (0.0%) | 0 (0.0%) |
| Administrative & Support | 0 (0.0%) | 6 (100.0%) |
| Educational Services | 0 (0.0%) | 11 (100.0%) |
| Health Care & Social Assistance | 5 (19.2%) | 21 (80.8%) |
| Arts, Entertainment & Recreation | 0 (0.0%) | 0 (0.0%) |
| Accommodation & Food Services | 0 (0.0%) | 3 (100.0%) |
| Public Administration | 5 (27.8%) | 13 (72.2%) |
| Total | 105 (37.5%) | 175 (62.5%) |
Education in Davisboro
School Enrollment in Davisboro
The most common levels of schooling among the 277 students in Davisboro are high school (118 | 42.6%), elementary school (58 | 20.9%), and college / undergraduate (47 | 17.0%).
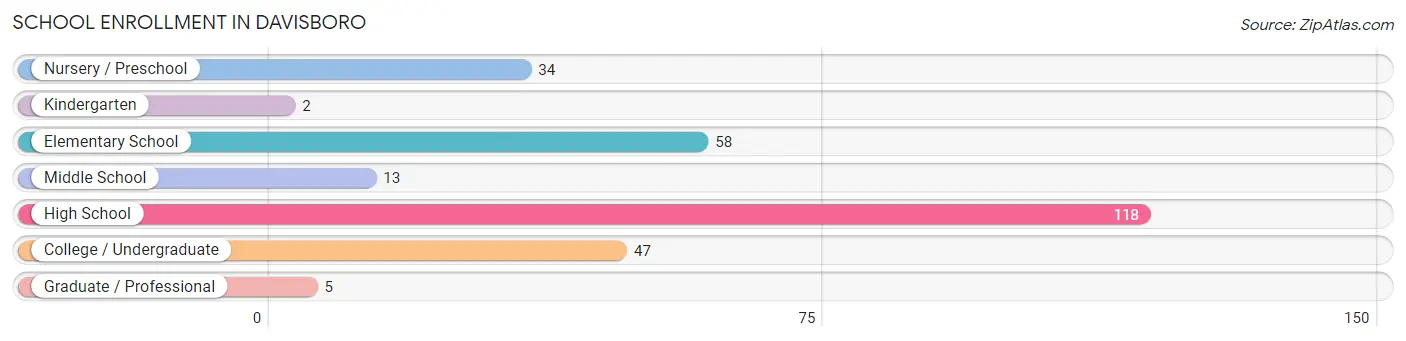
| School Level | # Students | % Students |
| Nursery / Preschool | 34 | 12.3% |
| Kindergarten | 2 | 0.7% |
| Elementary School | 58 | 20.9% |
| Middle School | 13 | 4.7% |
| High School | 118 | 42.6% |
| College / Undergraduate | 47 | 17.0% |
| Graduate / Professional | 5 | 1.8% |
| Total | 277 | 100.0% |
School Enrollment by Age by Funding Source in Davisboro
Out of a total of 277 students who are enrolled in schools in Davisboro, 89 (32.1%) attend a private institution, while the remaining 188 (67.9%) are enrolled in public schools. The age group of 35 years and over has the highest likelihood of being enrolled in private schools, with 66 (66.0% in the age bracket) enrolled. Conversely, the age group of 3 to 4 year olds has the lowest likelihood of being enrolled in a private school, with 24 (100.0% in the age bracket) attending a public institution.
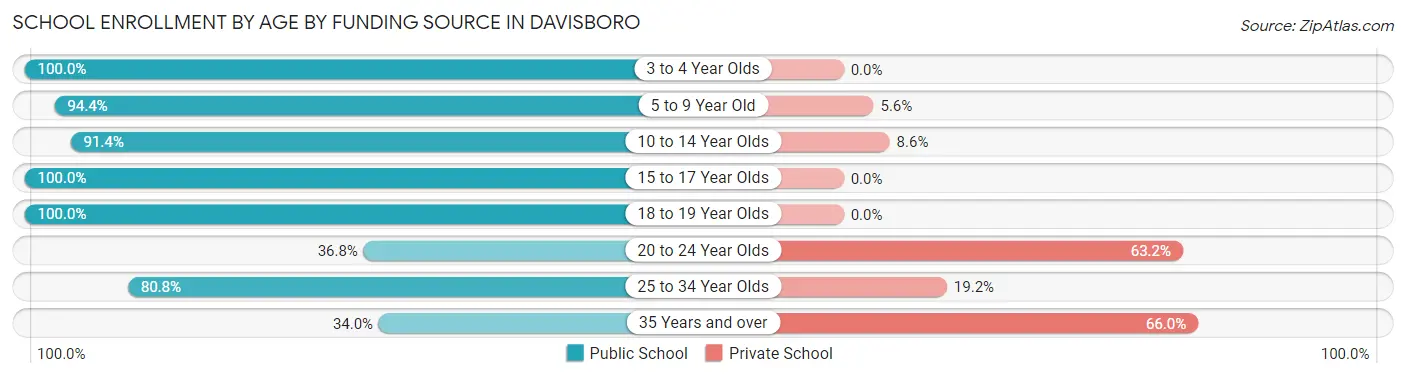
| Age Bracket | Public School | Private School |
| 3 to 4 Year Olds | 24 (100.0%) | 0 (0.0%) |
| 5 to 9 Year Old | 51 (94.4%) | 3 (5.6%) |
| 10 to 14 Year Olds | 32 (91.4%) | 3 (8.6%) |
| 15 to 17 Year Olds | 3 (100.0%) | 0 (0.0%) |
| 18 to 19 Year Olds | 16 (100.0%) | 0 (0.0%) |
| 20 to 24 Year Olds | 7 (36.8%) | 12 (63.2%) |
| 25 to 34 Year Olds | 21 (80.8%) | 5 (19.2%) |
| 35 Years and over | 34 (34.0%) | 66 (66.0%) |
| Total | 188 (67.9%) | 89 (32.1%) |
Educational Attainment by Field of Study in Davisboro
Business (48 | 44.4%), social sciences (14 | 13.0%), education (14 | 13.0%), arts & humanities (10 | 9.3%), and computers & mathematics (9 | 8.3%) are the most common fields of study among 108 individuals in Davisboro who have obtained a bachelor's degree or higher.
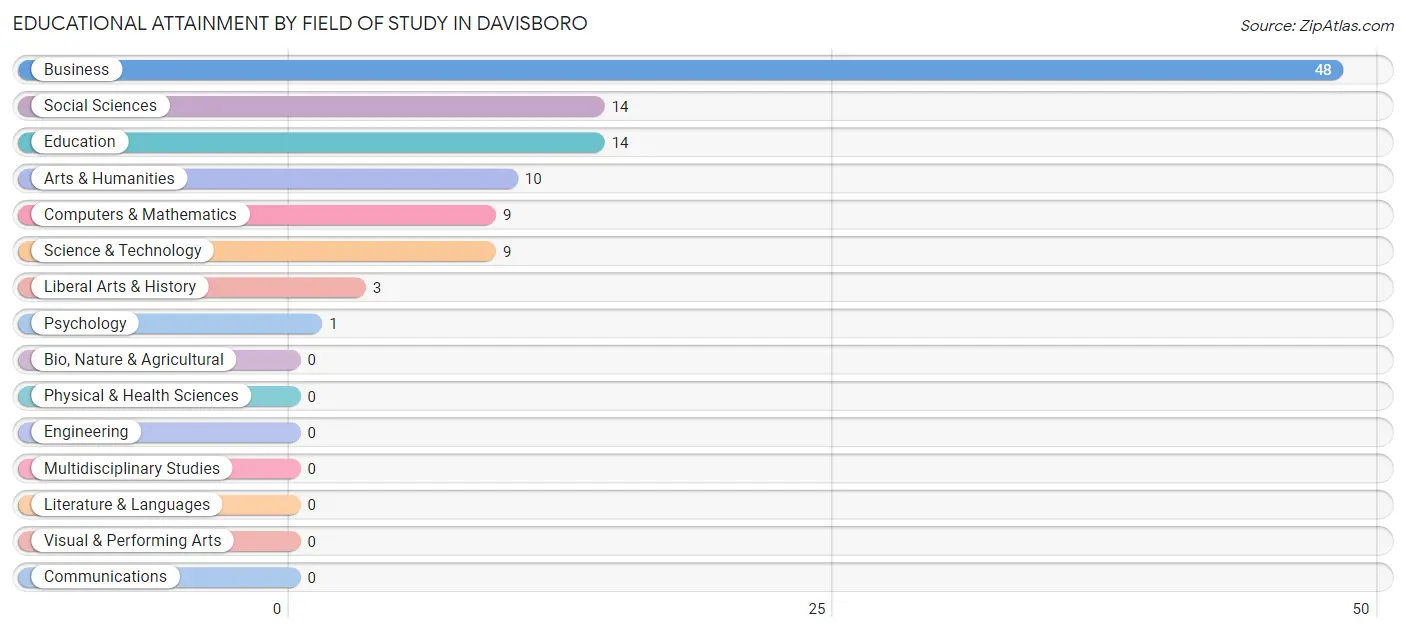
| Field of Study | # Graduates | % Graduates |
| Computers & Mathematics | 9 | 8.3% |
| Bio, Nature & Agricultural | 0 | 0.0% |
| Physical & Health Sciences | 0 | 0.0% |
| Psychology | 1 | 0.9% |
| Social Sciences | 14 | 13.0% |
| Engineering | 0 | 0.0% |
| Multidisciplinary Studies | 0 | 0.0% |
| Science & Technology | 9 | 8.3% |
| Business | 48 | 44.4% |
| Education | 14 | 13.0% |
| Literature & Languages | 0 | 0.0% |
| Liberal Arts & History | 3 | 2.8% |
| Visual & Performing Arts | 0 | 0.0% |
| Communications | 0 | 0.0% |
| Arts & Humanities | 10 | 9.3% |
| Total | 108 | 100.0% |
Transportation & Commute in Davisboro
Vehicle Availability by Sex in Davisboro
The most prevalent vehicle ownership categories in Davisboro are males with 2 vehicles (68, accounting for 64.8%) and females with 2 vehicles (97, making up 39.5%).
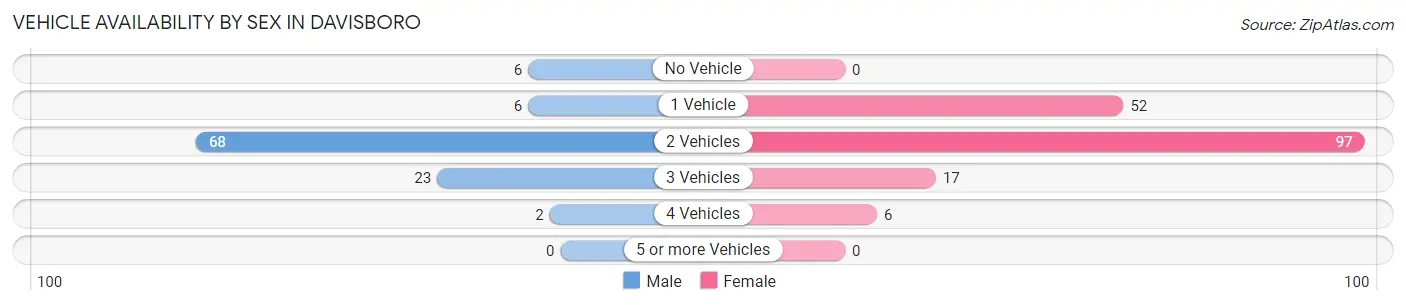
| Vehicles Available | Male | Female |
| No Vehicle | 6 (5.7%) | 0 (0.0%) |
| 1 Vehicle | 6 (5.7%) | 52 (30.2%) |
| 2 Vehicles | 68 (64.8%) | 97 (56.4%) |
| 3 Vehicles | 23 (21.9%) | 17 (9.9%) |
| 4 Vehicles | 2 (1.9%) | 6 (3.5%) |
| 5 or more Vehicles | 0 (0.0%) | 0 (0.0%) |
| Total | 105 (100.0%) | 172 (100.0%) |
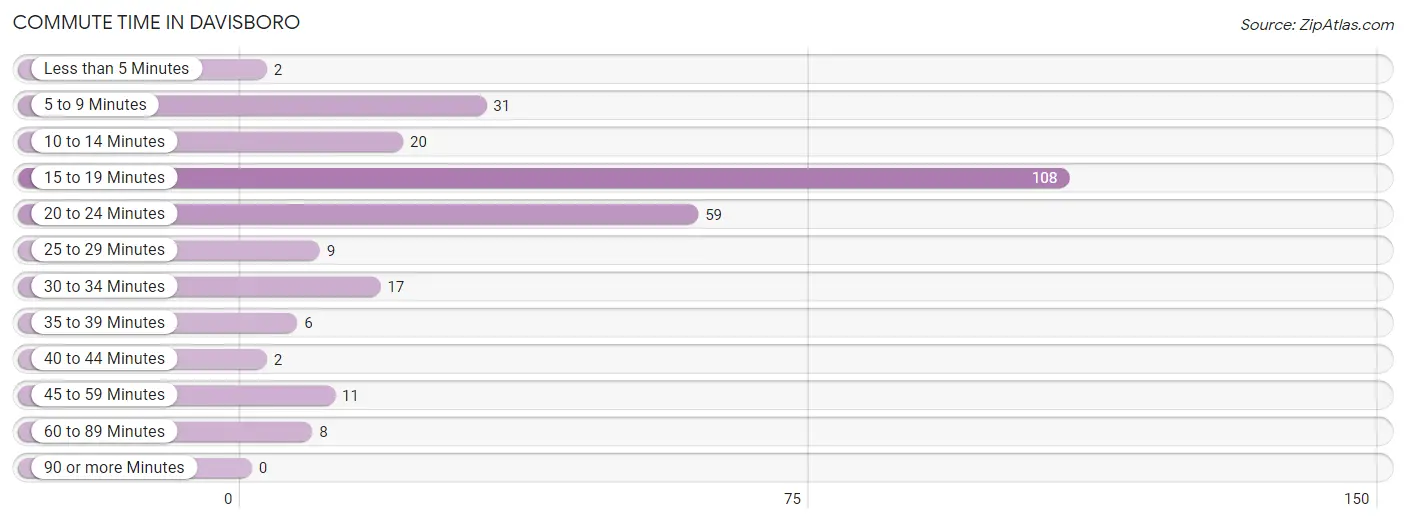
Commute Time in Davisboro
The most frequently occuring commute durations in Davisboro are 15 to 19 minutes (108 commuters, 39.6%), 20 to 24 minutes (59 commuters, 21.6%), and 5 to 9 minutes (31 commuters, 11.4%).
| Commute Time | # Commuters | % Commuters |
| Less than 5 Minutes | 2 | 0.7% |
| 5 to 9 Minutes | 31 | 11.4% |
| 10 to 14 Minutes | 20 | 7.3% |
| 15 to 19 Minutes | 108 | 39.6% |
| 20 to 24 Minutes | 59 | 21.6% |
| 25 to 29 Minutes | 9 | 3.3% |
| 30 to 34 Minutes | 17 | 6.2% |
| 35 to 39 Minutes | 6 | 2.2% |
| 40 to 44 Minutes | 2 | 0.7% |
| 45 to 59 Minutes | 11 | 4.0% |
| 60 to 89 Minutes | 8 | 2.9% |
| 90 or more Minutes | 0 | 0.0% |
Commute Time by Sex in Davisboro
The most common commute times in Davisboro are 20 to 24 minutes (32 commuters, 30.5%) for males and 15 to 19 minutes (96 commuters, 57.1%) for females.
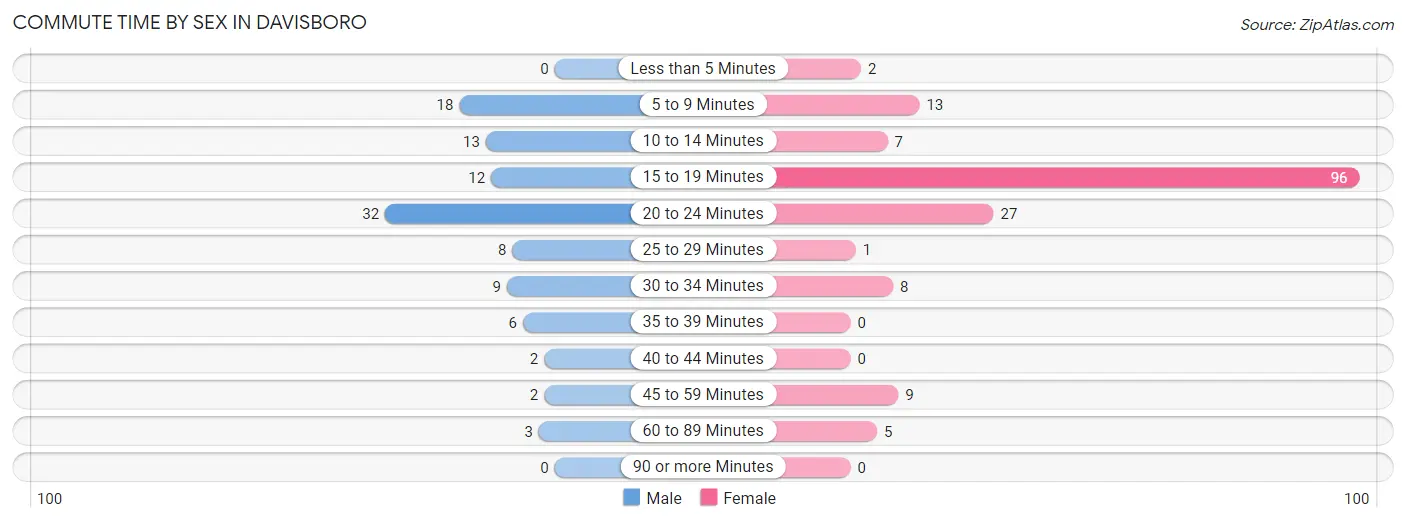
| Commute Time | Male | Female |
| Less than 5 Minutes | 0 (0.0%) | 2 (1.2%) |
| 5 to 9 Minutes | 18 (17.1%) | 13 (7.7%) |
| 10 to 14 Minutes | 13 (12.4%) | 7 (4.2%) |
| 15 to 19 Minutes | 12 (11.4%) | 96 (57.1%) |
| 20 to 24 Minutes | 32 (30.5%) | 27 (16.1%) |
| 25 to 29 Minutes | 8 (7.6%) | 1 (0.6%) |
| 30 to 34 Minutes | 9 (8.6%) | 8 (4.8%) |
| 35 to 39 Minutes | 6 (5.7%) | 0 (0.0%) |
| 40 to 44 Minutes | 2 (1.9%) | 0 (0.0%) |
| 45 to 59 Minutes | 2 (1.9%) | 9 (5.4%) |
| 60 to 89 Minutes | 3 (2.9%) | 5 (3.0%) |
| 90 or more Minutes | 0 (0.0%) | 0 (0.0%) |
Time of Departure to Work by Sex in Davisboro
The most frequent times of departure to work in Davisboro are 6:30 AM to 6:59 AM (31, 29.5%) for males and 7:00 AM to 7:29 AM (81, 48.2%) for females.
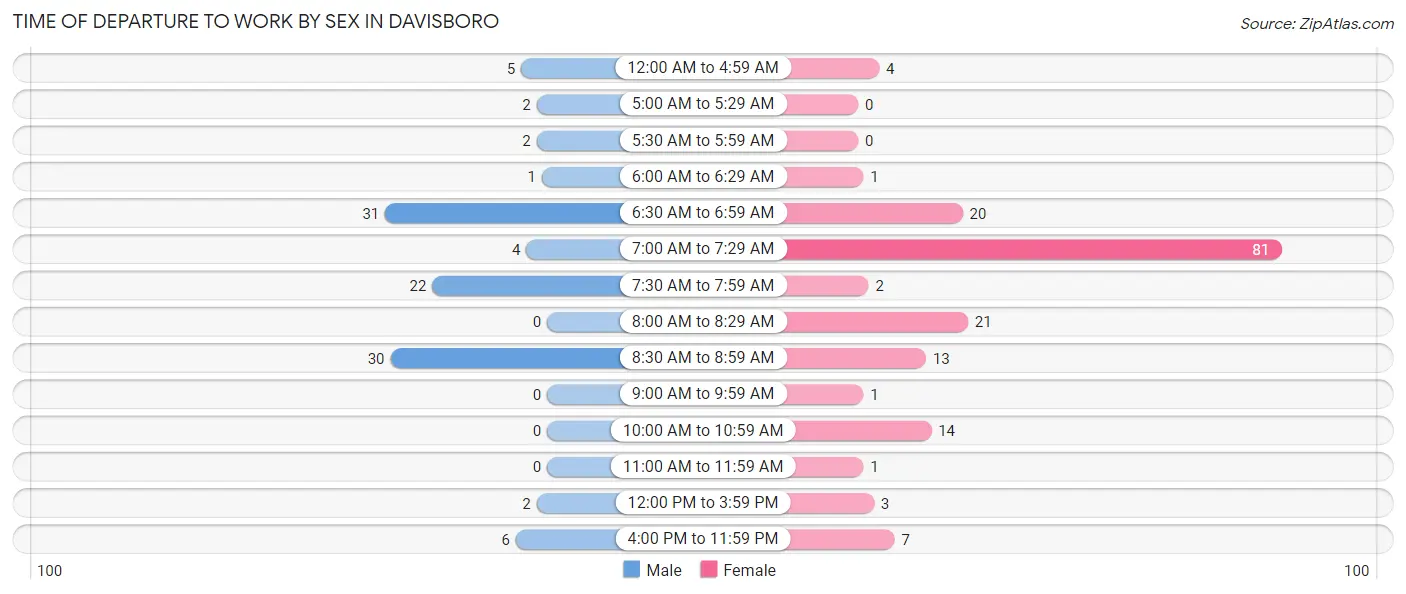
| Time of Departure | Male | Female |
| 12:00 AM to 4:59 AM | 5 (4.8%) | 4 (2.4%) |
| 5:00 AM to 5:29 AM | 2 (1.9%) | 0 (0.0%) |
| 5:30 AM to 5:59 AM | 2 (1.9%) | 0 (0.0%) |
| 6:00 AM to 6:29 AM | 1 (0.9%) | 1 (0.6%) |
| 6:30 AM to 6:59 AM | 31 (29.5%) | 20 (11.9%) |
| 7:00 AM to 7:29 AM | 4 (3.8%) | 81 (48.2%) |
| 7:30 AM to 7:59 AM | 22 (20.9%) | 2 (1.2%) |
| 8:00 AM to 8:29 AM | 0 (0.0%) | 21 (12.5%) |
| 8:30 AM to 8:59 AM | 30 (28.6%) | 13 (7.7%) |
| 9:00 AM to 9:59 AM | 0 (0.0%) | 1 (0.6%) |
| 10:00 AM to 10:59 AM | 0 (0.0%) | 14 (8.3%) |
| 11:00 AM to 11:59 AM | 0 (0.0%) | 1 (0.6%) |
| 12:00 PM to 3:59 PM | 2 (1.9%) | 3 (1.8%) |
| 4:00 PM to 11:59 PM | 6 (5.7%) | 7 (4.2%) |
| Total | 105 (100.0%) | 168 (100.0%) |
Housing Occupancy in Davisboro
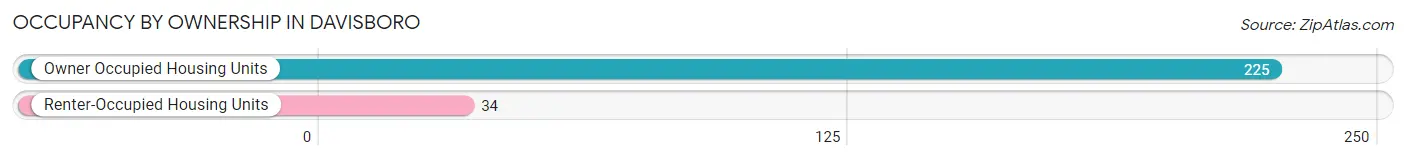
Occupancy by Ownership in Davisboro
Of the total 259 dwellings in Davisboro, owner-occupied units account for 225 (86.9%), while renter-occupied units make up 34 (13.1%).
| Occupancy | # Housing Units | % Housing Units |
| Owner Occupied Housing Units | 225 | 86.9% |
| Renter-Occupied Housing Units | 34 | 13.1% |
| Total Occupied Housing Units | 259 | 100.0% |
Occupancy by Household Size in Davisboro
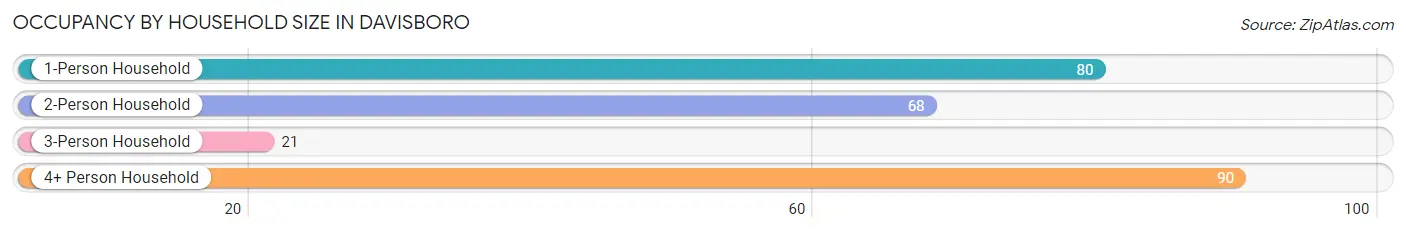
| Household Size | # Housing Units | % Housing Units |
| 1-Person Household | 80 | 30.9% |
| 2-Person Household | 68 | 26.3% |
| 3-Person Household | 21 | 8.1% |
| 4+ Person Household | 90 | 34.7% |
| Total Housing Units | 259 | 100.0% |
Occupancy by Ownership by Household Size in Davisboro
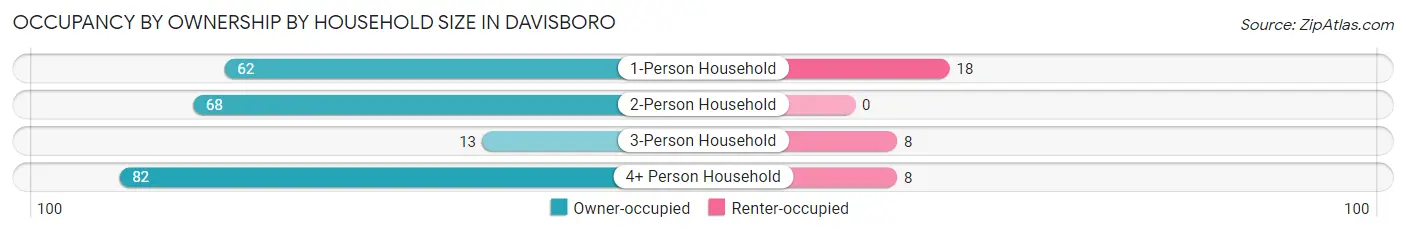
| Household Size | Owner-occupied | Renter-occupied |
| 1-Person Household | 62 (77.5%) | 18 (22.5%) |
| 2-Person Household | 68 (100.0%) | 0 (0.0%) |
| 3-Person Household | 13 (61.9%) | 8 (38.1%) |
| 4+ Person Household | 82 (91.1%) | 8 (8.9%) |
| Total Housing Units | 225 (86.9%) | 34 (13.1%) |
Occupancy by Educational Attainment in Davisboro
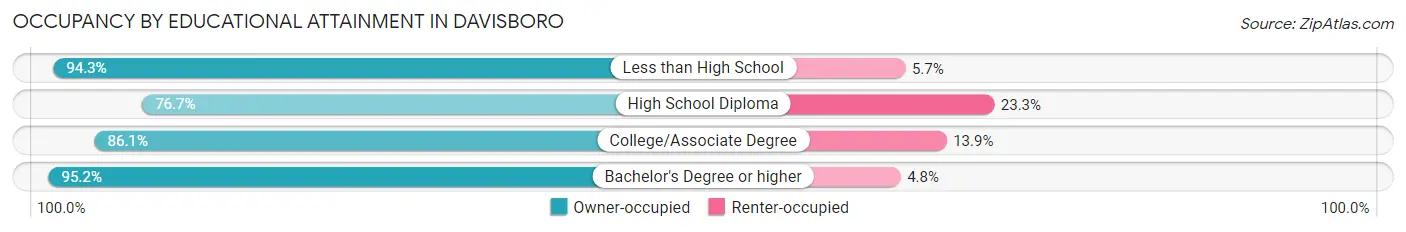
| Household Size | Owner-occupied | Renter-occupied |
| Less than High School | 66 (94.3%) | 4 (5.7%) |
| High School Diploma | 46 (76.7%) | 14 (23.3%) |
| College/Associate Degree | 93 (86.1%) | 15 (13.9%) |
| Bachelor's Degree or higher | 20 (95.2%) | 1 (4.8%) |
Occupancy by Age of Householder in Davisboro
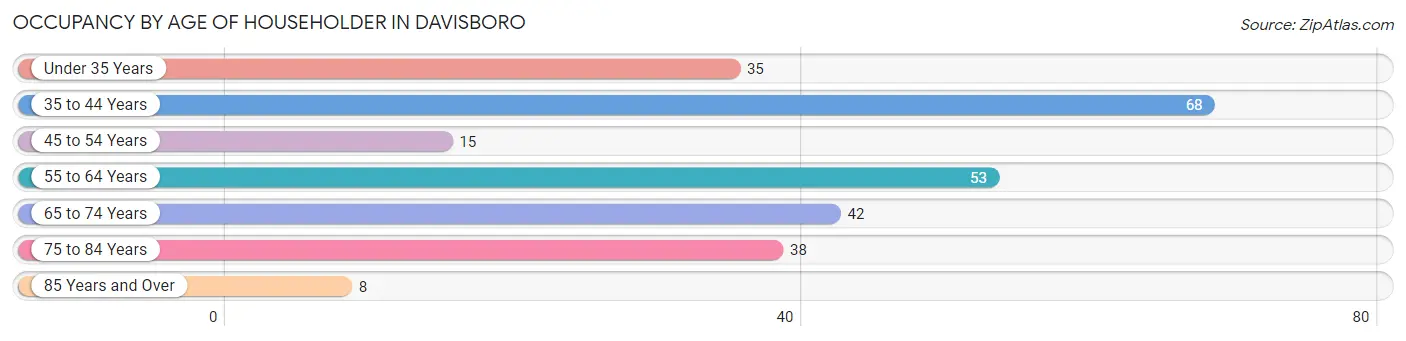
| Age Bracket | # Households | % Households |
| Under 35 Years | 35 | 13.5% |
| 35 to 44 Years | 68 | 26.3% |
| 45 to 54 Years | 15 | 5.8% |
| 55 to 64 Years | 53 | 20.5% |
| 65 to 74 Years | 42 | 16.2% |
| 75 to 84 Years | 38 | 14.7% |
| 85 Years and Over | 8 | 3.1% |
| Total | 259 | 100.0% |
Housing Finances in Davisboro
Median Income by Occupancy in Davisboro
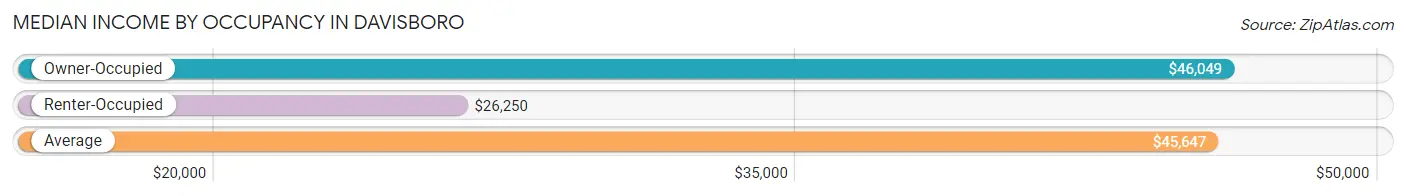
| Occupancy Type | # Households | Median Income |
| Owner-Occupied | 225 (86.9%) | $46,049 |
| Renter-Occupied | 34 (13.1%) | $26,250 |
| Average | 259 (100.0%) | $45,647 |
Occupancy by Householder Income Bracket in Davisboro
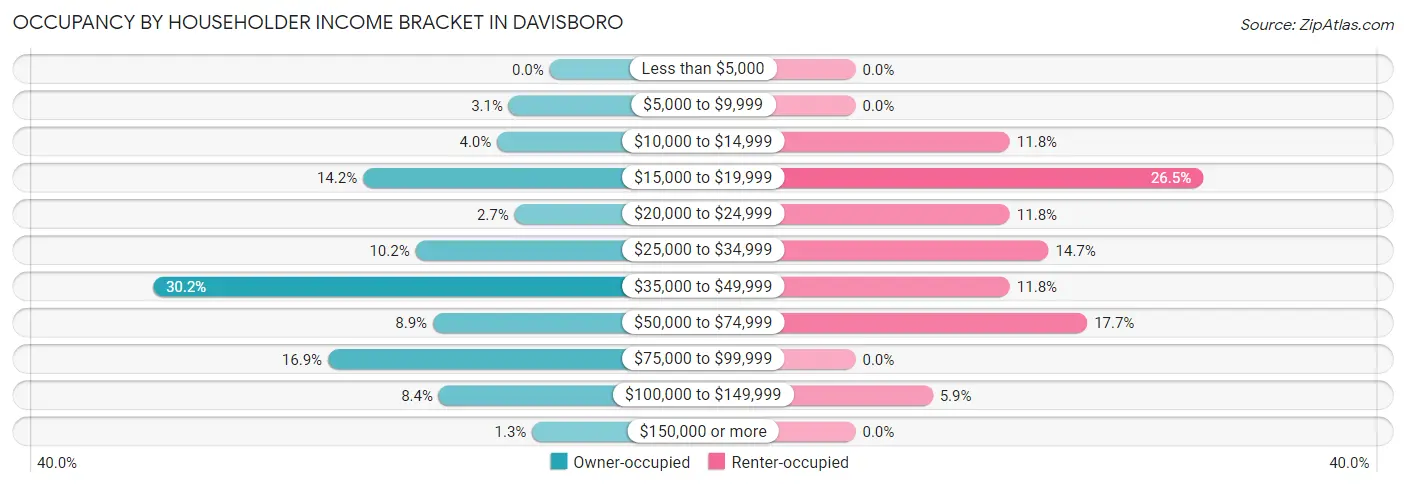
| Income Bracket | Owner-occupied | Renter-occupied |
| Less than $5,000 | 0 (0.0%) | 0 (0.0%) |
| $5,000 to $9,999 | 7 (3.1%) | 0 (0.0%) |
| $10,000 to $14,999 | 9 (4.0%) | 4 (11.8%) |
| $15,000 to $19,999 | 32 (14.2%) | 9 (26.5%) |
| $20,000 to $24,999 | 6 (2.7%) | 4 (11.8%) |
| $25,000 to $34,999 | 23 (10.2%) | 5 (14.7%) |
| $35,000 to $49,999 | 68 (30.2%) | 4 (11.8%) |
| $50,000 to $74,999 | 20 (8.9%) | 6 (17.6%) |
| $75,000 to $99,999 | 38 (16.9%) | 0 (0.0%) |
| $100,000 to $149,999 | 19 (8.4%) | 2 (5.9%) |
| $150,000 or more | 3 (1.3%) | 0 (0.0%) |
| Total | 225 (100.0%) | 34 (100.0%) |
Monthly Housing Cost Tiers in Davisboro
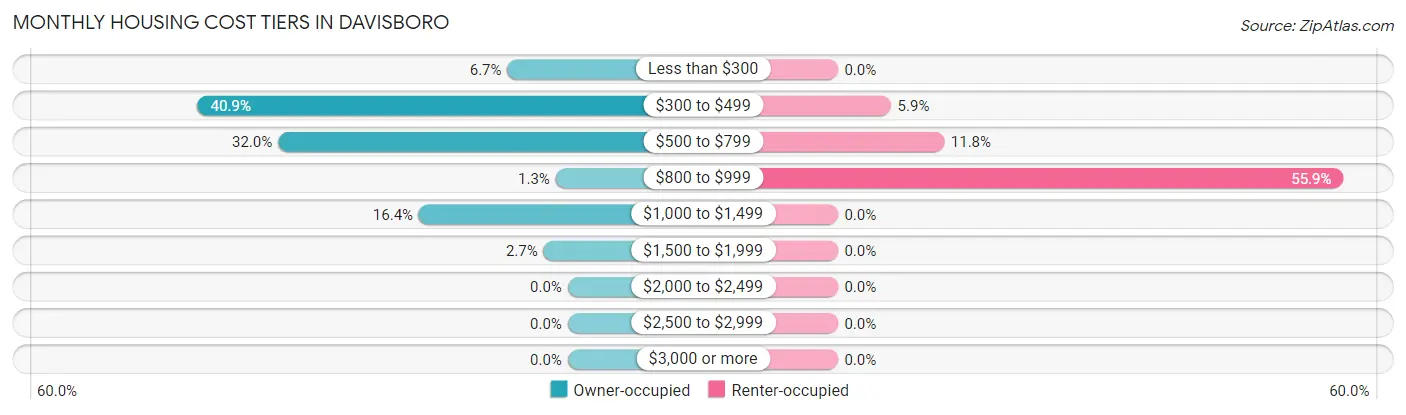
| Monthly Cost | Owner-occupied | Renter-occupied |
| Less than $300 | 15 (6.7%) | 0 (0.0%) |
| $300 to $499 | 92 (40.9%) | 2 (5.9%) |
| $500 to $799 | 72 (32.0%) | 4 (11.8%) |
| $800 to $999 | 3 (1.3%) | 19 (55.9%) |
| $1,000 to $1,499 | 37 (16.4%) | 0 (0.0%) |
| $1,500 to $1,999 | 6 (2.7%) | 0 (0.0%) |
| $2,000 to $2,499 | 0 (0.0%) | 0 (0.0%) |
| $2,500 to $2,999 | 0 (0.0%) | 0 (0.0%) |
| $3,000 or more | 0 (0.0%) | 0 (0.0%) |
| Total | 225 (100.0%) | 34 (100.0%) |
Physical Housing Characteristics in Davisboro
Housing Structures in Davisboro
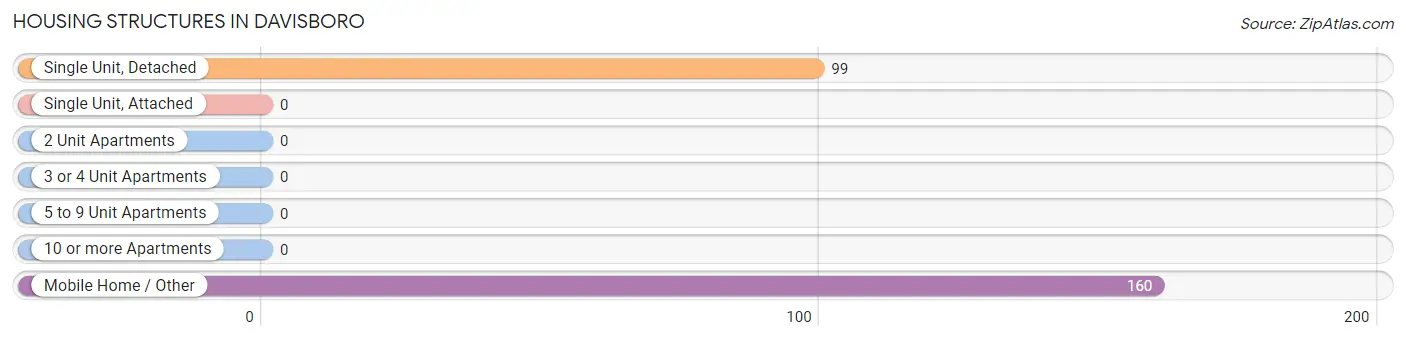
| Structure Type | # Housing Units | % Housing Units |
| Single Unit, Detached | 99 | 38.2% |
| Single Unit, Attached | 0 | 0.0% |
| 2 Unit Apartments | 0 | 0.0% |
| 3 or 4 Unit Apartments | 0 | 0.0% |
| 5 to 9 Unit Apartments | 0 | 0.0% |
| 10 or more Apartments | 0 | 0.0% |
| Mobile Home / Other | 160 | 61.8% |
| Total | 259 | 100.0% |
Housing Structures by Occupancy in Davisboro
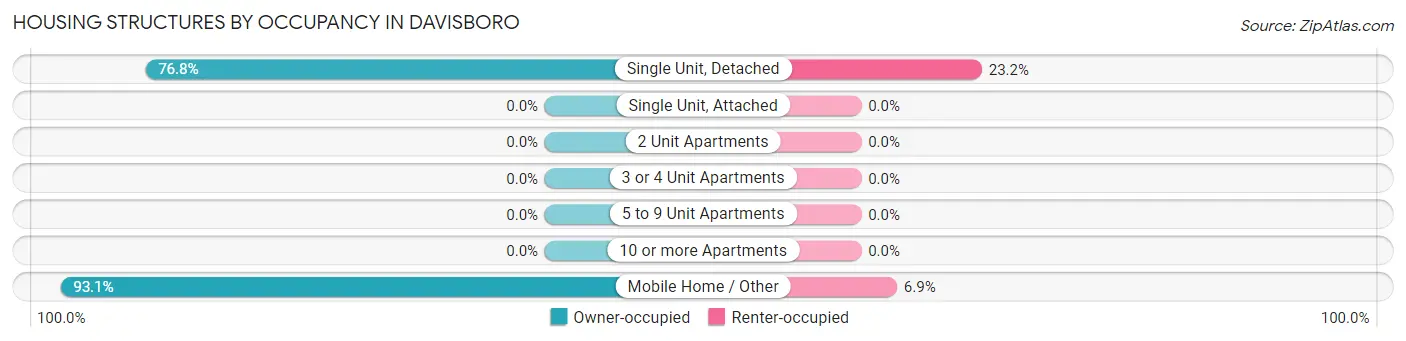
| Structure Type | Owner-occupied | Renter-occupied |
| Single Unit, Detached | 76 (76.8%) | 23 (23.2%) |
| Single Unit, Attached | 0 (0.0%) | 0 (0.0%) |
| 2 Unit Apartments | 0 (0.0%) | 0 (0.0%) |
| 3 or 4 Unit Apartments | 0 (0.0%) | 0 (0.0%) |
| 5 to 9 Unit Apartments | 0 (0.0%) | 0 (0.0%) |
| 10 or more Apartments | 0 (0.0%) | 0 (0.0%) |
| Mobile Home / Other | 149 (93.1%) | 11 (6.9%) |
| Total | 225 (86.9%) | 34 (13.1%) |
Housing Structures by Number of Rooms in Davisboro
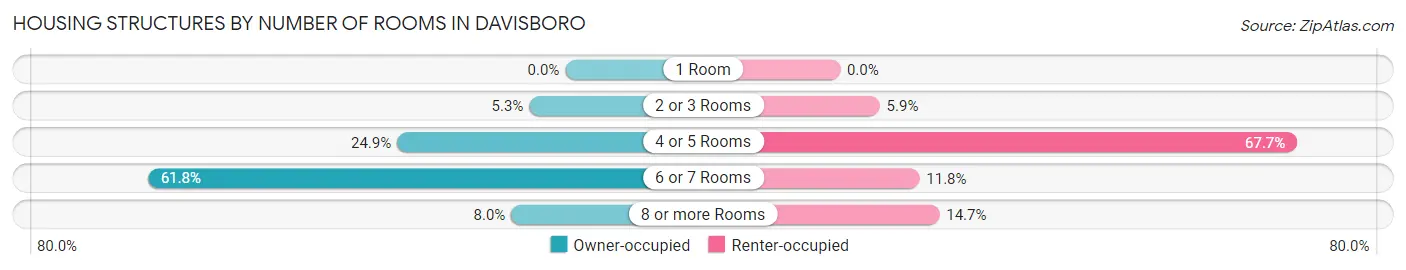
| Number of Rooms | Owner-occupied | Renter-occupied |
| 1 Room | 0 (0.0%) | 0 (0.0%) |
| 2 or 3 Rooms | 12 (5.3%) | 2 (5.9%) |
| 4 or 5 Rooms | 56 (24.9%) | 23 (67.6%) |
| 6 or 7 Rooms | 139 (61.8%) | 4 (11.8%) |
| 8 or more Rooms | 18 (8.0%) | 5 (14.7%) |
| Total | 225 (100.0%) | 34 (100.0%) |
Housing Structure by Heating Type in Davisboro
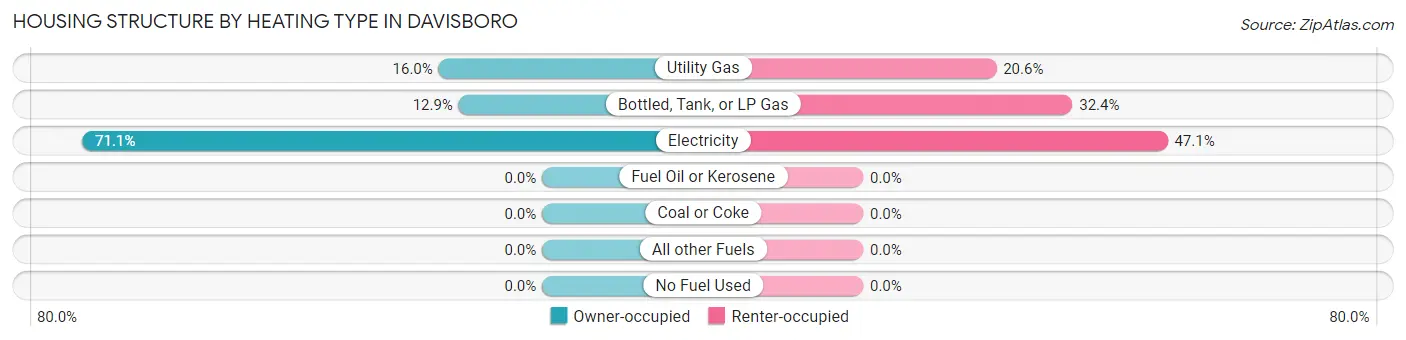
| Heating Type | Owner-occupied | Renter-occupied |
| Utility Gas | 36 (16.0%) | 7 (20.6%) |
| Bottled, Tank, or LP Gas | 29 (12.9%) | 11 (32.4%) |
| Electricity | 160 (71.1%) | 16 (47.1%) |
| Fuel Oil or Kerosene | 0 (0.0%) | 0 (0.0%) |
| Coal or Coke | 0 (0.0%) | 0 (0.0%) |
| All other Fuels | 0 (0.0%) | 0 (0.0%) |
| No Fuel Used | 0 (0.0%) | 0 (0.0%) |
| Total | 225 (100.0%) | 34 (100.0%) |
Household Vehicle Usage in Davisboro
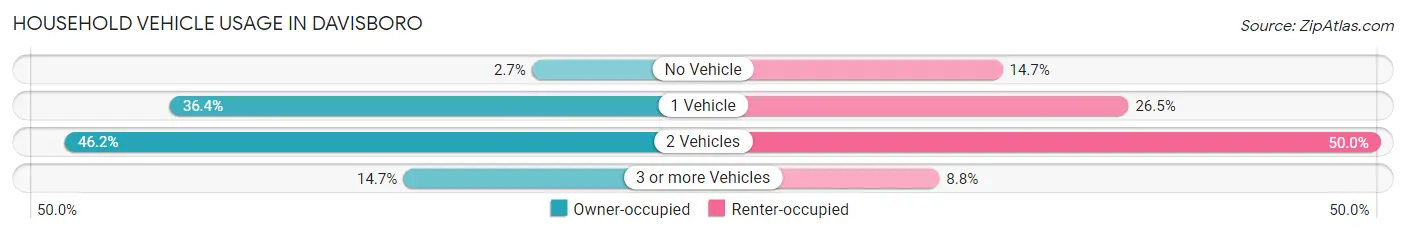
| Vehicles per Household | Owner-occupied | Renter-occupied |
| No Vehicle | 6 (2.7%) | 5 (14.7%) |
| 1 Vehicle | 82 (36.4%) | 9 (26.5%) |
| 2 Vehicles | 104 (46.2%) | 17 (50.0%) |
| 3 or more Vehicles | 33 (14.7%) | 3 (8.8%) |
| Total | 225 (100.0%) | 34 (100.0%) |
Real Estate & Mortgages in Davisboro
Real Estate and Mortgage Overview in Davisboro
| Characteristic | Without Mortgage | With Mortgage |
| Housing Units | 133 | 92 |
| Median Property Value | $104,300 | $0 |
| Median Household Income | $46,406 | $0 |
| Monthly Housing Costs | $442 | $0 |
| Real Estate Taxes | $499 | $7 |
Property Value by Mortgage Status in Davisboro
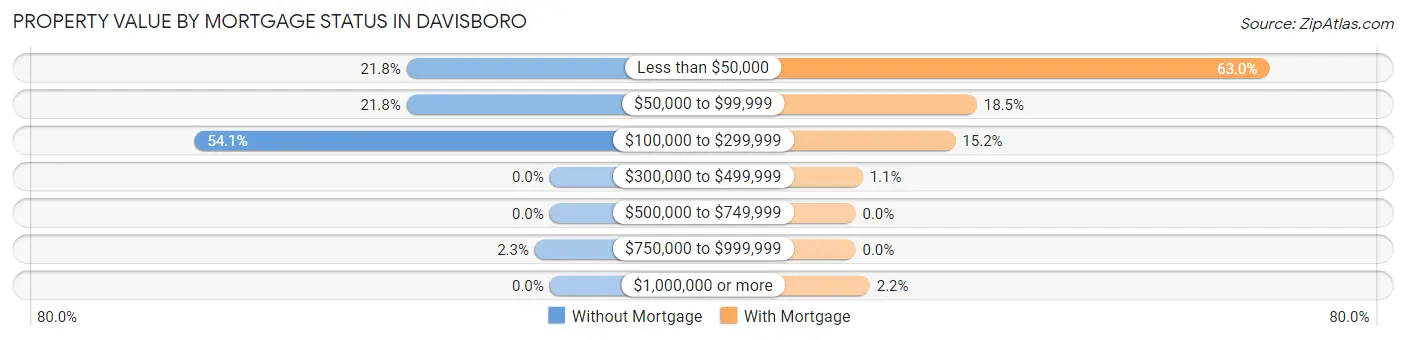
| Property Value | Without Mortgage | With Mortgage |
| Less than $50,000 | 29 (21.8%) | 58 (63.0%) |
| $50,000 to $99,999 | 29 (21.8%) | 17 (18.5%) |
| $100,000 to $299,999 | 72 (54.1%) | 14 (15.2%) |
| $300,000 to $499,999 | 0 (0.0%) | 1 (1.1%) |
| $500,000 to $749,999 | 0 (0.0%) | 0 (0.0%) |
| $750,000 to $999,999 | 3 (2.3%) | 0 (0.0%) |
| $1,000,000 or more | 0 (0.0%) | 2 (2.2%) |
| Total | 133 (100.0%) | 92 (100.0%) |
Household Income by Mortgage Status in Davisboro
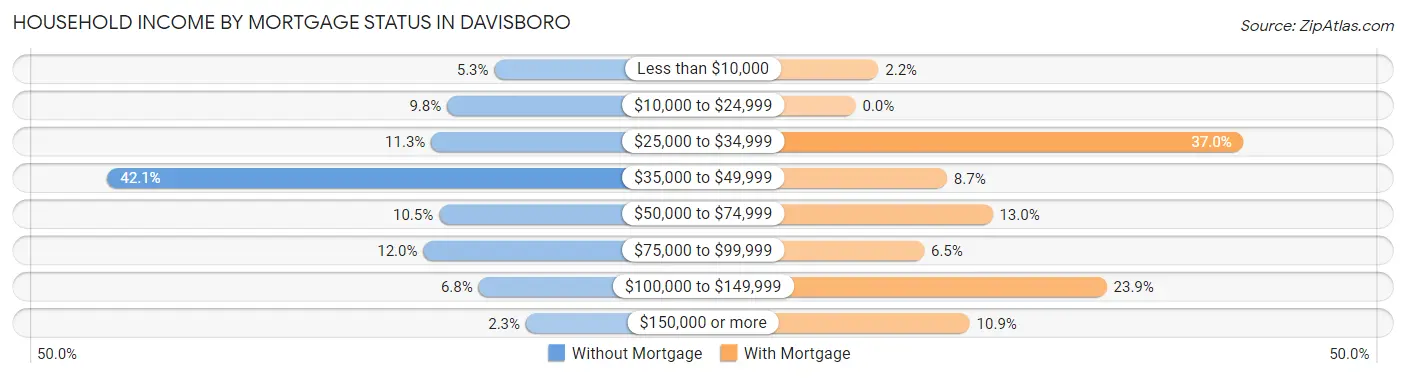
| Household Income | Without Mortgage | With Mortgage |
| Less than $10,000 | 7 (5.3%) | 2 (2.2%) |
| $10,000 to $24,999 | 13 (9.8%) | 0 (0.0%) |
| $25,000 to $34,999 | 15 (11.3%) | 34 (37.0%) |
| $35,000 to $49,999 | 56 (42.1%) | 8 (8.7%) |
| $50,000 to $74,999 | 14 (10.5%) | 12 (13.0%) |
| $75,000 to $99,999 | 16 (12.0%) | 6 (6.5%) |
| $100,000 to $149,999 | 9 (6.8%) | 22 (23.9%) |
| $150,000 or more | 3 (2.3%) | 10 (10.9%) |
| Total | 133 (100.0%) | 92 (100.0%) |
Property Value to Household Income Ratio in Davisboro
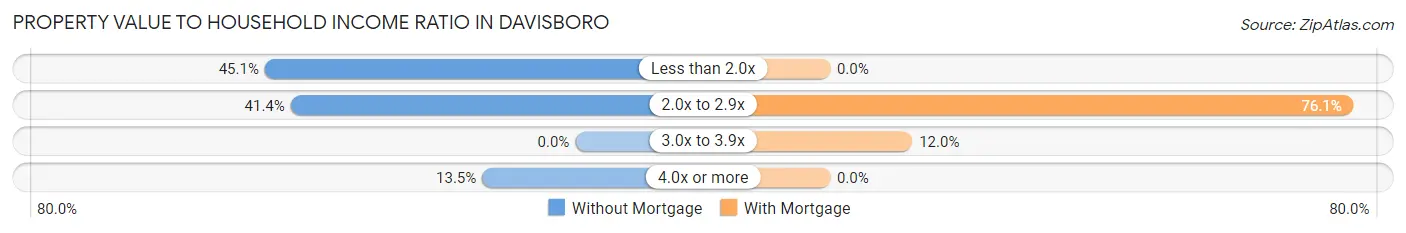
| Value-to-Income Ratio | Without Mortgage | With Mortgage |
| Less than 2.0x | 60 (45.1%) | 0 (0.0%) |
| 2.0x to 2.9x | 55 (41.3%) | 70 (76.1%) |
| 3.0x to 3.9x | 0 (0.0%) | 11 (12.0%) |
| 4.0x or more | 18 (13.5%) | 0 (0.0%) |
| Total | 133 (100.0%) | 92 (100.0%) |
Real Estate Taxes by Mortgage Status in Davisboro
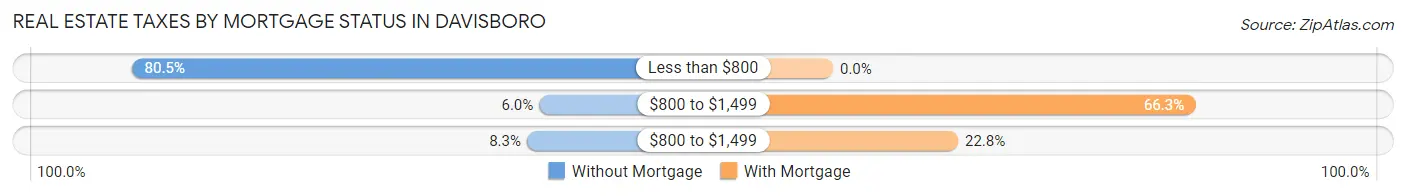
| Property Taxes | Without Mortgage | With Mortgage |
| Less than $800 | 107 (80.4%) | 0 (0.0%) |
| $800 to $1,499 | 8 (6.0%) | 61 (66.3%) |
| $800 to $1,499 | 11 (8.3%) | 21 (22.8%) |
| Total | 133 (100.0%) | 92 (100.0%) |
Health & Disability in Davisboro
Health Insurance Coverage by Age in Davisboro
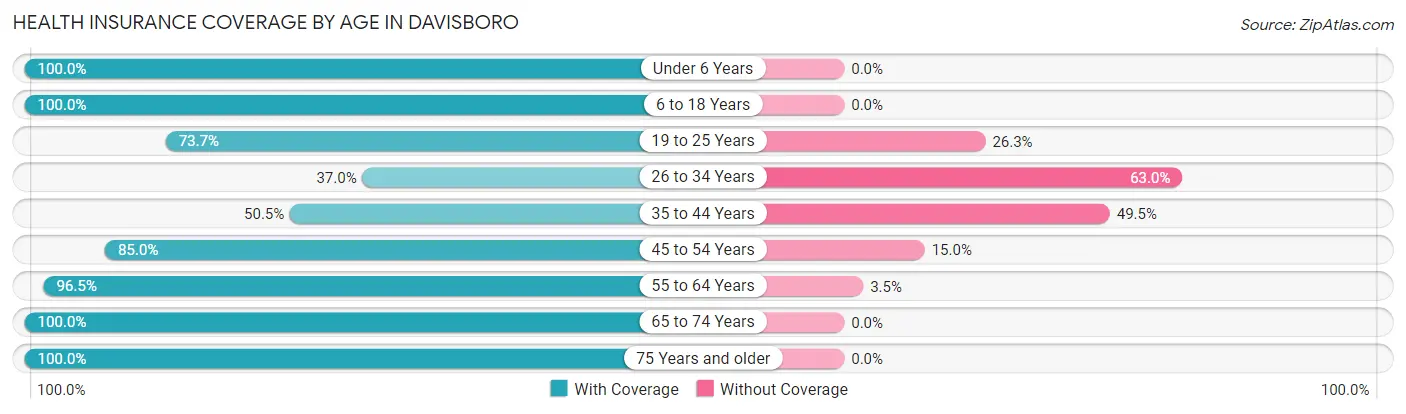
| Age Bracket | With Coverage | Without Coverage |
| Under 6 Years | 138 (100.0%) | 0 (0.0%) |
| 6 to 18 Years | 148 (100.0%) | 0 (0.0%) |
| 19 to 25 Years | 28 (73.7%) | 10 (26.3%) |
| 26 to 34 Years | 27 (37.0%) | 46 (63.0%) |
| 35 to 44 Years | 52 (50.5%) | 51 (49.5%) |
| 45 to 54 Years | 34 (85.0%) | 6 (15.0%) |
| 55 to 64 Years | 82 (96.5%) | 3 (3.5%) |
| 65 to 74 Years | 60 (100.0%) | 0 (0.0%) |
| 75 Years and older | 50 (100.0%) | 0 (0.0%) |
| Total | 619 (84.2%) | 116 (15.8%) |
Health Insurance Coverage by Citizenship Status in Davisboro
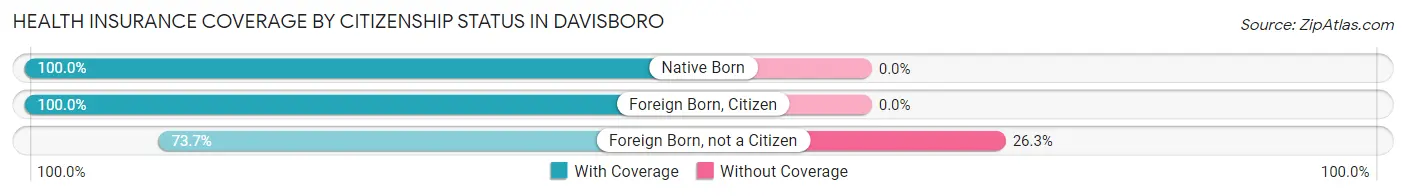
| Citizenship Status | With Coverage | Without Coverage |
| Native Born | 138 (100.0%) | 0 (0.0%) |
| Foreign Born, Citizen | 148 (100.0%) | 0 (0.0%) |
| Foreign Born, not a Citizen | 28 (73.7%) | 10 (26.3%) |
Health Insurance Coverage by Household Income in Davisboro
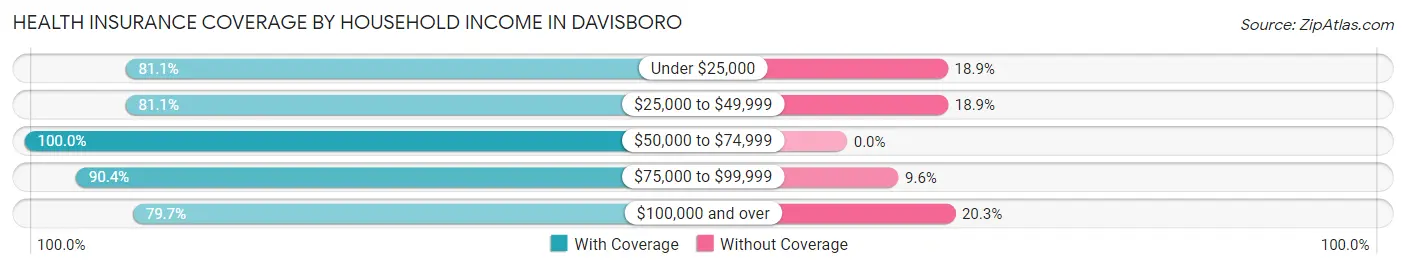
| Household Income | With Coverage | Without Coverage |
| Under $25,000 | 133 (81.1%) | 31 (18.9%) |
| $25,000 to $49,999 | 257 (81.1%) | 60 (18.9%) |
| $50,000 to $74,999 | 76 (100.0%) | 0 (0.0%) |
| $75,000 to $99,999 | 94 (90.4%) | 10 (9.6%) |
| $100,000 and over | 59 (79.7%) | 15 (20.3%) |
Public vs Private Health Insurance Coverage by Age in Davisboro
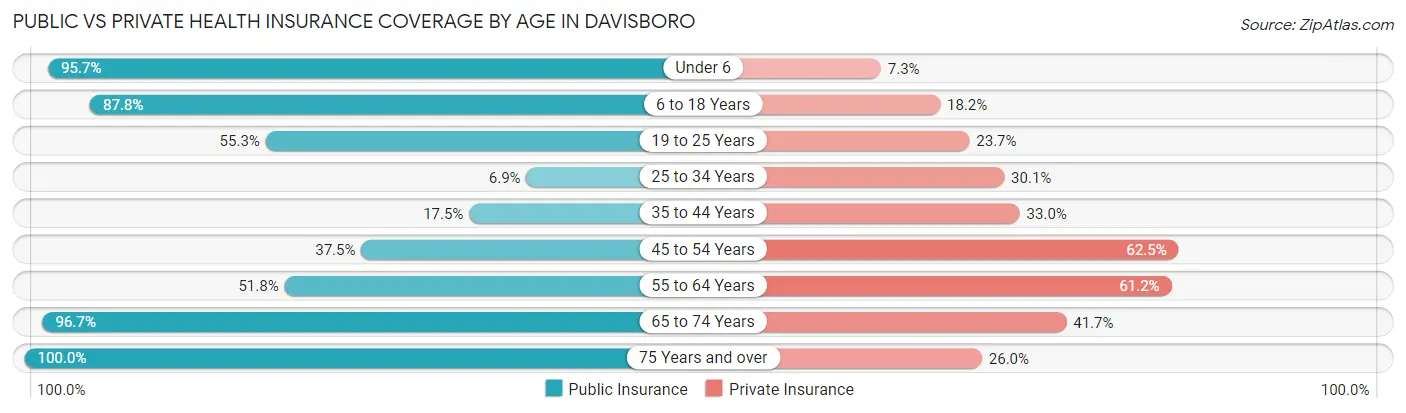
| Age Bracket | Public Insurance | Private Insurance |
| Under 6 | 132 (95.7%) | 10 (7.2%) |
| 6 to 18 Years | 130 (87.8%) | 27 (18.2%) |
| 19 to 25 Years | 21 (55.3%) | 9 (23.7%) |
| 25 to 34 Years | 5 (6.9%) | 22 (30.1%) |
| 35 to 44 Years | 18 (17.5%) | 34 (33.0%) |
| 45 to 54 Years | 15 (37.5%) | 25 (62.5%) |
| 55 to 64 Years | 44 (51.8%) | 52 (61.2%) |
| 65 to 74 Years | 58 (96.7%) | 25 (41.7%) |
| 75 Years and over | 50 (100.0%) | 13 (26.0%) |
| Total | 473 (64.3%) | 217 (29.5%) |
Disability Status by Sex by Age in Davisboro
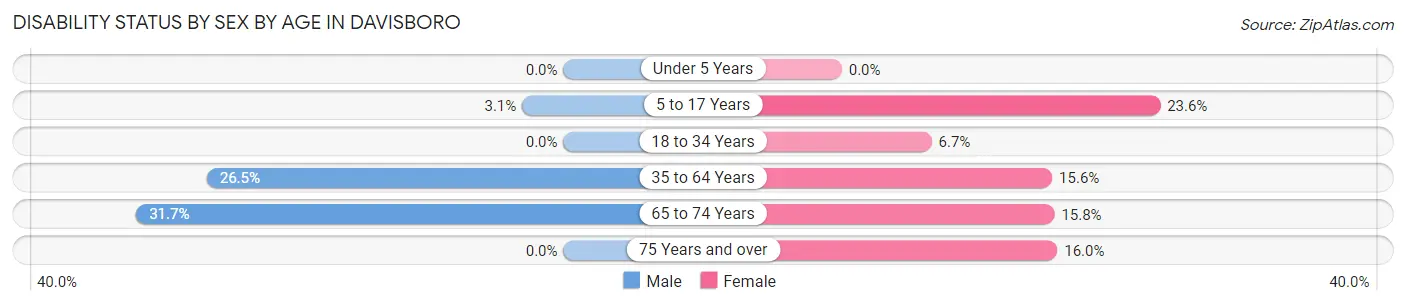
| Age Bracket | Male | Female |
| Under 5 Years | 0 (0.0%) | 0 (0.0%) |
| 5 to 17 Years | 3 (3.1%) | 13 (23.6%) |
| 18 to 34 Years | 0 (0.0%) | 4 (6.7%) |
| 35 to 64 Years | 18 (26.5%) | 25 (15.6%) |
| 65 to 74 Years | 13 (31.7%) | 3 (15.8%) |
| 75 Years and over | 0 (0.0%) | 8 (16.0%) |
Disability Class by Sex by Age in Davisboro
Disability Class: Hearing Difficulty
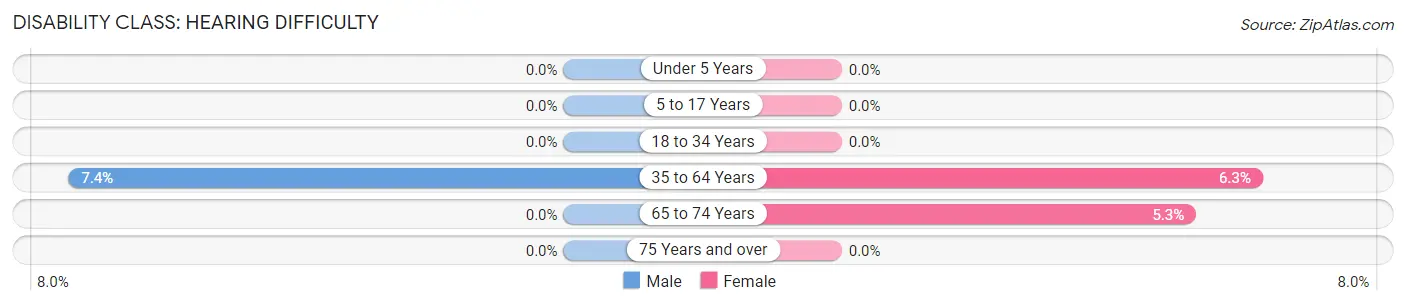
| Age Bracket | Male | Female |
| Under 5 Years | 0 (0.0%) | 0 (0.0%) |
| 5 to 17 Years | 0 (0.0%) | 0 (0.0%) |
| 18 to 34 Years | 0 (0.0%) | 0 (0.0%) |
| 35 to 64 Years | 5 (7.3%) | 10 (6.2%) |
| 65 to 74 Years | 0 (0.0%) | 1 (5.3%) |
| 75 Years and over | 0 (0.0%) | 0 (0.0%) |
Disability Class: Vision Difficulty
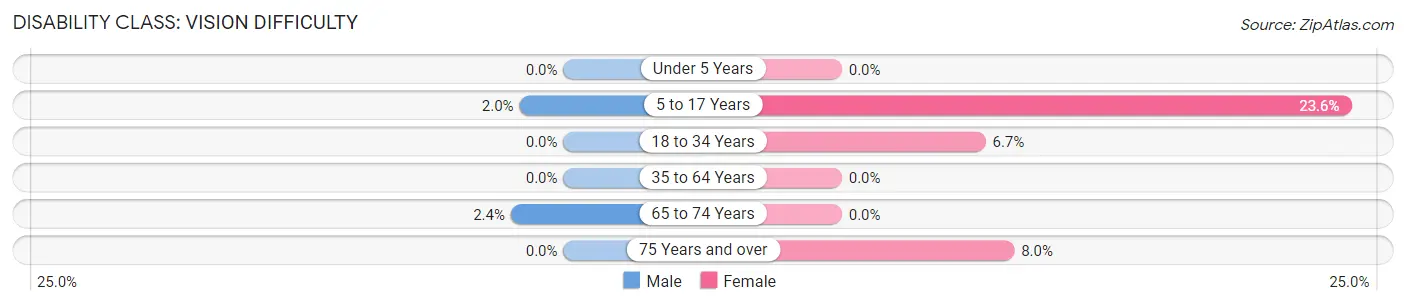
| Age Bracket | Male | Female |
| Under 5 Years | 0 (0.0%) | 0 (0.0%) |
| 5 to 17 Years | 2 (2.0%) | 13 (23.6%) |
| 18 to 34 Years | 0 (0.0%) | 4 (6.7%) |
| 35 to 64 Years | 0 (0.0%) | 0 (0.0%) |
| 65 to 74 Years | 1 (2.4%) | 0 (0.0%) |
| 75 Years and over | 0 (0.0%) | 4 (8.0%) |
Disability Class: Cognitive Difficulty
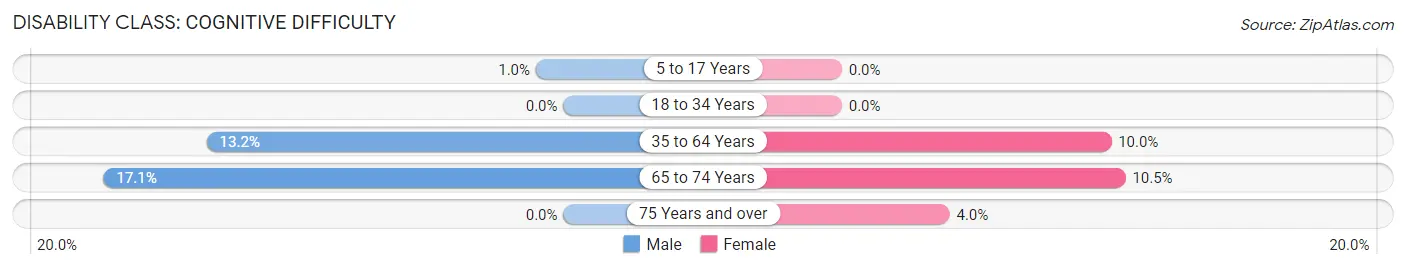
| Age Bracket | Male | Female |
| 5 to 17 Years | 1 (1.0%) | 0 (0.0%) |
| 18 to 34 Years | 0 (0.0%) | 0 (0.0%) |
| 35 to 64 Years | 9 (13.2%) | 16 (10.0%) |
| 65 to 74 Years | 7 (17.1%) | 2 (10.5%) |
| 75 Years and over | 0 (0.0%) | 2 (4.0%) |
Disability Class: Ambulatory Difficulty
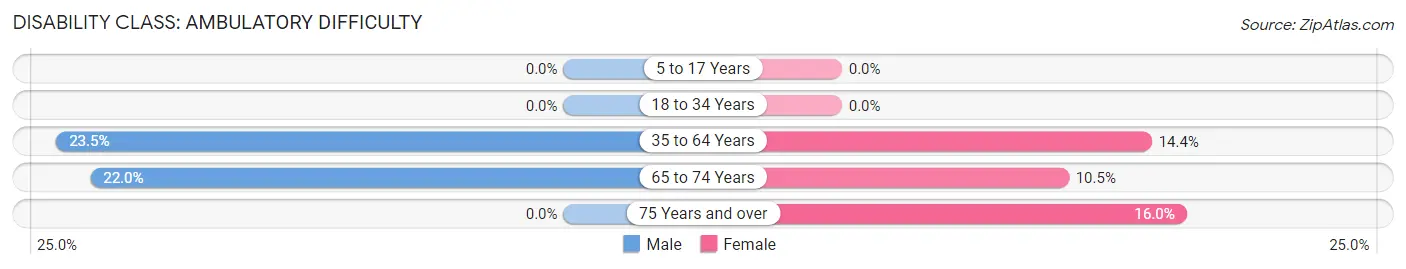
| Age Bracket | Male | Female |
| 5 to 17 Years | 0 (0.0%) | 0 (0.0%) |
| 18 to 34 Years | 0 (0.0%) | 0 (0.0%) |
| 35 to 64 Years | 16 (23.5%) | 23 (14.4%) |
| 65 to 74 Years | 9 (22.0%) | 2 (10.5%) |
| 75 Years and over | 0 (0.0%) | 8 (16.0%) |
Disability Class: Self-Care Difficulty
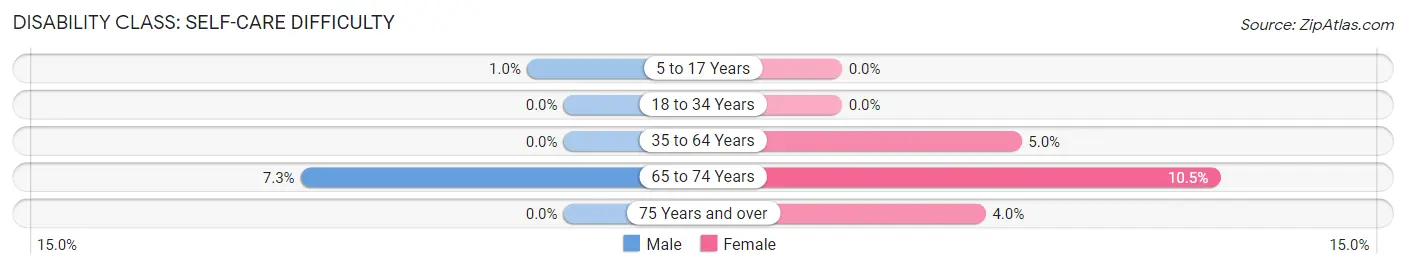
| Age Bracket | Male | Female |
| 5 to 17 Years | 1 (1.0%) | 0 (0.0%) |
| 18 to 34 Years | 0 (0.0%) | 0 (0.0%) |
| 35 to 64 Years | 0 (0.0%) | 8 (5.0%) |
| 65 to 74 Years | 3 (7.3%) | 2 (10.5%) |
| 75 Years and over | 0 (0.0%) | 2 (4.0%) |
Technology Access in Davisboro
Computing Device Access in Davisboro
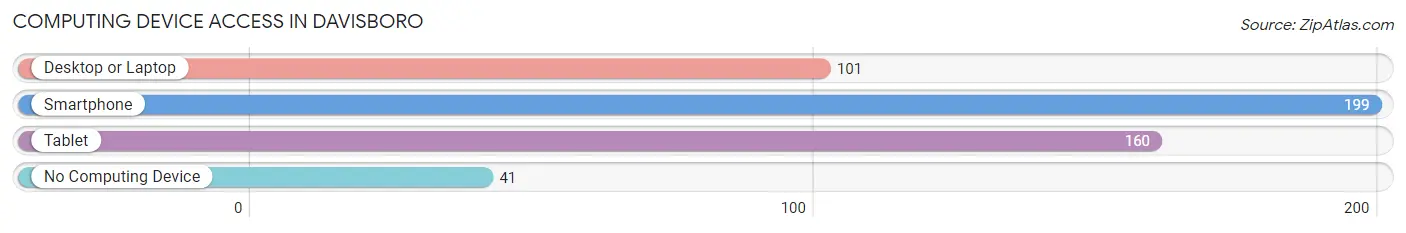
| Device Type | # Households | % Households |
| Desktop or Laptop | 101 | 39.0% |
| Smartphone | 199 | 76.8% |
| Tablet | 160 | 61.8% |
| No Computing Device | 41 | 15.8% |
| Total | 259 | 100.0% |
Internet Access in Davisboro
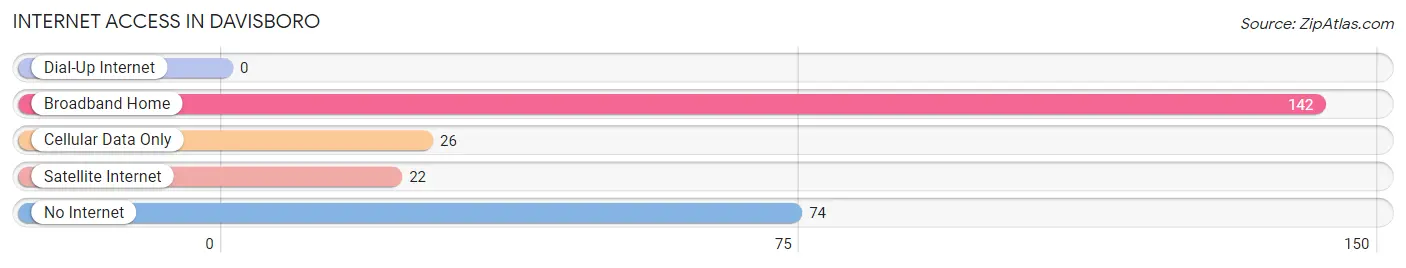
| Internet Type | # Households | % Households |
| Dial-Up Internet | 0 | 0.0% |
| Broadband Home | 142 | 54.8% |
| Cellular Data Only | 26 | 10.0% |
| Satellite Internet | 22 | 8.5% |
| No Internet | 74 | 28.6% |
| Total | 259 | 100.0% |
Davisboro Summary
Davisboro is a small town located in Washington County, Georgia, United States. It is situated in the southeastern part of the state, about 30 miles south of Augusta. The town was founded in 1820 and named after William Davis, a local landowner. As of the 2010 census, the population of Davisboro was 1,093.
Geography
Davisboro is located at 32°51'25" North, 82°25'45" West (32.856944, -82.429167). It is situated in the southeastern part of the state, about 30 miles south of Augusta. The town is located in the Ogeechee River basin, and is surrounded by rolling hills and forests. The nearest major cities are Augusta, Georgia (30 miles to the north) and Savannah, Georgia (90 miles to the south).
Climate
Davisboro has a humid subtropical climate, with hot, humid summers and mild winters. The average annual temperature is 64°F (18°C), and the average annual precipitation is 48 inches (122 cm).
Demographics
As of the 2010 census, the population of Davisboro was 1,093. The racial makeup of the town was 79.2% White, 17.7% African American, 0.3% Native American, 0.3% Asian, 0.1% Pacific Islander, 0.7% from other races, and 1.9% from two or more races. Hispanic or Latino of any race were 2.2% of the population.
Economy
The economy of Davisboro is largely based on agriculture. The town is home to several farms, which produce a variety of crops, including cotton, corn, soybeans, and peanuts. The town also has a few small businesses, including a grocery store, a hardware store, and a few restaurants.
History
Davisboro was founded in 1820 and named after William Davis, a local landowner. The town was incorporated in 1871. During the Civil War, Davisboro was the site of a skirmish between Union and Confederate forces. In the late 19th century, the town was a major center for cotton production. In the early 20th century, the town was home to several sawmills and lumber companies.
In the late 20th century, Davisboro experienced a period of economic decline. The town's population decreased, and many of its businesses closed. In recent years, the town has seen a resurgence in economic activity, with several new businesses opening in the area.
Common Questions
What is the Total Population of Davisboro?
Total Population of Davisboro is 2,196.
What is the Total Male Population of Davisboro?
Total Male Population of Davisboro is 1,744.
What is the Total Female Population of Davisboro?
Total Female Population of Davisboro is 452.
What is the Ratio of Males per 100 Females in Davisboro?
There are 385.84 Males per 100 Females in Davisboro.
What is the Ratio of Females per 100 Males in Davisboro?
There are 25.92 Females per 100 Males in Davisboro.
What is the Median Population Age in Davisboro?
Median Population Age in Davisboro is 37.5 Years.
What is the Average Family Size in Davisboro
Average Family Size in Davisboro is 3.6 People.
What is the Average Household Size in Davisboro
Average Household Size in Davisboro is 2.8 People.
What is Per Capita Income in Davisboro?
Per Capita income in Davisboro is $7,697.
What is the Median Family Income in Davisboro?
Median Family Income in Davisboro is $46,633.
What is the Median Household income in Davisboro?
Median Household Income in Davisboro is $45,647.
What is Inequality or Gini Index in Davisboro?
Inequality or Gini Index in Davisboro is 0.37.
How Large is the Labor Force in Davisboro?
There are 294 People in the Labor Forcein in Davisboro.
What is the Percentage of People in the Labor Force in Davisboro?
15.3% of People are in the Labor Force in Davisboro.
What is the Unemployment Rate in Davisboro?
Unemployment Rate in Davisboro is 4.4%.