Immigrants from Burma/Myanmar vs South American Indian Births to Unmarried Women
COMPARE
Immigrants from Burma/Myanmar
South American Indian
Births to Unmarried Women
Births to Unmarried Women Comparison
Immigrants from Burma/Myanmar
South American Indians
32.9%
BIRTHS TO UNMARRIED WOMEN
16.7/ 100
METRIC RATING
201st/ 347
METRIC RANK
31.7%
BIRTHS TO UNMARRIED WOMEN
47.7/ 100
METRIC RATING
177th/ 347
METRIC RANK
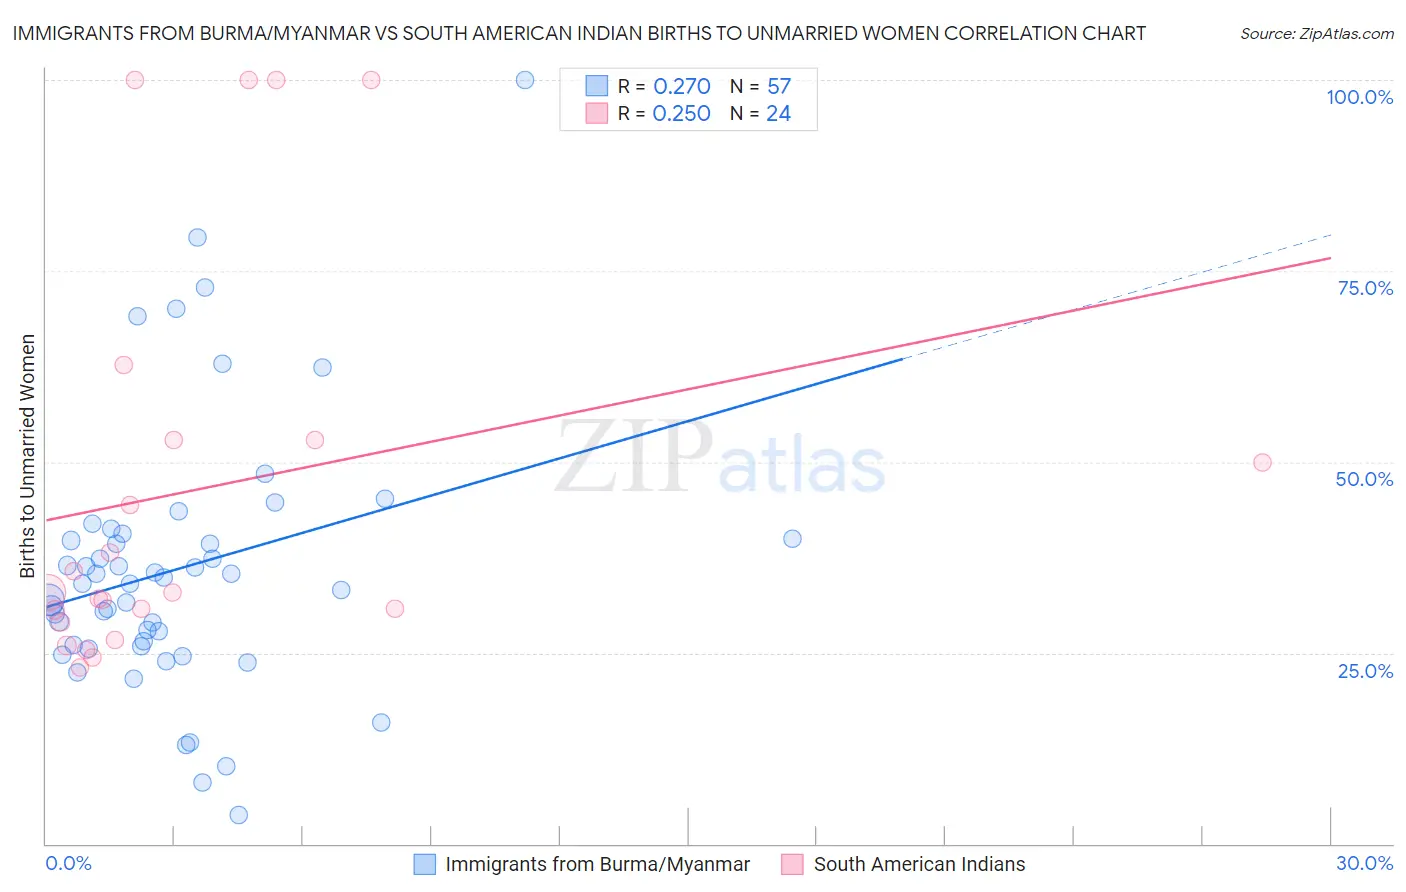
Immigrants from Burma/Myanmar vs South American Indian Births to Unmarried Women Correlation Chart
The statistical analysis conducted on geographies consisting of 166,895,809 people shows a weak positive correlation between the proportion of Immigrants from Burma/Myanmar and percentage of births to unmarried women in the United States with a correlation coefficient (R) of 0.270 and weighted average of 32.9%. Similarly, the statistical analysis conducted on geographies consisting of 159,564,044 people shows a weak positive correlation between the proportion of South American Indians and percentage of births to unmarried women in the United States with a correlation coefficient (R) of 0.250 and weighted average of 31.7%, a difference of 3.6%.
Births to Unmarried Women Correlation Summary
| Measurement | Immigrants from Burma/Myanmar | South American Indian |
| Minimum | 3.8% | 23.0% |
| Maximum | 100.0% | 100.0% |
| Range | 96.2% | 77.0% |
| Mean | 36.0% | 46.4% |
| Median | 34.0% | 32.9% |
| Interquartile 25% (IQ1) | 25.9% | 29.9% |
| Interquartile 75% (IQ3) | 40.3% | 52.9% |
| Interquartile Range (IQR) | 14.4% | 23.0% |
| Standard Deviation (Sample) | 17.5% | 26.5% |
| Standard Deviation (Population) | 17.4% | 25.9% |
Similar Demographics by Births to Unmarried Women
Demographics Similar to Immigrants from Burma/Myanmar by Births to Unmarried Women
In terms of births to unmarried women, the demographic groups most similar to Immigrants from Burma/Myanmar are Immigrants from Micronesia (32.9%, a difference of 0.010%), Immigrants from Germany (32.8%, a difference of 0.33%), Immigrants from Thailand (32.8%, a difference of 0.34%), Ute (33.0%, a difference of 0.39%), and Immigrants from Africa (33.0%, a difference of 0.41%).
| Demographics | Rating | Rank | Births to Unmarried Women |
| Sudanese | 27.3 /100 | #194 | Fair 32.4% |
| Samoans | 21.9 /100 | #195 | Fair 32.6% |
| Immigrants | Colombia | 21.7 /100 | #196 | Fair 32.6% |
| Immigrants | Immigrants | 20.6 /100 | #197 | Fair 32.7% |
| Costa Ricans | 20.3 /100 | #198 | Fair 32.7% |
| Immigrants | Thailand | 18.9 /100 | #199 | Poor 32.8% |
| Immigrants | Germany | 18.8 /100 | #200 | Poor 32.8% |
| Immigrants | Burma/Myanmar | 16.7 /100 | #201 | Poor 32.9% |
| Immigrants | Micronesia | 16.6 /100 | #202 | Poor 32.9% |
| Ute | 14.4 /100 | #203 | Poor 33.0% |
| Immigrants | Africa | 14.3 /100 | #204 | Poor 33.0% |
| German Russians | 13.1 /100 | #205 | Poor 33.1% |
| Uruguayans | 12.8 /100 | #206 | Poor 33.1% |
| Immigrants | Sudan | 11.5 /100 | #207 | Poor 33.2% |
| Hawaiians | 11.3 /100 | #208 | Poor 33.2% |
Demographics Similar to South American Indians by Births to Unmarried Women
In terms of births to unmarried women, the demographic groups most similar to South American Indians are English (31.7%, a difference of 0.030%), Scottish (31.7%, a difference of 0.040%), South American (31.8%, a difference of 0.070%), Immigrants from Venezuela (31.7%, a difference of 0.14%), and Moroccan (31.8%, a difference of 0.18%).
| Demographics | Rating | Rank | Births to Unmarried Women |
| Guamanians/Chamorros | 51.3 /100 | #170 | Average 31.6% |
| Finns | 50.5 /100 | #171 | Average 31.7% |
| Immigrants | Eritrea | 50.4 /100 | #172 | Average 31.7% |
| Immigrants | Yemen | 50.2 /100 | #173 | Average 31.7% |
| Venezuelans | 50.0 /100 | #174 | Average 31.7% |
| Immigrants | Venezuela | 49.2 /100 | #175 | Average 31.7% |
| Scottish | 48.1 /100 | #176 | Average 31.7% |
| South American Indians | 47.7 /100 | #177 | Average 31.7% |
| English | 47.4 /100 | #178 | Average 31.7% |
| South Americans | 46.9 /100 | #179 | Average 31.8% |
| Moroccans | 45.7 /100 | #180 | Average 31.8% |
| Immigrants | Peru | 45.1 /100 | #181 | Average 31.8% |
| Kenyans | 43.0 /100 | #182 | Average 31.9% |
| Canadians | 41.4 /100 | #183 | Average 31.9% |
| Immigrants | South America | 40.7 /100 | #184 | Average 32.0% |