Immigrants from Burma/Myanmar vs Somali Births to Unmarried Women
COMPARE
Immigrants from Burma/Myanmar
Somali
Births to Unmarried Women
Births to Unmarried Women Comparison
Immigrants from Burma/Myanmar
Somalis
32.9%
BIRTHS TO UNMARRIED WOMEN
16.7/ 100
METRIC RATING
201st/ 347
METRIC RANK
30.7%
BIRTHS TO UNMARRIED WOMEN
77.8/ 100
METRIC RATING
150th/ 347
METRIC RANK
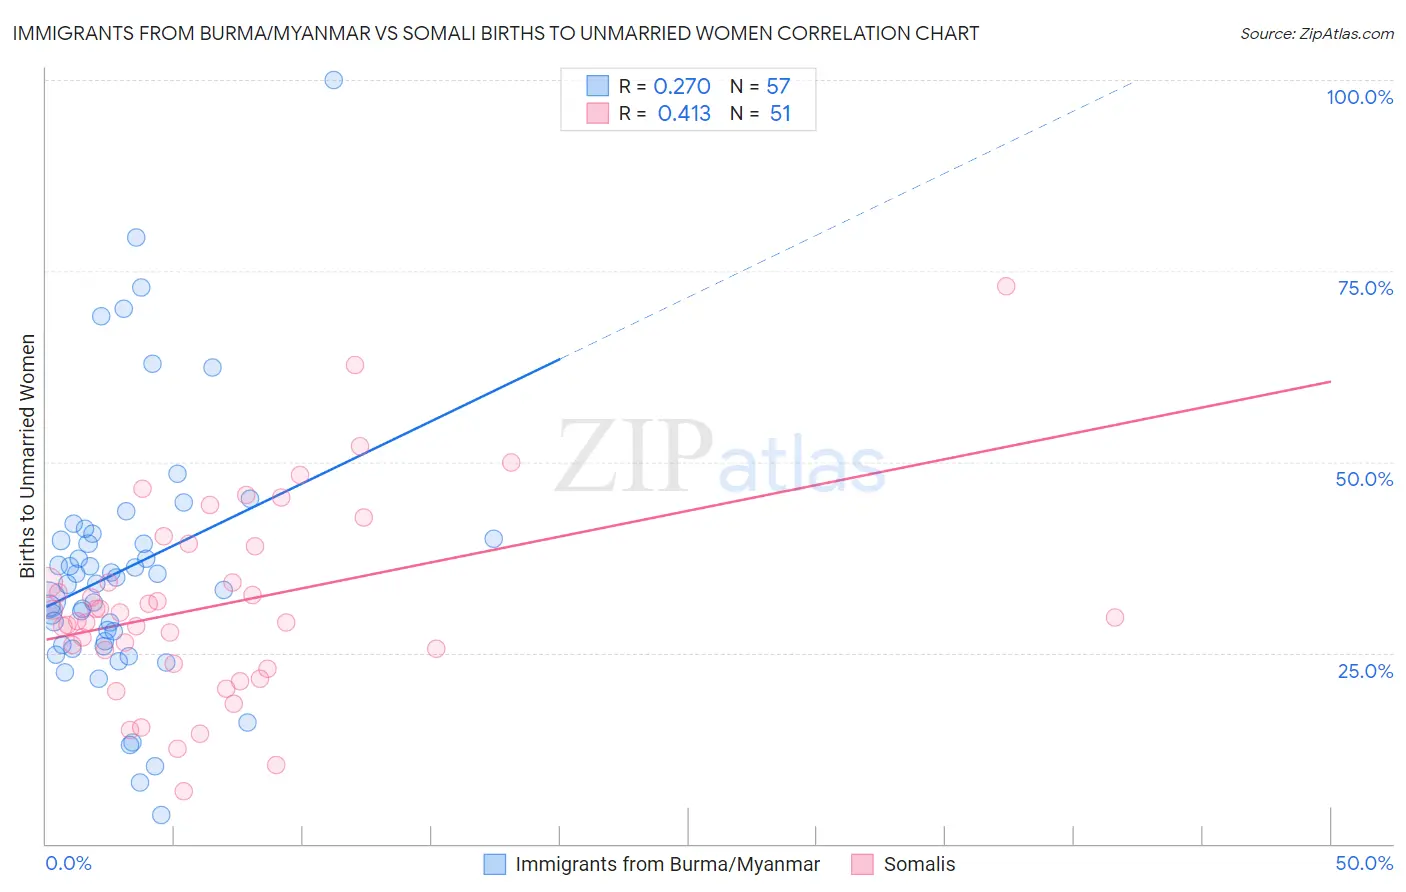
Immigrants from Burma/Myanmar vs Somali Births to Unmarried Women Correlation Chart
The statistical analysis conducted on geographies consisting of 166,895,809 people shows a weak positive correlation between the proportion of Immigrants from Burma/Myanmar and percentage of births to unmarried women in the United States with a correlation coefficient (R) of 0.270 and weighted average of 32.9%. Similarly, the statistical analysis conducted on geographies consisting of 97,449,396 people shows a moderate positive correlation between the proportion of Somalis and percentage of births to unmarried women in the United States with a correlation coefficient (R) of 0.413 and weighted average of 30.7%, a difference of 7.0%.
Births to Unmarried Women Correlation Summary
| Measurement | Immigrants from Burma/Myanmar | Somali |
| Minimum | 3.8% | 6.8% |
| Maximum | 100.0% | 73.0% |
| Range | 96.2% | 66.2% |
| Mean | 36.0% | 31.3% |
| Median | 34.0% | 29.7% |
| Interquartile 25% (IQ1) | 25.9% | 23.6% |
| Interquartile 75% (IQ3) | 40.3% | 39.0% |
| Interquartile Range (IQR) | 14.4% | 15.4% |
| Standard Deviation (Sample) | 17.5% | 12.7% |
| Standard Deviation (Population) | 17.4% | 12.6% |
Similar Demographics by Births to Unmarried Women
Demographics Similar to Immigrants from Burma/Myanmar by Births to Unmarried Women
In terms of births to unmarried women, the demographic groups most similar to Immigrants from Burma/Myanmar are Immigrants from Micronesia (32.9%, a difference of 0.010%), Immigrants from Germany (32.8%, a difference of 0.33%), Immigrants from Thailand (32.8%, a difference of 0.34%), Ute (33.0%, a difference of 0.39%), and Immigrants from Africa (33.0%, a difference of 0.41%).
| Demographics | Rating | Rank | Births to Unmarried Women |
| Sudanese | 27.3 /100 | #194 | Fair 32.4% |
| Samoans | 21.9 /100 | #195 | Fair 32.6% |
| Immigrants | Colombia | 21.7 /100 | #196 | Fair 32.6% |
| Immigrants | Immigrants | 20.6 /100 | #197 | Fair 32.7% |
| Costa Ricans | 20.3 /100 | #198 | Fair 32.7% |
| Immigrants | Thailand | 18.9 /100 | #199 | Poor 32.8% |
| Immigrants | Germany | 18.8 /100 | #200 | Poor 32.8% |
| Immigrants | Burma/Myanmar | 16.7 /100 | #201 | Poor 32.9% |
| Immigrants | Micronesia | 16.6 /100 | #202 | Poor 32.9% |
| Ute | 14.4 /100 | #203 | Poor 33.0% |
| Immigrants | Africa | 14.3 /100 | #204 | Poor 33.0% |
| German Russians | 13.1 /100 | #205 | Poor 33.1% |
| Uruguayans | 12.8 /100 | #206 | Poor 33.1% |
| Immigrants | Sudan | 11.5 /100 | #207 | Poor 33.2% |
| Hawaiians | 11.3 /100 | #208 | Poor 33.2% |
Demographics Similar to Somalis by Births to Unmarried Women
In terms of births to unmarried women, the demographic groups most similar to Somalis are Italian (30.8%, a difference of 0.11%), Serbian (30.7%, a difference of 0.14%), Chilean (30.7%, a difference of 0.19%), Polish (30.8%, a difference of 0.22%), and British (30.8%, a difference of 0.24%).
| Demographics | Rating | Rank | Births to Unmarried Women |
| Immigrants | Uganda | 82.6 /100 | #143 | Excellent 30.5% |
| Czechs | 82.1 /100 | #144 | Excellent 30.5% |
| Immigrants | North America | 81.5 /100 | #145 | Excellent 30.6% |
| Northern Europeans | 81.4 /100 | #146 | Excellent 30.6% |
| Immigrants | Oceania | 81.2 /100 | #147 | Excellent 30.6% |
| Chileans | 79.1 /100 | #148 | Good 30.7% |
| Serbians | 78.8 /100 | #149 | Good 30.7% |
| Somalis | 77.8 /100 | #150 | Good 30.7% |
| Italians | 77.0 /100 | #151 | Good 30.8% |
| Poles | 76.2 /100 | #152 | Good 30.8% |
| British | 76.0 /100 | #153 | Good 30.8% |
| Yugoslavians | 75.1 /100 | #154 | Good 30.8% |
| Immigrants | Bangladesh | 73.9 /100 | #155 | Good 30.9% |
| Carpatho Rusyns | 73.5 /100 | #156 | Good 30.9% |
| Immigrants | Eastern Africa | 72.1 /100 | #157 | Good 31.0% |