Scotch-Irish vs Immigrants from Greece Hearing Disability
COMPARE
Scotch-Irish
Immigrants from Greece
Hearing Disability
Hearing Disability Comparison
Scotch-Irish
Immigrants from Greece
3.8%
HEARING DISABILITY
0.0/ 100
METRIC RATING
309th/ 347
METRIC RANK
3.0%
HEARING DISABILITY
57.9/ 100
METRIC RATING
168th/ 347
METRIC RANK
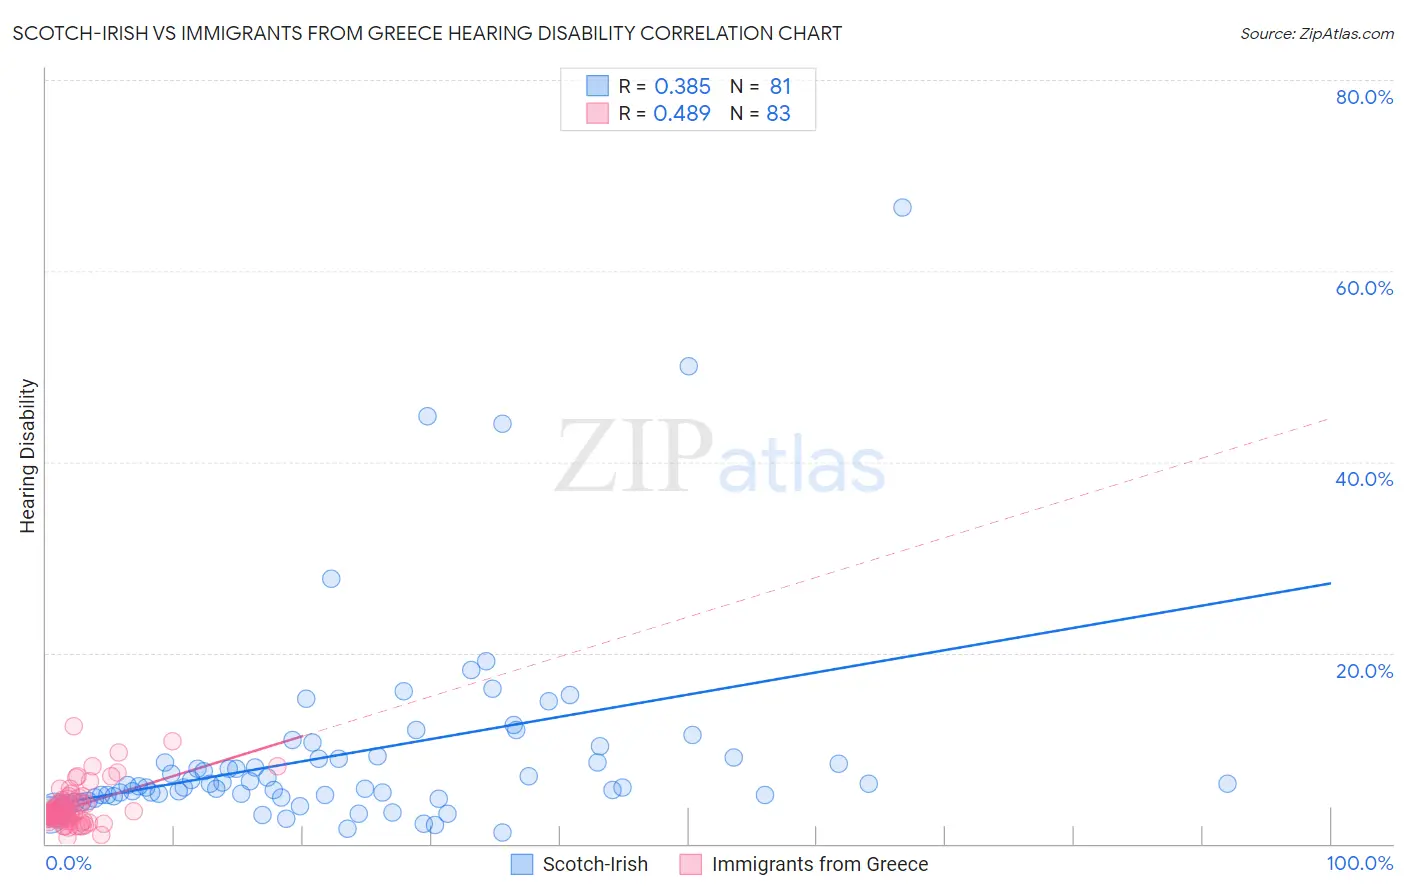
Scotch-Irish vs Immigrants from Greece Hearing Disability Correlation Chart
The statistical analysis conducted on geographies consisting of 548,308,255 people shows a mild positive correlation between the proportion of Scotch-Irish and percentage of population with hearing disability in the United States with a correlation coefficient (R) of 0.385 and weighted average of 3.8%. Similarly, the statistical analysis conducted on geographies consisting of 216,842,518 people shows a moderate positive correlation between the proportion of Immigrants from Greece and percentage of population with hearing disability in the United States with a correlation coefficient (R) of 0.489 and weighted average of 3.0%, a difference of 28.9%.
Hearing Disability Correlation Summary
| Measurement | Scotch-Irish | Immigrants from Greece |
| Minimum | 1.2% | 0.70% |
| Maximum | 66.7% | 12.3% |
| Range | 65.5% | 11.6% |
| Mean | 9.5% | 3.8% |
| Median | 6.1% | 3.2% |
| Interquartile 25% (IQ1) | 4.9% | 2.8% |
| Interquartile 75% (IQ3) | 9.1% | 4.3% |
| Interquartile Range (IQR) | 4.2% | 1.5% |
| Standard Deviation (Sample) | 10.8% | 2.1% |
| Standard Deviation (Population) | 10.7% | 2.0% |
Similar Demographics by Hearing Disability
Demographics Similar to Scotch-Irish by Hearing Disability
In terms of hearing disability, the demographic groups most similar to Scotch-Irish are Ottawa (3.8%, a difference of 0.080%), Cree (3.8%, a difference of 0.31%), French Canadian (3.8%, a difference of 0.52%), Marshallese (3.8%, a difference of 0.64%), and English (3.8%, a difference of 1.5%).
| Demographics | Rating | Rank | Hearing Disability |
| Dutch | 0.0 /100 | #302 | Tragic 3.7% |
| Menominee | 0.0 /100 | #303 | Tragic 3.7% |
| French | 0.0 /100 | #304 | Tragic 3.8% |
| English | 0.0 /100 | #305 | Tragic 3.8% |
| Marshallese | 0.0 /100 | #306 | Tragic 3.8% |
| French Canadians | 0.0 /100 | #307 | Tragic 3.8% |
| Ottawa | 0.0 /100 | #308 | Tragic 3.8% |
| Scotch-Irish | 0.0 /100 | #309 | Tragic 3.8% |
| Cree | 0.0 /100 | #310 | Tragic 3.8% |
| Americans | 0.0 /100 | #311 | Tragic 3.9% |
| Cajuns | 0.0 /100 | #312 | Tragic 3.9% |
| Hopi | 0.0 /100 | #313 | Tragic 3.9% |
| Yakama | 0.0 /100 | #314 | Tragic 3.9% |
| Puget Sound Salish | 0.0 /100 | #315 | Tragic 3.9% |
| Spanish Americans | 0.0 /100 | #316 | Tragic 4.0% |
Demographics Similar to Immigrants from Greece by Hearing Disability
In terms of hearing disability, the demographic groups most similar to Immigrants from Greece are Immigrants from Eastern Europe (3.0%, a difference of 0.020%), Arab (3.0%, a difference of 0.030%), Immigrants from Cabo Verde (3.0%, a difference of 0.10%), Immigrants from Ukraine (3.0%, a difference of 0.12%), and Armenian (3.0%, a difference of 0.18%).
| Demographics | Rating | Rank | Hearing Disability |
| Albanians | 66.6 /100 | #161 | Good 2.9% |
| Immigrants | Japan | 66.3 /100 | #162 | Good 2.9% |
| Immigrants | Central America | 64.9 /100 | #163 | Good 3.0% |
| Immigrants | Cambodia | 64.8 /100 | #164 | Good 3.0% |
| Immigrants | Zimbabwe | 64.2 /100 | #165 | Good 3.0% |
| Immigrants | South Eastern Asia | 62.9 /100 | #166 | Good 3.0% |
| Immigrants | Eastern Europe | 58.1 /100 | #167 | Average 3.0% |
| Immigrants | Greece | 57.9 /100 | #168 | Average 3.0% |
| Arabs | 57.6 /100 | #169 | Average 3.0% |
| Immigrants | Cabo Verde | 56.9 /100 | #170 | Average 3.0% |
| Immigrants | Ukraine | 56.6 /100 | #171 | Average 3.0% |
| Armenians | 56.0 /100 | #172 | Average 3.0% |
| Immigrants | Serbia | 51.1 /100 | #173 | Average 3.0% |
| Indonesians | 50.0 /100 | #174 | Average 3.0% |
| Immigrants | Romania | 48.4 /100 | #175 | Average 3.0% |