Cashmere, WA
Cashmere Map
Cashmere Overview
3,244
TOTAL POPULATION
1,551
MALE POPULATION
1,693
FEMALE POPULATION
91.61
MALES / 100 FEMALES
109.16
FEMALES / 100 MALES
43.8
MEDIAN AGE
3.4
AVG FAMILY SIZE
2.7
AVG HOUSEHOLD SIZE
$29,672
PER CAPITA INCOME
$68,255
AVG FAMILY INCOME
$60,597
AVG HOUSEHOLD INCOME
21.9%
WAGE / INCOME GAP [ % ]
78.1¢/ $1
WAGE / INCOME GAP [ $ ]
0.44
INEQUALITY / GINI INDEX
1,474
LABOR FORCE [ PEOPLE ]
56.8%
PERCENT IN LABOR FORCE
1.1%
UNEMPLOYMENT RATE
Cashmere Zip Codes
Cashmere Area Codes
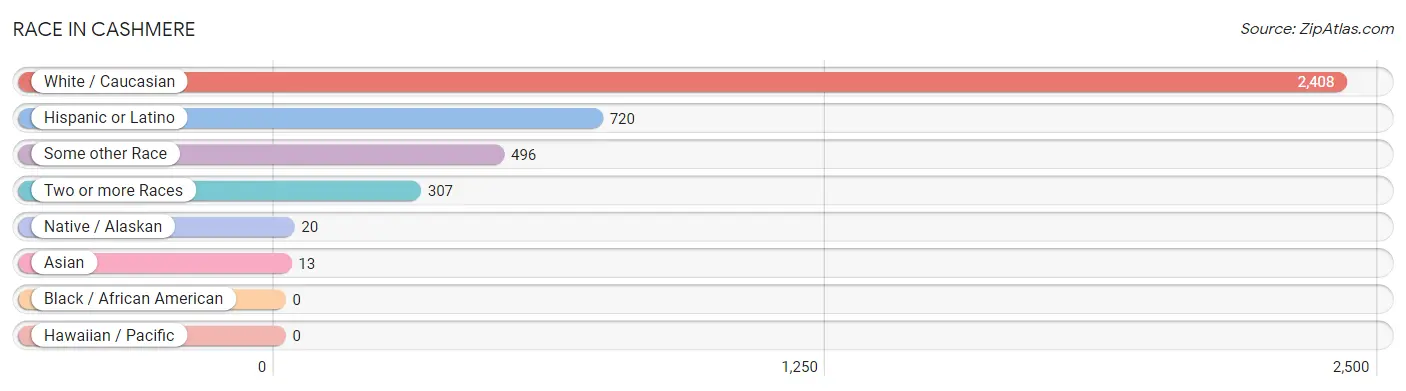
Race in Cashmere
The most populous races in Cashmere are White / Caucasian (2,408 | 74.2%), Hispanic or Latino (720 | 22.2%), and Some other Race (496 | 15.3%).
| Race | # Population | % Population |
| Asian | 13 | 0.4% |
| Black / African American | 0 | 0.0% |
| Hawaiian / Pacific | 0 | 0.0% |
| Hispanic or Latino | 720 | 22.2% |
| Native / Alaskan | 20 | 0.6% |
| White / Caucasian | 2,408 | 74.2% |
| Two or more Races | 307 | 9.5% |
| Some other Race | 496 | 15.3% |
| Total | 3,244 | 100.0% |
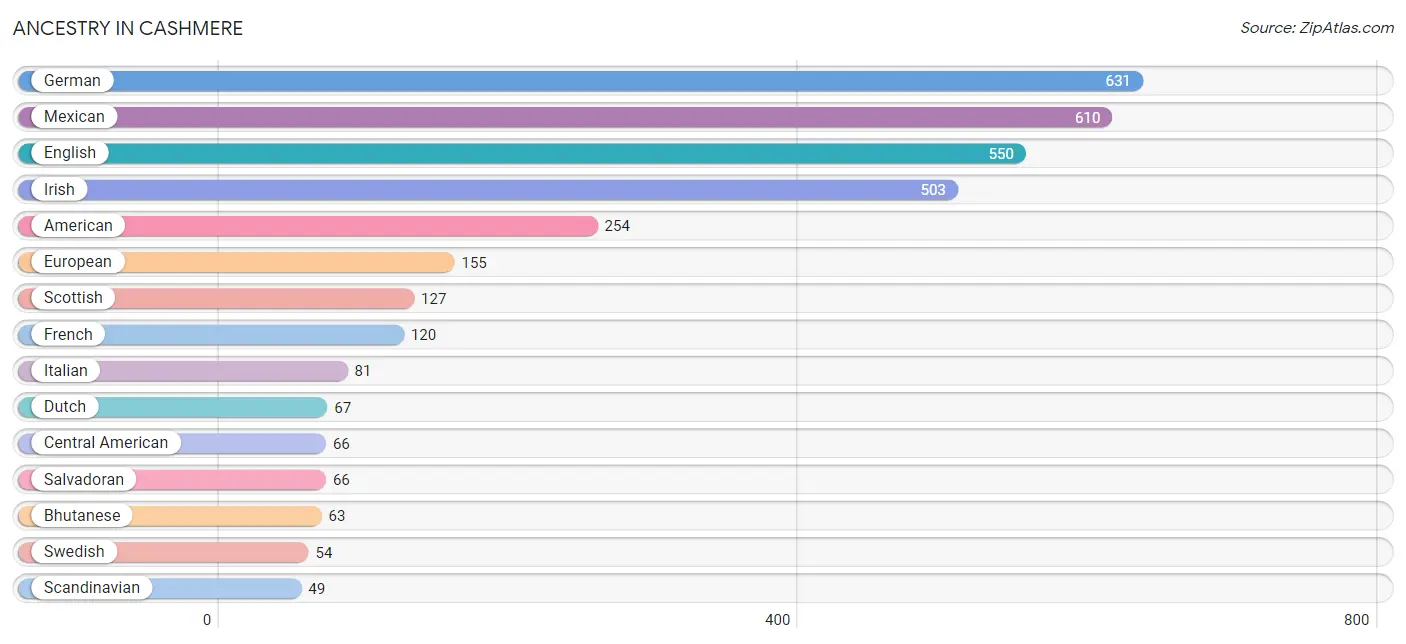
Ancestry in Cashmere
The most populous ancestries reported in Cashmere are German (631 | 19.5%), Mexican (610 | 18.8%), English (550 | 17.0%), Irish (503 | 15.5%), and American (254 | 7.8%), together accounting for 78.5% of all Cashmere residents.
| Ancestry | # Population | % Population |
| American | 254 | 7.8% |
| Austrian | 16 | 0.5% |
| Bhutanese | 63 | 1.9% |
| British | 13 | 0.4% |
| Burmese | 3 | 0.1% |
| Central American | 66 | 2.0% |
| Chippewa | 5 | 0.2% |
| Cree | 7 | 0.2% |
| Czech | 23 | 0.7% |
| Dutch | 67 | 2.1% |
| English | 550 | 17.0% |
| European | 155 | 4.8% |
| Finnish | 8 | 0.3% |
| French | 120 | 3.7% |
| French Canadian | 7 | 0.2% |
| German | 631 | 19.5% |
| Guamanian / Chamorro | 24 | 0.7% |
| Indian (Asian) | 24 | 0.7% |
| Irish | 503 | 15.5% |
| Italian | 81 | 2.5% |
| Mexican | 610 | 18.8% |
| Native Hawaiian | 24 | 0.7% |
| Northern European | 10 | 0.3% |
| Norwegian | 20 | 0.6% |
| Peruvian | 3 | 0.1% |
| Polish | 12 | 0.4% |
| Puerto Rican | 26 | 0.8% |
| Romanian | 3 | 0.1% |
| Russian | 11 | 0.3% |
| Salvadoran | 66 | 2.0% |
| Scandinavian | 49 | 1.5% |
| Scotch-Irish | 18 | 0.5% |
| Scottish | 127 | 3.9% |
| South American | 3 | 0.1% |
| Spaniard | 15 | 0.5% |
| Sri Lankan | 10 | 0.3% |
| Swedish | 54 | 1.7% |
| Swiss | 11 | 0.3% | View All 38 Rows |
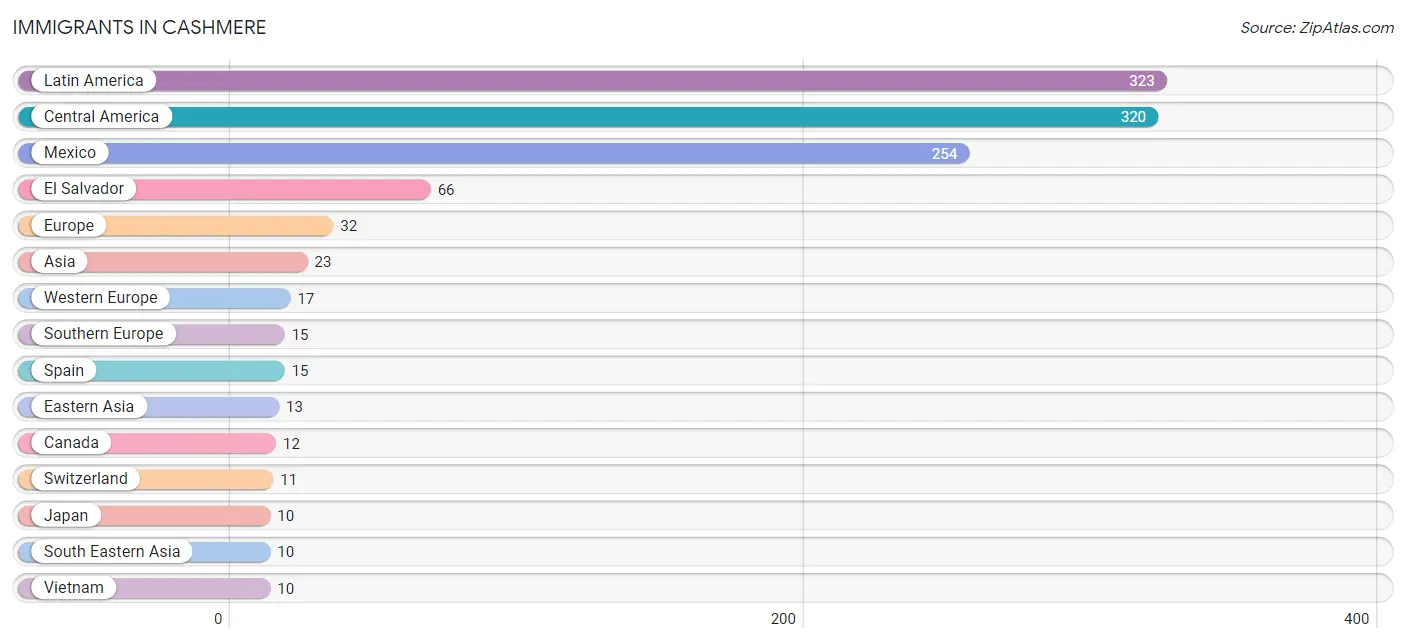
Immigrants in Cashmere
The most numerous immigrant groups reported in Cashmere came from Latin America (323 | 10.0%), Central America (320 | 9.9%), Mexico (254 | 7.8%), El Salvador (66 | 2.0%), and Europe (32 | 1.0%), together accounting for 30.7% of all Cashmere residents.
| Immigration Origin | # Population | % Population |
| Asia | 23 | 0.7% |
| Canada | 12 | 0.4% |
| Central America | 320 | 9.9% |
| Eastern Asia | 13 | 0.4% |
| El Salvador | 66 | 2.0% |
| Europe | 32 | 1.0% |
| Germany | 6 | 0.2% |
| Japan | 10 | 0.3% |
| Korea | 3 | 0.1% |
| Latin America | 323 | 10.0% |
| Mexico | 254 | 7.8% |
| Peru | 3 | 0.1% |
| South America | 3 | 0.1% |
| South Eastern Asia | 10 | 0.3% |
| Southern Europe | 15 | 0.5% |
| Spain | 15 | 0.5% |
| Switzerland | 11 | 0.3% |
| Vietnam | 10 | 0.3% |
| Western Europe | 17 | 0.5% | View All 19 Rows |
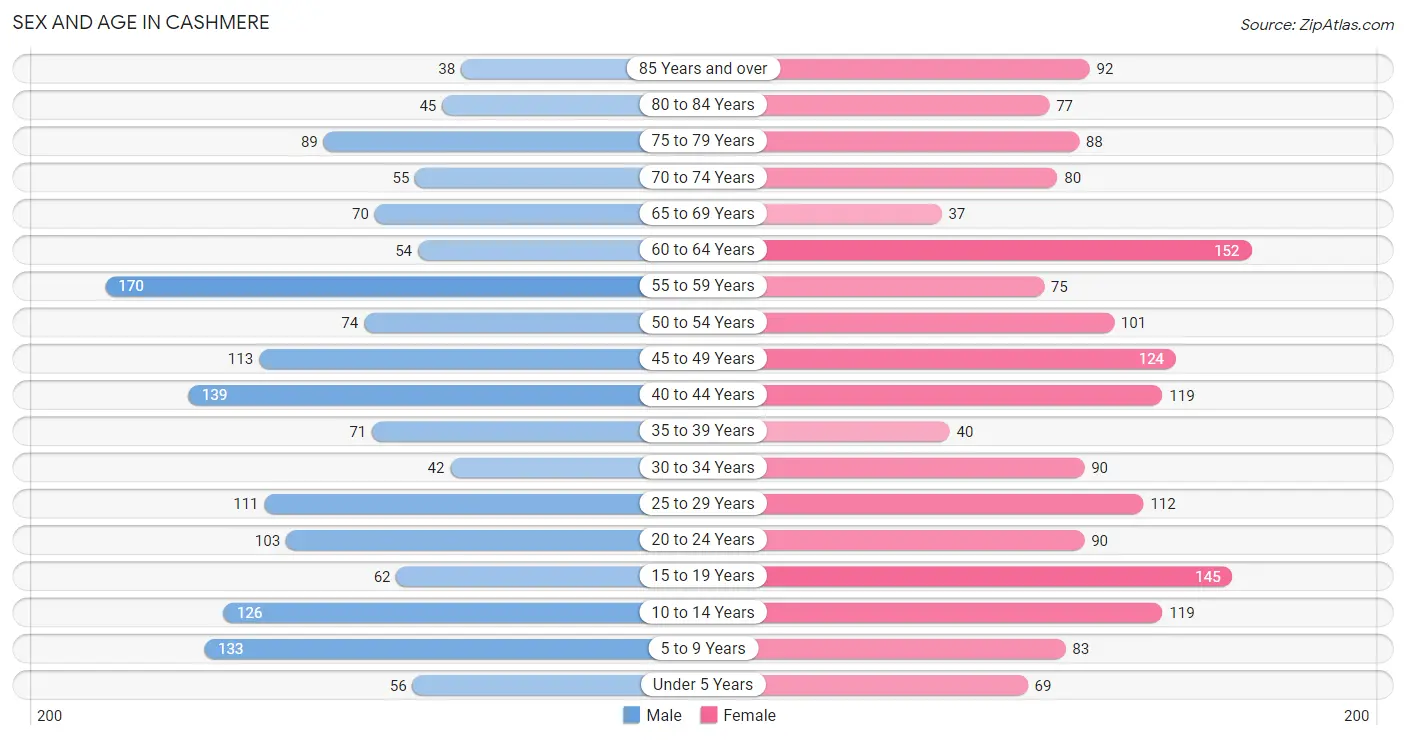
Sex and Age in Cashmere
Sex and Age in Cashmere
The most populous age groups in Cashmere are 55 to 59 Years (170 | 11.0%) for men and 60 to 64 Years (152 | 9.0%) for women.
| Age Bracket | Male | Female |
| Under 5 Years | 56 (3.6%) | 69 (4.1%) |
| 5 to 9 Years | 133 (8.6%) | 83 (4.9%) |
| 10 to 14 Years | 126 (8.1%) | 119 (7.0%) |
| 15 to 19 Years | 62 (4.0%) | 145 (8.6%) |
| 20 to 24 Years | 103 (6.6%) | 90 (5.3%) |
| 25 to 29 Years | 111 (7.2%) | 112 (6.6%) |
| 30 to 34 Years | 42 (2.7%) | 90 (5.3%) |
| 35 to 39 Years | 71 (4.6%) | 40 (2.4%) |
| 40 to 44 Years | 139 (9.0%) | 119 (7.0%) |
| 45 to 49 Years | 113 (7.3%) | 124 (7.3%) |
| 50 to 54 Years | 74 (4.8%) | 101 (6.0%) |
| 55 to 59 Years | 170 (11.0%) | 75 (4.4%) |
| 60 to 64 Years | 54 (3.5%) | 152 (9.0%) |
| 65 to 69 Years | 70 (4.5%) | 37 (2.2%) |
| 70 to 74 Years | 55 (3.5%) | 80 (4.7%) |
| 75 to 79 Years | 89 (5.7%) | 88 (5.2%) |
| 80 to 84 Years | 45 (2.9%) | 77 (4.5%) |
| 85 Years and over | 38 (2.5%) | 92 (5.4%) |
| Total | 1,551 (100.0%) | 1,693 (100.0%) |
Families and Households in Cashmere
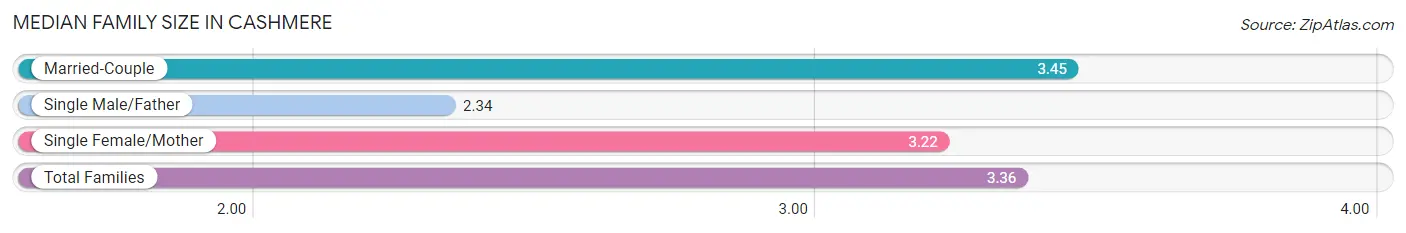
Median Family Size in Cashmere
The median family size in Cashmere is 3.36 persons per family, with married-couple families (557 | 73.9%) accounting for the largest median family size of 3.45 persons per family. On the other hand, single male/father families (29 | 3.8%) represent the smallest median family size with 2.34 persons per family.
| Family Type | # Families | Family Size |
| Married-Couple | 557 (73.9%) | 3.45 |
| Single Male/Father | 29 (3.8%) | 2.34 |
| Single Female/Mother | 168 (22.3%) | 3.22 |
| Total Families | 754 (100.0%) | 3.36 |
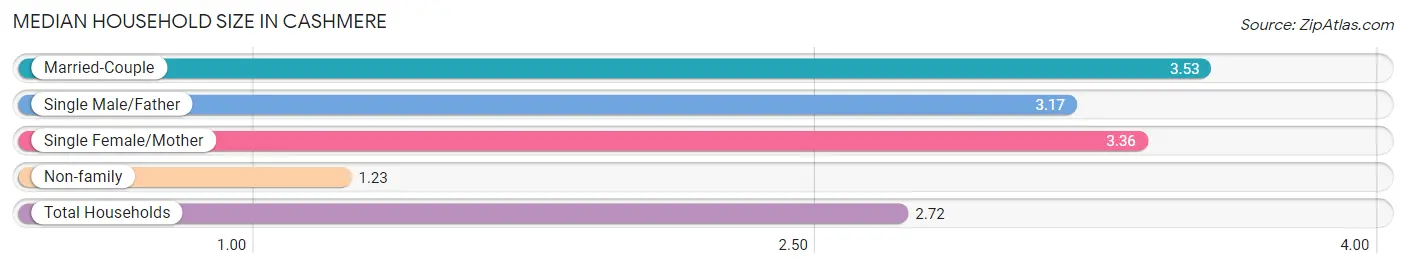
Median Household Size in Cashmere
The median household size in Cashmere is 2.72 persons per household, with married-couple households (557 | 48.9%) accounting for the largest median household size of 3.53 persons per household. non-family households (385 | 33.8%) represent the smallest median household size with 1.23 persons per household.
| Household Type | # Households | Household Size |
| Married-Couple | 557 (48.9%) | 3.53 |
| Single Male/Father | 29 (2.5%) | 3.17 |
| Single Female/Mother | 168 (14.7%) | 3.36 |
| Non-family | 385 (33.8%) | 1.23 |
| Total Households | 1,139 (100.0%) | 2.72 |
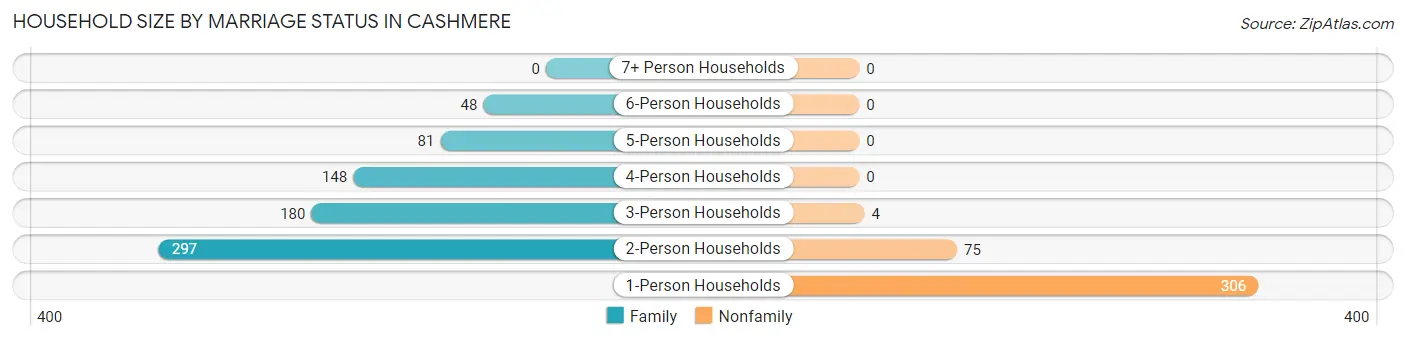
Household Size by Marriage Status in Cashmere
Out of a total of 1,139 households in Cashmere, 754 (66.2%) are family households, while 385 (33.8%) are nonfamily households. The most numerous type of family households are 2-person households, comprising 297, and the most common type of nonfamily households are 1-person households, comprising 306.
| Household Size | Family Households | Nonfamily Households |
| 1-Person Households | - | 306 (26.9%) |
| 2-Person Households | 297 (26.1%) | 75 (6.6%) |
| 3-Person Households | 180 (15.8%) | 4 (0.4%) |
| 4-Person Households | 148 (13.0%) | 0 (0.0%) |
| 5-Person Households | 81 (7.1%) | 0 (0.0%) |
| 6-Person Households | 48 (4.2%) | 0 (0.0%) |
| 7+ Person Households | 0 (0.0%) | 0 (0.0%) |
| Total | 754 (66.2%) | 385 (33.8%) |
Female Fertility in Cashmere
Fertility by Age in Cashmere
Average fertility rate in Cashmere is 5.0 births per 1,000 women. Women in the age bracket of 20 to 34 years have the highest fertility rate with 14.0 births per 1,000 women. Women in the age bracket of 20 to 34 years acount for 100.0% of all women with births.
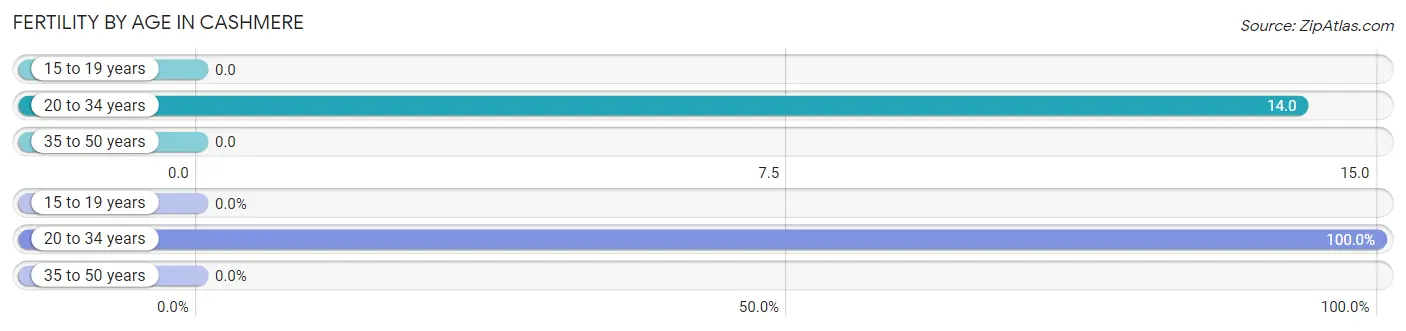
| Age Bracket | Women with Births | Births / 1,000 Women |
| 15 to 19 years | 0 (0.0%) | 0.0 |
| 20 to 34 years | 4 (100.0%) | 14.0 |
| 35 to 50 years | 0 (0.0%) | 0.0 |
| Total | 4 (100.0%) | 5.0 |
Fertility by Age by Marriage Status in Cashmere
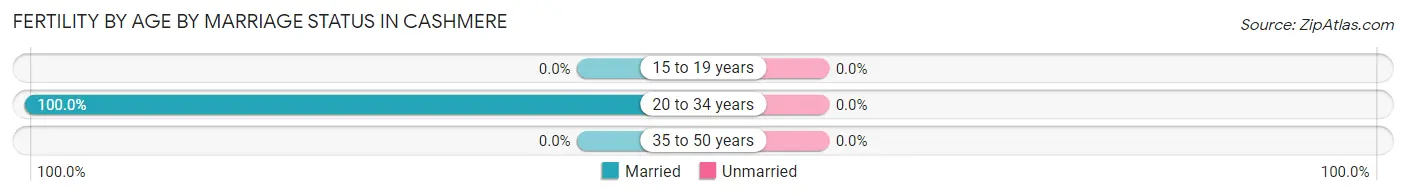
| Age Bracket | Married | Unmarried |
| 15 to 19 years | 0 (0.0%) | 0 (0.0%) |
| 20 to 34 years | 4 (100.0%) | 0 (0.0%) |
| 35 to 50 years | 0 (0.0%) | 0 (0.0%) |
| Total | 4 (100.0%) | 0 (0.0%) |
Fertility by Education in Cashmere
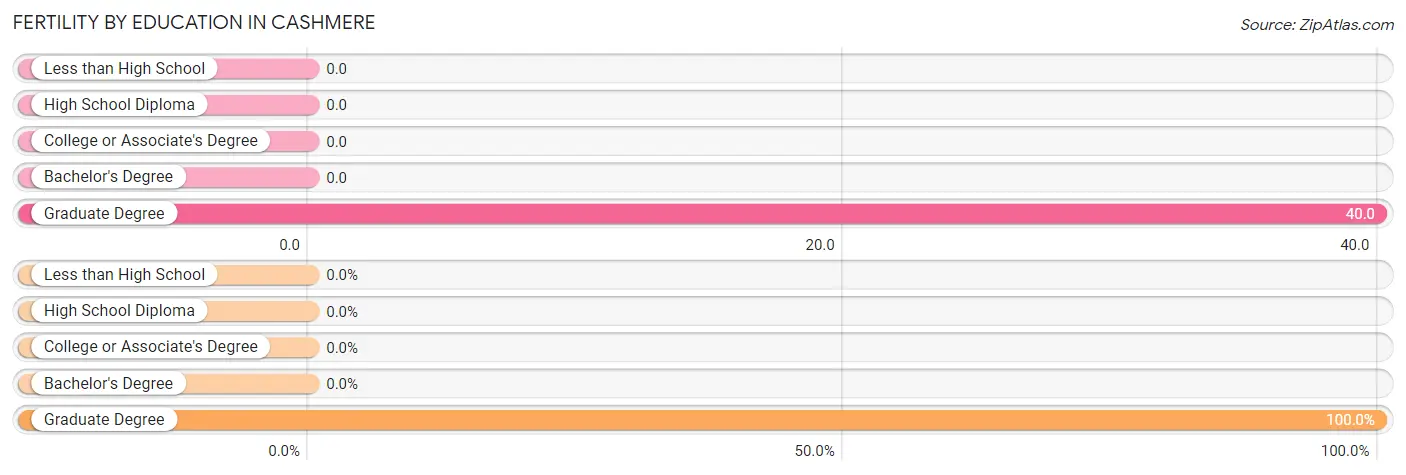
| Educational Attainment | Women with Births | Births / 1,000 Women |
| Less than High School | 0 (0.0%) | 0.0 |
| High School Diploma | 0 (0.0%) | 0.0 |
| College or Associate's Degree | 0 (0.0%) | 0.0 |
| Bachelor's Degree | 0 (0.0%) | 0.0 |
| Graduate Degree | 4 (100.0%) | 40.0 |
| Total | 4 (100.0%) | 5.0 |
Fertility by Education by Marriage Status in Cashmere
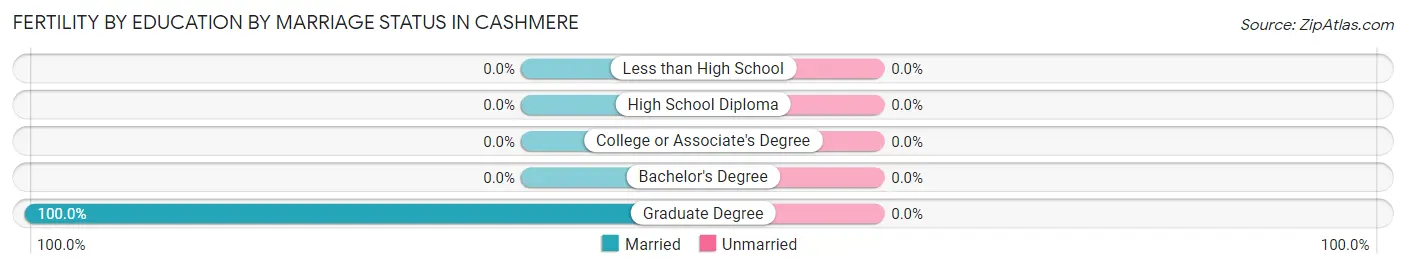
| Educational Attainment | Married | Unmarried |
| Less than High School | 0 (0.0%) | 0 (0.0%) |
| High School Diploma | 0 (0.0%) | 0 (0.0%) |
| College or Associate's Degree | 0 (0.0%) | 0 (0.0%) |
| Bachelor's Degree | 0 (0.0%) | 0 (0.0%) |
| Graduate Degree | 4 (100.0%) | 0 (0.0%) |
| Total | 4 (100.0%) | 0 (0.0%) |
Income in Cashmere
Income Overview in Cashmere
Per Capita Income in Cashmere is $29,672, while median incomes of families and households are $68,255 and $60,597 respectively.
| Characteristic | Number | Measure |
| Per Capita Income | 3,244 | $29,672 |
| Median Family Income | 754 | $68,255 |
| Mean Family Income | 754 | $94,949 |
| Median Household Income | 1,139 | $60,597 |
| Mean Household Income | 1,139 | $80,547 |
| Income Deficit | 754 | $0 |
| Wage / Income Gap (%) | 3,244 | 21.87% |
| Wage / Income Gap ($) | 3,244 | 78.13¢ per $1 |
| Gini / Inequality Index | 3,244 | 0.44 |
Earnings by Sex in Cashmere
Average Earnings in Cashmere are $33,750, $28,458 for men and $36,423 for women, a difference of 21.9%.
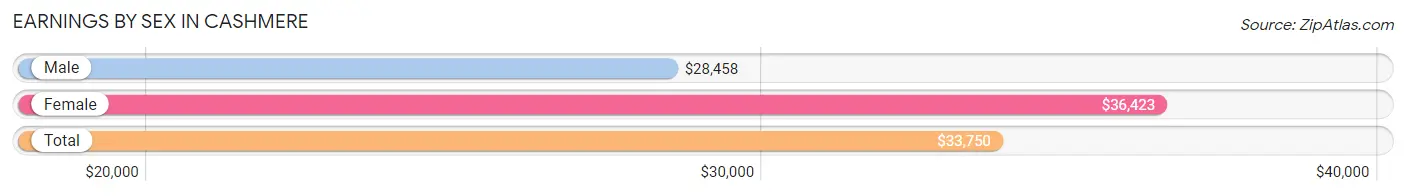
| Sex | Number | Average Earnings |
| Male | 908 (56.4%) | $28,458 |
| Female | 702 (43.6%) | $36,423 |
| Total | 1,610 (100.0%) | $33,750 |
Earnings by Sex by Income Bracket in Cashmere
The most common earnings brackets in Cashmere are $100,000+ for men (146 | 16.1%) and $75,000 to $99,999 for women (85 | 12.1%).
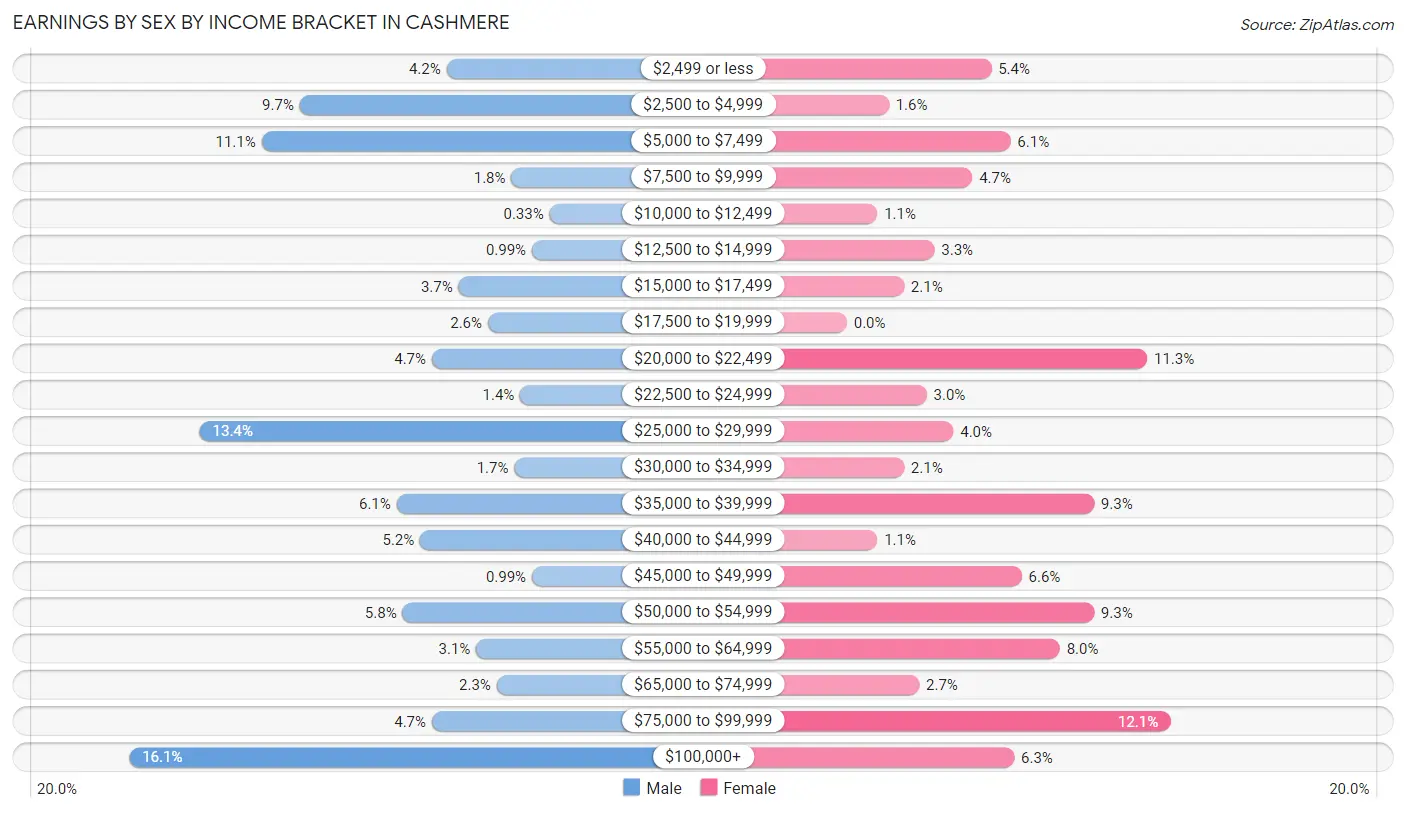
| Income | Male | Female |
| $2,499 or less | 38 (4.2%) | 38 (5.4%) |
| $2,500 to $4,999 | 88 (9.7%) | 11 (1.6%) |
| $5,000 to $7,499 | 101 (11.1%) | 43 (6.1%) |
| $7,500 to $9,999 | 16 (1.8%) | 33 (4.7%) |
| $10,000 to $12,499 | 3 (0.3%) | 8 (1.1%) |
| $12,500 to $14,999 | 9 (1.0%) | 23 (3.3%) |
| $15,000 to $17,499 | 34 (3.7%) | 15 (2.1%) |
| $17,500 to $19,999 | 24 (2.6%) | 0 (0.0%) |
| $20,000 to $22,499 | 43 (4.7%) | 79 (11.3%) |
| $22,500 to $24,999 | 13 (1.4%) | 21 (3.0%) |
| $25,000 to $29,999 | 122 (13.4%) | 28 (4.0%) |
| $30,000 to $34,999 | 15 (1.7%) | 15 (2.1%) |
| $35,000 to $39,999 | 55 (6.1%) | 65 (9.3%) |
| $40,000 to $44,999 | 47 (5.2%) | 8 (1.1%) |
| $45,000 to $49,999 | 9 (1.0%) | 46 (6.6%) |
| $50,000 to $54,999 | 53 (5.8%) | 65 (9.3%) |
| $55,000 to $64,999 | 28 (3.1%) | 56 (8.0%) |
| $65,000 to $74,999 | 21 (2.3%) | 19 (2.7%) |
| $75,000 to $99,999 | 43 (4.7%) | 85 (12.1%) |
| $100,000+ | 146 (16.1%) | 44 (6.3%) |
| Total | 908 (100.0%) | 702 (100.0%) |
Earnings by Sex by Educational Attainment in Cashmere
Average earnings in Cashmere are $35,968 for men and $46,667 for women, a difference of 22.9%. Men with an educational attainment of bachelor's degree enjoy the highest average annual earnings of $110,114, while those with less than high school education earn the least with $25,968. Women with an educational attainment of graduate degree earn the most with the average annual earnings of $91,250, while those with less than high school education have the smallest earnings of $21,637.
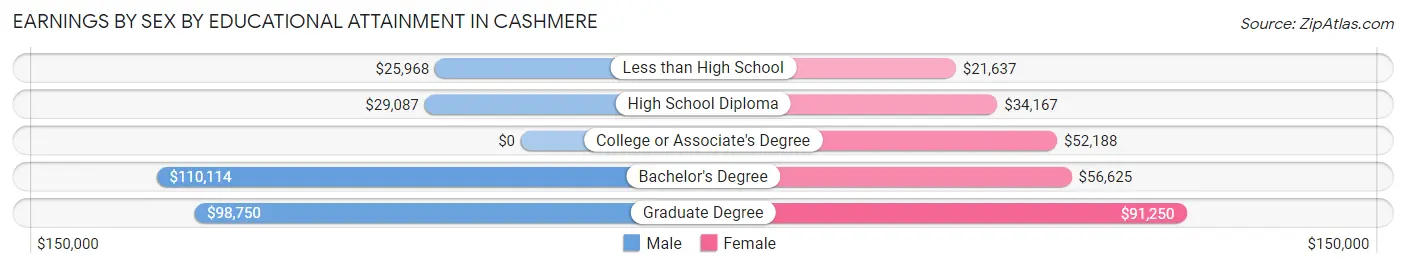
| Educational Attainment | Male Income | Female Income |
| Less than High School | $25,968 | $21,637 |
| High School Diploma | $29,087 | $34,167 |
| College or Associate's Degree | - | - |
| Bachelor's Degree | $110,114 | $56,625 |
| Graduate Degree | $98,750 | $91,250 |
| Total | $35,968 | $46,667 |
Family Income in Cashmere
Family Income Brackets in Cashmere
According to the Cashmere family income data, there are 237 families falling into the $50,000 to $74,999 income range, which is the most common income bracket and makes up 31.4% of all families. Conversely, the $15,000 to $24,999 income bracket is the least frequent group with only 5 families (0.7%) belonging to this category.
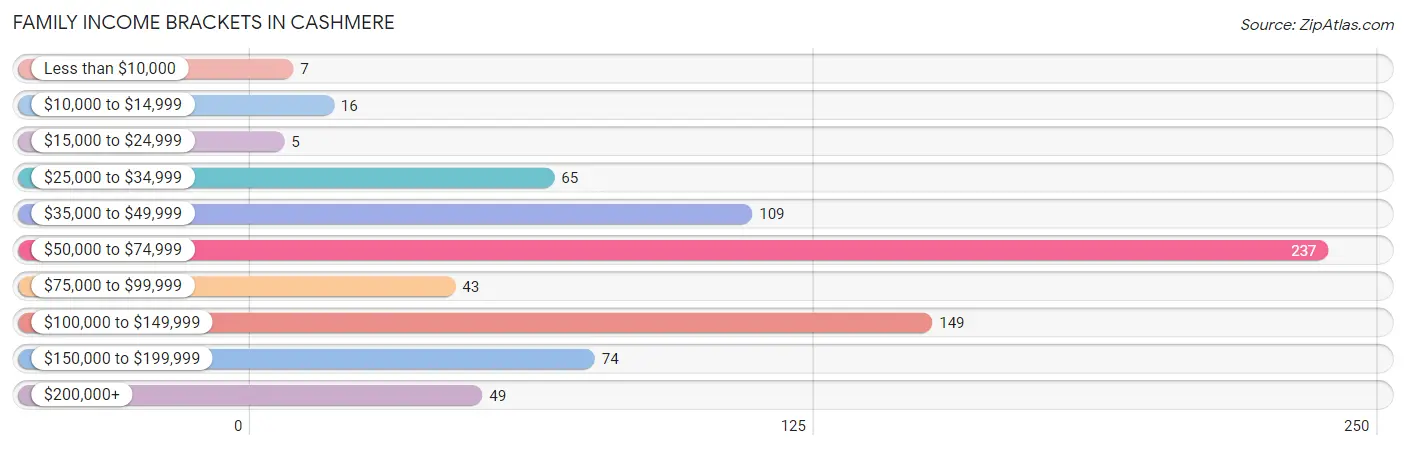
| Income Bracket | # Families | % Families |
| Less than $10,000 | 7 | 0.9% |
| $10,000 to $14,999 | 16 | 2.1% |
| $15,000 to $24,999 | 5 | 0.7% |
| $25,000 to $34,999 | 65 | 8.6% |
| $35,000 to $49,999 | 109 | 14.5% |
| $50,000 to $74,999 | 237 | 31.4% |
| $75,000 to $99,999 | 43 | 5.7% |
| $100,000 to $149,999 | 149 | 19.8% |
| $150,000 to $199,999 | 74 | 9.8% |
| $200,000+ | 49 | 6.5% |
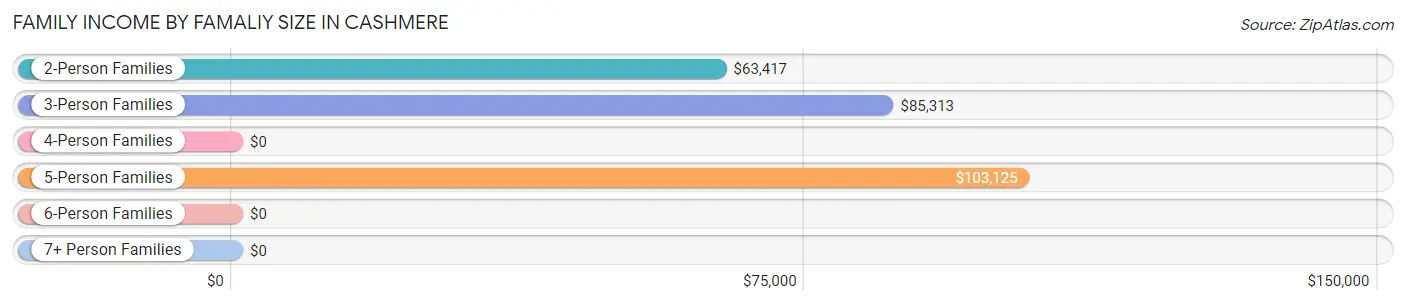
Family Income by Famaliy Size in Cashmere
5-person families (63 | 8.4%) account for the highest median family income in Cashmere with $103,125 per family, while 2-person families (309 | 41.0%) have the highest median income of $31,708 per family member.
| Income Bracket | # Families | Median Income |
| 2-Person Families | 309 (41.0%) | $63,417 |
| 3-Person Families | 185 (24.5%) | $85,313 |
| 4-Person Families | 165 (21.9%) | $0 |
| 5-Person Families | 63 (8.4%) | $103,125 |
| 6-Person Families | 32 (4.2%) | $0 |
| 7+ Person Families | 0 (0.0%) | $0 |
| Total | 754 (100.0%) | $68,255 |
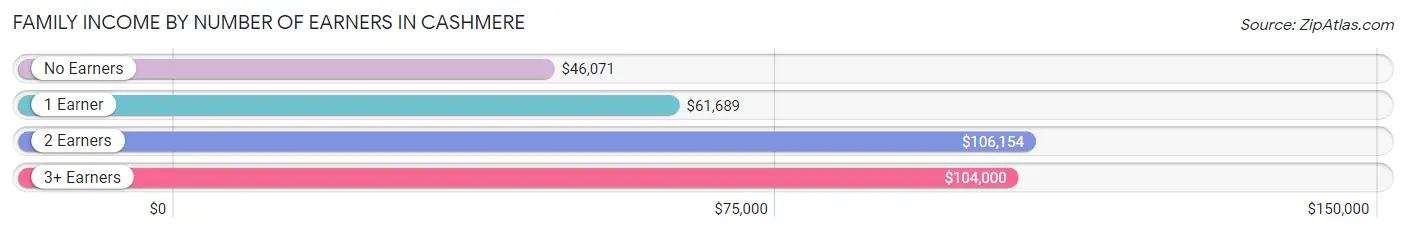
Family Income by Number of Earners in Cashmere
The median family income in Cashmere is $68,255, with families comprising 2 earners (288) having the highest median family income of $106,154, while families with no earners (64) have the lowest median family income of $46,071, accounting for 38.2% and 8.5% of families, respectively.
| Number of Earners | # Families | Median Income |
| No Earners | 64 (8.5%) | $46,071 |
| 1 Earner | 312 (41.4%) | $61,689 |
| 2 Earners | 288 (38.2%) | $106,154 |
| 3+ Earners | 90 (11.9%) | $104,000 |
| Total | 754 (100.0%) | $68,255 |
Household Income in Cashmere
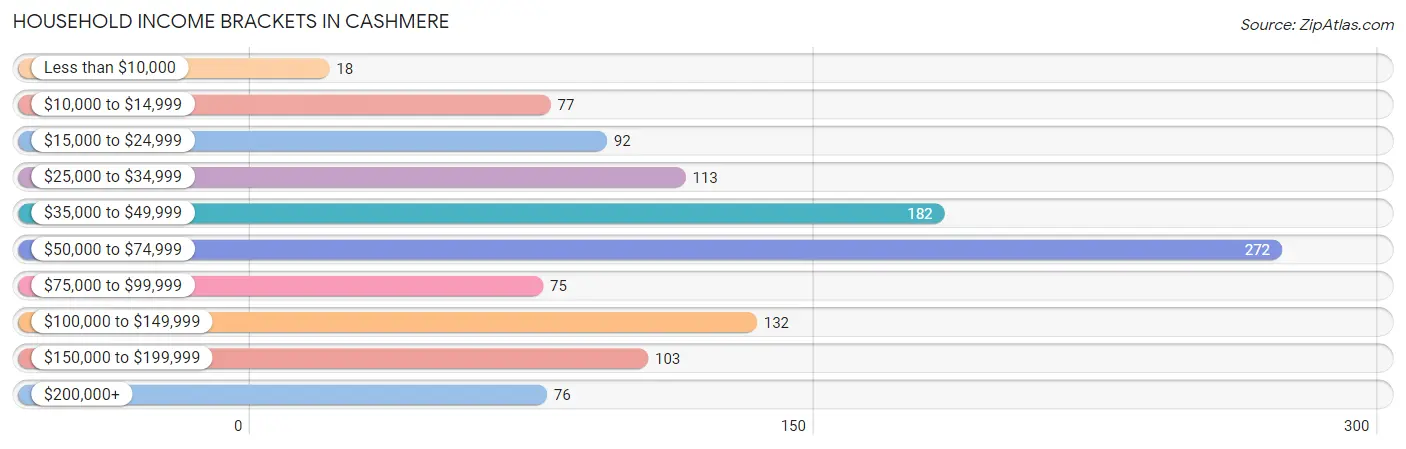
Household Income Brackets in Cashmere
With 272 households falling in the category, the $50,000 to $74,999 income range is the most frequent in Cashmere, accounting for 23.9% of all households. In contrast, only 18 households (1.6%) fall into the less than $10,000 income bracket, making it the least populous group.
| Income Bracket | # Households | % Households |
| Less than $10,000 | 18 | 1.6% |
| $10,000 to $14,999 | 77 | 6.8% |
| $15,000 to $24,999 | 92 | 8.1% |
| $25,000 to $34,999 | 113 | 9.9% |
| $35,000 to $49,999 | 182 | 16.0% |
| $50,000 to $74,999 | 272 | 23.9% |
| $75,000 to $99,999 | 75 | 6.6% |
| $100,000 to $149,999 | 132 | 11.6% |
| $150,000 to $199,999 | 103 | 9.0% |
| $200,000+ | 76 | 6.7% |
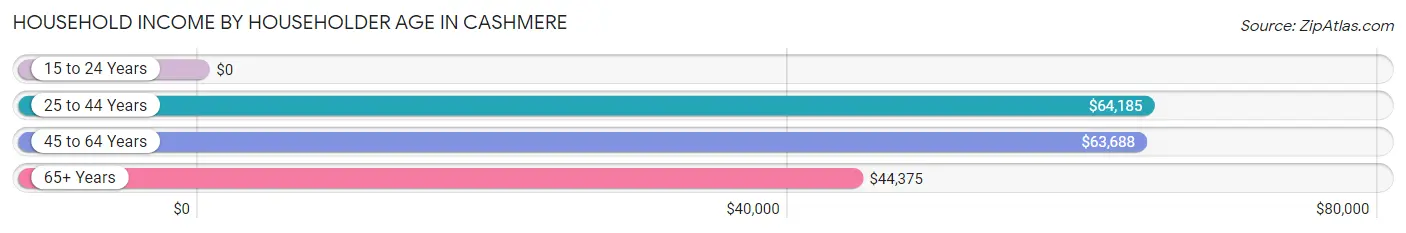
Household Income by Householder Age in Cashmere
The median household income in Cashmere is $60,597, with the highest median household income of $64,185 found in the 25 to 44 years age bracket for the primary householder. A total of 415 households (36.4%) fall into this category.
| Income Bracket | # Households | Median Income |
| 15 to 24 Years | 0 (0.0%) | $0 |
| 25 to 44 Years | 415 (36.4%) | $64,185 |
| 45 to 64 Years | 364 (32.0%) | $63,688 |
| 65+ Years | 360 (31.6%) | $44,375 |
| Total | 1,139 (100.0%) | $60,597 |
Poverty in Cashmere
Income Below Poverty by Sex and Age in Cashmere
With 11.4% poverty level for males and 10.5% for females among the residents of Cashmere, under 5 year old males and under 5 year old females are the most vulnerable to poverty, with 43 males (76.8%) and 31 females (44.9%) in their respective age groups living below the poverty level.
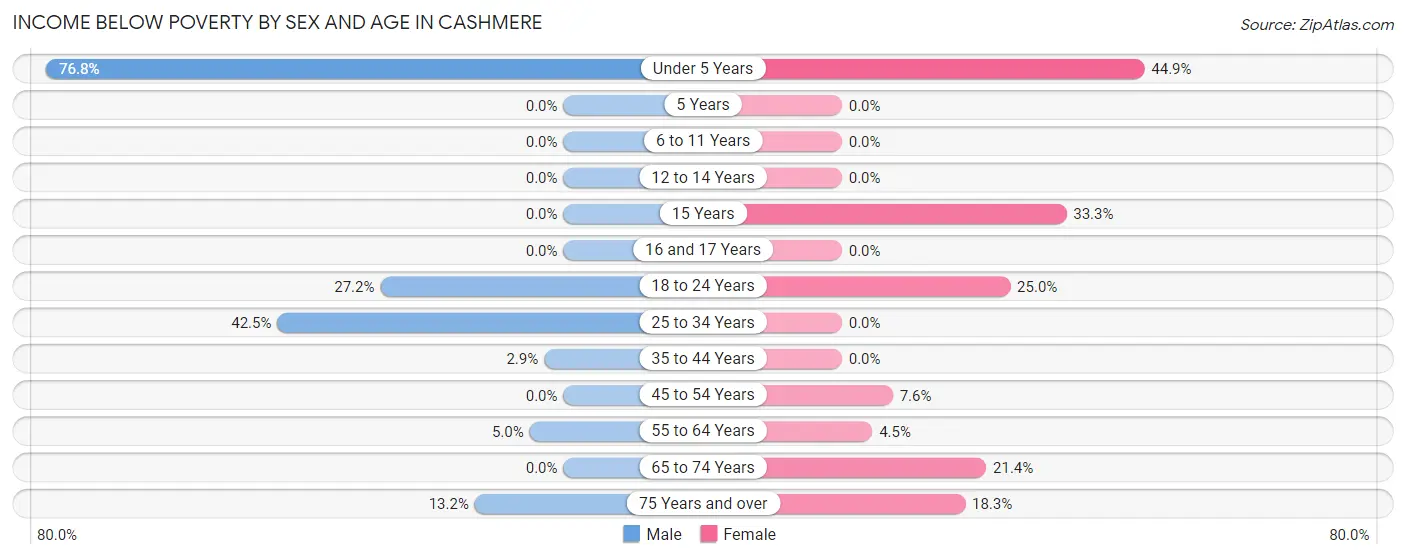
| Age Bracket | Male | Female |
| Under 5 Years | 43 (76.8%) | 31 (44.9%) |
| 5 Years | 0 (0.0%) | 0 (0.0%) |
| 6 to 11 Years | 0 (0.0%) | 0 (0.0%) |
| 12 to 14 Years | 0 (0.0%) | 0 (0.0%) |
| 15 Years | 0 (0.0%) | 15 (33.3%) |
| 16 and 17 Years | 0 (0.0%) | 0 (0.0%) |
| 18 to 24 Years | 28 (27.2%) | 35 (25.0%) |
| 25 to 34 Years | 65 (42.5%) | 0 (0.0%) |
| 35 to 44 Years | 6 (2.9%) | 0 (0.0%) |
| 45 to 54 Years | 0 (0.0%) | 17 (7.6%) |
| 55 to 64 Years | 11 (5.0%) | 10 (4.5%) |
| 65 to 74 Years | 0 (0.0%) | 24 (21.4%) |
| 75 Years and over | 20 (13.2%) | 41 (18.3%) |
| Total | 173 (11.4%) | 173 (10.5%) |
Income Above Poverty by Sex and Age in Cashmere
According to the poverty statistics in Cashmere, males aged 5 years and females aged 5 years are the age groups that are most secure financially, with 100.0% of males and 100.0% of females in these age groups living above the poverty line.
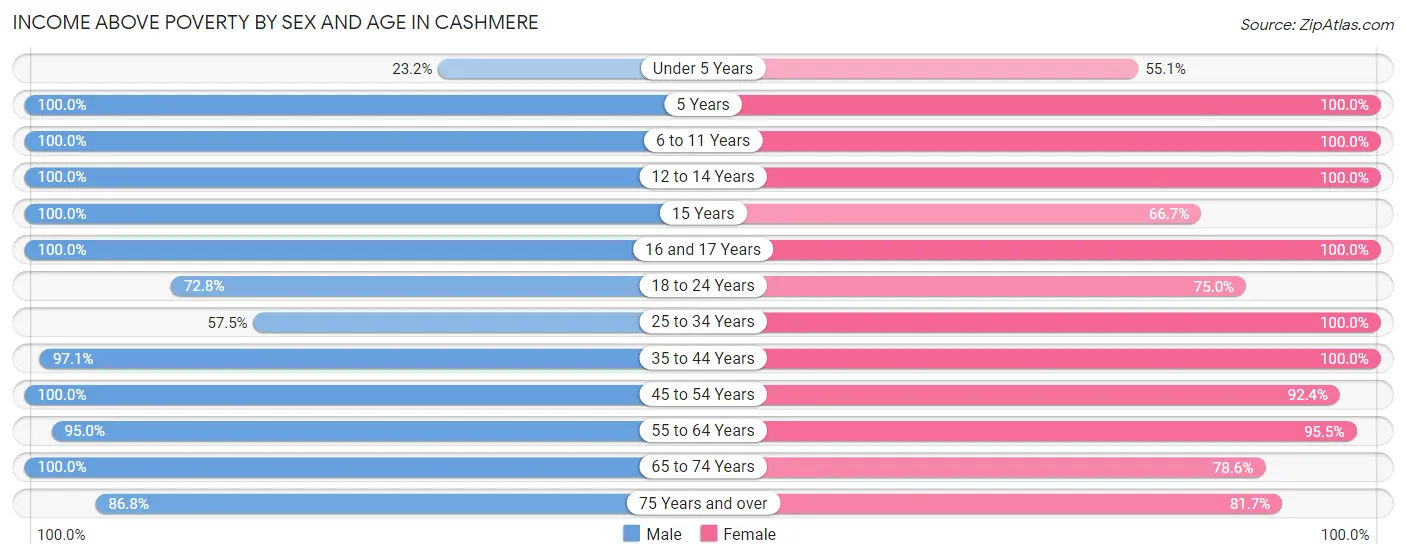
| Age Bracket | Male | Female |
| Under 5 Years | 13 (23.2%) | 38 (55.1%) |
| 5 Years | 82 (100.0%) | 5 (100.0%) |
| 6 to 11 Years | 90 (100.0%) | 132 (100.0%) |
| 12 to 14 Years | 83 (100.0%) | 60 (100.0%) |
| 15 Years | 18 (100.0%) | 30 (66.7%) |
| 16 and 17 Years | 44 (100.0%) | 50 (100.0%) |
| 18 to 24 Years | 75 (72.8%) | 105 (75.0%) |
| 25 to 34 Years | 88 (57.5%) | 202 (100.0%) |
| 35 to 44 Years | 204 (97.1%) | 159 (100.0%) |
| 45 to 54 Years | 187 (100.0%) | 208 (92.4%) |
| 55 to 64 Years | 208 (95.0%) | 211 (95.5%) |
| 65 to 74 Years | 115 (100.0%) | 88 (78.6%) |
| 75 Years and over | 132 (86.8%) | 183 (81.7%) |
| Total | 1,339 (88.6%) | 1,471 (89.5%) |
Income Below Poverty Among Married-Couple Families in Cashmere
The poverty statistics for married-couple families in Cashmere show that 11.5% or 64 of the total 557 families live below the poverty line. Families with 1 or 2 children have the highest poverty rate of 24.5%, comprising of 52 families. On the other hand, families with 3 or 4 children have the lowest poverty rate of 0.0%, which includes 0 families.
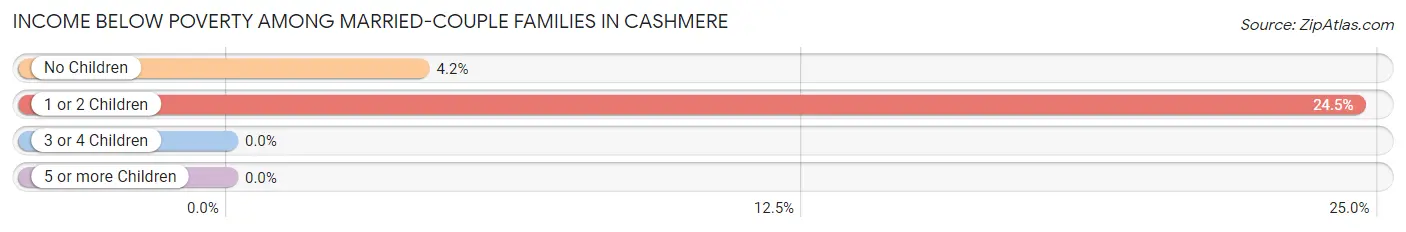
| Children | Above Poverty | Below Poverty |
| No Children | 276 (95.8%) | 12 (4.2%) |
| 1 or 2 Children | 160 (75.5%) | 52 (24.5%) |
| 3 or 4 Children | 57 (100.0%) | 0 (0.0%) |
| 5 or more Children | 0 (0.0%) | 0 (0.0%) |
| Total | 493 (88.5%) | 64 (11.5%) |
Income Below Poverty Among Single-Parent Households in Cashmere
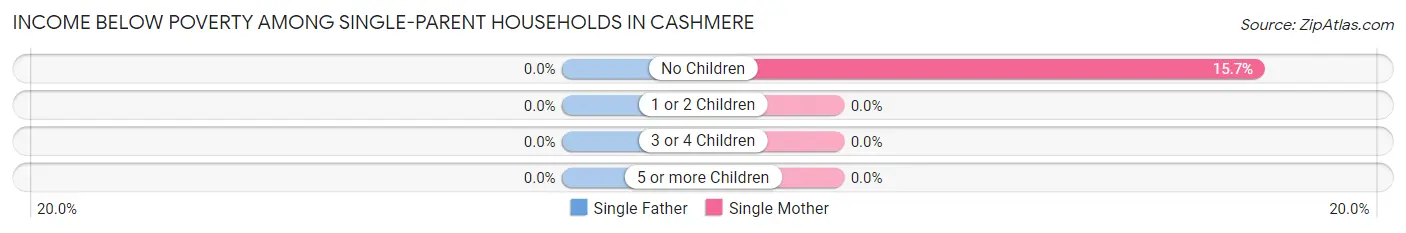
| Children | Single Father | Single Mother |
| No Children | 0 (0.0%) | 16 (15.7%) |
| 1 or 2 Children | 0 (0.0%) | 0 (0.0%) |
| 3 or 4 Children | 0 (0.0%) | 0 (0.0%) |
| 5 or more Children | 0 (0.0%) | 0 (0.0%) |
| Total | 0 (0.0%) | 16 (9.5%) |
Income Below Poverty Among Married-Couple vs Single-Parent Households in Cashmere
The poverty data for Cashmere shows that 64 of the married-couple family households (11.5%) and 16 of the single-parent households (8.1%) are living below the poverty level. Within the married-couple family households, those with 1 or 2 children have the highest poverty rate, with 52 households (24.5%) falling below the poverty line. Among the single-parent households, those with no children have the highest poverty rate, with 16 household (14.0%) living below poverty.
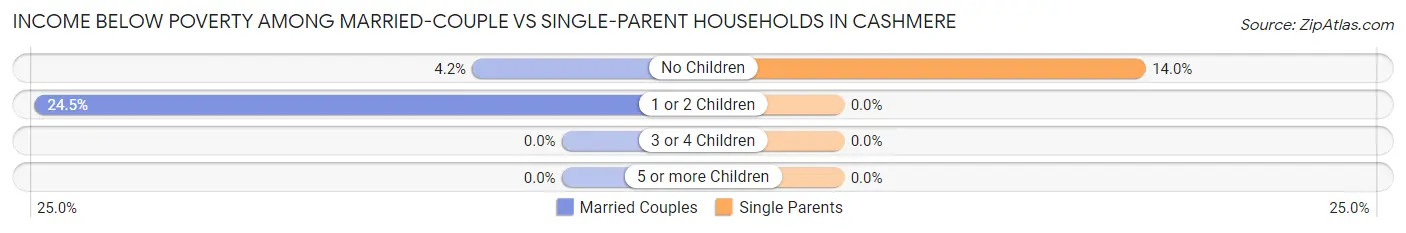
| Children | Married-Couple Families | Single-Parent Households |
| No Children | 12 (4.2%) | 16 (14.0%) |
| 1 or 2 Children | 52 (24.5%) | 0 (0.0%) |
| 3 or 4 Children | 0 (0.0%) | 0 (0.0%) |
| 5 or more Children | 0 (0.0%) | 0 (0.0%) |
| Total | 64 (11.5%) | 16 (8.1%) |
Employment Characteristics in Cashmere
Employment by Class of Employer in Cashmere
Among the 1,445 employed individuals in Cashmere, private company employees (929 | 64.3%), not-for-profit organizations (147 | 10.2%), and self-employed (not incorporated) (117 | 8.1%) make up the most common classes of employment.
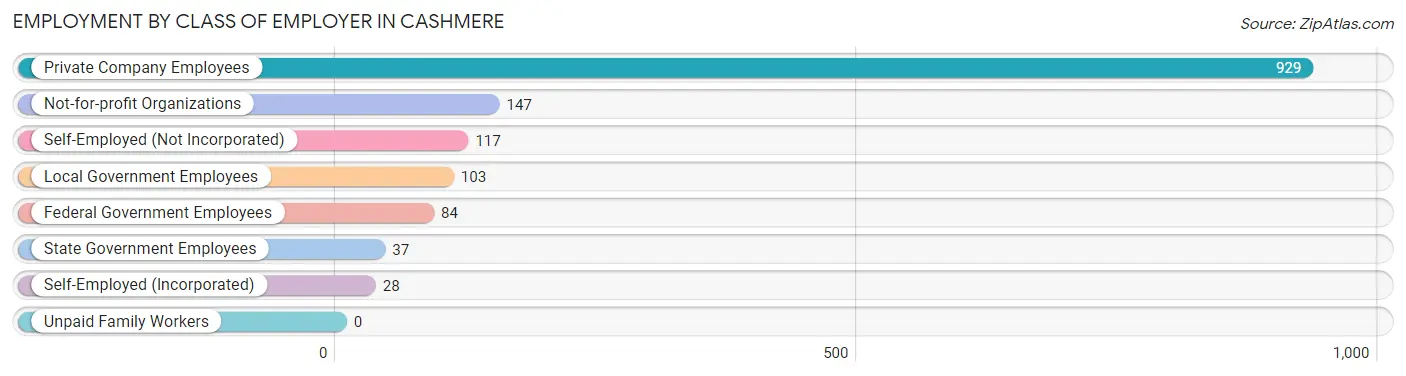
| Employer Class | # Employees | % Employees |
| Private Company Employees | 929 | 64.3% |
| Self-Employed (Incorporated) | 28 | 1.9% |
| Self-Employed (Not Incorporated) | 117 | 8.1% |
| Not-for-profit Organizations | 147 | 10.2% |
| Local Government Employees | 103 | 7.1% |
| State Government Employees | 37 | 2.6% |
| Federal Government Employees | 84 | 5.8% |
| Unpaid Family Workers | 0 | 0.0% |
| Total | 1,445 | 100.0% |
Employment Status by Age in Cashmere
According to the labor force statistics for Cashmere, out of the total population over 16 years of age (2,595), 56.8% or 1,474 individuals are in the labor force, with 1.1% or 16 of them unemployed. The age group with the highest labor force participation rate is 30 to 34 years, with 93.9% or 124 individuals in the labor force. Within the labor force, the 16 to 19 years age range has the highest percentage of unemployed individuals, with 6.8% or 6 of them being unemployed.
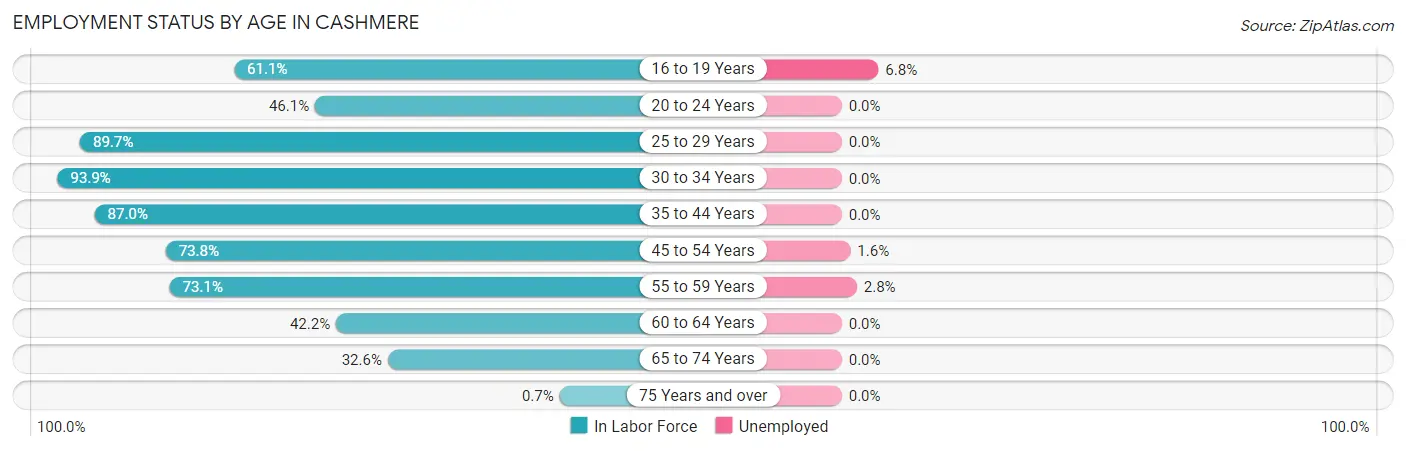
| Age Bracket | In Labor Force | Unemployed |
| 16 to 19 Years | 88 (61.1%) | 6 (6.8%) |
| 20 to 24 Years | 89 (46.1%) | 0 (0.0%) |
| 25 to 29 Years | 200 (89.7%) | 0 (0.0%) |
| 30 to 34 Years | 124 (93.9%) | 0 (0.0%) |
| 35 to 44 Years | 321 (87.0%) | 0 (0.0%) |
| 45 to 54 Years | 304 (73.8%) | 5 (1.6%) |
| 55 to 59 Years | 179 (73.1%) | 5 (2.8%) |
| 60 to 64 Years | 87 (42.2%) | 0 (0.0%) |
| 65 to 74 Years | 79 (32.6%) | 0 (0.0%) |
| 75 Years and over | 3 (0.7%) | 0 (0.0%) |
| Total | 1,474 (56.8%) | 16 (1.1%) |
Employment Status by Educational Attainment in Cashmere
According to labor force statistics for Cashmere, 76.6% of individuals (1,216) out of the total population between 25 and 64 years of age (1,587) are in the labor force, with 0.8% or 10 of them being unemployed. The group with the highest labor force participation rate are those with the educational attainment of high school diploma, with 85.5% or 283 individuals in the labor force. Within the labor force, individuals with high school diploma education have the highest percentage of unemployment, with 3.5% or 10 of them being unemployed.
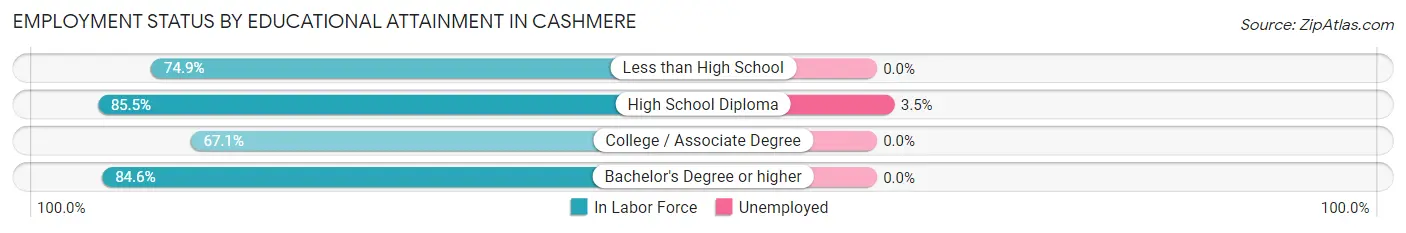
| Educational Attainment | In Labor Force | Unemployed |
| Less than High School | 143 (74.9%) | 0 (0.0%) |
| High School Diploma | 283 (85.5%) | 12 (3.5%) |
| College / Associate Degree | 431 (67.1%) | 0 (0.0%) |
| Bachelor's Degree or higher | 358 (84.6%) | 0 (0.0%) |
| Total | 1,216 (76.6%) | 13 (0.8%) |
Employment Occupations by Sex in Cashmere
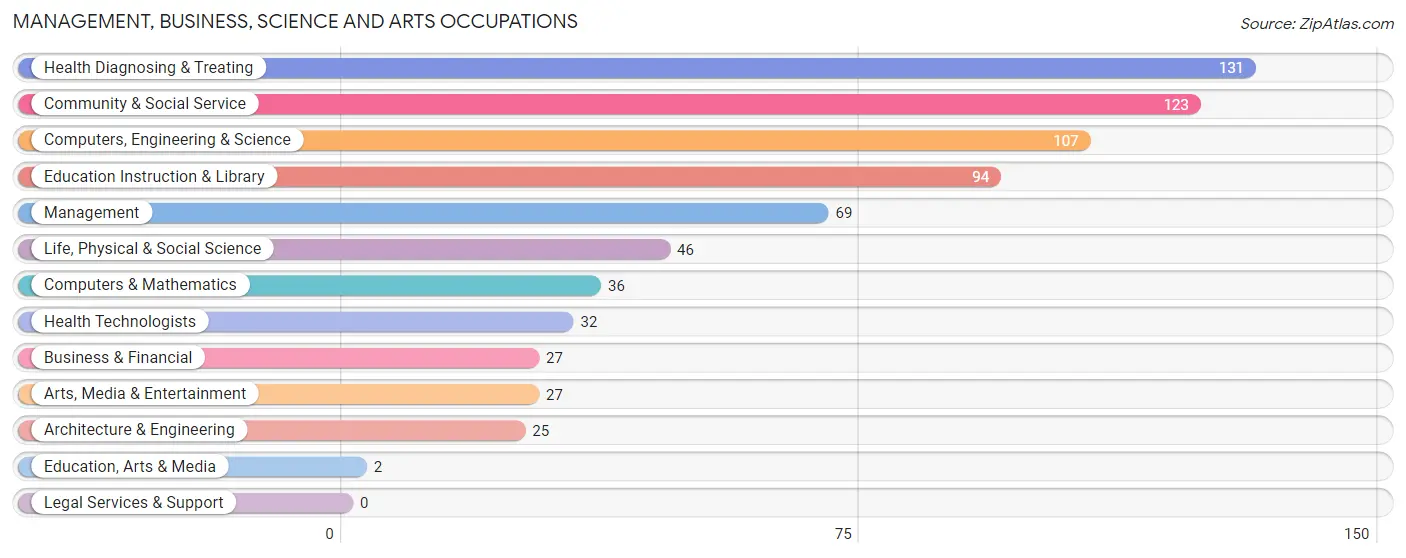
Management, Business, Science and Arts Occupations
The most common Management, Business, Science and Arts occupations in Cashmere are Health Diagnosing & Treating (131 | 9.0%), Community & Social Service (123 | 8.4%), Computers, Engineering & Science (107 | 7.3%), Education Instruction & Library (94 | 6.5%), and Management (69 | 4.7%).
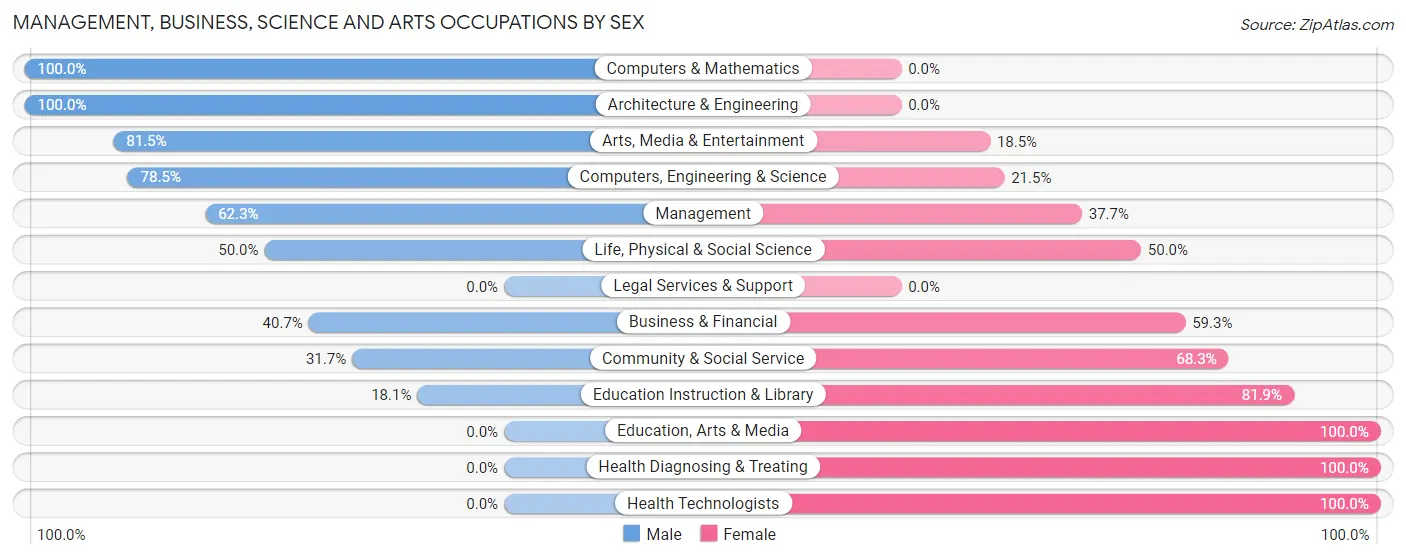
Management, Business, Science and Arts Occupations by Sex
Within the Management, Business, Science and Arts occupations in Cashmere, the most male-oriented occupations are Computers & Mathematics (100.0%), Architecture & Engineering (100.0%), and Arts, Media & Entertainment (81.5%), while the most female-oriented occupations are Education, Arts & Media (100.0%), Health Diagnosing & Treating (100.0%), and Health Technologists (100.0%).
| Occupation | Male | Female |
| Management | 43 (62.3%) | 26 (37.7%) |
| Business & Financial | 11 (40.7%) | 16 (59.3%) |
| Computers, Engineering & Science | 84 (78.5%) | 23 (21.5%) |
| Computers & Mathematics | 36 (100.0%) | 0 (0.0%) |
| Architecture & Engineering | 25 (100.0%) | 0 (0.0%) |
| Life, Physical & Social Science | 23 (50.0%) | 23 (50.0%) |
| Community & Social Service | 39 (31.7%) | 84 (68.3%) |
| Education, Arts & Media | 0 (0.0%) | 2 (100.0%) |
| Legal Services & Support | 0 (0.0%) | 0 (0.0%) |
| Education Instruction & Library | 17 (18.1%) | 77 (81.9%) |
| Arts, Media & Entertainment | 22 (81.5%) | 5 (18.5%) |
| Health Diagnosing & Treating | 0 (0.0%) | 131 (100.0%) |
| Health Technologists | 0 (0.0%) | 32 (100.0%) |
| Total (Category) | 177 (38.7%) | 280 (61.3%) |
| Total (Overall) | 833 (57.1%) | 625 (42.9%) |
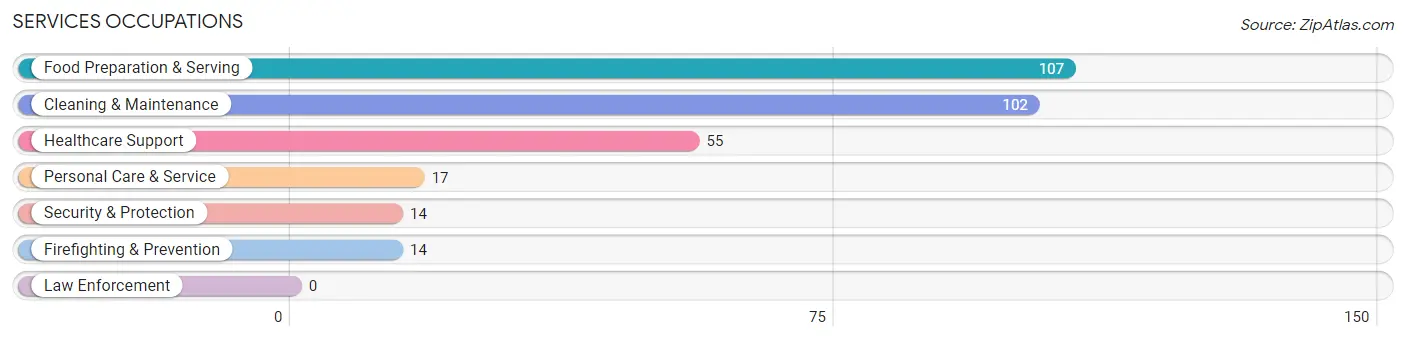
Services Occupations
The most common Services occupations in Cashmere are Food Preparation & Serving (107 | 7.3%), Cleaning & Maintenance (102 | 7.0%), Healthcare Support (55 | 3.8%), Personal Care & Service (17 | 1.2%), and Security & Protection (14 | 1.0%).
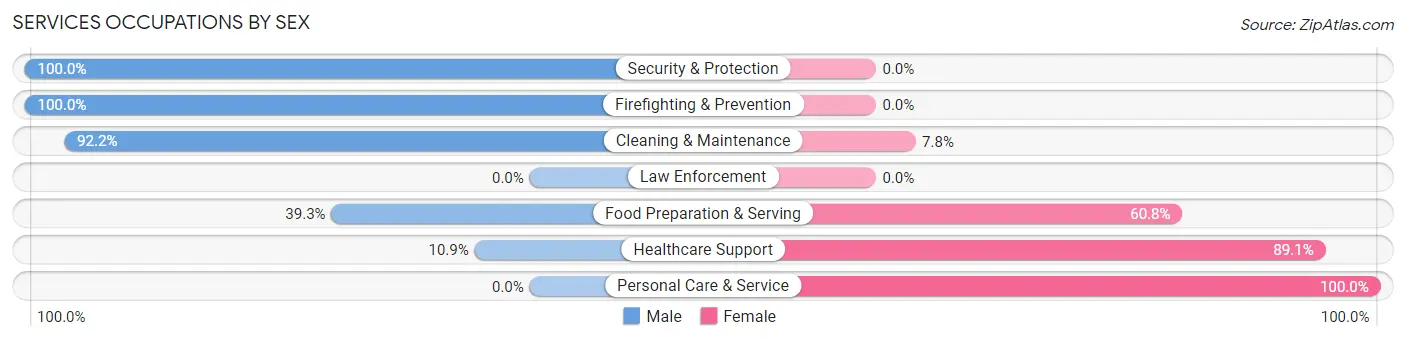
Services Occupations by Sex
Within the Services occupations in Cashmere, the most male-oriented occupations are Security & Protection (100.0%), Firefighting & Prevention (100.0%), and Cleaning & Maintenance (92.2%), while the most female-oriented occupations are Personal Care & Service (100.0%), Healthcare Support (89.1%), and Food Preparation & Serving (60.8%).
| Occupation | Male | Female |
| Healthcare Support | 6 (10.9%) | 49 (89.1%) |
| Security & Protection | 14 (100.0%) | 0 (0.0%) |
| Firefighting & Prevention | 14 (100.0%) | 0 (0.0%) |
| Law Enforcement | 0 (0.0%) | 0 (0.0%) |
| Food Preparation & Serving | 42 (39.3%) | 65 (60.8%) |
| Cleaning & Maintenance | 94 (92.2%) | 8 (7.8%) |
| Personal Care & Service | 0 (0.0%) | 17 (100.0%) |
| Total (Category) | 156 (52.9%) | 139 (47.1%) |
| Total (Overall) | 833 (57.1%) | 625 (42.9%) |
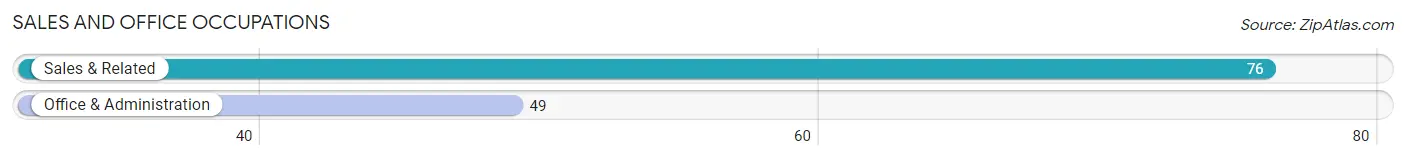
Sales and Office Occupations
The most common Sales and Office occupations in Cashmere are Sales & Related (76 | 5.2%), and Office & Administration (49 | 3.4%).
Sales and Office Occupations by Sex
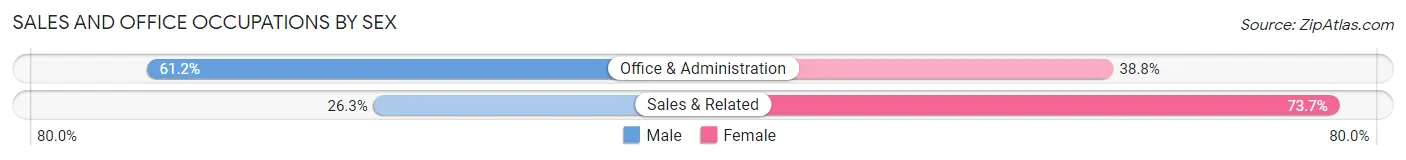
| Occupation | Male | Female |
| Sales & Related | 20 (26.3%) | 56 (73.7%) |
| Office & Administration | 30 (61.2%) | 19 (38.8%) |
| Total (Category) | 50 (40.0%) | 75 (60.0%) |
| Total (Overall) | 833 (57.1%) | 625 (42.9%) |
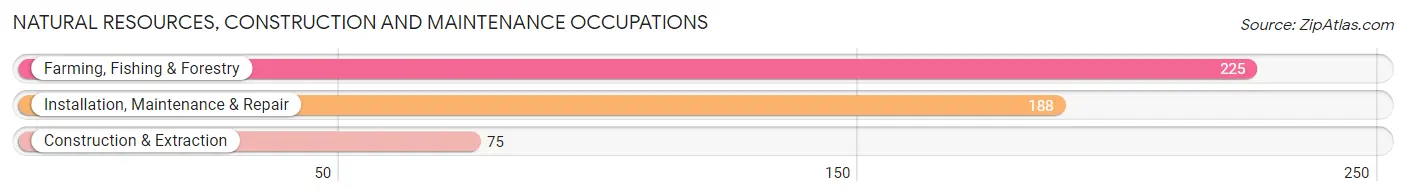
Natural Resources, Construction and Maintenance Occupations
The most common Natural Resources, Construction and Maintenance occupations in Cashmere are Farming, Fishing & Forestry (225 | 15.4%), Installation, Maintenance & Repair (188 | 12.9%), and Construction & Extraction (75 | 5.1%).
Natural Resources, Construction and Maintenance Occupations by Sex
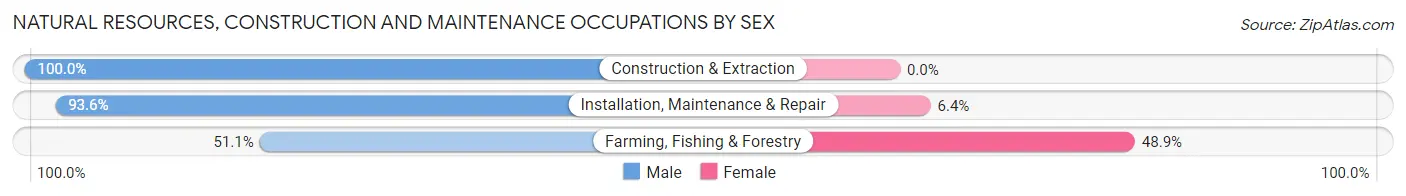
| Occupation | Male | Female |
| Farming, Fishing & Forestry | 115 (51.1%) | 110 (48.9%) |
| Construction & Extraction | 75 (100.0%) | 0 (0.0%) |
| Installation, Maintenance & Repair | 176 (93.6%) | 12 (6.4%) |
| Total (Category) | 366 (75.0%) | 122 (25.0%) |
| Total (Overall) | 833 (57.1%) | 625 (42.9%) |
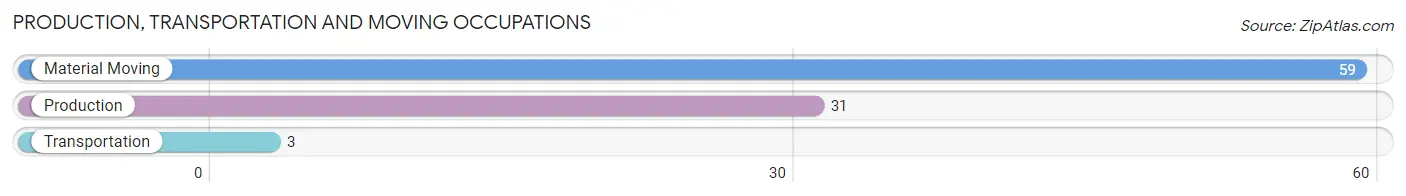
Production, Transportation and Moving Occupations
The most common Production, Transportation and Moving occupations in Cashmere are Material Moving (59 | 4.1%), Production (31 | 2.1%), and Transportation (3 | 0.2%).
Production, Transportation and Moving Occupations by Sex
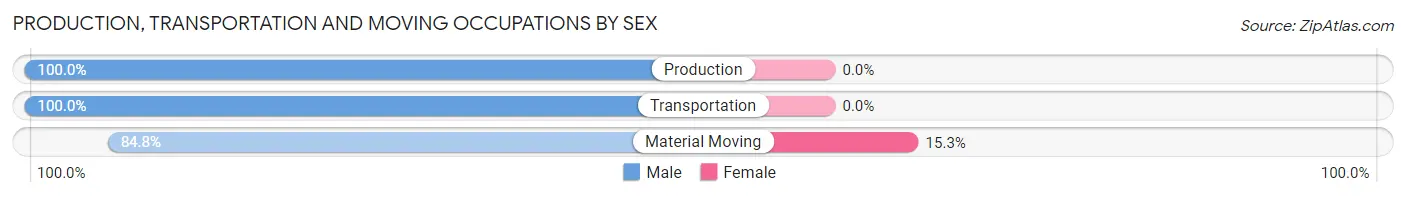
| Occupation | Male | Female |
| Production | 31 (100.0%) | 0 (0.0%) |
| Transportation | 3 (100.0%) | 0 (0.0%) |
| Material Moving | 50 (84.8%) | 9 (15.2%) |
| Total (Category) | 84 (90.3%) | 9 (9.7%) |
| Total (Overall) | 833 (57.1%) | 625 (42.9%) |
Employment Industries by Sex in Cashmere
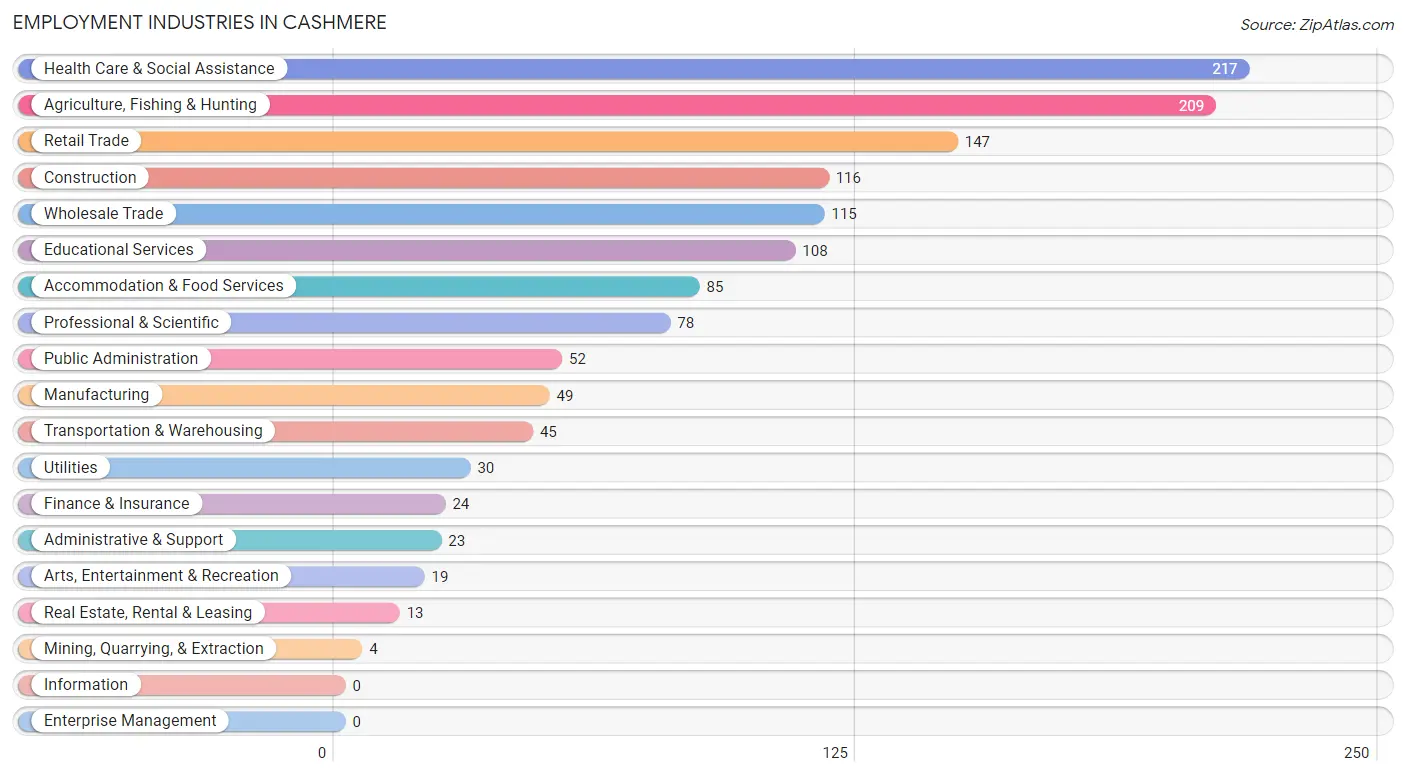
Employment Industries in Cashmere
The major employment industries in Cashmere include Health Care & Social Assistance (217 | 14.9%), Agriculture, Fishing & Hunting (209 | 14.3%), Retail Trade (147 | 10.1%), Construction (116 | 8.0%), and Wholesale Trade (115 | 7.9%).
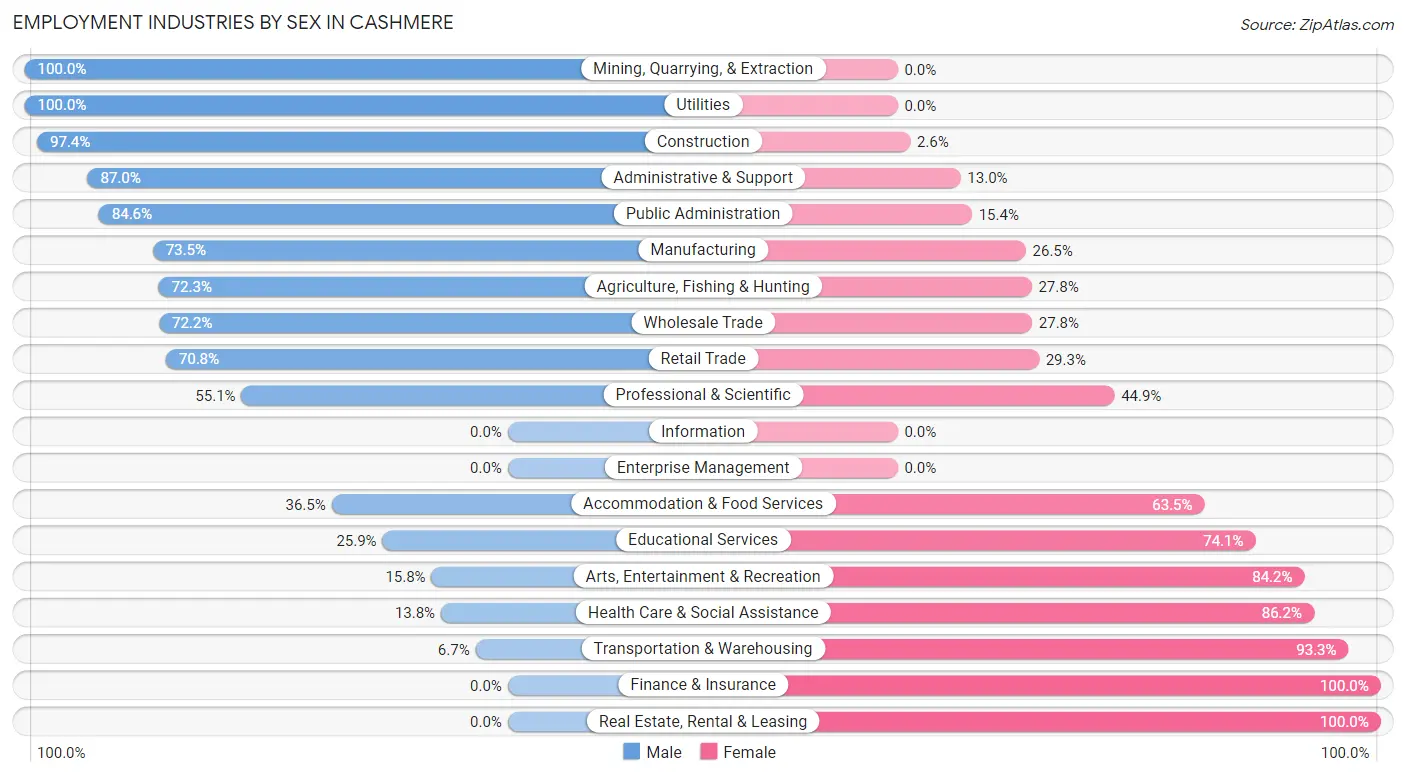
Employment Industries by Sex in Cashmere
The Cashmere industries that see more men than women are Mining, Quarrying, & Extraction (100.0%), Utilities (100.0%), and Construction (97.4%), whereas the industries that tend to have a higher number of women are Finance & Insurance (100.0%), Real Estate, Rental & Leasing (100.0%), and Transportation & Warehousing (93.3%).
| Industry | Male | Female |
| Agriculture, Fishing & Hunting | 151 (72.3%) | 58 (27.8%) |
| Mining, Quarrying, & Extraction | 4 (100.0%) | 0 (0.0%) |
| Construction | 113 (97.4%) | 3 (2.6%) |
| Manufacturing | 36 (73.5%) | 13 (26.5%) |
| Wholesale Trade | 83 (72.2%) | 32 (27.8%) |
| Retail Trade | 104 (70.8%) | 43 (29.2%) |
| Transportation & Warehousing | 3 (6.7%) | 42 (93.3%) |
| Utilities | 30 (100.0%) | 0 (0.0%) |
| Information | 0 (0.0%) | 0 (0.0%) |
| Finance & Insurance | 0 (0.0%) | 24 (100.0%) |
| Real Estate, Rental & Leasing | 0 (0.0%) | 13 (100.0%) |
| Professional & Scientific | 43 (55.1%) | 35 (44.9%) |
| Enterprise Management | 0 (0.0%) | 0 (0.0%) |
| Administrative & Support | 20 (87.0%) | 3 (13.0%) |
| Educational Services | 28 (25.9%) | 80 (74.1%) |
| Health Care & Social Assistance | 30 (13.8%) | 187 (86.2%) |
| Arts, Entertainment & Recreation | 3 (15.8%) | 16 (84.2%) |
| Accommodation & Food Services | 31 (36.5%) | 54 (63.5%) |
| Public Administration | 44 (84.6%) | 8 (15.4%) |
| Total | 833 (57.1%) | 625 (42.9%) |
Education in Cashmere
School Enrollment in Cashmere
The most common levels of schooling among the 788 students in Cashmere are high school (221 | 28.1%), college / undergraduate (169 | 21.4%), and middle school (165 | 20.9%).
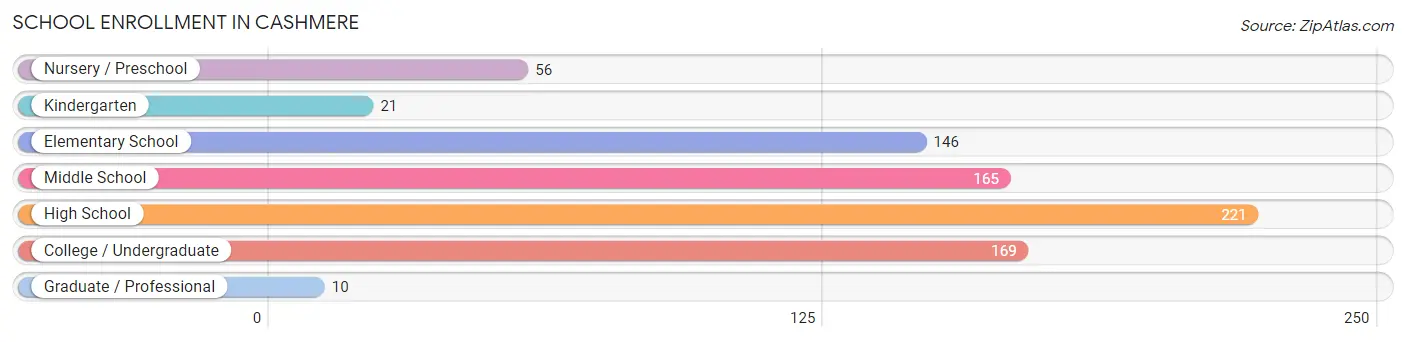
| School Level | # Students | % Students |
| Nursery / Preschool | 56 | 7.1% |
| Kindergarten | 21 | 2.7% |
| Elementary School | 146 | 18.5% |
| Middle School | 165 | 20.9% |
| High School | 221 | 28.1% |
| College / Undergraduate | 169 | 21.4% |
| Graduate / Professional | 10 | 1.3% |
| Total | 788 | 100.0% |
School Enrollment by Age by Funding Source in Cashmere
Out of a total of 788 students who are enrolled in schools in Cashmere, 97 (12.3%) attend a private institution, while the remaining 691 (87.7%) are enrolled in public schools. The age group of 35 years and over has the highest likelihood of being enrolled in private schools, with 36 (53.7% in the age bracket) enrolled. Conversely, the age group of 18 to 19 year olds has the lowest likelihood of being enrolled in a private school, with 26 (100.0% in the age bracket) attending a public institution.
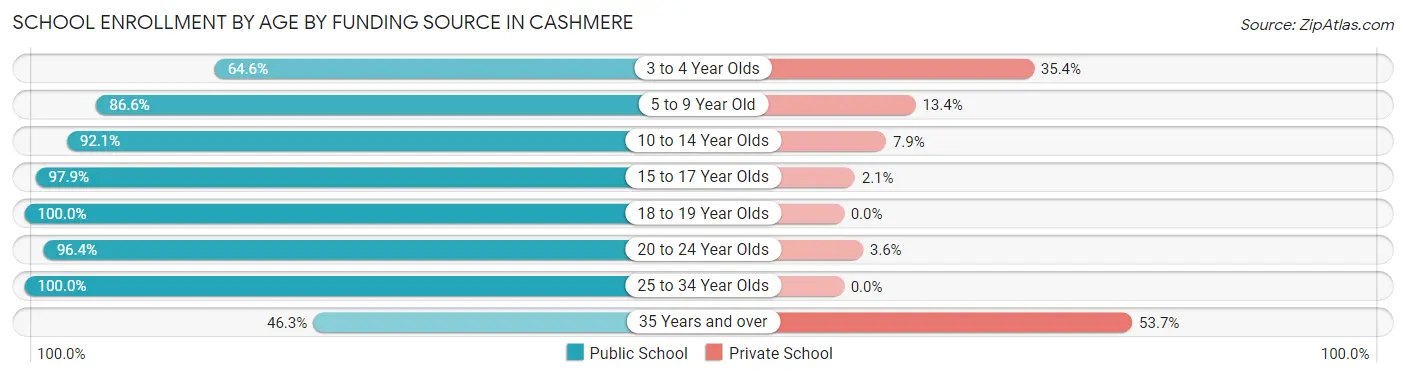
| Age Bracket | Public School | Private School |
| 3 to 4 Year Olds | 31 (64.6%) | 17 (35.4%) |
| 5 to 9 Year Old | 123 (86.6%) | 19 (13.4%) |
| 10 to 14 Year Olds | 222 (92.1%) | 19 (7.9%) |
| 15 to 17 Year Olds | 142 (97.9%) | 3 (2.1%) |
| 18 to 19 Year Olds | 26 (100.0%) | 0 (0.0%) |
| 20 to 24 Year Olds | 81 (96.4%) | 3 (3.6%) |
| 25 to 34 Year Olds | 35 (100.0%) | 0 (0.0%) |
| 35 Years and over | 31 (46.3%) | 36 (53.7%) |
| Total | 691 (87.7%) | 97 (12.3%) |
Educational Attainment by Field of Study in Cashmere
Bio, nature & agricultural (89 | 15.0%), education (88 | 14.8%), liberal arts & history (75 | 12.6%), computers & mathematics (53 | 8.9%), and psychology (51 | 8.6%) are the most common fields of study among 594 individuals in Cashmere who have obtained a bachelor's degree or higher.
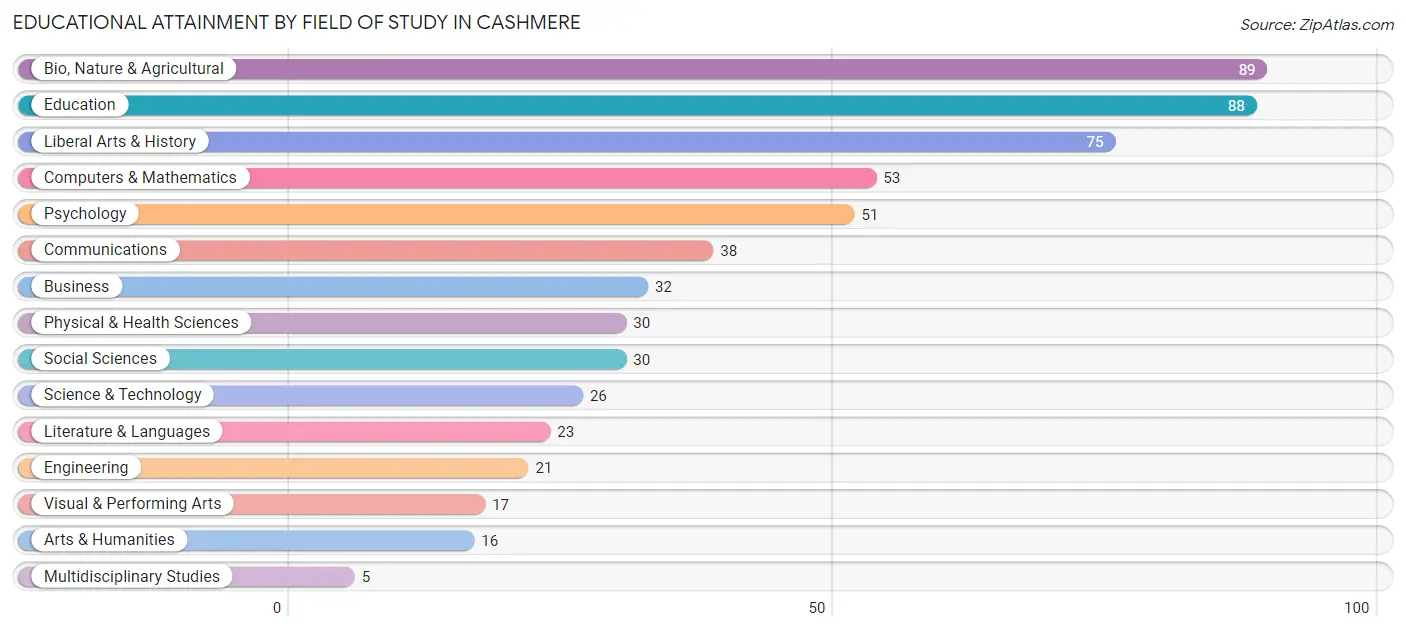
| Field of Study | # Graduates | % Graduates |
| Computers & Mathematics | 53 | 8.9% |
| Bio, Nature & Agricultural | 89 | 15.0% |
| Physical & Health Sciences | 30 | 5.1% |
| Psychology | 51 | 8.6% |
| Social Sciences | 30 | 5.1% |
| Engineering | 21 | 3.5% |
| Multidisciplinary Studies | 5 | 0.8% |
| Science & Technology | 26 | 4.4% |
| Business | 32 | 5.4% |
| Education | 88 | 14.8% |
| Literature & Languages | 23 | 3.9% |
| Liberal Arts & History | 75 | 12.6% |
| Visual & Performing Arts | 17 | 2.9% |
| Communications | 38 | 6.4% |
| Arts & Humanities | 16 | 2.7% |
| Total | 594 | 100.0% |
Transportation & Commute in Cashmere
Vehicle Availability by Sex in Cashmere
The most prevalent vehicle ownership categories in Cashmere are males with 2 vehicles (354, accounting for 42.5%) and females with 2 vehicles (235, making up 57.8%).
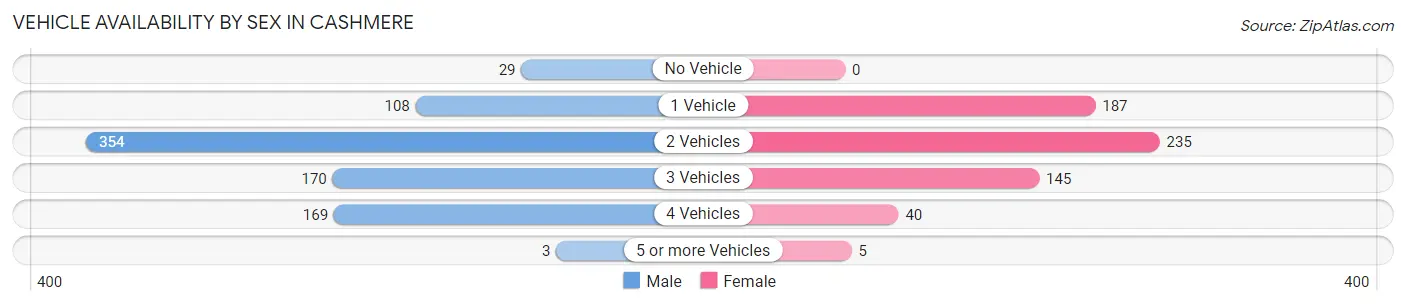
| Vehicles Available | Male | Female |
| No Vehicle | 29 (3.5%) | 0 (0.0%) |
| 1 Vehicle | 108 (13.0%) | 187 (30.6%) |
| 2 Vehicles | 354 (42.5%) | 235 (38.4%) |
| 3 Vehicles | 170 (20.4%) | 145 (23.7%) |
| 4 Vehicles | 169 (20.3%) | 40 (6.5%) |
| 5 or more Vehicles | 3 (0.4%) | 5 (0.8%) |
| Total | 833 (100.0%) | 612 (100.0%) |
Commute Time in Cashmere
The most frequently occuring commute durations in Cashmere are 15 to 19 minutes (267 commuters, 20.5%), 5 to 9 minutes (199 commuters, 15.3%), and 20 to 24 minutes (199 commuters, 15.3%).
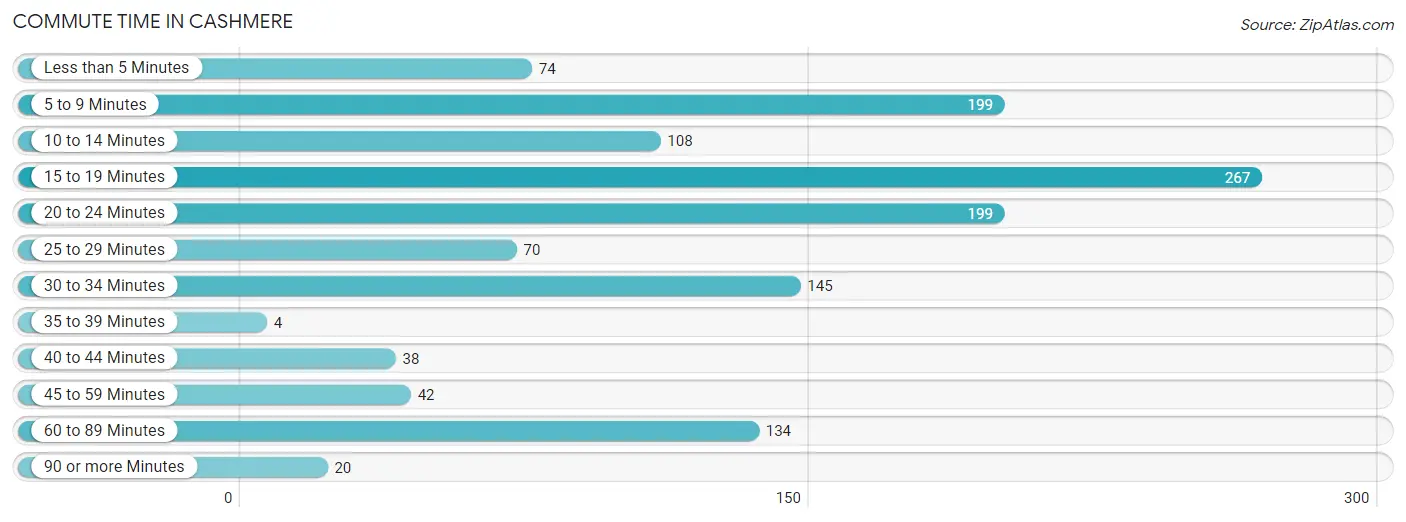
| Commute Time | # Commuters | % Commuters |
| Less than 5 Minutes | 74 | 5.7% |
| 5 to 9 Minutes | 199 | 15.3% |
| 10 to 14 Minutes | 108 | 8.3% |
| 15 to 19 Minutes | 267 | 20.5% |
| 20 to 24 Minutes | 199 | 15.3% |
| 25 to 29 Minutes | 70 | 5.4% |
| 30 to 34 Minutes | 145 | 11.2% |
| 35 to 39 Minutes | 4 | 0.3% |
| 40 to 44 Minutes | 38 | 2.9% |
| 45 to 59 Minutes | 42 | 3.2% |
| 60 to 89 Minutes | 134 | 10.3% |
| 90 or more Minutes | 20 | 1.5% |
Commute Time by Sex in Cashmere
The most common commute times in Cashmere are 15 to 19 minutes (170 commuters, 23.0%) for males and 20 to 24 minutes (149 commuters, 26.5%) for females.
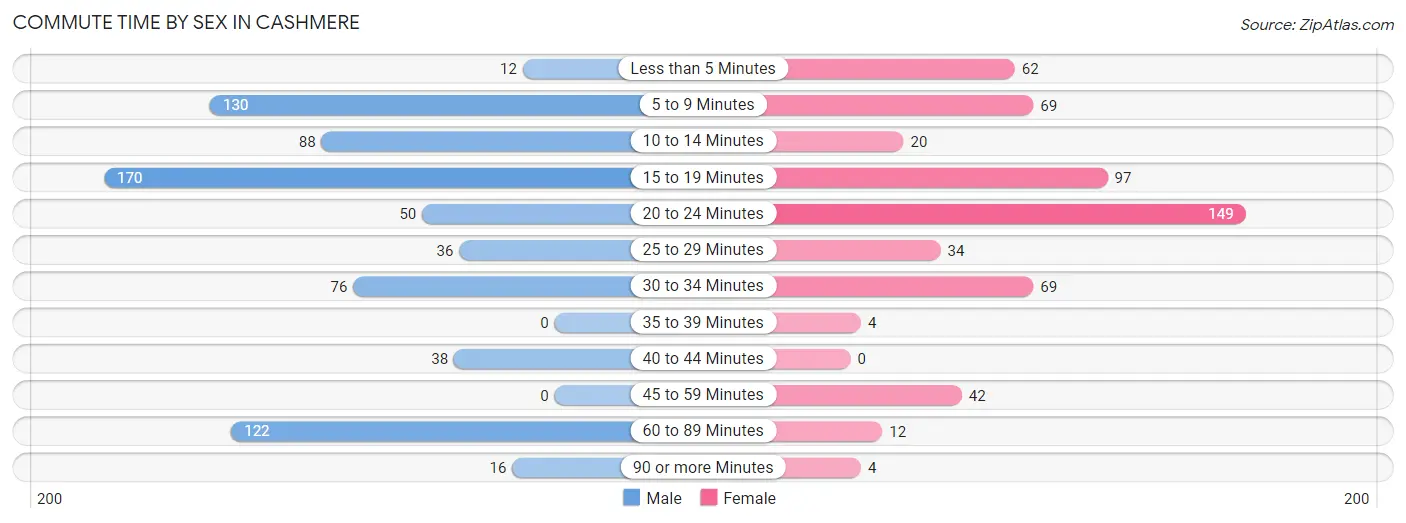
| Commute Time | Male | Female |
| Less than 5 Minutes | 12 (1.6%) | 62 (11.0%) |
| 5 to 9 Minutes | 130 (17.6%) | 69 (12.3%) |
| 10 to 14 Minutes | 88 (11.9%) | 20 (3.6%) |
| 15 to 19 Minutes | 170 (23.0%) | 97 (17.3%) |
| 20 to 24 Minutes | 50 (6.8%) | 149 (26.5%) |
| 25 to 29 Minutes | 36 (4.9%) | 34 (6.0%) |
| 30 to 34 Minutes | 76 (10.3%) | 69 (12.3%) |
| 35 to 39 Minutes | 0 (0.0%) | 4 (0.7%) |
| 40 to 44 Minutes | 38 (5.1%) | 0 (0.0%) |
| 45 to 59 Minutes | 0 (0.0%) | 42 (7.5%) |
| 60 to 89 Minutes | 122 (16.5%) | 12 (2.1%) |
| 90 or more Minutes | 16 (2.2%) | 4 (0.7%) |
Time of Departure to Work by Sex in Cashmere
The most frequent times of departure to work in Cashmere are 6:30 AM to 6:59 AM (149, 20.2%) for males and 6:00 AM to 6:29 AM (90, 16.0%) for females.
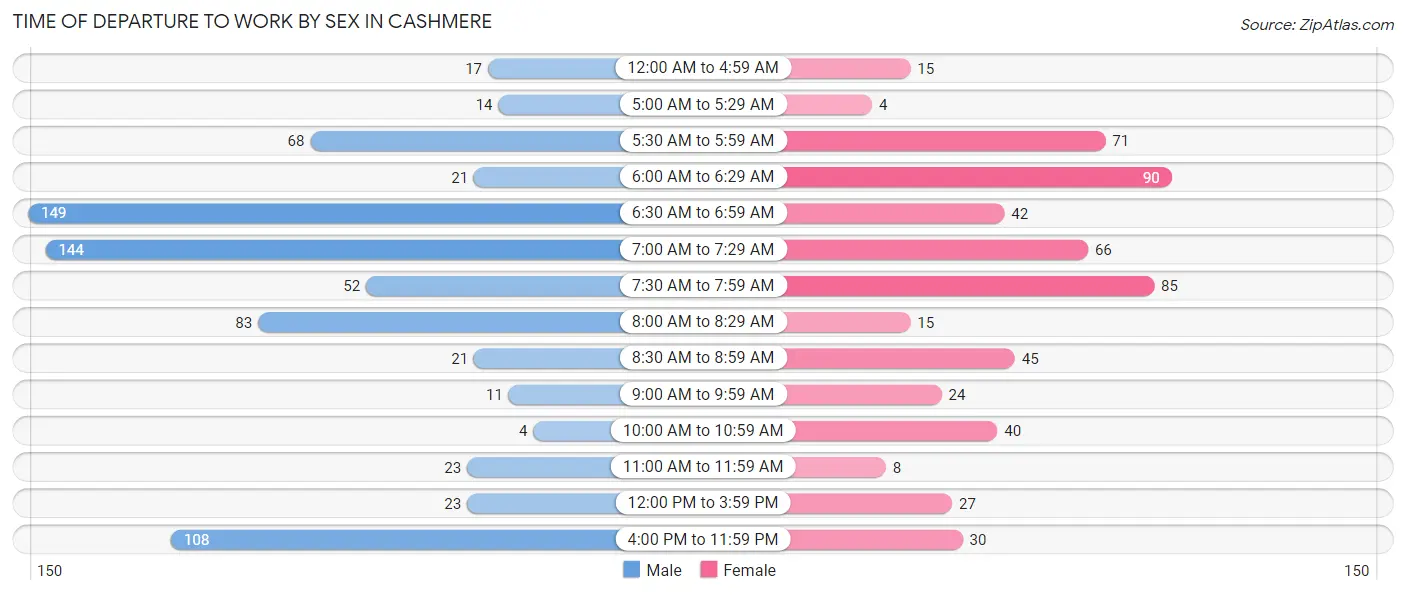
| Time of Departure | Male | Female |
| 12:00 AM to 4:59 AM | 17 (2.3%) | 15 (2.7%) |
| 5:00 AM to 5:29 AM | 14 (1.9%) | 4 (0.7%) |
| 5:30 AM to 5:59 AM | 68 (9.2%) | 71 (12.6%) |
| 6:00 AM to 6:29 AM | 21 (2.9%) | 90 (16.0%) |
| 6:30 AM to 6:59 AM | 149 (20.2%) | 42 (7.5%) |
| 7:00 AM to 7:29 AM | 144 (19.5%) | 66 (11.7%) |
| 7:30 AM to 7:59 AM | 52 (7.0%) | 85 (15.1%) |
| 8:00 AM to 8:29 AM | 83 (11.3%) | 15 (2.7%) |
| 8:30 AM to 8:59 AM | 21 (2.9%) | 45 (8.0%) |
| 9:00 AM to 9:59 AM | 11 (1.5%) | 24 (4.3%) |
| 10:00 AM to 10:59 AM | 4 (0.5%) | 40 (7.1%) |
| 11:00 AM to 11:59 AM | 23 (3.1%) | 8 (1.4%) |
| 12:00 PM to 3:59 PM | 23 (3.1%) | 27 (4.8%) |
| 4:00 PM to 11:59 PM | 108 (14.6%) | 30 (5.3%) |
| Total | 738 (100.0%) | 562 (100.0%) |
Housing Occupancy in Cashmere
Occupancy by Ownership in Cashmere
Of the total 1,139 dwellings in Cashmere, owner-occupied units account for 617 (54.2%), while renter-occupied units make up 522 (45.8%).
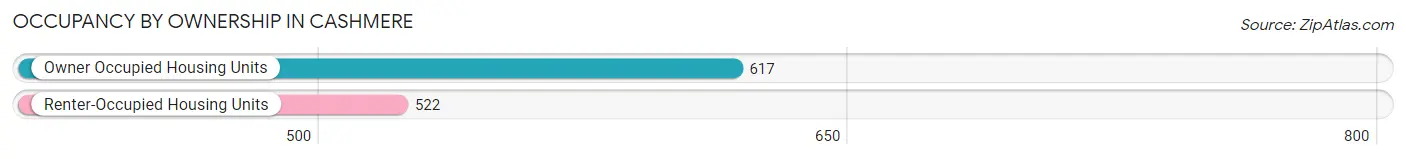
| Occupancy | # Housing Units | % Housing Units |
| Owner Occupied Housing Units | 617 | 54.2% |
| Renter-Occupied Housing Units | 522 | 45.8% |
| Total Occupied Housing Units | 1,139 | 100.0% |
Occupancy by Household Size in Cashmere
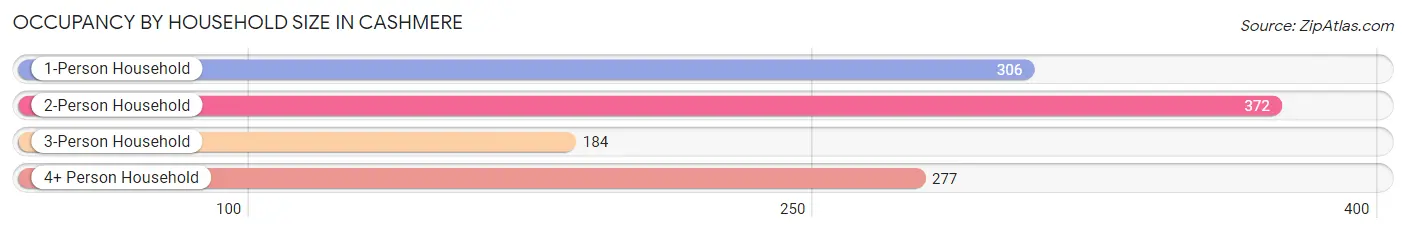
| Household Size | # Housing Units | % Housing Units |
| 1-Person Household | 306 | 26.9% |
| 2-Person Household | 372 | 32.7% |
| 3-Person Household | 184 | 16.2% |
| 4+ Person Household | 277 | 24.3% |
| Total Housing Units | 1,139 | 100.0% |
Occupancy by Ownership by Household Size in Cashmere
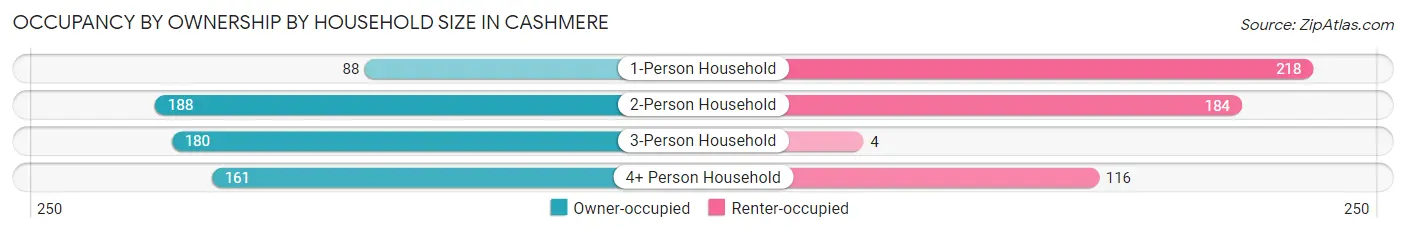
| Household Size | Owner-occupied | Renter-occupied |
| 1-Person Household | 88 (28.8%) | 218 (71.2%) |
| 2-Person Household | 188 (50.5%) | 184 (49.5%) |
| 3-Person Household | 180 (97.8%) | 4 (2.2%) |
| 4+ Person Household | 161 (58.1%) | 116 (41.9%) |
| Total Housing Units | 617 (54.2%) | 522 (45.8%) |
Occupancy by Educational Attainment in Cashmere
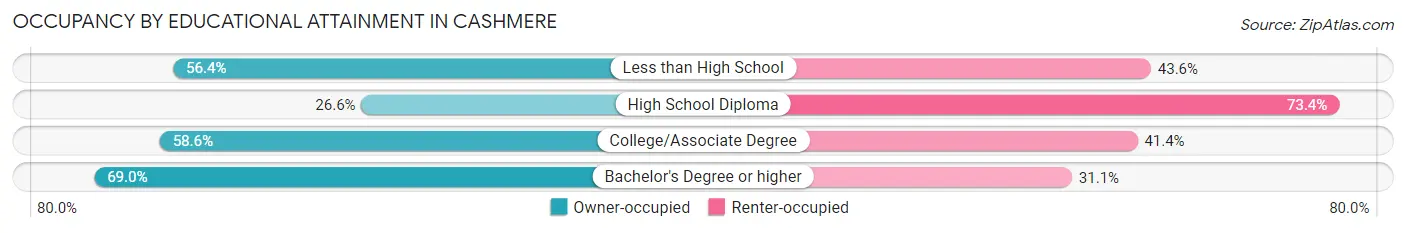
| Household Size | Owner-occupied | Renter-occupied |
| Less than High School | 79 (56.4%) | 61 (43.6%) |
| High School Diploma | 63 (26.6%) | 174 (73.4%) |
| College/Associate Degree | 284 (58.6%) | 201 (41.4%) |
| Bachelor's Degree or higher | 191 (69.0%) | 86 (31.0%) |
Occupancy by Age of Householder in Cashmere
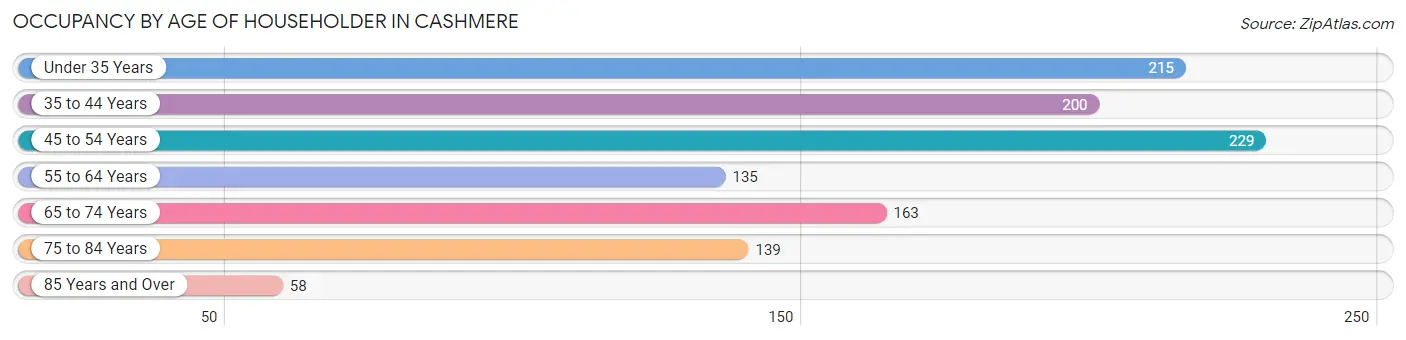
| Age Bracket | # Households | % Households |
| Under 35 Years | 215 | 18.9% |
| 35 to 44 Years | 200 | 17.6% |
| 45 to 54 Years | 229 | 20.1% |
| 55 to 64 Years | 135 | 11.8% |
| 65 to 74 Years | 163 | 14.3% |
| 75 to 84 Years | 139 | 12.2% |
| 85 Years and Over | 58 | 5.1% |
| Total | 1,139 | 100.0% |
Housing Finances in Cashmere
Median Income by Occupancy in Cashmere
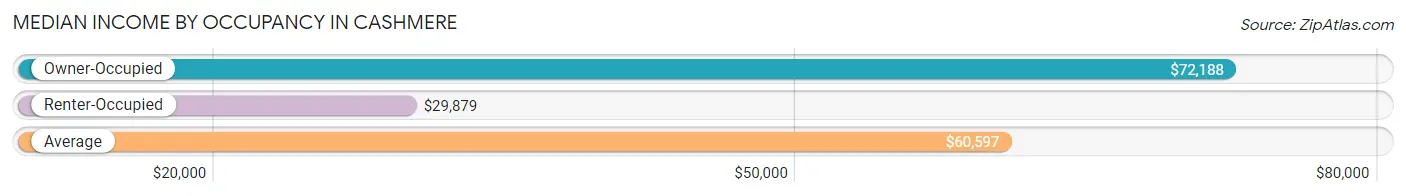
| Occupancy Type | # Households | Median Income |
| Owner-Occupied | 617 (54.2%) | $72,188 |
| Renter-Occupied | 522 (45.8%) | $29,879 |
| Average | 1,139 (100.0%) | $60,597 |
Occupancy by Householder Income Bracket in Cashmere
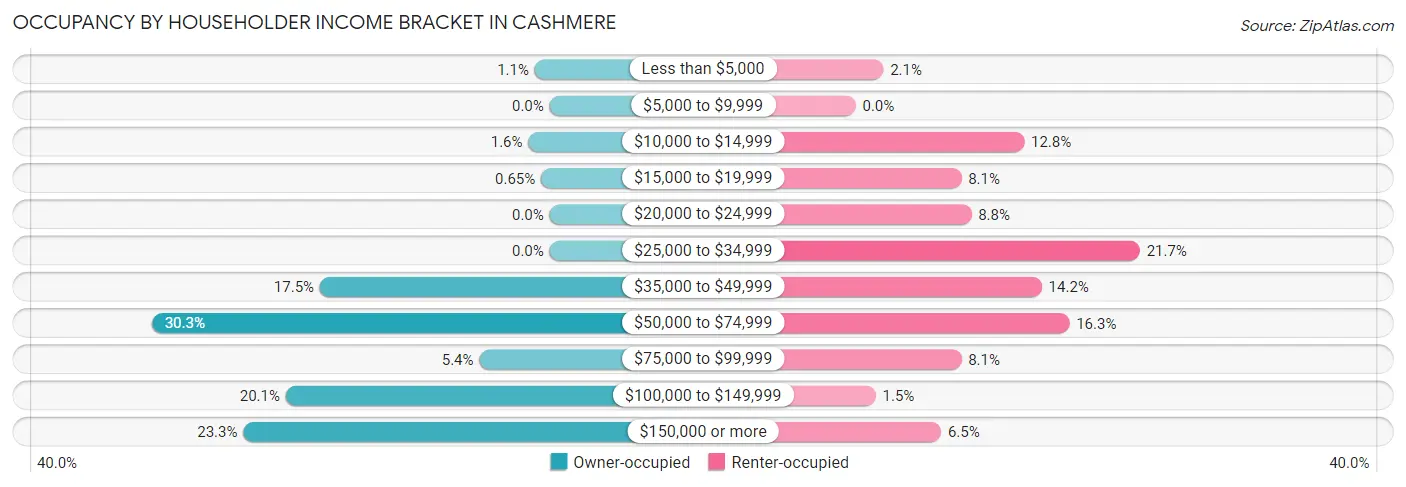
| Income Bracket | Owner-occupied | Renter-occupied |
| Less than $5,000 | 7 (1.1%) | 11 (2.1%) |
| $5,000 to $9,999 | 0 (0.0%) | 0 (0.0%) |
| $10,000 to $14,999 | 10 (1.6%) | 67 (12.8%) |
| $15,000 to $19,999 | 4 (0.6%) | 42 (8.1%) |
| $20,000 to $24,999 | 0 (0.0%) | 46 (8.8%) |
| $25,000 to $34,999 | 0 (0.0%) | 113 (21.6%) |
| $35,000 to $49,999 | 108 (17.5%) | 74 (14.2%) |
| $50,000 to $74,999 | 187 (30.3%) | 85 (16.3%) |
| $75,000 to $99,999 | 33 (5.3%) | 42 (8.1%) |
| $100,000 to $149,999 | 124 (20.1%) | 8 (1.5%) |
| $150,000 or more | 144 (23.3%) | 34 (6.5%) |
| Total | 617 (100.0%) | 522 (100.0%) |
Monthly Housing Cost Tiers in Cashmere
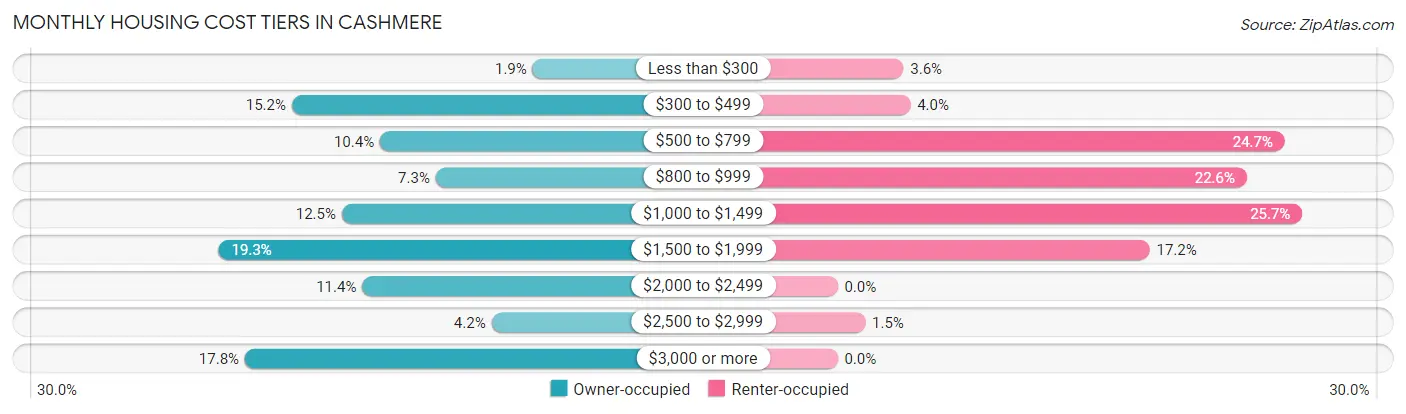
| Monthly Cost | Owner-occupied | Renter-occupied |
| Less than $300 | 12 (1.9%) | 19 (3.6%) |
| $300 to $499 | 94 (15.2%) | 21 (4.0%) |
| $500 to $799 | 64 (10.4%) | 129 (24.7%) |
| $800 to $999 | 45 (7.3%) | 118 (22.6%) |
| $1,000 to $1,499 | 77 (12.5%) | 134 (25.7%) |
| $1,500 to $1,999 | 119 (19.3%) | 90 (17.2%) |
| $2,000 to $2,499 | 70 (11.4%) | 0 (0.0%) |
| $2,500 to $2,999 | 26 (4.2%) | 8 (1.5%) |
| $3,000 or more | 110 (17.8%) | 0 (0.0%) |
| Total | 617 (100.0%) | 522 (100.0%) |
Physical Housing Characteristics in Cashmere
Housing Structures in Cashmere
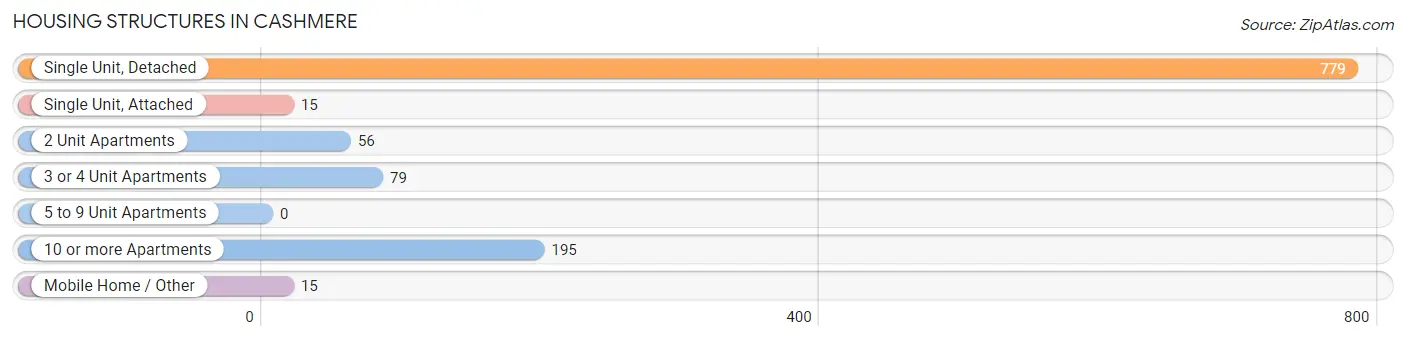
| Structure Type | # Housing Units | % Housing Units |
| Single Unit, Detached | 779 | 68.4% |
| Single Unit, Attached | 15 | 1.3% |
| 2 Unit Apartments | 56 | 4.9% |
| 3 or 4 Unit Apartments | 79 | 6.9% |
| 5 to 9 Unit Apartments | 0 | 0.0% |
| 10 or more Apartments | 195 | 17.1% |
| Mobile Home / Other | 15 | 1.3% |
| Total | 1,139 | 100.0% |
Housing Structures by Occupancy in Cashmere
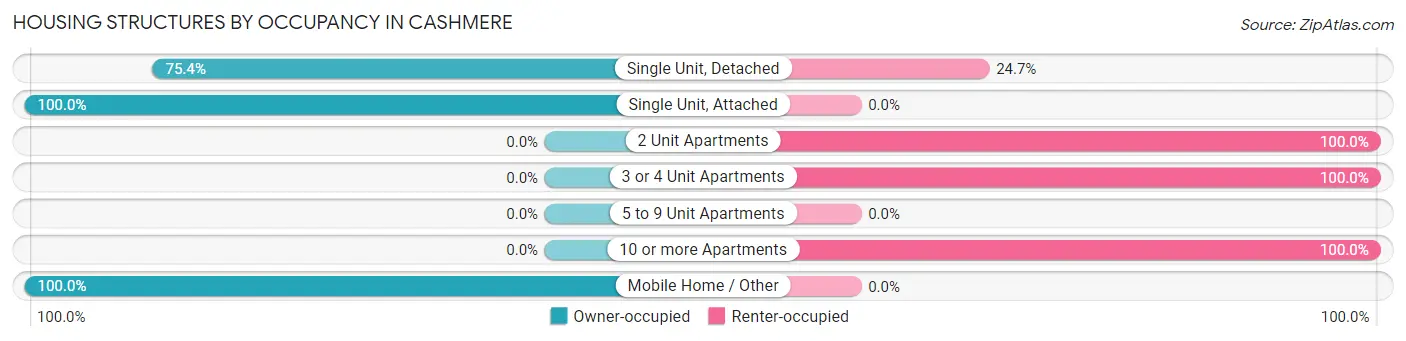
| Structure Type | Owner-occupied | Renter-occupied |
| Single Unit, Detached | 587 (75.3%) | 192 (24.6%) |
| Single Unit, Attached | 15 (100.0%) | 0 (0.0%) |
| 2 Unit Apartments | 0 (0.0%) | 56 (100.0%) |
| 3 or 4 Unit Apartments | 0 (0.0%) | 79 (100.0%) |
| 5 to 9 Unit Apartments | 0 (0.0%) | 0 (0.0%) |
| 10 or more Apartments | 0 (0.0%) | 195 (100.0%) |
| Mobile Home / Other | 15 (100.0%) | 0 (0.0%) |
| Total | 617 (54.2%) | 522 (45.8%) |
Housing Structures by Number of Rooms in Cashmere
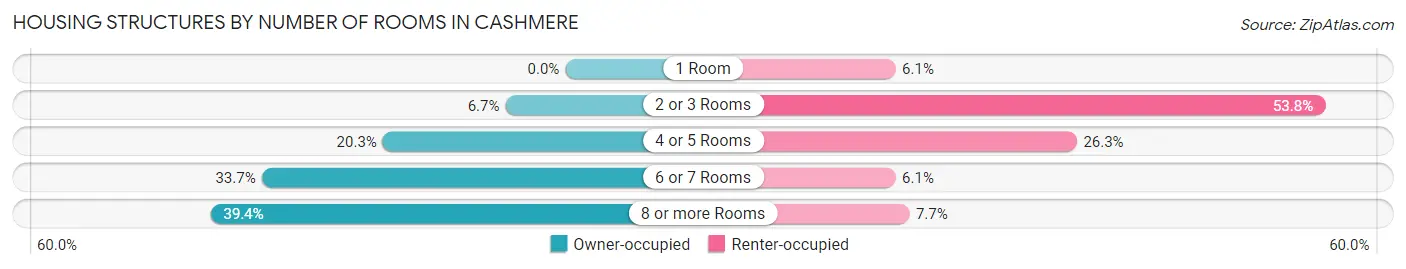
| Number of Rooms | Owner-occupied | Renter-occupied |
| 1 Room | 0 (0.0%) | 32 (6.1%) |
| 2 or 3 Rooms | 41 (6.7%) | 281 (53.8%) |
| 4 or 5 Rooms | 125 (20.3%) | 137 (26.3%) |
| 6 or 7 Rooms | 208 (33.7%) | 32 (6.1%) |
| 8 or more Rooms | 243 (39.4%) | 40 (7.7%) |
| Total | 617 (100.0%) | 522 (100.0%) |
Housing Structure by Heating Type in Cashmere
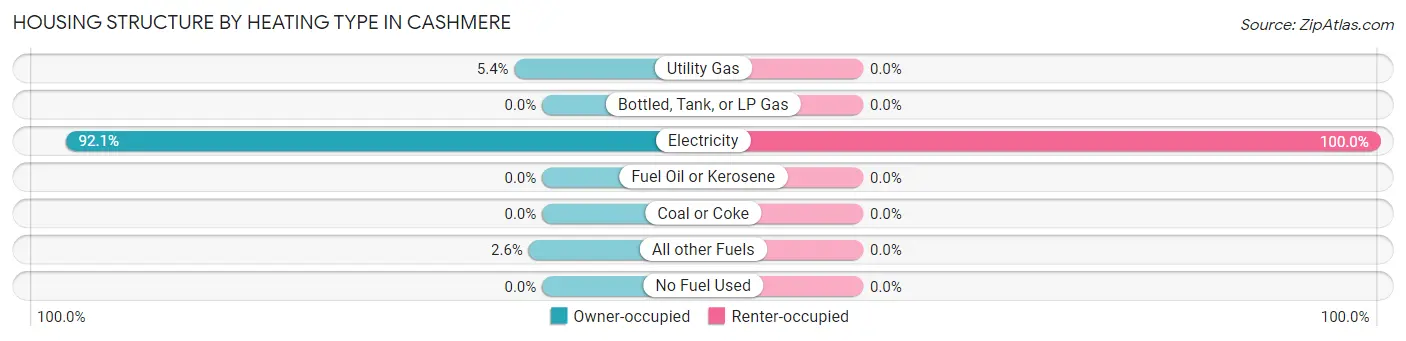
| Heating Type | Owner-occupied | Renter-occupied |
| Utility Gas | 33 (5.3%) | 0 (0.0%) |
| Bottled, Tank, or LP Gas | 0 (0.0%) | 0 (0.0%) |
| Electricity | 568 (92.1%) | 522 (100.0%) |
| Fuel Oil or Kerosene | 0 (0.0%) | 0 (0.0%) |
| Coal or Coke | 0 (0.0%) | 0 (0.0%) |
| All other Fuels | 16 (2.6%) | 0 (0.0%) |
| No Fuel Used | 0 (0.0%) | 0 (0.0%) |
| Total | 617 (100.0%) | 522 (100.0%) |
Household Vehicle Usage in Cashmere
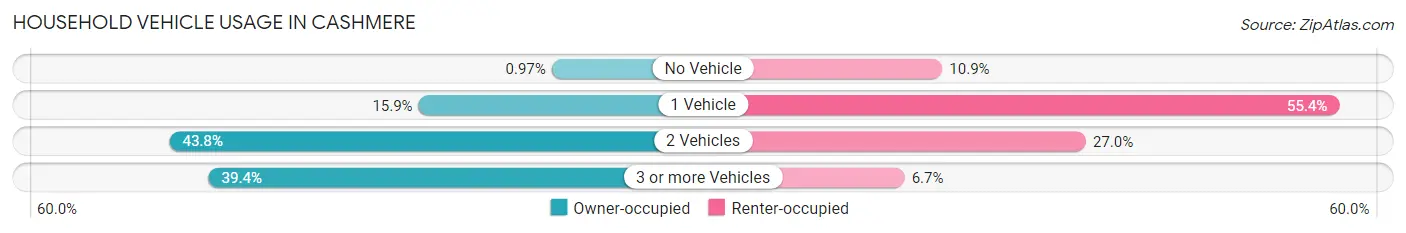
| Vehicles per Household | Owner-occupied | Renter-occupied |
| No Vehicle | 6 (1.0%) | 57 (10.9%) |
| 1 Vehicle | 98 (15.9%) | 289 (55.4%) |
| 2 Vehicles | 270 (43.8%) | 141 (27.0%) |
| 3 or more Vehicles | 243 (39.4%) | 35 (6.7%) |
| Total | 617 (100.0%) | 522 (100.0%) |
Real Estate & Mortgages in Cashmere
Real Estate and Mortgage Overview in Cashmere
| Characteristic | Without Mortgage | With Mortgage |
| Housing Units | 148 | 469 |
| Median Property Value | $270,000 | $374,500 |
| Median Household Income | $57,188 | $137 |
| Monthly Housing Costs | $391 | $110 |
| Real Estate Taxes | $2,054 | $0 |
Property Value by Mortgage Status in Cashmere
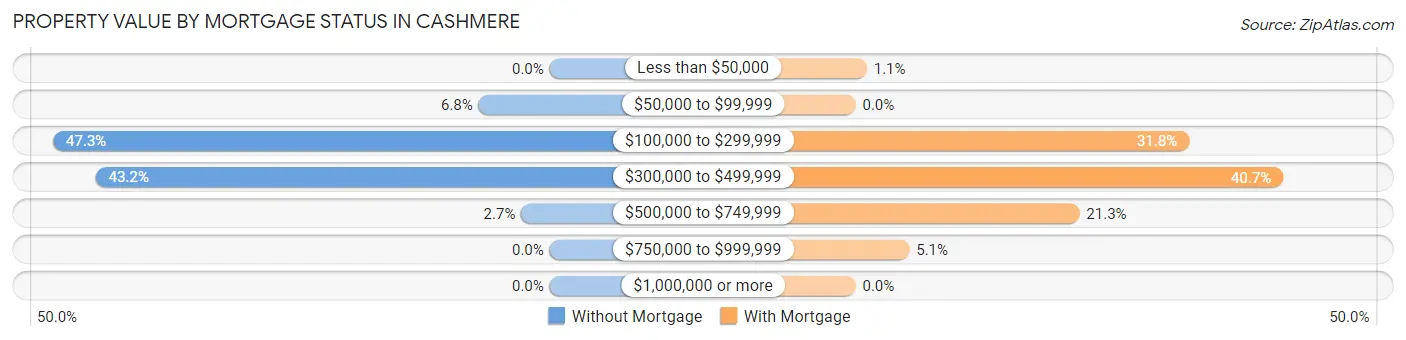
| Property Value | Without Mortgage | With Mortgage |
| Less than $50,000 | 0 (0.0%) | 5 (1.1%) |
| $50,000 to $99,999 | 10 (6.8%) | 0 (0.0%) |
| $100,000 to $299,999 | 70 (47.3%) | 149 (31.8%) |
| $300,000 to $499,999 | 64 (43.2%) | 191 (40.7%) |
| $500,000 to $749,999 | 4 (2.7%) | 100 (21.3%) |
| $750,000 to $999,999 | 0 (0.0%) | 24 (5.1%) |
| $1,000,000 or more | 0 (0.0%) | 0 (0.0%) |
| Total | 148 (100.0%) | 469 (100.0%) |
Household Income by Mortgage Status in Cashmere
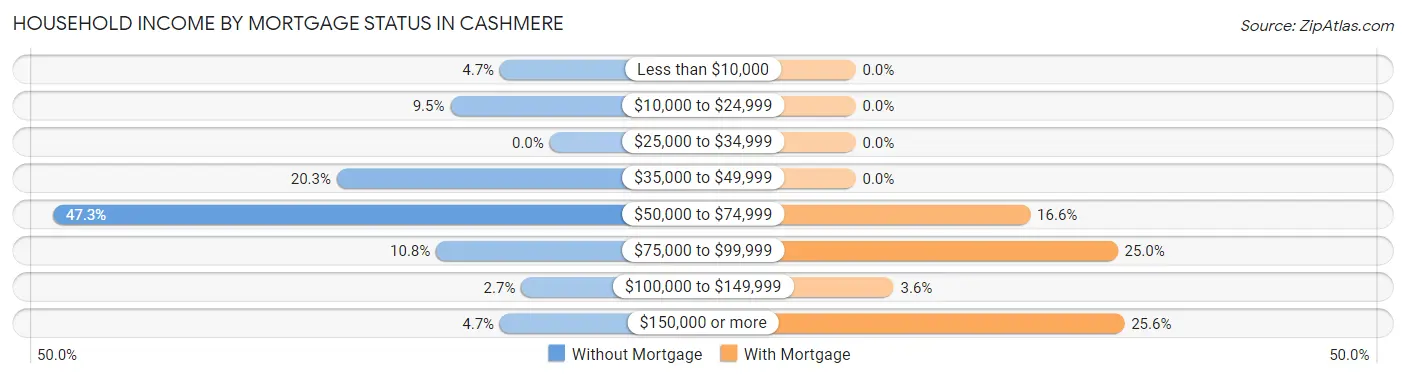
| Household Income | Without Mortgage | With Mortgage |
| Less than $10,000 | 7 (4.7%) | 0 (0.0%) |
| $10,000 to $24,999 | 14 (9.5%) | 0 (0.0%) |
| $25,000 to $34,999 | 0 (0.0%) | 0 (0.0%) |
| $35,000 to $49,999 | 30 (20.3%) | 0 (0.0%) |
| $50,000 to $74,999 | 70 (47.3%) | 78 (16.6%) |
| $75,000 to $99,999 | 16 (10.8%) | 117 (24.9%) |
| $100,000 to $149,999 | 4 (2.7%) | 17 (3.6%) |
| $150,000 or more | 7 (4.7%) | 120 (25.6%) |
| Total | 148 (100.0%) | 469 (100.0%) |
Property Value to Household Income Ratio in Cashmere
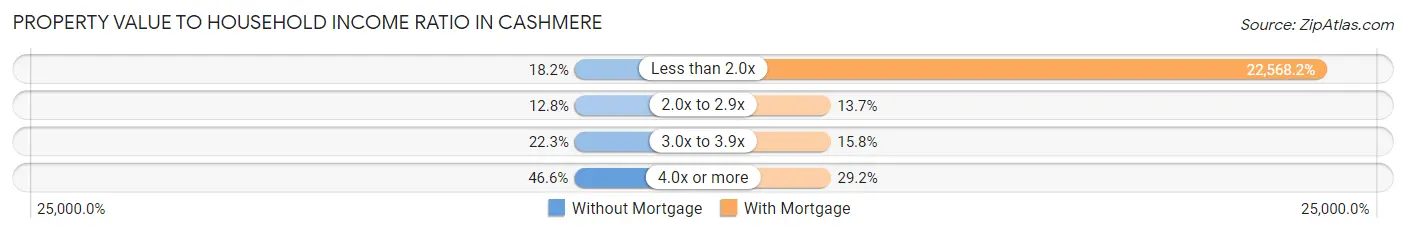
| Value-to-Income Ratio | Without Mortgage | With Mortgage |
| Less than 2.0x | 27 (18.2%) | 105,845 (22,568.2%) |
| 2.0x to 2.9x | 19 (12.8%) | 64 (13.7%) |
| 3.0x to 3.9x | 33 (22.3%) | 74 (15.8%) |
| 4.0x or more | 69 (46.6%) | 137 (29.2%) |
| Total | 148 (100.0%) | 469 (100.0%) |
Real Estate Taxes by Mortgage Status in Cashmere
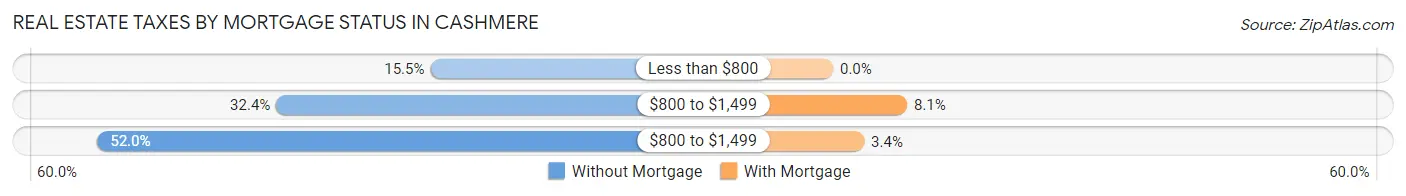
| Property Taxes | Without Mortgage | With Mortgage |
| Less than $800 | 23 (15.5%) | 0 (0.0%) |
| $800 to $1,499 | 48 (32.4%) | 38 (8.1%) |
| $800 to $1,499 | 77 (52.0%) | 16 (3.4%) |
| Total | 148 (100.0%) | 469 (100.0%) |
Health & Disability in Cashmere
Health Insurance Coverage by Age in Cashmere
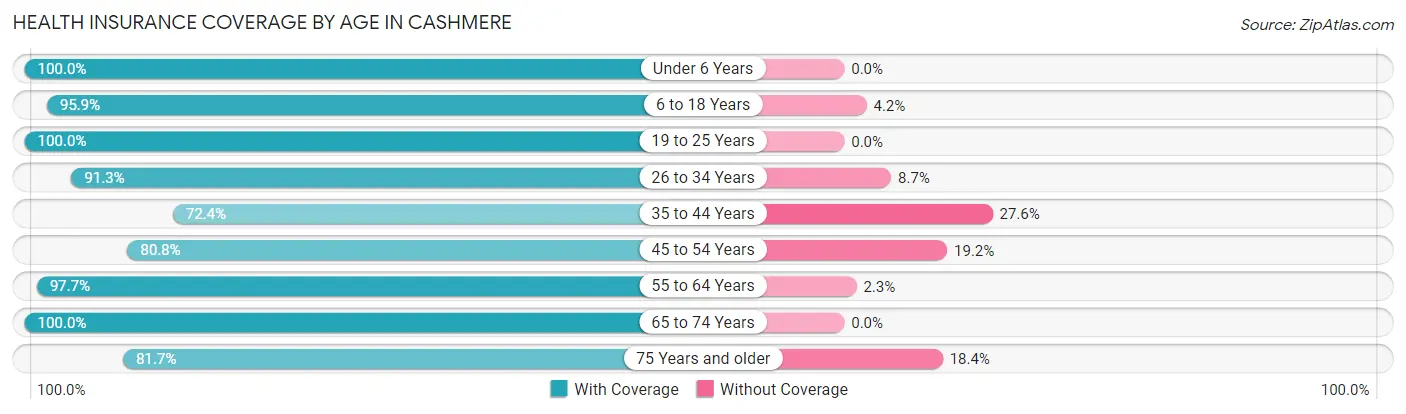
| Age Bracket | With Coverage | Without Coverage |
| Under 6 Years | 212 (100.0%) | 0 (0.0%) |
| 6 to 18 Years | 554 (95.9%) | 24 (4.2%) |
| 19 to 25 Years | 196 (100.0%) | 0 (0.0%) |
| 26 to 34 Years | 324 (91.3%) | 31 (8.7%) |
| 35 to 44 Years | 267 (72.4%) | 102 (27.6%) |
| 45 to 54 Years | 333 (80.8%) | 79 (19.2%) |
| 55 to 64 Years | 430 (97.7%) | 10 (2.3%) |
| 65 to 74 Years | 227 (100.0%) | 0 (0.0%) |
| 75 Years and older | 307 (81.7%) | 69 (18.3%) |
| Total | 2,850 (90.0%) | 315 (10.0%) |
Health Insurance Coverage by Citizenship Status in Cashmere
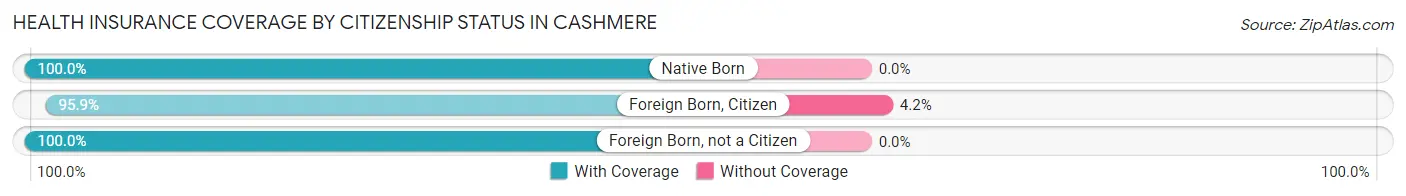
| Citizenship Status | With Coverage | Without Coverage |
| Native Born | 212 (100.0%) | 0 (0.0%) |
| Foreign Born, Citizen | 554 (95.9%) | 24 (4.2%) |
| Foreign Born, not a Citizen | 196 (100.0%) | 0 (0.0%) |
Health Insurance Coverage by Household Income in Cashmere
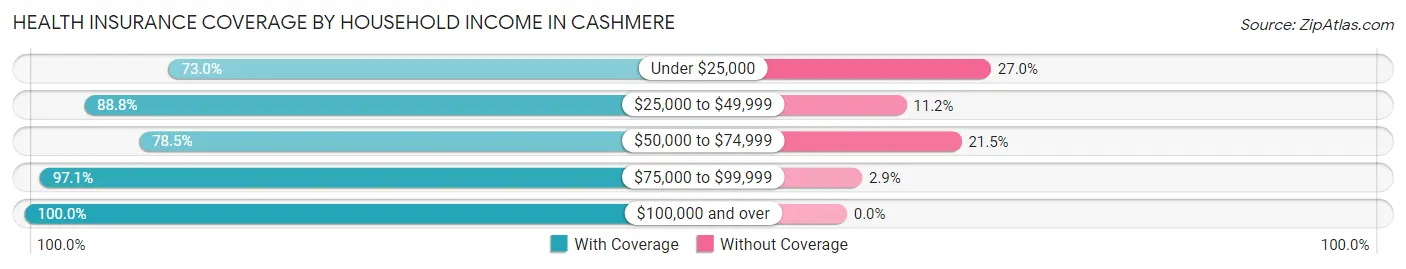
| Household Income | With Coverage | Without Coverage |
| Under $25,000 | 165 (73.0%) | 61 (27.0%) |
| $25,000 to $49,999 | 613 (88.8%) | 77 (11.2%) |
| $50,000 to $74,999 | 625 (78.5%) | 171 (21.5%) |
| $75,000 to $99,999 | 204 (97.1%) | 6 (2.9%) |
| $100,000 and over | 1,171 (100.0%) | 0 (0.0%) |
Public vs Private Health Insurance Coverage by Age in Cashmere
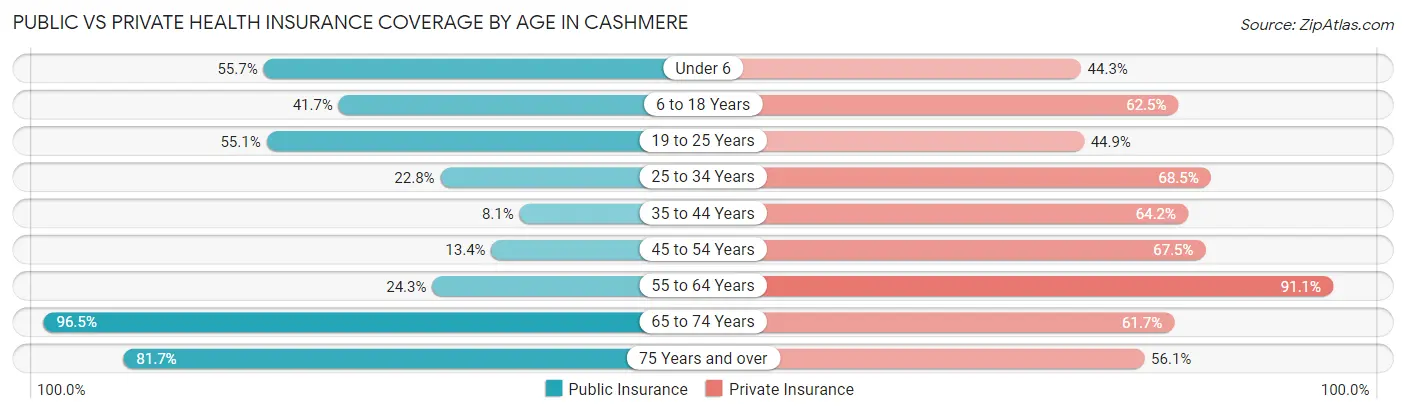
| Age Bracket | Public Insurance | Private Insurance |
| Under 6 | 118 (55.7%) | 94 (44.3%) |
| 6 to 18 Years | 241 (41.7%) | 361 (62.5%) |
| 19 to 25 Years | 108 (55.1%) | 88 (44.9%) |
| 25 to 34 Years | 81 (22.8%) | 243 (68.4%) |
| 35 to 44 Years | 30 (8.1%) | 237 (64.2%) |
| 45 to 54 Years | 55 (13.4%) | 278 (67.5%) |
| 55 to 64 Years | 107 (24.3%) | 401 (91.1%) |
| 65 to 74 Years | 219 (96.5%) | 140 (61.7%) |
| 75 Years and over | 307 (81.7%) | 211 (56.1%) |
| Total | 1,266 (40.0%) | 2,053 (64.9%) |
Disability Status by Sex by Age in Cashmere
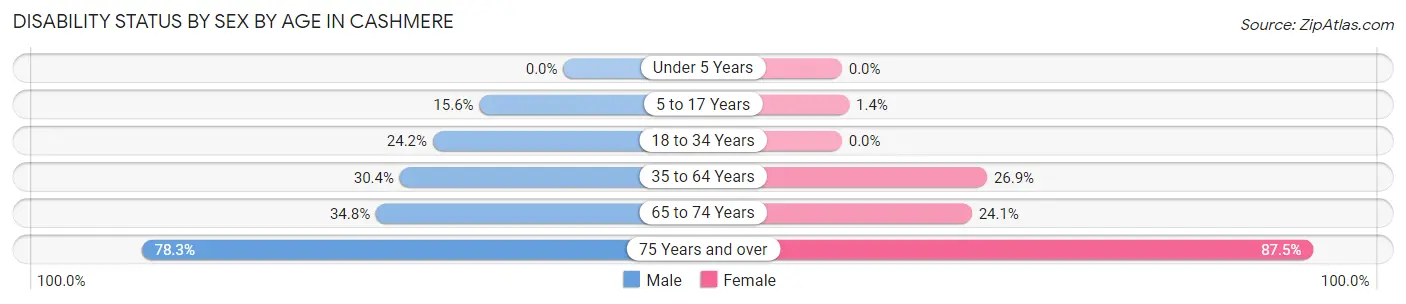
| Age Bracket | Male | Female |
| Under 5 Years | 0 (0.0%) | 0 (0.0%) |
| 5 to 17 Years | 50 (15.6%) | 4 (1.3%) |
| 18 to 34 Years | 62 (24.2%) | 0 (0.0%) |
| 35 to 64 Years | 187 (30.4%) | 163 (26.9%) |
| 65 to 74 Years | 40 (34.8%) | 27 (24.1%) |
| 75 Years and over | 119 (78.3%) | 196 (87.5%) |
Disability Class by Sex by Age in Cashmere
Disability Class: Hearing Difficulty
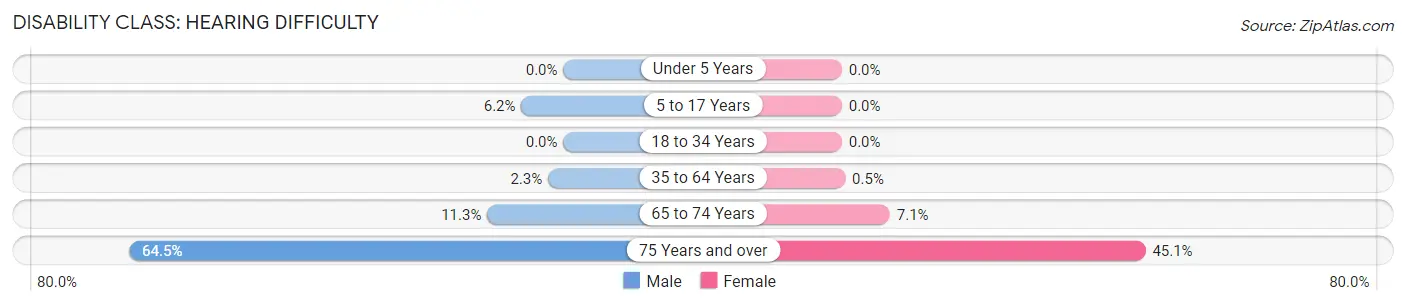
| Age Bracket | Male | Female |
| Under 5 Years | 0 (0.0%) | 0 (0.0%) |
| 5 to 17 Years | 20 (6.2%) | 0 (0.0%) |
| 18 to 34 Years | 0 (0.0%) | 0 (0.0%) |
| 35 to 64 Years | 14 (2.3%) | 3 (0.5%) |
| 65 to 74 Years | 13 (11.3%) | 8 (7.1%) |
| 75 Years and over | 98 (64.5%) | 101 (45.1%) |
Disability Class: Vision Difficulty
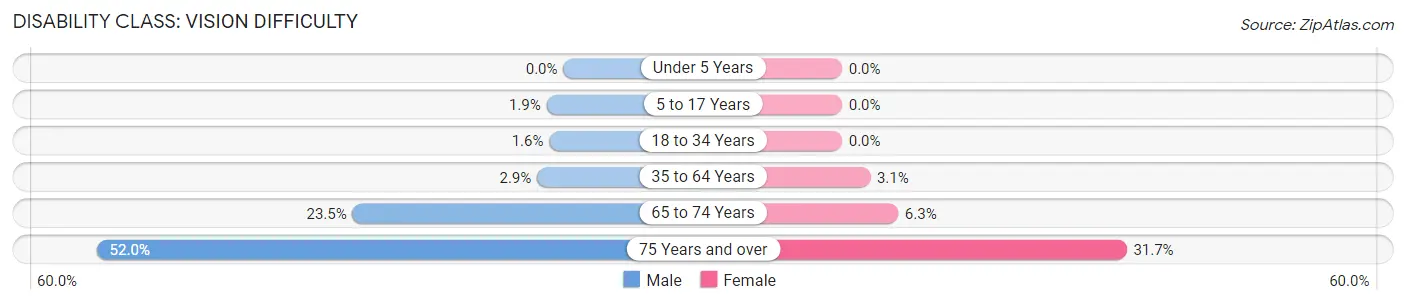
| Age Bracket | Male | Female |
| Under 5 Years | 0 (0.0%) | 0 (0.0%) |
| 5 to 17 Years | 6 (1.9%) | 0 (0.0%) |
| 18 to 34 Years | 4 (1.6%) | 0 (0.0%) |
| 35 to 64 Years | 18 (2.9%) | 19 (3.1%) |
| 65 to 74 Years | 27 (23.5%) | 7 (6.2%) |
| 75 Years and over | 79 (52.0%) | 71 (31.7%) |
Disability Class: Cognitive Difficulty
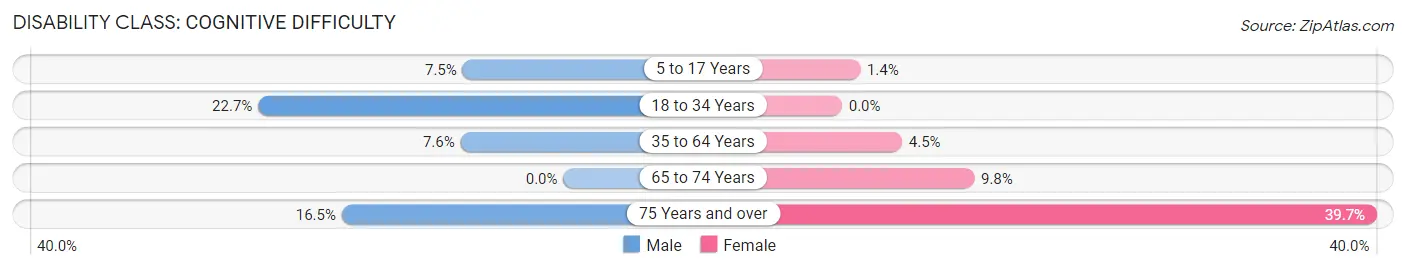
| Age Bracket | Male | Female |
| 5 to 17 Years | 24 (7.5%) | 4 (1.3%) |
| 18 to 34 Years | 58 (22.7%) | 0 (0.0%) |
| 35 to 64 Years | 47 (7.6%) | 27 (4.5%) |
| 65 to 74 Years | 0 (0.0%) | 11 (9.8%) |
| 75 Years and over | 25 (16.5%) | 89 (39.7%) |
Disability Class: Ambulatory Difficulty
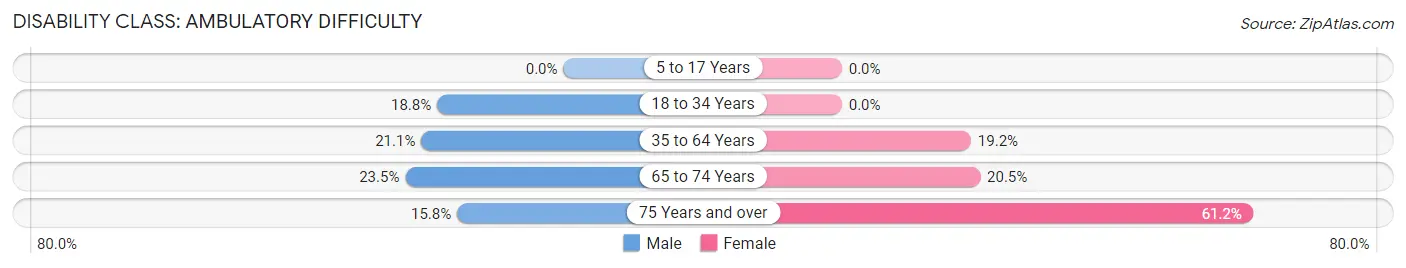
| Age Bracket | Male | Female |
| 5 to 17 Years | 0 (0.0%) | 0 (0.0%) |
| 18 to 34 Years | 48 (18.8%) | 0 (0.0%) |
| 35 to 64 Years | 130 (21.1%) | 116 (19.2%) |
| 65 to 74 Years | 27 (23.5%) | 23 (20.5%) |
| 75 Years and over | 24 (15.8%) | 137 (61.2%) |
Disability Class: Self-Care Difficulty
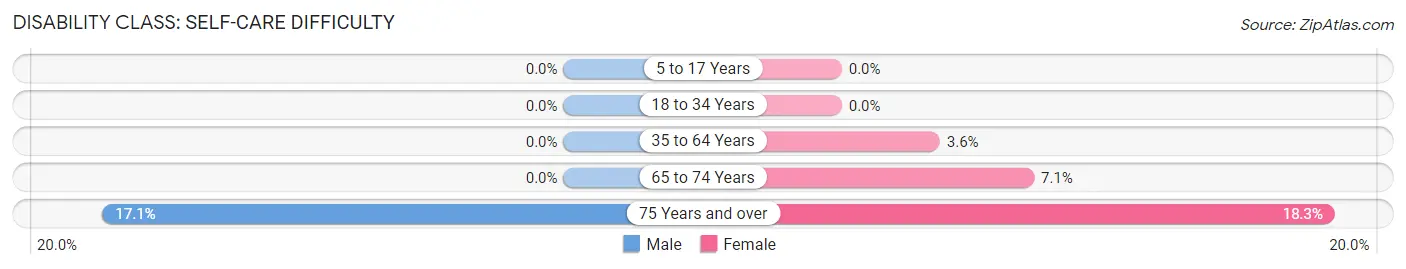
| Age Bracket | Male | Female |
| 5 to 17 Years | 0 (0.0%) | 0 (0.0%) |
| 18 to 34 Years | 0 (0.0%) | 0 (0.0%) |
| 35 to 64 Years | 0 (0.0%) | 22 (3.6%) |
| 65 to 74 Years | 0 (0.0%) | 8 (7.1%) |
| 75 Years and over | 26 (17.1%) | 41 (18.3%) |
Technology Access in Cashmere
Computing Device Access in Cashmere
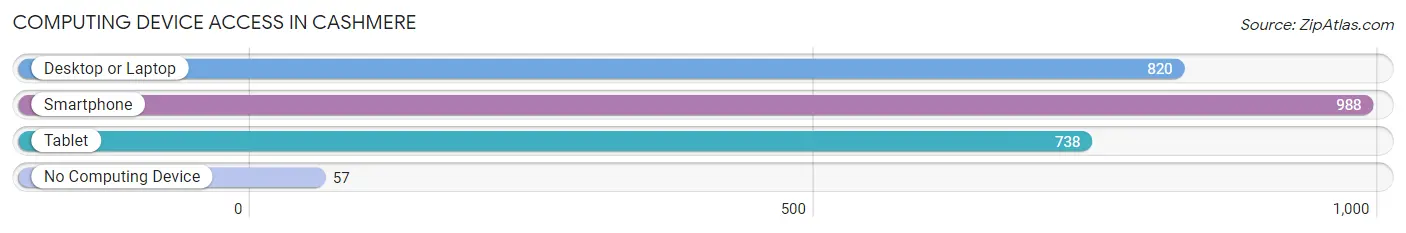
| Device Type | # Households | % Households |
| Desktop or Laptop | 820 | 72.0% |
| Smartphone | 988 | 86.7% |
| Tablet | 738 | 64.8% |
| No Computing Device | 57 | 5.0% |
| Total | 1,139 | 100.0% |
Internet Access in Cashmere
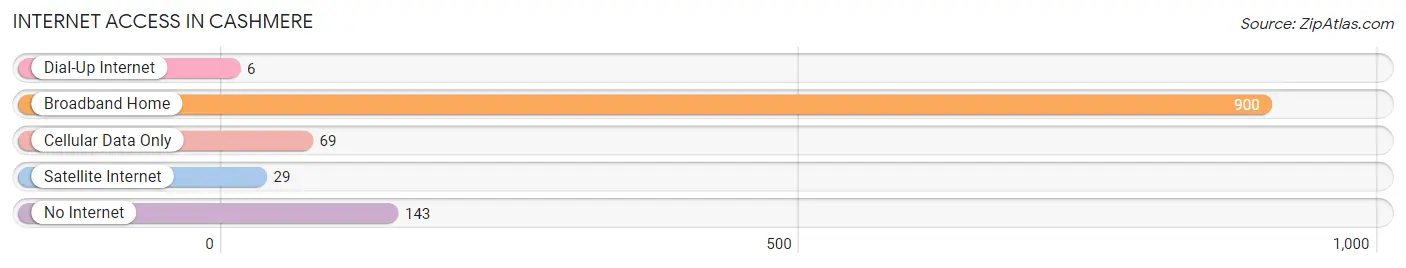
| Internet Type | # Households | % Households |
| Dial-Up Internet | 6 | 0.5% |
| Broadband Home | 900 | 79.0% |
| Cellular Data Only | 69 | 6.1% |
| Satellite Internet | 29 | 2.5% |
| No Internet | 143 | 12.6% |
| Total | 1,139 | 100.0% |
Cashmere Summary
Introduction
Located in the heart of the Cascade Mountains in Washington State, the small city of Cashmere is a picturesque community with a rich history, diverse geography, and a vibrant economy. With a population of just over 3,000 people, Cashmere is a small but vibrant city that has been home to generations of families and businesses. This paper will explore the history, geography, economy, and demographics of Cashmere in 2000 words.
History
The history of Cashmere dates back to the mid-1800s when the area was first settled by pioneers. The first settlers were mostly farmers and ranchers who were attracted to the area by its fertile soil and abundant water supply. The first post office was established in 1883 and the town was officially incorporated in 1891.
The early settlers of Cashmere were mostly of European descent, but the population also included Native Americans, Chinese, and Japanese immigrants. The town was a major hub for the timber industry, and the local economy was largely based on logging and lumber production.
In the early 1900s, Cashmere was a bustling town with a variety of businesses, including a bank, a hotel, a movie theater, and several stores. The town was also home to a number of churches, schools, and other civic organizations.
Geography
Cashmere is located in the Wenatchee Valley, which is part of the Cascade Mountains in Washington State. The city is situated at the confluence of the Wenatchee and Columbia Rivers, and is surrounded by mountains and forests. The city is located at an elevation of 1,400 feet, and the average annual temperature is around 50 degrees Fahrenheit.
The city is divided into two distinct areas: the downtown area and the residential area. The downtown area is home to a variety of businesses, including restaurants, shops, and other services. The residential area is made up of single-family homes, apartments, and condominiums.
Economy
The economy of Cashmere is largely based on agriculture, tourism, and manufacturing. The city is home to a number of fruit orchards, vineyards, and other agricultural operations. The city is also a popular tourist destination, and the local economy benefits from the influx of visitors each year.
Manufacturing is also an important part of the local economy. The city is home to a number of factories and industrial plants, including a paper mill, a lumber mill, and a food processing plant.
Demographics
As of the 2010 census, the population of Cashmere was 3,074. The population is predominantly white (90.2%), with a small percentage of African Americans (2.2%), Asians (2.1%), and Native Americans (1.2%). The median household income is $45,000, and the median age is 39.
Conclusion
Cashmere is a small but vibrant city with a rich history, diverse geography, and a vibrant economy. The city is home to a variety of businesses, including restaurants, shops, and other services. The local economy is largely based on agriculture, tourism, and manufacturing. The population is predominantly white, with a small percentage of African Americans, Asians, and Native Americans. Cashmere is a great place to live, work, and visit.
Common Questions
What is the Total Population of Cashmere?
Total Population of Cashmere is 3,244.
What is the Total Male Population of Cashmere?
Total Male Population of Cashmere is 1,551.
What is the Total Female Population of Cashmere?
Total Female Population of Cashmere is 1,693.
What is the Ratio of Males per 100 Females in Cashmere?
There are 91.61 Males per 100 Females in Cashmere.
What is the Ratio of Females per 100 Males in Cashmere?
There are 109.16 Females per 100 Males in Cashmere.
What is the Median Population Age in Cashmere?
Median Population Age in Cashmere is 43.8 Years.
What is the Average Family Size in Cashmere
Average Family Size in Cashmere is 3.4 People.
What is the Average Household Size in Cashmere
Average Household Size in Cashmere is 2.7 People.
What is Per Capita Income in Cashmere?
Per Capita income in Cashmere is $29,672.
What is the Median Family Income in Cashmere?
Median Family Income in Cashmere is $68,255.
What is the Median Household income in Cashmere?
Median Household Income in Cashmere is $60,597.
What is Income or Wage Gap in Cashmere?
Income or Wage Gap in Cashmere is 21.9%.
Women in Cashmere earn 78.1 cents for every dollar earned by a man.
What is Inequality or Gini Index in Cashmere?
Inequality or Gini Index in Cashmere is 0.44.
How Large is the Labor Force in Cashmere?
There are 1,474 People in the Labor Forcein in Cashmere.
What is the Percentage of People in the Labor Force in Cashmere?
56.8% of People are in the Labor Force in Cashmere.
What is the Unemployment Rate in Cashmere?
Unemployment Rate in Cashmere is 1.1%.