Alderton, WA
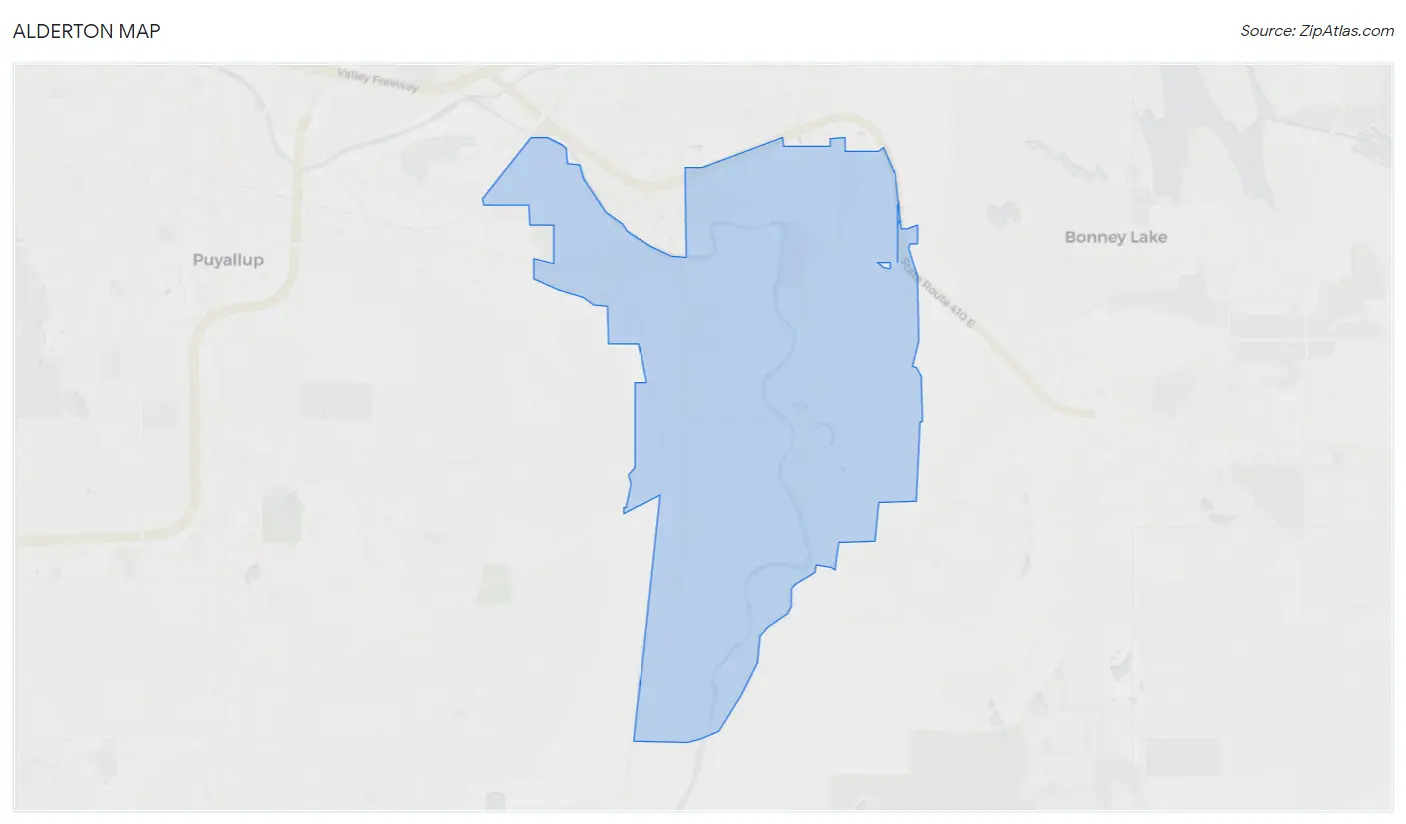
Alderton Map
Alderton Overview
2,686
TOTAL POPULATION
1,227
MALE POPULATION
1,459
FEMALE POPULATION
84.10
MALES / 100 FEMALES
118.91
FEMALES / 100 MALES
45.2
MEDIAN AGE
3.1
AVG FAMILY SIZE
2.6
AVG HOUSEHOLD SIZE
$51,668
PER CAPITA INCOME
$94,926
AVG FAMILY INCOME
$93,008
AVG HOUSEHOLD INCOME
29.2%
WAGE / INCOME GAP [ % ]
70.8¢/ $1
WAGE / INCOME GAP [ $ ]
$22,418
FAMILY INCOME DEFICIT
0.44
INEQUALITY / GINI INDEX
1,530
LABOR FORCE [ PEOPLE ]
66.4%
PERCENT IN LABOR FORCE
9.1%
UNEMPLOYMENT RATE
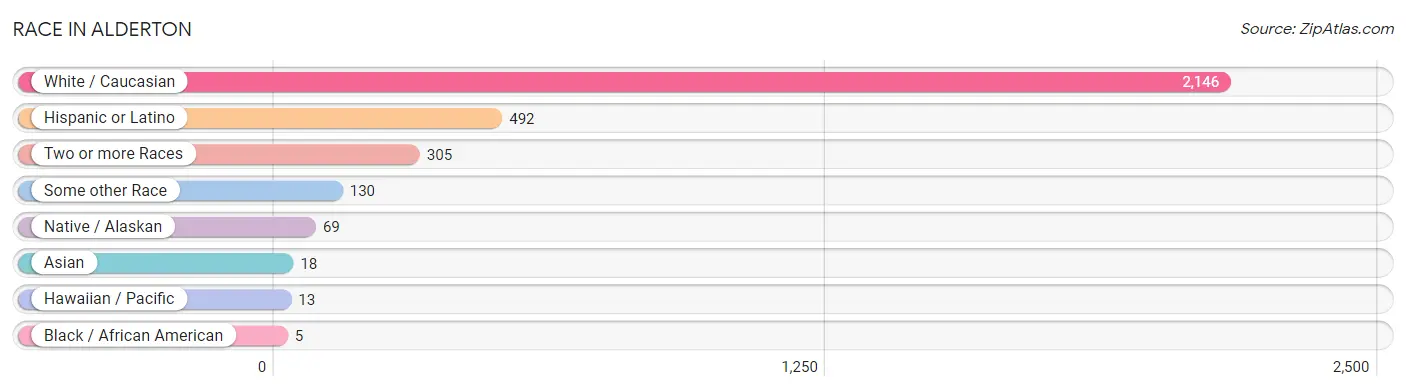
Race in Alderton
The most populous races in Alderton are White / Caucasian (2,146 | 79.9%), Hispanic or Latino (492 | 18.3%), and Two or more Races (305 | 11.4%).
| Race | # Population | % Population |
| Asian | 18 | 0.7% |
| Black / African American | 5 | 0.2% |
| Hawaiian / Pacific | 13 | 0.5% |
| Hispanic or Latino | 492 | 18.3% |
| Native / Alaskan | 69 | 2.6% |
| White / Caucasian | 2,146 | 79.9% |
| Two or more Races | 305 | 11.4% |
| Some other Race | 130 | 4.8% |
| Total | 2,686 | 100.0% |
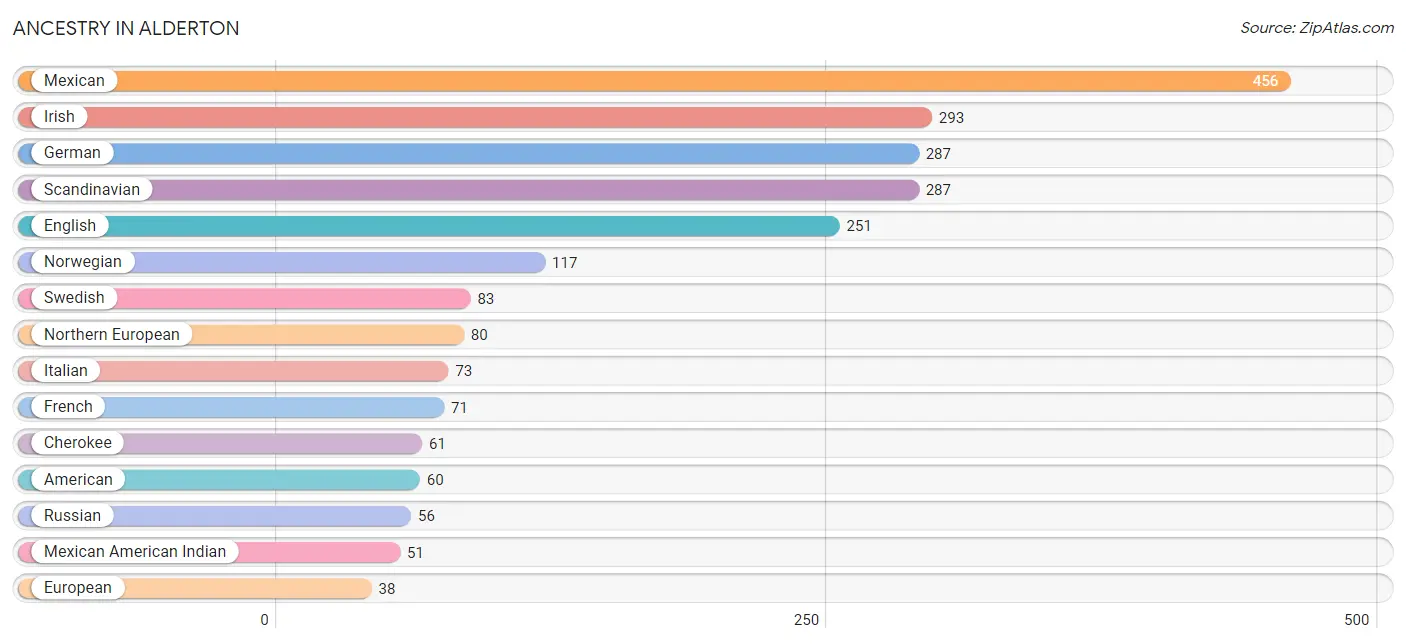
Ancestry in Alderton
The most populous ancestries reported in Alderton are Mexican (456 | 17.0%), Irish (293 | 10.9%), German (287 | 10.7%), Scandinavian (287 | 10.7%), and English (251 | 9.3%), together accounting for 58.6% of all Alderton residents.
| Ancestry | # Population | % Population |
| American | 60 | 2.2% |
| Belgian | 8 | 0.3% |
| Blackfeet | 24 | 0.9% |
| Burmese | 1 | 0.0% |
| Cherokee | 61 | 2.3% |
| Choctaw | 9 | 0.3% |
| Czech | 6 | 0.2% |
| Dutch | 6 | 0.2% |
| Eastern European | 24 | 0.9% |
| English | 251 | 9.3% |
| European | 38 | 1.4% |
| Finnish | 25 | 0.9% |
| French | 71 | 2.6% |
| French Canadian | 6 | 0.2% |
| German | 287 | 10.7% |
| Greek | 23 | 0.9% |
| Guamanian / Chamorro | 8 | 0.3% |
| Hungarian | 9 | 0.3% |
| Irish | 293 | 10.9% |
| Italian | 73 | 2.7% |
| Korean | 17 | 0.6% |
| Mexican | 456 | 17.0% |
| Mexican American Indian | 51 | 1.9% |
| Native Hawaiian | 5 | 0.2% |
| Northern European | 80 | 3.0% |
| Norwegian | 117 | 4.4% |
| Polish | 34 | 1.3% |
| Portuguese | 2 | 0.1% |
| Puerto Rican | 17 | 0.6% |
| Russian | 56 | 2.1% |
| Scandinavian | 287 | 10.7% |
| Scotch-Irish | 35 | 1.3% |
| Scottish | 32 | 1.2% |
| Slavic | 6 | 0.2% |
| Slovene | 16 | 0.6% |
| Swedish | 83 | 3.1% |
| Swiss | 4 | 0.2% |
| Ukrainian | 10 | 0.4% | View All 38 Rows |
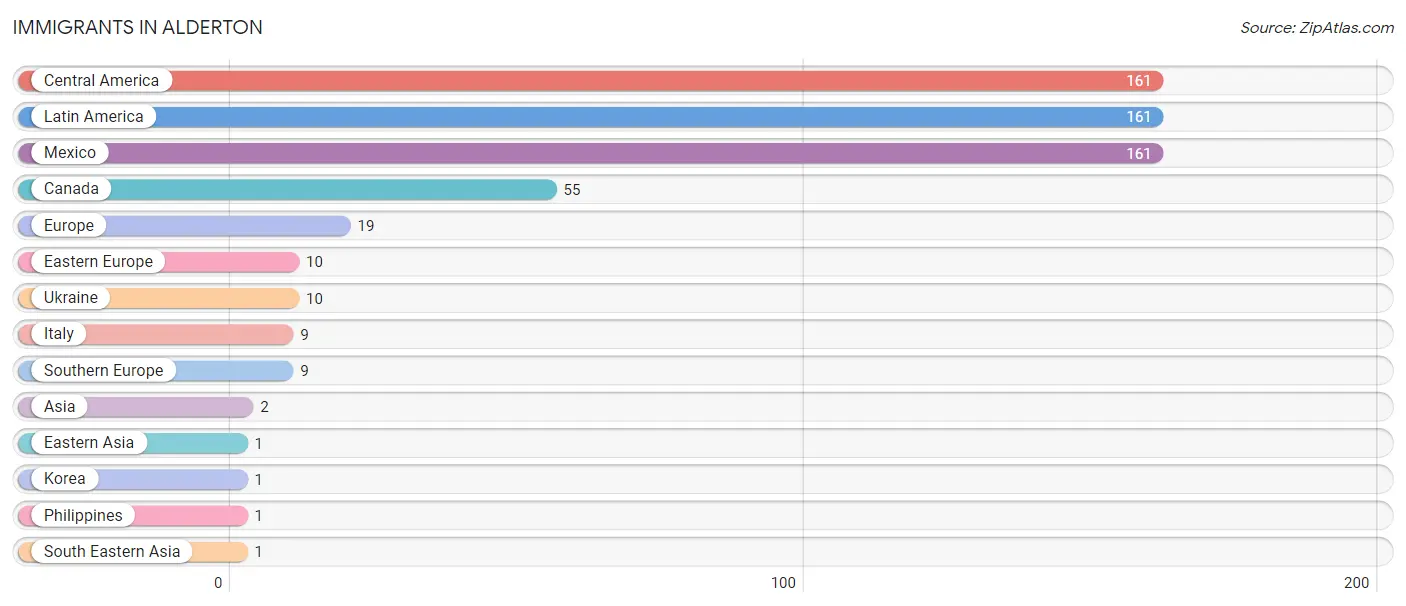
Immigrants in Alderton
The most numerous immigrant groups reported in Alderton came from Central America (161 | 6.0%), Latin America (161 | 6.0%), Mexico (161 | 6.0%), Canada (55 | 2.1%), and Europe (19 | 0.7%), together accounting for 20.7% of all Alderton residents.
| Immigration Origin | # Population | % Population |
| Asia | 2 | 0.1% |
| Canada | 55 | 2.1% |
| Central America | 161 | 6.0% |
| Eastern Asia | 1 | 0.0% |
| Eastern Europe | 10 | 0.4% |
| Europe | 19 | 0.7% |
| Italy | 9 | 0.3% |
| Korea | 1 | 0.0% |
| Latin America | 161 | 6.0% |
| Mexico | 161 | 6.0% |
| Philippines | 1 | 0.0% |
| South Eastern Asia | 1 | 0.0% |
| Southern Europe | 9 | 0.3% |
| Ukraine | 10 | 0.4% | View All 14 Rows |
Sex and Age in Alderton
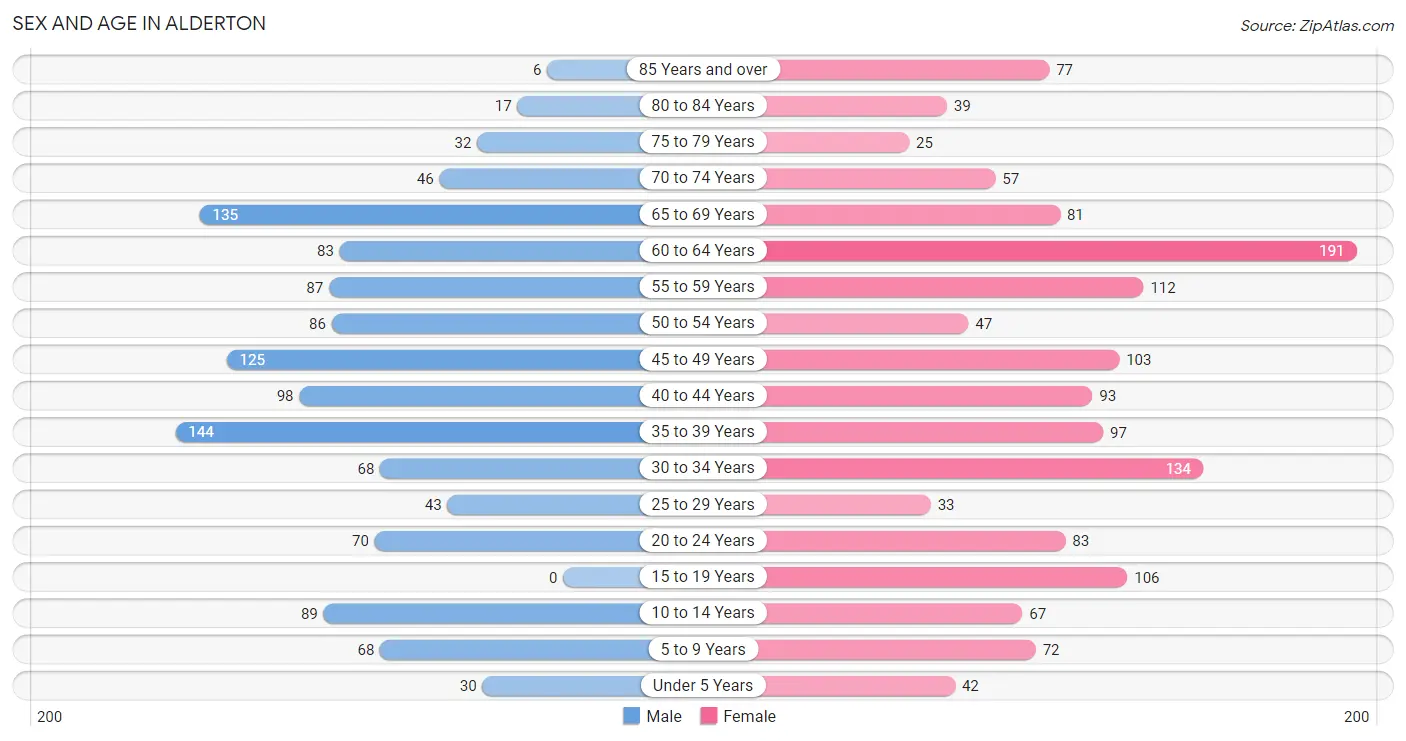
Sex and Age in Alderton
The most populous age groups in Alderton are 35 to 39 Years (144 | 11.7%) for men and 60 to 64 Years (191 | 13.1%) for women.
| Age Bracket | Male | Female |
| Under 5 Years | 30 (2.4%) | 42 (2.9%) |
| 5 to 9 Years | 68 (5.5%) | 72 (4.9%) |
| 10 to 14 Years | 89 (7.2%) | 67 (4.6%) |
| 15 to 19 Years | 0 (0.0%) | 106 (7.3%) |
| 20 to 24 Years | 70 (5.7%) | 83 (5.7%) |
| 25 to 29 Years | 43 (3.5%) | 33 (2.3%) |
| 30 to 34 Years | 68 (5.5%) | 134 (9.2%) |
| 35 to 39 Years | 144 (11.7%) | 97 (6.7%) |
| 40 to 44 Years | 98 (8.0%) | 93 (6.4%) |
| 45 to 49 Years | 125 (10.2%) | 103 (7.1%) |
| 50 to 54 Years | 86 (7.0%) | 47 (3.2%) |
| 55 to 59 Years | 87 (7.1%) | 112 (7.7%) |
| 60 to 64 Years | 83 (6.8%) | 191 (13.1%) |
| 65 to 69 Years | 135 (11.0%) | 81 (5.6%) |
| 70 to 74 Years | 46 (3.7%) | 57 (3.9%) |
| 75 to 79 Years | 32 (2.6%) | 25 (1.7%) |
| 80 to 84 Years | 17 (1.4%) | 39 (2.7%) |
| 85 Years and over | 6 (0.5%) | 77 (5.3%) |
| Total | 1,227 (100.0%) | 1,459 (100.0%) |
Families and Households in Alderton
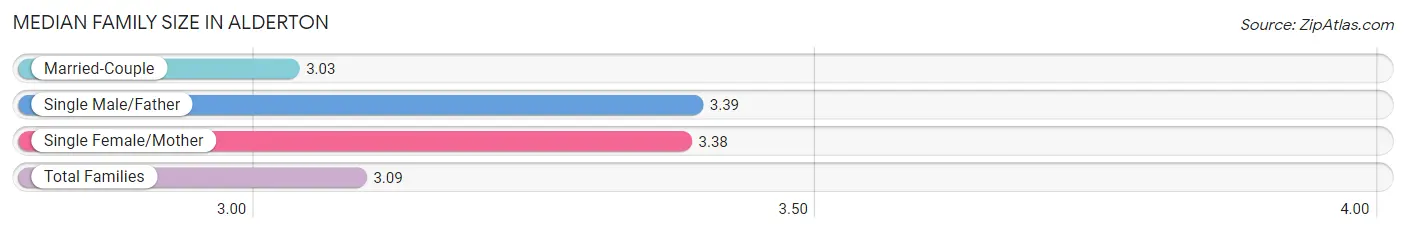
Median Family Size in Alderton
The median family size in Alderton is 3.09 persons per family, with single male/father families (41 | 6.1%) accounting for the largest median family size of 3.39 persons per family. On the other hand, married-couple families (566 | 83.9%) represent the smallest median family size with 3.03 persons per family.
| Family Type | # Families | Family Size |
| Married-Couple | 566 (83.9%) | 3.03 |
| Single Male/Father | 41 (6.1%) | 3.39 |
| Single Female/Mother | 68 (10.1%) | 3.38 |
| Total Families | 675 (100.0%) | 3.09 |
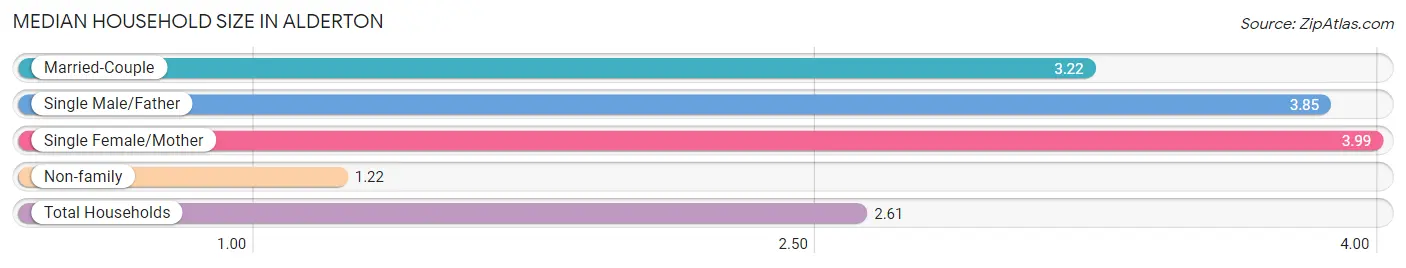
Median Household Size in Alderton
The median household size in Alderton is 2.61 persons per household, with single female/mother households (68 | 6.6%) accounting for the largest median household size of 3.99 persons per household. non-family households (352 | 34.3%) represent the smallest median household size with 1.22 persons per household.
| Household Type | # Households | Household Size |
| Married-Couple | 566 (55.1%) | 3.22 |
| Single Male/Father | 41 (4.0%) | 3.85 |
| Single Female/Mother | 68 (6.6%) | 3.99 |
| Non-family | 352 (34.3%) | 1.22 |
| Total Households | 1,027 (100.0%) | 2.61 |
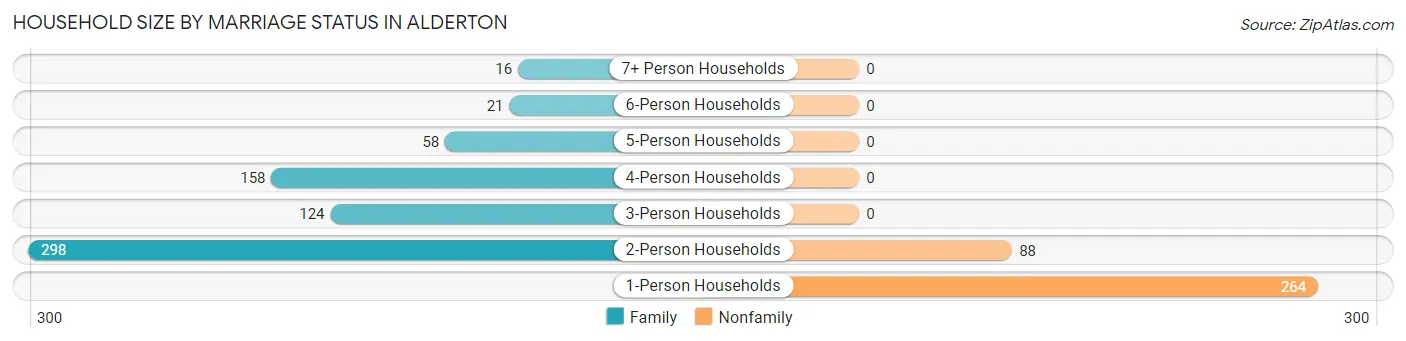
Household Size by Marriage Status in Alderton
Out of a total of 1,027 households in Alderton, 675 (65.7%) are family households, while 352 (34.3%) are nonfamily households. The most numerous type of family households are 2-person households, comprising 298, and the most common type of nonfamily households are 1-person households, comprising 264.
| Household Size | Family Households | Nonfamily Households |
| 1-Person Households | - | 264 (25.7%) |
| 2-Person Households | 298 (29.0%) | 88 (8.6%) |
| 3-Person Households | 124 (12.1%) | 0 (0.0%) |
| 4-Person Households | 158 (15.4%) | 0 (0.0%) |
| 5-Person Households | 58 (5.7%) | 0 (0.0%) |
| 6-Person Households | 21 (2.0%) | 0 (0.0%) |
| 7+ Person Households | 16 (1.6%) | 0 (0.0%) |
| Total | 675 (65.7%) | 352 (34.3%) |
Female Fertility in Alderton
Fertility by Age in Alderton
Average fertility rate in Alderton is 29.0 births per 1,000 women. Women in the age bracket of 20 to 34 years have the highest fertility rate with 76.0 births per 1,000 women. Women in the age bracket of 20 to 34 years acount for 100.0% of all women with births.
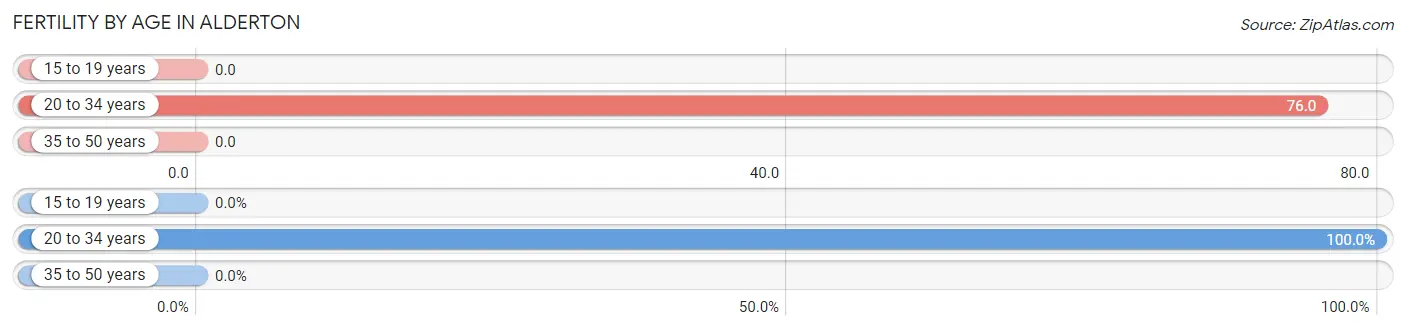
| Age Bracket | Women with Births | Births / 1,000 Women |
| 15 to 19 years | 0 (0.0%) | 0.0 |
| 20 to 34 years | 19 (100.0%) | 76.0 |
| 35 to 50 years | 0 (0.0%) | 0.0 |
| Total | 19 (100.0%) | 29.0 |
Fertility by Age by Marriage Status in Alderton
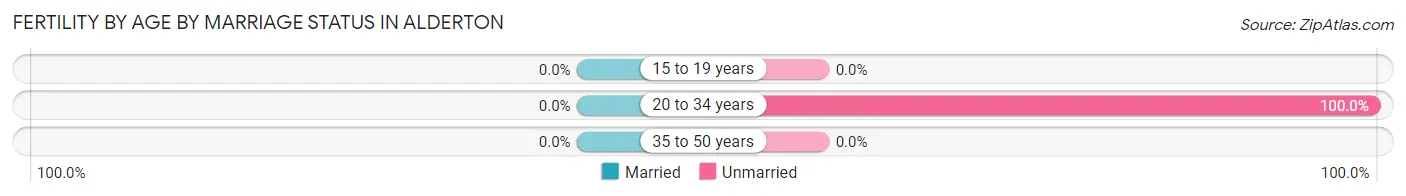
| Age Bracket | Married | Unmarried |
| 15 to 19 years | 0 (0.0%) | 0 (0.0%) |
| 20 to 34 years | 0 (0.0%) | 19 (100.0%) |
| 35 to 50 years | 0 (0.0%) | 0 (0.0%) |
| Total | 0 (0.0%) | 19 (100.0%) |
Fertility by Education in Alderton
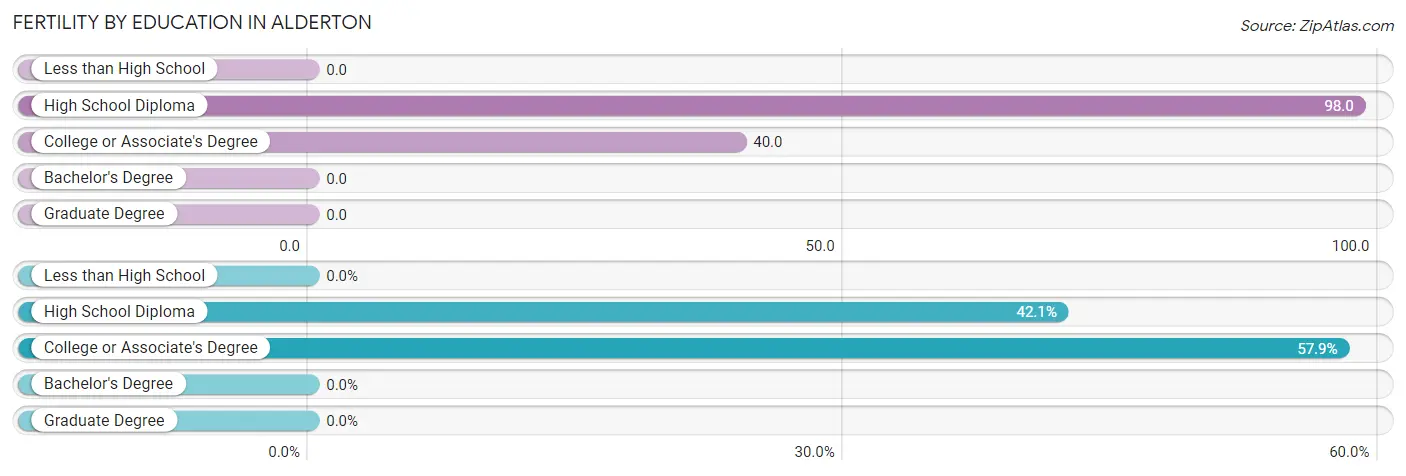
| Educational Attainment | Women with Births | Births / 1,000 Women |
| Less than High School | 0 (0.0%) | 0.0 |
| High School Diploma | 8 (42.1%) | 98.0 |
| College or Associate's Degree | 11 (57.9%) | 40.0 |
| Bachelor's Degree | 0 (0.0%) | 0.0 |
| Graduate Degree | 0 (0.0%) | 0.0 |
| Total | 19 (100.0%) | 29.0 |
Fertility by Education by Marriage Status in Alderton
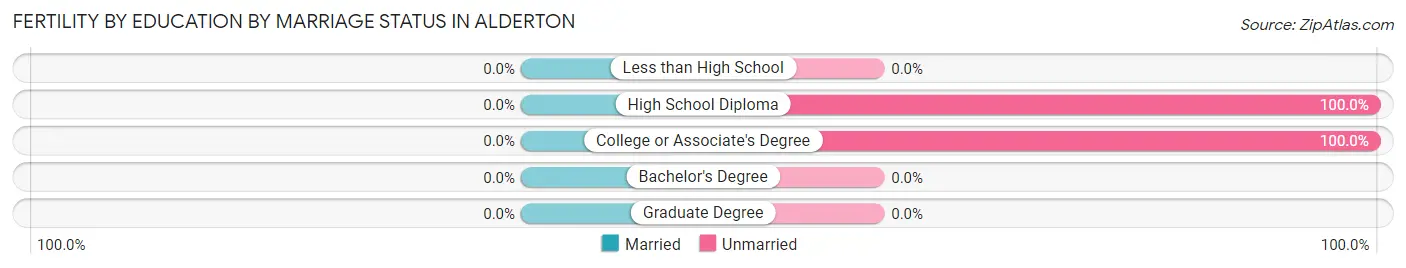
| Educational Attainment | Married | Unmarried |
| Less than High School | 0 (0.0%) | 0 (0.0%) |
| High School Diploma | 0 (0.0%) | 8 (100.0%) |
| College or Associate's Degree | 0 (0.0%) | 11 (100.0%) |
| Bachelor's Degree | 0 (0.0%) | 0 (0.0%) |
| Graduate Degree | 0 (0.0%) | 0 (0.0%) |
| Total | 0 (0.0%) | 19 (100.0%) |
Income in Alderton
Income Overview in Alderton
Per Capita Income in Alderton is $51,668, while median incomes of families and households are $94,926 and $93,008 respectively.
| Characteristic | Number | Measure |
| Per Capita Income | 2,686 | $51,668 |
| Median Family Income | 675 | $94,926 |
| Mean Family Income | 675 | $137,337 |
| Median Household Income | 1,027 | $93,008 |
| Mean Household Income | 1,027 | $132,224 |
| Income Deficit | 675 | $22,418 |
| Wage / Income Gap (%) | 2,686 | 29.21% |
| Wage / Income Gap ($) | 2,686 | 70.79¢ per $1 |
| Gini / Inequality Index | 2,686 | 0.44 |
Earnings by Sex in Alderton
Average Earnings in Alderton are $54,946, $58,750 for men and $41,591 for women, a difference of 29.2%.
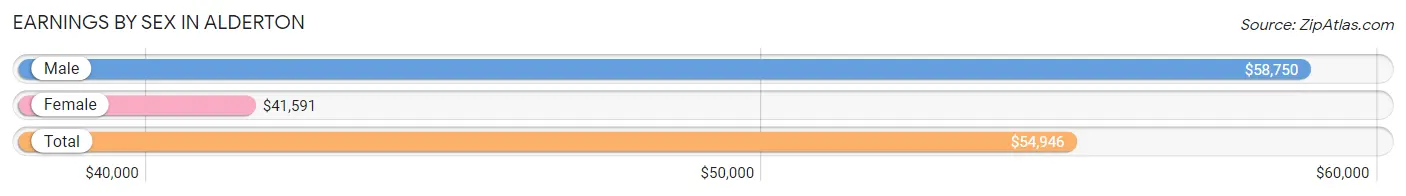
| Sex | Number | Average Earnings |
| Male | 877 (52.4%) | $58,750 |
| Female | 798 (47.6%) | $41,591 |
| Total | 1,675 (100.0%) | $54,946 |
Earnings by Sex by Income Bracket in Alderton
The most common earnings brackets in Alderton are $100,000+ for men (191 | 21.8%) and $75,000 to $99,999 for women (128 | 16.0%).
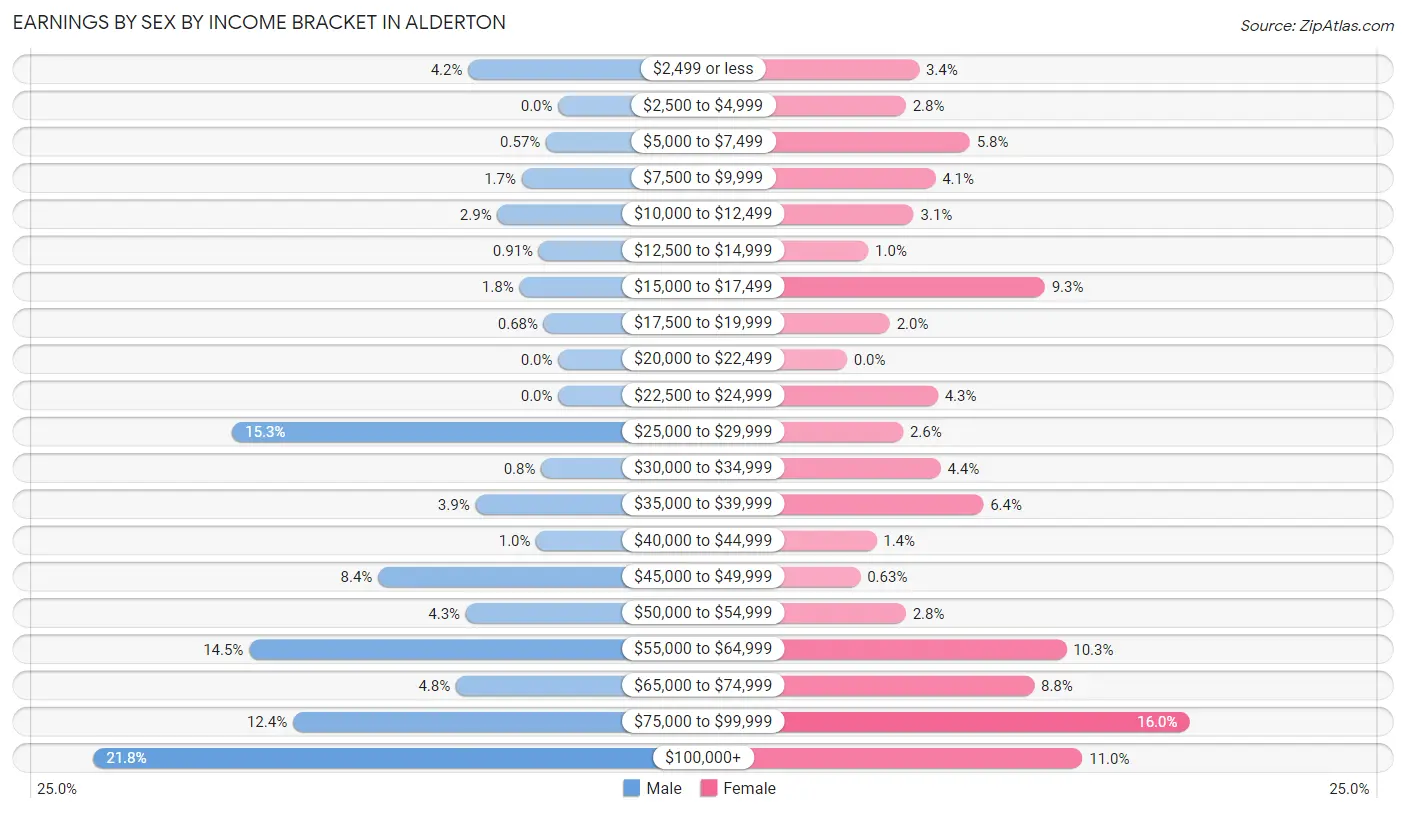
| Income | Male | Female |
| $2,499 or less | 37 (4.2%) | 27 (3.4%) |
| $2,500 to $4,999 | 0 (0.0%) | 22 (2.8%) |
| $5,000 to $7,499 | 5 (0.6%) | 46 (5.8%) |
| $7,500 to $9,999 | 15 (1.7%) | 33 (4.1%) |
| $10,000 to $12,499 | 25 (2.9%) | 25 (3.1%) |
| $12,500 to $14,999 | 8 (0.9%) | 8 (1.0%) |
| $15,000 to $17,499 | 16 (1.8%) | 74 (9.3%) |
| $17,500 to $19,999 | 6 (0.7%) | 16 (2.0%) |
| $20,000 to $22,499 | 0 (0.0%) | 0 (0.0%) |
| $22,500 to $24,999 | 0 (0.0%) | 34 (4.3%) |
| $25,000 to $29,999 | 134 (15.3%) | 21 (2.6%) |
| $30,000 to $34,999 | 7 (0.8%) | 35 (4.4%) |
| $35,000 to $39,999 | 34 (3.9%) | 51 (6.4%) |
| $40,000 to $44,999 | 9 (1.0%) | 11 (1.4%) |
| $45,000 to $49,999 | 74 (8.4%) | 5 (0.6%) |
| $50,000 to $54,999 | 38 (4.3%) | 22 (2.8%) |
| $55,000 to $64,999 | 127 (14.5%) | 82 (10.3%) |
| $65,000 to $74,999 | 42 (4.8%) | 70 (8.8%) |
| $75,000 to $99,999 | 109 (12.4%) | 128 (16.0%) |
| $100,000+ | 191 (21.8%) | 88 (11.0%) |
| Total | 877 (100.0%) | 798 (100.0%) |
Earnings by Sex by Educational Attainment in Alderton
Average earnings in Alderton are $59,783 for men and $63,421 for women, a difference of 5.7%. Men with an educational attainment of bachelor's degree enjoy the highest average annual earnings of $158,370, while those with high school diploma education earn the least with $43,889. Women with an educational attainment of bachelor's degree earn the most with the average annual earnings of $87,875, while those with high school diploma education have the smallest earnings of $36,875.
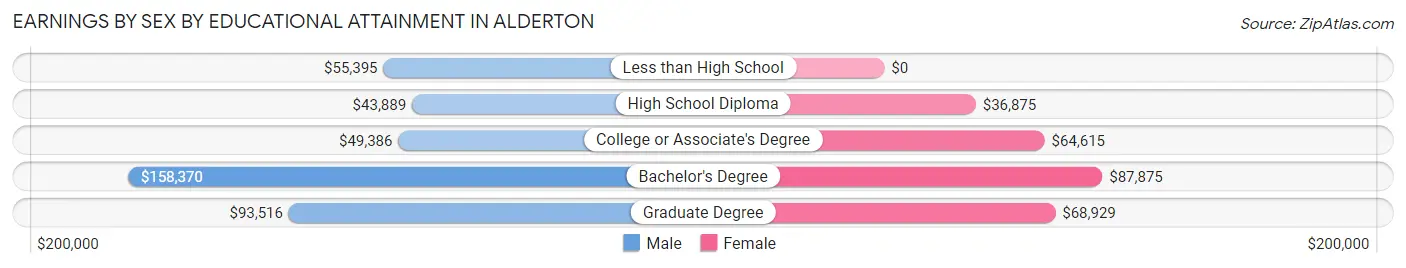
| Educational Attainment | Male Income | Female Income |
| Less than High School | $55,395 | $0 |
| High School Diploma | $43,889 | $36,875 |
| College or Associate's Degree | $49,386 | $64,615 |
| Bachelor's Degree | $158,370 | $87,875 |
| Graduate Degree | $93,516 | $68,929 |
| Total | $59,783 | $63,421 |
Family Income in Alderton
Family Income Brackets in Alderton
According to the Alderton family income data, there are 136 families falling into the $75,000 to $99,999 income range, which is the most common income bracket and makes up 20.2% of all families.
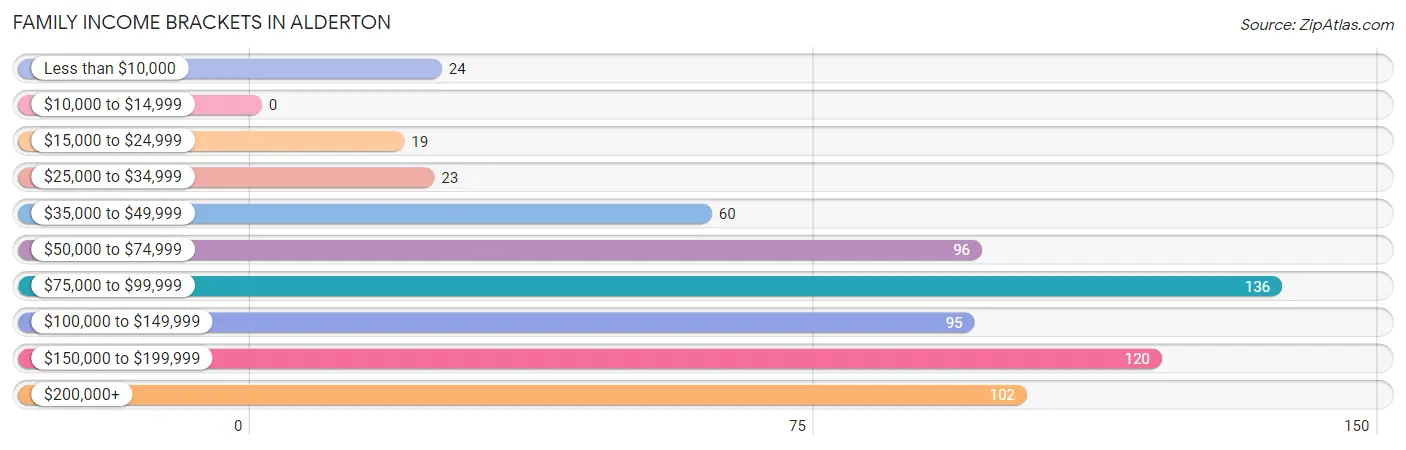
| Income Bracket | # Families | % Families |
| Less than $10,000 | 24 | 3.6% |
| $10,000 to $14,999 | 0 | 0.0% |
| $15,000 to $24,999 | 19 | 2.8% |
| $25,000 to $34,999 | 23 | 3.4% |
| $35,000 to $49,999 | 60 | 8.9% |
| $50,000 to $74,999 | 96 | 14.2% |
| $75,000 to $99,999 | 136 | 20.1% |
| $100,000 to $149,999 | 95 | 14.1% |
| $150,000 to $199,999 | 120 | 17.8% |
| $200,000+ | 102 | 15.1% |
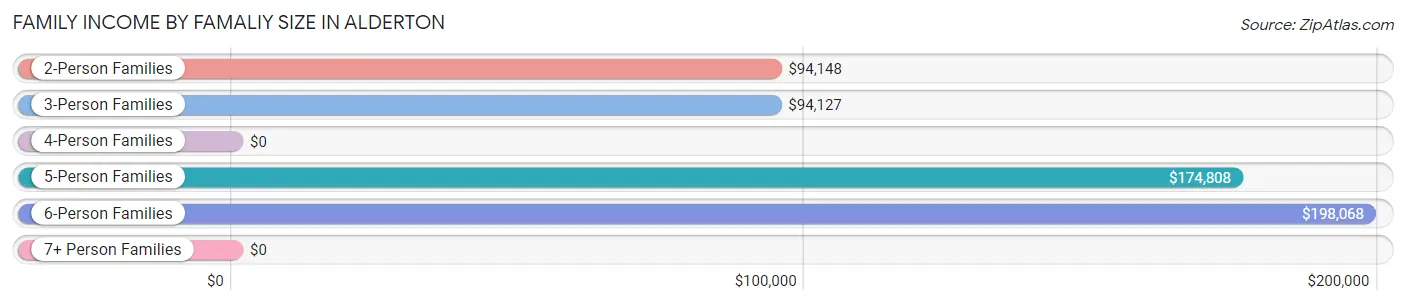
Family Income by Famaliy Size in Alderton
6-person families (37 | 5.5%) account for the highest median family income in Alderton with $198,068 per family, while 2-person families (309 | 45.8%) have the highest median income of $47,074 per family member.
| Income Bracket | # Families | Median Income |
| 2-Person Families | 309 (45.8%) | $94,148 |
| 3-Person Families | 192 (28.4%) | $94,127 |
| 4-Person Families | 113 (16.7%) | $0 |
| 5-Person Families | 24 (3.6%) | $174,808 |
| 6-Person Families | 37 (5.5%) | $198,068 |
| 7+ Person Families | 0 (0.0%) | $0 |
| Total | 675 (100.0%) | $94,926 |
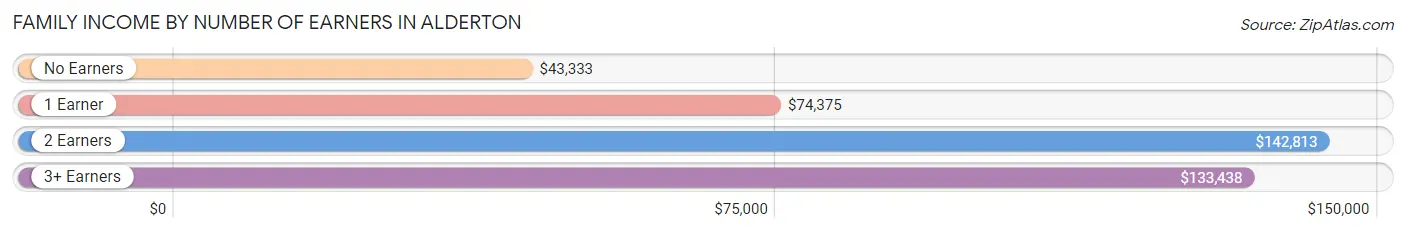
Family Income by Number of Earners in Alderton
The median family income in Alderton is $94,926, with families comprising 2 earners (198) having the highest median family income of $142,813, while families with no earners (78) have the lowest median family income of $43,333, accounting for 29.3% and 11.6% of families, respectively.
| Number of Earners | # Families | Median Income |
| No Earners | 78 (11.6%) | $43,333 |
| 1 Earner | 221 (32.7%) | $74,375 |
| 2 Earners | 198 (29.3%) | $142,813 |
| 3+ Earners | 178 (26.4%) | $133,438 |
| Total | 675 (100.0%) | $94,926 |
Household Income in Alderton
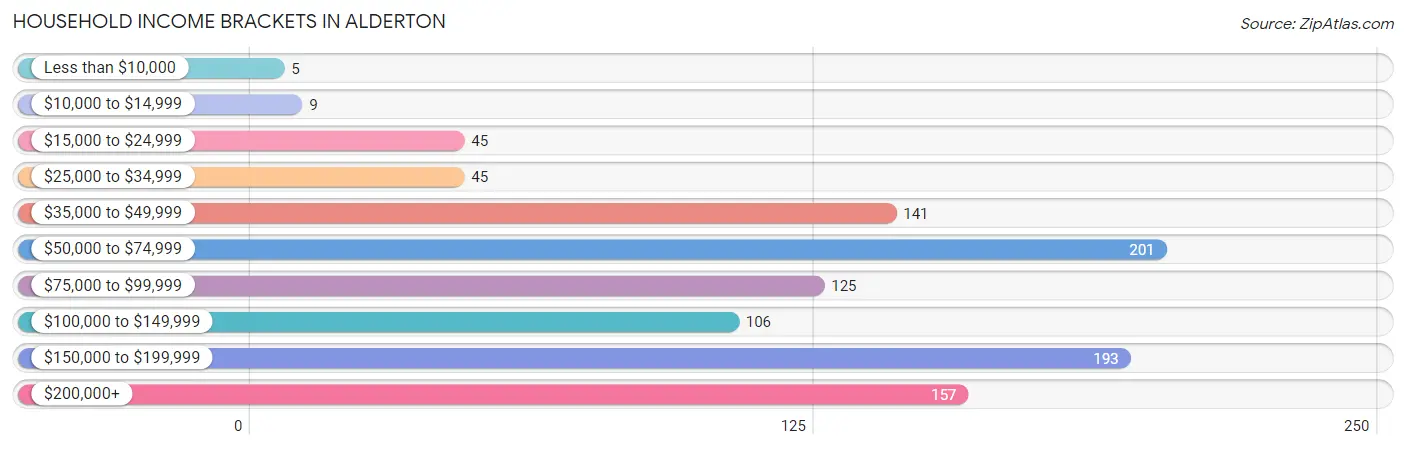
Household Income Brackets in Alderton
With 201 households falling in the category, the $50,000 to $74,999 income range is the most frequent in Alderton, accounting for 19.6% of all households. In contrast, only 5 households (0.5%) fall into the less than $10,000 income bracket, making it the least populous group.
| Income Bracket | # Households | % Households |
| Less than $10,000 | 5 | 0.5% |
| $10,000 to $14,999 | 9 | 0.9% |
| $15,000 to $24,999 | 45 | 4.4% |
| $25,000 to $34,999 | 45 | 4.4% |
| $35,000 to $49,999 | 141 | 13.7% |
| $50,000 to $74,999 | 201 | 19.6% |
| $75,000 to $99,999 | 125 | 12.2% |
| $100,000 to $149,999 | 106 | 10.3% |
| $150,000 to $199,999 | 193 | 18.8% |
| $200,000+ | 157 | 15.3% |
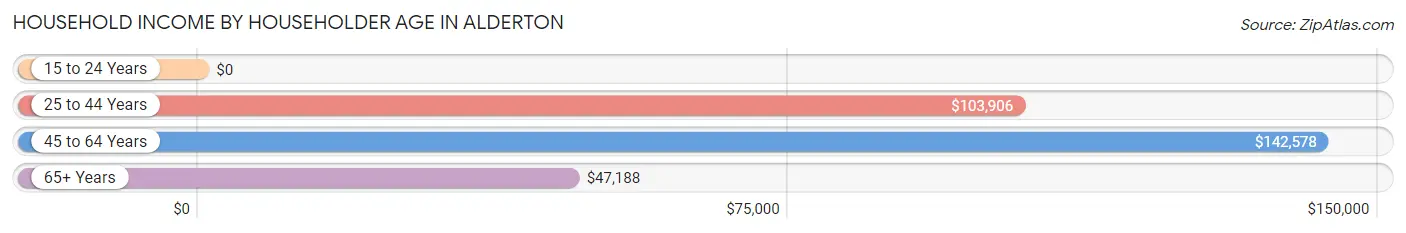
Household Income by Householder Age in Alderton
The median household income in Alderton is $93,008, with the highest median household income of $142,578 found in the 45 to 64 years age bracket for the primary householder. A total of 477 households (46.5%) fall into this category.
| Income Bracket | # Households | Median Income |
| 15 to 24 Years | 0 (0.0%) | $0 |
| 25 to 44 Years | 259 (25.2%) | $103,906 |
| 45 to 64 Years | 477 (46.5%) | $142,578 |
| 65+ Years | 291 (28.3%) | $47,188 |
| Total | 1,027 (100.0%) | $93,008 |
Poverty in Alderton
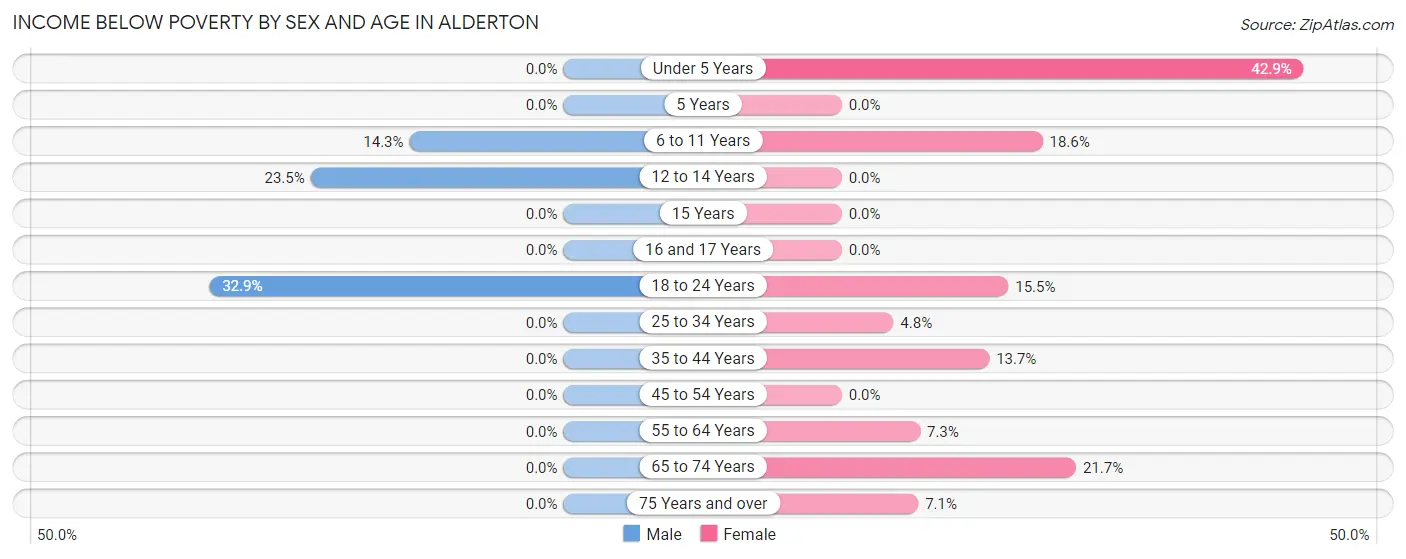
Income Below Poverty by Sex and Age in Alderton
With 4.2% poverty level for males and 10.4% for females among the residents of Alderton, 18 to 24 year old males and under 5 year old females are the most vulnerable to poverty, with 23 males (32.9%) and 18 females (42.9%) in their respective age groups living below the poverty level.
| Age Bracket | Male | Female |
| Under 5 Years | 0 (0.0%) | 18 (42.9%) |
| 5 Years | 0 (0.0%) | 0 (0.0%) |
| 6 to 11 Years | 9 (14.3%) | 19 (18.6%) |
| 12 to 14 Years | 19 (23.5%) | 0 (0.0%) |
| 15 Years | 0 (0.0%) | 0 (0.0%) |
| 16 and 17 Years | 0 (0.0%) | 0 (0.0%) |
| 18 to 24 Years | 23 (32.9%) | 19 (15.4%) |
| 25 to 34 Years | 0 (0.0%) | 8 (4.8%) |
| 35 to 44 Years | 0 (0.0%) | 26 (13.7%) |
| 45 to 54 Years | 0 (0.0%) | 0 (0.0%) |
| 55 to 64 Years | 0 (0.0%) | 22 (7.3%) |
| 65 to 74 Years | 0 (0.0%) | 30 (21.7%) |
| 75 Years and over | 0 (0.0%) | 10 (7.1%) |
| Total | 51 (4.2%) | 152 (10.4%) |
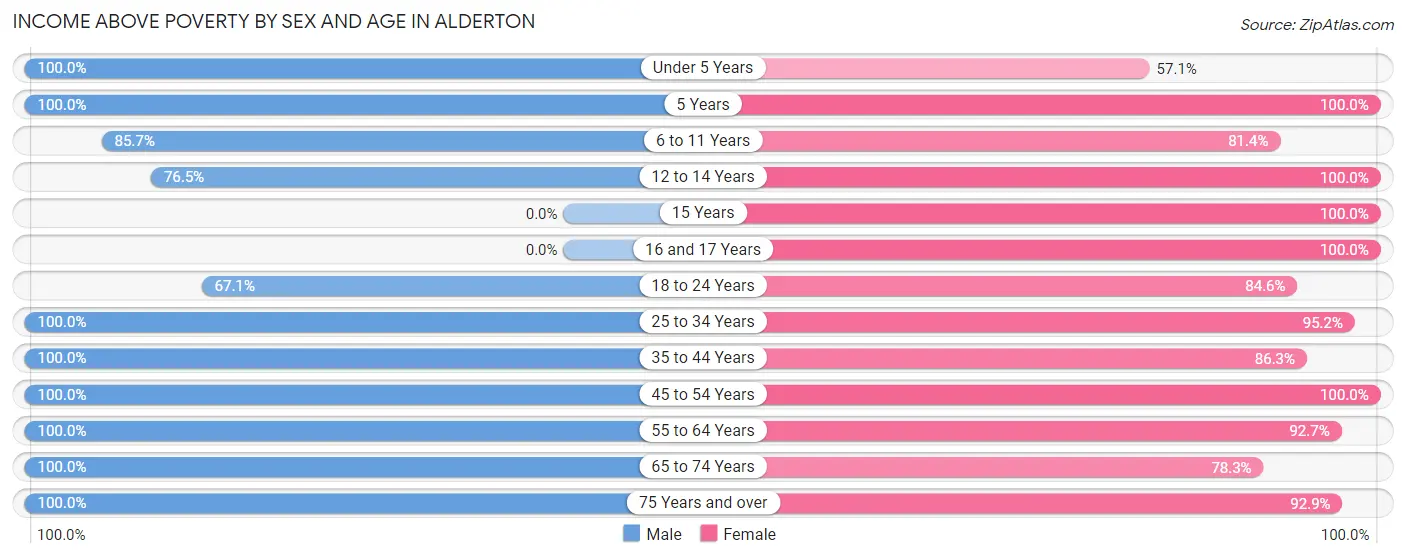
Income Above Poverty by Sex and Age in Alderton
According to the poverty statistics in Alderton, males aged under 5 years and females aged 5 years are the age groups that are most secure financially, with 100.0% of males and 100.0% of females in these age groups living above the poverty line.
| Age Bracket | Male | Female |
| Under 5 Years | 30 (100.0%) | 24 (57.1%) |
| 5 Years | 13 (100.0%) | 13 (100.0%) |
| 6 to 11 Years | 54 (85.7%) | 83 (81.4%) |
| 12 to 14 Years | 62 (76.5%) | 24 (100.0%) |
| 15 Years | 0 (0.0%) | 14 (100.0%) |
| 16 and 17 Years | 0 (0.0%) | 51 (100.0%) |
| 18 to 24 Years | 47 (67.1%) | 104 (84.6%) |
| 25 to 34 Years | 111 (100.0%) | 159 (95.2%) |
| 35 to 44 Years | 242 (100.0%) | 164 (86.3%) |
| 45 to 54 Years | 211 (100.0%) | 150 (100.0%) |
| 55 to 64 Years | 170 (100.0%) | 281 (92.7%) |
| 65 to 74 Years | 181 (100.0%) | 108 (78.3%) |
| 75 Years and over | 55 (100.0%) | 131 (92.9%) |
| Total | 1,176 (95.8%) | 1,306 (89.6%) |
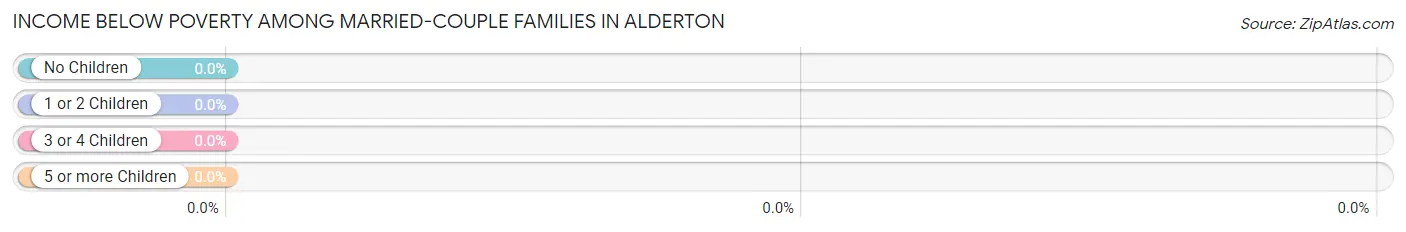
Income Below Poverty Among Married-Couple Families in Alderton
| Children | Above Poverty | Below Poverty |
| No Children | 403 (100.0%) | 0 (0.0%) |
| 1 or 2 Children | 147 (100.0%) | 0 (0.0%) |
| 3 or 4 Children | 16 (100.0%) | 0 (0.0%) |
| 5 or more Children | 0 (0.0%) | 0 (0.0%) |
| Total | 566 (100.0%) | 0 (0.0%) |
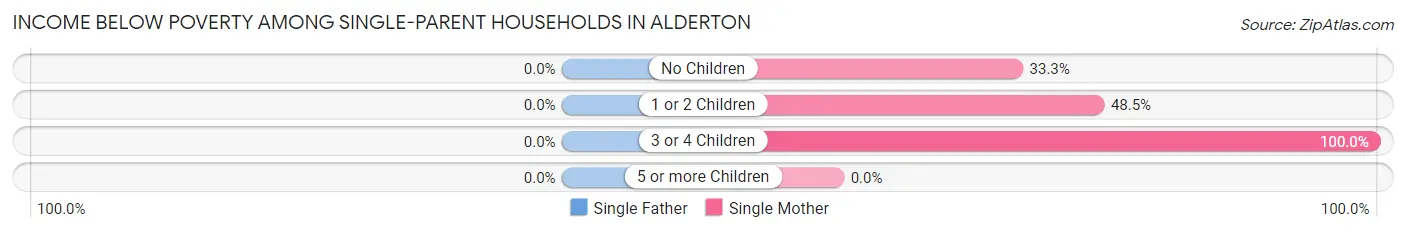
Income Below Poverty Among Single-Parent Households in Alderton
| Children | Single Father | Single Mother |
| No Children | 0 (0.0%) | 9 (33.3%) |
| 1 or 2 Children | 0 (0.0%) | 16 (48.5%) |
| 3 or 4 Children | 0 (0.0%) | 8 (100.0%) |
| 5 or more Children | 0 (0.0%) | 0 (0.0%) |
| Total | 0 (0.0%) | 33 (48.5%) |
Income Below Poverty Among Married-Couple vs Single-Parent Households in Alderton
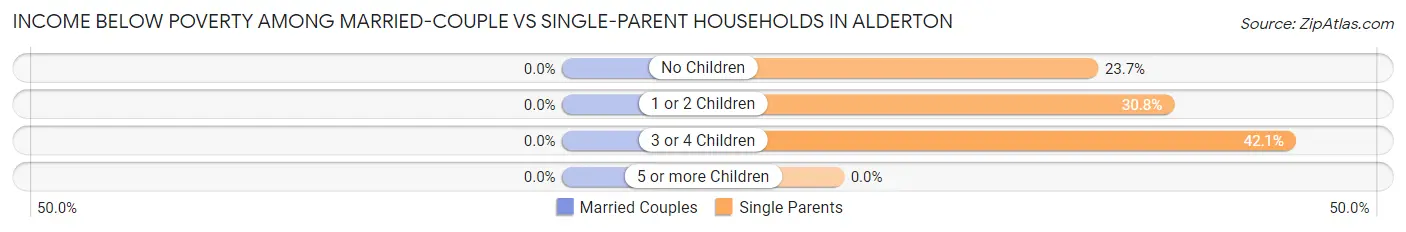
| Children | Married-Couple Families | Single-Parent Households |
| No Children | 0 (0.0%) | 9 (23.7%) |
| 1 or 2 Children | 0 (0.0%) | 16 (30.8%) |
| 3 or 4 Children | 0 (0.0%) | 8 (42.1%) |
| 5 or more Children | 0 (0.0%) | 0 (0.0%) |
| Total | 0 (0.0%) | 33 (30.3%) |
Employment Characteristics in Alderton
Employment by Class of Employer in Alderton
Among the 1,304 employed individuals in Alderton, private company employees (835 | 64.0%), self-employed (incorporated) (140 | 10.7%), and federal government employees (104 | 8.0%) make up the most common classes of employment.
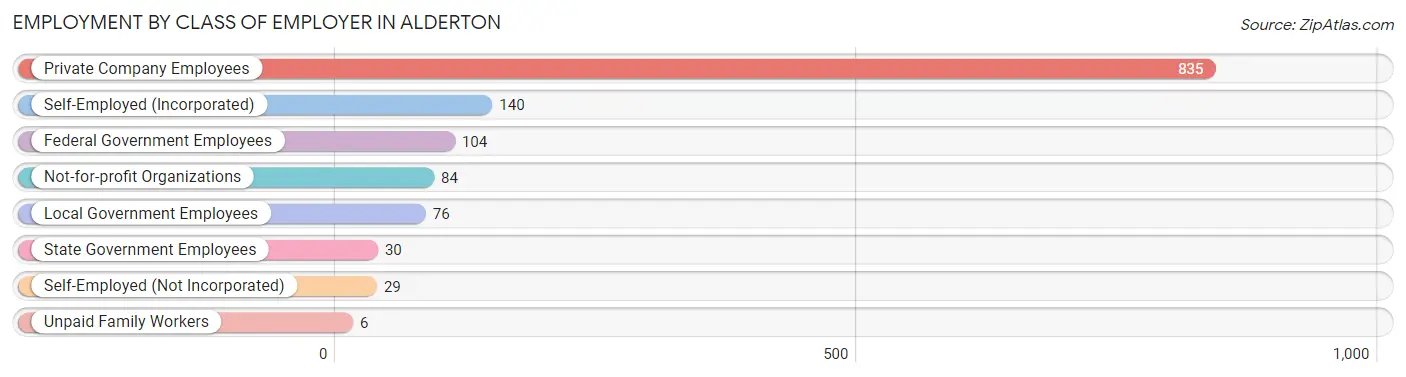
| Employer Class | # Employees | % Employees |
| Private Company Employees | 835 | 64.0% |
| Self-Employed (Incorporated) | 140 | 10.7% |
| Self-Employed (Not Incorporated) | 29 | 2.2% |
| Not-for-profit Organizations | 84 | 6.4% |
| Local Government Employees | 76 | 5.8% |
| State Government Employees | 30 | 2.3% |
| Federal Government Employees | 104 | 8.0% |
| Unpaid Family Workers | 6 | 0.5% |
| Total | 1,304 | 100.0% |
Employment Status by Age in Alderton
According to the labor force statistics for Alderton, out of the total population over 16 years of age (2,304), 66.4% or 1,530 individuals are in the labor force, with 9.1% or 139 of them unemployed. The age group with the highest labor force participation rate is 20 to 24 years, with 94.8% or 145 individuals in the labor force. Within the labor force, the 35 to 44 years age range has the highest percentage of unemployed individuals, with 24.6% or 94 of them being unemployed.
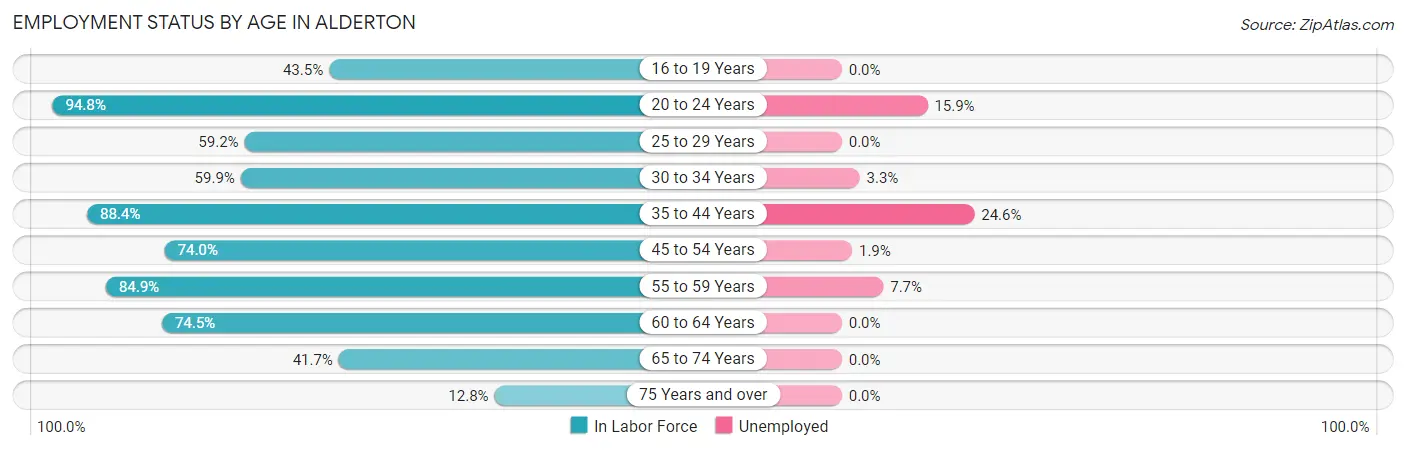
| Age Bracket | In Labor Force | Unemployed |
| 16 to 19 Years | 40 (43.5%) | 0 (0.0%) |
| 20 to 24 Years | 145 (94.8%) | 23 (15.9%) |
| 25 to 29 Years | 45 (59.2%) | 0 (0.0%) |
| 30 to 34 Years | 121 (59.9%) | 4 (3.3%) |
| 35 to 44 Years | 382 (88.4%) | 94 (24.6%) |
| 45 to 54 Years | 267 (74.0%) | 5 (1.9%) |
| 55 to 59 Years | 169 (84.9%) | 13 (7.7%) |
| 60 to 64 Years | 204 (74.5%) | 0 (0.0%) |
| 65 to 74 Years | 133 (41.7%) | 0 (0.0%) |
| 75 Years and over | 25 (12.8%) | 0 (0.0%) |
| Total | 1,530 (66.4%) | 139 (9.1%) |
Employment Status by Educational Attainment in Alderton
According to labor force statistics for Alderton, 76.9% of individuals (1,187) out of the total population between 25 and 64 years of age (1,544) are in the labor force, with 9.8% or 116 of them being unemployed. The group with the highest labor force participation rate are those with the educational attainment of bachelor's degree or higher, with 87.3% or 290 individuals in the labor force. Within the labor force, individuals with college / associate degree education have the highest percentage of unemployment, with 17.7% or 81 of them being unemployed.
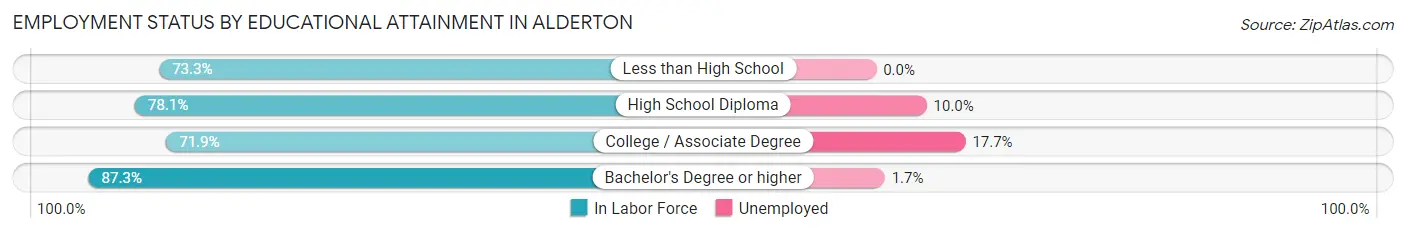
| Educational Attainment | In Labor Force | Unemployed |
| Less than High School | 140 (73.3%) | 0 (0.0%) |
| High School Diploma | 300 (78.1%) | 38 (10.0%) |
| College / Associate Degree | 458 (71.9%) | 113 (17.7%) |
| Bachelor's Degree or higher | 290 (87.3%) | 6 (1.7%) |
| Total | 1,187 (76.9%) | 151 (9.8%) |
Employment Occupations by Sex in Alderton
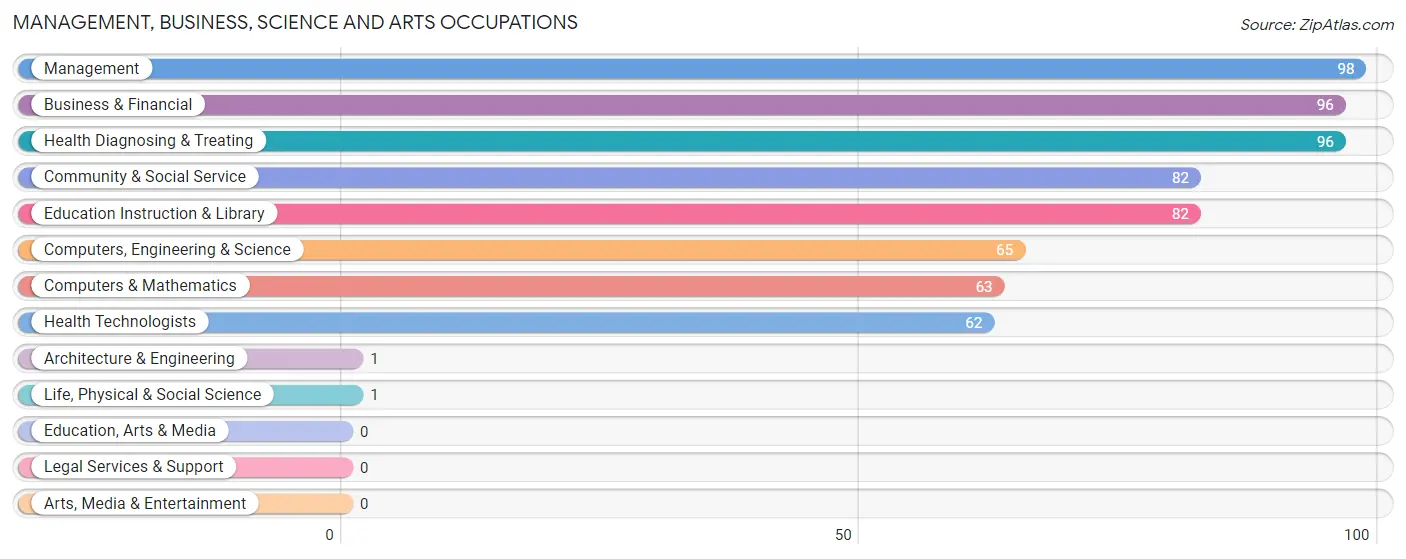
Management, Business, Science and Arts Occupations
The most common Management, Business, Science and Arts occupations in Alderton are Management (98 | 7.0%), Business & Financial (96 | 6.9%), Health Diagnosing & Treating (96 | 6.9%), Community & Social Service (82 | 5.9%), and Education Instruction & Library (82 | 5.9%).
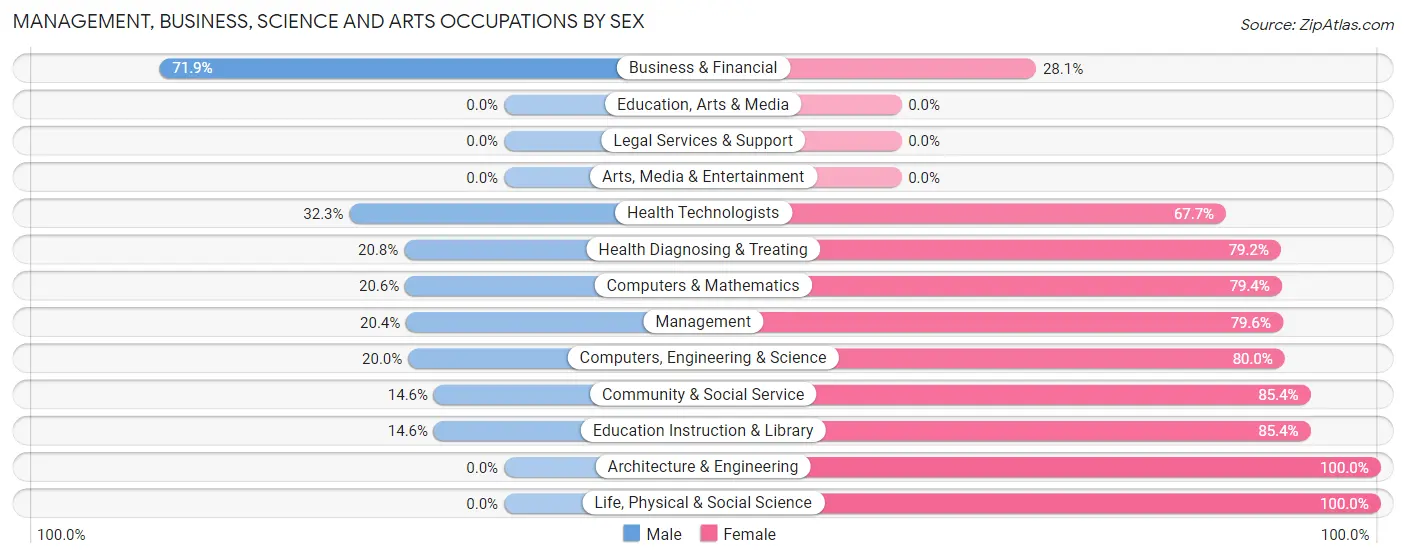
Management, Business, Science and Arts Occupations by Sex
Within the Management, Business, Science and Arts occupations in Alderton, the most male-oriented occupations are Business & Financial (71.9%), Health Technologists (32.3%), and Health Diagnosing & Treating (20.8%), while the most female-oriented occupations are Architecture & Engineering (100.0%), Life, Physical & Social Science (100.0%), and Community & Social Service (85.4%).
| Occupation | Male | Female |
| Management | 20 (20.4%) | 78 (79.6%) |
| Business & Financial | 69 (71.9%) | 27 (28.1%) |
| Computers, Engineering & Science | 13 (20.0%) | 52 (80.0%) |
| Computers & Mathematics | 13 (20.6%) | 50 (79.4%) |
| Architecture & Engineering | 0 (0.0%) | 1 (100.0%) |
| Life, Physical & Social Science | 0 (0.0%) | 1 (100.0%) |
| Community & Social Service | 12 (14.6%) | 70 (85.4%) |
| Education, Arts & Media | 0 (0.0%) | 0 (0.0%) |
| Legal Services & Support | 0 (0.0%) | 0 (0.0%) |
| Education Instruction & Library | 12 (14.6%) | 70 (85.4%) |
| Arts, Media & Entertainment | 0 (0.0%) | 0 (0.0%) |
| Health Diagnosing & Treating | 20 (20.8%) | 76 (79.2%) |
| Health Technologists | 20 (32.3%) | 42 (67.7%) |
| Total (Category) | 134 (30.7%) | 303 (69.3%) |
| Total (Overall) | 739 (53.1%) | 653 (46.9%) |
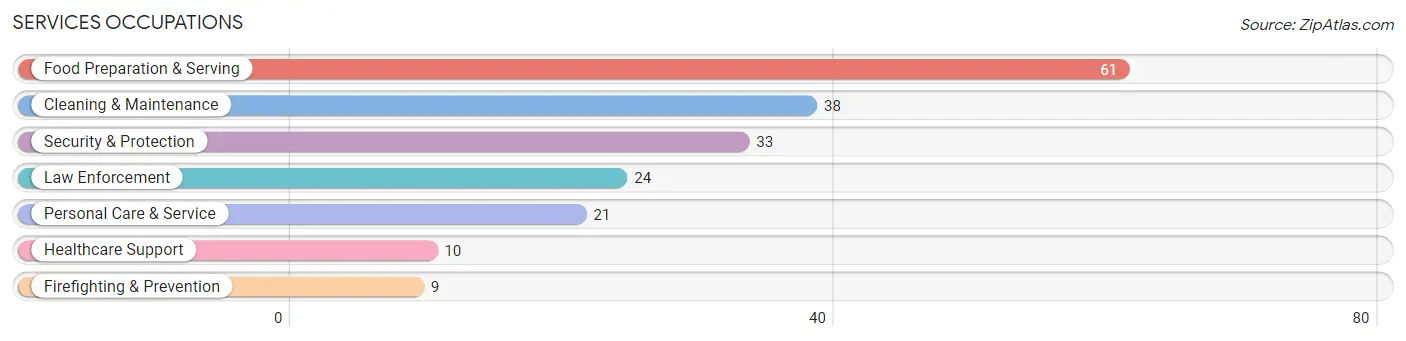
Services Occupations
The most common Services occupations in Alderton are Food Preparation & Serving (61 | 4.4%), Cleaning & Maintenance (38 | 2.7%), Security & Protection (33 | 2.4%), Law Enforcement (24 | 1.7%), and Personal Care & Service (21 | 1.5%).
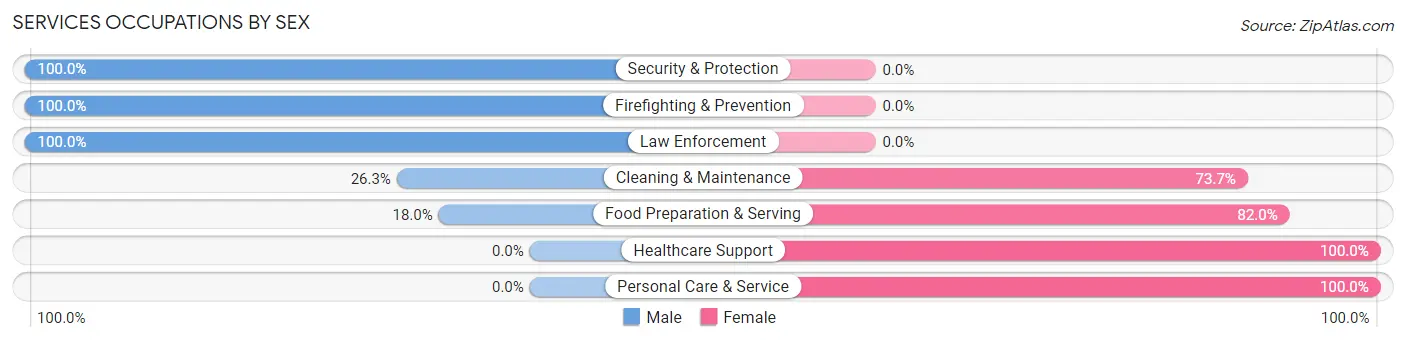
Services Occupations by Sex
Within the Services occupations in Alderton, the most male-oriented occupations are Security & Protection (100.0%), Firefighting & Prevention (100.0%), and Law Enforcement (100.0%), while the most female-oriented occupations are Healthcare Support (100.0%), Personal Care & Service (100.0%), and Food Preparation & Serving (82.0%).
| Occupation | Male | Female |
| Healthcare Support | 0 (0.0%) | 10 (100.0%) |
| Security & Protection | 33 (100.0%) | 0 (0.0%) |
| Firefighting & Prevention | 9 (100.0%) | 0 (0.0%) |
| Law Enforcement | 24 (100.0%) | 0 (0.0%) |
| Food Preparation & Serving | 11 (18.0%) | 50 (82.0%) |
| Cleaning & Maintenance | 10 (26.3%) | 28 (73.7%) |
| Personal Care & Service | 0 (0.0%) | 21 (100.0%) |
| Total (Category) | 54 (33.1%) | 109 (66.9%) |
| Total (Overall) | 739 (53.1%) | 653 (46.9%) |
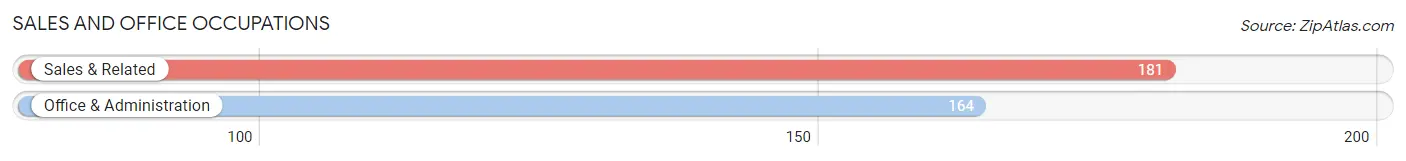
Sales and Office Occupations
The most common Sales and Office occupations in Alderton are Sales & Related (181 | 13.0%), and Office & Administration (164 | 11.8%).
Sales and Office Occupations by Sex
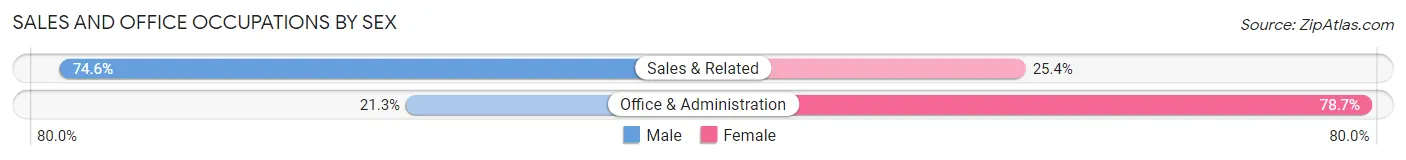
| Occupation | Male | Female |
| Sales & Related | 135 (74.6%) | 46 (25.4%) |
| Office & Administration | 35 (21.3%) | 129 (78.7%) |
| Total (Category) | 170 (49.3%) | 175 (50.7%) |
| Total (Overall) | 739 (53.1%) | 653 (46.9%) |
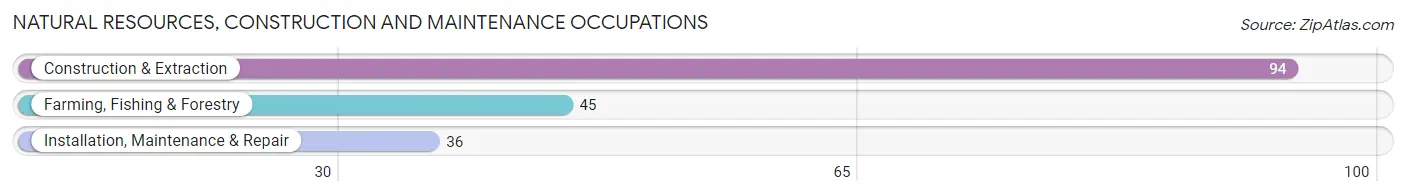
Natural Resources, Construction and Maintenance Occupations
The most common Natural Resources, Construction and Maintenance occupations in Alderton are Construction & Extraction (94 | 6.8%), Farming, Fishing & Forestry (45 | 3.2%), and Installation, Maintenance & Repair (36 | 2.6%).
Natural Resources, Construction and Maintenance Occupations by Sex
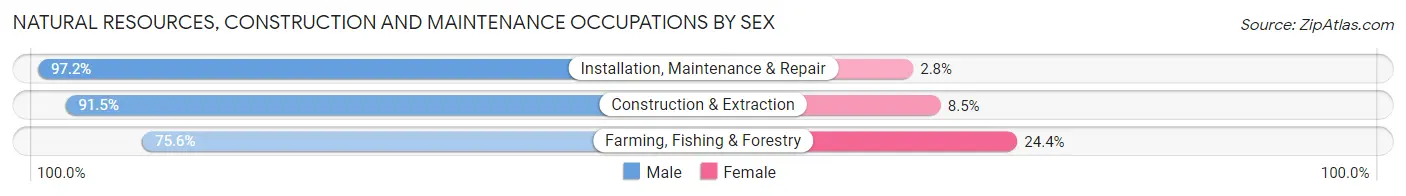
| Occupation | Male | Female |
| Farming, Fishing & Forestry | 34 (75.6%) | 11 (24.4%) |
| Construction & Extraction | 86 (91.5%) | 8 (8.5%) |
| Installation, Maintenance & Repair | 35 (97.2%) | 1 (2.8%) |
| Total (Category) | 155 (88.6%) | 20 (11.4%) |
| Total (Overall) | 739 (53.1%) | 653 (46.9%) |
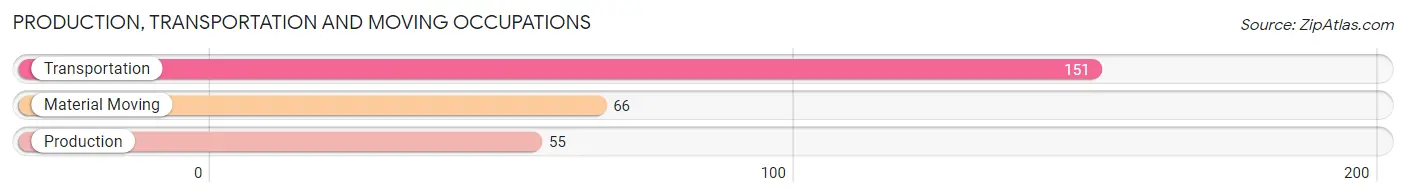
Production, Transportation and Moving Occupations
The most common Production, Transportation and Moving occupations in Alderton are Transportation (151 | 10.8%), Material Moving (66 | 4.7%), and Production (55 | 4.0%).
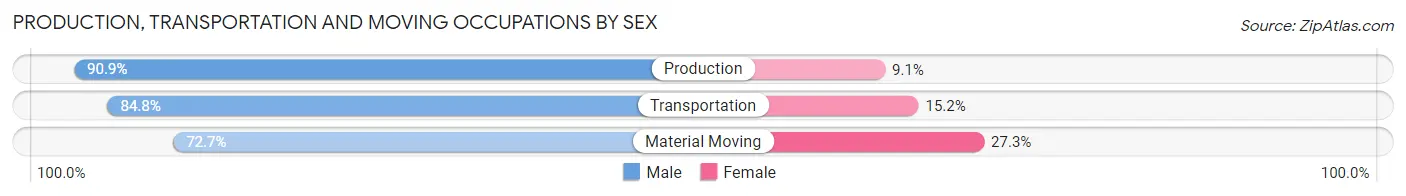
Production, Transportation and Moving Occupations by Sex
| Occupation | Male | Female |
| Production | 50 (90.9%) | 5 (9.1%) |
| Transportation | 128 (84.8%) | 23 (15.2%) |
| Material Moving | 48 (72.7%) | 18 (27.3%) |
| Total (Category) | 226 (83.1%) | 46 (16.9%) |
| Total (Overall) | 739 (53.1%) | 653 (46.9%) |
Employment Industries by Sex in Alderton
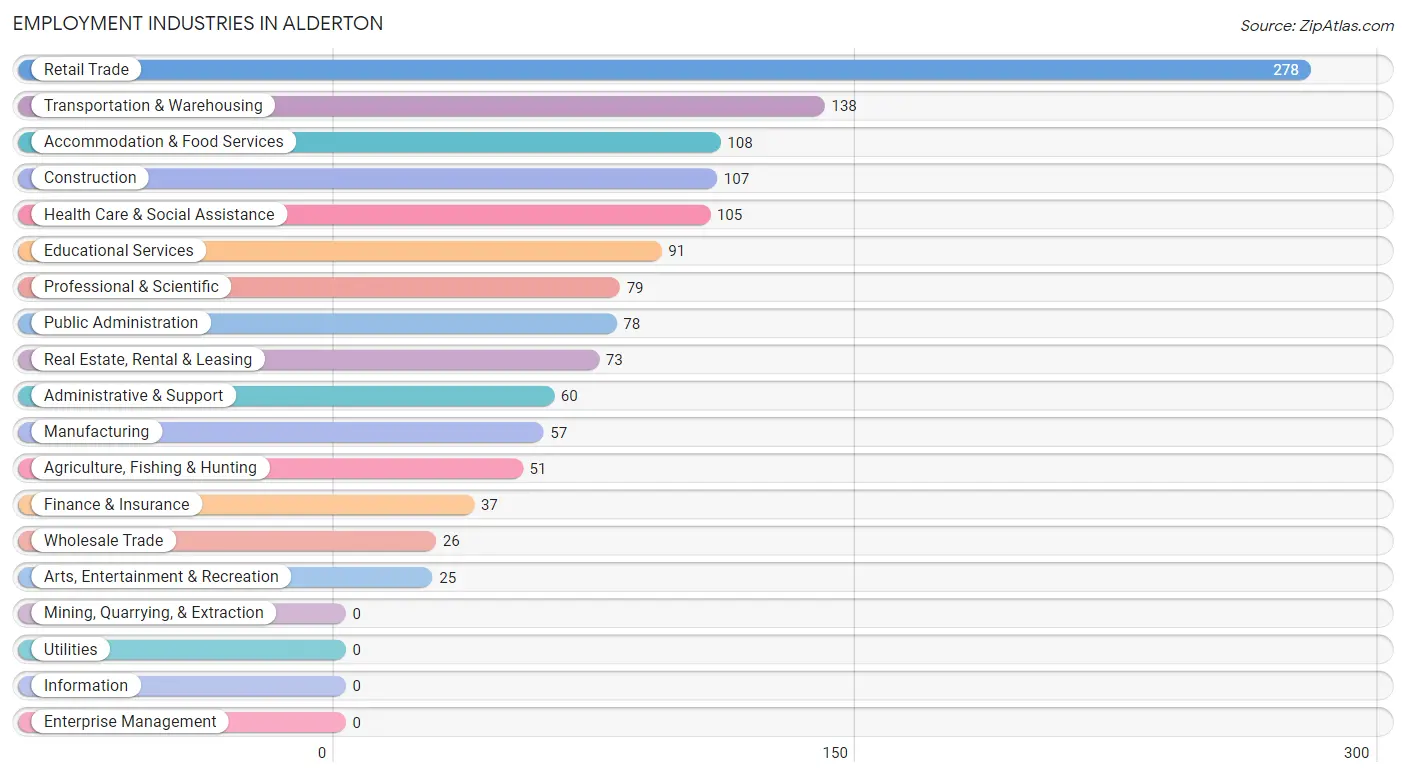
Employment Industries in Alderton
The major employment industries in Alderton include Retail Trade (278 | 20.0%), Transportation & Warehousing (138 | 9.9%), Accommodation & Food Services (108 | 7.8%), Construction (107 | 7.7%), and Health Care & Social Assistance (105 | 7.5%).
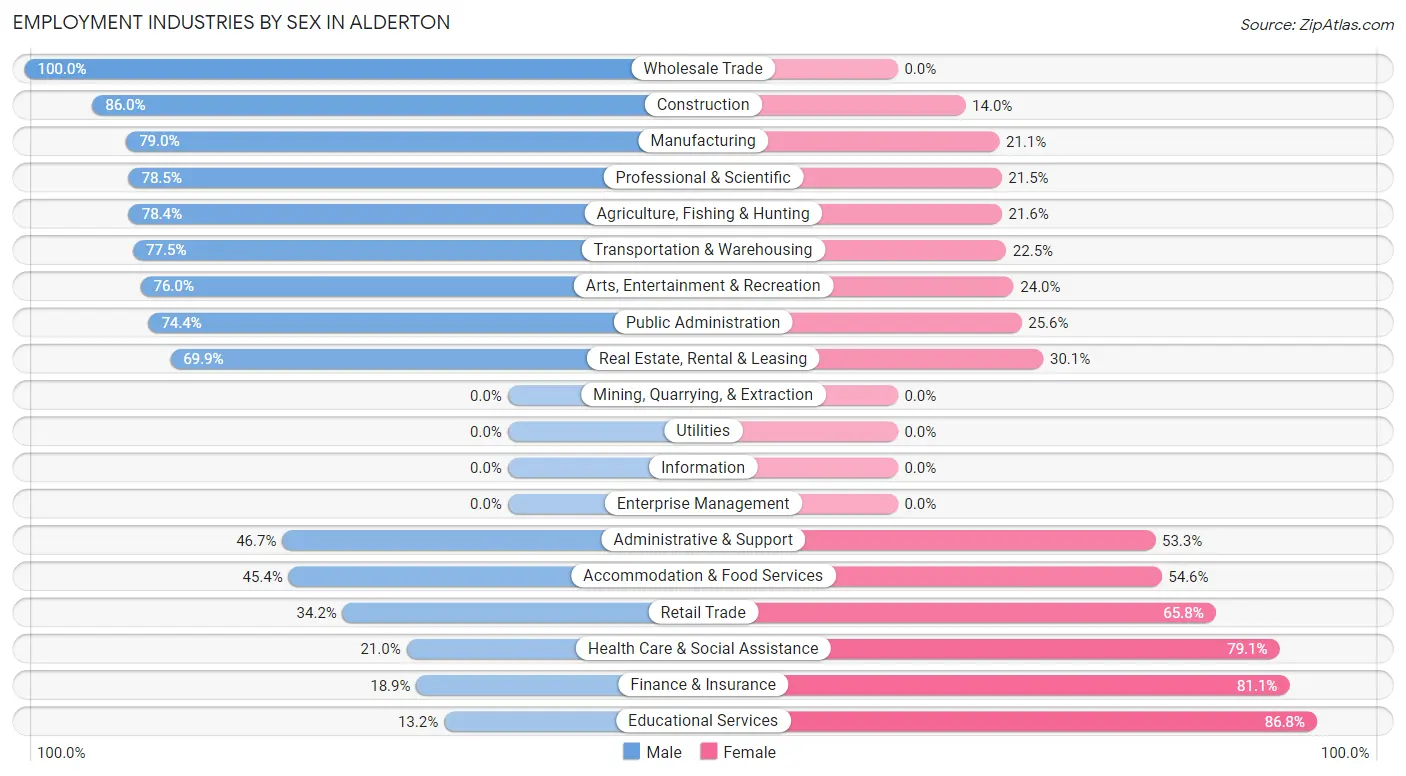
Employment Industries by Sex in Alderton
The Alderton industries that see more men than women are Wholesale Trade (100.0%), Construction (86.0%), and Manufacturing (78.9%), whereas the industries that tend to have a higher number of women are Educational Services (86.8%), Finance & Insurance (81.1%), and Health Care & Social Assistance (79.0%).
| Industry | Male | Female |
| Agriculture, Fishing & Hunting | 40 (78.4%) | 11 (21.6%) |
| Mining, Quarrying, & Extraction | 0 (0.0%) | 0 (0.0%) |
| Construction | 92 (86.0%) | 15 (14.0%) |
| Manufacturing | 45 (78.9%) | 12 (21.0%) |
| Wholesale Trade | 26 (100.0%) | 0 (0.0%) |
| Retail Trade | 95 (34.2%) | 183 (65.8%) |
| Transportation & Warehousing | 107 (77.5%) | 31 (22.5%) |
| Utilities | 0 (0.0%) | 0 (0.0%) |
| Information | 0 (0.0%) | 0 (0.0%) |
| Finance & Insurance | 7 (18.9%) | 30 (81.1%) |
| Real Estate, Rental & Leasing | 51 (69.9%) | 22 (30.1%) |
| Professional & Scientific | 62 (78.5%) | 17 (21.5%) |
| Enterprise Management | 0 (0.0%) | 0 (0.0%) |
| Administrative & Support | 28 (46.7%) | 32 (53.3%) |
| Educational Services | 12 (13.2%) | 79 (86.8%) |
| Health Care & Social Assistance | 22 (20.9%) | 83 (79.0%) |
| Arts, Entertainment & Recreation | 19 (76.0%) | 6 (24.0%) |
| Accommodation & Food Services | 49 (45.4%) | 59 (54.6%) |
| Public Administration | 58 (74.4%) | 20 (25.6%) |
| Total | 739 (53.1%) | 653 (46.9%) |
Education in Alderton
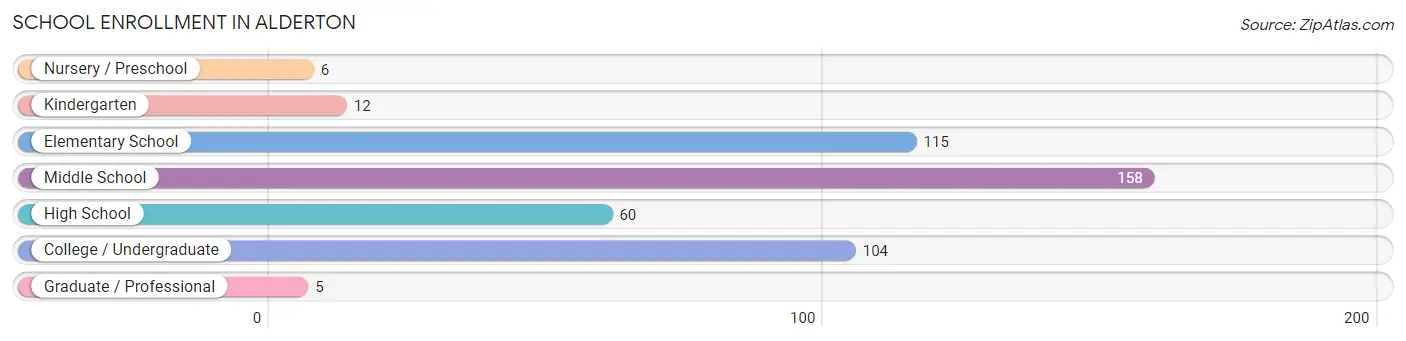
School Enrollment in Alderton
The most common levels of schooling among the 460 students in Alderton are middle school (158 | 34.4%), elementary school (115 | 25.0%), and college / undergraduate (104 | 22.6%).
| School Level | # Students | % Students |
| Nursery / Preschool | 6 | 1.3% |
| Kindergarten | 12 | 2.6% |
| Elementary School | 115 | 25.0% |
| Middle School | 158 | 34.4% |
| High School | 60 | 13.0% |
| College / Undergraduate | 104 | 22.6% |
| Graduate / Professional | 5 | 1.1% |
| Total | 460 | 100.0% |
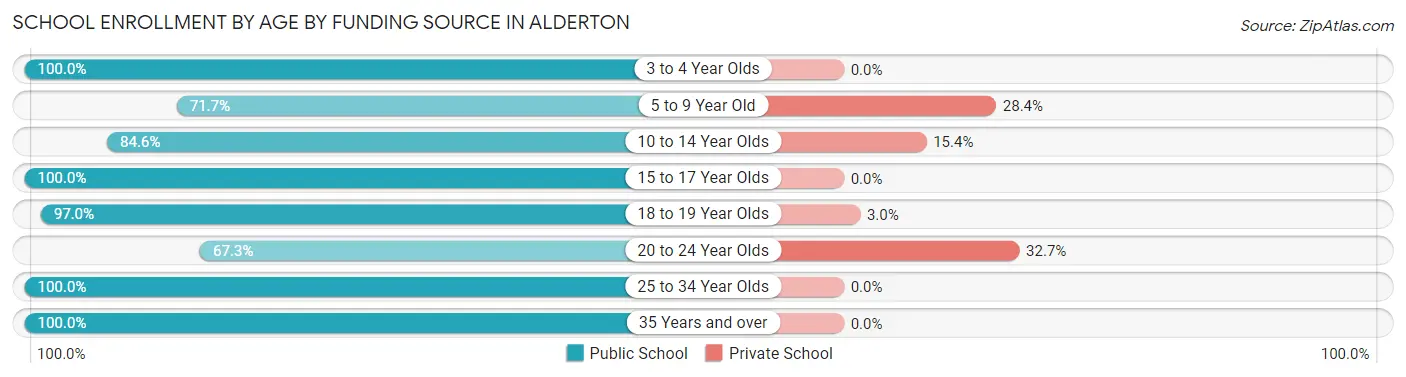
School Enrollment by Age by Funding Source in Alderton
Out of a total of 460 students who are enrolled in schools in Alderton, 78 (17.0%) attend a private institution, while the remaining 382 (83.0%) are enrolled in public schools. The age group of 20 to 24 year olds has the highest likelihood of being enrolled in private schools, with 17 (32.7% in the age bracket) enrolled. Conversely, the age group of 3 to 4 year olds has the lowest likelihood of being enrolled in a private school, with 3 (100.0% in the age bracket) attending a public institution.
| Age Bracket | Public School | Private School |
| 3 to 4 Year Olds | 3 (100.0%) | 0 (0.0%) |
| 5 to 9 Year Old | 91 (71.7%) | 36 (28.3%) |
| 10 to 14 Year Olds | 132 (84.6%) | 24 (15.4%) |
| 15 to 17 Year Olds | 65 (100.0%) | 0 (0.0%) |
| 18 to 19 Year Olds | 32 (97.0%) | 1 (3.0%) |
| 20 to 24 Year Olds | 35 (67.3%) | 17 (32.7%) |
| 25 to 34 Year Olds | 16 (100.0%) | 0 (0.0%) |
| 35 Years and over | 8 (100.0%) | 0 (0.0%) |
| Total | 382 (83.0%) | 78 (17.0%) |
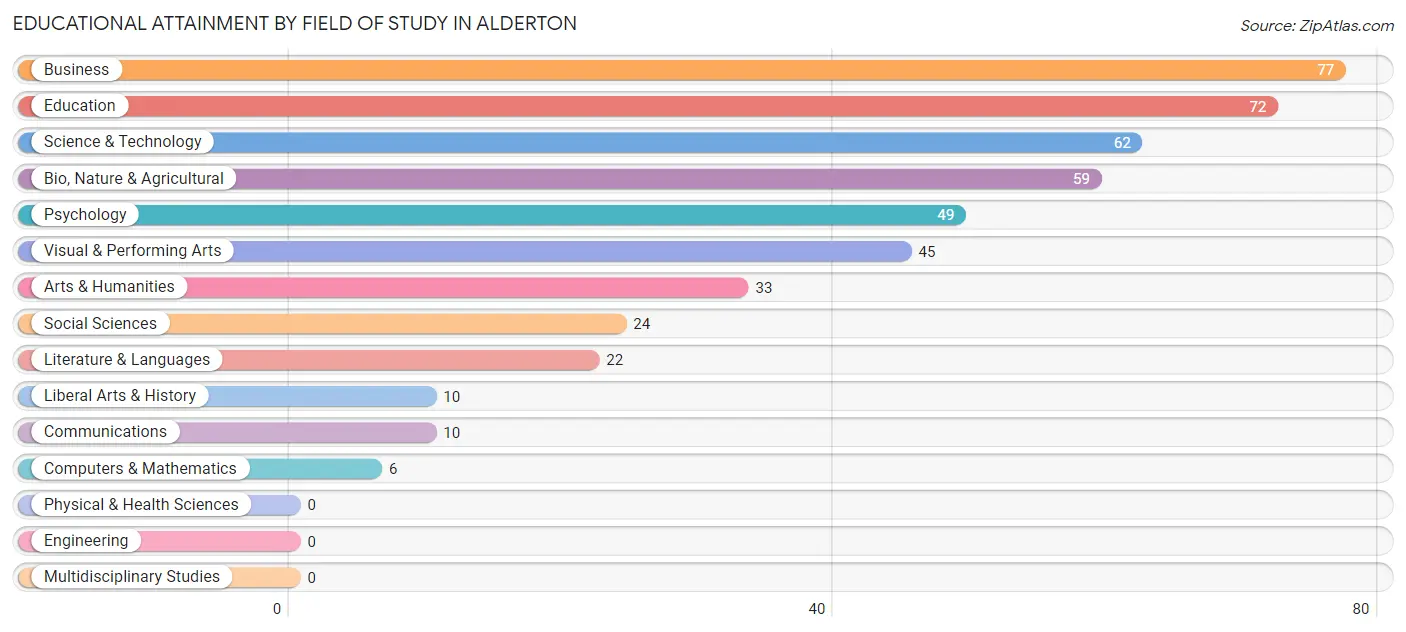
Educational Attainment by Field of Study in Alderton
Business (77 | 16.4%), education (72 | 15.3%), science & technology (62 | 13.2%), bio, nature & agricultural (59 | 12.6%), and psychology (49 | 10.4%) are the most common fields of study among 469 individuals in Alderton who have obtained a bachelor's degree or higher.
| Field of Study | # Graduates | % Graduates |
| Computers & Mathematics | 6 | 1.3% |
| Bio, Nature & Agricultural | 59 | 12.6% |
| Physical & Health Sciences | 0 | 0.0% |
| Psychology | 49 | 10.4% |
| Social Sciences | 24 | 5.1% |
| Engineering | 0 | 0.0% |
| Multidisciplinary Studies | 0 | 0.0% |
| Science & Technology | 62 | 13.2% |
| Business | 77 | 16.4% |
| Education | 72 | 15.3% |
| Literature & Languages | 22 | 4.7% |
| Liberal Arts & History | 10 | 2.1% |
| Visual & Performing Arts | 45 | 9.6% |
| Communications | 10 | 2.1% |
| Arts & Humanities | 33 | 7.0% |
| Total | 469 | 100.0% |
Transportation & Commute in Alderton
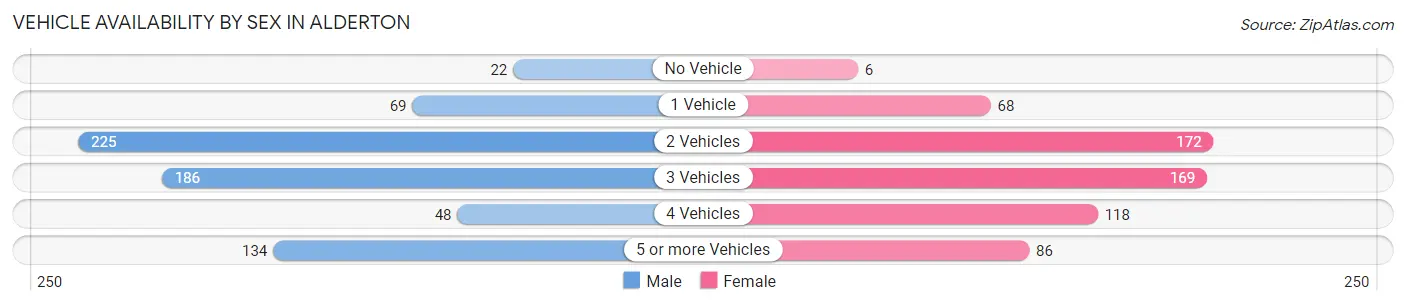
Vehicle Availability by Sex in Alderton
The most prevalent vehicle ownership categories in Alderton are males with 2 vehicles (225, accounting for 32.9%) and females with 2 vehicles (172, making up 36.3%).
| Vehicles Available | Male | Female |
| No Vehicle | 22 (3.2%) | 6 (1.0%) |
| 1 Vehicle | 69 (10.1%) | 68 (11.0%) |
| 2 Vehicles | 225 (32.9%) | 172 (27.8%) |
| 3 Vehicles | 186 (27.2%) | 169 (27.3%) |
| 4 Vehicles | 48 (7.0%) | 118 (19.1%) |
| 5 or more Vehicles | 134 (19.6%) | 86 (13.9%) |
| Total | 684 (100.0%) | 619 (100.0%) |
Commute Time in Alderton
The most frequently occuring commute durations in Alderton are 15 to 19 minutes (200 commuters, 19.5%), 30 to 34 minutes (199 commuters, 19.4%), and 45 to 59 minutes (180 commuters, 17.5%).
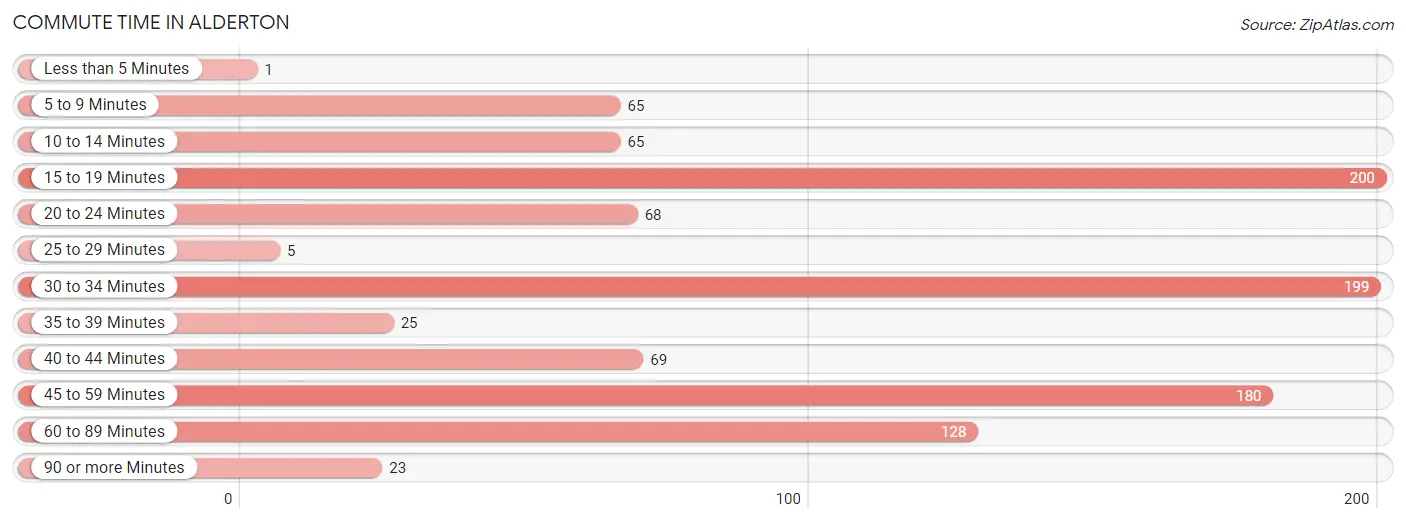
| Commute Time | # Commuters | % Commuters |
| Less than 5 Minutes | 1 | 0.1% |
| 5 to 9 Minutes | 65 | 6.3% |
| 10 to 14 Minutes | 65 | 6.3% |
| 15 to 19 Minutes | 200 | 19.5% |
| 20 to 24 Minutes | 68 | 6.6% |
| 25 to 29 Minutes | 5 | 0.5% |
| 30 to 34 Minutes | 199 | 19.4% |
| 35 to 39 Minutes | 25 | 2.4% |
| 40 to 44 Minutes | 69 | 6.7% |
| 45 to 59 Minutes | 180 | 17.5% |
| 60 to 89 Minutes | 128 | 12.4% |
| 90 or more Minutes | 23 | 2.2% |
Commute Time by Sex in Alderton
The most common commute times in Alderton are 30 to 34 minutes (147 commuters, 25.5%) for males and 15 to 19 minutes (101 commuters, 22.4%) for females.
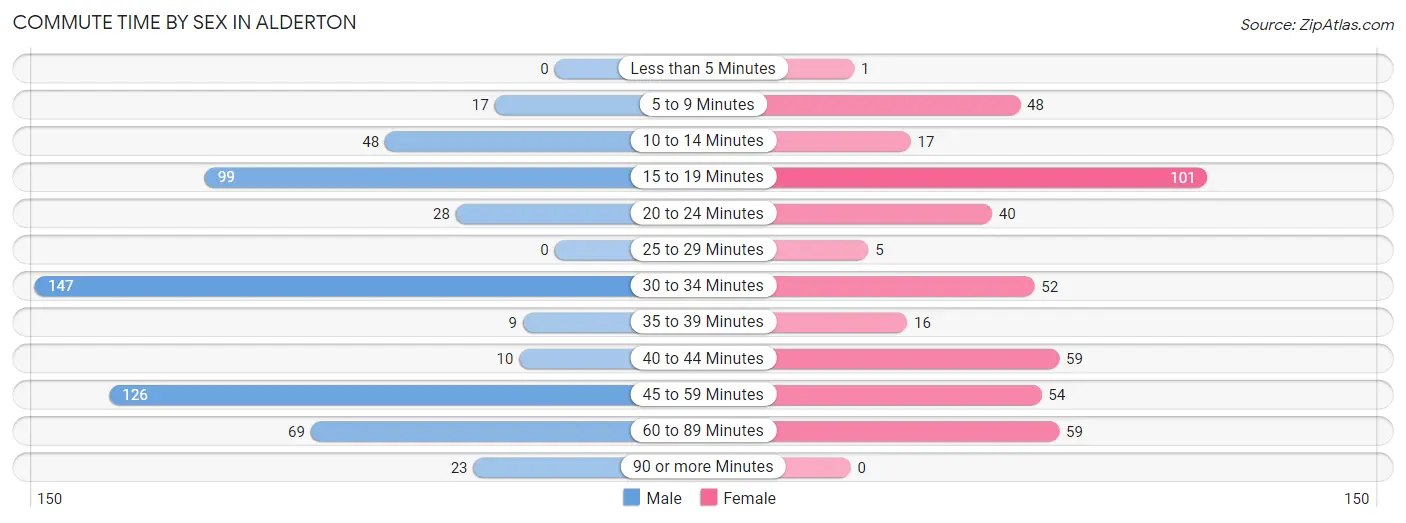
| Commute Time | Male | Female |
| Less than 5 Minutes | 0 (0.0%) | 1 (0.2%) |
| 5 to 9 Minutes | 17 (2.9%) | 48 (10.6%) |
| 10 to 14 Minutes | 48 (8.3%) | 17 (3.8%) |
| 15 to 19 Minutes | 99 (17.2%) | 101 (22.4%) |
| 20 to 24 Minutes | 28 (4.9%) | 40 (8.8%) |
| 25 to 29 Minutes | 0 (0.0%) | 5 (1.1%) |
| 30 to 34 Minutes | 147 (25.5%) | 52 (11.5%) |
| 35 to 39 Minutes | 9 (1.6%) | 16 (3.5%) |
| 40 to 44 Minutes | 10 (1.7%) | 59 (13.1%) |
| 45 to 59 Minutes | 126 (21.9%) | 54 (11.9%) |
| 60 to 89 Minutes | 69 (12.0%) | 59 (13.1%) |
| 90 or more Minutes | 23 (4.0%) | 0 (0.0%) |
Time of Departure to Work by Sex in Alderton
The most frequent times of departure to work in Alderton are 12:00 AM to 4:59 AM (111, 19.3%) for males and 8:30 AM to 8:59 AM (68, 15.0%) for females.
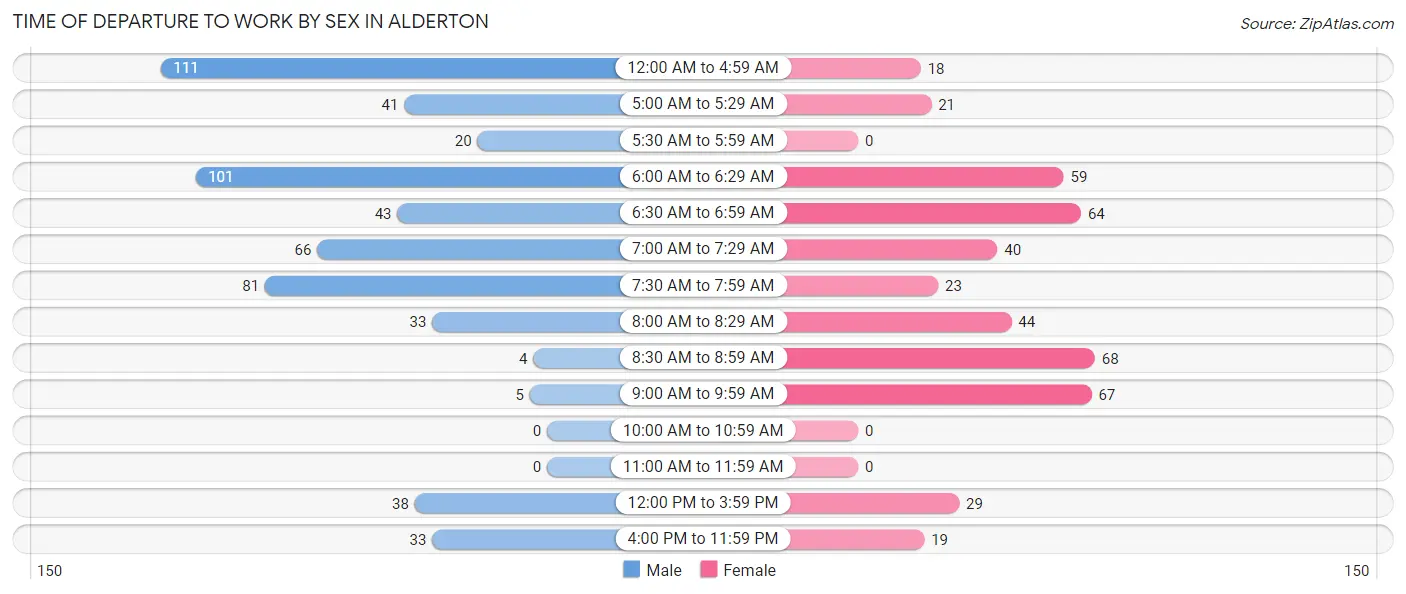
| Time of Departure | Male | Female |
| 12:00 AM to 4:59 AM | 111 (19.3%) | 18 (4.0%) |
| 5:00 AM to 5:29 AM | 41 (7.1%) | 21 (4.6%) |
| 5:30 AM to 5:59 AM | 20 (3.5%) | 0 (0.0%) |
| 6:00 AM to 6:29 AM | 101 (17.5%) | 59 (13.1%) |
| 6:30 AM to 6:59 AM | 43 (7.5%) | 64 (14.2%) |
| 7:00 AM to 7:29 AM | 66 (11.5%) | 40 (8.8%) |
| 7:30 AM to 7:59 AM | 81 (14.1%) | 23 (5.1%) |
| 8:00 AM to 8:29 AM | 33 (5.7%) | 44 (9.7%) |
| 8:30 AM to 8:59 AM | 4 (0.7%) | 68 (15.0%) |
| 9:00 AM to 9:59 AM | 5 (0.9%) | 67 (14.8%) |
| 10:00 AM to 10:59 AM | 0 (0.0%) | 0 (0.0%) |
| 11:00 AM to 11:59 AM | 0 (0.0%) | 0 (0.0%) |
| 12:00 PM to 3:59 PM | 38 (6.6%) | 29 (6.4%) |
| 4:00 PM to 11:59 PM | 33 (5.7%) | 19 (4.2%) |
| Total | 576 (100.0%) | 452 (100.0%) |
Housing Occupancy in Alderton
Occupancy by Ownership in Alderton
Of the total 1,027 dwellings in Alderton, owner-occupied units account for 913 (88.9%), while renter-occupied units make up 114 (11.1%).
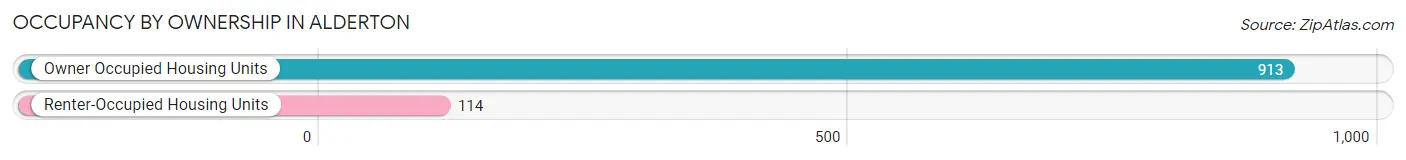
| Occupancy | # Housing Units | % Housing Units |
| Owner Occupied Housing Units | 913 | 88.9% |
| Renter-Occupied Housing Units | 114 | 11.1% |
| Total Occupied Housing Units | 1,027 | 100.0% |
Occupancy by Household Size in Alderton
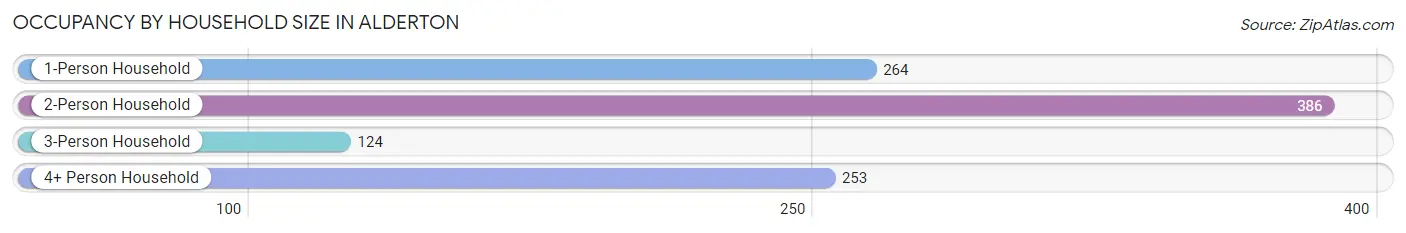
| Household Size | # Housing Units | % Housing Units |
| 1-Person Household | 264 | 25.7% |
| 2-Person Household | 386 | 37.6% |
| 3-Person Household | 124 | 12.1% |
| 4+ Person Household | 253 | 24.6% |
| Total Housing Units | 1,027 | 100.0% |
Occupancy by Ownership by Household Size in Alderton
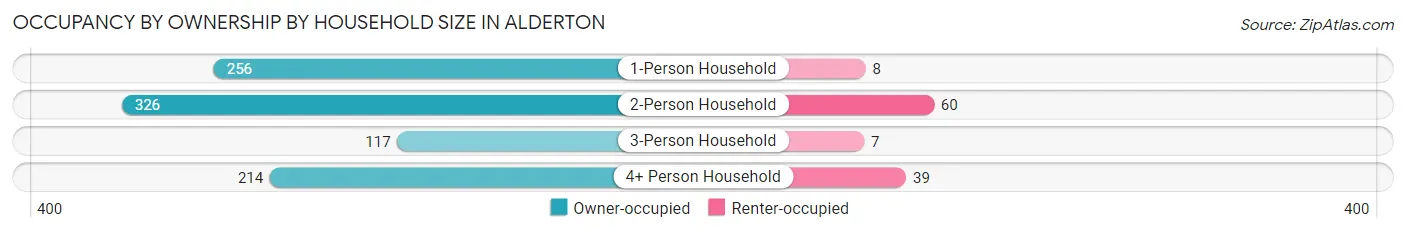
| Household Size | Owner-occupied | Renter-occupied |
| 1-Person Household | 256 (97.0%) | 8 (3.0%) |
| 2-Person Household | 326 (84.5%) | 60 (15.5%) |
| 3-Person Household | 117 (94.4%) | 7 (5.7%) |
| 4+ Person Household | 214 (84.6%) | 39 (15.4%) |
| Total Housing Units | 913 (88.9%) | 114 (11.1%) |
Occupancy by Educational Attainment in Alderton
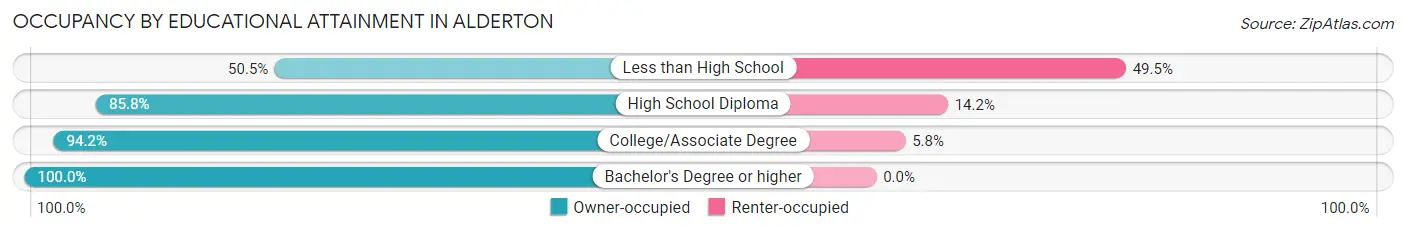
| Household Size | Owner-occupied | Renter-occupied |
| Less than High School | 49 (50.5%) | 48 (49.5%) |
| High School Diploma | 260 (85.8%) | 43 (14.2%) |
| College/Associate Degree | 376 (94.2%) | 23 (5.8%) |
| Bachelor's Degree or higher | 228 (100.0%) | 0 (0.0%) |
Occupancy by Age of Householder in Alderton
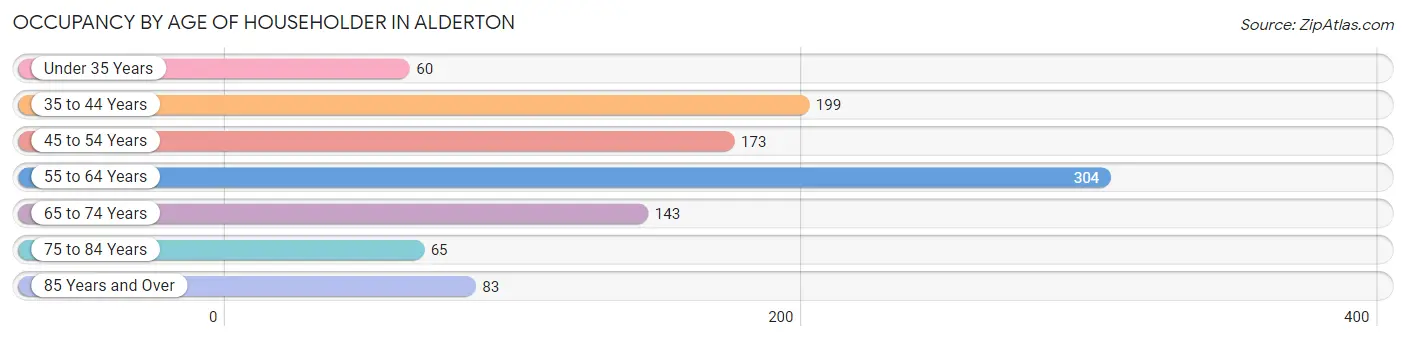
| Age Bracket | # Households | % Households |
| Under 35 Years | 60 | 5.8% |
| 35 to 44 Years | 199 | 19.4% |
| 45 to 54 Years | 173 | 16.9% |
| 55 to 64 Years | 304 | 29.6% |
| 65 to 74 Years | 143 | 13.9% |
| 75 to 84 Years | 65 | 6.3% |
| 85 Years and Over | 83 | 8.1% |
| Total | 1,027 | 100.0% |
Housing Finances in Alderton
Median Income by Occupancy in Alderton
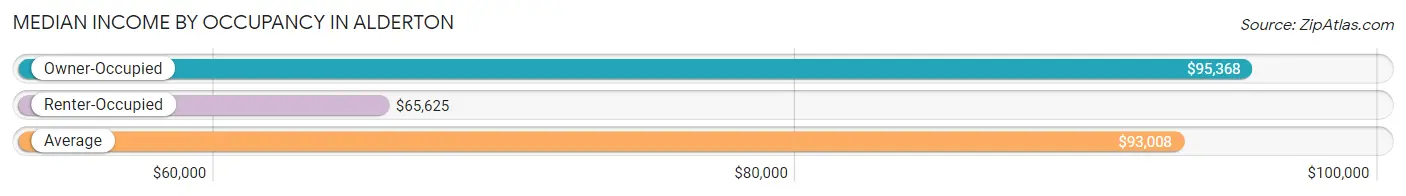
| Occupancy Type | # Households | Median Income |
| Owner-Occupied | 913 (88.9%) | $95,368 |
| Renter-Occupied | 114 (11.1%) | $65,625 |
| Average | 1,027 (100.0%) | $93,008 |
Occupancy by Householder Income Bracket in Alderton
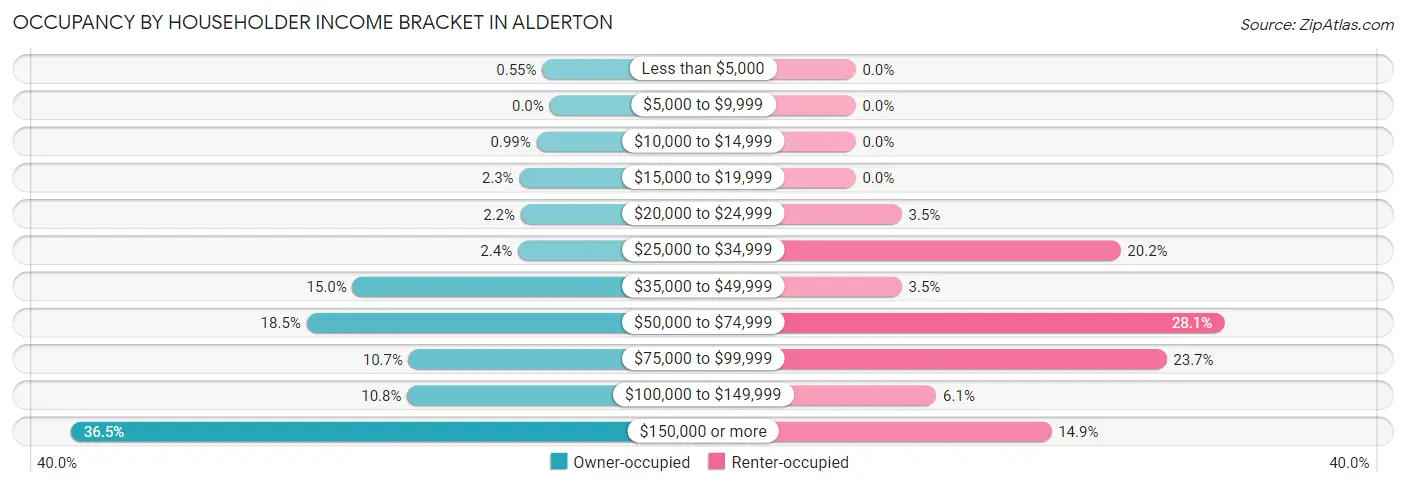
| Income Bracket | Owner-occupied | Renter-occupied |
| Less than $5,000 | 5 (0.5%) | 0 (0.0%) |
| $5,000 to $9,999 | 0 (0.0%) | 0 (0.0%) |
| $10,000 to $14,999 | 9 (1.0%) | 0 (0.0%) |
| $15,000 to $19,999 | 21 (2.3%) | 0 (0.0%) |
| $20,000 to $24,999 | 20 (2.2%) | 4 (3.5%) |
| $25,000 to $34,999 | 22 (2.4%) | 23 (20.2%) |
| $35,000 to $49,999 | 137 (15.0%) | 4 (3.5%) |
| $50,000 to $74,999 | 169 (18.5%) | 32 (28.1%) |
| $75,000 to $99,999 | 98 (10.7%) | 27 (23.7%) |
| $100,000 to $149,999 | 99 (10.8%) | 7 (6.1%) |
| $150,000 or more | 333 (36.5%) | 17 (14.9%) |
| Total | 913 (100.0%) | 114 (100.0%) |
Monthly Housing Cost Tiers in Alderton
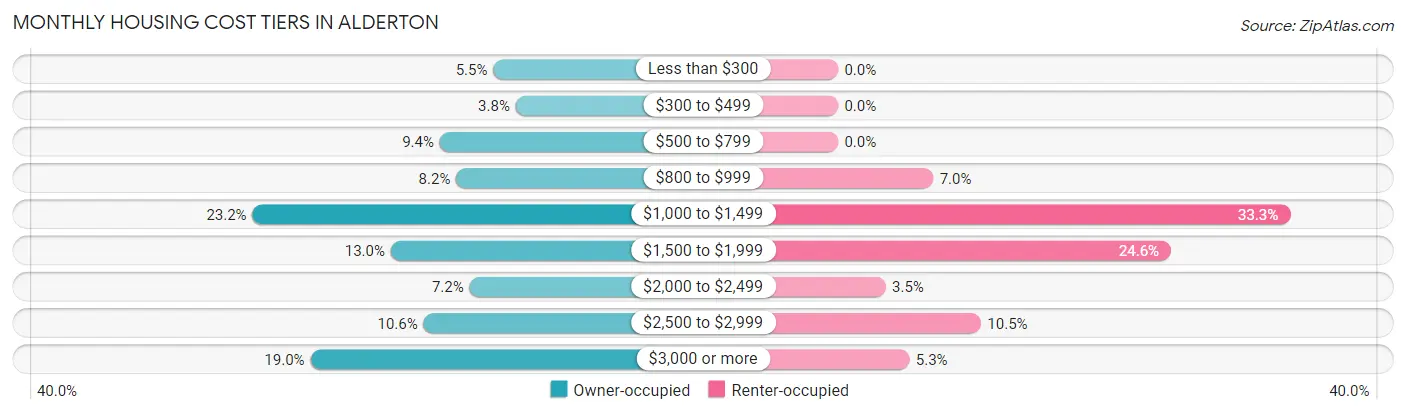
| Monthly Cost | Owner-occupied | Renter-occupied |
| Less than $300 | 50 (5.5%) | 0 (0.0%) |
| $300 to $499 | 35 (3.8%) | 0 (0.0%) |
| $500 to $799 | 86 (9.4%) | 0 (0.0%) |
| $800 to $999 | 75 (8.2%) | 8 (7.0%) |
| $1,000 to $1,499 | 212 (23.2%) | 38 (33.3%) |
| $1,500 to $1,999 | 119 (13.0%) | 28 (24.6%) |
| $2,000 to $2,499 | 66 (7.2%) | 4 (3.5%) |
| $2,500 to $2,999 | 97 (10.6%) | 12 (10.5%) |
| $3,000 or more | 173 (19.0%) | 6 (5.3%) |
| Total | 913 (100.0%) | 114 (100.0%) |
Physical Housing Characteristics in Alderton
Housing Structures in Alderton
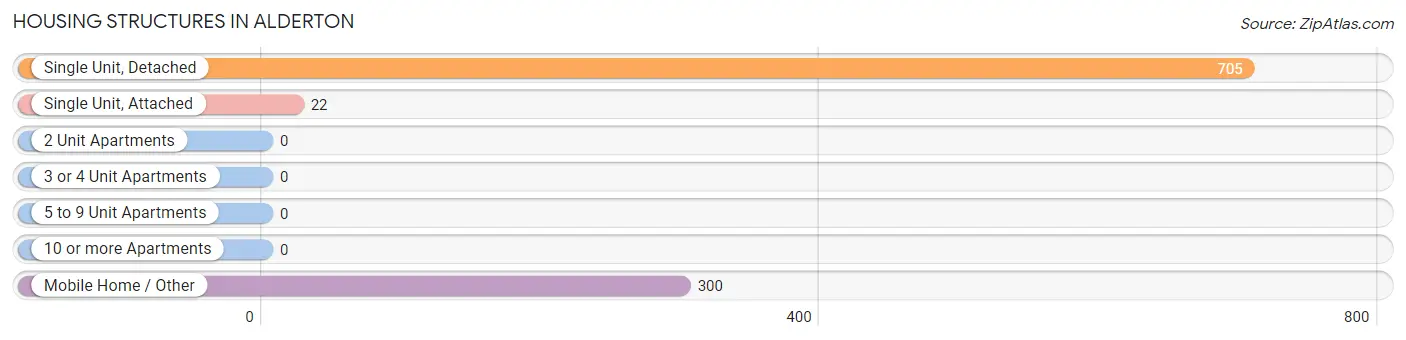
| Structure Type | # Housing Units | % Housing Units |
| Single Unit, Detached | 705 | 68.6% |
| Single Unit, Attached | 22 | 2.1% |
| 2 Unit Apartments | 0 | 0.0% |
| 3 or 4 Unit Apartments | 0 | 0.0% |
| 5 to 9 Unit Apartments | 0 | 0.0% |
| 10 or more Apartments | 0 | 0.0% |
| Mobile Home / Other | 300 | 29.2% |
| Total | 1,027 | 100.0% |
Housing Structures by Occupancy in Alderton
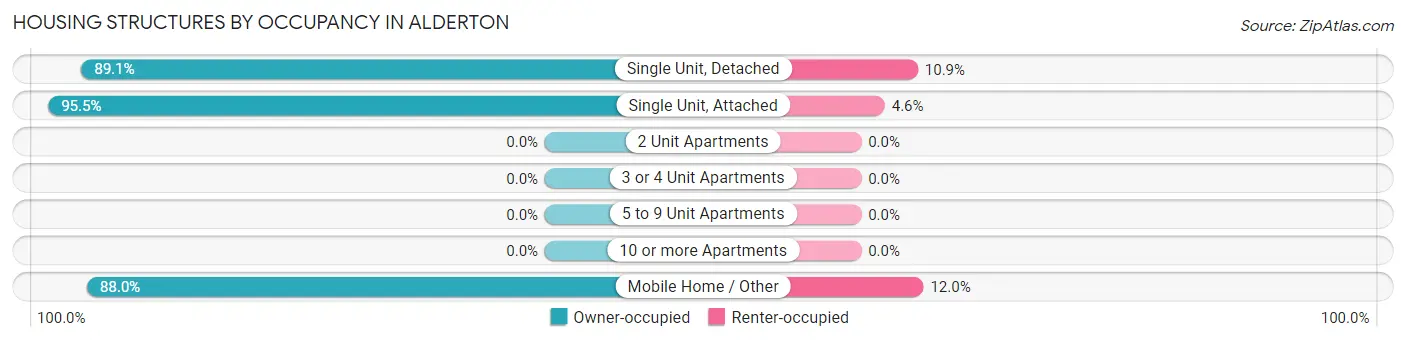
| Structure Type | Owner-occupied | Renter-occupied |
| Single Unit, Detached | 628 (89.1%) | 77 (10.9%) |
| Single Unit, Attached | 21 (95.5%) | 1 (4.5%) |
| 2 Unit Apartments | 0 (0.0%) | 0 (0.0%) |
| 3 or 4 Unit Apartments | 0 (0.0%) | 0 (0.0%) |
| 5 to 9 Unit Apartments | 0 (0.0%) | 0 (0.0%) |
| 10 or more Apartments | 0 (0.0%) | 0 (0.0%) |
| Mobile Home / Other | 264 (88.0%) | 36 (12.0%) |
| Total | 913 (88.9%) | 114 (11.1%) |
Housing Structures by Number of Rooms in Alderton
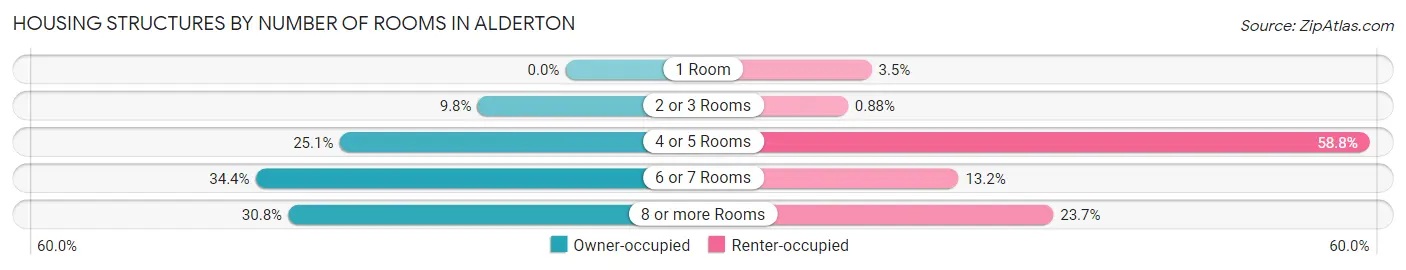
| Number of Rooms | Owner-occupied | Renter-occupied |
| 1 Room | 0 (0.0%) | 4 (3.5%) |
| 2 or 3 Rooms | 89 (9.8%) | 1 (0.9%) |
| 4 or 5 Rooms | 229 (25.1%) | 67 (58.8%) |
| 6 or 7 Rooms | 314 (34.4%) | 15 (13.2%) |
| 8 or more Rooms | 281 (30.8%) | 27 (23.7%) |
| Total | 913 (100.0%) | 114 (100.0%) |
Housing Structure by Heating Type in Alderton
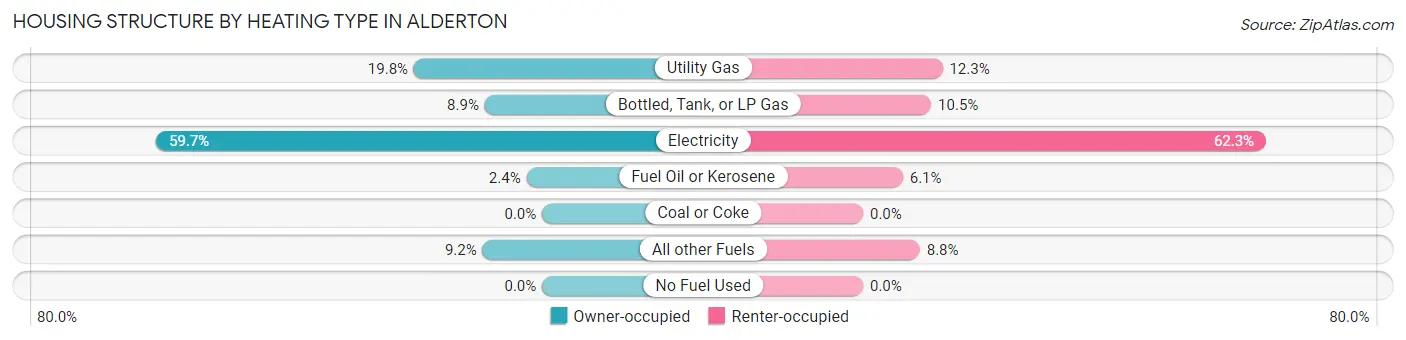
| Heating Type | Owner-occupied | Renter-occupied |
| Utility Gas | 181 (19.8%) | 14 (12.3%) |
| Bottled, Tank, or LP Gas | 81 (8.9%) | 12 (10.5%) |
| Electricity | 545 (59.7%) | 71 (62.3%) |
| Fuel Oil or Kerosene | 22 (2.4%) | 7 (6.1%) |
| Coal or Coke | 0 (0.0%) | 0 (0.0%) |
| All other Fuels | 84 (9.2%) | 10 (8.8%) |
| No Fuel Used | 0 (0.0%) | 0 (0.0%) |
| Total | 913 (100.0%) | 114 (100.0%) |
Household Vehicle Usage in Alderton
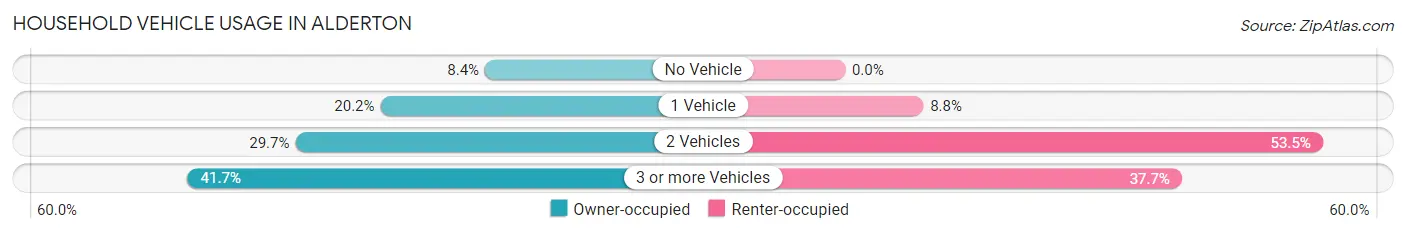
| Vehicles per Household | Owner-occupied | Renter-occupied |
| No Vehicle | 77 (8.4%) | 0 (0.0%) |
| 1 Vehicle | 184 (20.2%) | 10 (8.8%) |
| 2 Vehicles | 271 (29.7%) | 61 (53.5%) |
| 3 or more Vehicles | 381 (41.7%) | 43 (37.7%) |
| Total | 913 (100.0%) | 114 (100.0%) |
Real Estate & Mortgages in Alderton
Real Estate and Mortgage Overview in Alderton
| Characteristic | Without Mortgage | With Mortgage |
| Housing Units | 420 | 493 |
| Median Property Value | $263,900 | $523,400 |
| Median Household Income | $63,542 | $271 |
| Monthly Housing Costs | $958 | $173 |
| Real Estate Taxes | $3,697 | $36 |
Property Value by Mortgage Status in Alderton
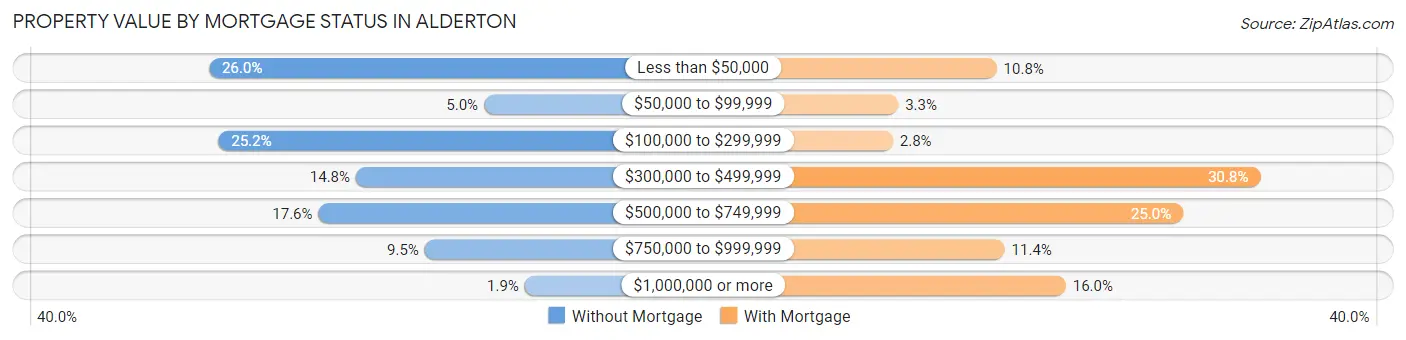
| Property Value | Without Mortgage | With Mortgage |
| Less than $50,000 | 109 (26.0%) | 53 (10.7%) |
| $50,000 to $99,999 | 21 (5.0%) | 16 (3.3%) |
| $100,000 to $299,999 | 106 (25.2%) | 14 (2.8%) |
| $300,000 to $499,999 | 62 (14.8%) | 152 (30.8%) |
| $500,000 to $749,999 | 74 (17.6%) | 123 (24.9%) |
| $750,000 to $999,999 | 40 (9.5%) | 56 (11.4%) |
| $1,000,000 or more | 8 (1.9%) | 79 (16.0%) |
| Total | 420 (100.0%) | 493 (100.0%) |
Household Income by Mortgage Status in Alderton
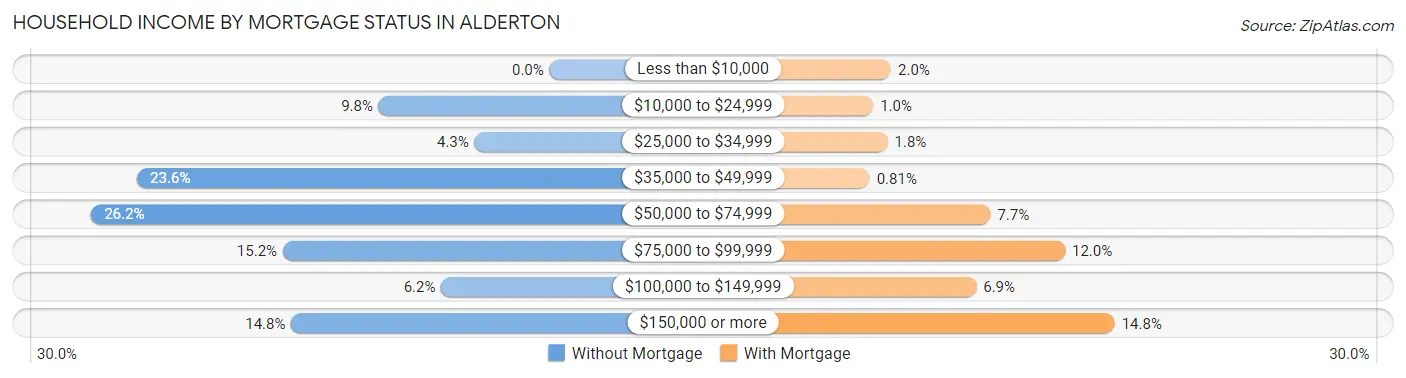
| Household Income | Without Mortgage | With Mortgage |
| Less than $10,000 | 0 (0.0%) | 10 (2.0%) |
| $10,000 to $24,999 | 41 (9.8%) | 5 (1.0%) |
| $25,000 to $34,999 | 18 (4.3%) | 9 (1.8%) |
| $35,000 to $49,999 | 99 (23.6%) | 4 (0.8%) |
| $50,000 to $74,999 | 110 (26.2%) | 38 (7.7%) |
| $75,000 to $99,999 | 64 (15.2%) | 59 (12.0%) |
| $100,000 to $149,999 | 26 (6.2%) | 34 (6.9%) |
| $150,000 or more | 62 (14.8%) | 73 (14.8%) |
| Total | 420 (100.0%) | 493 (100.0%) |
Property Value to Household Income Ratio in Alderton
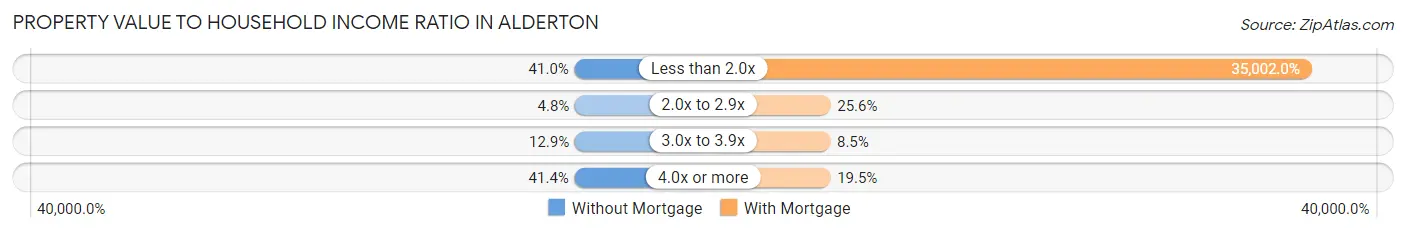
| Value-to-Income Ratio | Without Mortgage | With Mortgage |
| Less than 2.0x | 172 (40.9%) | 172,560 (35,002.0%) |
| 2.0x to 2.9x | 20 (4.8%) | 126 (25.6%) |
| 3.0x to 3.9x | 54 (12.9%) | 42 (8.5%) |
| 4.0x or more | 174 (41.4%) | 96 (19.5%) |
| Total | 420 (100.0%) | 493 (100.0%) |
Real Estate Taxes by Mortgage Status in Alderton
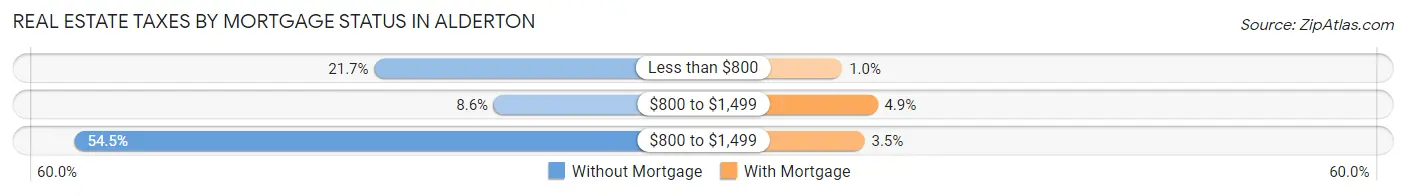
| Property Taxes | Without Mortgage | With Mortgage |
| Less than $800 | 91 (21.7%) | 5 (1.0%) |
| $800 to $1,499 | 36 (8.6%) | 24 (4.9%) |
| $800 to $1,499 | 229 (54.5%) | 17 (3.5%) |
| Total | 420 (100.0%) | 493 (100.0%) |
Health & Disability in Alderton
Health Insurance Coverage by Age in Alderton
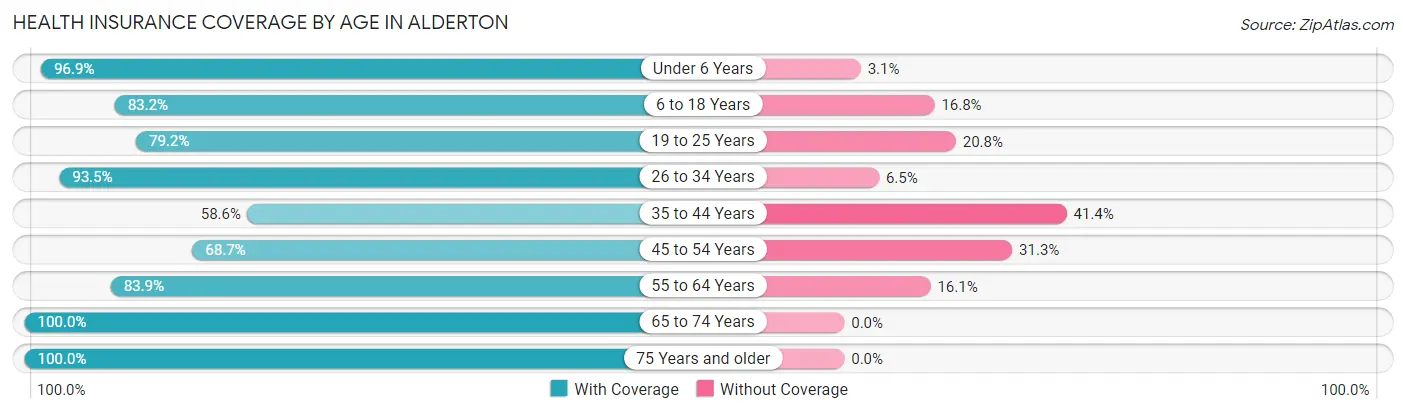
| Age Bracket | With Coverage | Without Coverage |
| Under 6 Years | 95 (96.9%) | 3 (3.1%) |
| 6 to 18 Years | 292 (83.2%) | 59 (16.8%) |
| 19 to 25 Years | 141 (79.2%) | 37 (20.8%) |
| 26 to 34 Years | 260 (93.5%) | 18 (6.5%) |
| 35 to 44 Years | 253 (58.6%) | 179 (41.4%) |
| 45 to 54 Years | 248 (68.7%) | 113 (31.3%) |
| 55 to 64 Years | 397 (83.9%) | 76 (16.1%) |
| 65 to 74 Years | 319 (100.0%) | 0 (0.0%) |
| 75 Years and older | 196 (100.0%) | 0 (0.0%) |
| Total | 2,201 (81.9%) | 485 (18.1%) |
Health Insurance Coverage by Citizenship Status in Alderton
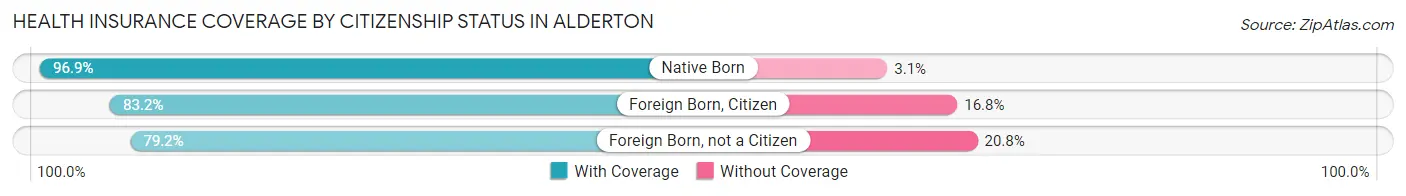
| Citizenship Status | With Coverage | Without Coverage |
| Native Born | 95 (96.9%) | 3 (3.1%) |
| Foreign Born, Citizen | 292 (83.2%) | 59 (16.8%) |
| Foreign Born, not a Citizen | 141 (79.2%) | 37 (20.8%) |
Health Insurance Coverage by Household Income in Alderton
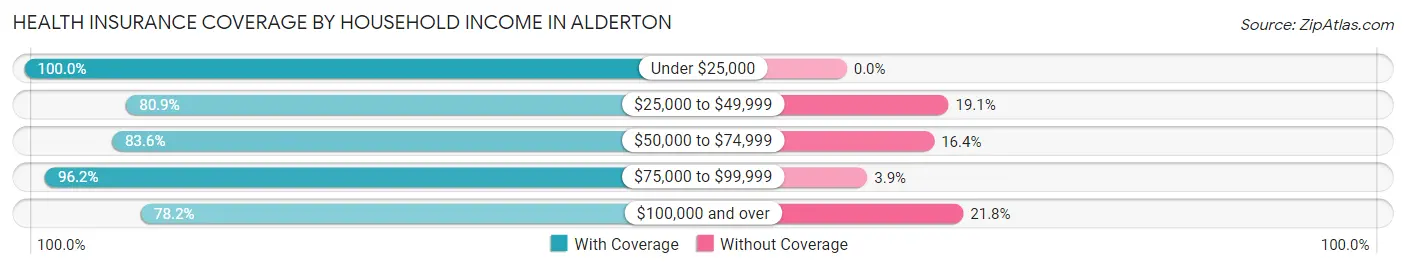
| Household Income | With Coverage | Without Coverage |
| Under $25,000 | 88 (100.0%) | 0 (0.0%) |
| $25,000 to $49,999 | 276 (80.9%) | 65 (19.1%) |
| $50,000 to $74,999 | 388 (83.6%) | 76 (16.4%) |
| $75,000 to $99,999 | 250 (96.2%) | 10 (3.8%) |
| $100,000 and over | 1,195 (78.2%) | 334 (21.8%) |
Public vs Private Health Insurance Coverage by Age in Alderton
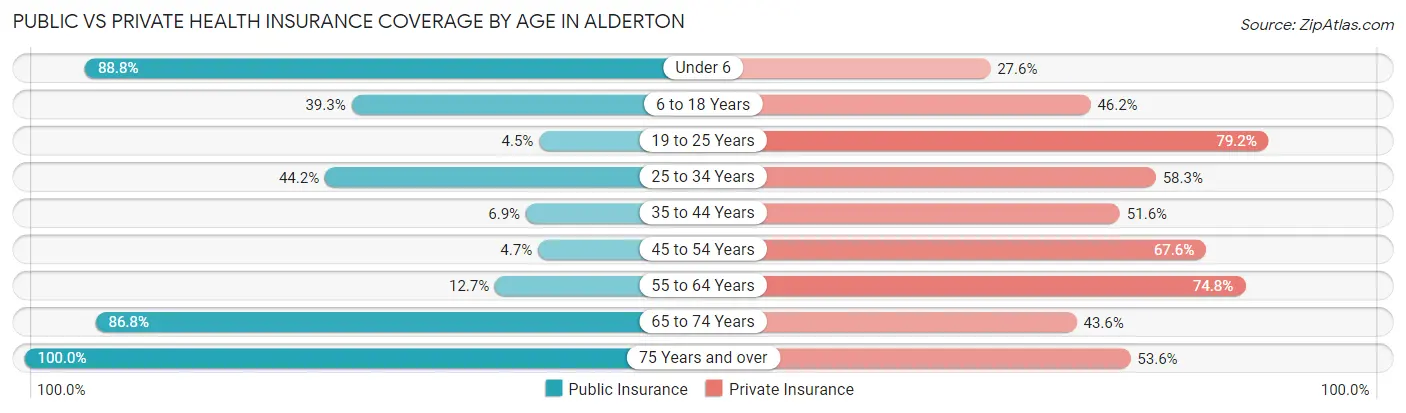
| Age Bracket | Public Insurance | Private Insurance |
| Under 6 | 87 (88.8%) | 27 (27.6%) |
| 6 to 18 Years | 138 (39.3%) | 162 (46.2%) |
| 19 to 25 Years | 8 (4.5%) | 141 (79.2%) |
| 25 to 34 Years | 123 (44.2%) | 162 (58.3%) |
| 35 to 44 Years | 30 (6.9%) | 223 (51.6%) |
| 45 to 54 Years | 17 (4.7%) | 244 (67.6%) |
| 55 to 64 Years | 60 (12.7%) | 354 (74.8%) |
| 65 to 74 Years | 277 (86.8%) | 139 (43.6%) |
| 75 Years and over | 196 (100.0%) | 105 (53.6%) |
| Total | 936 (34.8%) | 1,557 (58.0%) |
Disability Status by Sex by Age in Alderton
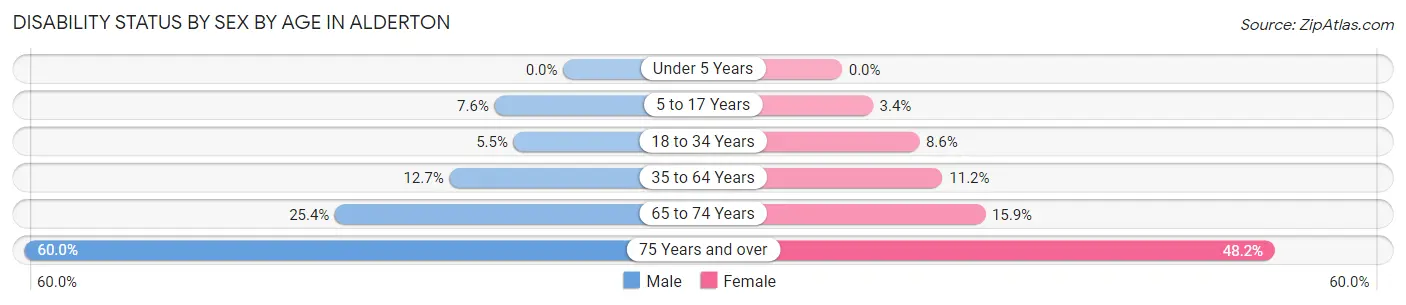
| Age Bracket | Male | Female |
| Under 5 Years | 0 (0.0%) | 0 (0.0%) |
| 5 to 17 Years | 12 (7.6%) | 7 (3.4%) |
| 18 to 34 Years | 10 (5.5%) | 25 (8.6%) |
| 35 to 64 Years | 79 (12.7%) | 72 (11.2%) |
| 65 to 74 Years | 46 (25.4%) | 22 (15.9%) |
| 75 Years and over | 33 (60.0%) | 68 (48.2%) |
Disability Class by Sex by Age in Alderton
Disability Class: Hearing Difficulty
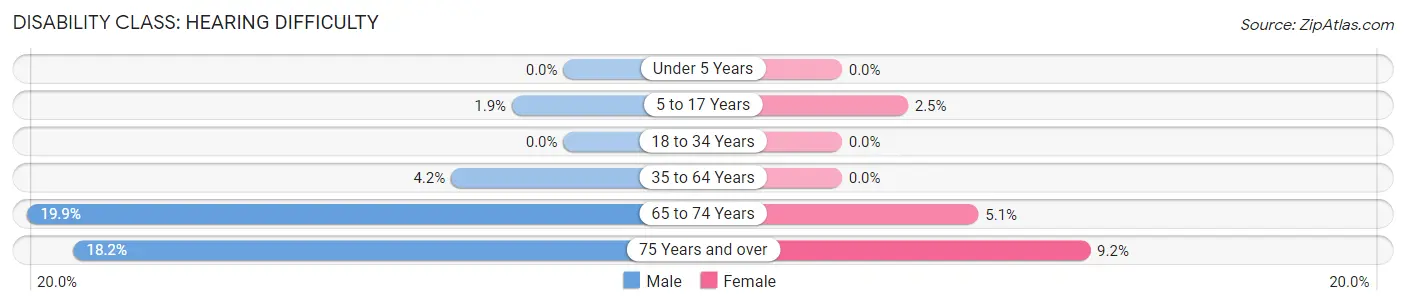
| Age Bracket | Male | Female |
| Under 5 Years | 0 (0.0%) | 0 (0.0%) |
| 5 to 17 Years | 3 (1.9%) | 5 (2.5%) |
| 18 to 34 Years | 0 (0.0%) | 0 (0.0%) |
| 35 to 64 Years | 26 (4.2%) | 0 (0.0%) |
| 65 to 74 Years | 36 (19.9%) | 7 (5.1%) |
| 75 Years and over | 10 (18.2%) | 13 (9.2%) |
Disability Class: Vision Difficulty
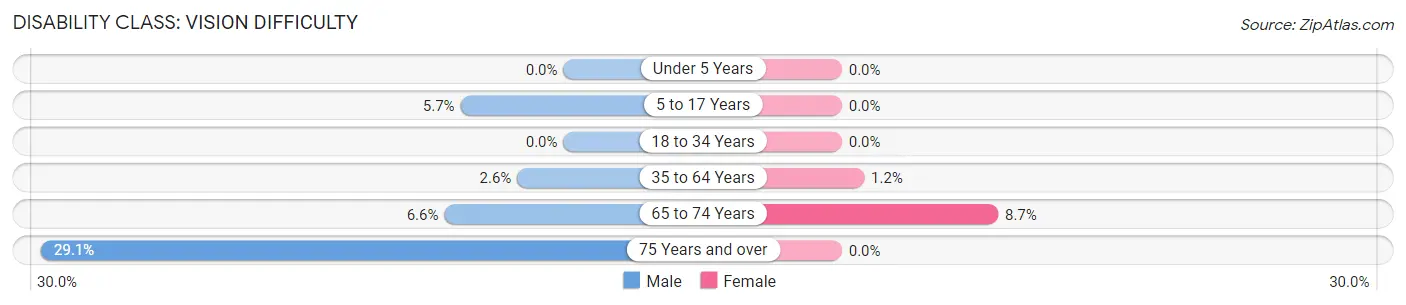
| Age Bracket | Male | Female |
| Under 5 Years | 0 (0.0%) | 0 (0.0%) |
| 5 to 17 Years | 9 (5.7%) | 0 (0.0%) |
| 18 to 34 Years | 0 (0.0%) | 0 (0.0%) |
| 35 to 64 Years | 16 (2.6%) | 8 (1.2%) |
| 65 to 74 Years | 12 (6.6%) | 12 (8.7%) |
| 75 Years and over | 16 (29.1%) | 0 (0.0%) |
Disability Class: Cognitive Difficulty
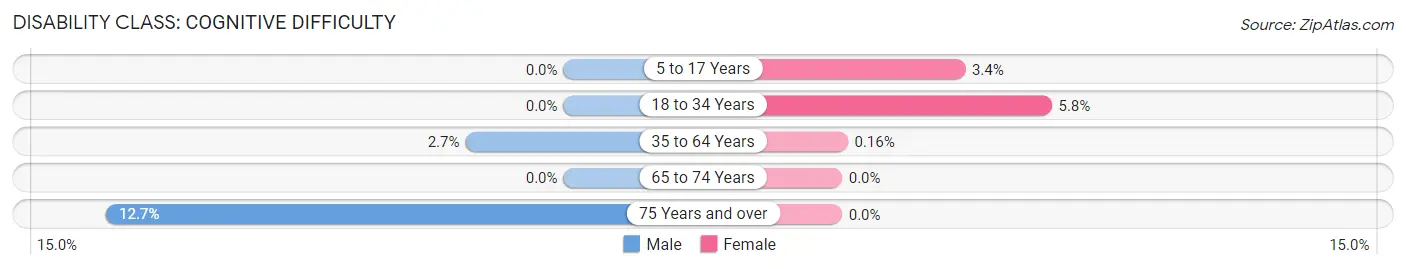
| Age Bracket | Male | Female |
| 5 to 17 Years | 0 (0.0%) | 7 (3.4%) |
| 18 to 34 Years | 0 (0.0%) | 17 (5.8%) |
| 35 to 64 Years | 17 (2.7%) | 1 (0.2%) |
| 65 to 74 Years | 0 (0.0%) | 0 (0.0%) |
| 75 Years and over | 7 (12.7%) | 0 (0.0%) |
Disability Class: Ambulatory Difficulty
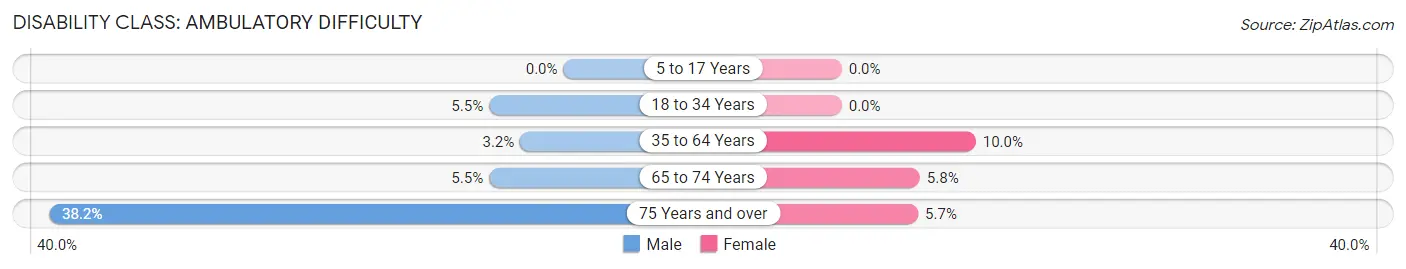
| Age Bracket | Male | Female |
| 5 to 17 Years | 0 (0.0%) | 0 (0.0%) |
| 18 to 34 Years | 10 (5.5%) | 0 (0.0%) |
| 35 to 64 Years | 20 (3.2%) | 64 (10.0%) |
| 65 to 74 Years | 10 (5.5%) | 8 (5.8%) |
| 75 Years and over | 21 (38.2%) | 8 (5.7%) |
Disability Class: Self-Care Difficulty
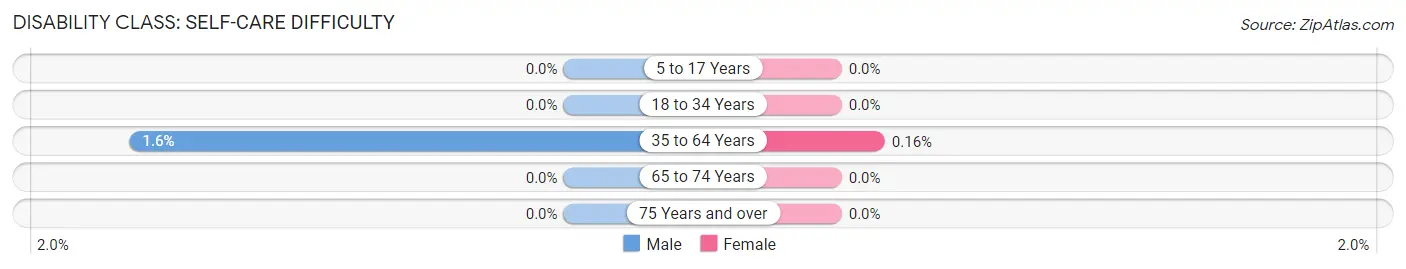
| Age Bracket | Male | Female |
| 5 to 17 Years | 0 (0.0%) | 0 (0.0%) |
| 18 to 34 Years | 0 (0.0%) | 0 (0.0%) |
| 35 to 64 Years | 10 (1.6%) | 1 (0.2%) |
| 65 to 74 Years | 0 (0.0%) | 0 (0.0%) |
| 75 Years and over | 0 (0.0%) | 0 (0.0%) |
Technology Access in Alderton
Computing Device Access in Alderton
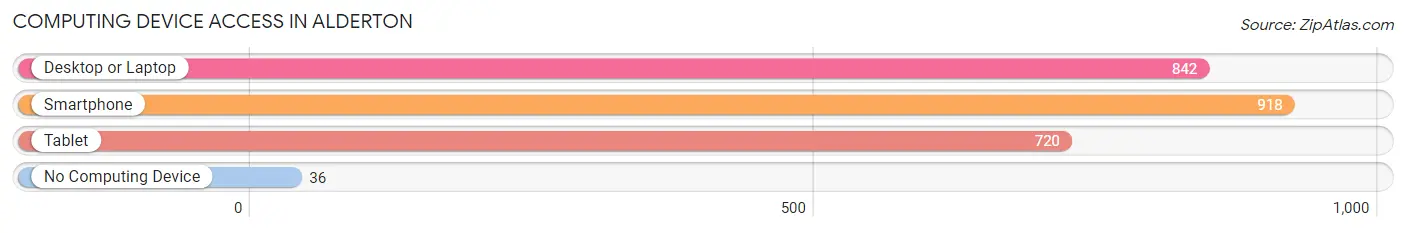
| Device Type | # Households | % Households |
| Desktop or Laptop | 842 | 82.0% |
| Smartphone | 918 | 89.4% |
| Tablet | 720 | 70.1% |
| No Computing Device | 36 | 3.5% |
| Total | 1,027 | 100.0% |
Internet Access in Alderton
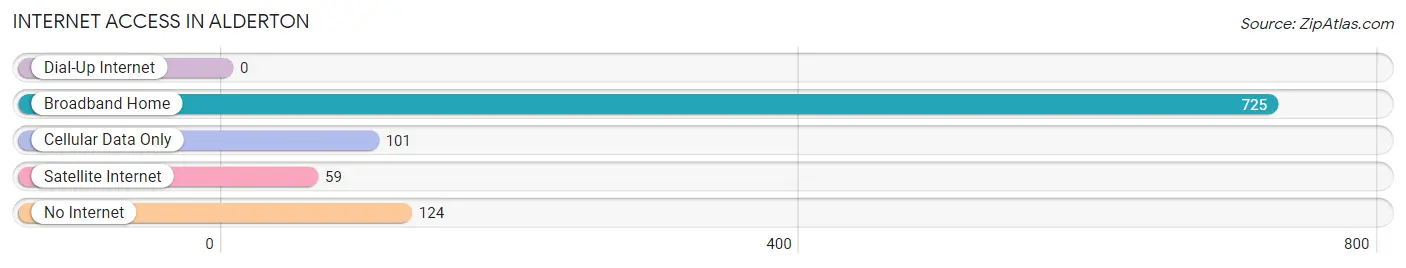
| Internet Type | # Households | % Households |
| Dial-Up Internet | 0 | 0.0% |
| Broadband Home | 725 | 70.6% |
| Cellular Data Only | 101 | 9.8% |
| Satellite Internet | 59 | 5.7% |
| No Internet | 124 | 12.1% |
| Total | 1,027 | 100.0% |
Alderton Summary
Alderton is a small town located in the state of Washington, United States. It is situated in the foothills of the Cascade Mountains, approximately 25 miles east of Seattle. The town has a population of approximately 1,500 people and is part of the King County metropolitan area.
History
Alderton was founded in 1883 by a group of settlers from the Midwest. The town was named after the Alderton family, who were among the first settlers. The town was originally a logging and farming community, and the first sawmill was built in 1884. The town grew steadily over the years, and by the early 1900s, it had become a thriving community with a population of over 1,000 people.
In the 1920s, the town began to experience a decline in population as people moved away to larger cities. However, the town was able to remain relatively stable due to its proximity to Seattle and the surrounding area. In the 1950s, the town experienced a resurgence in population as people moved back to the area.
Geography
Alderton is located in the foothills of the Cascade Mountains, approximately 25 miles east of Seattle. The town is situated at an elevation of approximately 1,000 feet above sea level. The town is surrounded by forests and mountains, and is home to several small lakes and streams. The climate in Alderton is mild, with temperatures ranging from the mid-50s in the winter to the mid-80s in the summer.
Economy
Alderton’s economy is largely based on tourism and agriculture. The town is home to several small businesses, including restaurants, shops, and lodging. The town also has a small manufacturing sector, which produces a variety of products, including furniture and clothing.
The town is also home to several wineries, which produce a variety of wines. The town is also home to several farms, which produce a variety of fruits and vegetables.
Demographics
As of the 2010 census, the population of Alderton was 1,500 people. The town is predominantly white, with approximately 90% of the population being Caucasian. The town also has a small Hispanic population, with approximately 5% of the population being of Hispanic or Latino origin. The town also has a small African American population, with approximately 2% of the population being of African American origin.
The median household income in Alderton is approximately $50,000, and the median home value is approximately $200,000. The town has a low unemployment rate, with approximately 4% of the population being unemployed.
Conclusion
Alderton is a small town located in the state of Washington, United States. It is situated in the foothills of the Cascade Mountains, approximately 25 miles east of Seattle. The town has a population of approximately 1,500 people and is part of the King County metropolitan area. The town’s economy is largely based on tourism and agriculture, and the town is home to several small businesses, wineries, and farms. The town is predominantly white, with approximately 90% of the population being Caucasian. The median household income in Alderton is approximately $50,000, and the median home value is approximately $200,000.
Common Questions
What is the Total Population of Alderton?
Total Population of Alderton is 2,686.
What is the Total Male Population of Alderton?
Total Male Population of Alderton is 1,227.
What is the Total Female Population of Alderton?
Total Female Population of Alderton is 1,459.
What is the Ratio of Males per 100 Females in Alderton?
There are 84.10 Males per 100 Females in Alderton.
What is the Ratio of Females per 100 Males in Alderton?
There are 118.91 Females per 100 Males in Alderton.
What is the Median Population Age in Alderton?
Median Population Age in Alderton is 45.2 Years.
What is the Average Family Size in Alderton
Average Family Size in Alderton is 3.1 People.
What is the Average Household Size in Alderton
Average Household Size in Alderton is 2.6 People.
What is Per Capita Income in Alderton?
Per Capita income in Alderton is $51,668.
What is the Median Family Income in Alderton?
Median Family Income in Alderton is $94,926.
What is the Median Household income in Alderton?
Median Household Income in Alderton is $93,008.
What is Income or Wage Gap in Alderton?
Income or Wage Gap in Alderton is 29.2%.
Women in Alderton earn 70.8 cents for every dollar earned by a man.
What is Family Income Deficit in Alderton?
Family Income Deficit in Alderton is $22,418.
Families that are below poverty line in Alderton earn $22,418 less on average than the poverty threshold level.
What is Inequality or Gini Index in Alderton?
Inequality or Gini Index in Alderton is 0.44.
How Large is the Labor Force in Alderton?
There are 1,530 People in the Labor Forcein in Alderton.
What is the Percentage of People in the Labor Force in Alderton?
66.4% of People are in the Labor Force in Alderton.
What is the Unemployment Rate in Alderton?
Unemployment Rate in Alderton is 9.1%.