Benson, UT
Benson Map
Benson Overview
1,816
TOTAL POPULATION
873
MALE POPULATION
943
FEMALE POPULATION
92.58
MALES / 100 FEMALES
108.02
FEMALES / 100 MALES
32.8
MEDIAN AGE
3.7
AVG FAMILY SIZE
3.1
AVG HOUSEHOLD SIZE
$34,919
PER CAPITA INCOME
$100,040
AVG FAMILY INCOME
$69,188
AVG HOUSEHOLD INCOME
55.4%
WAGE / INCOME GAP [ % ]
44.6¢/ $1
WAGE / INCOME GAP [ $ ]
0.47
INEQUALITY / GINI INDEX
1,039
LABOR FORCE [ PEOPLE ]
82.7%
PERCENT IN LABOR FORCE
7.5%
UNEMPLOYMENT RATE
Benson Area Codes
Race in Benson
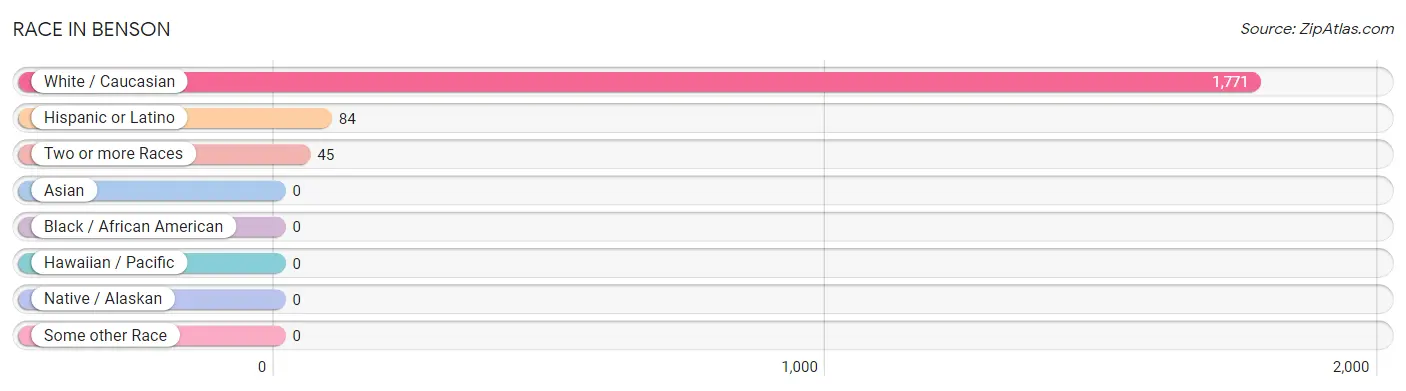
The most populous races in Benson are White / Caucasian (1,771 | 97.5%), Hispanic or Latino (84 | 4.6%), and Two or more Races (45 | 2.5%).
| Race | # Population | % Population |
| Asian | 0 | 0.0% |
| Black / African American | 0 | 0.0% |
| Hawaiian / Pacific | 0 | 0.0% |
| Hispanic or Latino | 84 | 4.6% |
| Native / Alaskan | 0 | 0.0% |
| White / Caucasian | 1,771 | 97.5% |
| Two or more Races | 45 | 2.5% |
| Some other Race | 0 | 0.0% |
| Total | 1,816 | 100.0% |
Ancestry in Benson
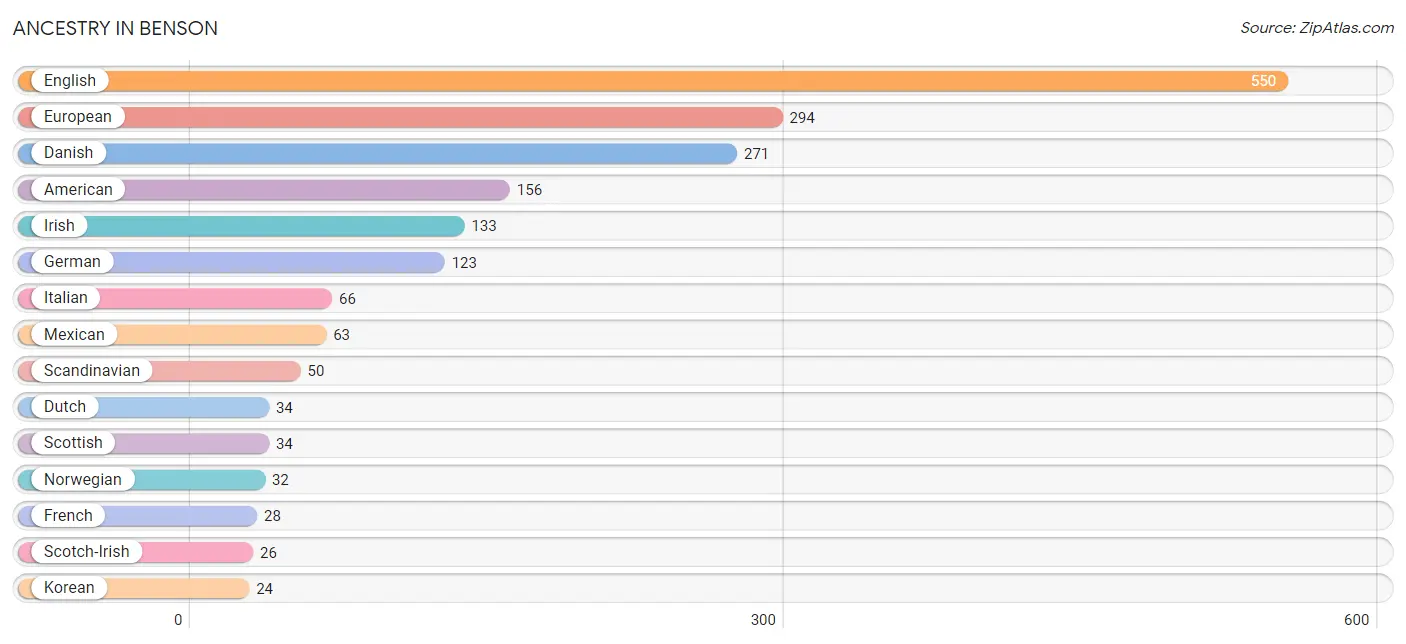
The most populous ancestries reported in Benson are English (550 | 30.3%), European (294 | 16.2%), Danish (271 | 14.9%), American (156 | 8.6%), and Irish (133 | 7.3%), together accounting for 77.3% of all Benson residents.
| Ancestry | # Population | % Population |
| American | 156 | 8.6% |
| Belgian | 15 | 0.8% |
| Danish | 271 | 14.9% |
| Dutch | 34 | 1.9% |
| English | 550 | 30.3% |
| European | 294 | 16.2% |
| French | 28 | 1.5% |
| German | 123 | 6.8% |
| Irish | 133 | 7.3% |
| Italian | 66 | 3.6% |
| Korean | 24 | 1.3% |
| Mexican | 63 | 3.5% |
| Norwegian | 32 | 1.8% |
| Polish | 16 | 0.9% |
| Scandinavian | 50 | 2.8% |
| Scotch-Irish | 26 | 1.4% |
| Scottish | 34 | 1.9% |
| Swedish | 23 | 1.3% | View All 18 Rows |
Immigrants in Benson
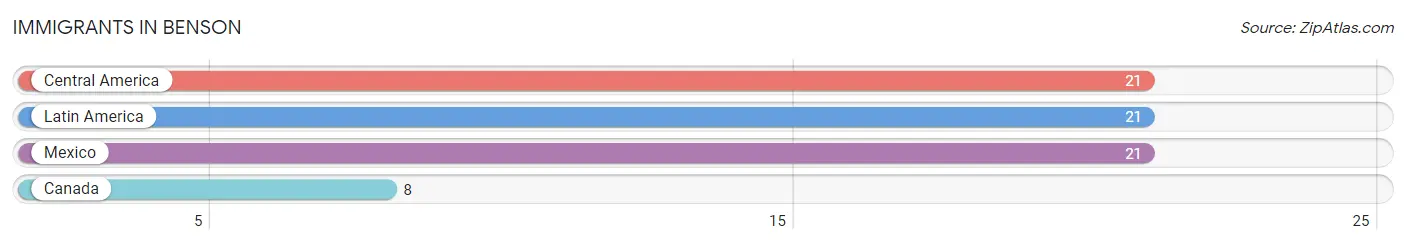
The most numerous immigrant groups reported in Benson came from Central America (21 | 1.2%), Latin America (21 | 1.2%), Mexico (21 | 1.2%), and Canada (8 | 0.4%), together accounting for 3.9% of all Benson residents.
| Immigration Origin | # Population | % Population |
| Canada | 8 | 0.4% |
| Central America | 21 | 1.2% |
| Latin America | 21 | 1.2% |
| Mexico | 21 | 1.2% | View All 4 Rows |
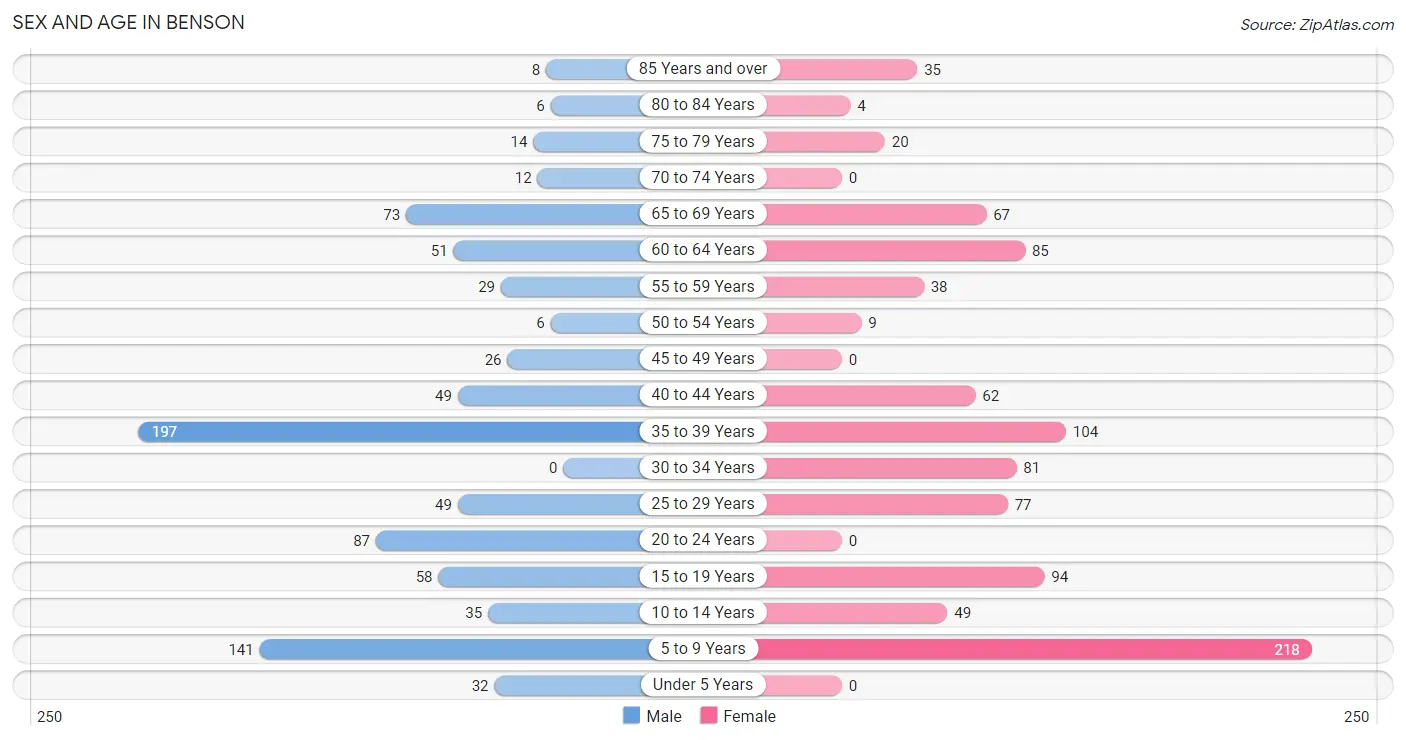
Sex and Age in Benson
Sex and Age in Benson
The most populous age groups in Benson are 35 to 39 Years (197 | 22.6%) for men and 5 to 9 Years (218 | 23.1%) for women.
| Age Bracket | Male | Female |
| Under 5 Years | 32 (3.7%) | 0 (0.0%) |
| 5 to 9 Years | 141 (16.2%) | 218 (23.1%) |
| 10 to 14 Years | 35 (4.0%) | 49 (5.2%) |
| 15 to 19 Years | 58 (6.6%) | 94 (10.0%) |
| 20 to 24 Years | 87 (10.0%) | 0 (0.0%) |
| 25 to 29 Years | 49 (5.6%) | 77 (8.2%) |
| 30 to 34 Years | 0 (0.0%) | 81 (8.6%) |
| 35 to 39 Years | 197 (22.6%) | 104 (11.0%) |
| 40 to 44 Years | 49 (5.6%) | 62 (6.6%) |
| 45 to 49 Years | 26 (3.0%) | 0 (0.0%) |
| 50 to 54 Years | 6 (0.7%) | 9 (0.9%) |
| 55 to 59 Years | 29 (3.3%) | 38 (4.0%) |
| 60 to 64 Years | 51 (5.8%) | 85 (9.0%) |
| 65 to 69 Years | 73 (8.4%) | 67 (7.1%) |
| 70 to 74 Years | 12 (1.4%) | 0 (0.0%) |
| 75 to 79 Years | 14 (1.6%) | 20 (2.1%) |
| 80 to 84 Years | 6 (0.7%) | 4 (0.4%) |
| 85 Years and over | 8 (0.9%) | 35 (3.7%) |
| Total | 873 (100.0%) | 943 (100.0%) |
Families and Households in Benson
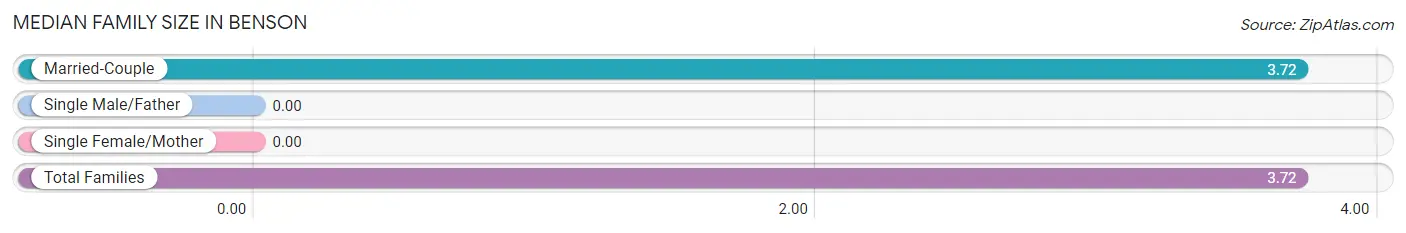
Median Family Size in Benson
| Family Type | # Families | Family Size |
| Married-Couple | 428 (100.0%) | 3.72 |
| Single Male/Father | 0 (0.0%) | - |
| Single Female/Mother | 0 (0.0%) | - |
| Total Families | 428 (100.0%) | 3.72 |
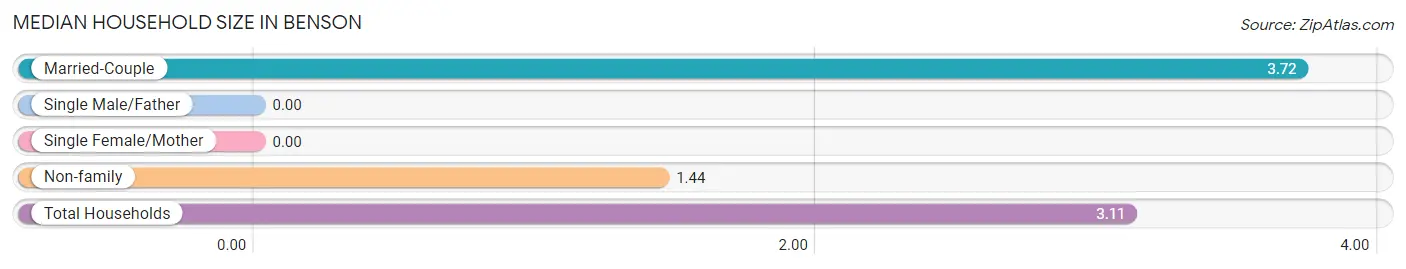
Median Household Size in Benson
| Household Type | # Households | Household Size |
| Married-Couple | 428 (73.4%) | 3.72 |
| Single Male/Father | 0 (0.0%) | - |
| Single Female/Mother | 0 (0.0%) | - |
| Non-family | 155 (26.6%) | 1.44 |
| Total Households | 583 (100.0%) | 3.11 |
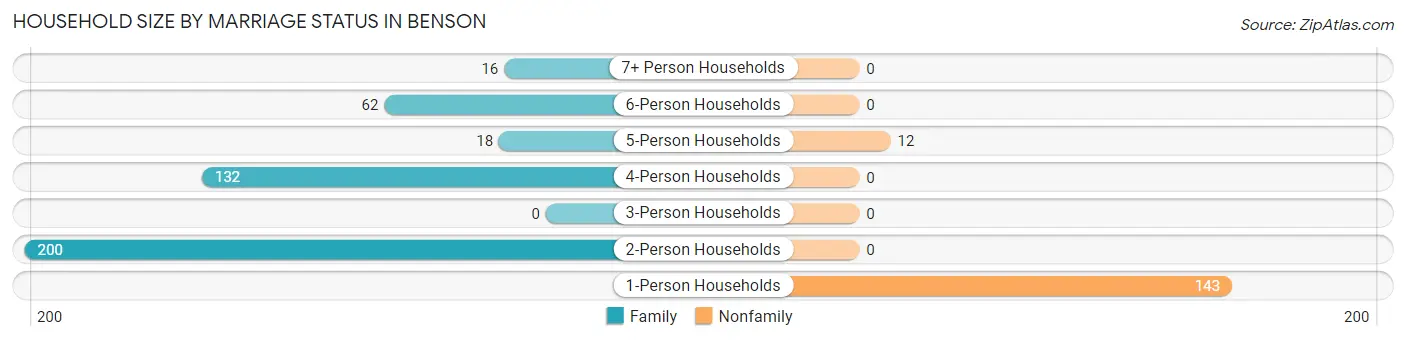
Household Size by Marriage Status in Benson
Out of a total of 583 households in Benson, 428 (73.4%) are family households, while 155 (26.6%) are nonfamily households. The most numerous type of family households are 2-person households, comprising 200, and the most common type of nonfamily households are 1-person households, comprising 143.
| Household Size | Family Households | Nonfamily Households |
| 1-Person Households | - | 143 (24.5%) |
| 2-Person Households | 200 (34.3%) | 0 (0.0%) |
| 3-Person Households | 0 (0.0%) | 0 (0.0%) |
| 4-Person Households | 132 (22.6%) | 0 (0.0%) |
| 5-Person Households | 18 (3.1%) | 12 (2.1%) |
| 6-Person Households | 62 (10.6%) | 0 (0.0%) |
| 7+ Person Households | 16 (2.7%) | 0 (0.0%) |
| Total | 428 (73.4%) | 155 (26.6%) |
Female Fertility in Benson
Fertility by Age in Benson
| Age Bracket | Women with Births | Births / 1,000 Women |
| 15 to 19 years | 0 (0.0%) | 0.0 |
| 20 to 34 years | 0 (0.0%) | 0.0 |
| 35 to 50 years | 0 (0.0%) | 0.0 |
| Total | 0 (0.0%) | 0.0 |
Fertility by Age by Marriage Status in Benson
| Age Bracket | Married | Unmarried |
| 15 to 19 years | 0 (0.0%) | 0 (0.0%) |
| 20 to 34 years | 0 (0.0%) | 0 (0.0%) |
| 35 to 50 years | 0 (0.0%) | 0 (0.0%) |
| Total | 0 (0.0%) | 0 (0.0%) |
Fertility by Education in Benson
| Educational Attainment | Women with Births | Births / 1,000 Women |
| Less than High School | 0 (0.0%) | 0.0 |
| High School Diploma | 0 (0.0%) | 0.0 |
| College or Associate's Degree | 0 (0.0%) | 0.0 |
| Bachelor's Degree | 0 (0.0%) | 0.0 |
| Graduate Degree | 0 (0.0%) | 0.0 |
| Total | 0 (0.0%) | 0.0 |
Fertility by Education by Marriage Status in Benson
| Educational Attainment | Married | Unmarried |
| Less than High School | 0 (0.0%) | 0 (0.0%) |
| High School Diploma | 0 (0.0%) | 0 (0.0%) |
| College or Associate's Degree | 0 (0.0%) | 0 (0.0%) |
| Bachelor's Degree | 0 (0.0%) | 0 (0.0%) |
| Graduate Degree | 0 (0.0%) | 0 (0.0%) |
| Total | 0 (0.0%) | 0 (0.0%) |
Income in Benson
Income Overview in Benson
Per Capita Income in Benson is $34,919, while median incomes of families and households are $100,040 and $69,188 respectively.
| Characteristic | Number | Measure |
| Per Capita Income | 1,816 | $34,919 |
| Median Family Income | 428 | $100,040 |
| Mean Family Income | 428 | $130,224 |
| Median Household Income | 583 | $69,188 |
| Mean Household Income | 583 | $106,815 |
| Income Deficit | 428 | $0 |
| Wage / Income Gap (%) | 1,816 | 55.42% |
| Wage / Income Gap ($) | 1,816 | 44.58¢ per $1 |
| Gini / Inequality Index | 1,816 | 0.47 |
Earnings by Sex in Benson
Average Earnings in Benson are $38,259, $48,036 for men and $21,414 for women, a difference of 55.4%.
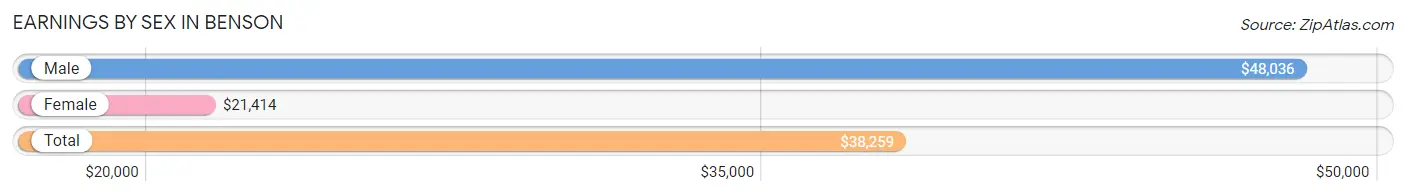
| Sex | Number | Average Earnings |
| Male | 602 (60.9%) | $48,036 |
| Female | 387 (39.1%) | $21,414 |
| Total | 989 (100.0%) | $38,259 |
Earnings by Sex by Income Bracket in Benson
The most common earnings brackets in Benson are $75,000 to $99,999 for men (98 | 16.3%) and $40,000 to $44,999 for women (66 | 17.1%).
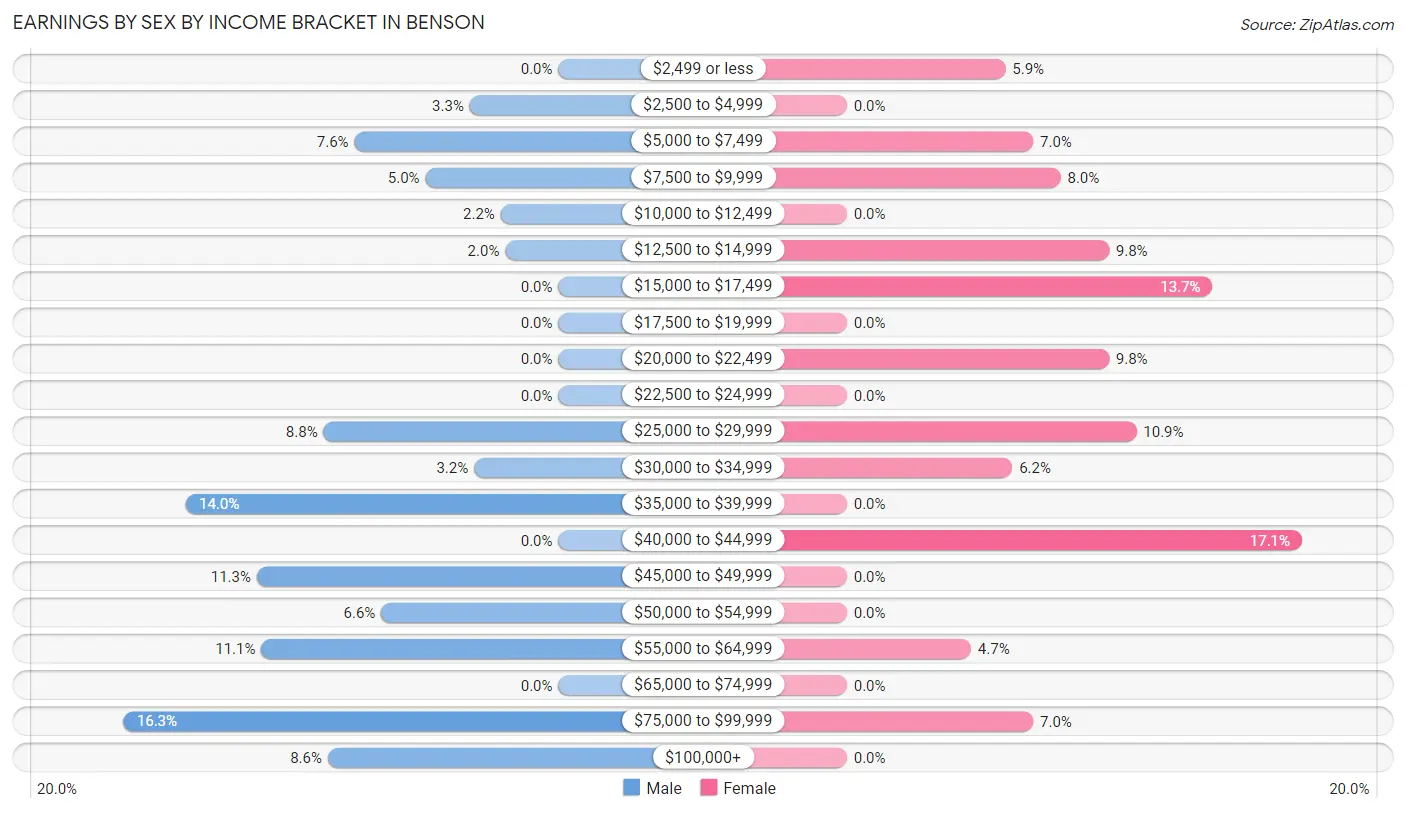
| Income | Male | Female |
| $2,499 or less | 0 (0.0%) | 23 (5.9%) |
| $2,500 to $4,999 | 20 (3.3%) | 0 (0.0%) |
| $5,000 to $7,499 | 46 (7.6%) | 27 (7.0%) |
| $7,500 to $9,999 | 30 (5.0%) | 31 (8.0%) |
| $10,000 to $12,499 | 13 (2.2%) | 0 (0.0%) |
| $12,500 to $14,999 | 12 (2.0%) | 38 (9.8%) |
| $15,000 to $17,499 | 0 (0.0%) | 53 (13.7%) |
| $17,500 to $19,999 | 0 (0.0%) | 0 (0.0%) |
| $20,000 to $22,499 | 0 (0.0%) | 38 (9.8%) |
| $22,500 to $24,999 | 0 (0.0%) | 0 (0.0%) |
| $25,000 to $29,999 | 53 (8.8%) | 42 (10.8%) |
| $30,000 to $34,999 | 19 (3.2%) | 24 (6.2%) |
| $35,000 to $39,999 | 84 (14.0%) | 0 (0.0%) |
| $40,000 to $44,999 | 0 (0.0%) | 66 (17.1%) |
| $45,000 to $49,999 | 68 (11.3%) | 0 (0.0%) |
| $50,000 to $54,999 | 40 (6.6%) | 0 (0.0%) |
| $55,000 to $64,999 | 67 (11.1%) | 18 (4.6%) |
| $65,000 to $74,999 | 0 (0.0%) | 0 (0.0%) |
| $75,000 to $99,999 | 98 (16.3%) | 27 (7.0%) |
| $100,000+ | 52 (8.6%) | 0 (0.0%) |
| Total | 602 (100.0%) | 387 (100.0%) |
Earnings by Sex by Educational Attainment in Benson
Average earnings in Benson are $52,614 for men and $22,336 for women, a difference of 57.6%. Men with an educational attainment of graduate degree enjoy the highest average annual earnings of $107,984, while those with college or associate's degree education earn the least with $53,011. Women with an educational attainment of college or associate's degree earn the most with the average annual earnings of $26,111, while those with high school diploma education have the smallest earnings of $16,274.
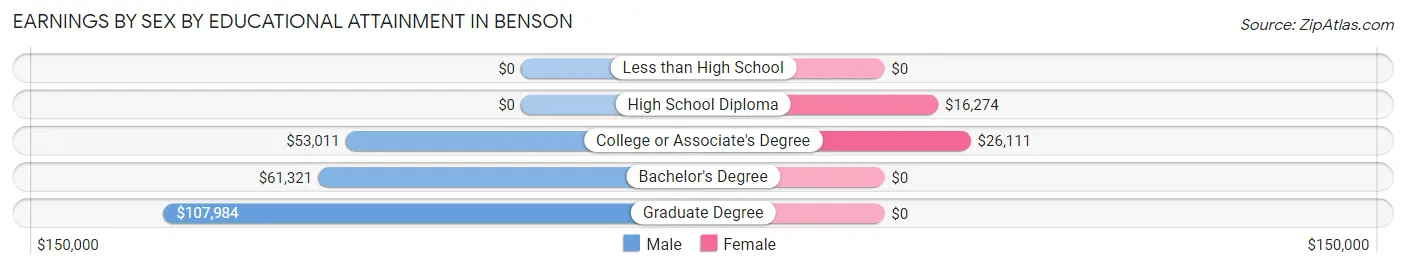
| Educational Attainment | Male Income | Female Income |
| Less than High School | - | - |
| High School Diploma | - | - |
| College or Associate's Degree | $53,011 | $26,111 |
| Bachelor's Degree | $61,321 | $0 |
| Graduate Degree | $107,984 | $0 |
| Total | $52,614 | $22,336 |
Family Income in Benson
Family Income Brackets in Benson
According to the Benson family income data, there are 162 families falling into the $100,000 to $149,999 income range, which is the most common income bracket and makes up 37.9% of all families.
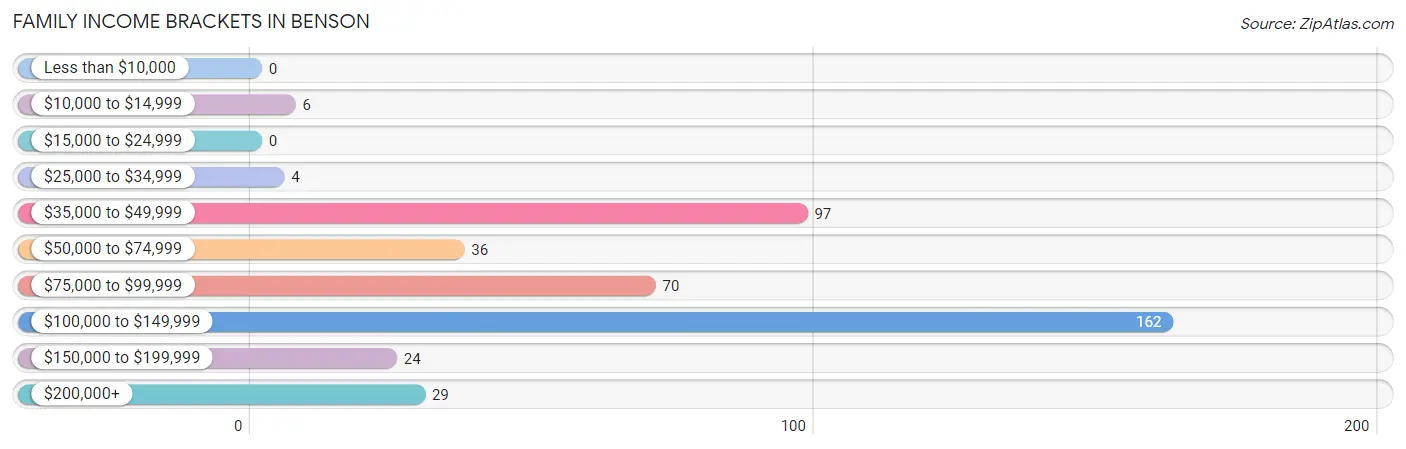
| Income Bracket | # Families | % Families |
| Less than $10,000 | 0 | 0.0% |
| $10,000 to $14,999 | 6 | 1.4% |
| $15,000 to $24,999 | 0 | 0.0% |
| $25,000 to $34,999 | 4 | 0.9% |
| $35,000 to $49,999 | 97 | 22.7% |
| $50,000 to $74,999 | 36 | 8.4% |
| $75,000 to $99,999 | 70 | 16.4% |
| $100,000 to $149,999 | 162 | 37.9% |
| $150,000 to $199,999 | 24 | 5.6% |
| $200,000+ | 29 | 6.8% |
Family Income by Famaliy Size in Benson
6-person families (62 | 14.5%) account for the highest median family income in Benson with $130,481 per family, while 2-person families (200 | 46.7%) have the highest median income of $61,452 per family member.
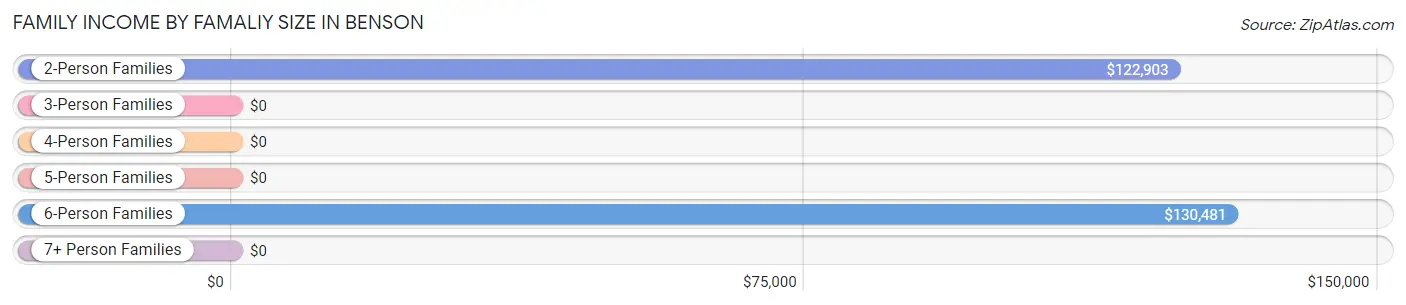
| Income Bracket | # Families | Median Income |
| 2-Person Families | 200 (46.7%) | $122,903 |
| 3-Person Families | 0 (0.0%) | $0 |
| 4-Person Families | 132 (30.8%) | $0 |
| 5-Person Families | 18 (4.2%) | $0 |
| 6-Person Families | 62 (14.5%) | $130,481 |
| 7+ Person Families | 16 (3.7%) | $0 |
| Total | 428 (100.0%) | $100,040 |
Family Income by Number of Earners in Benson
The median family income in Benson is $100,040, with families comprising 3+ earners (63) having the highest median family income of $130,433, while families with 1 earner (113) have the lowest median family income of $39,518, accounting for 14.7% and 26.4% of families, respectively.
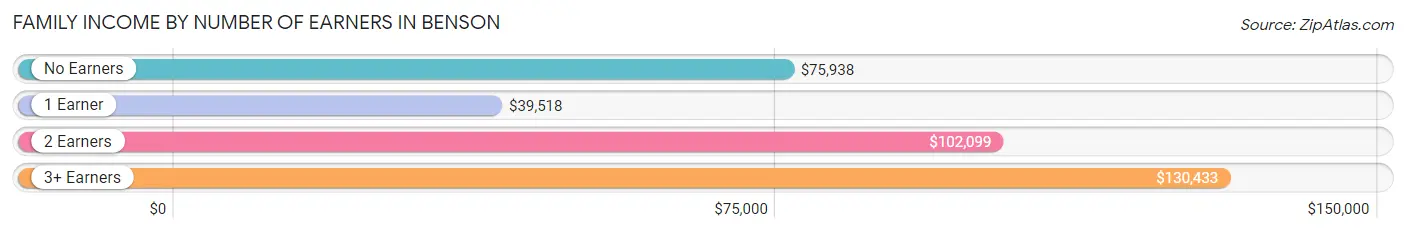
| Number of Earners | # Families | Median Income |
| No Earners | 29 (6.8%) | $75,938 |
| 1 Earner | 113 (26.4%) | $39,518 |
| 2 Earners | 223 (52.1%) | $102,099 |
| 3+ Earners | 63 (14.7%) | $130,433 |
| Total | 428 (100.0%) | $100,040 |
Household Income in Benson
Household Income Brackets in Benson
With 163 households falling in the category, the $35,000 to $49,999 income range is the most frequent in Benson, accounting for 28.0% of all households.
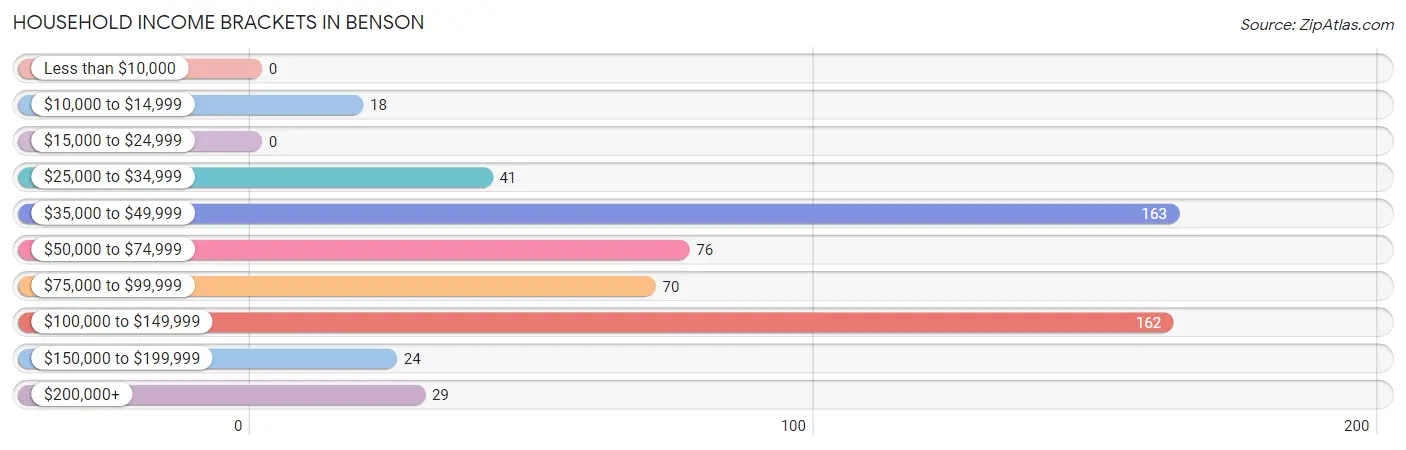
| Income Bracket | # Households | % Households |
| Less than $10,000 | 0 | 0.0% |
| $10,000 to $14,999 | 18 | 3.1% |
| $15,000 to $24,999 | 0 | 0.0% |
| $25,000 to $34,999 | 41 | 7.0% |
| $35,000 to $49,999 | 163 | 28.0% |
| $50,000 to $74,999 | 76 | 13.0% |
| $75,000 to $99,999 | 70 | 12.0% |
| $100,000 to $149,999 | 162 | 27.8% |
| $150,000 to $199,999 | 24 | 4.1% |
| $200,000+ | 29 | 5.0% |
Household Income by Householder Age in Benson
The median household income in Benson is $69,188, with the highest median household income of $90,833 found in the 45 to 64 years age bracket for the primary householder. A total of 140 households (24.0%) fall into this category.
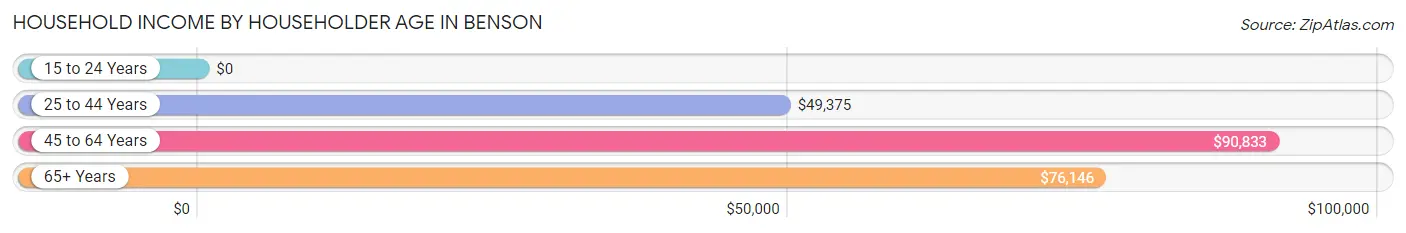
| Income Bracket | # Households | Median Income |
| 15 to 24 Years | 0 (0.0%) | $0 |
| 25 to 44 Years | 302 (51.8%) | $49,375 |
| 45 to 64 Years | 140 (24.0%) | $90,833 |
| 65+ Years | 141 (24.2%) | $76,146 |
| Total | 583 (100.0%) | $69,188 |
Poverty in Benson
Income Below Poverty by Sex and Age in Benson
With 5.8% poverty level for males and 1.8% for females among the residents of Benson, 25 to 34 year old males and 65 to 74 year old females are the most vulnerable to poverty, with 25 males (51.0%) and 6 females (9.0%) in their respective age groups living below the poverty level.
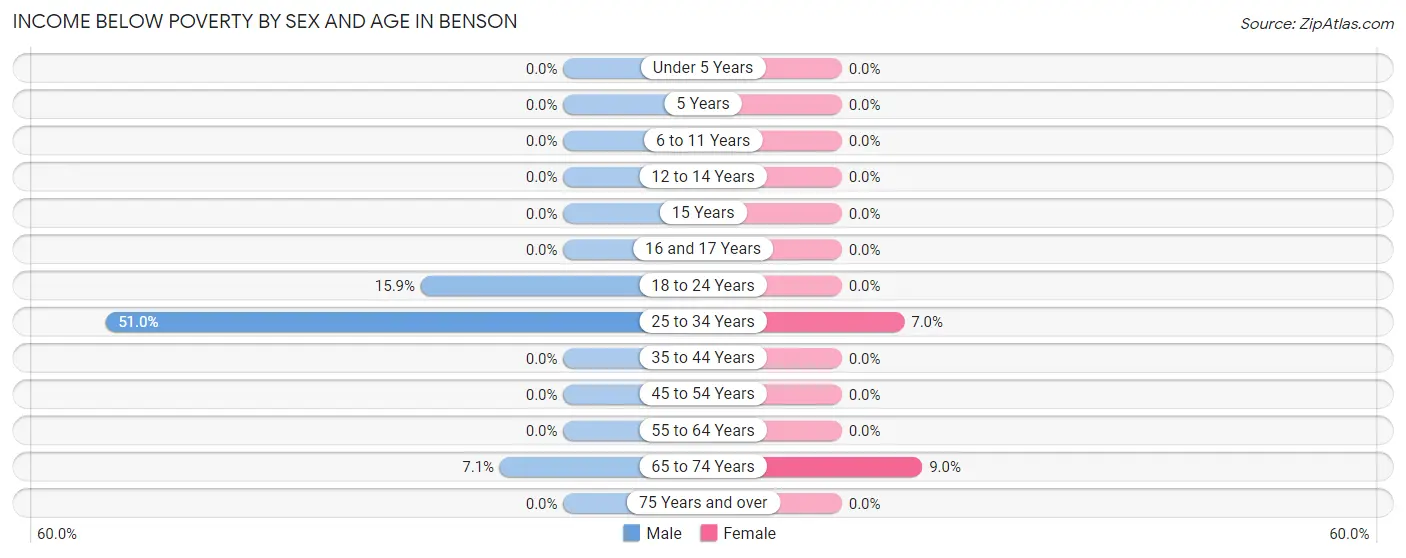
| Age Bracket | Male | Female |
| Under 5 Years | 0 (0.0%) | 0 (0.0%) |
| 5 Years | 0 (0.0%) | 0 (0.0%) |
| 6 to 11 Years | 0 (0.0%) | 0 (0.0%) |
| 12 to 14 Years | 0 (0.0%) | 0 (0.0%) |
| 15 Years | 0 (0.0%) | 0 (0.0%) |
| 16 and 17 Years | 0 (0.0%) | 0 (0.0%) |
| 18 to 24 Years | 20 (15.9%) | 0 (0.0%) |
| 25 to 34 Years | 25 (51.0%) | 11 (7.0%) |
| 35 to 44 Years | 0 (0.0%) | 0 (0.0%) |
| 45 to 54 Years | 0 (0.0%) | 0 (0.0%) |
| 55 to 64 Years | 0 (0.0%) | 0 (0.0%) |
| 65 to 74 Years | 6 (7.1%) | 6 (9.0%) |
| 75 Years and over | 0 (0.0%) | 0 (0.0%) |
| Total | 51 (5.8%) | 17 (1.8%) |
Income Above Poverty by Sex and Age in Benson
According to the poverty statistics in Benson, males aged under 5 years and females aged 6 to 11 years are the age groups that are most secure financially, with 100.0% of males and 100.0% of females in these age groups living above the poverty line.
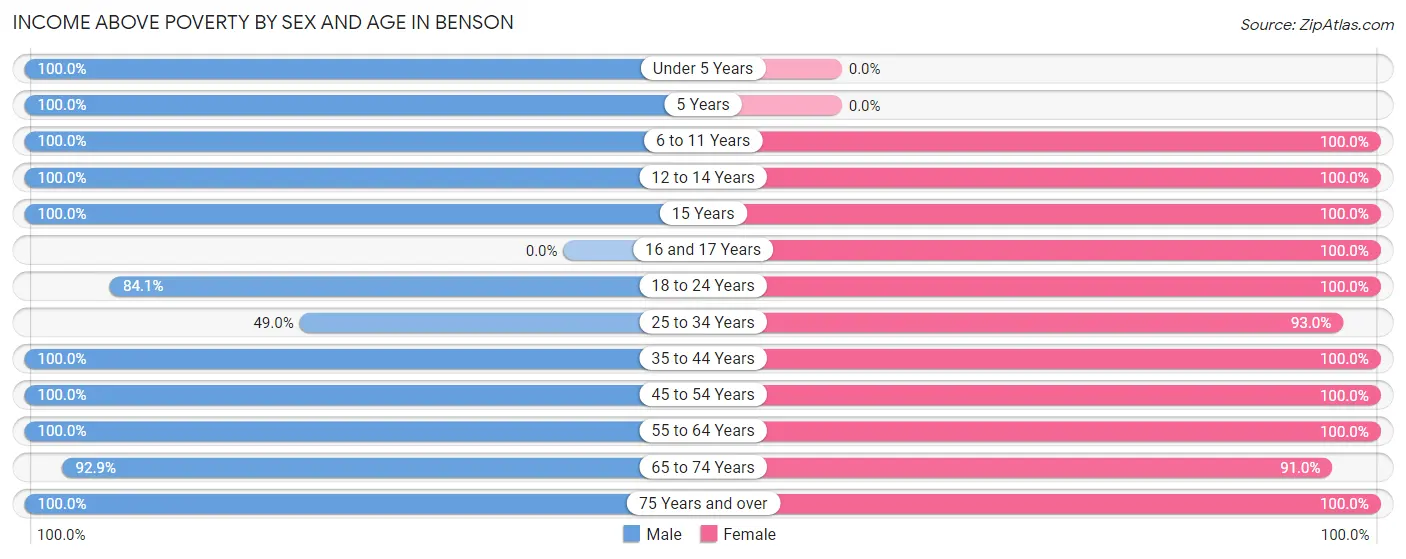
| Age Bracket | Male | Female |
| Under 5 Years | 32 (100.0%) | 0 (0.0%) |
| 5 Years | 24 (100.0%) | 0 (0.0%) |
| 6 to 11 Years | 124 (100.0%) | 228 (100.0%) |
| 12 to 14 Years | 28 (100.0%) | 39 (100.0%) |
| 15 Years | 19 (100.0%) | 66 (100.0%) |
| 16 and 17 Years | 0 (0.0%) | 12 (100.0%) |
| 18 to 24 Years | 106 (84.1%) | 16 (100.0%) |
| 25 to 34 Years | 24 (49.0%) | 147 (93.0%) |
| 35 to 44 Years | 246 (100.0%) | 166 (100.0%) |
| 45 to 54 Years | 32 (100.0%) | 9 (100.0%) |
| 55 to 64 Years | 80 (100.0%) | 123 (100.0%) |
| 65 to 74 Years | 79 (92.9%) | 61 (91.0%) |
| 75 Years and over | 28 (100.0%) | 59 (100.0%) |
| Total | 822 (94.2%) | 926 (98.2%) |
Income Below Poverty Among Married-Couple Families in Benson
The poverty statistics for married-couple families in Benson show that 1.4% or 6 of the total 428 families live below the poverty line. Families with no children have the highest poverty rate of 3.0%, comprising of 6 families. On the other hand, families with 1 or 2 children have the lowest poverty rate of 0.0%, which includes 0 families.
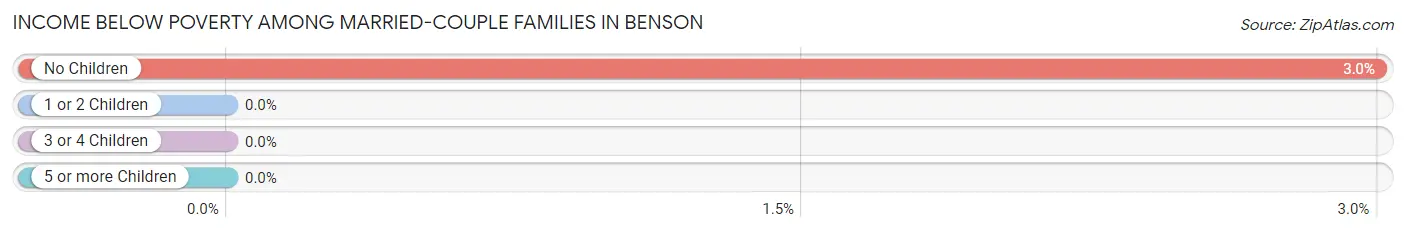
| Children | Above Poverty | Below Poverty |
| No Children | 194 (97.0%) | 6 (3.0%) |
| 1 or 2 Children | 196 (100.0%) | 0 (0.0%) |
| 3 or 4 Children | 16 (100.0%) | 0 (0.0%) |
| 5 or more Children | 16 (100.0%) | 0 (0.0%) |
| Total | 422 (98.6%) | 6 (1.4%) |
Income Below Poverty Among Single-Parent Households in Benson
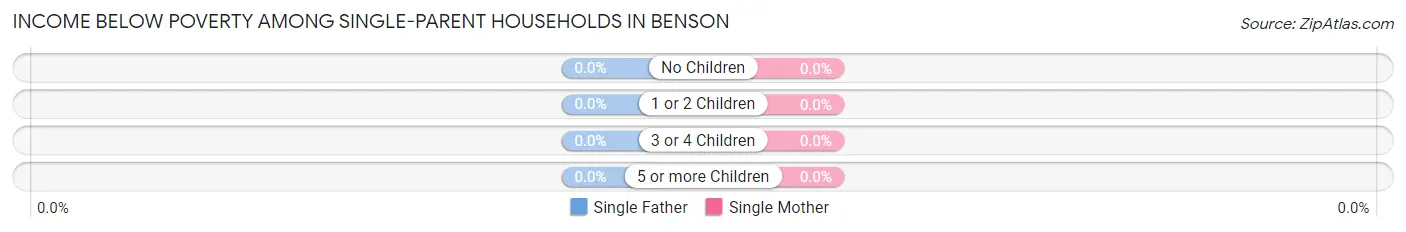
| Children | Single Father | Single Mother |
| No Children | 0 (0.0%) | 0 (0.0%) |
| 1 or 2 Children | 0 (0.0%) | 0 (0.0%) |
| 3 or 4 Children | 0 (0.0%) | 0 (0.0%) |
| 5 or more Children | 0 (0.0%) | 0 (0.0%) |
| Total | 0 (0.0%) | 0 (0.0%) |
Income Below Poverty Among Married-Couple vs Single-Parent Households in Benson
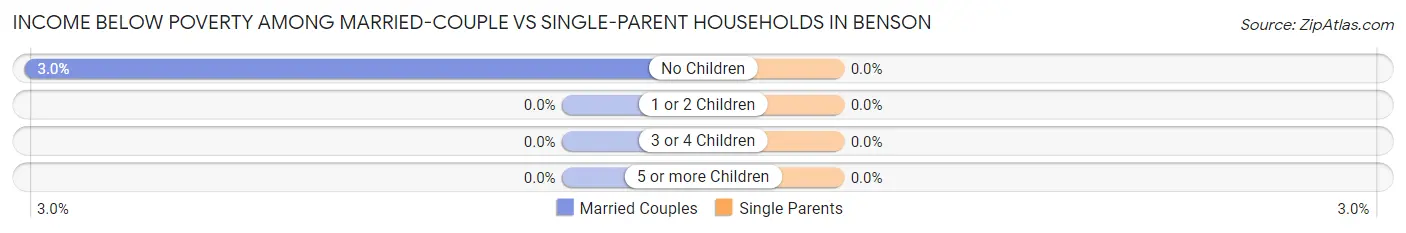
| Children | Married-Couple Families | Single-Parent Households |
| No Children | 6 (3.0%) | 0 (0.0%) |
| 1 or 2 Children | 0 (0.0%) | 0 (0.0%) |
| 3 or 4 Children | 0 (0.0%) | 0 (0.0%) |
| 5 or more Children | 0 (0.0%) | 0 (0.0%) |
| Total | 6 (1.4%) | 0 (0.0%) |
Employment Characteristics in Benson
Employment by Class of Employer in Benson
Among the 917 employed individuals in Benson, private company employees (533 | 58.1%), self-employed (incorporated) (199 | 21.7%), and state government employees (72 | 7.9%) make up the most common classes of employment.
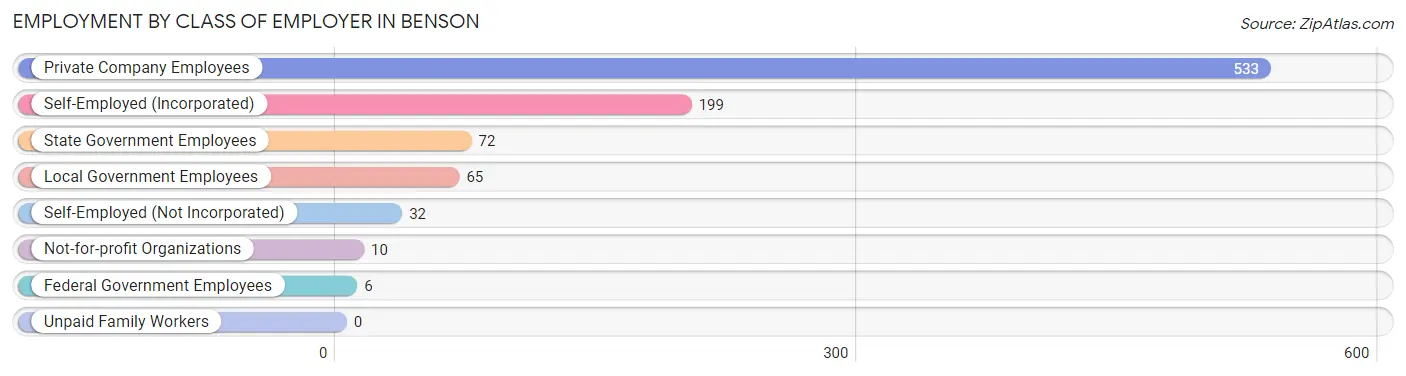
| Employer Class | # Employees | % Employees |
| Private Company Employees | 533 | 58.1% |
| Self-Employed (Incorporated) | 199 | 21.7% |
| Self-Employed (Not Incorporated) | 32 | 3.5% |
| Not-for-profit Organizations | 10 | 1.1% |
| Local Government Employees | 65 | 7.1% |
| State Government Employees | 72 | 7.9% |
| Federal Government Employees | 6 | 0.6% |
| Unpaid Family Workers | 0 | 0.0% |
| Total | 917 | 100.0% |
Employment Status by Age in Benson
According to the labor force statistics for Benson, out of the total population over 16 years of age (1,256), 82.7% or 1,039 individuals are in the labor force, with 7.5% or 78 of them unemployed. The age group with the highest labor force participation rate is 16 to 19 years, with 100.0% or 67 individuals in the labor force. Within the labor force, the 35 to 44 years age range has the highest percentage of unemployed individuals, with 21.0% or 78 of them being unemployed.
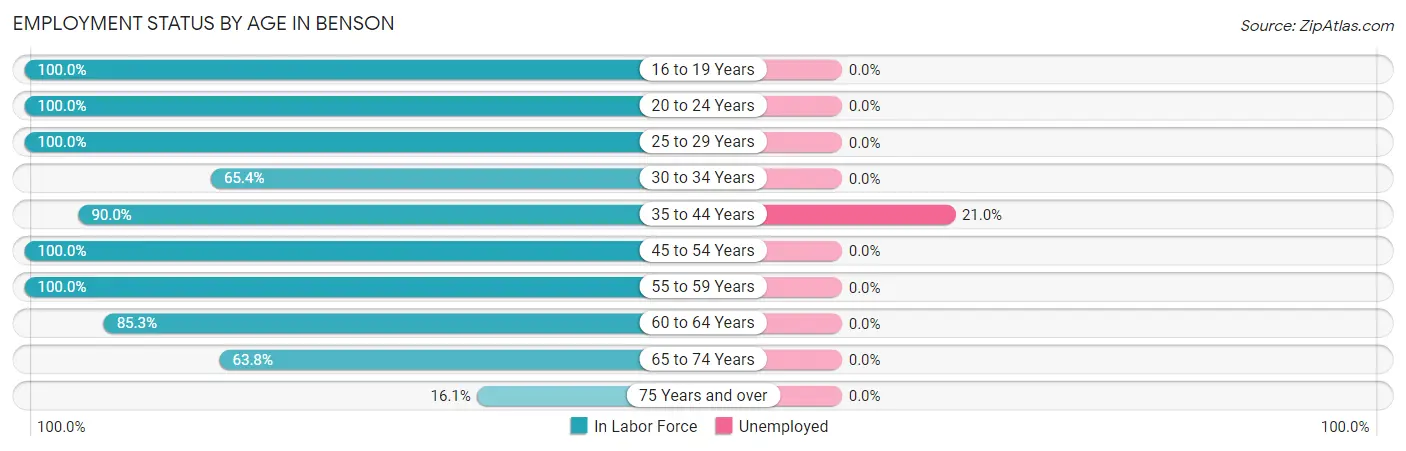
| Age Bracket | In Labor Force | Unemployed |
| 16 to 19 Years | 67 (100.0%) | 0 (0.0%) |
| 20 to 24 Years | 87 (100.0%) | 0 (0.0%) |
| 25 to 29 Years | 126 (100.0%) | 0 (0.0%) |
| 30 to 34 Years | 53 (65.4%) | 0 (0.0%) |
| 35 to 44 Years | 371 (90.0%) | 78 (21.0%) |
| 45 to 54 Years | 41 (100.0%) | 0 (0.0%) |
| 55 to 59 Years | 67 (100.0%) | 0 (0.0%) |
| 60 to 64 Years | 116 (85.3%) | 0 (0.0%) |
| 65 to 74 Years | 97 (63.8%) | 0 (0.0%) |
| 75 Years and over | 14 (16.1%) | 0 (0.0%) |
| Total | 1,039 (82.7%) | 78 (7.5%) |
Employment Status by Educational Attainment in Benson
According to labor force statistics for Benson, 89.7% of individuals (774) out of the total population between 25 and 64 years of age (863) are in the labor force, with 10.1% or 78 of them being unemployed. The group with the highest labor force participation rate are those with the educational attainment of less than high school, with 100.0% or 45 individuals in the labor force. Within the labor force, individuals with college / associate degree education have the highest percentage of unemployment, with 42.6% or 78 of them being unemployed.
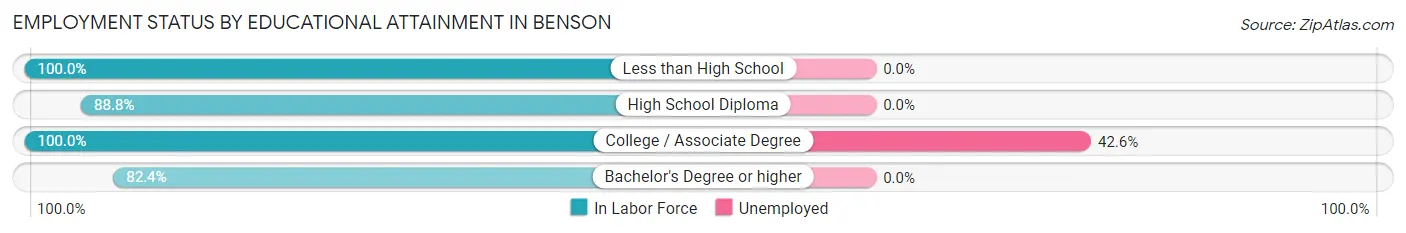
| Educational Attainment | In Labor Force | Unemployed |
| Less than High School | 45 (100.0%) | 0 (0.0%) |
| High School Diploma | 316 (88.8%) | 0 (0.0%) |
| College / Associate Degree | 183 (100.0%) | 78 (42.6%) |
| Bachelor's Degree or higher | 230 (82.4%) | 0 (0.0%) |
| Total | 774 (89.7%) | 87 (10.1%) |
Employment Occupations by Sex in Benson
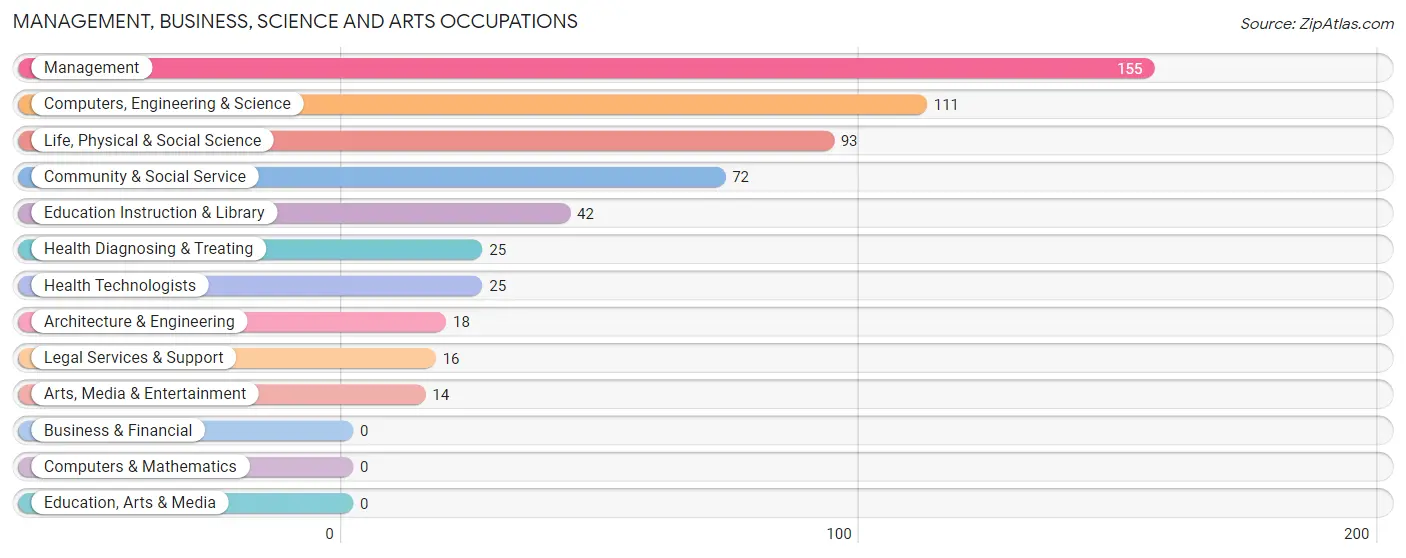
Management, Business, Science and Arts Occupations
The most common Management, Business, Science and Arts occupations in Benson are Management (155 | 16.1%), Computers, Engineering & Science (111 | 11.6%), Life, Physical & Social Science (93 | 9.7%), Community & Social Service (72 | 7.5%), and Education Instruction & Library (42 | 4.4%).
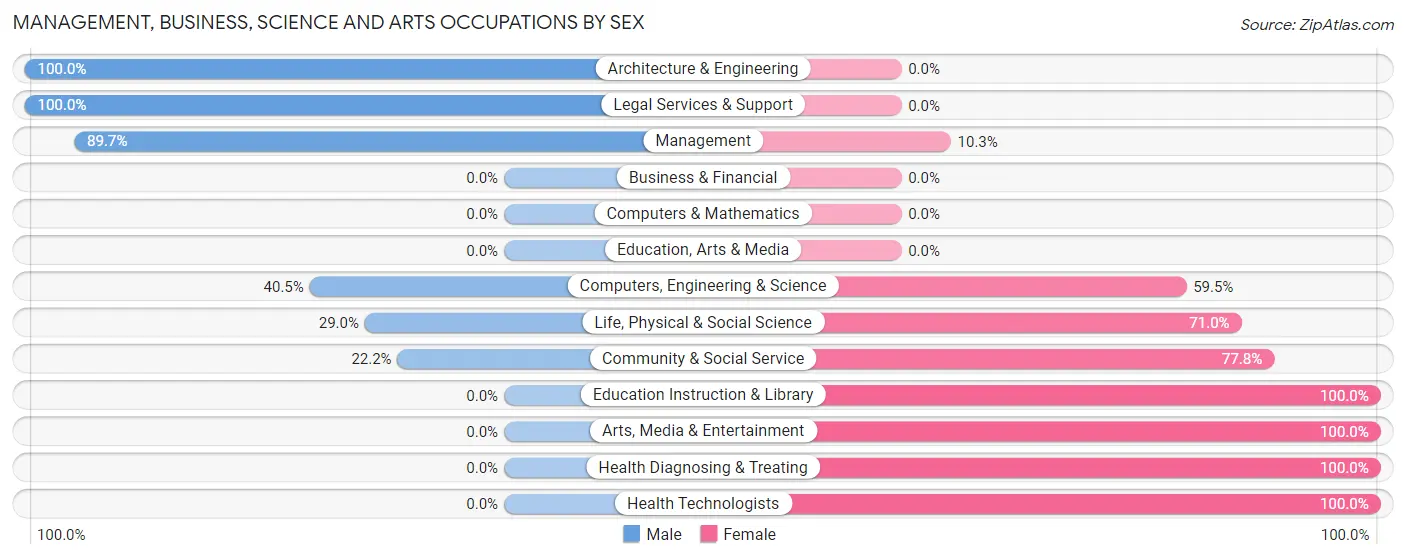
Management, Business, Science and Arts Occupations by Sex
Within the Management, Business, Science and Arts occupations in Benson, the most male-oriented occupations are Architecture & Engineering (100.0%), Legal Services & Support (100.0%), and Management (89.7%), while the most female-oriented occupations are Education Instruction & Library (100.0%), Arts, Media & Entertainment (100.0%), and Health Diagnosing & Treating (100.0%).
| Occupation | Male | Female |
| Management | 139 (89.7%) | 16 (10.3%) |
| Business & Financial | 0 (0.0%) | 0 (0.0%) |
| Computers, Engineering & Science | 45 (40.5%) | 66 (59.5%) |
| Computers & Mathematics | 0 (0.0%) | 0 (0.0%) |
| Architecture & Engineering | 18 (100.0%) | 0 (0.0%) |
| Life, Physical & Social Science | 27 (29.0%) | 66 (71.0%) |
| Community & Social Service | 16 (22.2%) | 56 (77.8%) |
| Education, Arts & Media | 0 (0.0%) | 0 (0.0%) |
| Legal Services & Support | 16 (100.0%) | 0 (0.0%) |
| Education Instruction & Library | 0 (0.0%) | 42 (100.0%) |
| Arts, Media & Entertainment | 0 (0.0%) | 14 (100.0%) |
| Health Diagnosing & Treating | 0 (0.0%) | 25 (100.0%) |
| Health Technologists | 0 (0.0%) | 25 (100.0%) |
| Total (Category) | 200 (55.1%) | 163 (44.9%) |
| Total (Overall) | 602 (62.6%) | 359 (37.4%) |
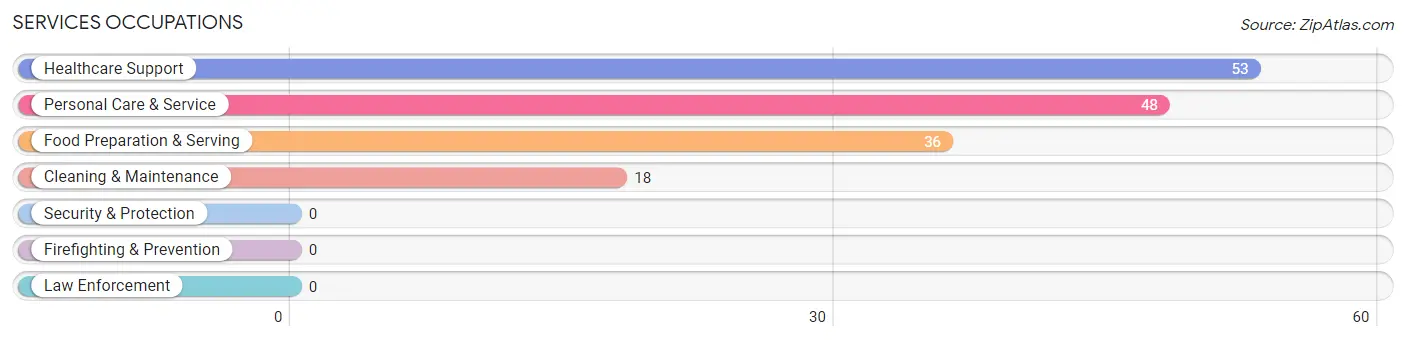
Services Occupations
The most common Services occupations in Benson are Healthcare Support (53 | 5.5%), Personal Care & Service (48 | 5.0%), Food Preparation & Serving (36 | 3.7%), and Cleaning & Maintenance (18 | 1.9%).
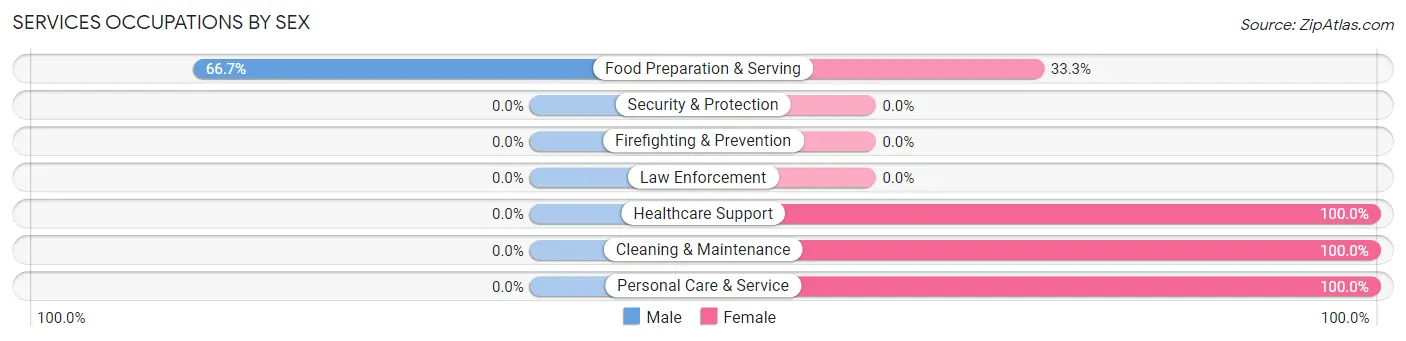
Services Occupations by Sex
| Occupation | Male | Female |
| Healthcare Support | 0 (0.0%) | 53 (100.0%) |
| Security & Protection | 0 (0.0%) | 0 (0.0%) |
| Firefighting & Prevention | 0 (0.0%) | 0 (0.0%) |
| Law Enforcement | 0 (0.0%) | 0 (0.0%) |
| Food Preparation & Serving | 24 (66.7%) | 12 (33.3%) |
| Cleaning & Maintenance | 0 (0.0%) | 18 (100.0%) |
| Personal Care & Service | 0 (0.0%) | 48 (100.0%) |
| Total (Category) | 24 (15.5%) | 131 (84.5%) |
| Total (Overall) | 602 (62.6%) | 359 (37.4%) |
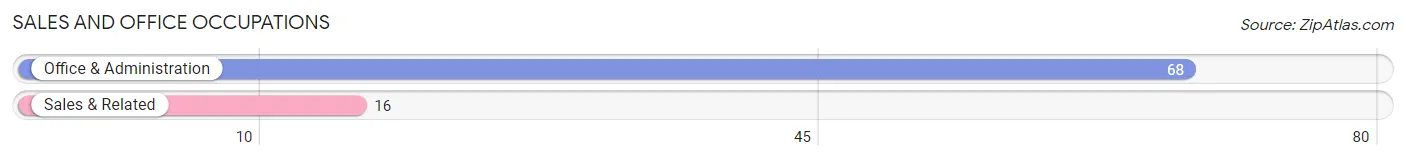
Sales and Office Occupations
The most common Sales and Office occupations in Benson are Office & Administration (68 | 7.1%), and Sales & Related (16 | 1.7%).
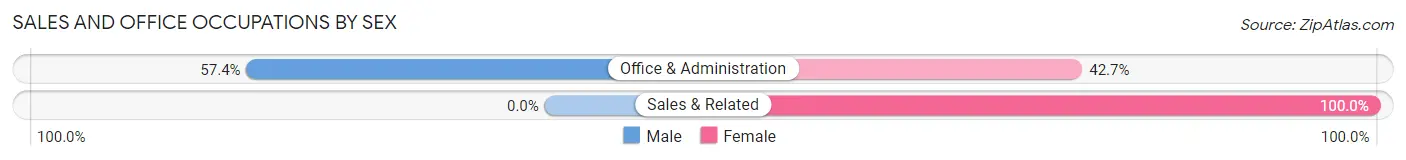
Sales and Office Occupations by Sex
| Occupation | Male | Female |
| Sales & Related | 0 (0.0%) | 16 (100.0%) |
| Office & Administration | 39 (57.4%) | 29 (42.6%) |
| Total (Category) | 39 (46.4%) | 45 (53.6%) |
| Total (Overall) | 602 (62.6%) | 359 (37.4%) |
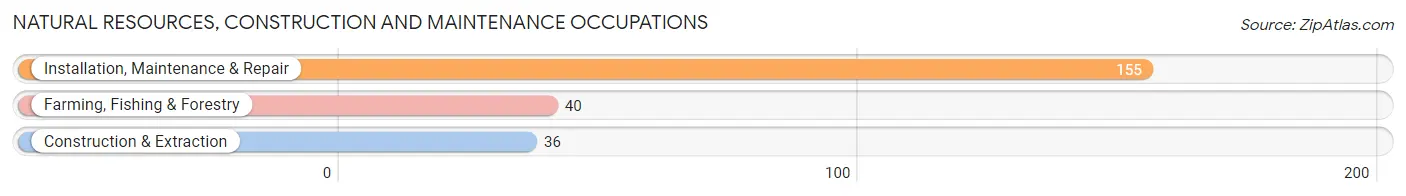
Natural Resources, Construction and Maintenance Occupations
The most common Natural Resources, Construction and Maintenance occupations in Benson are Installation, Maintenance & Repair (155 | 16.1%), Farming, Fishing & Forestry (40 | 4.2%), and Construction & Extraction (36 | 3.7%).
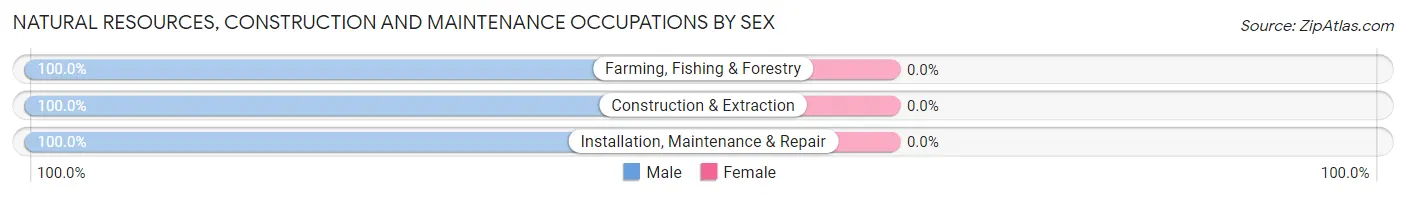
Natural Resources, Construction and Maintenance Occupations by Sex
| Occupation | Male | Female |
| Farming, Fishing & Forestry | 40 (100.0%) | 0 (0.0%) |
| Construction & Extraction | 36 (100.0%) | 0 (0.0%) |
| Installation, Maintenance & Repair | 155 (100.0%) | 0 (0.0%) |
| Total (Category) | 231 (100.0%) | 0 (0.0%) |
| Total (Overall) | 602 (62.6%) | 359 (37.4%) |
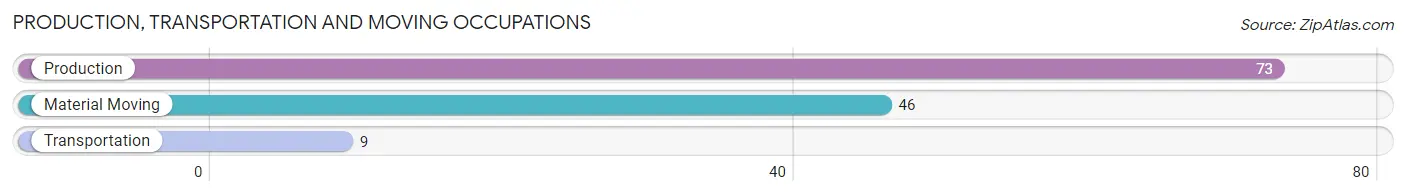
Production, Transportation and Moving Occupations
The most common Production, Transportation and Moving occupations in Benson are Production (73 | 7.6%), Material Moving (46 | 4.8%), and Transportation (9 | 0.9%).
Production, Transportation and Moving Occupations by Sex
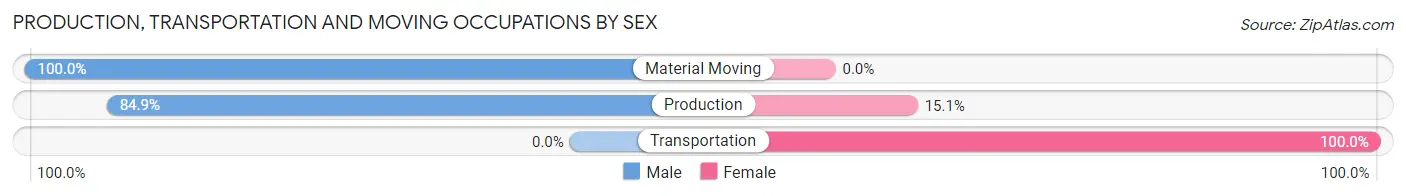
| Occupation | Male | Female |
| Production | 62 (84.9%) | 11 (15.1%) |
| Transportation | 0 (0.0%) | 9 (100.0%) |
| Material Moving | 46 (100.0%) | 0 (0.0%) |
| Total (Category) | 108 (84.4%) | 20 (15.6%) |
| Total (Overall) | 602 (62.6%) | 359 (37.4%) |
Employment Industries by Sex in Benson
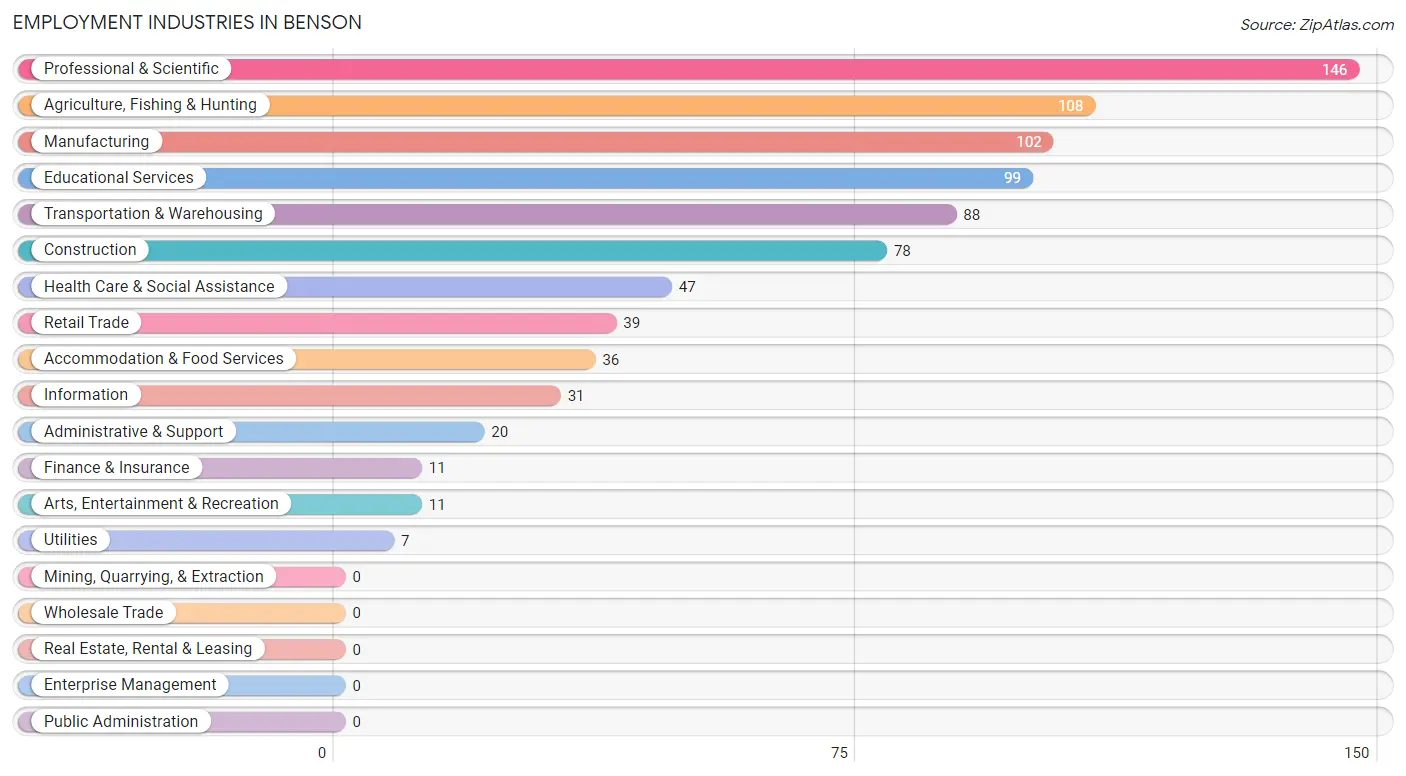
Employment Industries in Benson
The major employment industries in Benson include Professional & Scientific (146 | 15.2%), Agriculture, Fishing & Hunting (108 | 11.2%), Manufacturing (102 | 10.6%), Educational Services (99 | 10.3%), and Transportation & Warehousing (88 | 9.2%).
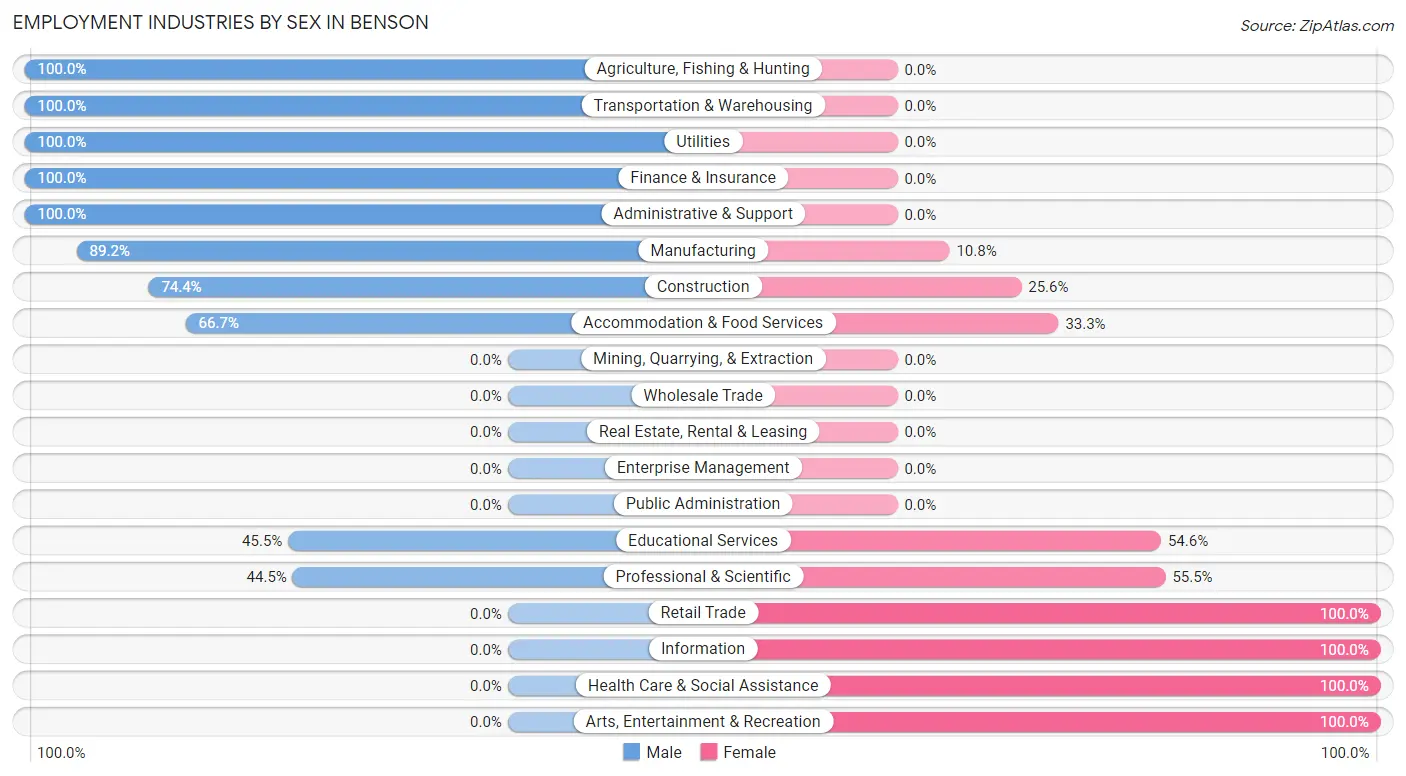
Employment Industries by Sex in Benson
The Benson industries that see more men than women are Agriculture, Fishing & Hunting (100.0%), Transportation & Warehousing (100.0%), and Utilities (100.0%), whereas the industries that tend to have a higher number of women are Retail Trade (100.0%), Information (100.0%), and Health Care & Social Assistance (100.0%).
| Industry | Male | Female |
| Agriculture, Fishing & Hunting | 108 (100.0%) | 0 (0.0%) |
| Mining, Quarrying, & Extraction | 0 (0.0%) | 0 (0.0%) |
| Construction | 58 (74.4%) | 20 (25.6%) |
| Manufacturing | 91 (89.2%) | 11 (10.8%) |
| Wholesale Trade | 0 (0.0%) | 0 (0.0%) |
| Retail Trade | 0 (0.0%) | 39 (100.0%) |
| Transportation & Warehousing | 88 (100.0%) | 0 (0.0%) |
| Utilities | 7 (100.0%) | 0 (0.0%) |
| Information | 0 (0.0%) | 31 (100.0%) |
| Finance & Insurance | 11 (100.0%) | 0 (0.0%) |
| Real Estate, Rental & Leasing | 0 (0.0%) | 0 (0.0%) |
| Professional & Scientific | 65 (44.5%) | 81 (55.5%) |
| Enterprise Management | 0 (0.0%) | 0 (0.0%) |
| Administrative & Support | 20 (100.0%) | 0 (0.0%) |
| Educational Services | 45 (45.5%) | 54 (54.5%) |
| Health Care & Social Assistance | 0 (0.0%) | 47 (100.0%) |
| Arts, Entertainment & Recreation | 0 (0.0%) | 11 (100.0%) |
| Accommodation & Food Services | 24 (66.7%) | 12 (33.3%) |
| Public Administration | 0 (0.0%) | 0 (0.0%) |
| Total | 602 (62.6%) | 359 (37.4%) |
Education in Benson
School Enrollment in Benson
The most common levels of schooling among the 605 students in Benson are elementary school (335 | 55.4%), high school (132 | 21.8%), and middle school (84 | 13.9%).
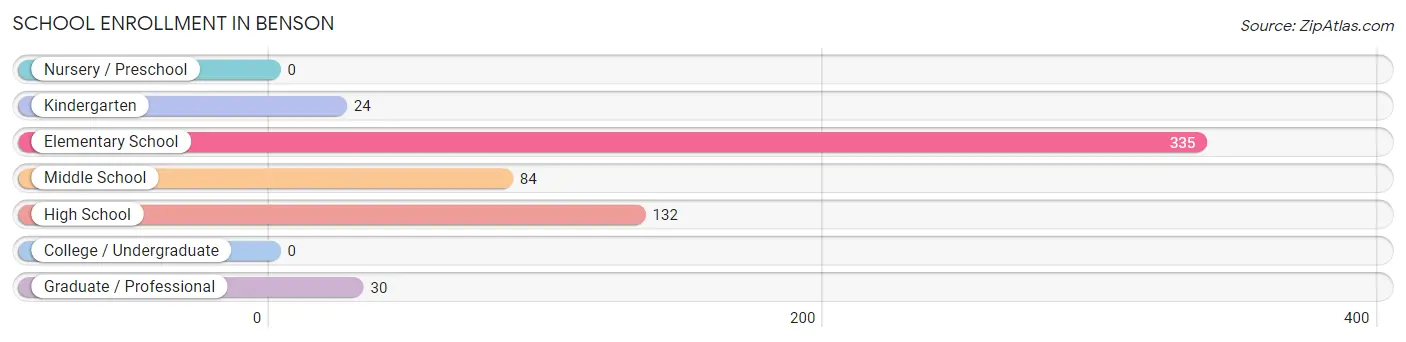
| School Level | # Students | % Students |
| Nursery / Preschool | 0 | 0.0% |
| Kindergarten | 24 | 4.0% |
| Elementary School | 335 | 55.4% |
| Middle School | 84 | 13.9% |
| High School | 132 | 21.8% |
| College / Undergraduate | 0 | 0.0% |
| Graduate / Professional | 30 | 5.0% |
| Total | 605 | 100.0% |
School Enrollment by Age by Funding Source in Benson
Out of a total of 605 students who are enrolled in schools in Benson, 81 (13.4%) attend a private institution, while the remaining 524 (86.6%) are enrolled in public schools. The age group of 20 to 24 year olds has the highest likelihood of being enrolled in private schools, with 30 (100.0% in the age bracket) enrolled. Conversely, the age group of 10 to 14 year olds has the lowest likelihood of being enrolled in a private school, with 84 (100.0% in the age bracket) attending a public institution.
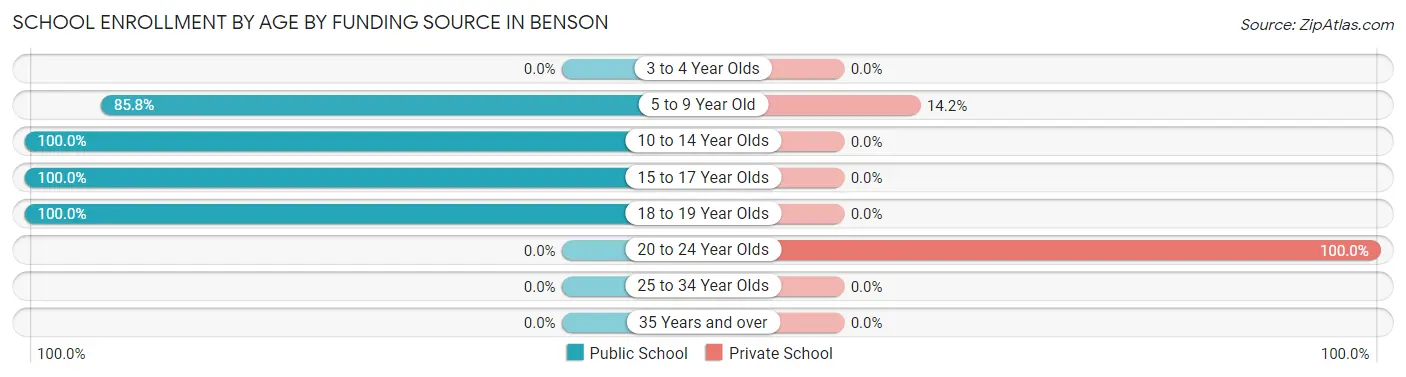
| Age Bracket | Public School | Private School |
| 3 to 4 Year Olds | 0 (0.0%) | 0 (0.0%) |
| 5 to 9 Year Old | 308 (85.8%) | 51 (14.2%) |
| 10 to 14 Year Olds | 84 (100.0%) | 0 (0.0%) |
| 15 to 17 Year Olds | 97 (100.0%) | 0 (0.0%) |
| 18 to 19 Year Olds | 35 (100.0%) | 0 (0.0%) |
| 20 to 24 Year Olds | 0 (0.0%) | 30 (100.0%) |
| 25 to 34 Year Olds | 0 (0.0%) | 0 (0.0%) |
| 35 Years and over | 0 (0.0%) | 0 (0.0%) |
| Total | 524 (86.6%) | 81 (13.4%) |
Educational Attainment by Field of Study in Benson
Bio, nature & agricultural (139 | 31.8%), education (77 | 17.6%), business (47 | 10.8%), engineering (44 | 10.1%), and communications (31 | 7.1%) are the most common fields of study among 437 individuals in Benson who have obtained a bachelor's degree or higher.
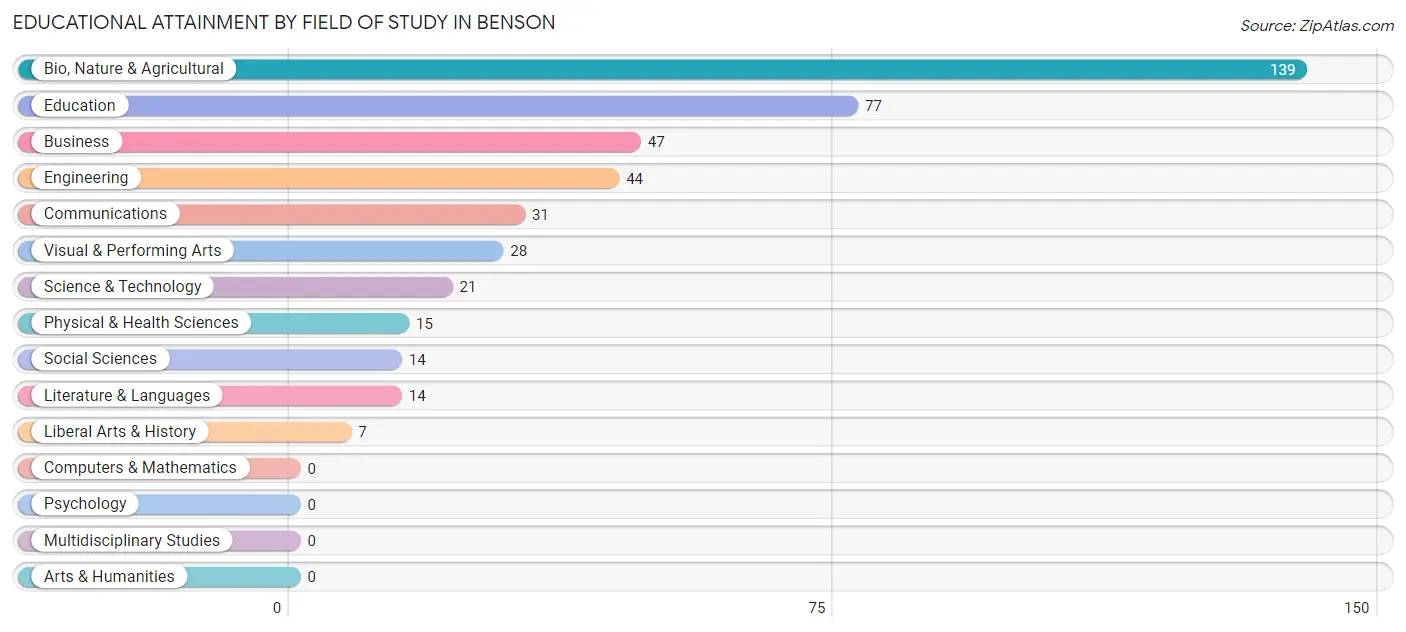
| Field of Study | # Graduates | % Graduates |
| Computers & Mathematics | 0 | 0.0% |
| Bio, Nature & Agricultural | 139 | 31.8% |
| Physical & Health Sciences | 15 | 3.4% |
| Psychology | 0 | 0.0% |
| Social Sciences | 14 | 3.2% |
| Engineering | 44 | 10.1% |
| Multidisciplinary Studies | 0 | 0.0% |
| Science & Technology | 21 | 4.8% |
| Business | 47 | 10.8% |
| Education | 77 | 17.6% |
| Literature & Languages | 14 | 3.2% |
| Liberal Arts & History | 7 | 1.6% |
| Visual & Performing Arts | 28 | 6.4% |
| Communications | 31 | 7.1% |
| Arts & Humanities | 0 | 0.0% |
| Total | 437 | 100.0% |
Transportation & Commute in Benson
Vehicle Availability by Sex in Benson
The most prevalent vehicle ownership categories in Benson are males with 3 vehicles (204, accounting for 36.6%) and females with 3 vehicles (84, making up 56.8%).
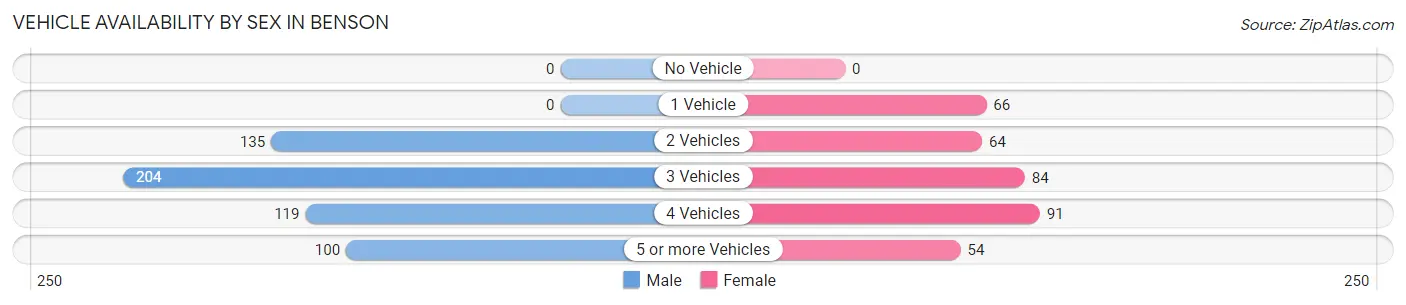
| Vehicles Available | Male | Female |
| No Vehicle | 0 (0.0%) | 0 (0.0%) |
| 1 Vehicle | 0 (0.0%) | 66 (18.4%) |
| 2 Vehicles | 135 (24.2%) | 64 (17.8%) |
| 3 Vehicles | 204 (36.6%) | 84 (23.4%) |
| 4 Vehicles | 119 (21.3%) | 91 (25.4%) |
| 5 or more Vehicles | 100 (17.9%) | 54 (15.0%) |
| Total | 558 (100.0%) | 359 (100.0%) |
Commute Time in Benson
The most frequently occuring commute durations in Benson are 5 to 9 minutes (171 commuters, 26.0%), 15 to 19 minutes (147 commuters, 22.4%), and 10 to 14 minutes (94 commuters, 14.3%).
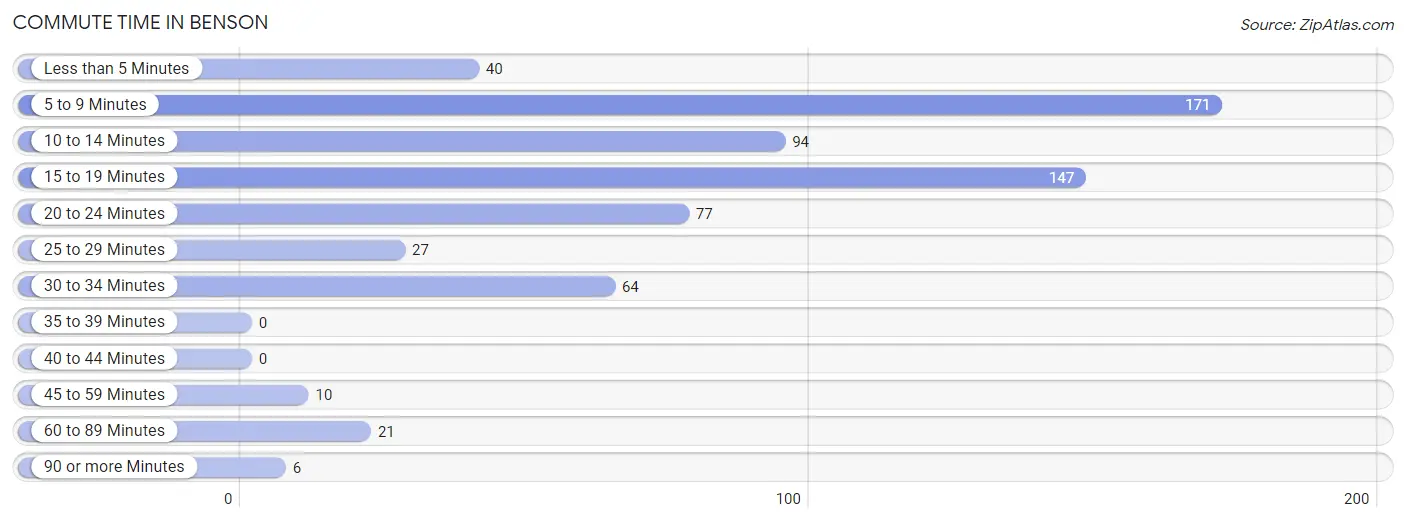
| Commute Time | # Commuters | % Commuters |
| Less than 5 Minutes | 40 | 6.1% |
| 5 to 9 Minutes | 171 | 26.0% |
| 10 to 14 Minutes | 94 | 14.3% |
| 15 to 19 Minutes | 147 | 22.4% |
| 20 to 24 Minutes | 77 | 11.7% |
| 25 to 29 Minutes | 27 | 4.1% |
| 30 to 34 Minutes | 64 | 9.7% |
| 35 to 39 Minutes | 0 | 0.0% |
| 40 to 44 Minutes | 0 | 0.0% |
| 45 to 59 Minutes | 10 | 1.5% |
| 60 to 89 Minutes | 21 | 3.2% |
| 90 or more Minutes | 6 | 0.9% |
Commute Time by Sex in Benson
The most common commute times in Benson are 5 to 9 minutes (115 commuters, 31.4%) for males and 15 to 19 minutes (147 commuters, 50.5%) for females.
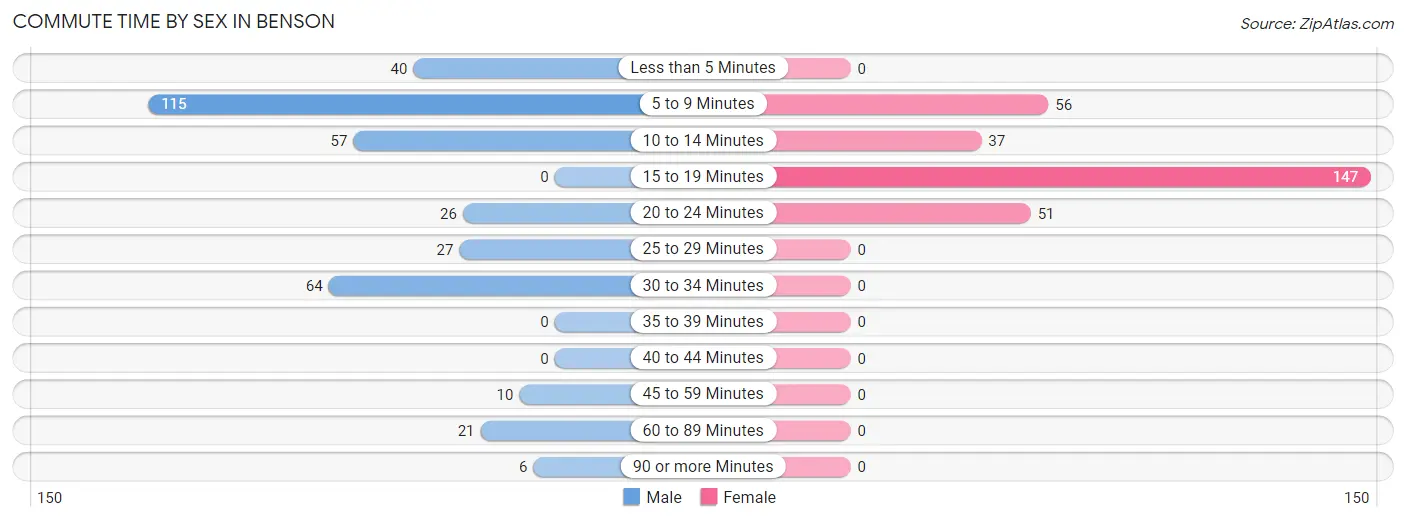
| Commute Time | Male | Female |
| Less than 5 Minutes | 40 (10.9%) | 0 (0.0%) |
| 5 to 9 Minutes | 115 (31.4%) | 56 (19.2%) |
| 10 to 14 Minutes | 57 (15.6%) | 37 (12.7%) |
| 15 to 19 Minutes | 0 (0.0%) | 147 (50.5%) |
| 20 to 24 Minutes | 26 (7.1%) | 51 (17.5%) |
| 25 to 29 Minutes | 27 (7.4%) | 0 (0.0%) |
| 30 to 34 Minutes | 64 (17.5%) | 0 (0.0%) |
| 35 to 39 Minutes | 0 (0.0%) | 0 (0.0%) |
| 40 to 44 Minutes | 0 (0.0%) | 0 (0.0%) |
| 45 to 59 Minutes | 10 (2.7%) | 0 (0.0%) |
| 60 to 89 Minutes | 21 (5.7%) | 0 (0.0%) |
| 90 or more Minutes | 6 (1.6%) | 0 (0.0%) |
Time of Departure to Work by Sex in Benson
The most frequent times of departure to work in Benson are 7:00 AM to 7:29 AM (104, 28.4%) for males and 8:00 AM to 8:29 AM (85, 29.2%) for females.
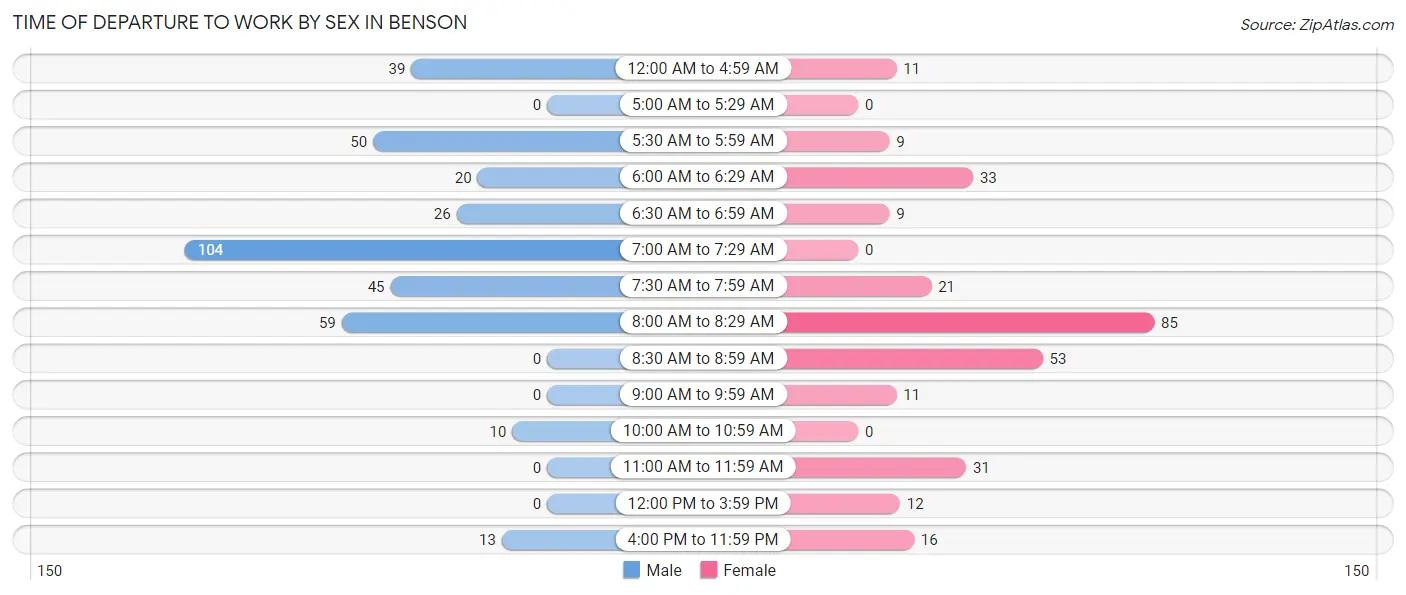
| Time of Departure | Male | Female |
| 12:00 AM to 4:59 AM | 39 (10.7%) | 11 (3.8%) |
| 5:00 AM to 5:29 AM | 0 (0.0%) | 0 (0.0%) |
| 5:30 AM to 5:59 AM | 50 (13.7%) | 9 (3.1%) |
| 6:00 AM to 6:29 AM | 20 (5.5%) | 33 (11.3%) |
| 6:30 AM to 6:59 AM | 26 (7.1%) | 9 (3.1%) |
| 7:00 AM to 7:29 AM | 104 (28.4%) | 0 (0.0%) |
| 7:30 AM to 7:59 AM | 45 (12.3%) | 21 (7.2%) |
| 8:00 AM to 8:29 AM | 59 (16.1%) | 85 (29.2%) |
| 8:30 AM to 8:59 AM | 0 (0.0%) | 53 (18.2%) |
| 9:00 AM to 9:59 AM | 0 (0.0%) | 11 (3.8%) |
| 10:00 AM to 10:59 AM | 10 (2.7%) | 0 (0.0%) |
| 11:00 AM to 11:59 AM | 0 (0.0%) | 31 (10.6%) |
| 12:00 PM to 3:59 PM | 0 (0.0%) | 12 (4.1%) |
| 4:00 PM to 11:59 PM | 13 (3.5%) | 16 (5.5%) |
| Total | 366 (100.0%) | 291 (100.0%) |
Housing Occupancy in Benson
Occupancy by Ownership in Benson
Of the total 583 dwellings in Benson, owner-occupied units account for 427 (73.2%), while renter-occupied units make up 156 (26.8%).
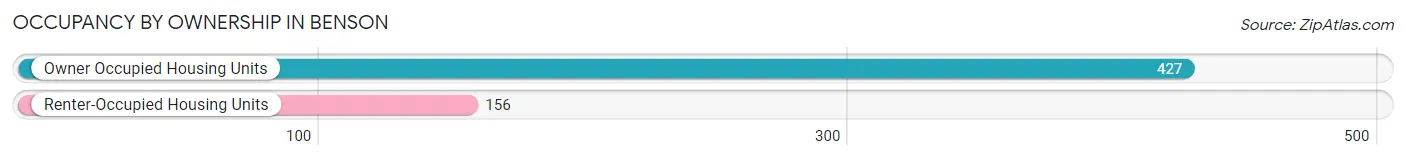
| Occupancy | # Housing Units | % Housing Units |
| Owner Occupied Housing Units | 427 | 73.2% |
| Renter-Occupied Housing Units | 156 | 26.8% |
| Total Occupied Housing Units | 583 | 100.0% |
Occupancy by Household Size in Benson
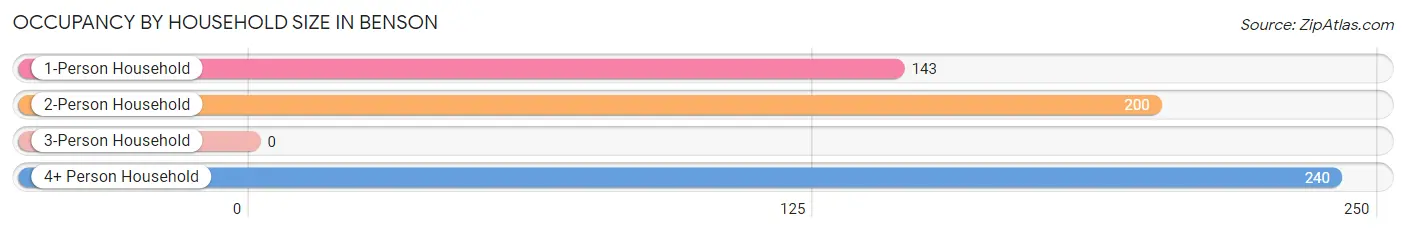
| Household Size | # Housing Units | % Housing Units |
| 1-Person Household | 143 | 24.5% |
| 2-Person Household | 200 | 34.3% |
| 3-Person Household | 0 | 0.0% |
| 4+ Person Household | 240 | 41.2% |
| Total Housing Units | 583 | 100.0% |
Occupancy by Ownership by Household Size in Benson
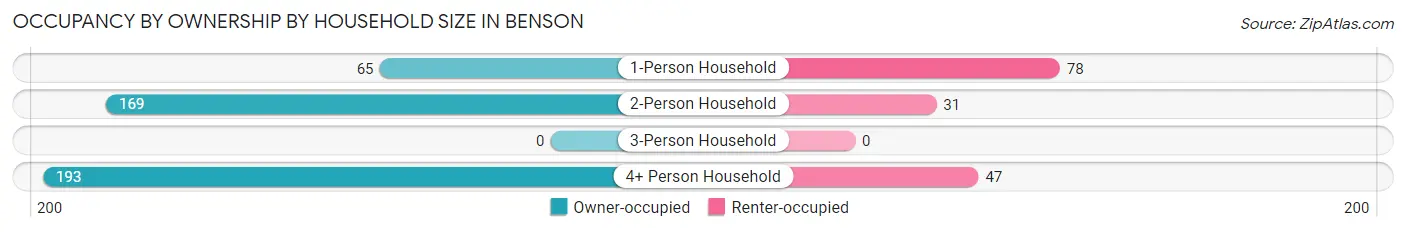
| Household Size | Owner-occupied | Renter-occupied |
| 1-Person Household | 65 (45.5%) | 78 (54.5%) |
| 2-Person Household | 169 (84.5%) | 31 (15.5%) |
| 3-Person Household | 0 (0.0%) | 0 (0.0%) |
| 4+ Person Household | 193 (80.4%) | 47 (19.6%) |
| Total Housing Units | 427 (73.2%) | 156 (26.8%) |
Occupancy by Educational Attainment in Benson
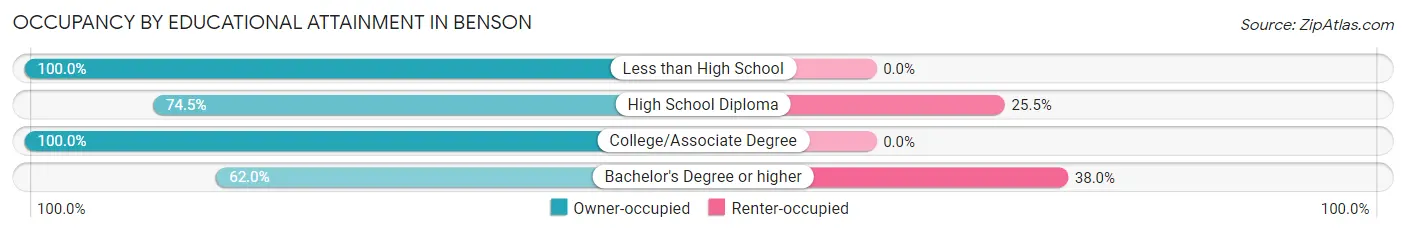
| Household Size | Owner-occupied | Renter-occupied |
| Less than High School | 4 (100.0%) | 0 (0.0%) |
| High School Diploma | 155 (74.5%) | 53 (25.5%) |
| College/Associate Degree | 100 (100.0%) | 0 (0.0%) |
| Bachelor's Degree or higher | 168 (62.0%) | 103 (38.0%) |
Occupancy by Age of Householder in Benson
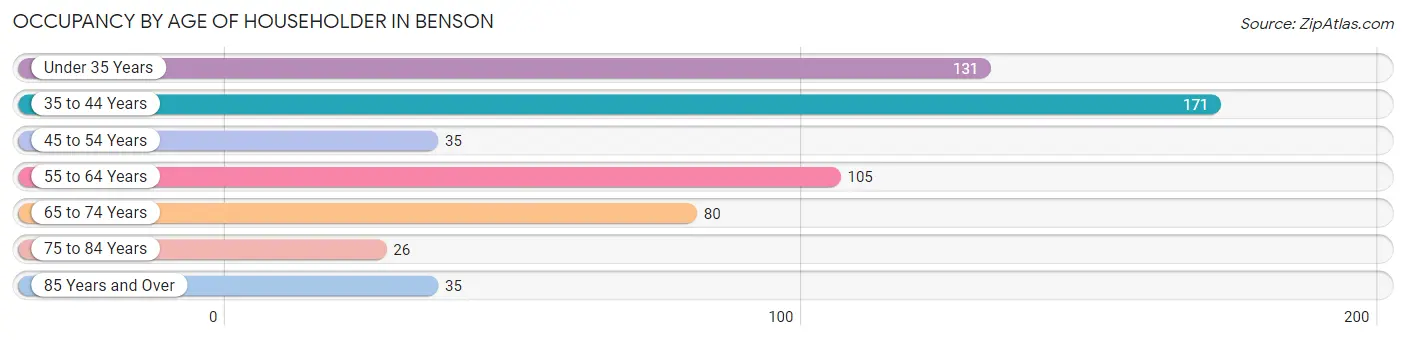
| Age Bracket | # Households | % Households |
| Under 35 Years | 131 | 22.5% |
| 35 to 44 Years | 171 | 29.3% |
| 45 to 54 Years | 35 | 6.0% |
| 55 to 64 Years | 105 | 18.0% |
| 65 to 74 Years | 80 | 13.7% |
| 75 to 84 Years | 26 | 4.5% |
| 85 Years and Over | 35 | 6.0% |
| Total | 583 | 100.0% |
Housing Finances in Benson
Median Income by Occupancy in Benson
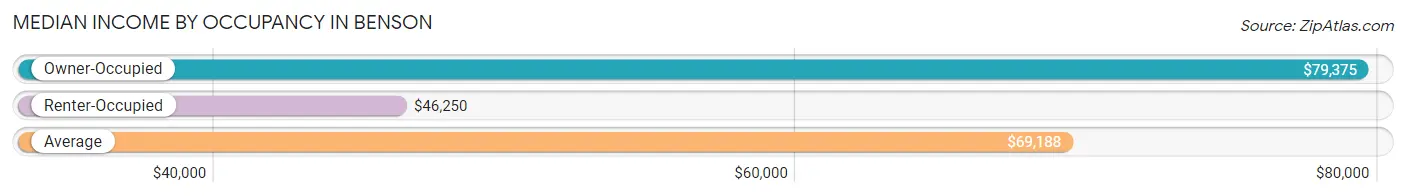
| Occupancy Type | # Households | Median Income |
| Owner-Occupied | 427 (73.2%) | $79,375 |
| Renter-Occupied | 156 (26.8%) | $46,250 |
| Average | 583 (100.0%) | $69,188 |
Occupancy by Householder Income Bracket in Benson
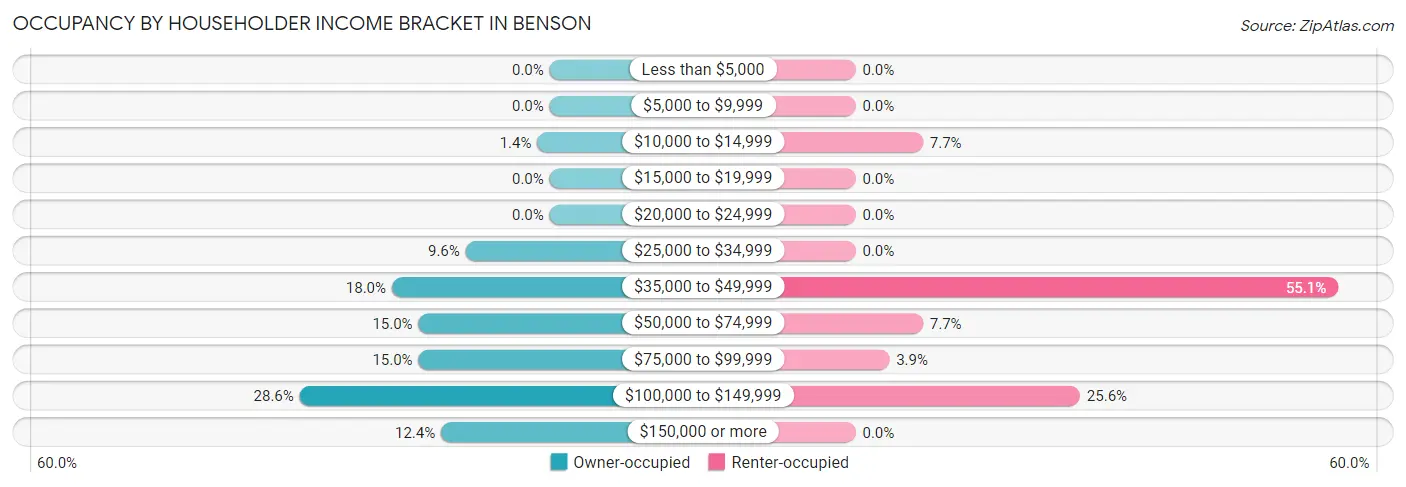
| Income Bracket | Owner-occupied | Renter-occupied |
| Less than $5,000 | 0 (0.0%) | 0 (0.0%) |
| $5,000 to $9,999 | 0 (0.0%) | 0 (0.0%) |
| $10,000 to $14,999 | 6 (1.4%) | 12 (7.7%) |
| $15,000 to $19,999 | 0 (0.0%) | 0 (0.0%) |
| $20,000 to $24,999 | 0 (0.0%) | 0 (0.0%) |
| $25,000 to $34,999 | 41 (9.6%) | 0 (0.0%) |
| $35,000 to $49,999 | 77 (18.0%) | 86 (55.1%) |
| $50,000 to $74,999 | 64 (15.0%) | 12 (7.7%) |
| $75,000 to $99,999 | 64 (15.0%) | 6 (3.8%) |
| $100,000 to $149,999 | 122 (28.6%) | 40 (25.6%) |
| $150,000 or more | 53 (12.4%) | 0 (0.0%) |
| Total | 427 (100.0%) | 156 (100.0%) |
Monthly Housing Cost Tiers in Benson
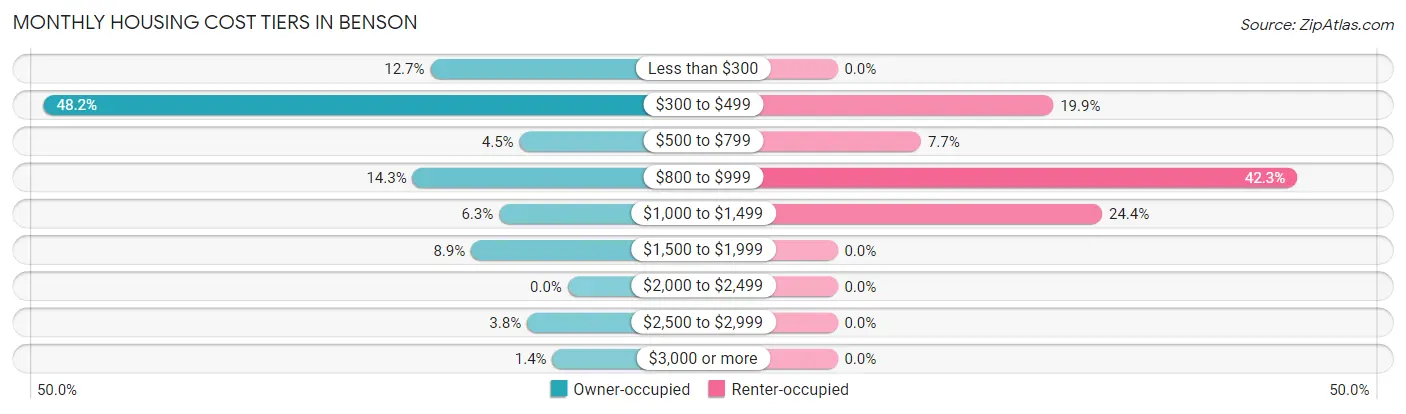
| Monthly Cost | Owner-occupied | Renter-occupied |
| Less than $300 | 54 (12.7%) | 0 (0.0%) |
| $300 to $499 | 206 (48.2%) | 31 (19.9%) |
| $500 to $799 | 19 (4.4%) | 12 (7.7%) |
| $800 to $999 | 61 (14.3%) | 66 (42.3%) |
| $1,000 to $1,499 | 27 (6.3%) | 38 (24.4%) |
| $1,500 to $1,999 | 38 (8.9%) | 0 (0.0%) |
| $2,000 to $2,499 | 0 (0.0%) | 0 (0.0%) |
| $2,500 to $2,999 | 16 (3.7%) | 0 (0.0%) |
| $3,000 or more | 6 (1.4%) | 0 (0.0%) |
| Total | 427 (100.0%) | 156 (100.0%) |
Physical Housing Characteristics in Benson
Housing Structures in Benson
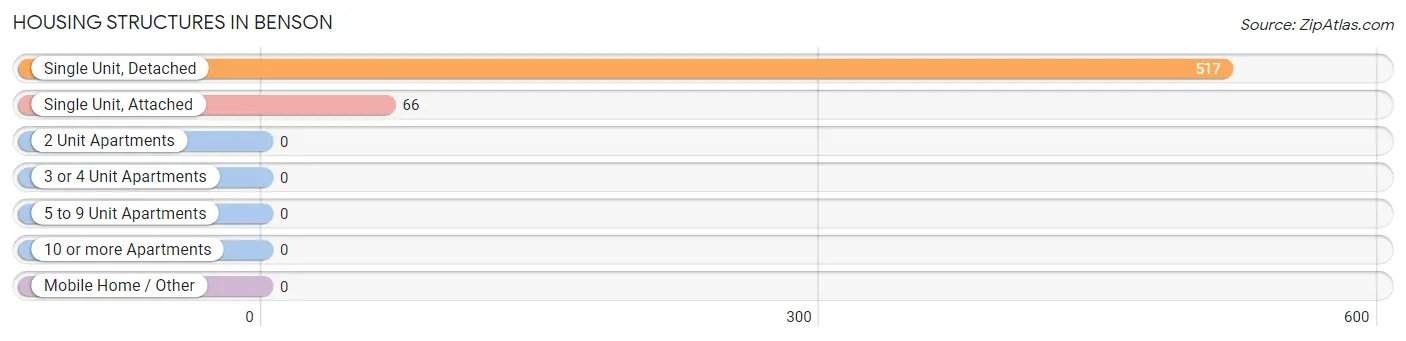
| Structure Type | # Housing Units | % Housing Units |
| Single Unit, Detached | 517 | 88.7% |
| Single Unit, Attached | 66 | 11.3% |
| 2 Unit Apartments | 0 | 0.0% |
| 3 or 4 Unit Apartments | 0 | 0.0% |
| 5 to 9 Unit Apartments | 0 | 0.0% |
| 10 or more Apartments | 0 | 0.0% |
| Mobile Home / Other | 0 | 0.0% |
| Total | 583 | 100.0% |
Housing Structures by Occupancy in Benson
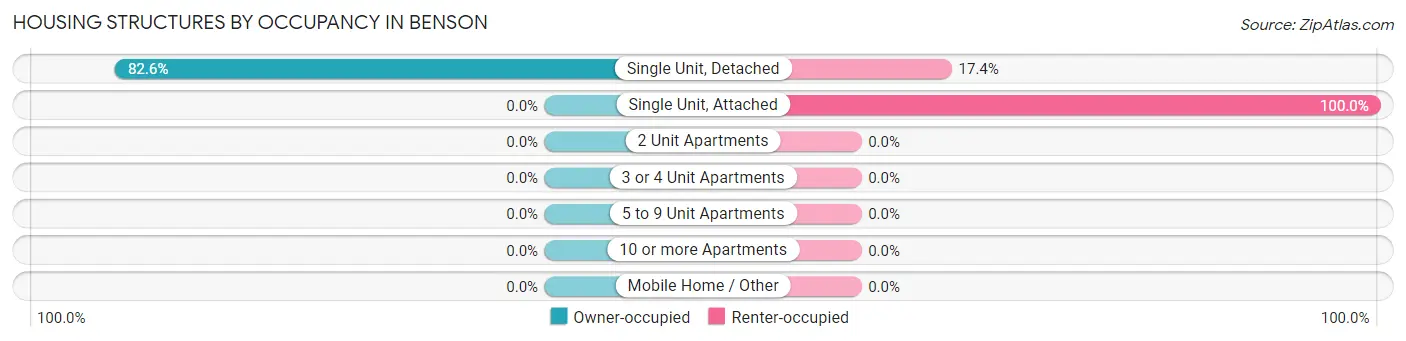
| Structure Type | Owner-occupied | Renter-occupied |
| Single Unit, Detached | 427 (82.6%) | 90 (17.4%) |
| Single Unit, Attached | 0 (0.0%) | 66 (100.0%) |
| 2 Unit Apartments | 0 (0.0%) | 0 (0.0%) |
| 3 or 4 Unit Apartments | 0 (0.0%) | 0 (0.0%) |
| 5 to 9 Unit Apartments | 0 (0.0%) | 0 (0.0%) |
| 10 or more Apartments | 0 (0.0%) | 0 (0.0%) |
| Mobile Home / Other | 0 (0.0%) | 0 (0.0%) |
| Total | 427 (73.2%) | 156 (26.8%) |
Housing Structures by Number of Rooms in Benson
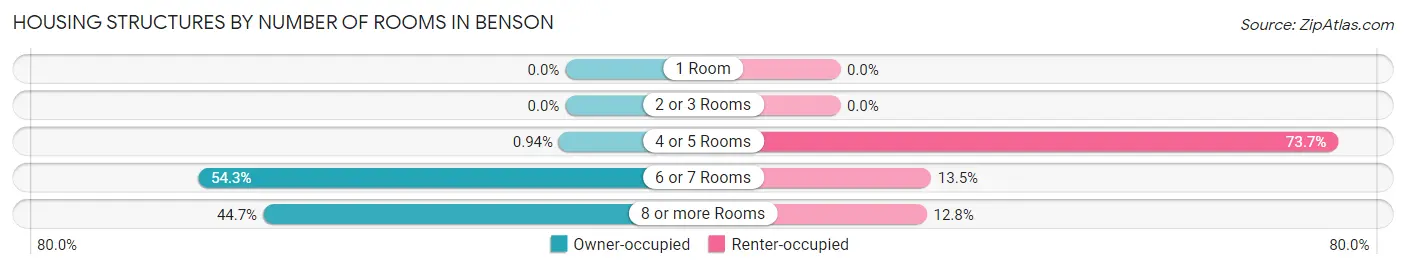
| Number of Rooms | Owner-occupied | Renter-occupied |
| 1 Room | 0 (0.0%) | 0 (0.0%) |
| 2 or 3 Rooms | 0 (0.0%) | 0 (0.0%) |
| 4 or 5 Rooms | 4 (0.9%) | 115 (73.7%) |
| 6 or 7 Rooms | 232 (54.3%) | 21 (13.5%) |
| 8 or more Rooms | 191 (44.7%) | 20 (12.8%) |
| Total | 427 (100.0%) | 156 (100.0%) |
Housing Structure by Heating Type in Benson
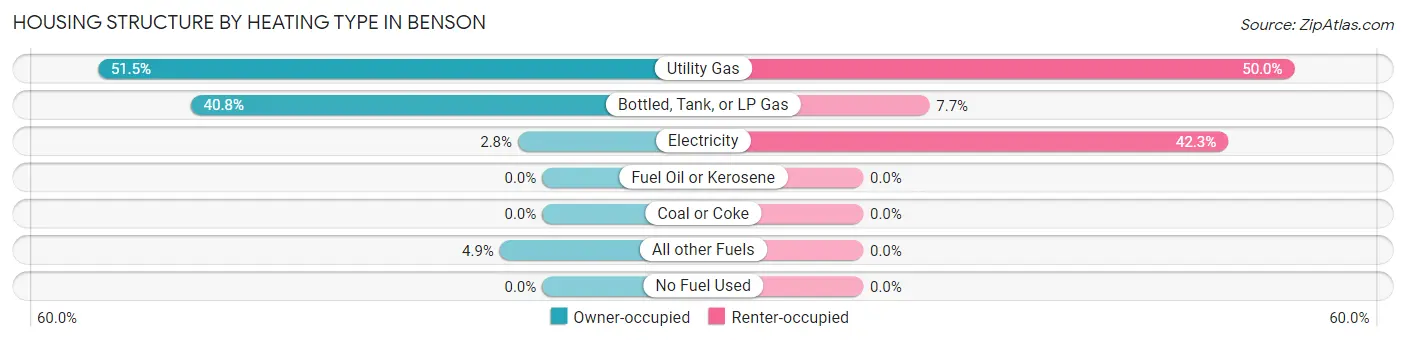
| Heating Type | Owner-occupied | Renter-occupied |
| Utility Gas | 220 (51.5%) | 78 (50.0%) |
| Bottled, Tank, or LP Gas | 174 (40.7%) | 12 (7.7%) |
| Electricity | 12 (2.8%) | 66 (42.3%) |
| Fuel Oil or Kerosene | 0 (0.0%) | 0 (0.0%) |
| Coal or Coke | 0 (0.0%) | 0 (0.0%) |
| All other Fuels | 21 (4.9%) | 0 (0.0%) |
| No Fuel Used | 0 (0.0%) | 0 (0.0%) |
| Total | 427 (100.0%) | 156 (100.0%) |
Household Vehicle Usage in Benson
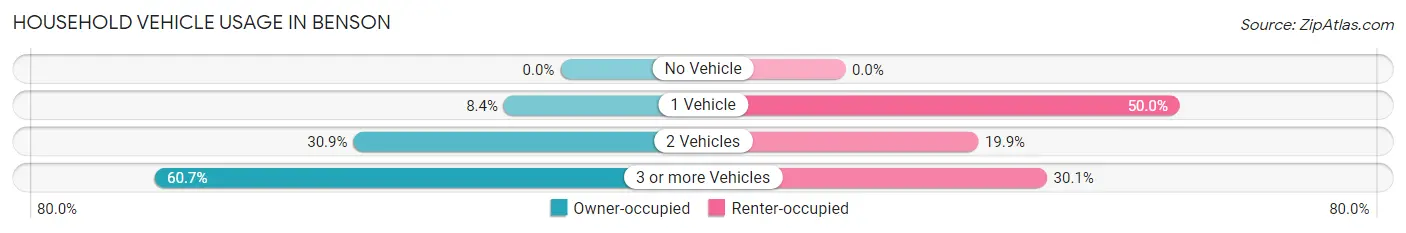
| Vehicles per Household | Owner-occupied | Renter-occupied |
| No Vehicle | 0 (0.0%) | 0 (0.0%) |
| 1 Vehicle | 36 (8.4%) | 78 (50.0%) |
| 2 Vehicles | 132 (30.9%) | 31 (19.9%) |
| 3 or more Vehicles | 259 (60.7%) | 47 (30.1%) |
| Total | 427 (100.0%) | 156 (100.0%) |
Real Estate & Mortgages in Benson
Real Estate and Mortgage Overview in Benson
| Characteristic | Without Mortgage | With Mortgage |
| Housing Units | 275 | 152 |
| Median Property Value | $247,700 | $288,300 |
| Median Household Income | $85,903 | $0 |
| Monthly Housing Costs | $385 | $6 |
| Real Estate Taxes | $1,909 | $0 |
Property Value by Mortgage Status in Benson
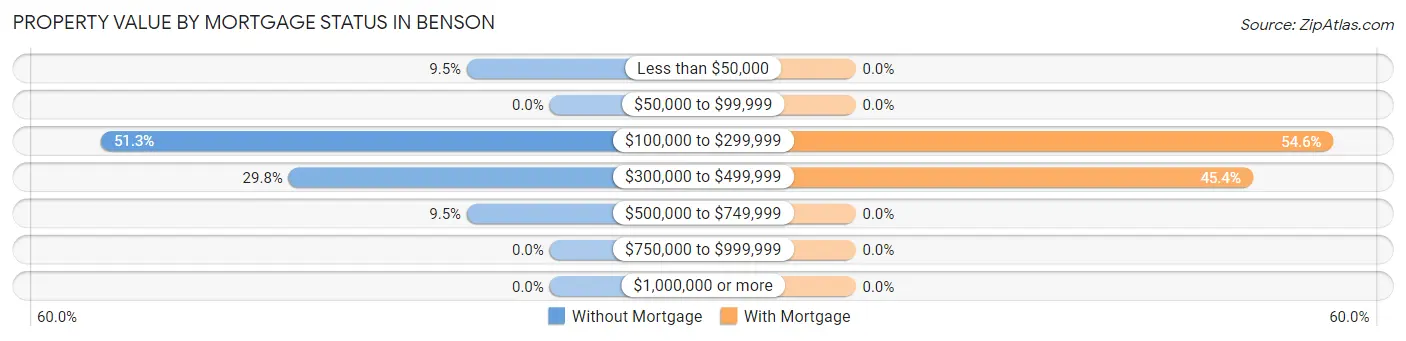
| Property Value | Without Mortgage | With Mortgage |
| Less than $50,000 | 26 (9.5%) | 0 (0.0%) |
| $50,000 to $99,999 | 0 (0.0%) | 0 (0.0%) |
| $100,000 to $299,999 | 141 (51.3%) | 83 (54.6%) |
| $300,000 to $499,999 | 82 (29.8%) | 69 (45.4%) |
| $500,000 to $749,999 | 26 (9.5%) | 0 (0.0%) |
| $750,000 to $999,999 | 0 (0.0%) | 0 (0.0%) |
| $1,000,000 or more | 0 (0.0%) | 0 (0.0%) |
| Total | 275 (100.0%) | 152 (100.0%) |
Household Income by Mortgage Status in Benson
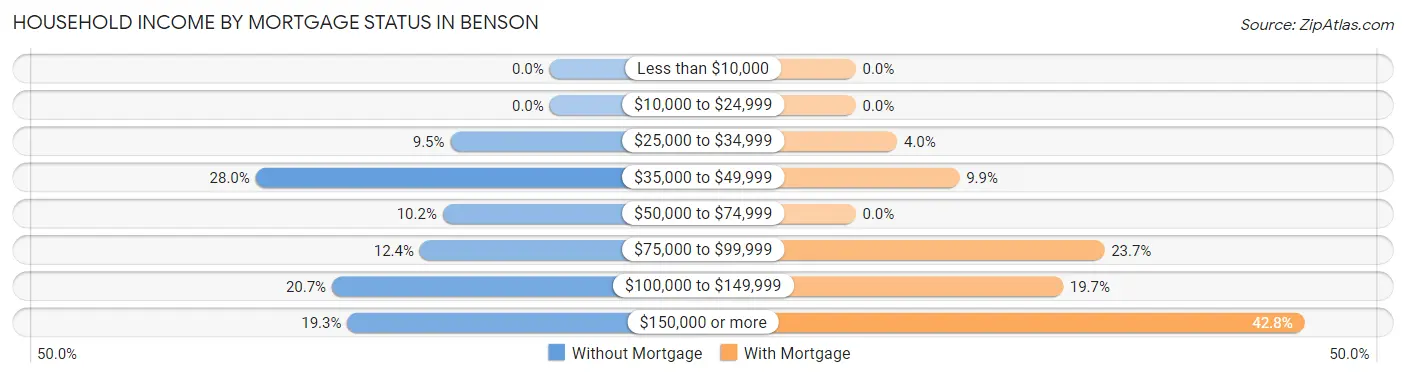
| Household Income | Without Mortgage | With Mortgage |
| Less than $10,000 | 0 (0.0%) | 0 (0.0%) |
| $10,000 to $24,999 | 0 (0.0%) | 0 (0.0%) |
| $25,000 to $34,999 | 26 (9.5%) | 6 (4.0%) |
| $35,000 to $49,999 | 77 (28.0%) | 15 (9.9%) |
| $50,000 to $74,999 | 28 (10.2%) | 0 (0.0%) |
| $75,000 to $99,999 | 34 (12.4%) | 36 (23.7%) |
| $100,000 to $149,999 | 57 (20.7%) | 30 (19.7%) |
| $150,000 or more | 53 (19.3%) | 65 (42.8%) |
| Total | 275 (100.0%) | 152 (100.0%) |
Property Value to Household Income Ratio in Benson
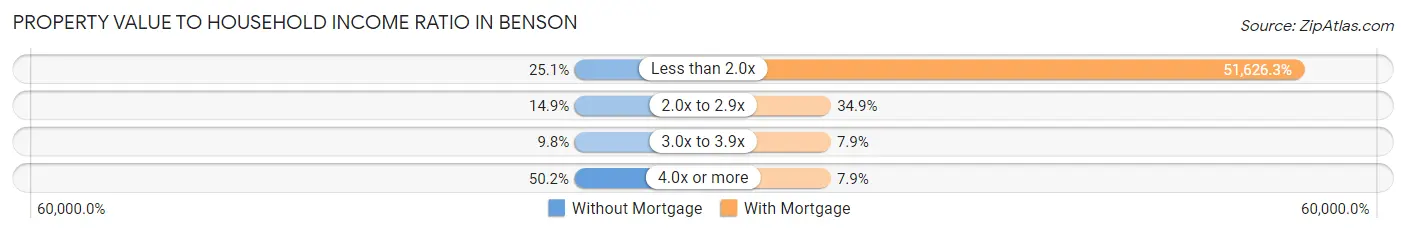
| Value-to-Income Ratio | Without Mortgage | With Mortgage |
| Less than 2.0x | 69 (25.1%) | 78,472 (51,626.3%) |
| 2.0x to 2.9x | 41 (14.9%) | 53 (34.9%) |
| 3.0x to 3.9x | 27 (9.8%) | 12 (7.9%) |
| 4.0x or more | 138 (50.2%) | 12 (7.9%) |
| Total | 275 (100.0%) | 152 (100.0%) |
Real Estate Taxes by Mortgage Status in Benson
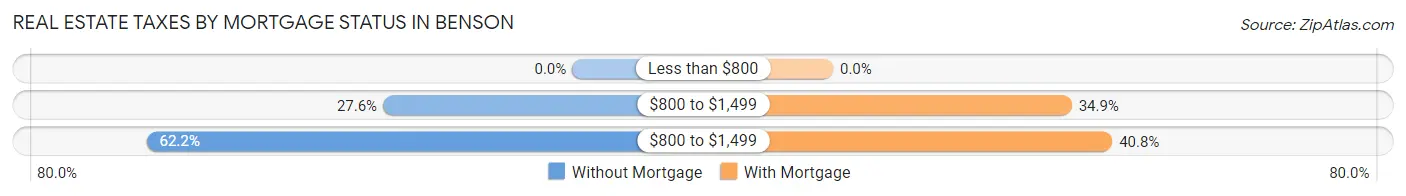
| Property Taxes | Without Mortgage | With Mortgage |
| Less than $800 | 0 (0.0%) | 0 (0.0%) |
| $800 to $1,499 | 76 (27.6%) | 53 (34.9%) |
| $800 to $1,499 | 171 (62.2%) | 62 (40.8%) |
| Total | 275 (100.0%) | 152 (100.0%) |
Health & Disability in Benson
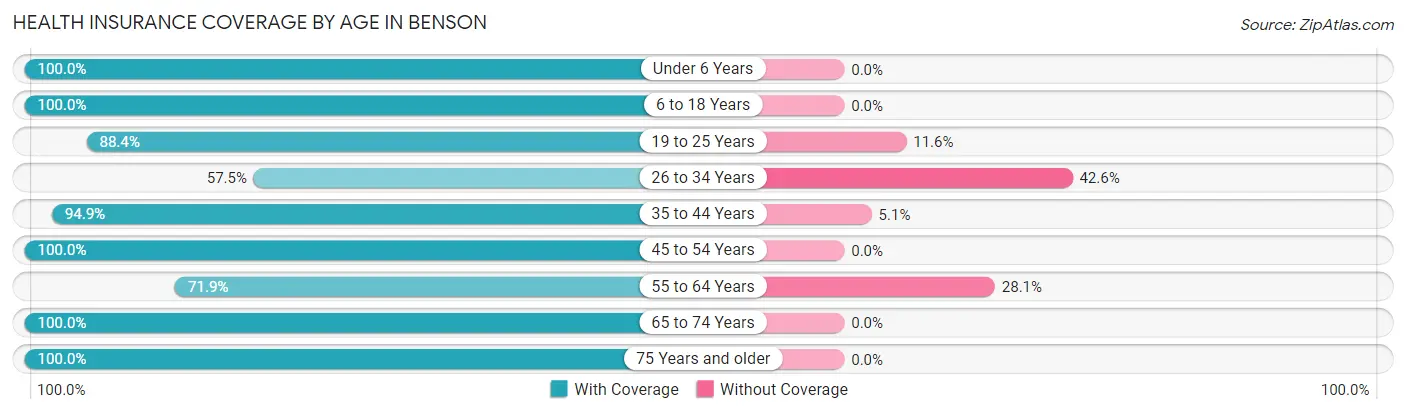
Health Insurance Coverage by Age in Benson
| Age Bracket | With Coverage | Without Coverage |
| Under 6 Years | 56 (100.0%) | 0 (0.0%) |
| 6 to 18 Years | 551 (100.0%) | 0 (0.0%) |
| 19 to 25 Years | 153 (88.4%) | 20 (11.6%) |
| 26 to 34 Years | 81 (57.5%) | 60 (42.5%) |
| 35 to 44 Years | 391 (94.9%) | 21 (5.1%) |
| 45 to 54 Years | 41 (100.0%) | 0 (0.0%) |
| 55 to 64 Years | 146 (71.9%) | 57 (28.1%) |
| 65 to 74 Years | 152 (100.0%) | 0 (0.0%) |
| 75 Years and older | 87 (100.0%) | 0 (0.0%) |
| Total | 1,658 (91.3%) | 158 (8.7%) |
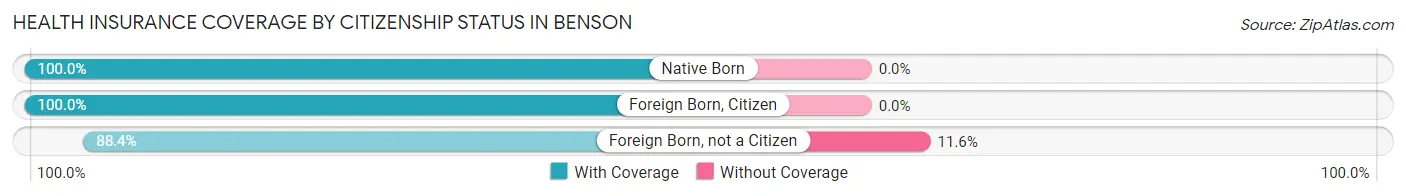
Health Insurance Coverage by Citizenship Status in Benson
| Citizenship Status | With Coverage | Without Coverage |
| Native Born | 56 (100.0%) | 0 (0.0%) |
| Foreign Born, Citizen | 551 (100.0%) | 0 (0.0%) |
| Foreign Born, not a Citizen | 153 (88.4%) | 20 (11.6%) |
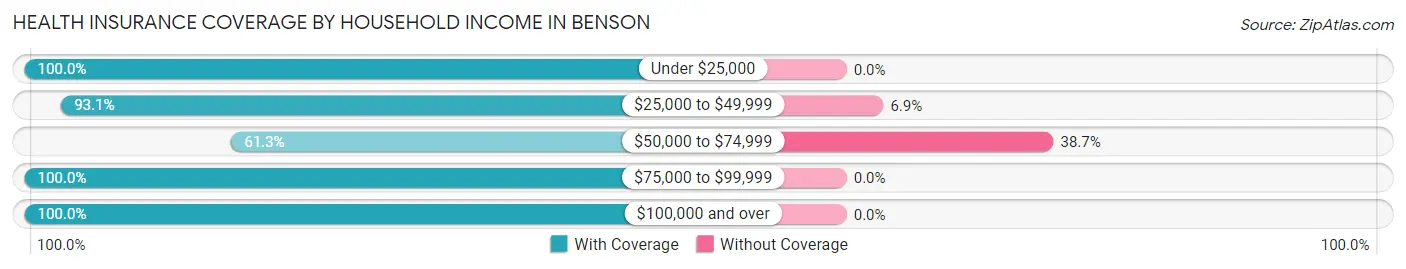
Health Insurance Coverage by Household Income in Benson
| Household Income | With Coverage | Without Coverage |
| Under $25,000 | 24 (100.0%) | 0 (0.0%) |
| $25,000 to $49,999 | 488 (93.1%) | 36 (6.9%) |
| $50,000 to $74,999 | 193 (61.3%) | 122 (38.7%) |
| $75,000 to $99,999 | 232 (100.0%) | 0 (0.0%) |
| $100,000 and over | 721 (100.0%) | 0 (0.0%) |
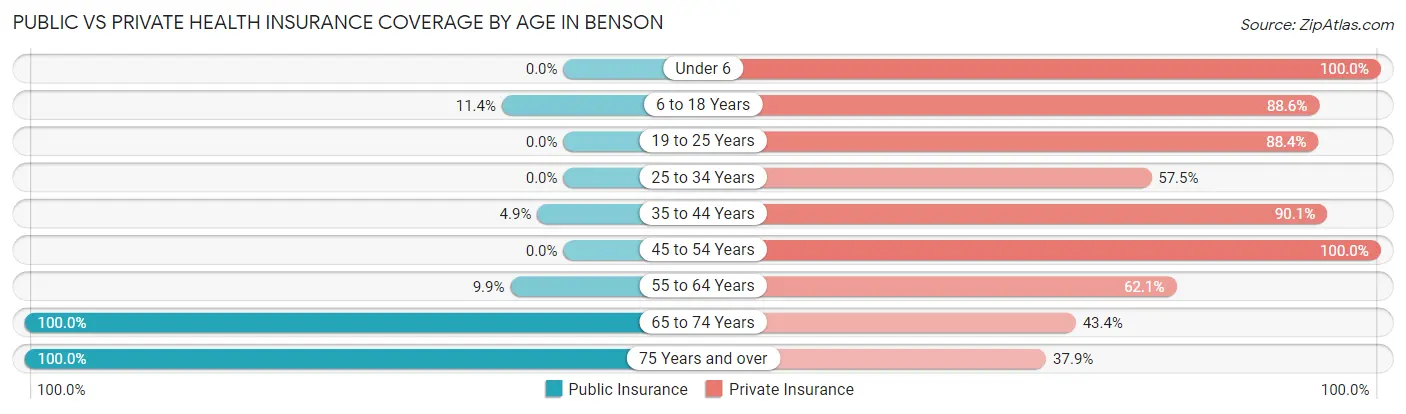
Public vs Private Health Insurance Coverage by Age in Benson
| Age Bracket | Public Insurance | Private Insurance |
| Under 6 | 0 (0.0%) | 56 (100.0%) |
| 6 to 18 Years | 63 (11.4%) | 488 (88.6%) |
| 19 to 25 Years | 0 (0.0%) | 153 (88.4%) |
| 25 to 34 Years | 0 (0.0%) | 81 (57.5%) |
| 35 to 44 Years | 20 (4.9%) | 371 (90.0%) |
| 45 to 54 Years | 0 (0.0%) | 41 (100.0%) |
| 55 to 64 Years | 20 (9.9%) | 126 (62.1%) |
| 65 to 74 Years | 152 (100.0%) | 66 (43.4%) |
| 75 Years and over | 87 (100.0%) | 33 (37.9%) |
| Total | 342 (18.8%) | 1,415 (77.9%) |
Disability Status by Sex by Age in Benson
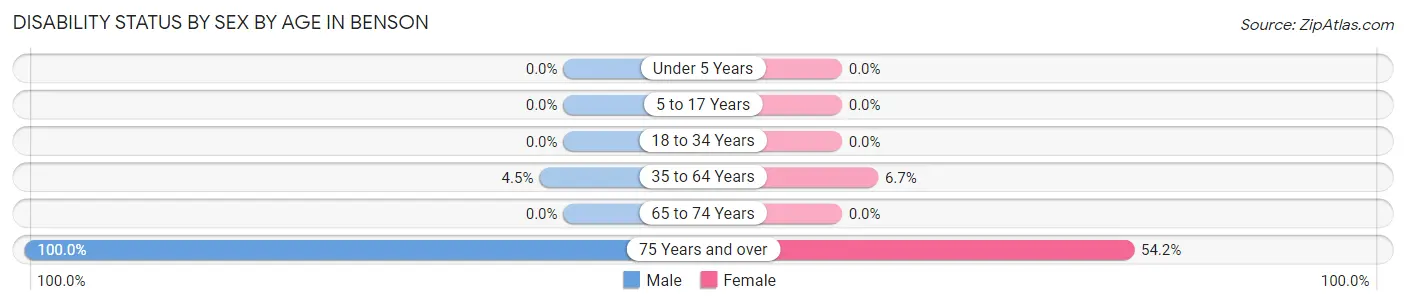
| Age Bracket | Male | Female |
| Under 5 Years | 0 (0.0%) | 0 (0.0%) |
| 5 to 17 Years | 0 (0.0%) | 0 (0.0%) |
| 18 to 34 Years | 0 (0.0%) | 0 (0.0%) |
| 35 to 64 Years | 16 (4.5%) | 20 (6.7%) |
| 65 to 74 Years | 0 (0.0%) | 0 (0.0%) |
| 75 Years and over | 28 (100.0%) | 32 (54.2%) |
Disability Class by Sex by Age in Benson
Disability Class: Hearing Difficulty
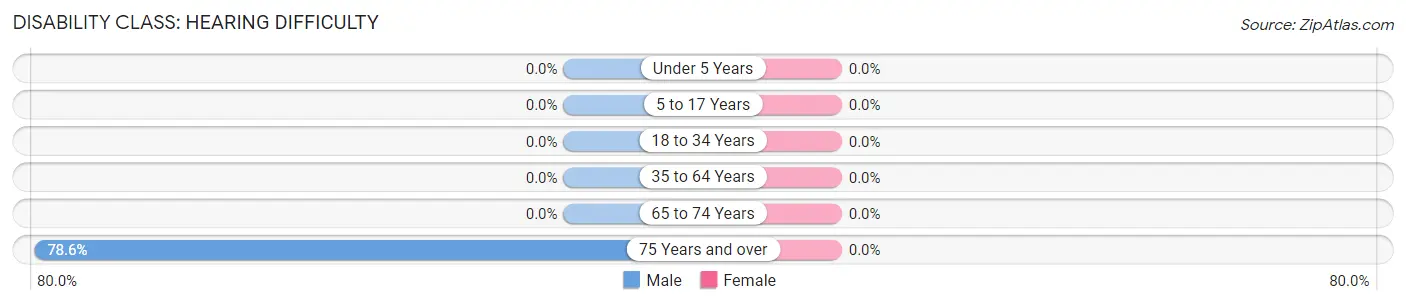
| Age Bracket | Male | Female |
| Under 5 Years | 0 (0.0%) | 0 (0.0%) |
| 5 to 17 Years | 0 (0.0%) | 0 (0.0%) |
| 18 to 34 Years | 0 (0.0%) | 0 (0.0%) |
| 35 to 64 Years | 0 (0.0%) | 0 (0.0%) |
| 65 to 74 Years | 0 (0.0%) | 0 (0.0%) |
| 75 Years and over | 22 (78.6%) | 0 (0.0%) |
Disability Class: Vision Difficulty
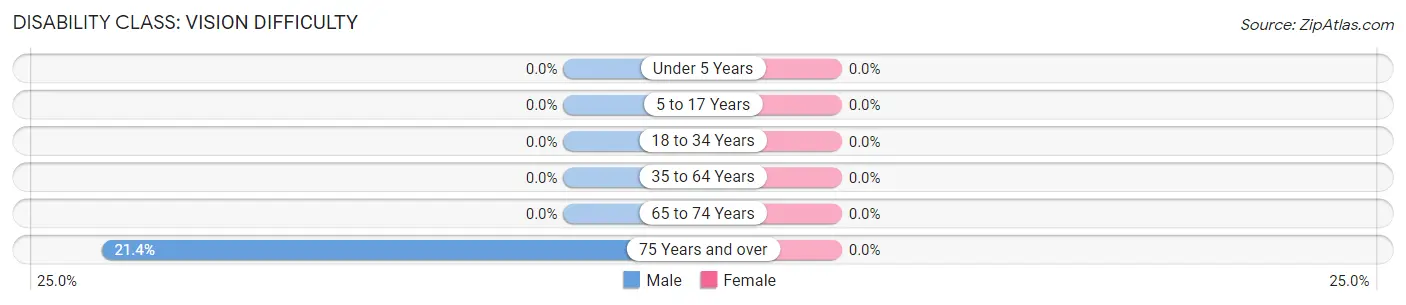
| Age Bracket | Male | Female |
| Under 5 Years | 0 (0.0%) | 0 (0.0%) |
| 5 to 17 Years | 0 (0.0%) | 0 (0.0%) |
| 18 to 34 Years | 0 (0.0%) | 0 (0.0%) |
| 35 to 64 Years | 0 (0.0%) | 0 (0.0%) |
| 65 to 74 Years | 0 (0.0%) | 0 (0.0%) |
| 75 Years and over | 6 (21.4%) | 0 (0.0%) |
Disability Class: Cognitive Difficulty
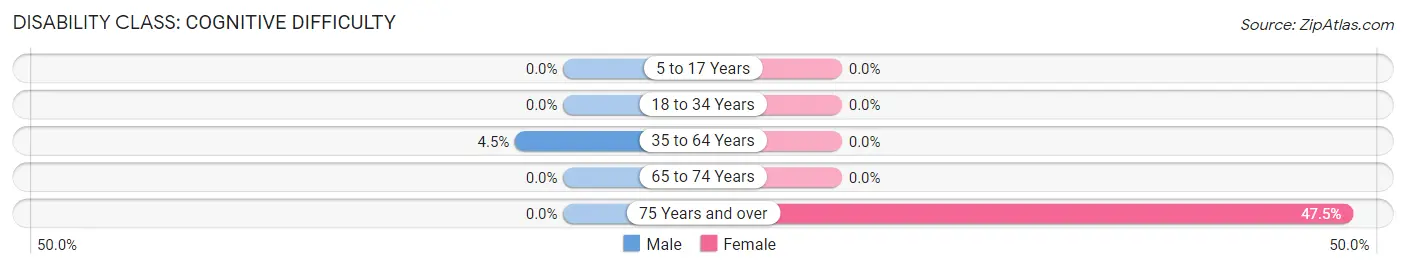
| Age Bracket | Male | Female |
| 5 to 17 Years | 0 (0.0%) | 0 (0.0%) |
| 18 to 34 Years | 0 (0.0%) | 0 (0.0%) |
| 35 to 64 Years | 16 (4.5%) | 0 (0.0%) |
| 65 to 74 Years | 0 (0.0%) | 0 (0.0%) |
| 75 Years and over | 0 (0.0%) | 28 (47.5%) |
Disability Class: Ambulatory Difficulty
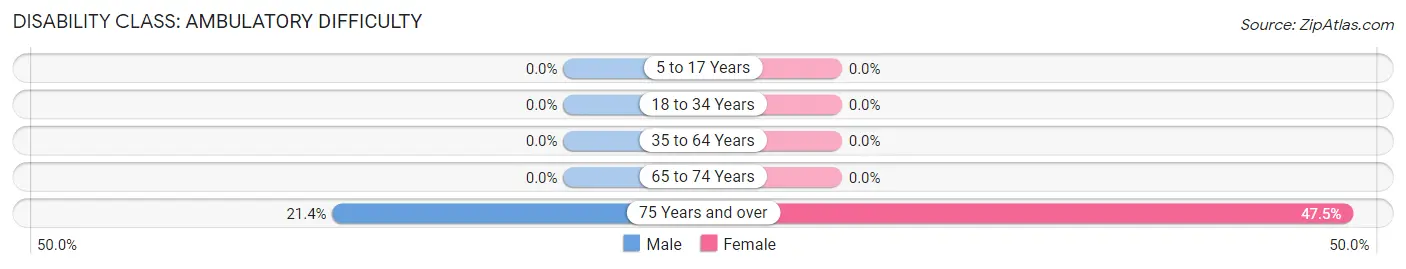
| Age Bracket | Male | Female |
| 5 to 17 Years | 0 (0.0%) | 0 (0.0%) |
| 18 to 34 Years | 0 (0.0%) | 0 (0.0%) |
| 35 to 64 Years | 0 (0.0%) | 0 (0.0%) |
| 65 to 74 Years | 0 (0.0%) | 0 (0.0%) |
| 75 Years and over | 6 (21.4%) | 28 (47.5%) |
Disability Class: Self-Care Difficulty
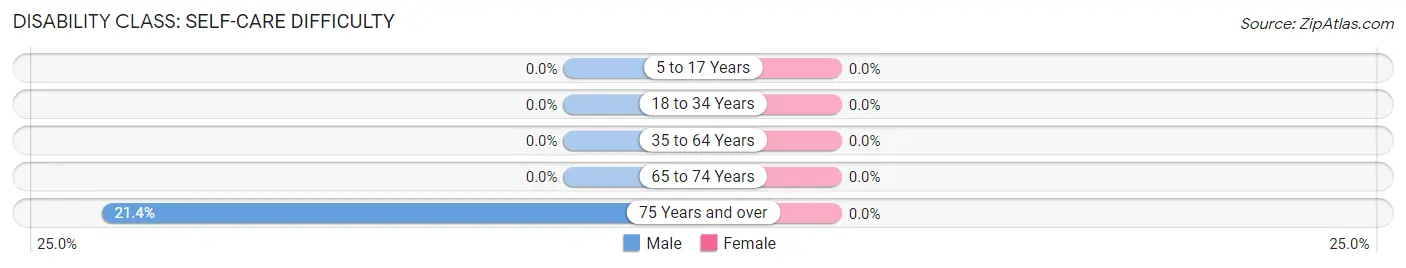
| Age Bracket | Male | Female |
| 5 to 17 Years | 0 (0.0%) | 0 (0.0%) |
| 18 to 34 Years | 0 (0.0%) | 0 (0.0%) |
| 35 to 64 Years | 0 (0.0%) | 0 (0.0%) |
| 65 to 74 Years | 0 (0.0%) | 0 (0.0%) |
| 75 Years and over | 6 (21.4%) | 0 (0.0%) |
Technology Access in Benson
Computing Device Access in Benson
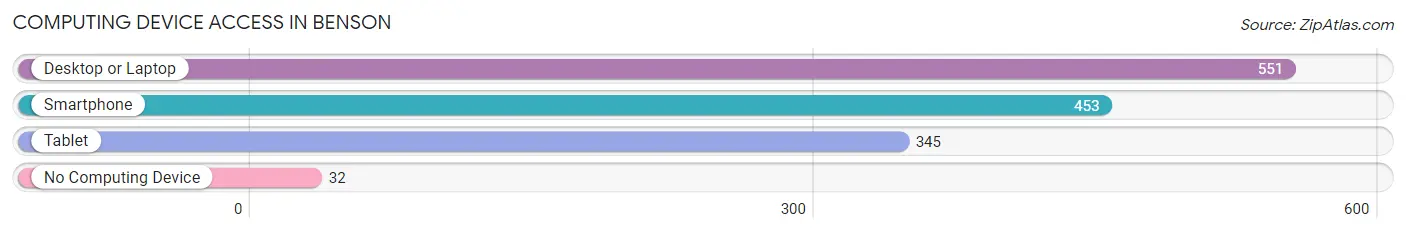
| Device Type | # Households | % Households |
| Desktop or Laptop | 551 | 94.5% |
| Smartphone | 453 | 77.7% |
| Tablet | 345 | 59.2% |
| No Computing Device | 32 | 5.5% |
| Total | 583 | 100.0% |
Internet Access in Benson
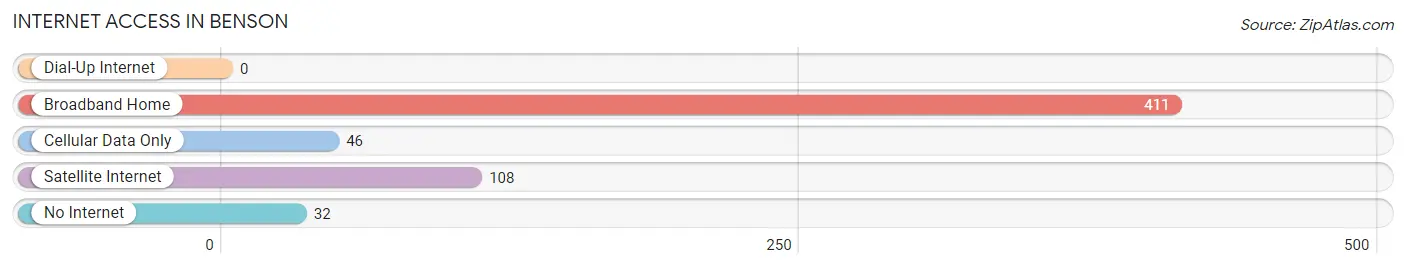
| Internet Type | # Households | % Households |
| Dial-Up Internet | 0 | 0.0% |
| Broadband Home | 411 | 70.5% |
| Cellular Data Only | 46 | 7.9% |
| Satellite Internet | 108 | 18.5% |
| No Internet | 32 | 5.5% |
| Total | 583 | 100.0% |
Benson Summary
Benson, Utah is a small town located in the southwestern corner of the state, near the Arizona border. It is situated in the heart of the Grand Staircase-Escalante National Monument, and is surrounded by stunning red rock formations and breathtaking views of the surrounding desert. The town has a population of just over 1,000 people, and is the gateway to the Grand Staircase-Escalante National Monument.
Benson was first settled in 1876 by a group of Mormon pioneers led by John D. Lee. The town was named after Lee's son, Benson Lee, and was originally intended to be a farming community. However, the harsh desert climate and lack of water made it difficult to sustain a successful agricultural operation. As a result, the town shifted its focus to ranching and mining.
The town's economy is largely based on tourism, as it is the gateway to the Grand Staircase-Escalante National Monument. The monument is a popular destination for hikers, campers, and other outdoor enthusiasts. The town also has a few small businesses, including a gas station, a grocery store, and a few restaurants.
The climate in Benson is arid and semi-arid, with hot summers and cold winters. The average high temperature in the summer is around 90 degrees Fahrenheit, while the average low temperature in the winter is around 20 degrees Fahrenheit. The town receives an average of 8 inches of precipitation per year, most of which falls in the form of snow.
The population of Benson is predominantly white, with a small Hispanic minority. The median household income is around $35,000, and the median home value is around $150,000. The town has a low unemployment rate, and the majority of the population is employed in the tourism industry.
Benson is a small town with a rich history and a unique culture. It is a great place to visit for those looking to explore the Grand Staircase-Escalante National Monument, or just to get away from the hustle and bustle of city life. With its stunning views and friendly people, Benson is sure to be a memorable experience.
Common Questions
What is the Total Population of Benson?
Total Population of Benson is 1,816.
What is the Total Male Population of Benson?
Total Male Population of Benson is 873.
What is the Total Female Population of Benson?
Total Female Population of Benson is 943.
What is the Ratio of Males per 100 Females in Benson?
There are 92.58 Males per 100 Females in Benson.
What is the Ratio of Females per 100 Males in Benson?
There are 108.02 Females per 100 Males in Benson.
What is the Median Population Age in Benson?
Median Population Age in Benson is 32.8 Years.
What is the Average Family Size in Benson
Average Family Size in Benson is 3.7 People.
What is the Average Household Size in Benson
Average Household Size in Benson is 3.1 People.
What is Per Capita Income in Benson?
Per Capita income in Benson is $34,919.
What is the Median Family Income in Benson?
Median Family Income in Benson is $100,040.
What is the Median Household income in Benson?
Median Household Income in Benson is $69,188.
What is Income or Wage Gap in Benson?
Income or Wage Gap in Benson is 55.4%.
Women in Benson earn 44.6 cents for every dollar earned by a man.
What is Inequality or Gini Index in Benson?
Inequality or Gini Index in Benson is 0.47.
How Large is the Labor Force in Benson?
There are 1,039 People in the Labor Forcein in Benson.
What is the Percentage of People in the Labor Force in Benson?
82.7% of People are in the Labor Force in Benson.
What is the Unemployment Rate in Benson?
Unemployment Rate in Benson is 7.5%.