Zip Codes with the Lowest Poverty Level Among Seniors Over the Age of 65 in Salt Lake City, UT

RELATED REPORTS & OPTIONS

Lowest Poverty | Seniors 65+
Population
Families and Households
Female Fertility
Female Fertility (Unmarried)
Race (Community Size)
Race (Percentage)
Ancestry (Community Size)
AfghanAfricanAlbanianAmericanApacheArabArapahoArgentineanArmenianAssyrian / Chaldean / SyriacAustralianAustrianBangladeshiBasqueBelgianBhutaneseBlackfeetBolivianBrazilianBritishBulgarianBurmeseCajunCambodianCanadianCelticCentral AmericanCentral American IndianCherokeeCheyenneChileanChippewaChoctawColombianComancheCosta RicanCreeCroatianCubanCzechCzechoslovakianDanishDominicanDutchEastern EuropeanEcuadorianEgyptianEnglishEstonianEthiopianEuropeanFijianFilipinoFinnishFrenchFrench American IndianFrench CanadianGermanGhanaianGreekGuamanian / ChamorroGuatemalanHaitianHonduranHopiHungarianIcelanderIndian (Asian)IndonesianIranianIraqiIrishIroquoisIsraeliItalianJamaicanJapaneseJordanianKenyanKoreanLaotianLatvianLebaneseLiberianLithuanianLuxembourgerMacedonianMalaysianMalteseMexicanMexican American IndianMongolianMoroccanNative HawaiianNavajoNew ZealanderNicaraguanNigerianNorthern EuropeanNorwegianPaiutePakistaniPalestinianPanamanianPeruvianPolishPortuguesePotawatomiPuebloPuerto RicanRomanianRussianSalvadoranSamoanScandinavianScotch-IrishScottishSerbianShoshoneSiouxSlavicSlovakSloveneSomaliSouth AfricanSouth AmericanSouth American IndianSpaniardSpanishSpanish AmericanSpanish American IndianSri LankanSubsaharan AfricanSudaneseSwedishSwissSyrianThaiTlingit-HaidaTonganTrinidadian and TobagonianTurkishUgandanUkrainianUruguayanUteVenezuelanVietnameseWelshWest IndianYaquiYugoslavianZimbabwean
Ancestry (Percentage)
AfghanAfricanAlbanianAmericanApacheArabArapahoArgentineanArmenianAssyrian / Chaldean / SyriacAustralianAustrianBangladeshiBasqueBelgianBhutaneseBlackfeetBolivianBrazilianBritishBulgarianBurmeseCajunCambodianCanadianCelticCentral AmericanCentral American IndianCherokeeCheyenneChileanChippewaChoctawColombianComancheCosta RicanCreeCroatianCubanCzechCzechoslovakianDanishDominicanDutchEastern EuropeanEcuadorianEgyptianEnglishEstonianEthiopianEuropeanFijianFilipinoFinnishFrenchFrench American IndianFrench CanadianGermanGhanaianGreekGuamanian / ChamorroGuatemalanHaitianHonduranHopiHungarianIcelanderIndian (Asian)IndonesianIranianIraqiIrishIroquoisIsraeliItalianJamaicanJapaneseJordanianKenyanKoreanLaotianLatvianLebaneseLiberianLithuanianLuxembourgerMacedonianMalaysianMalteseMexicanMexican American IndianMongolianMoroccanNative HawaiianNavajoNew ZealanderNicaraguanNigerianNorthern EuropeanNorwegianPaiutePakistaniPalestinianPanamanianPeruvianPolishPortuguesePotawatomiPuebloPuerto RicanRomanianRussianSalvadoranSamoanScandinavianScotch-IrishScottishSerbianShoshoneSiouxSlavicSlovakSloveneSomaliSouth AfricanSouth AmericanSouth American IndianSpaniardSpanishSpanish AmericanSpanish American IndianSri LankanSubsaharan AfricanSudaneseSwedishSwissSyrianThaiTlingit-HaidaTonganTrinidadian and TobagonianTurkishUgandanUkrainianUruguayanUteVenezuelanVietnameseWelshWest IndianYaquiYugoslavianZimbabwean
Immigrant Origin (Total)
AfghanistanAfricaArgentinaArmeniaAsiaAustraliaAustriaBangladeshBelarusBelgiumBoliviaBosnia and HerzegovinaBrazilBulgariaBurma / MyanmarCambodiaCanadaCaribbeanCentral AmericaChileChinaColombiaCongoCosta RicaCroatiaCubaCzechoslovakiaDenmarkDominican RepublicEastern AfricaEastern AsiaEastern EuropeEcuadorEgyptEl SalvadorEnglandEthiopiaEuropeFijiFranceGermanyGhanaGreeceGuatemalaHaitiHondurasHong KongHungaryIndiaIndonesiaIranIraqIrelandIsraelItalyJamaicaJapanJordanKazakhstanKenyaKoreaKuwaitLaosLatin AmericaLebanonLiberiaMalaysiaMexicoMicronesiaMiddle AfricaMoldovaMoroccoNepalNetherlandsNicaraguaNigeriaNorthern AfricaNorthern EuropeNorwayOceaniaPakistanPeruPhilippinesPolandPortugalRomaniaRussiaSaudi ArabiaScotlandSerbiaSierra LeoneSingaporeSomaliaSouth AfricaSouth AmericaSouth Central AsiaSouth Eastern AsiaSouthern EuropeSpainSri LankaSudanSwedenSwitzerlandSyriaTaiwanThailandTurkeyUgandaUkraineUruguayVenezuelaVietnamWestern AfricaWestern AsiaWestern EuropeZaireZimbabwe
Immigrant Origin (Percentage)
AfghanistanAfricaArgentinaArmeniaAsiaAustraliaAustriaBangladeshBelarusBelgiumBoliviaBosnia and HerzegovinaBrazilBulgariaBurma / MyanmarCambodiaCanadaCaribbeanCentral AmericaChileChinaColombiaCongoCosta RicaCroatiaCubaCzechoslovakiaDenmarkDominican RepublicEastern AfricaEastern AsiaEastern EuropeEcuadorEgyptEl SalvadorEnglandEthiopiaEuropeFijiFranceGermanyGhanaGreeceGuatemalaHaitiHondurasHong KongHungaryIndiaIndonesiaIranIraqIrelandIsraelItalyJamaicaJapanJordanKazakhstanKenyaKoreaKuwaitLaosLatin AmericaLebanonLiberiaMalaysiaMexicoMicronesiaMiddle AfricaMoldovaMoroccoNepalNetherlandsNicaraguaNigeriaNorthern AfricaNorthern EuropeNorwayOceaniaPakistanPeruPhilippinesPolandPortugalRomaniaRussiaSaudi ArabiaScotlandSerbiaSierra LeoneSingaporeSomaliaSouth AfricaSouth AmericaSouth Central AsiaSouth Eastern AsiaSouthern EuropeSpainSri LankaSudanSwedenSwitzerlandSyriaTaiwanThailandTurkeyUgandaUkraineUruguayVenezuelaVietnamWestern AfricaWestern AsiaWestern EuropeZaireZimbabwe
Income
Income (Families)
Income (Households)
Poverty
Poverty (Families)
Unemployment
Employment Occupations
Employment Industries
Employer Class
Commute Time
Commute Means
School Enrollment
Education by Degree Field
Occupancy
Finances
Physical Characteristics
Salt Lake City
Compare Zip Codes
Comparison Subject

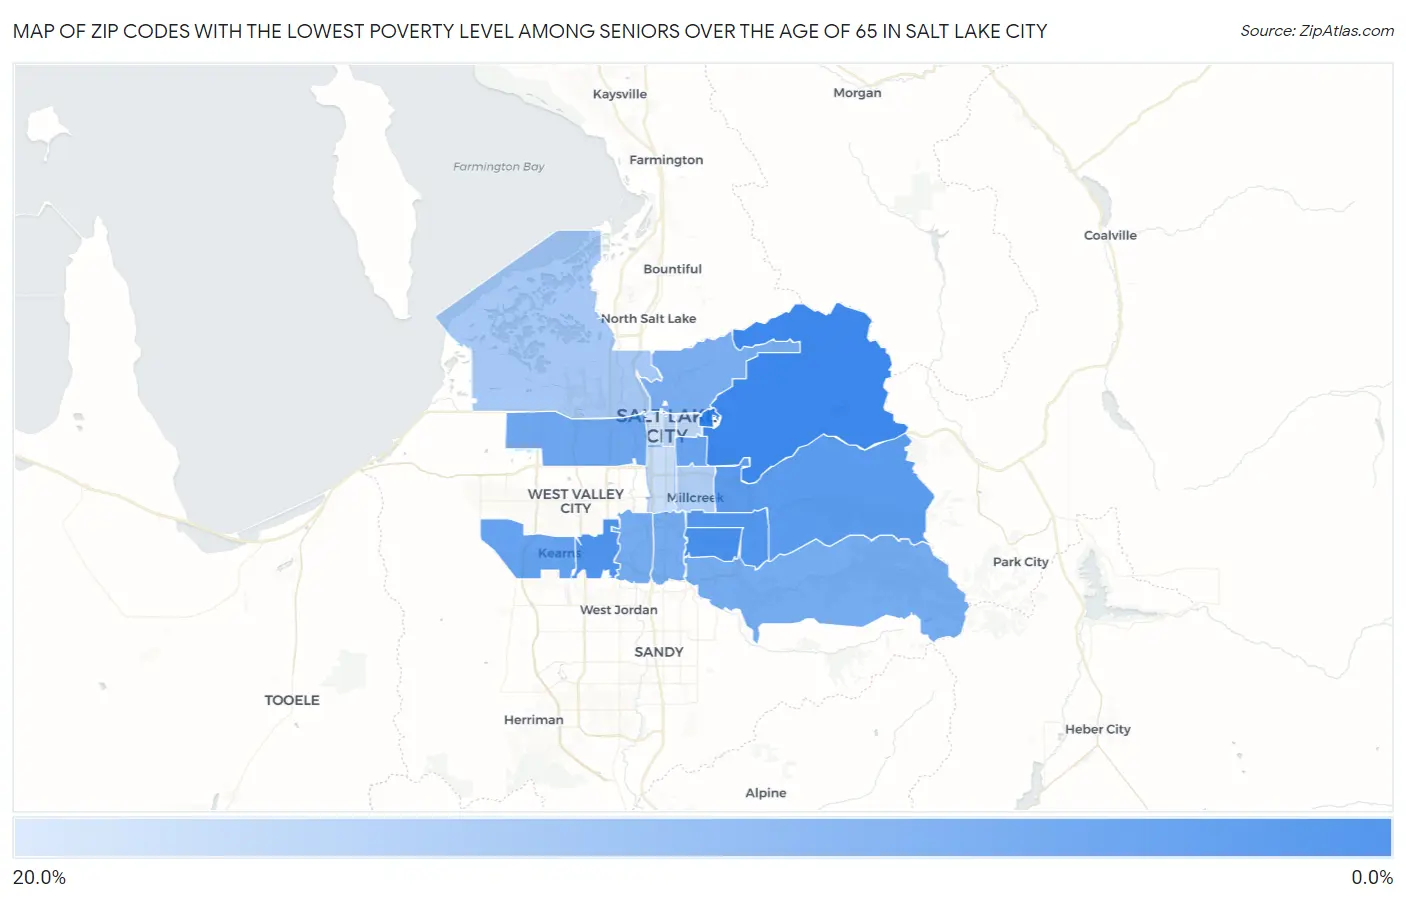
Map of Zip Codes with the Lowest Poverty Level Among Seniors Over the Age of 65 in Salt Lake City

20.0%
0.0%
Zip Codes with the Lowest Poverty Level Among Seniors Over the Age of 65 in Salt Lake City Map

Zip Codes with the Lowest Poverty Level Among Seniors Over the Age of 65 in Salt Lake City, UT

Zip Code Senior Poverty vs State vs National
1.841083.0%6.6%(-3.59)#3010.0%(-6.98)#2,324
2.841174.0%6.6%(-2.54)#4710.0%(-5.93)#4,056
3.841294.8%6.6%(-1.78)#6610.0%(-5.17)#5,542
4.841245.0%6.6%(-1.55)#7310.0%(-4.94)#6,034
5.841095.8%6.6%(-0.727)#9210.0%(-4.12)#7,776
6.841186.5%6.6%(-0.094)#11110.0%(-3.49)#9,105
7.841057.1%6.6%(+0.500)#12310.0%(-2.89)#10,383
8.841047.4%6.6%(+0.835)#12810.0%(-2.56)#11,106
9.841238.0%6.6%(+1.44)#14010.0%(-1.95)#12,331
10.841218.0%6.6%(+1.46)#14110.0%(-1.93)#12,359
11.841078.1%6.6%(+1.51)#14210.0%(-1.88)#12,469
12.841038.5%6.6%(+1.89)#14710.0%(-1.50)#13,221
13.8411612.5%6.6%(+5.91)#17710.0%(+2.52)#19,359
14.8410613.4%6.6%(+6.84)#18110.0%(+3.45)#20,372
15.8411114.1%6.6%(+7.51)#18410.0%(+4.12)#20,988
16.8410214.7%6.6%(+8.12)#18710.0%(+4.72)#21,506
17.8411515.7%6.6%(+9.18)#19110.0%(+5.79)#22,322
18.8410116.5%6.6%(+9.99)#19410.0%(+6.60)#22,861

Common Questions

What are the Top 10 Zip Codes with the Lowest Poverty Level Among Seniors Over the Age of 65 in Salt Lake City, UT?
Top 10 Zip Codes with the Lowest Poverty Level Among Seniors Over the Age of 65 in Salt Lake City, UT are:
#1
0.0%
#2
0.0%
#3
3.0%
#4
4.0%
#5
4.8%
#6
5.0%
#7
5.8%
#8
6.5%
#9
7.1%
#10
7.4%
What zip code has the Lowest Poverty Level Among Seniors Over the Age of 65 in Salt Lake City, UT?
84108 has the Lowest Poverty Level Among Seniors Over the Age of 65 in Salt Lake City, UT with 3.0%.
What is the Poverty Level Among Seniors Over the Age of 65 in Salt Lake City, UT?
Poverty Level Among Seniors Over the Age of 65 in Salt Lake City is 10.0%.
What is the Poverty Level Among Seniors Over the Age of 65 in Utah?
Poverty Level Among Seniors Over the Age of 65 in Utah is 6.6%.
What is the Poverty Level Among Seniors Over the Age of 65 in the United States?
Poverty Level Among Seniors Over the Age of 65 in the United States is 10.0%.