Kamas, UT
Kamas Map
Kamas Overview
2,411
TOTAL POPULATION
1,197
MALE POPULATION
1,214
FEMALE POPULATION
98.60
MALES / 100 FEMALES
101.42
FEMALES / 100 MALES
28.2
MEDIAN AGE
4.7
AVG FAMILY SIZE
4.2
AVG HOUSEHOLD SIZE
$29,386
PER CAPITA INCOME
$83,385
AVG FAMILY INCOME
$81,341
AVG HOUSEHOLD INCOME
24.4%
WAGE / INCOME GAP [ % ]
75.6¢/ $1
WAGE / INCOME GAP [ $ ]
0.37
INEQUALITY / GINI INDEX
1,348
LABOR FORCE [ PEOPLE ]
81.7%
PERCENT IN LABOR FORCE
0.9%
UNEMPLOYMENT RATE
Kamas Zip Codes
Kamas Area Codes
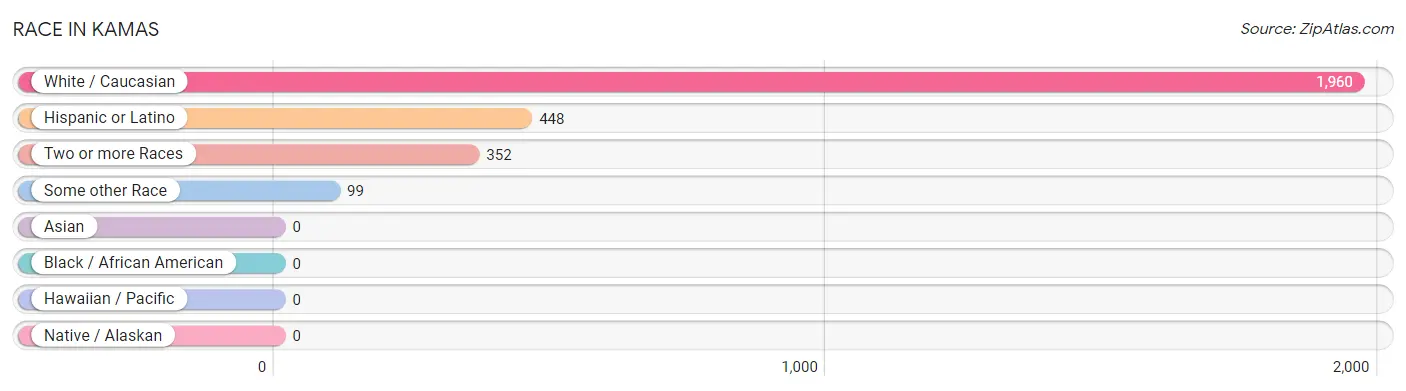
Race in Kamas
The most populous races in Kamas are White / Caucasian (1,960 | 81.3%), Hispanic or Latino (448 | 18.6%), and Two or more Races (352 | 14.6%).
| Race | # Population | % Population |
| Asian | 0 | 0.0% |
| Black / African American | 0 | 0.0% |
| Hawaiian / Pacific | 0 | 0.0% |
| Hispanic or Latino | 448 | 18.6% |
| Native / Alaskan | 0 | 0.0% |
| White / Caucasian | 1,960 | 81.3% |
| Two or more Races | 352 | 14.6% |
| Some other Race | 99 | 4.1% |
| Total | 2,411 | 100.0% |
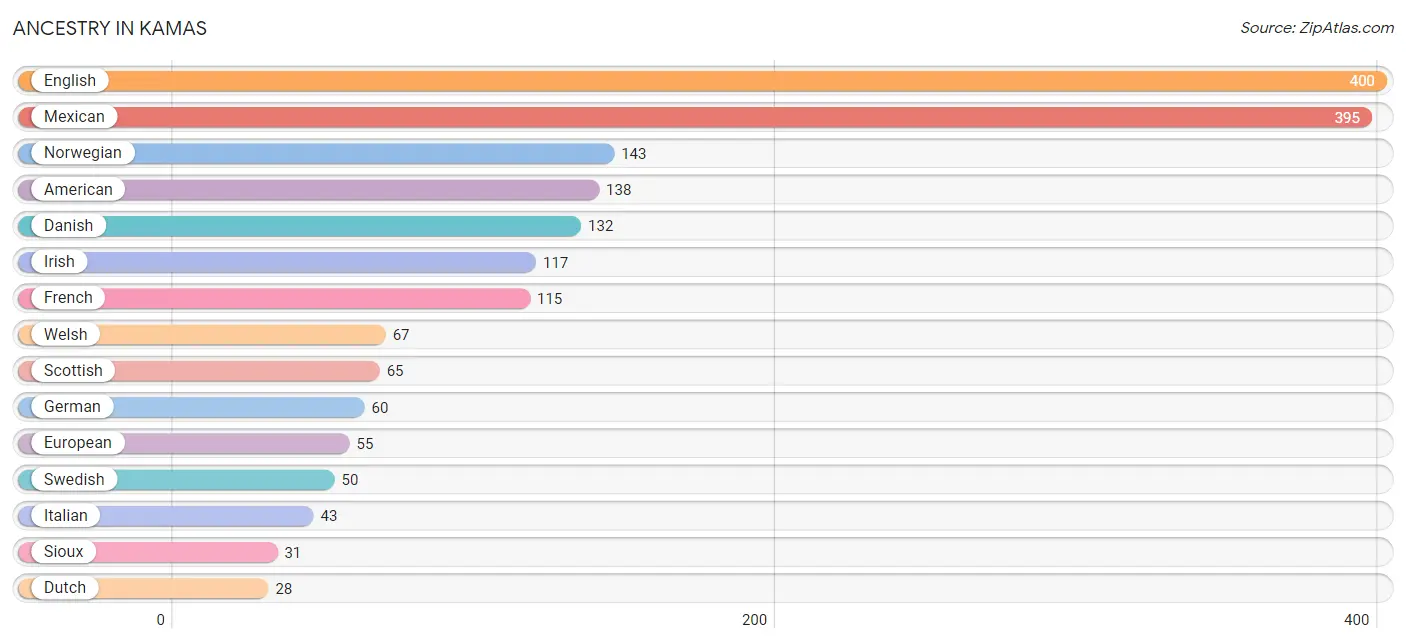
Ancestry in Kamas
The most populous ancestries reported in Kamas are English (400 | 16.6%), Mexican (395 | 16.4%), Norwegian (143 | 5.9%), American (138 | 5.7%), and Danish (132 | 5.5%), together accounting for 50.1% of all Kamas residents.
| Ancestry | # Population | % Population |
| Alsatian | 2 | 0.1% |
| American | 138 | 5.7% |
| Bhutanese | 3 | 0.1% |
| Brazilian | 1 | 0.0% |
| British | 7 | 0.3% |
| Central American | 18 | 0.7% |
| Colombian | 14 | 0.6% |
| Croatian | 2 | 0.1% |
| Czech | 15 | 0.6% |
| Czechoslovakian | 2 | 0.1% |
| Danish | 132 | 5.5% |
| Dutch | 28 | 1.2% |
| Eastern European | 8 | 0.3% |
| English | 400 | 16.6% |
| European | 55 | 2.3% |
| French | 115 | 4.8% |
| French Canadian | 21 | 0.9% |
| German | 60 | 2.5% |
| Greek | 11 | 0.5% |
| Guatemalan | 18 | 0.7% |
| Hungarian | 2 | 0.1% |
| Icelander | 3 | 0.1% |
| Irish | 117 | 4.9% |
| Italian | 43 | 1.8% |
| Mexican | 395 | 16.4% |
| Norwegian | 143 | 5.9% |
| Polish | 25 | 1.0% |
| Portuguese | 3 | 0.1% |
| Russian | 9 | 0.4% |
| Scandinavian | 27 | 1.1% |
| Scotch-Irish | 4 | 0.2% |
| Scottish | 65 | 2.7% |
| Sioux | 31 | 1.3% |
| Slovak | 8 | 0.3% |
| South African | 6 | 0.3% |
| South American | 19 | 0.8% |
| Spaniard | 8 | 0.3% |
| Subsaharan African | 6 | 0.3% |
| Swedish | 50 | 2.1% |
| Swiss | 22 | 0.9% |
| Uruguayan | 5 | 0.2% |
| Welsh | 67 | 2.8% | View All 42 Rows |
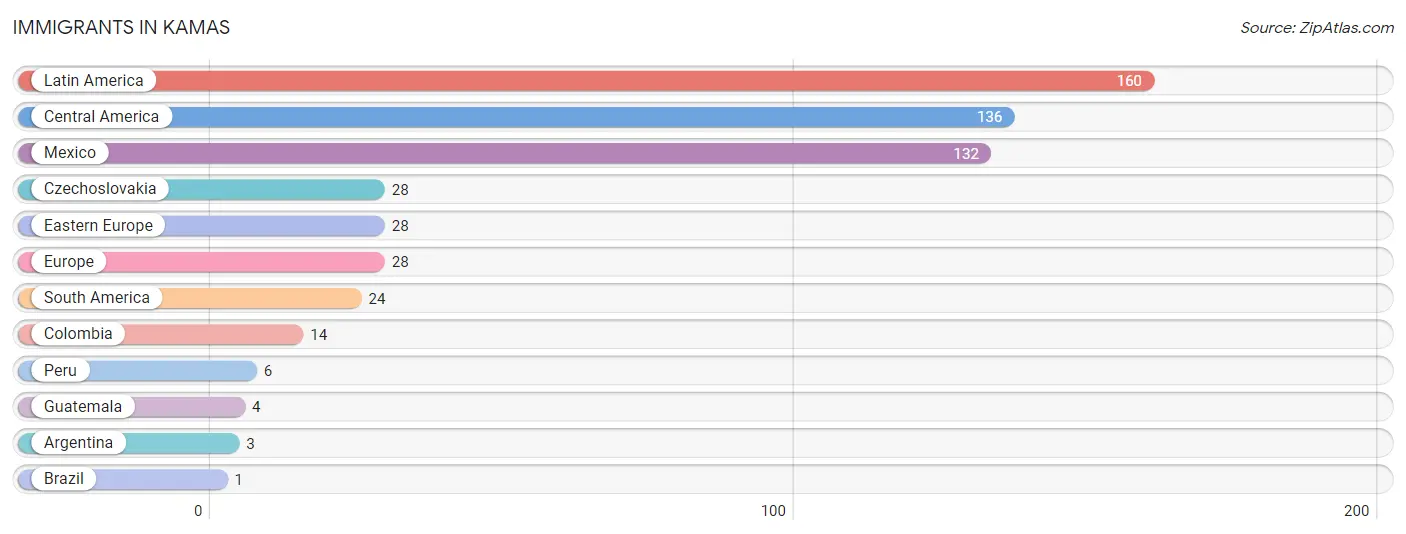
Immigrants in Kamas
The most numerous immigrant groups reported in Kamas came from Latin America (160 | 6.6%), Central America (136 | 5.6%), Mexico (132 | 5.5%), Czechoslovakia (28 | 1.2%), and Eastern Europe (28 | 1.2%), together accounting for 20.1% of all Kamas residents.
| Immigration Origin | # Population | % Population |
| Argentina | 3 | 0.1% |
| Brazil | 1 | 0.0% |
| Central America | 136 | 5.6% |
| Colombia | 14 | 0.6% |
| Czechoslovakia | 28 | 1.2% |
| Eastern Europe | 28 | 1.2% |
| Europe | 28 | 1.2% |
| Guatemala | 4 | 0.2% |
| Latin America | 160 | 6.6% |
| Mexico | 132 | 5.5% |
| Peru | 6 | 0.3% |
| South America | 24 | 1.0% | View All 12 Rows |
Sex and Age in Kamas
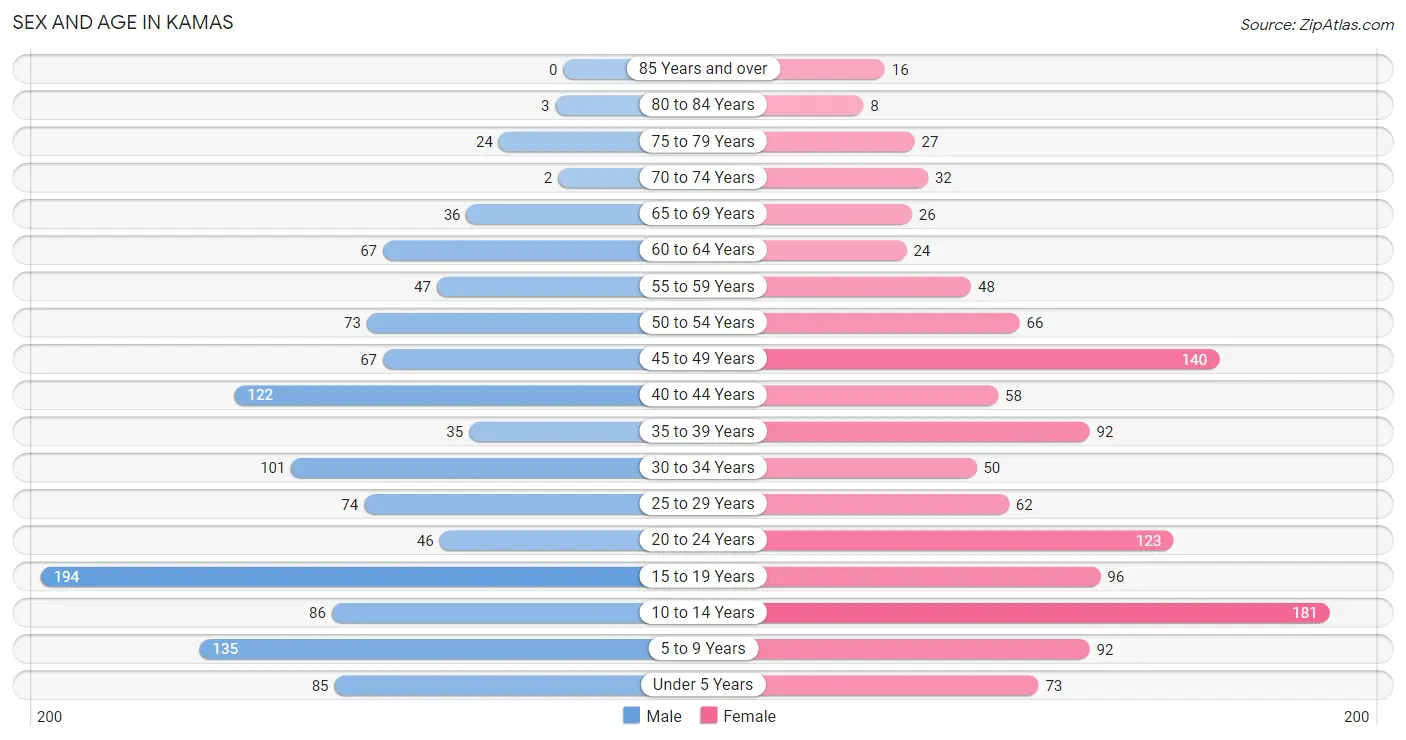
Sex and Age in Kamas
The most populous age groups in Kamas are 15 to 19 Years (194 | 16.2%) for men and 10 to 14 Years (181 | 14.9%) for women.
| Age Bracket | Male | Female |
| Under 5 Years | 85 (7.1%) | 73 (6.0%) |
| 5 to 9 Years | 135 (11.3%) | 92 (7.6%) |
| 10 to 14 Years | 86 (7.2%) | 181 (14.9%) |
| 15 to 19 Years | 194 (16.2%) | 96 (7.9%) |
| 20 to 24 Years | 46 (3.8%) | 123 (10.1%) |
| 25 to 29 Years | 74 (6.2%) | 62 (5.1%) |
| 30 to 34 Years | 101 (8.4%) | 50 (4.1%) |
| 35 to 39 Years | 35 (2.9%) | 92 (7.6%) |
| 40 to 44 Years | 122 (10.2%) | 58 (4.8%) |
| 45 to 49 Years | 67 (5.6%) | 140 (11.5%) |
| 50 to 54 Years | 73 (6.1%) | 66 (5.4%) |
| 55 to 59 Years | 47 (3.9%) | 48 (4.0%) |
| 60 to 64 Years | 67 (5.6%) | 24 (2.0%) |
| 65 to 69 Years | 36 (3.0%) | 26 (2.1%) |
| 70 to 74 Years | 2 (0.2%) | 32 (2.6%) |
| 75 to 79 Years | 24 (2.0%) | 27 (2.2%) |
| 80 to 84 Years | 3 (0.3%) | 8 (0.7%) |
| 85 Years and over | 0 (0.0%) | 16 (1.3%) |
| Total | 1,197 (100.0%) | 1,214 (100.0%) |
Families and Households in Kamas
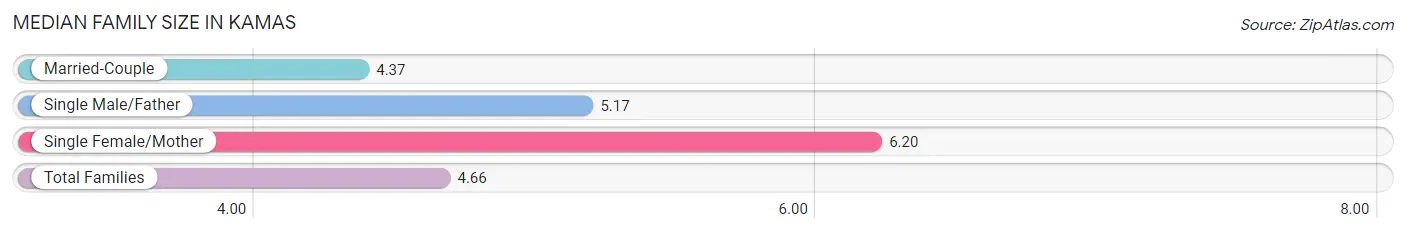
Median Family Size in Kamas
The median family size in Kamas is 4.66 persons per family, with single female/mother families (65 | 13.8%) accounting for the largest median family size of 6.2 persons per family. On the other hand, married-couple families (382 | 81.1%) represent the smallest median family size with 4.37 persons per family.
| Family Type | # Families | Family Size |
| Married-Couple | 382 (81.1%) | 4.37 |
| Single Male/Father | 24 (5.1%) | 5.17 |
| Single Female/Mother | 65 (13.8%) | 6.20 |
| Total Families | 471 (100.0%) | 4.66 |
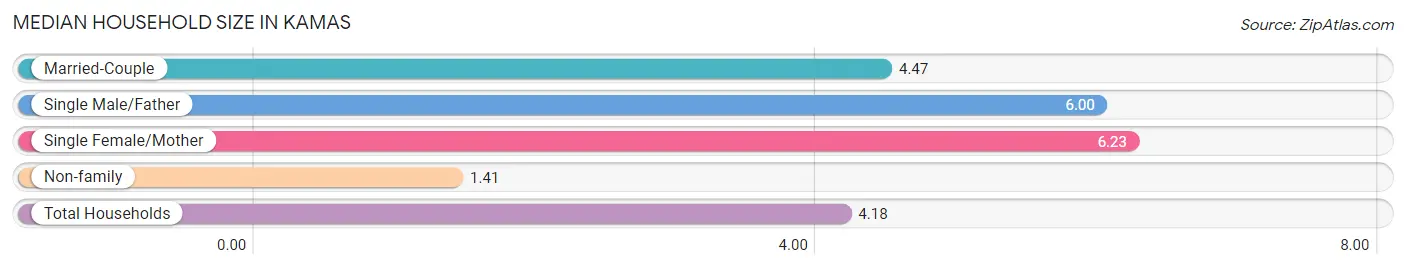
Median Household Size in Kamas
The median household size in Kamas is 4.18 persons per household, with single female/mother households (65 | 11.3%) accounting for the largest median household size of 6.23 persons per household. non-family households (105 | 18.2%) represent the smallest median household size with 1.41 persons per household.
| Household Type | # Households | Household Size |
| Married-Couple | 382 (66.3%) | 4.47 |
| Single Male/Father | 24 (4.2%) | 6.00 |
| Single Female/Mother | 65 (11.3%) | 6.23 |
| Non-family | 105 (18.2%) | 1.41 |
| Total Households | 576 (100.0%) | 4.18 |
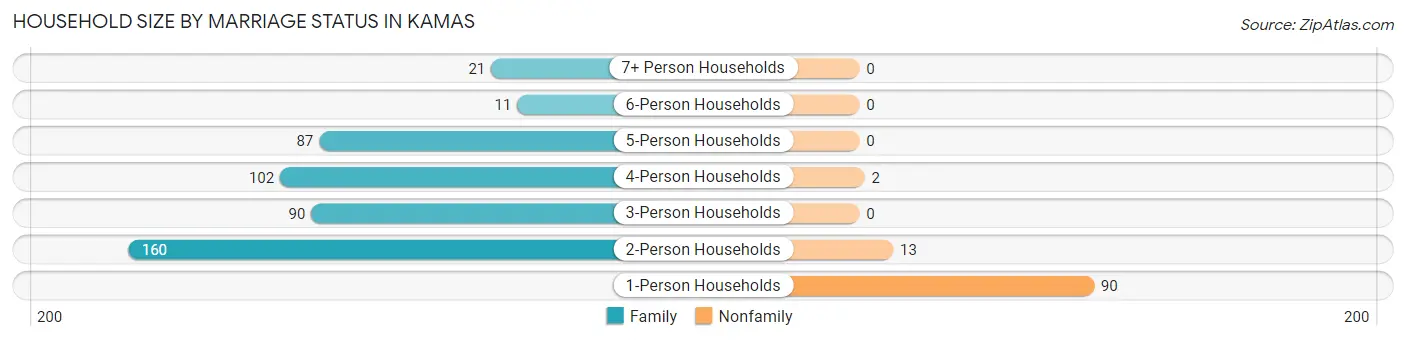
Household Size by Marriage Status in Kamas
Out of a total of 576 households in Kamas, 471 (81.8%) are family households, while 105 (18.2%) are nonfamily households. The most numerous type of family households are 2-person households, comprising 160, and the most common type of nonfamily households are 1-person households, comprising 90.
| Household Size | Family Households | Nonfamily Households |
| 1-Person Households | - | 90 (15.6%) |
| 2-Person Households | 160 (27.8%) | 13 (2.3%) |
| 3-Person Households | 90 (15.6%) | 0 (0.0%) |
| 4-Person Households | 102 (17.7%) | 2 (0.4%) |
| 5-Person Households | 87 (15.1%) | 0 (0.0%) |
| 6-Person Households | 11 (1.9%) | 0 (0.0%) |
| 7+ Person Households | 21 (3.6%) | 0 (0.0%) |
| Total | 471 (81.8%) | 105 (18.2%) |
Female Fertility in Kamas
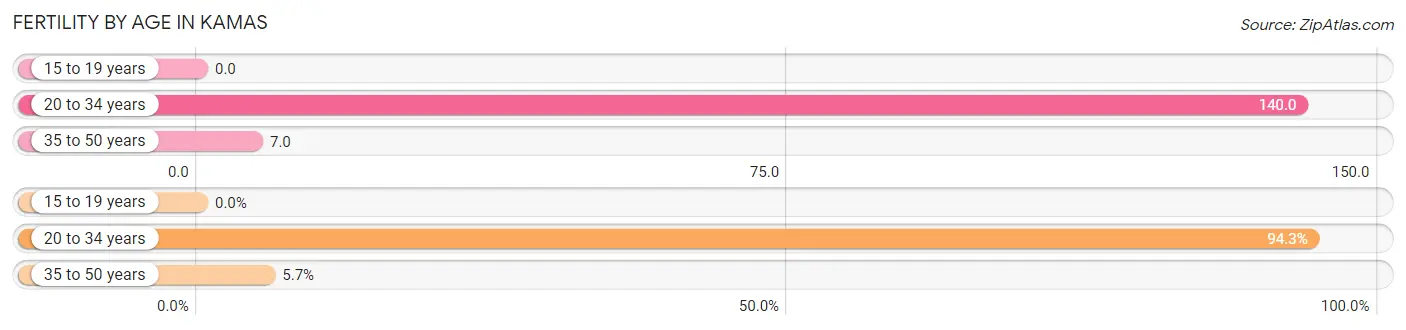
Fertility by Age in Kamas
Average fertility rate in Kamas is 55.0 births per 1,000 women. Women in the age bracket of 20 to 34 years have the highest fertility rate with 140.0 births per 1,000 women. Women in the age bracket of 20 to 34 years acount for 94.3% of all women with births.
| Age Bracket | Women with Births | Births / 1,000 Women |
| 15 to 19 years | 0 (0.0%) | 0.0 |
| 20 to 34 years | 33 (94.3%) | 140.0 |
| 35 to 50 years | 2 (5.7%) | 7.0 |
| Total | 35 (100.0%) | 55.0 |
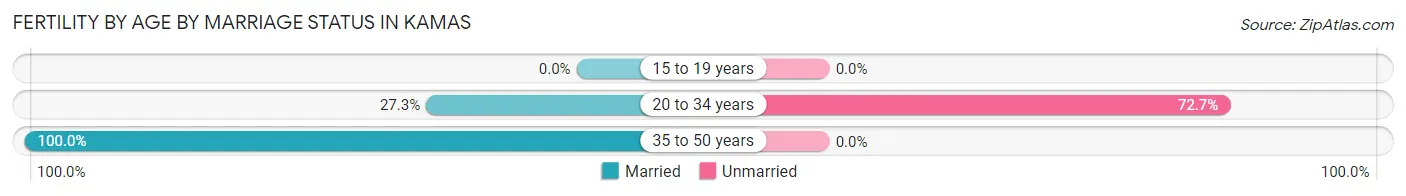
Fertility by Age by Marriage Status in Kamas
31.4% of women with births (35) in Kamas are married. The highest percentage of unmarried women with births falls into 20 to 34 years age bracket with 72.7% of them unmarried at the time of birth, while the lowest percentage of unmarried women with births belong to 35 to 50 years age bracket with 0.0% of them unmarried.
| Age Bracket | Married | Unmarried |
| 15 to 19 years | 0 (0.0%) | 0 (0.0%) |
| 20 to 34 years | 9 (27.3%) | 24 (72.7%) |
| 35 to 50 years | 2 (100.0%) | 0 (0.0%) |
| Total | 11 (31.4%) | 24 (68.6%) |
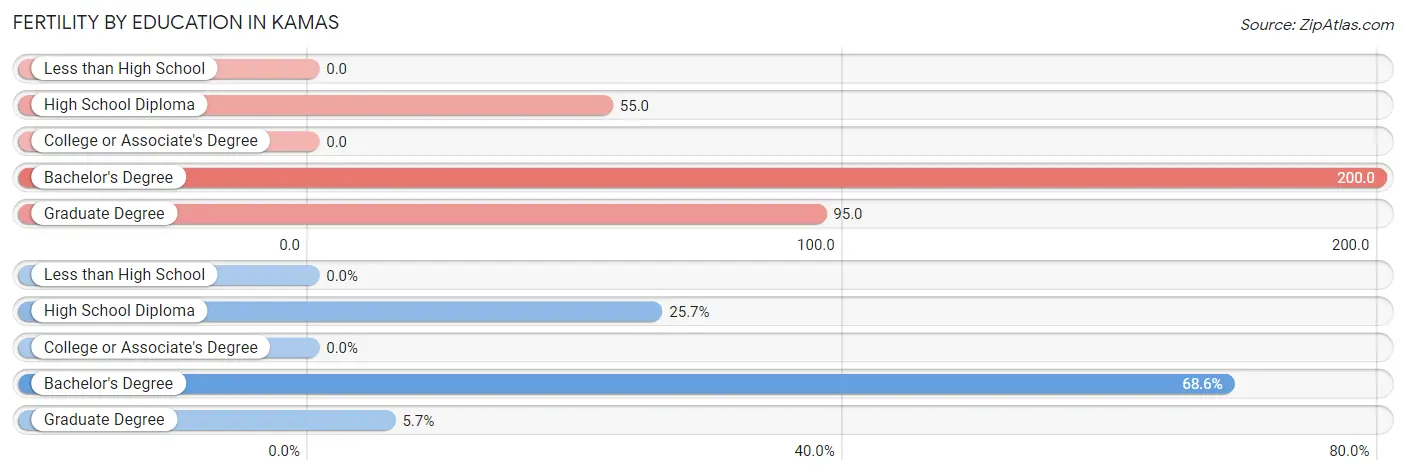
Fertility by Education in Kamas
| Educational Attainment | Women with Births | Births / 1,000 Women |
| Less than High School | 0 (0.0%) | 0.0 |
| High School Diploma | 9 (25.7%) | 55.0 |
| College or Associate's Degree | 0 (0.0%) | 0.0 |
| Bachelor's Degree | 24 (68.6%) | 200.0 |
| Graduate Degree | 2 (5.7%) | 95.0 |
| Total | 35 (100.0%) | 55.0 |
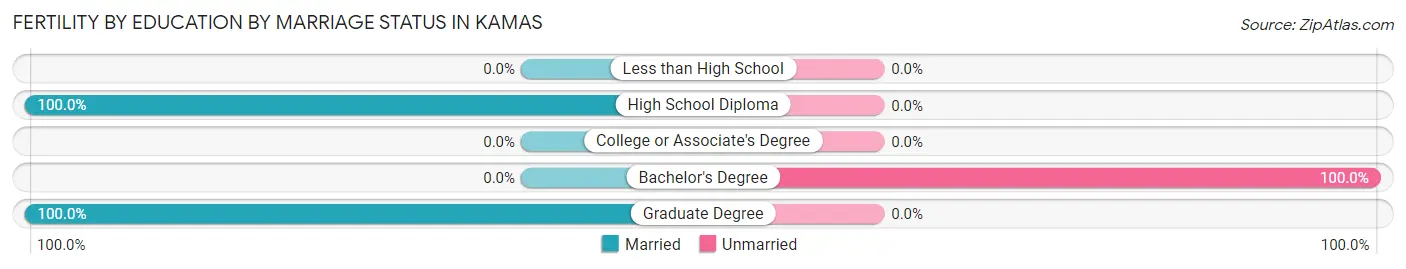
Fertility by Education by Marriage Status in Kamas
68.6% of women with births in Kamas are unmarried. Women with the educational attainment of high school diploma are most likely to be married with 100.0% of them married at childbirth, while women with the educational attainment of bachelor's degree are least likely to be married with 100.0% of them unmarried at childbirth.
| Educational Attainment | Married | Unmarried |
| Less than High School | 0 (0.0%) | 0 (0.0%) |
| High School Diploma | 9 (100.0%) | 0 (0.0%) |
| College or Associate's Degree | 0 (0.0%) | 0 (0.0%) |
| Bachelor's Degree | 0 (0.0%) | 24 (100.0%) |
| Graduate Degree | 2 (100.0%) | 0 (0.0%) |
| Total | 11 (31.4%) | 24 (68.6%) |
Income in Kamas
Income Overview in Kamas
Per Capita Income in Kamas is $29,386, while median incomes of families and households are $83,385 and $81,341 respectively.
| Characteristic | Number | Measure |
| Per Capita Income | 2,411 | $29,386 |
| Median Family Income | 471 | $83,385 |
| Mean Family Income | 471 | $104,615 |
| Median Household Income | 576 | $81,341 |
| Mean Household Income | 576 | $98,787 |
| Income Deficit | 471 | $0 |
| Wage / Income Gap (%) | 2,411 | 24.41% |
| Wage / Income Gap ($) | 2,411 | 75.59¢ per $1 |
| Gini / Inequality Index | 2,411 | 0.37 |
Earnings by Sex in Kamas
Average Earnings in Kamas are $35,938, $41,705 for men and $31,524 for women, a difference of 24.4%.
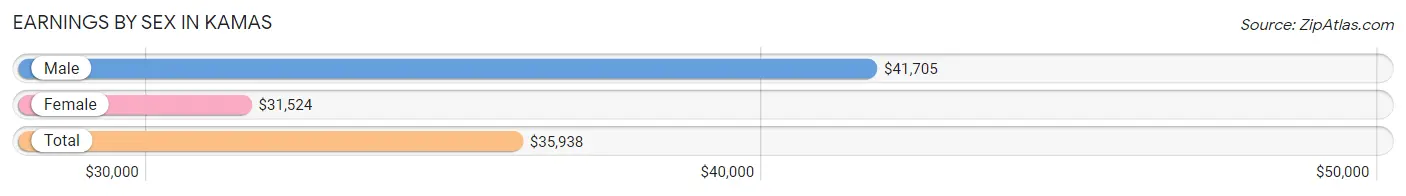
| Sex | Number | Average Earnings |
| Male | 741 (52.9%) | $41,705 |
| Female | 660 (47.1%) | $31,524 |
| Total | 1,401 (100.0%) | $35,938 |
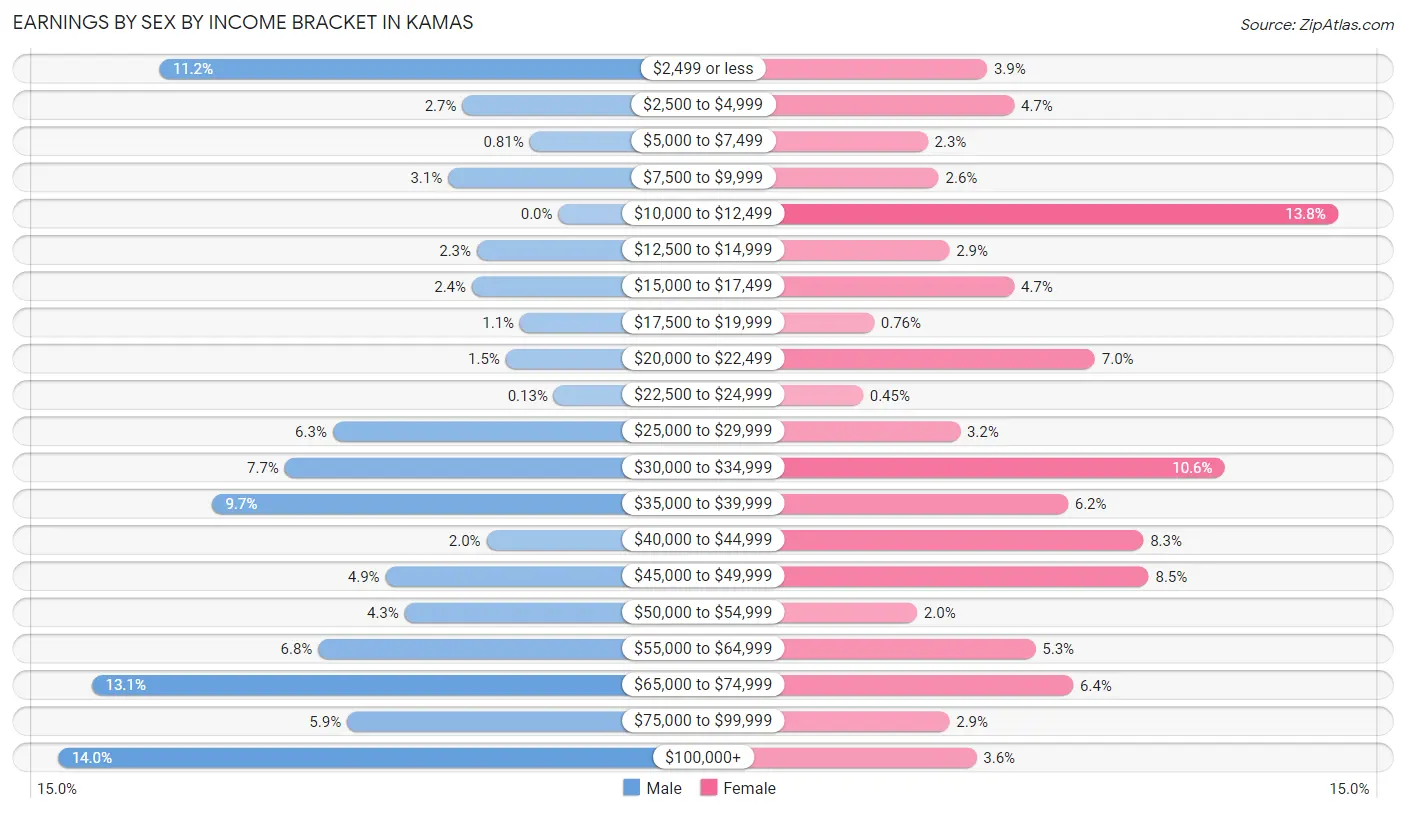
Earnings by Sex by Income Bracket in Kamas
The most common earnings brackets in Kamas are $100,000+ for men (104 | 14.0%) and $10,000 to $12,499 for women (91 | 13.8%).
| Income | Male | Female |
| $2,499 or less | 83 (11.2%) | 26 (3.9%) |
| $2,500 to $4,999 | 20 (2.7%) | 31 (4.7%) |
| $5,000 to $7,499 | 6 (0.8%) | 15 (2.3%) |
| $7,500 to $9,999 | 23 (3.1%) | 17 (2.6%) |
| $10,000 to $12,499 | 0 (0.0%) | 91 (13.8%) |
| $12,500 to $14,999 | 17 (2.3%) | 19 (2.9%) |
| $15,000 to $17,499 | 18 (2.4%) | 31 (4.7%) |
| $17,500 to $19,999 | 8 (1.1%) | 5 (0.8%) |
| $20,000 to $22,499 | 11 (1.5%) | 46 (7.0%) |
| $22,500 to $24,999 | 1 (0.1%) | 3 (0.4%) |
| $25,000 to $29,999 | 47 (6.3%) | 21 (3.2%) |
| $30,000 to $34,999 | 57 (7.7%) | 70 (10.6%) |
| $35,000 to $39,999 | 72 (9.7%) | 41 (6.2%) |
| $40,000 to $44,999 | 15 (2.0%) | 55 (8.3%) |
| $45,000 to $49,999 | 36 (4.9%) | 56 (8.5%) |
| $50,000 to $54,999 | 32 (4.3%) | 13 (2.0%) |
| $55,000 to $64,999 | 50 (6.8%) | 35 (5.3%) |
| $65,000 to $74,999 | 97 (13.1%) | 42 (6.4%) |
| $75,000 to $99,999 | 44 (5.9%) | 19 (2.9%) |
| $100,000+ | 104 (14.0%) | 24 (3.6%) |
| Total | 741 (100.0%) | 660 (100.0%) |
Earnings by Sex by Educational Attainment in Kamas
Average earnings in Kamas are $55,764 for men and $37,443 for women, a difference of 32.9%. Men with an educational attainment of graduate degree enjoy the highest average annual earnings of $94,896, while those with less than high school education earn the least with $50,250. Women with an educational attainment of graduate degree earn the most with the average annual earnings of $65,536, while those with high school diploma education have the smallest earnings of $31,042.
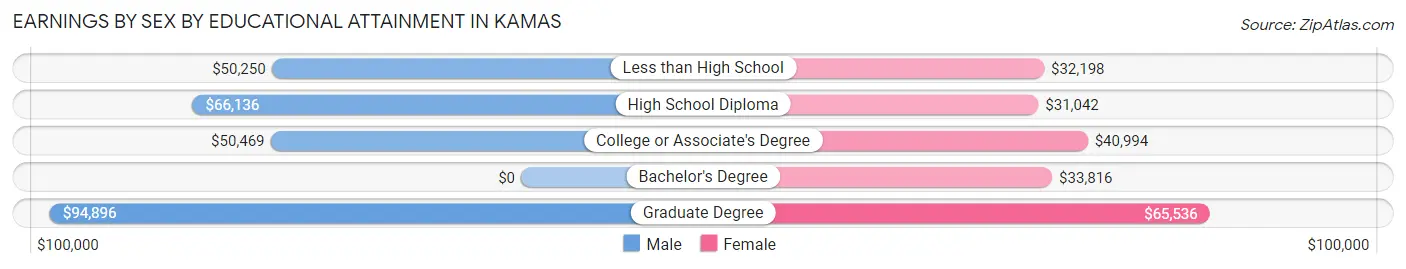
| Educational Attainment | Male Income | Female Income |
| Less than High School | $50,250 | $32,198 |
| High School Diploma | $66,136 | $31,042 |
| College or Associate's Degree | $50,469 | $40,994 |
| Bachelor's Degree | - | - |
| Graduate Degree | $94,896 | $65,536 |
| Total | $55,764 | $37,443 |
Family Income in Kamas
Family Income Brackets in Kamas
According to the Kamas family income data, there are 134 families falling into the $75,000 to $99,999 income range, which is the most common income bracket and makes up 28.4% of all families. Conversely, the $10,000 to $14,999 income bracket is the least frequent group with only 4 families (0.9%) belonging to this category.
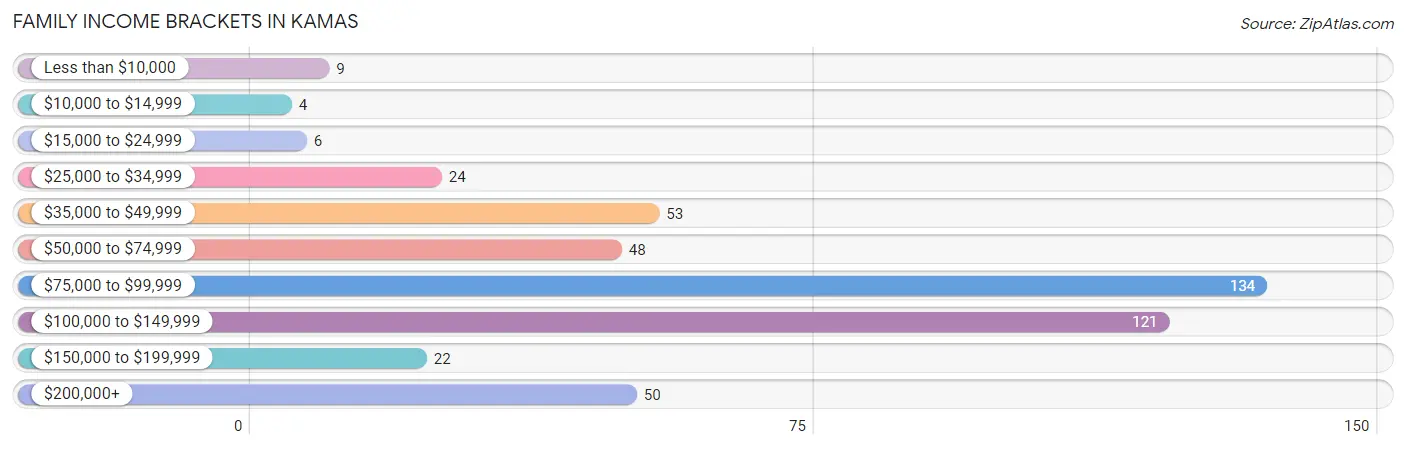
| Income Bracket | # Families | % Families |
| Less than $10,000 | 9 | 1.9% |
| $10,000 to $14,999 | 4 | 0.8% |
| $15,000 to $24,999 | 6 | 1.3% |
| $25,000 to $34,999 | 24 | 5.1% |
| $35,000 to $49,999 | 53 | 11.3% |
| $50,000 to $74,999 | 48 | 10.2% |
| $75,000 to $99,999 | 134 | 28.5% |
| $100,000 to $149,999 | 121 | 25.7% |
| $150,000 to $199,999 | 22 | 4.7% |
| $200,000+ | 50 | 10.6% |
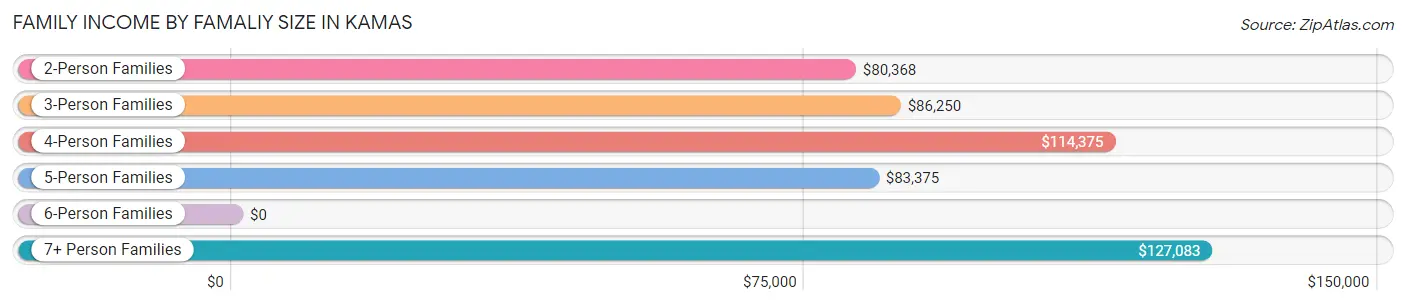
Family Income by Famaliy Size in Kamas
7+ person families (21 | 4.5%) account for the highest median family income in Kamas with $127,083 per family, while 2-person families (169 | 35.9%) have the highest median income of $40,184 per family member.
| Income Bracket | # Families | Median Income |
| 2-Person Families | 169 (35.9%) | $80,368 |
| 3-Person Families | 101 (21.4%) | $86,250 |
| 4-Person Families | 86 (18.3%) | $114,375 |
| 5-Person Families | 85 (18.0%) | $83,375 |
| 6-Person Families | 9 (1.9%) | $0 |
| 7+ Person Families | 21 (4.5%) | $127,083 |
| Total | 471 (100.0%) | $83,385 |
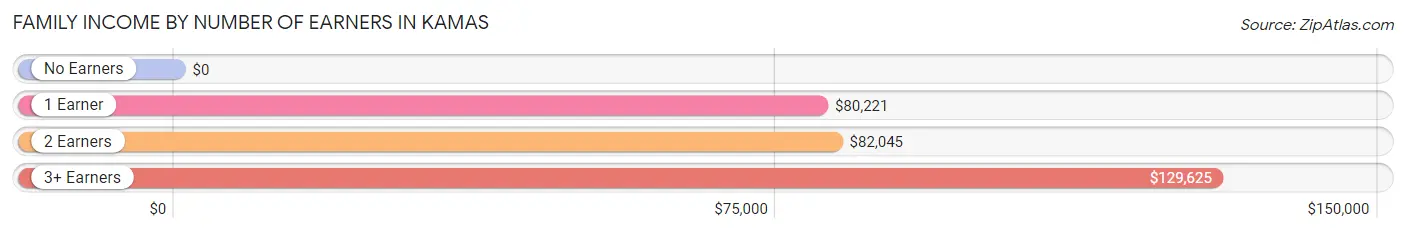
Family Income by Number of Earners in Kamas
| Number of Earners | # Families | Median Income |
| No Earners | 27 (5.7%) | $0 |
| 1 Earner | 75 (15.9%) | $80,221 |
| 2 Earners | 288 (61.2%) | $82,045 |
| 3+ Earners | 81 (17.2%) | $129,625 |
| Total | 471 (100.0%) | $83,385 |
Household Income in Kamas
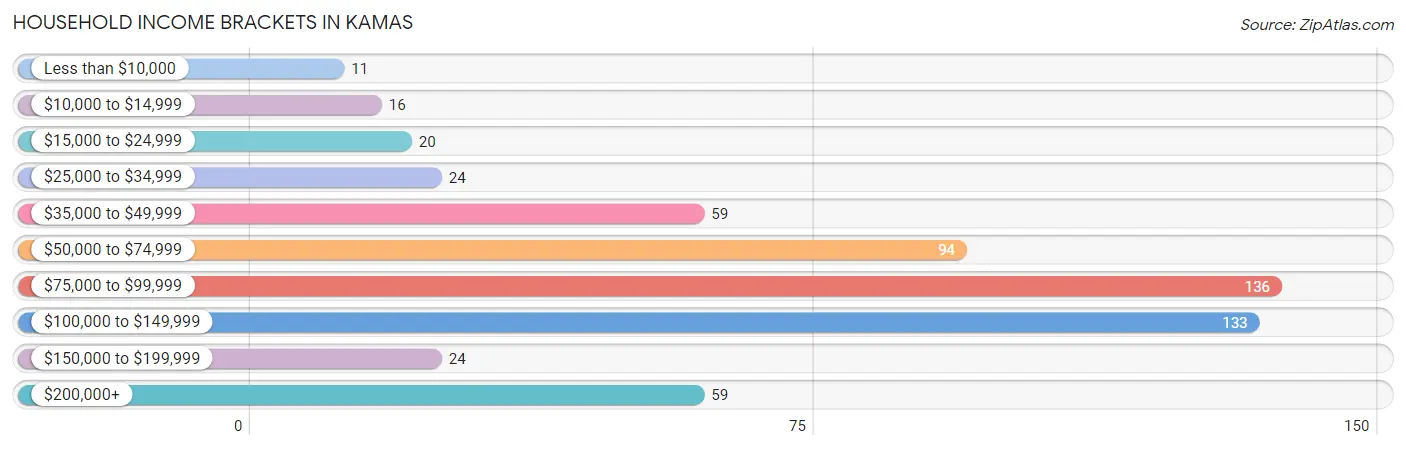
Household Income Brackets in Kamas
With 136 households falling in the category, the $75,000 to $99,999 income range is the most frequent in Kamas, accounting for 23.6% of all households. In contrast, only 11 households (1.9%) fall into the less than $10,000 income bracket, making it the least populous group.
| Income Bracket | # Households | % Households |
| Less than $10,000 | 11 | 1.9% |
| $10,000 to $14,999 | 16 | 2.8% |
| $15,000 to $24,999 | 20 | 3.5% |
| $25,000 to $34,999 | 24 | 4.2% |
| $35,000 to $49,999 | 59 | 10.2% |
| $50,000 to $74,999 | 94 | 16.3% |
| $75,000 to $99,999 | 136 | 23.6% |
| $100,000 to $149,999 | 133 | 23.1% |
| $150,000 to $199,999 | 24 | 4.2% |
| $200,000+ | 59 | 10.2% |
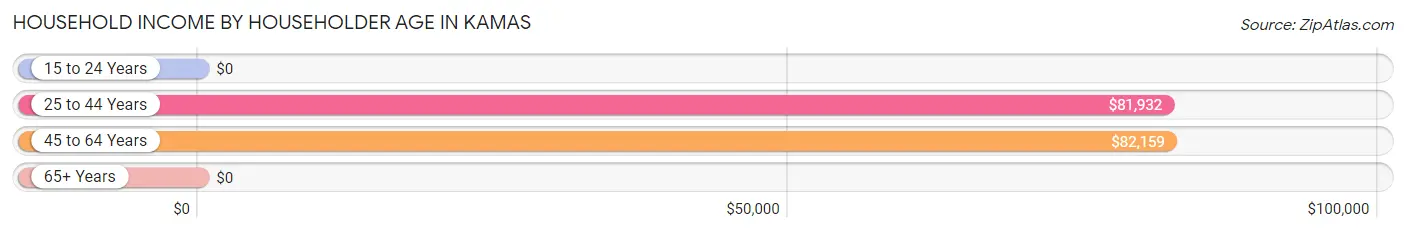
Household Income by Householder Age in Kamas
The median household income in Kamas is $81,341, with the highest median household income of $82,159 found in the 45 to 64 years age bracket for the primary householder. A total of 271 households (47.0%) fall into this category. Meanwhile, the 15 to 24 years age bracket for the primary householder has the lowest median household income of $0, with 12 households (2.1%) in this group.
| Income Bracket | # Households | Median Income |
| 15 to 24 Years | 12 (2.1%) | $0 |
| 25 to 44 Years | 226 (39.2%) | $81,932 |
| 45 to 64 Years | 271 (47.0%) | $82,159 |
| 65+ Years | 67 (11.6%) | $0 |
| Total | 576 (100.0%) | $81,341 |
Poverty in Kamas
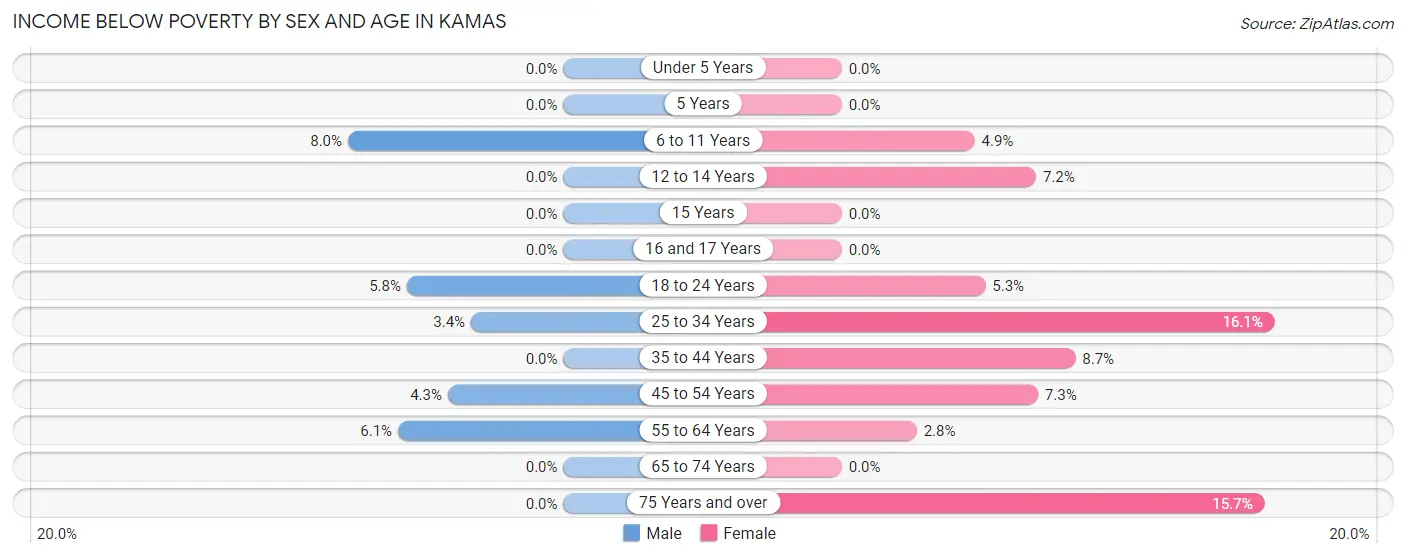
Income Below Poverty by Sex and Age in Kamas
With 3.2% poverty level for males and 6.7% for females among the residents of Kamas, 6 to 11 year old males and 25 to 34 year old females are the most vulnerable to poverty, with 14 males (8.0%) and 18 females (16.1%) in their respective age groups living below the poverty level.
| Age Bracket | Male | Female |
| Under 5 Years | 0 (0.0%) | 0 (0.0%) |
| 5 Years | 0 (0.0%) | 0 (0.0%) |
| 6 to 11 Years | 14 (8.0%) | 7 (4.9%) |
| 12 to 14 Years | 0 (0.0%) | 8 (7.2%) |
| 15 Years | 0 (0.0%) | 0 (0.0%) |
| 16 and 17 Years | 0 (0.0%) | 0 (0.0%) |
| 18 to 24 Years | 5 (5.8%) | 9 (5.3%) |
| 25 to 34 Years | 6 (3.4%) | 18 (16.1%) |
| 35 to 44 Years | 0 (0.0%) | 13 (8.7%) |
| 45 to 54 Years | 6 (4.3%) | 15 (7.3%) |
| 55 to 64 Years | 7 (6.1%) | 2 (2.8%) |
| 65 to 74 Years | 0 (0.0%) | 0 (0.0%) |
| 75 Years and over | 0 (0.0%) | 8 (15.7%) |
| Total | 38 (3.2%) | 80 (6.7%) |
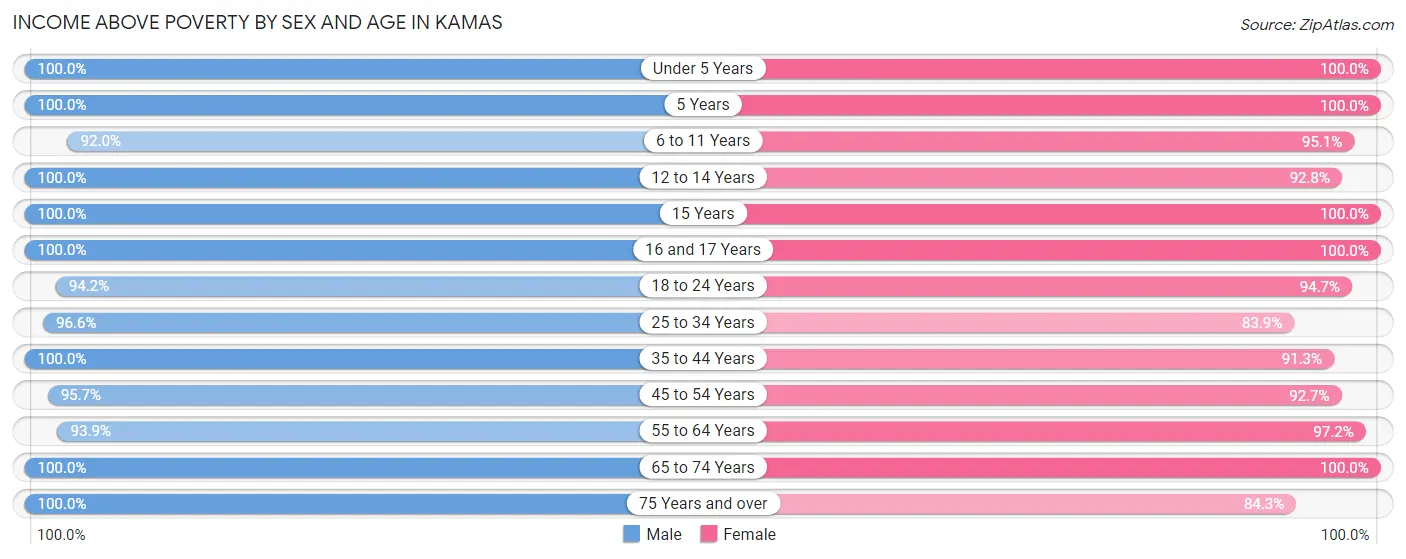
Income Above Poverty by Sex and Age in Kamas
According to the poverty statistics in Kamas, males aged under 5 years and females aged under 5 years are the age groups that are most secure financially, with 100.0% of males and 100.0% of females in these age groups living above the poverty line.
| Age Bracket | Male | Female |
| Under 5 Years | 85 (100.0%) | 62 (100.0%) |
| 5 Years | 16 (100.0%) | 10 (100.0%) |
| 6 to 11 Years | 161 (92.0%) | 135 (95.1%) |
| 12 to 14 Years | 30 (100.0%) | 103 (92.8%) |
| 15 Years | 72 (100.0%) | 37 (100.0%) |
| 16 and 17 Years | 82 (100.0%) | 13 (100.0%) |
| 18 to 24 Years | 81 (94.2%) | 160 (94.7%) |
| 25 to 34 Years | 169 (96.6%) | 94 (83.9%) |
| 35 to 44 Years | 157 (100.0%) | 137 (91.3%) |
| 45 to 54 Years | 134 (95.7%) | 191 (92.7%) |
| 55 to 64 Years | 107 (93.9%) | 70 (97.2%) |
| 65 to 74 Years | 38 (100.0%) | 58 (100.0%) |
| 75 Years and over | 27 (100.0%) | 43 (84.3%) |
| Total | 1,159 (96.8%) | 1,113 (93.3%) |
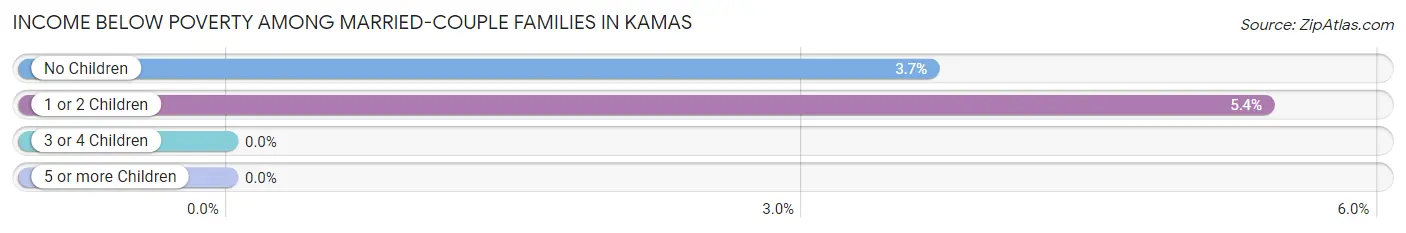
Income Below Poverty Among Married-Couple Families in Kamas
The poverty statistics for married-couple families in Kamas show that 3.4% or 13 of the total 382 families live below the poverty line. Families with 1 or 2 children have the highest poverty rate of 5.4%, comprising of 6 families. On the other hand, families with 3 or 4 children have the lowest poverty rate of 0.0%, which includes 0 families.
| Children | Above Poverty | Below Poverty |
| No Children | 184 (96.3%) | 7 (3.7%) |
| 1 or 2 Children | 105 (94.6%) | 6 (5.4%) |
| 3 or 4 Children | 68 (100.0%) | 0 (0.0%) |
| 5 or more Children | 12 (100.0%) | 0 (0.0%) |
| Total | 369 (96.6%) | 13 (3.4%) |
Income Below Poverty Among Single-Parent Households in Kamas
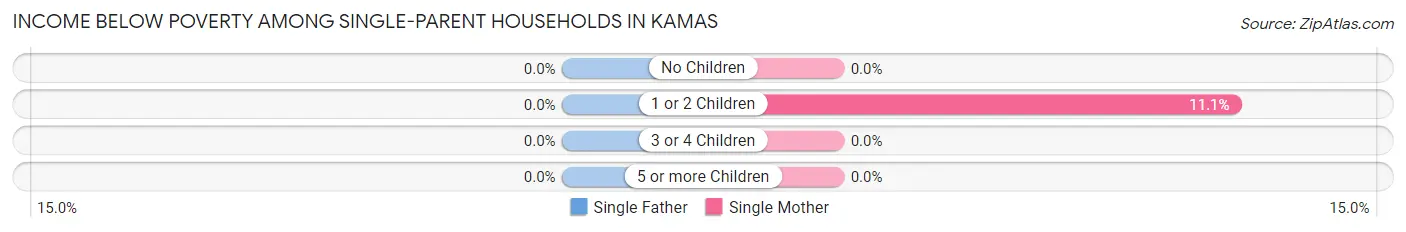
| Children | Single Father | Single Mother |
| No Children | 0 (0.0%) | 0 (0.0%) |
| 1 or 2 Children | 0 (0.0%) | 3 (11.1%) |
| 3 or 4 Children | 0 (0.0%) | 0 (0.0%) |
| 5 or more Children | 0 (0.0%) | 0 (0.0%) |
| Total | 0 (0.0%) | 3 (4.6%) |
Income Below Poverty Among Married-Couple vs Single-Parent Households in Kamas
The poverty data for Kamas shows that 13 of the married-couple family households (3.4%) and 3 of the single-parent households (3.4%) are living below the poverty level. Within the married-couple family households, those with 1 or 2 children have the highest poverty rate, with 6 households (5.4%) falling below the poverty line. Among the single-parent households, those with 1 or 2 children have the highest poverty rate, with 3 household (8.3%) living below poverty.
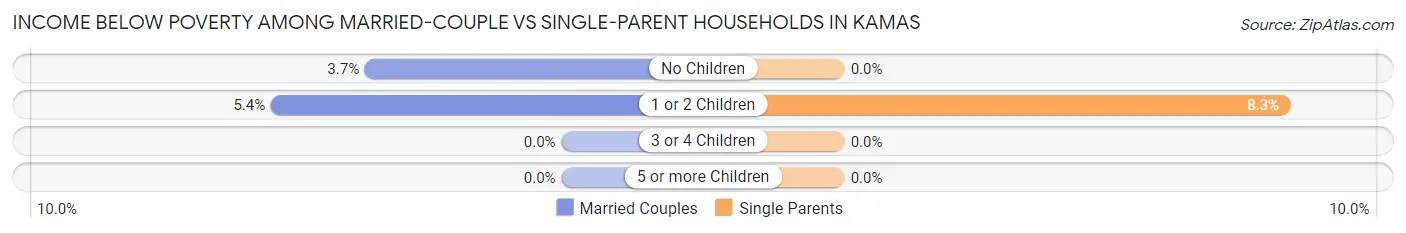
| Children | Married-Couple Families | Single-Parent Households |
| No Children | 7 (3.7%) | 0 (0.0%) |
| 1 or 2 Children | 6 (5.4%) | 3 (8.3%) |
| 3 or 4 Children | 0 (0.0%) | 0 (0.0%) |
| 5 or more Children | 0 (0.0%) | 0 (0.0%) |
| Total | 13 (3.4%) | 3 (3.4%) |
Employment Characteristics in Kamas
Employment by Class of Employer in Kamas
Among the 1,312 employed individuals in Kamas, private company employees (906 | 69.1%), not-for-profit organizations (100 | 7.6%), and state government employees (95 | 7.2%) make up the most common classes of employment.
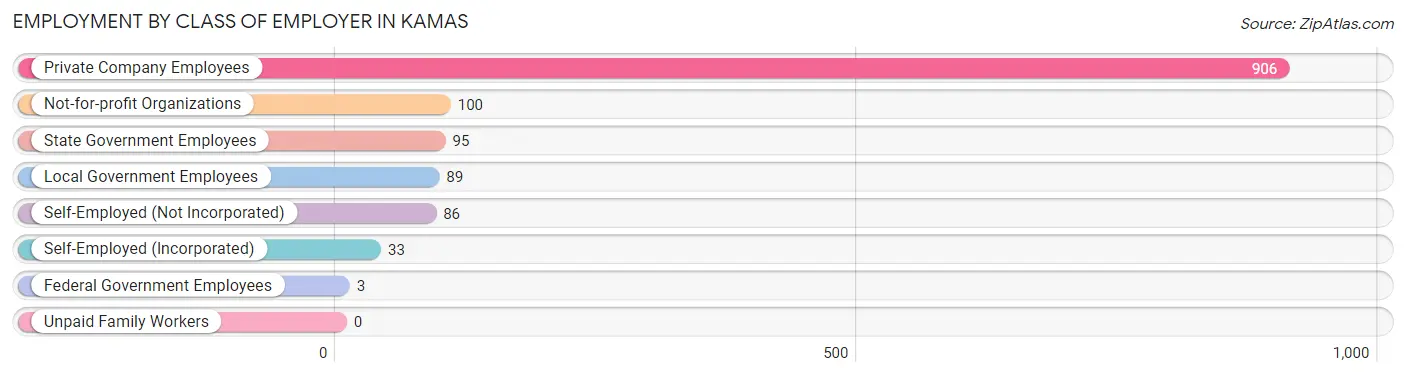
| Employer Class | # Employees | % Employees |
| Private Company Employees | 906 | 69.1% |
| Self-Employed (Incorporated) | 33 | 2.5% |
| Self-Employed (Not Incorporated) | 86 | 6.6% |
| Not-for-profit Organizations | 100 | 7.6% |
| Local Government Employees | 89 | 6.8% |
| State Government Employees | 95 | 7.2% |
| Federal Government Employees | 3 | 0.2% |
| Unpaid Family Workers | 0 | 0.0% |
| Total | 1,312 | 100.0% |
Employment Status by Age in Kamas
According to the labor force statistics for Kamas, out of the total population over 16 years of age (1,650), 81.7% or 1,348 individuals are in the labor force, with 0.9% or 12 of them unemployed. The age group with the highest labor force participation rate is 20 to 24 years, with 94.1% or 159 individuals in the labor force. Within the labor force, the 55 to 59 years age range has the highest percentage of unemployed individuals, with 4.6% or 4 of them being unemployed.
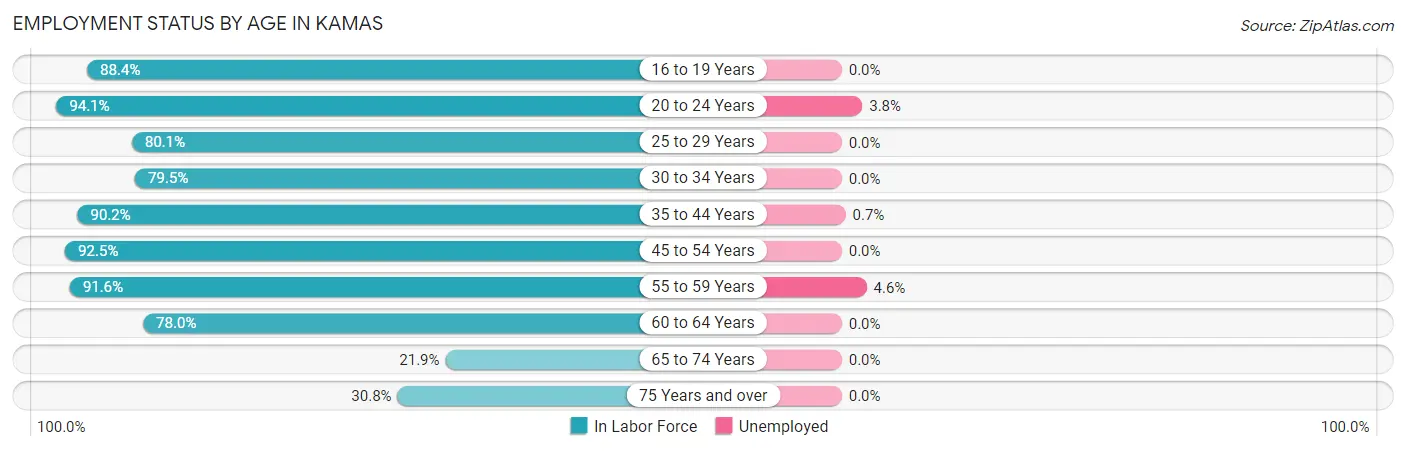
| Age Bracket | In Labor Force | Unemployed |
| 16 to 19 Years | 160 (88.4%) | 0 (0.0%) |
| 20 to 24 Years | 159 (94.1%) | 6 (3.8%) |
| 25 to 29 Years | 109 (80.1%) | 0 (0.0%) |
| 30 to 34 Years | 120 (79.5%) | 0 (0.0%) |
| 35 to 44 Years | 277 (90.2%) | 2 (0.7%) |
| 45 to 54 Years | 320 (92.5%) | 0 (0.0%) |
| 55 to 59 Years | 87 (91.6%) | 4 (4.6%) |
| 60 to 64 Years | 71 (78.0%) | 0 (0.0%) |
| 65 to 74 Years | 21 (21.9%) | 0 (0.0%) |
| 75 Years and over | 24 (30.8%) | 0 (0.0%) |
| Total | 1,348 (81.7%) | 12 (0.9%) |
Employment Status by Educational Attainment in Kamas
According to labor force statistics for Kamas, 87.4% of individuals (984) out of the total population between 25 and 64 years of age (1,126) are in the labor force, with 0.6% or 6 of them being unemployed. The group with the highest labor force participation rate are those with the educational attainment of bachelor's degree or higher, with 91.1% or 318 individuals in the labor force. Within the labor force, individuals with bachelor's degree or higher education have the highest percentage of unemployment, with 1.9% or 6 of them being unemployed.
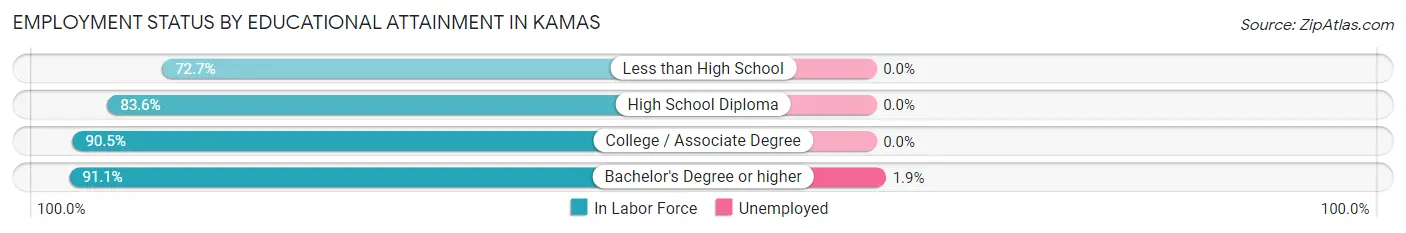
| Educational Attainment | In Labor Force | Unemployed |
| Less than High School | 72 (72.7%) | 0 (0.0%) |
| High School Diploma | 240 (83.6%) | 0 (0.0%) |
| College / Associate Degree | 354 (90.5%) | 0 (0.0%) |
| Bachelor's Degree or higher | 318 (91.1%) | 7 (1.9%) |
| Total | 984 (87.4%) | 7 (0.6%) |
Employment Occupations by Sex in Kamas
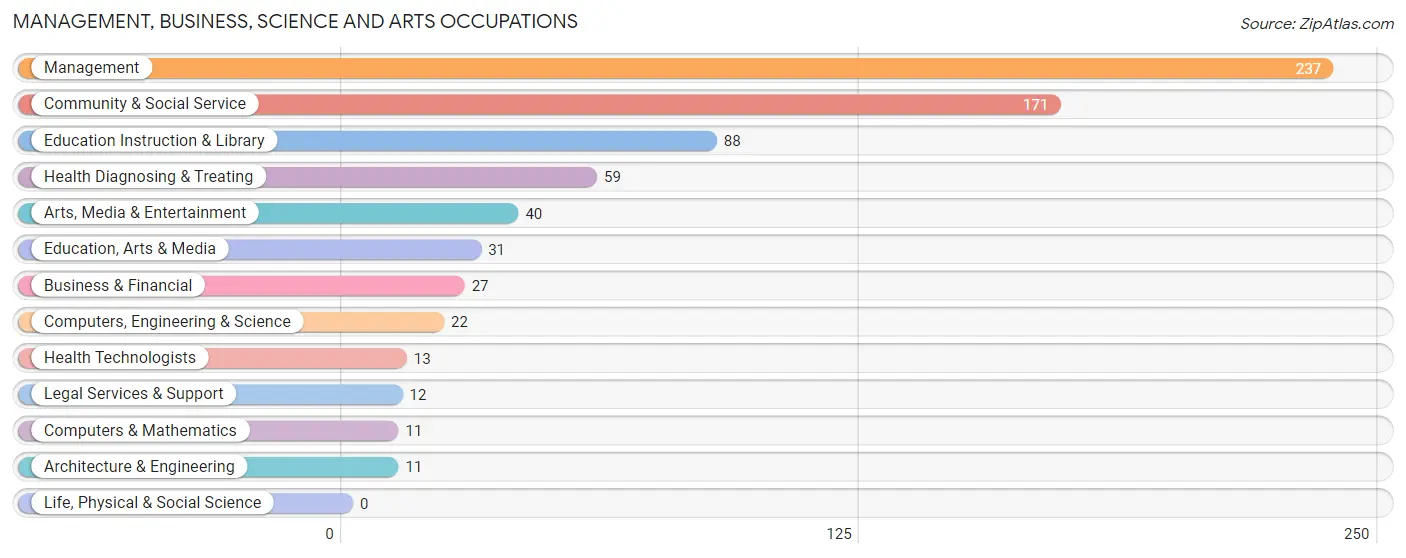
Management, Business, Science and Arts Occupations
The most common Management, Business, Science and Arts occupations in Kamas are Management (237 | 17.7%), Community & Social Service (171 | 12.8%), Education Instruction & Library (88 | 6.6%), Health Diagnosing & Treating (59 | 4.4%), and Arts, Media & Entertainment (40 | 3.0%).
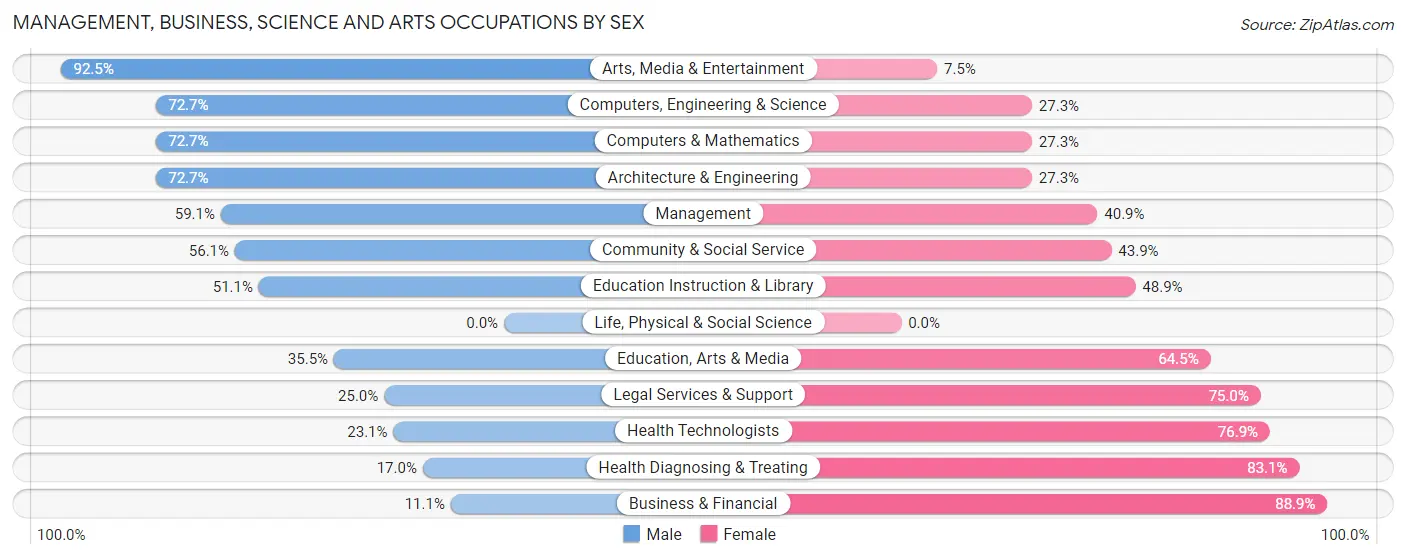
Management, Business, Science and Arts Occupations by Sex
Within the Management, Business, Science and Arts occupations in Kamas, the most male-oriented occupations are Arts, Media & Entertainment (92.5%), Computers, Engineering & Science (72.7%), and Computers & Mathematics (72.7%), while the most female-oriented occupations are Business & Financial (88.9%), Health Diagnosing & Treating (83.1%), and Health Technologists (76.9%).
| Occupation | Male | Female |
| Management | 140 (59.1%) | 97 (40.9%) |
| Business & Financial | 3 (11.1%) | 24 (88.9%) |
| Computers, Engineering & Science | 16 (72.7%) | 6 (27.3%) |
| Computers & Mathematics | 8 (72.7%) | 3 (27.3%) |
| Architecture & Engineering | 8 (72.7%) | 3 (27.3%) |
| Life, Physical & Social Science | 0 (0.0%) | 0 (0.0%) |
| Community & Social Service | 96 (56.1%) | 75 (43.9%) |
| Education, Arts & Media | 11 (35.5%) | 20 (64.5%) |
| Legal Services & Support | 3 (25.0%) | 9 (75.0%) |
| Education Instruction & Library | 45 (51.1%) | 43 (48.9%) |
| Arts, Media & Entertainment | 37 (92.5%) | 3 (7.5%) |
| Health Diagnosing & Treating | 10 (17.0%) | 49 (83.1%) |
| Health Technologists | 3 (23.1%) | 10 (76.9%) |
| Total (Category) | 265 (51.4%) | 251 (48.6%) |
| Total (Overall) | 715 (53.5%) | 621 (46.5%) |
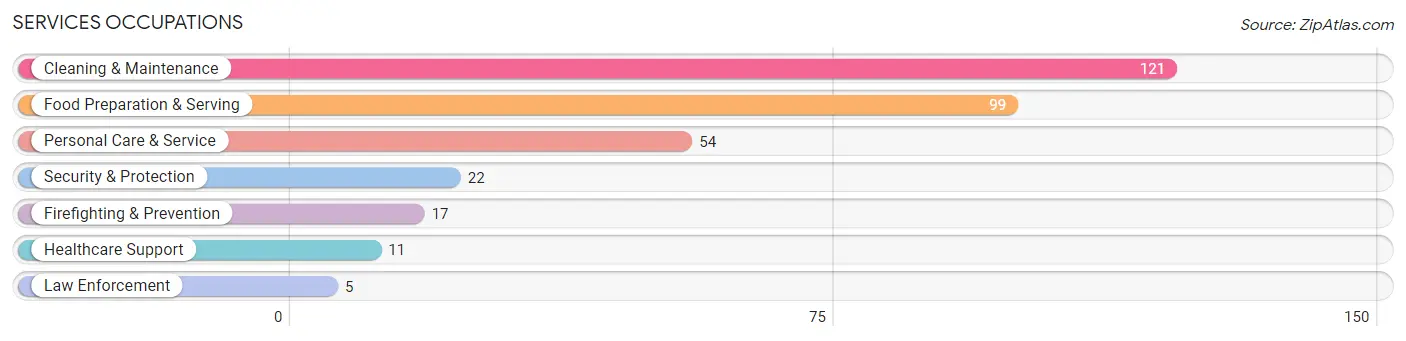
Services Occupations
The most common Services occupations in Kamas are Cleaning & Maintenance (121 | 9.1%), Food Preparation & Serving (99 | 7.4%), Personal Care & Service (54 | 4.0%), Security & Protection (22 | 1.7%), and Firefighting & Prevention (17 | 1.3%).
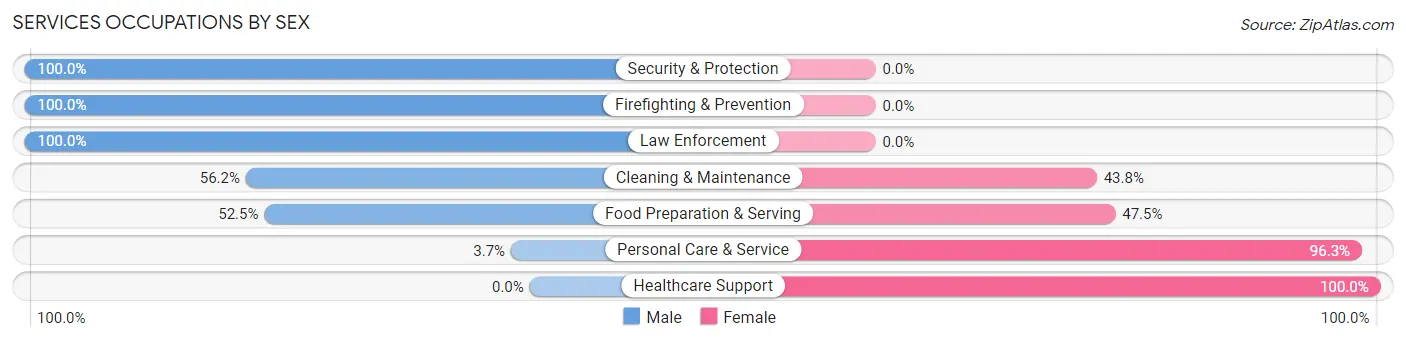
Services Occupations by Sex
Within the Services occupations in Kamas, the most male-oriented occupations are Security & Protection (100.0%), Firefighting & Prevention (100.0%), and Law Enforcement (100.0%), while the most female-oriented occupations are Healthcare Support (100.0%), Personal Care & Service (96.3%), and Food Preparation & Serving (47.5%).
| Occupation | Male | Female |
| Healthcare Support | 0 (0.0%) | 11 (100.0%) |
| Security & Protection | 22 (100.0%) | 0 (0.0%) |
| Firefighting & Prevention | 17 (100.0%) | 0 (0.0%) |
| Law Enforcement | 5 (100.0%) | 0 (0.0%) |
| Food Preparation & Serving | 52 (52.5%) | 47 (47.5%) |
| Cleaning & Maintenance | 68 (56.2%) | 53 (43.8%) |
| Personal Care & Service | 2 (3.7%) | 52 (96.3%) |
| Total (Category) | 144 (46.9%) | 163 (53.1%) |
| Total (Overall) | 715 (53.5%) | 621 (46.5%) |
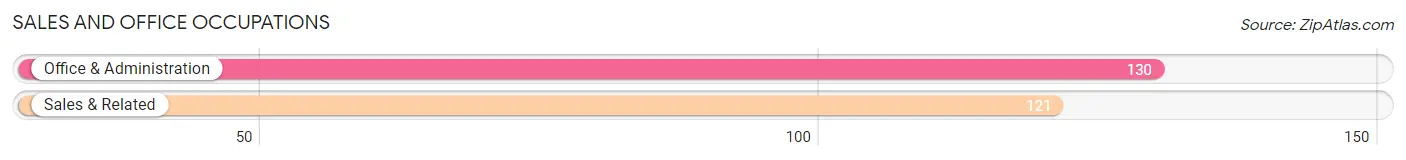
Sales and Office Occupations
The most common Sales and Office occupations in Kamas are Office & Administration (130 | 9.7%), and Sales & Related (121 | 9.1%).
Sales and Office Occupations by Sex
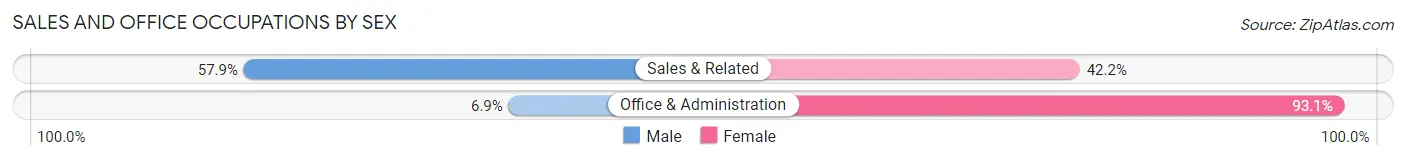
| Occupation | Male | Female |
| Sales & Related | 70 (57.9%) | 51 (42.1%) |
| Office & Administration | 9 (6.9%) | 121 (93.1%) |
| Total (Category) | 79 (31.5%) | 172 (68.5%) |
| Total (Overall) | 715 (53.5%) | 621 (46.5%) |
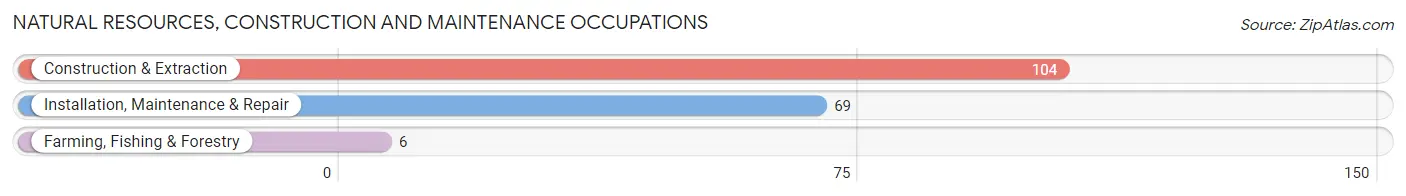
Natural Resources, Construction and Maintenance Occupations
The most common Natural Resources, Construction and Maintenance occupations in Kamas are Construction & Extraction (104 | 7.8%), Installation, Maintenance & Repair (69 | 5.2%), and Farming, Fishing & Forestry (6 | 0.4%).
Natural Resources, Construction and Maintenance Occupations by Sex
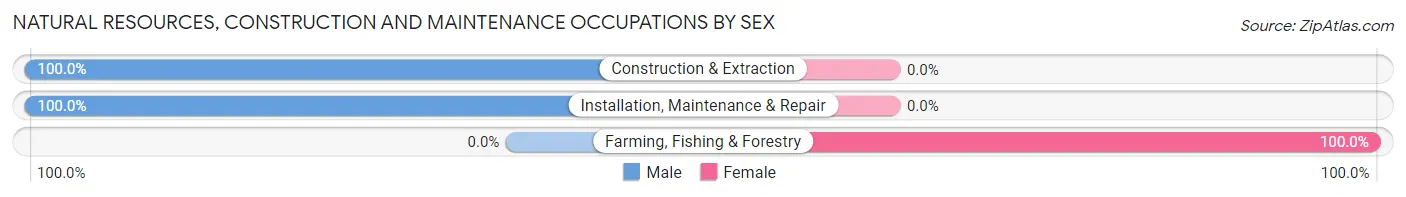
| Occupation | Male | Female |
| Farming, Fishing & Forestry | 0 (0.0%) | 6 (100.0%) |
| Construction & Extraction | 104 (100.0%) | 0 (0.0%) |
| Installation, Maintenance & Repair | 69 (100.0%) | 0 (0.0%) |
| Total (Category) | 173 (96.7%) | 6 (3.4%) |
| Total (Overall) | 715 (53.5%) | 621 (46.5%) |
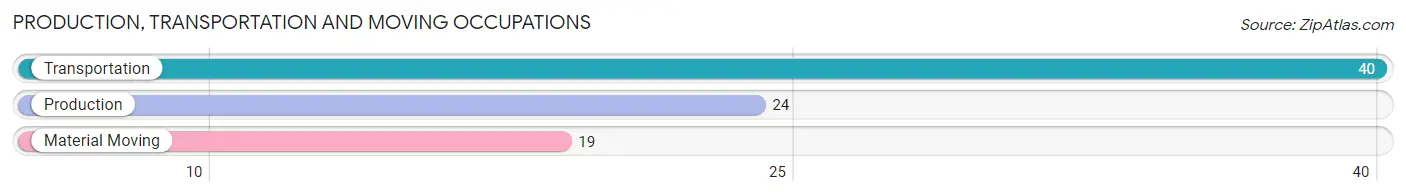
Production, Transportation and Moving Occupations
The most common Production, Transportation and Moving occupations in Kamas are Transportation (40 | 3.0%), Production (24 | 1.8%), and Material Moving (19 | 1.4%).
Production, Transportation and Moving Occupations by Sex
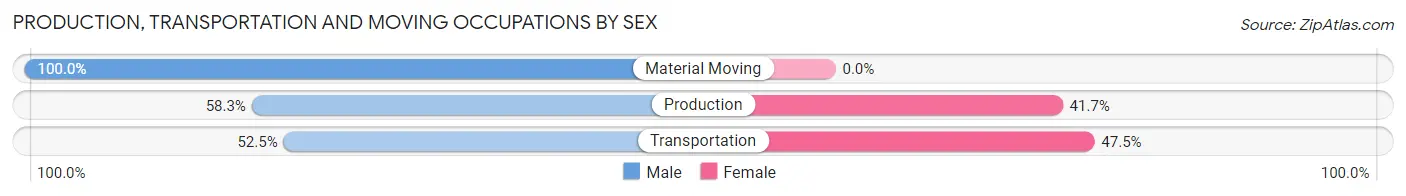
| Occupation | Male | Female |
| Production | 14 (58.3%) | 10 (41.7%) |
| Transportation | 21 (52.5%) | 19 (47.5%) |
| Material Moving | 19 (100.0%) | 0 (0.0%) |
| Total (Category) | 54 (65.1%) | 29 (34.9%) |
| Total (Overall) | 715 (53.5%) | 621 (46.5%) |
Employment Industries by Sex in Kamas
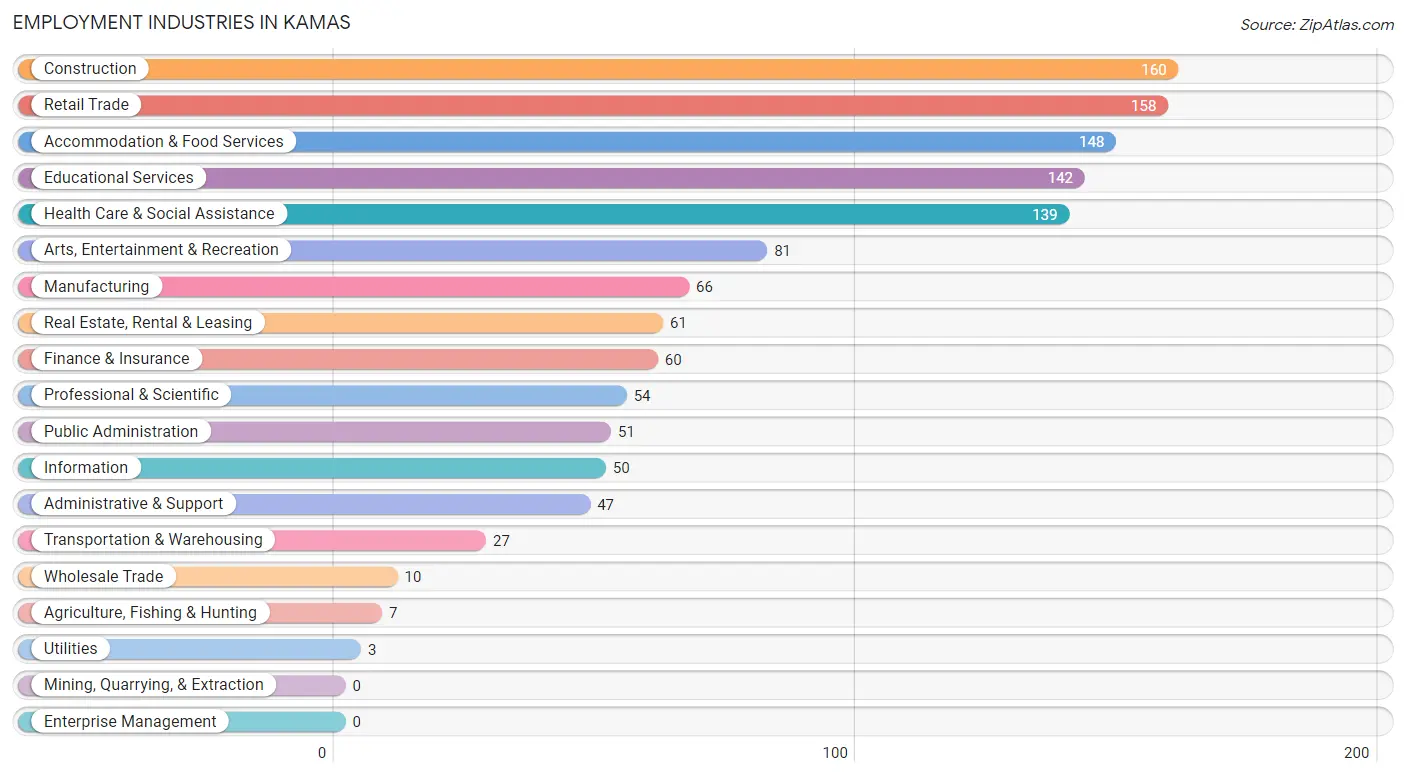
Employment Industries in Kamas
The major employment industries in Kamas include Construction (160 | 12.0%), Retail Trade (158 | 11.8%), Accommodation & Food Services (148 | 11.1%), Educational Services (142 | 10.6%), and Health Care & Social Assistance (139 | 10.4%).
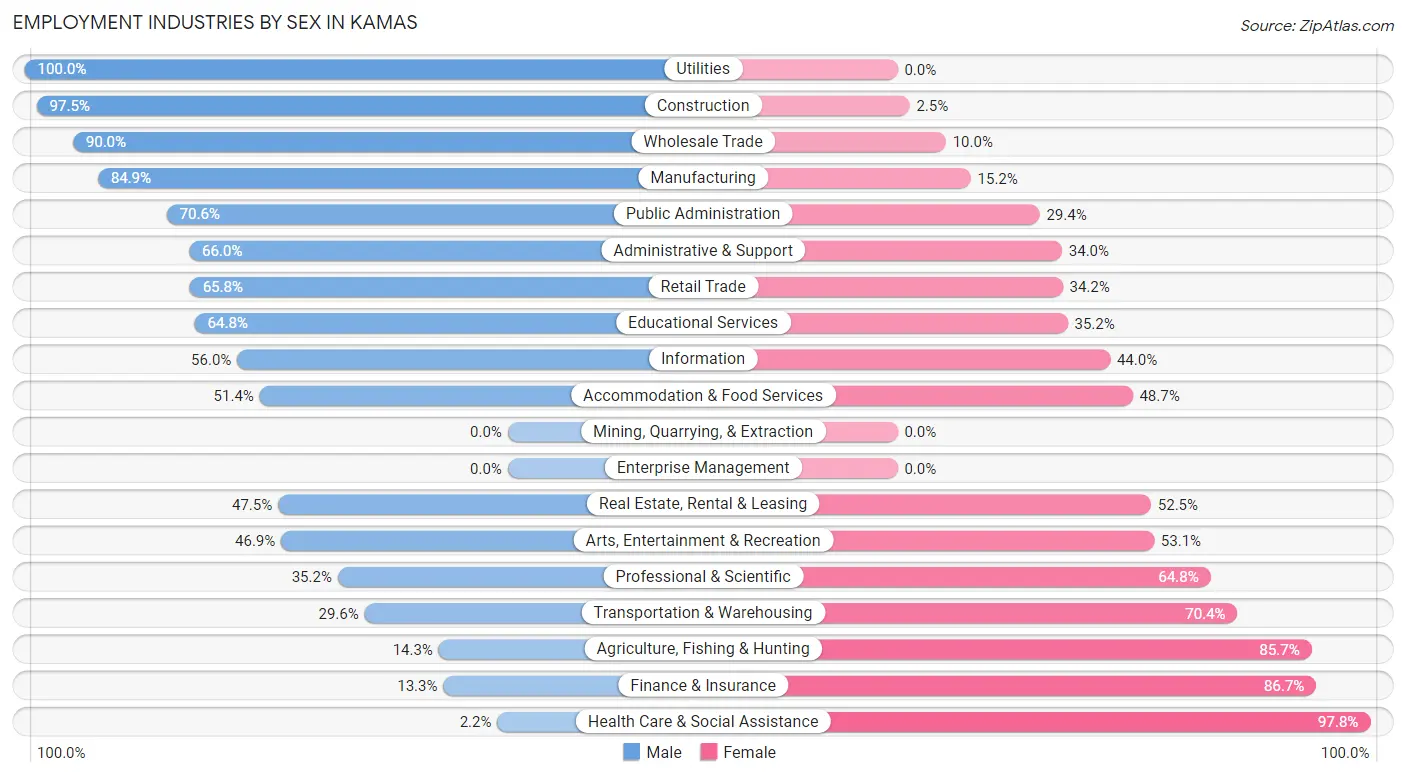
Employment Industries by Sex in Kamas
The Kamas industries that see more men than women are Utilities (100.0%), Construction (97.5%), and Wholesale Trade (90.0%), whereas the industries that tend to have a higher number of women are Health Care & Social Assistance (97.8%), Finance & Insurance (86.7%), and Agriculture, Fishing & Hunting (85.7%).
| Industry | Male | Female |
| Agriculture, Fishing & Hunting | 1 (14.3%) | 6 (85.7%) |
| Mining, Quarrying, & Extraction | 0 (0.0%) | 0 (0.0%) |
| Construction | 156 (97.5%) | 4 (2.5%) |
| Manufacturing | 56 (84.9%) | 10 (15.1%) |
| Wholesale Trade | 9 (90.0%) | 1 (10.0%) |
| Retail Trade | 104 (65.8%) | 54 (34.2%) |
| Transportation & Warehousing | 8 (29.6%) | 19 (70.4%) |
| Utilities | 3 (100.0%) | 0 (0.0%) |
| Information | 28 (56.0%) | 22 (44.0%) |
| Finance & Insurance | 8 (13.3%) | 52 (86.7%) |
| Real Estate, Rental & Leasing | 29 (47.5%) | 32 (52.5%) |
| Professional & Scientific | 19 (35.2%) | 35 (64.8%) |
| Enterprise Management | 0 (0.0%) | 0 (0.0%) |
| Administrative & Support | 31 (66.0%) | 16 (34.0%) |
| Educational Services | 92 (64.8%) | 50 (35.2%) |
| Health Care & Social Assistance | 3 (2.2%) | 136 (97.8%) |
| Arts, Entertainment & Recreation | 38 (46.9%) | 43 (53.1%) |
| Accommodation & Food Services | 76 (51.3%) | 72 (48.6%) |
| Public Administration | 36 (70.6%) | 15 (29.4%) |
| Total | 715 (53.5%) | 621 (46.5%) |
Education in Kamas
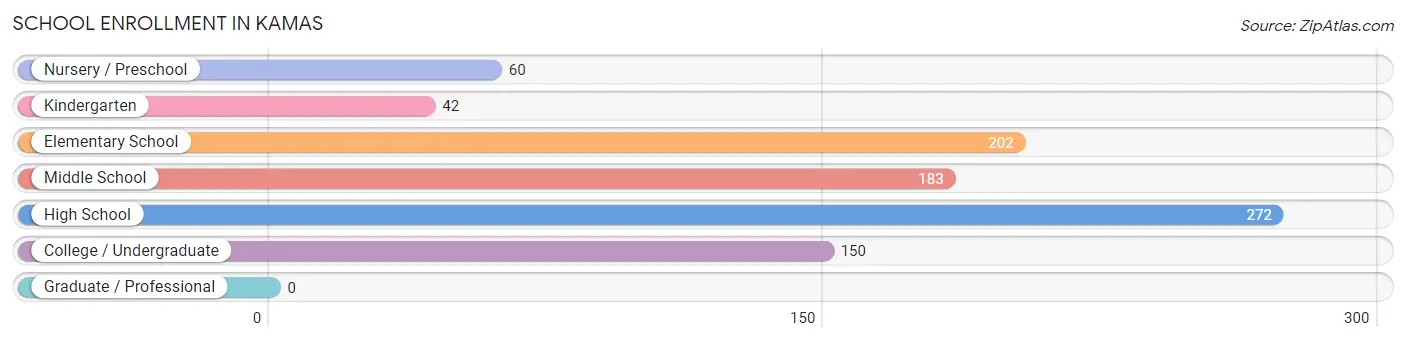
School Enrollment in Kamas
The most common levels of schooling among the 909 students in Kamas are high school (272 | 29.9%), elementary school (202 | 22.2%), and middle school (183 | 20.1%).
| School Level | # Students | % Students |
| Nursery / Preschool | 60 | 6.6% |
| Kindergarten | 42 | 4.6% |
| Elementary School | 202 | 22.2% |
| Middle School | 183 | 20.1% |
| High School | 272 | 29.9% |
| College / Undergraduate | 150 | 16.5% |
| Graduate / Professional | 0 | 0.0% |
| Total | 909 | 100.0% |
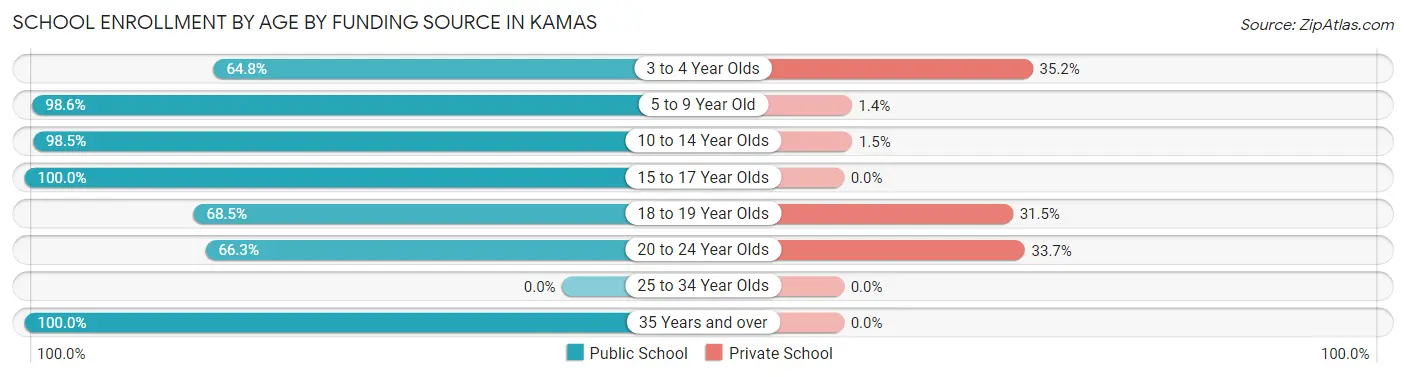
School Enrollment by Age by Funding Source in Kamas
Out of a total of 909 students who are enrolled in schools in Kamas, 74 (8.1%) attend a private institution, while the remaining 835 (91.9%) are enrolled in public schools. The age group of 3 to 4 year olds has the highest likelihood of being enrolled in private schools, with 19 (35.2% in the age bracket) enrolled. Conversely, the age group of 15 to 17 year olds has the lowest likelihood of being enrolled in a private school, with 201 (100.0% in the age bracket) attending a public institution.
| Age Bracket | Public School | Private School |
| 3 to 4 Year Olds | 35 (64.8%) | 19 (35.2%) |
| 5 to 9 Year Old | 205 (98.6%) | 3 (1.4%) |
| 10 to 14 Year Olds | 255 (98.5%) | 4 (1.5%) |
| 15 to 17 Year Olds | 201 (100.0%) | 0 (0.0%) |
| 18 to 19 Year Olds | 37 (68.5%) | 17 (31.5%) |
| 20 to 24 Year Olds | 61 (66.3%) | 31 (33.7%) |
| 25 to 34 Year Olds | 0 (0.0%) | 0 (0.0%) |
| 35 Years and over | 41 (100.0%) | 0 (0.0%) |
| Total | 835 (91.9%) | 74 (8.1%) |
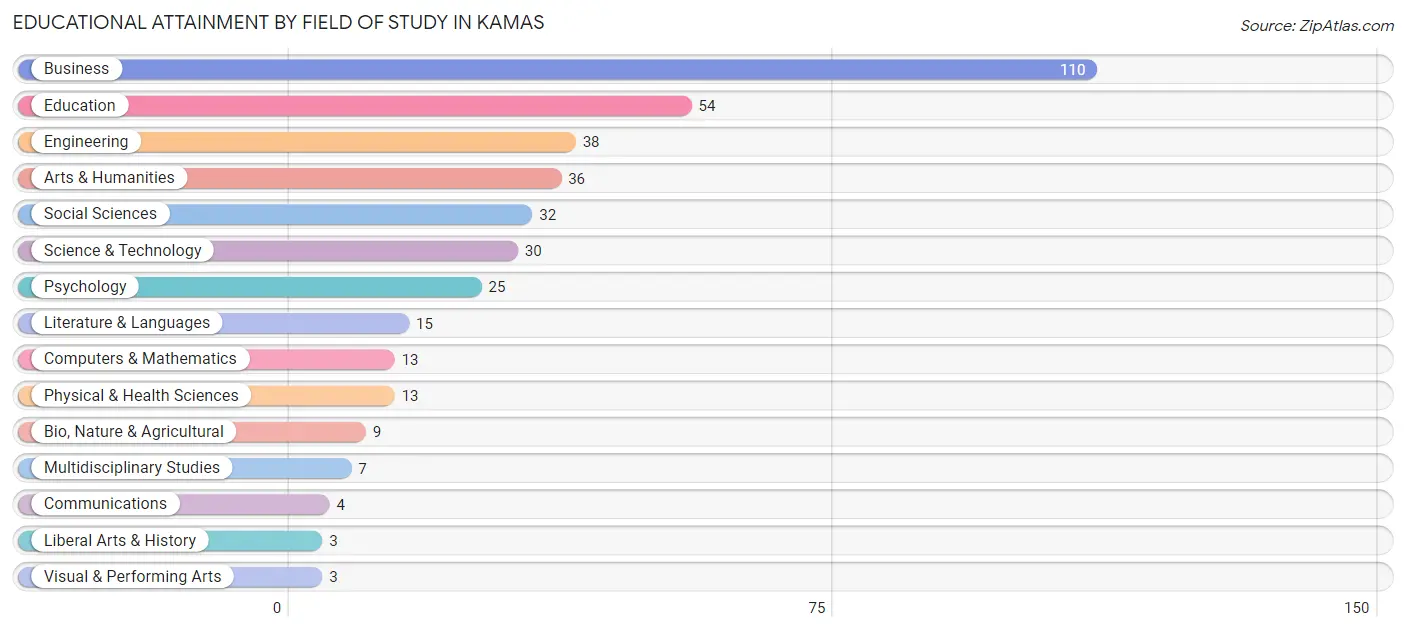
Educational Attainment by Field of Study in Kamas
Business (110 | 28.1%), education (54 | 13.8%), engineering (38 | 9.7%), arts & humanities (36 | 9.2%), and social sciences (32 | 8.2%) are the most common fields of study among 392 individuals in Kamas who have obtained a bachelor's degree or higher.
| Field of Study | # Graduates | % Graduates |
| Computers & Mathematics | 13 | 3.3% |
| Bio, Nature & Agricultural | 9 | 2.3% |
| Physical & Health Sciences | 13 | 3.3% |
| Psychology | 25 | 6.4% |
| Social Sciences | 32 | 8.2% |
| Engineering | 38 | 9.7% |
| Multidisciplinary Studies | 7 | 1.8% |
| Science & Technology | 30 | 7.6% |
| Business | 110 | 28.1% |
| Education | 54 | 13.8% |
| Literature & Languages | 15 | 3.8% |
| Liberal Arts & History | 3 | 0.8% |
| Visual & Performing Arts | 3 | 0.8% |
| Communications | 4 | 1.0% |
| Arts & Humanities | 36 | 9.2% |
| Total | 392 | 100.0% |
Transportation & Commute in Kamas
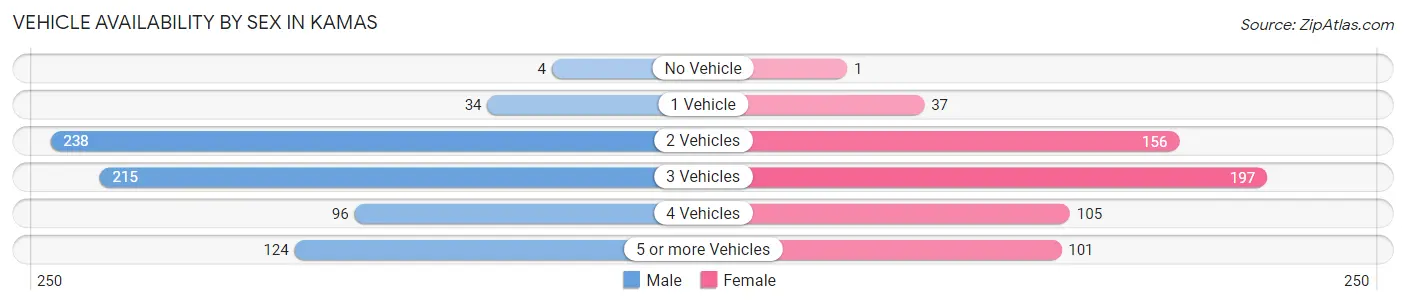
Vehicle Availability by Sex in Kamas
The most prevalent vehicle ownership categories in Kamas are males with 2 vehicles (238, accounting for 33.5%) and females with 2 vehicles (156, making up 39.9%).
| Vehicles Available | Male | Female |
| No Vehicle | 4 (0.6%) | 1 (0.2%) |
| 1 Vehicle | 34 (4.8%) | 37 (6.2%) |
| 2 Vehicles | 238 (33.5%) | 156 (26.1%) |
| 3 Vehicles | 215 (30.2%) | 197 (33.0%) |
| 4 Vehicles | 96 (13.5%) | 105 (17.6%) |
| 5 or more Vehicles | 124 (17.4%) | 101 (16.9%) |
| Total | 711 (100.0%) | 597 (100.0%) |
Commute Time in Kamas
The most frequently occuring commute durations in Kamas are 20 to 24 minutes (209 commuters, 17.1%), 30 to 34 minutes (183 commuters, 15.0%), and 45 to 59 minutes (150 commuters, 12.3%).
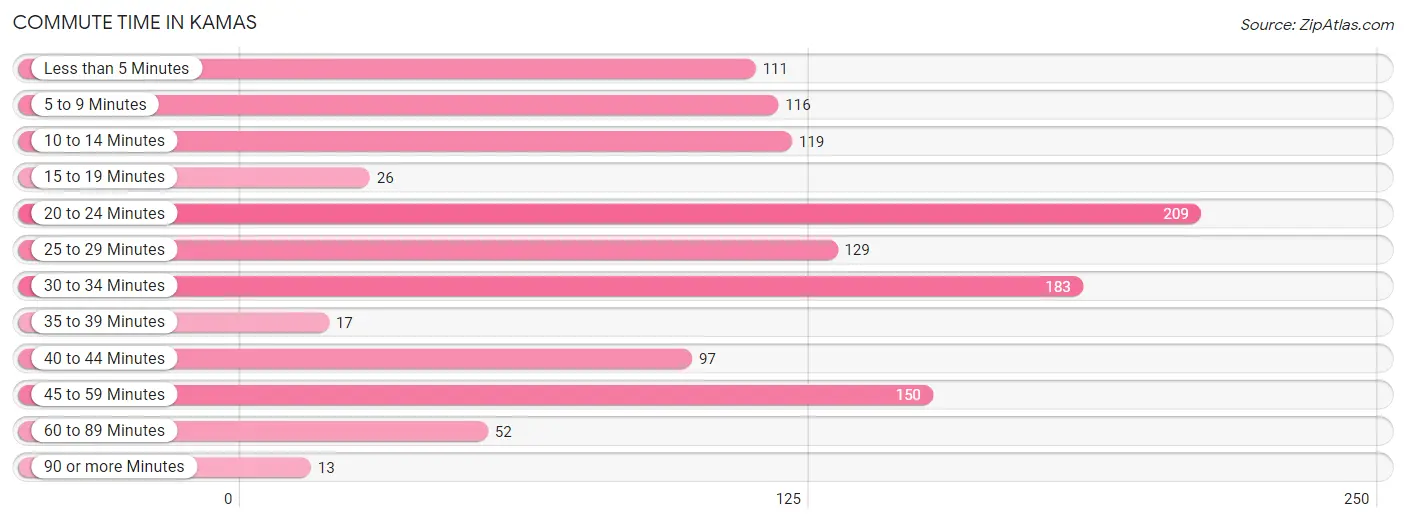
| Commute Time | # Commuters | % Commuters |
| Less than 5 Minutes | 111 | 9.1% |
| 5 to 9 Minutes | 116 | 9.5% |
| 10 to 14 Minutes | 119 | 9.7% |
| 15 to 19 Minutes | 26 | 2.1% |
| 20 to 24 Minutes | 209 | 17.1% |
| 25 to 29 Minutes | 129 | 10.6% |
| 30 to 34 Minutes | 183 | 15.0% |
| 35 to 39 Minutes | 17 | 1.4% |
| 40 to 44 Minutes | 97 | 7.9% |
| 45 to 59 Minutes | 150 | 12.3% |
| 60 to 89 Minutes | 52 | 4.3% |
| 90 or more Minutes | 13 | 1.1% |
Commute Time by Sex in Kamas
The most common commute times in Kamas are 30 to 34 minutes (143 commuters, 20.7%) for males and 20 to 24 minutes (118 commuters, 22.2%) for females.
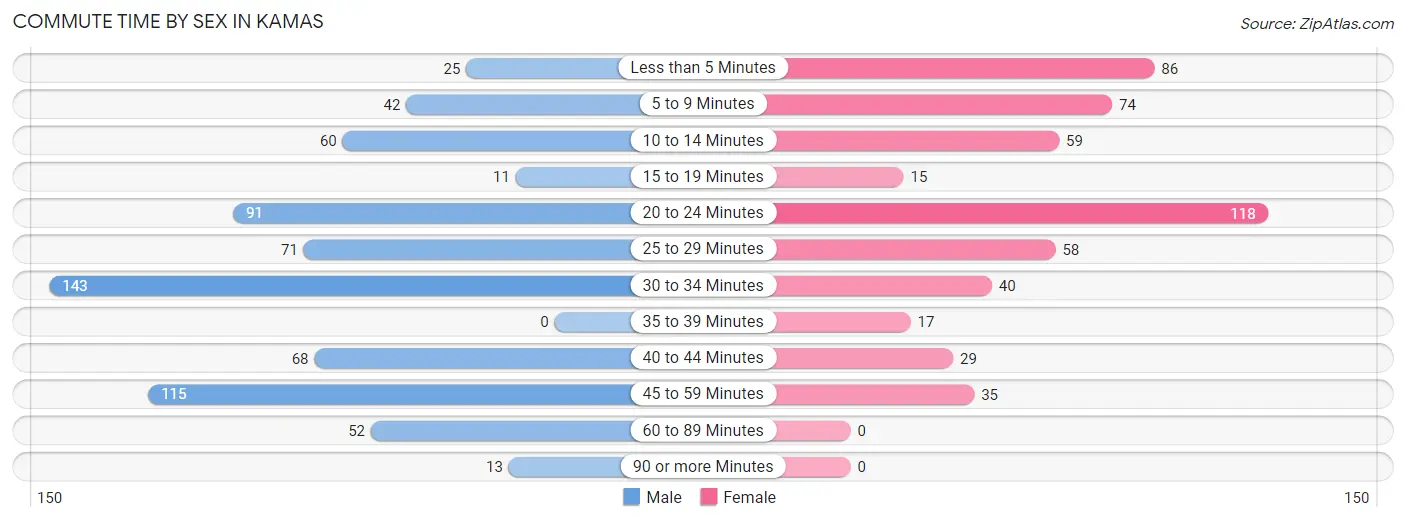
| Commute Time | Male | Female |
| Less than 5 Minutes | 25 (3.6%) | 86 (16.2%) |
| 5 to 9 Minutes | 42 (6.1%) | 74 (13.9%) |
| 10 to 14 Minutes | 60 (8.7%) | 59 (11.1%) |
| 15 to 19 Minutes | 11 (1.6%) | 15 (2.8%) |
| 20 to 24 Minutes | 91 (13.2%) | 118 (22.2%) |
| 25 to 29 Minutes | 71 (10.3%) | 58 (10.9%) |
| 30 to 34 Minutes | 143 (20.7%) | 40 (7.5%) |
| 35 to 39 Minutes | 0 (0.0%) | 17 (3.2%) |
| 40 to 44 Minutes | 68 (9.8%) | 29 (5.5%) |
| 45 to 59 Minutes | 115 (16.6%) | 35 (6.6%) |
| 60 to 89 Minutes | 52 (7.5%) | 0 (0.0%) |
| 90 or more Minutes | 13 (1.9%) | 0 (0.0%) |
Time of Departure to Work by Sex in Kamas
The most frequent times of departure to work in Kamas are 5:00 AM to 5:29 AM (89, 12.9%) for males and 7:30 AM to 7:59 AM (80, 15.1%) for females.
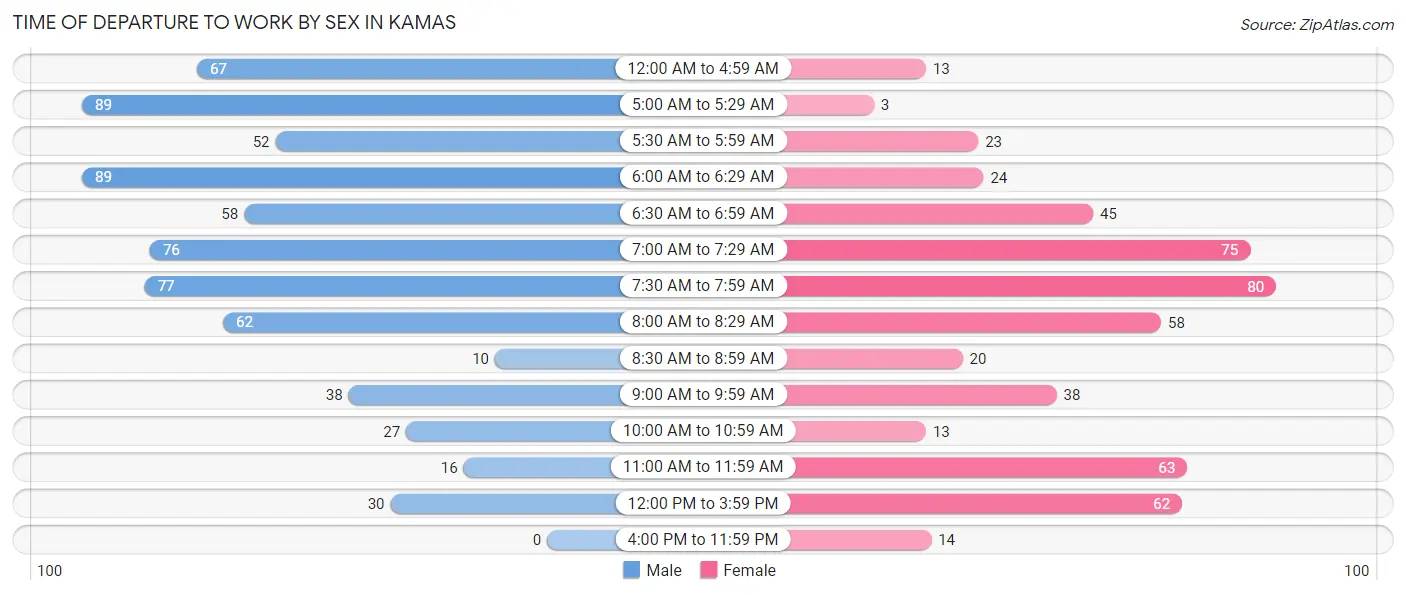
| Time of Departure | Male | Female |
| 12:00 AM to 4:59 AM | 67 (9.7%) | 13 (2.5%) |
| 5:00 AM to 5:29 AM | 89 (12.9%) | 3 (0.6%) |
| 5:30 AM to 5:59 AM | 52 (7.5%) | 23 (4.3%) |
| 6:00 AM to 6:29 AM | 89 (12.9%) | 24 (4.5%) |
| 6:30 AM to 6:59 AM | 58 (8.4%) | 45 (8.5%) |
| 7:00 AM to 7:29 AM | 76 (11.0%) | 75 (14.1%) |
| 7:30 AM to 7:59 AM | 77 (11.1%) | 80 (15.1%) |
| 8:00 AM to 8:29 AM | 62 (9.0%) | 58 (10.9%) |
| 8:30 AM to 8:59 AM | 10 (1.5%) | 20 (3.8%) |
| 9:00 AM to 9:59 AM | 38 (5.5%) | 38 (7.2%) |
| 10:00 AM to 10:59 AM | 27 (3.9%) | 13 (2.5%) |
| 11:00 AM to 11:59 AM | 16 (2.3%) | 63 (11.9%) |
| 12:00 PM to 3:59 PM | 30 (4.3%) | 62 (11.7%) |
| 4:00 PM to 11:59 PM | 0 (0.0%) | 14 (2.6%) |
| Total | 691 (100.0%) | 531 (100.0%) |
Housing Occupancy in Kamas
Occupancy by Ownership in Kamas
Of the total 576 dwellings in Kamas, owner-occupied units account for 471 (81.8%), while renter-occupied units make up 105 (18.2%).
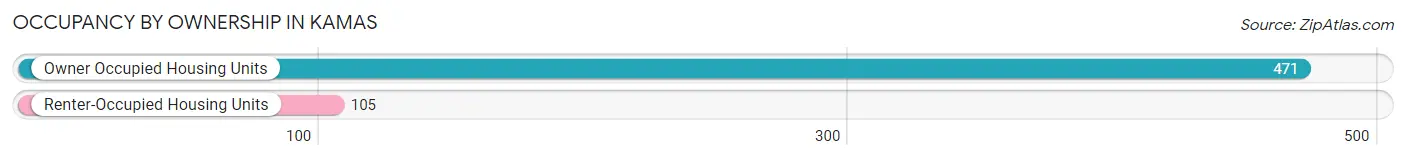
| Occupancy | # Housing Units | % Housing Units |
| Owner Occupied Housing Units | 471 | 81.8% |
| Renter-Occupied Housing Units | 105 | 18.2% |
| Total Occupied Housing Units | 576 | 100.0% |
Occupancy by Household Size in Kamas
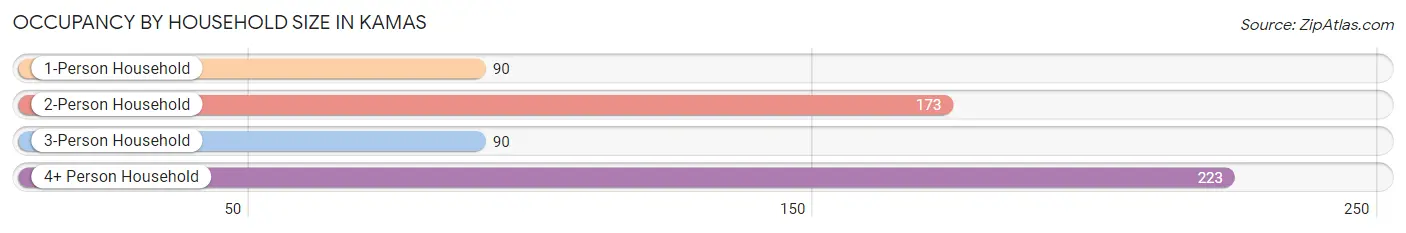
| Household Size | # Housing Units | % Housing Units |
| 1-Person Household | 90 | 15.6% |
| 2-Person Household | 173 | 30.0% |
| 3-Person Household | 90 | 15.6% |
| 4+ Person Household | 223 | 38.7% |
| Total Housing Units | 576 | 100.0% |
Occupancy by Ownership by Household Size in Kamas
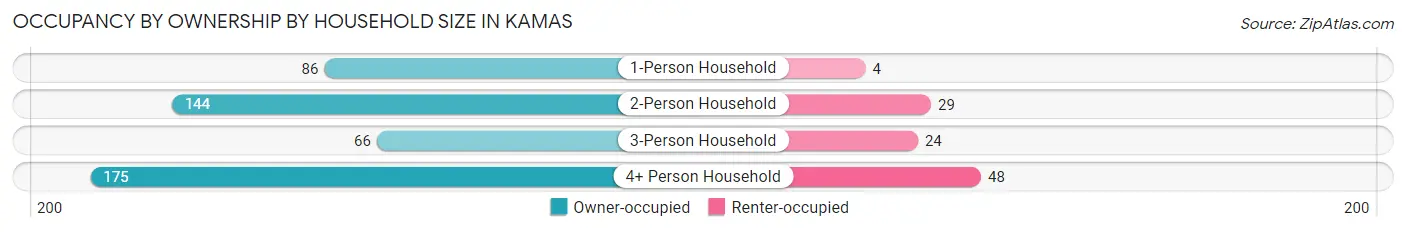
| Household Size | Owner-occupied | Renter-occupied |
| 1-Person Household | 86 (95.6%) | 4 (4.4%) |
| 2-Person Household | 144 (83.2%) | 29 (16.8%) |
| 3-Person Household | 66 (73.3%) | 24 (26.7%) |
| 4+ Person Household | 175 (78.5%) | 48 (21.5%) |
| Total Housing Units | 471 (81.8%) | 105 (18.2%) |
Occupancy by Educational Attainment in Kamas
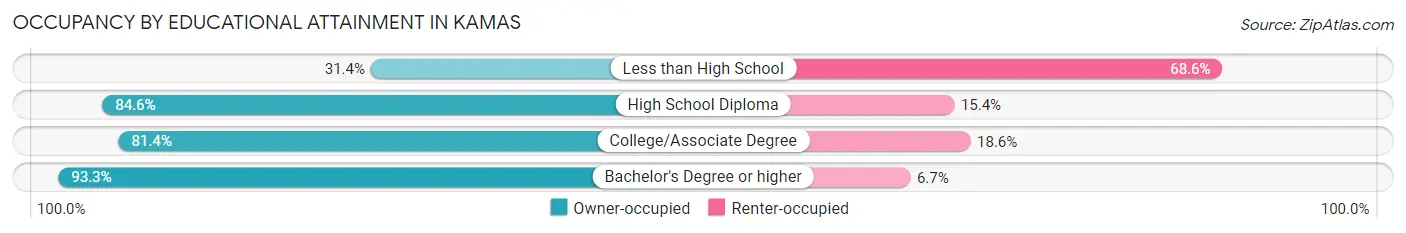
| Household Size | Owner-occupied | Renter-occupied |
| Less than High School | 16 (31.4%) | 35 (68.6%) |
| High School Diploma | 170 (84.6%) | 31 (15.4%) |
| College/Associate Degree | 118 (81.4%) | 27 (18.6%) |
| Bachelor's Degree or higher | 167 (93.3%) | 12 (6.7%) |
Occupancy by Age of Householder in Kamas
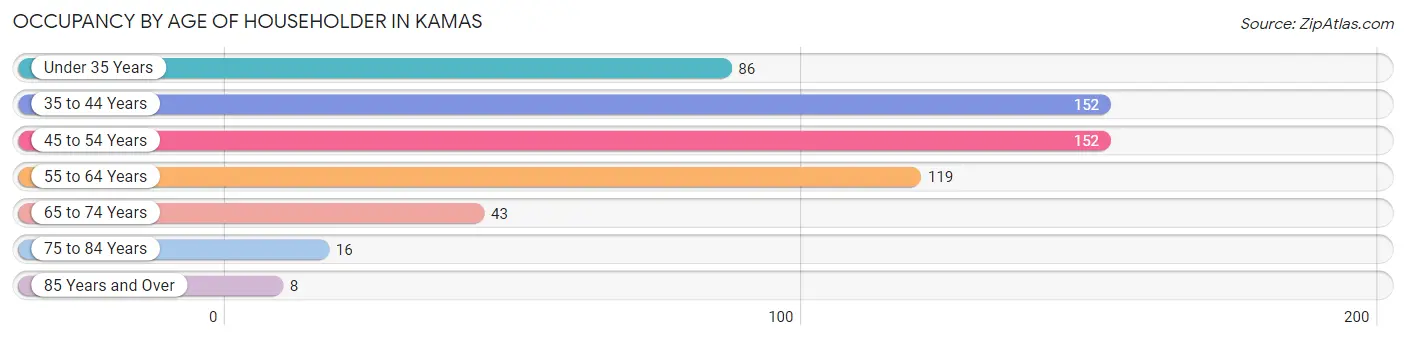
| Age Bracket | # Households | % Households |
| Under 35 Years | 86 | 14.9% |
| 35 to 44 Years | 152 | 26.4% |
| 45 to 54 Years | 152 | 26.4% |
| 55 to 64 Years | 119 | 20.7% |
| 65 to 74 Years | 43 | 7.5% |
| 75 to 84 Years | 16 | 2.8% |
| 85 Years and Over | 8 | 1.4% |
| Total | 576 | 100.0% |
Housing Finances in Kamas
Median Income by Occupancy in Kamas
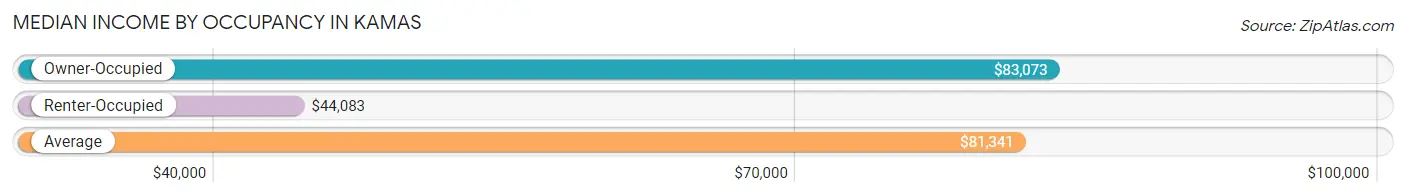
| Occupancy Type | # Households | Median Income |
| Owner-Occupied | 471 (81.8%) | $83,073 |
| Renter-Occupied | 105 (18.2%) | $44,083 |
| Average | 576 (100.0%) | $81,341 |
Occupancy by Householder Income Bracket in Kamas
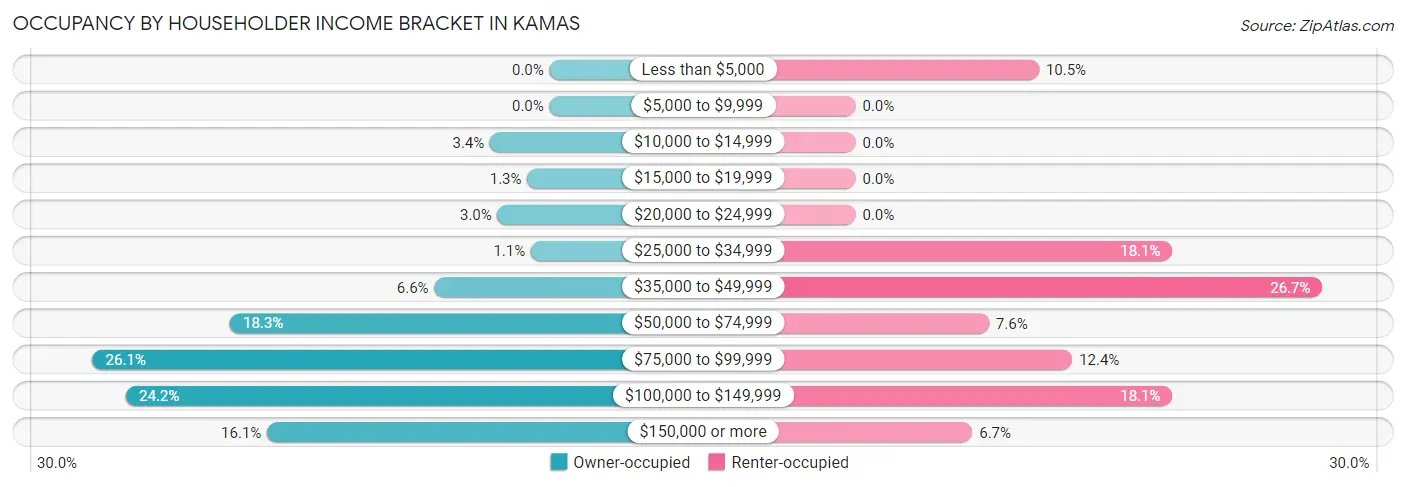
| Income Bracket | Owner-occupied | Renter-occupied |
| Less than $5,000 | 0 (0.0%) | 11 (10.5%) |
| $5,000 to $9,999 | 0 (0.0%) | 0 (0.0%) |
| $10,000 to $14,999 | 16 (3.4%) | 0 (0.0%) |
| $15,000 to $19,999 | 6 (1.3%) | 0 (0.0%) |
| $20,000 to $24,999 | 14 (3.0%) | 0 (0.0%) |
| $25,000 to $34,999 | 5 (1.1%) | 19 (18.1%) |
| $35,000 to $49,999 | 31 (6.6%) | 28 (26.7%) |
| $50,000 to $74,999 | 86 (18.3%) | 8 (7.6%) |
| $75,000 to $99,999 | 123 (26.1%) | 13 (12.4%) |
| $100,000 to $149,999 | 114 (24.2%) | 19 (18.1%) |
| $150,000 or more | 76 (16.1%) | 7 (6.7%) |
| Total | 471 (100.0%) | 105 (100.0%) |
Monthly Housing Cost Tiers in Kamas
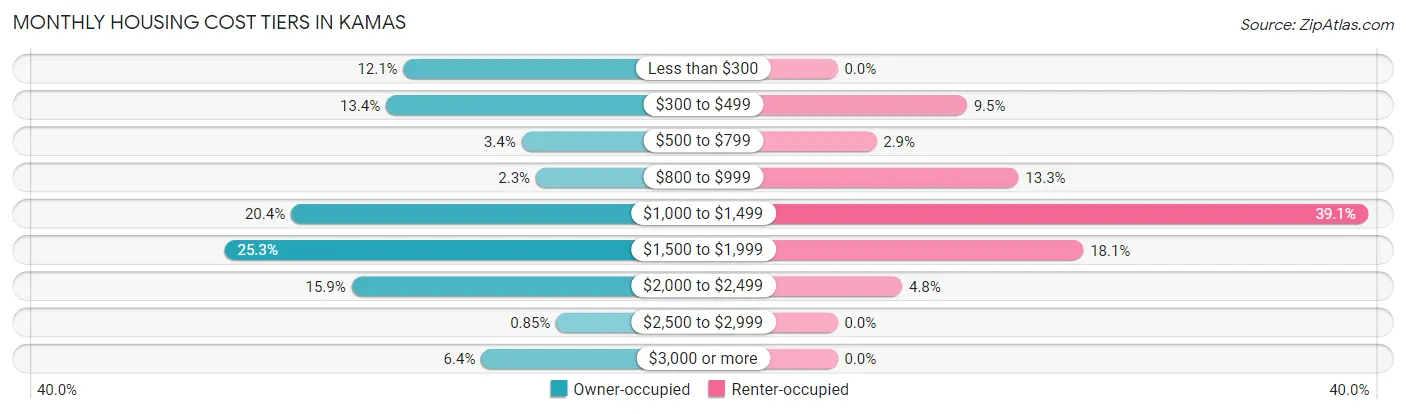
| Monthly Cost | Owner-occupied | Renter-occupied |
| Less than $300 | 57 (12.1%) | 0 (0.0%) |
| $300 to $499 | 63 (13.4%) | 10 (9.5%) |
| $500 to $799 | 16 (3.4%) | 3 (2.9%) |
| $800 to $999 | 11 (2.3%) | 14 (13.3%) |
| $1,000 to $1,499 | 96 (20.4%) | 41 (39.1%) |
| $1,500 to $1,999 | 119 (25.3%) | 19 (18.1%) |
| $2,000 to $2,499 | 75 (15.9%) | 5 (4.8%) |
| $2,500 to $2,999 | 4 (0.9%) | 0 (0.0%) |
| $3,000 or more | 30 (6.4%) | 0 (0.0%) |
| Total | 471 (100.0%) | 105 (100.0%) |
Physical Housing Characteristics in Kamas
Housing Structures in Kamas
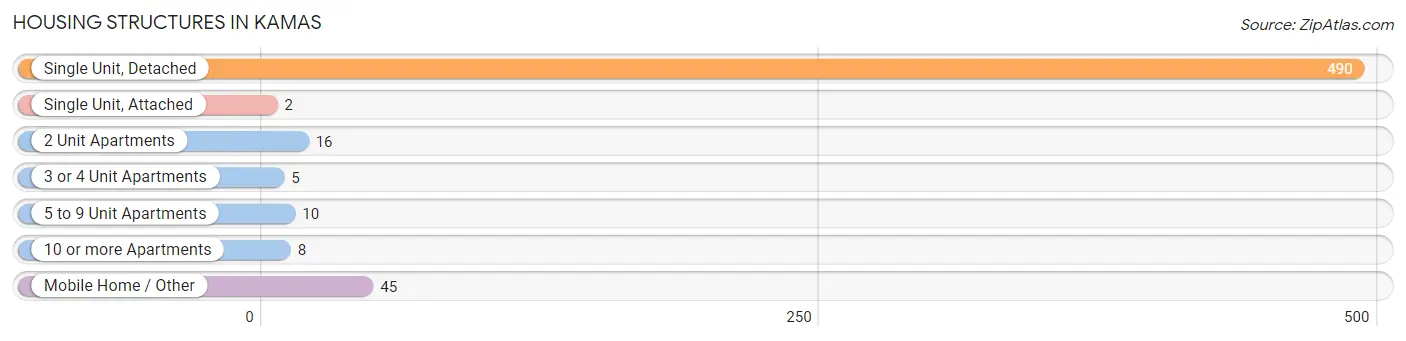
| Structure Type | # Housing Units | % Housing Units |
| Single Unit, Detached | 490 | 85.1% |
| Single Unit, Attached | 2 | 0.4% |
| 2 Unit Apartments | 16 | 2.8% |
| 3 or 4 Unit Apartments | 5 | 0.9% |
| 5 to 9 Unit Apartments | 10 | 1.7% |
| 10 or more Apartments | 8 | 1.4% |
| Mobile Home / Other | 45 | 7.8% |
| Total | 576 | 100.0% |
Housing Structures by Occupancy in Kamas
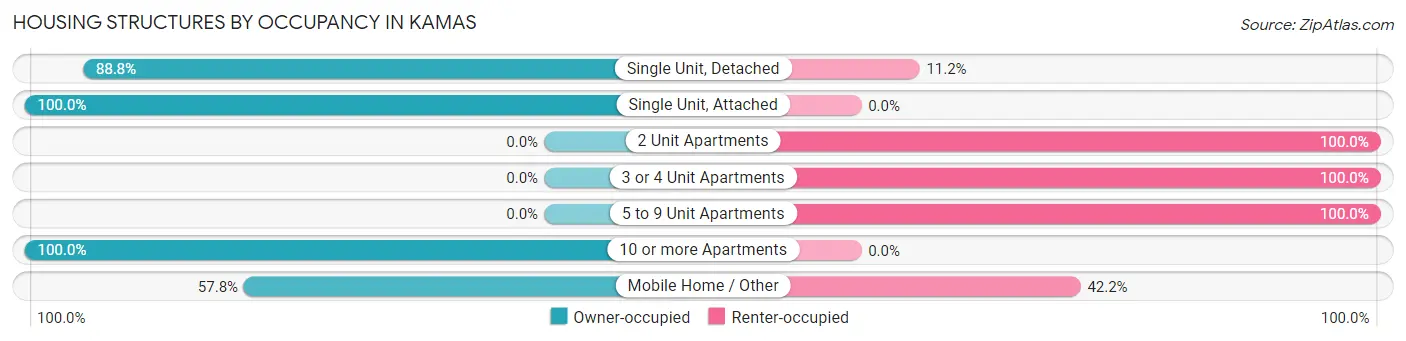
| Structure Type | Owner-occupied | Renter-occupied |
| Single Unit, Detached | 435 (88.8%) | 55 (11.2%) |
| Single Unit, Attached | 2 (100.0%) | 0 (0.0%) |
| 2 Unit Apartments | 0 (0.0%) | 16 (100.0%) |
| 3 or 4 Unit Apartments | 0 (0.0%) | 5 (100.0%) |
| 5 to 9 Unit Apartments | 0 (0.0%) | 10 (100.0%) |
| 10 or more Apartments | 8 (100.0%) | 0 (0.0%) |
| Mobile Home / Other | 26 (57.8%) | 19 (42.2%) |
| Total | 471 (81.8%) | 105 (18.2%) |
Housing Structures by Number of Rooms in Kamas
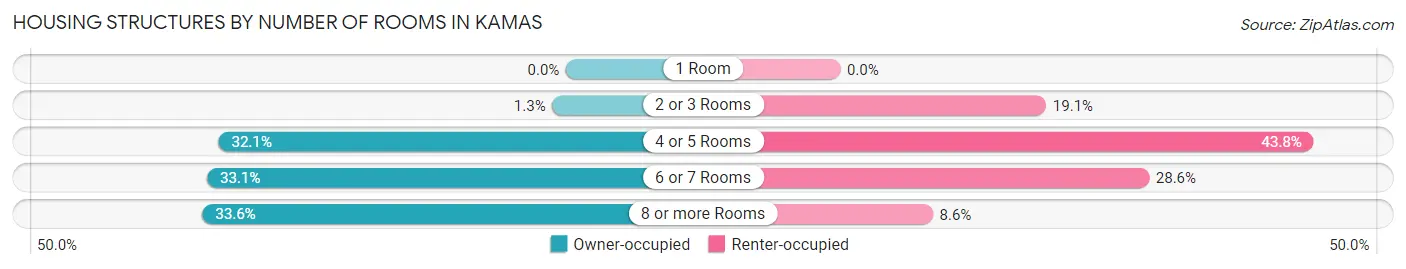
| Number of Rooms | Owner-occupied | Renter-occupied |
| 1 Room | 0 (0.0%) | 0 (0.0%) |
| 2 or 3 Rooms | 6 (1.3%) | 20 (19.1%) |
| 4 or 5 Rooms | 151 (32.1%) | 46 (43.8%) |
| 6 or 7 Rooms | 156 (33.1%) | 30 (28.6%) |
| 8 or more Rooms | 158 (33.6%) | 9 (8.6%) |
| Total | 471 (100.0%) | 105 (100.0%) |
Housing Structure by Heating Type in Kamas
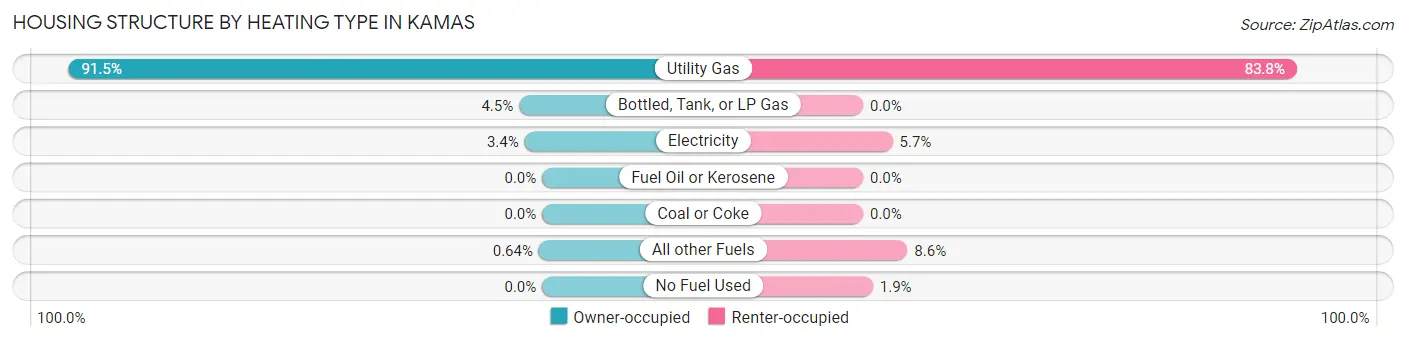
| Heating Type | Owner-occupied | Renter-occupied |
| Utility Gas | 431 (91.5%) | 88 (83.8%) |
| Bottled, Tank, or LP Gas | 21 (4.5%) | 0 (0.0%) |
| Electricity | 16 (3.4%) | 6 (5.7%) |
| Fuel Oil or Kerosene | 0 (0.0%) | 0 (0.0%) |
| Coal or Coke | 0 (0.0%) | 0 (0.0%) |
| All other Fuels | 3 (0.6%) | 9 (8.6%) |
| No Fuel Used | 0 (0.0%) | 2 (1.9%) |
| Total | 471 (100.0%) | 105 (100.0%) |
Household Vehicle Usage in Kamas
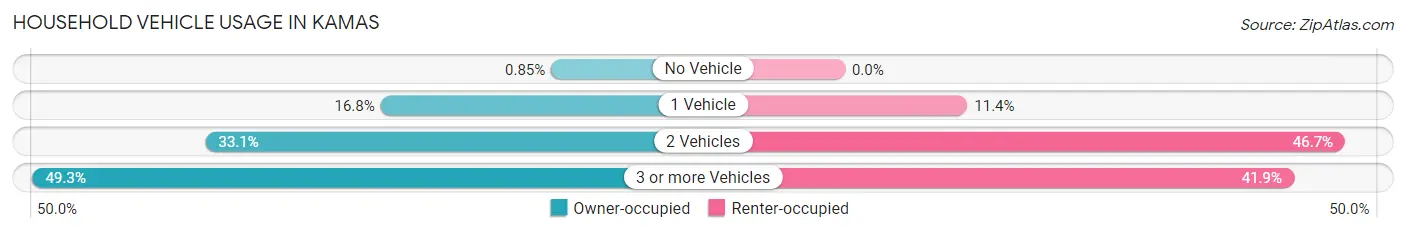
| Vehicles per Household | Owner-occupied | Renter-occupied |
| No Vehicle | 4 (0.9%) | 0 (0.0%) |
| 1 Vehicle | 79 (16.8%) | 12 (11.4%) |
| 2 Vehicles | 156 (33.1%) | 49 (46.7%) |
| 3 or more Vehicles | 232 (49.3%) | 44 (41.9%) |
| Total | 471 (100.0%) | 105 (100.0%) |
Real Estate & Mortgages in Kamas
Real Estate and Mortgage Overview in Kamas
| Characteristic | Without Mortgage | With Mortgage |
| Housing Units | 141 | 330 |
| Median Property Value | $413,000 | $449,000 |
| Median Household Income | $54,306 | $64 |
| Monthly Housing Costs | $348 | $30 |
| Real Estate Taxes | $1,471 | $0 |
Property Value by Mortgage Status in Kamas
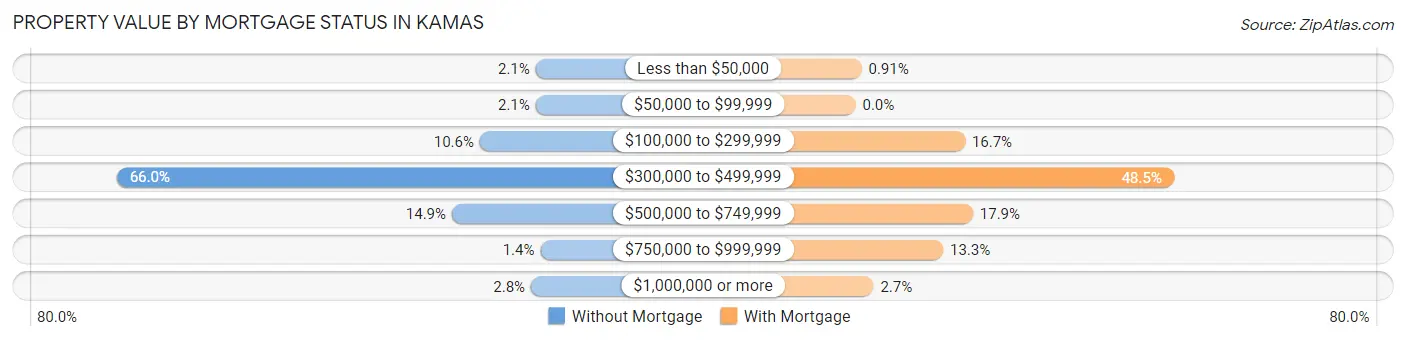
| Property Value | Without Mortgage | With Mortgage |
| Less than $50,000 | 3 (2.1%) | 3 (0.9%) |
| $50,000 to $99,999 | 3 (2.1%) | 0 (0.0%) |
| $100,000 to $299,999 | 15 (10.6%) | 55 (16.7%) |
| $300,000 to $499,999 | 93 (66.0%) | 160 (48.5%) |
| $500,000 to $749,999 | 21 (14.9%) | 59 (17.9%) |
| $750,000 to $999,999 | 2 (1.4%) | 44 (13.3%) |
| $1,000,000 or more | 4 (2.8%) | 9 (2.7%) |
| Total | 141 (100.0%) | 330 (100.0%) |
Household Income by Mortgage Status in Kamas
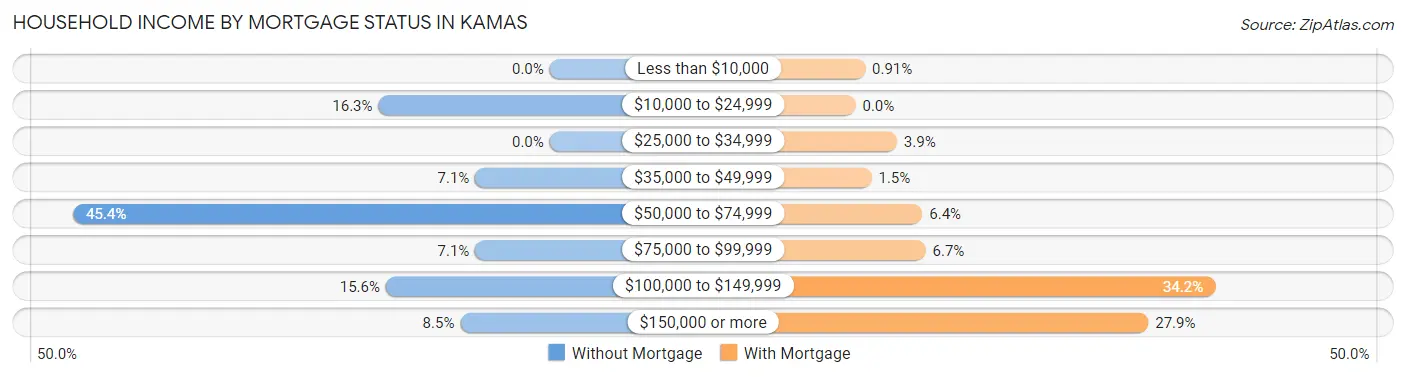
| Household Income | Without Mortgage | With Mortgage |
| Less than $10,000 | 0 (0.0%) | 3 (0.9%) |
| $10,000 to $24,999 | 23 (16.3%) | 0 (0.0%) |
| $25,000 to $34,999 | 0 (0.0%) | 13 (3.9%) |
| $35,000 to $49,999 | 10 (7.1%) | 5 (1.5%) |
| $50,000 to $74,999 | 64 (45.4%) | 21 (6.4%) |
| $75,000 to $99,999 | 10 (7.1%) | 22 (6.7%) |
| $100,000 to $149,999 | 22 (15.6%) | 113 (34.2%) |
| $150,000 or more | 12 (8.5%) | 92 (27.9%) |
| Total | 141 (100.0%) | 330 (100.0%) |
Property Value to Household Income Ratio in Kamas
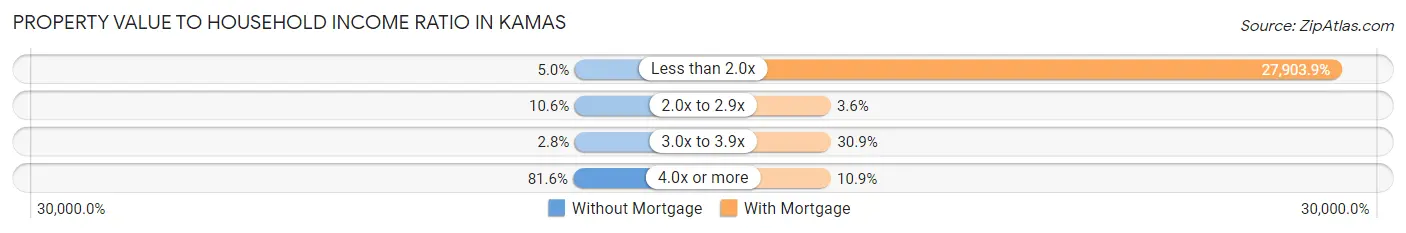
| Value-to-Income Ratio | Without Mortgage | With Mortgage |
| Less than 2.0x | 7 (5.0%) | 92,083 (27,903.9%) |
| 2.0x to 2.9x | 15 (10.6%) | 12 (3.6%) |
| 3.0x to 3.9x | 4 (2.8%) | 102 (30.9%) |
| 4.0x or more | 115 (81.6%) | 36 (10.9%) |
| Total | 141 (100.0%) | 330 (100.0%) |
Real Estate Taxes by Mortgage Status in Kamas
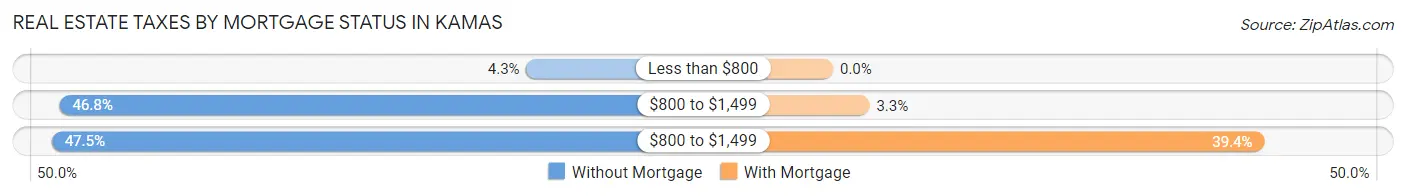
| Property Taxes | Without Mortgage | With Mortgage |
| Less than $800 | 6 (4.3%) | 0 (0.0%) |
| $800 to $1,499 | 66 (46.8%) | 11 (3.3%) |
| $800 to $1,499 | 67 (47.5%) | 130 (39.4%) |
| Total | 141 (100.0%) | 330 (100.0%) |
Health & Disability in Kamas
Health Insurance Coverage by Age in Kamas
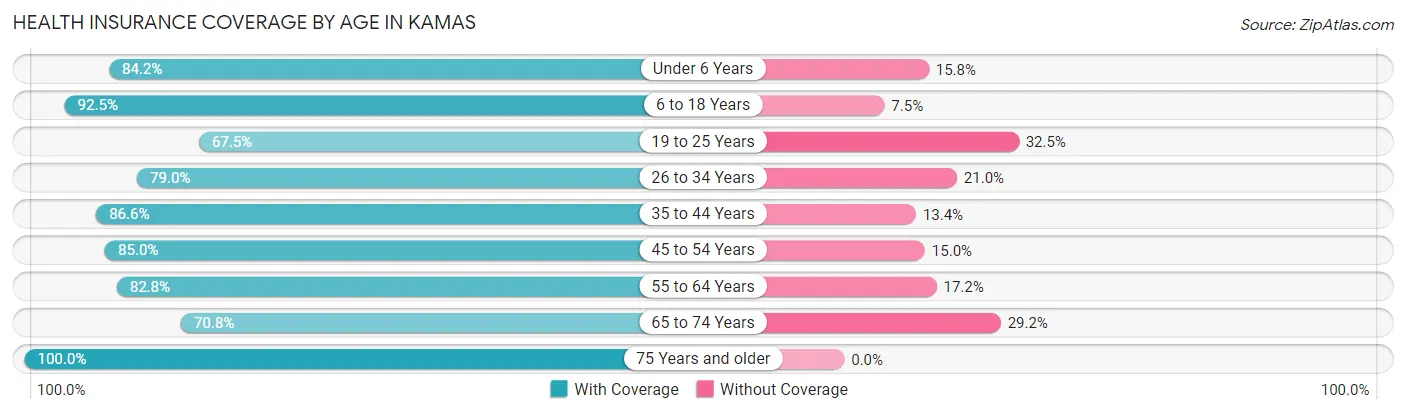
| Age Bracket | With Coverage | Without Coverage |
| Under 6 Years | 155 (84.2%) | 29 (15.8%) |
| 6 to 18 Years | 656 (92.5%) | 53 (7.5%) |
| 19 to 25 Years | 193 (67.5%) | 93 (32.5%) |
| 26 to 34 Years | 173 (79.0%) | 46 (21.0%) |
| 35 to 44 Years | 266 (86.6%) | 41 (13.4%) |
| 45 to 54 Years | 294 (85.0%) | 52 (15.0%) |
| 55 to 64 Years | 154 (82.8%) | 32 (17.2%) |
| 65 to 74 Years | 68 (70.8%) | 28 (29.2%) |
| 75 Years and older | 78 (100.0%) | 0 (0.0%) |
| Total | 2,037 (84.5%) | 374 (15.5%) |
Health Insurance Coverage by Citizenship Status in Kamas
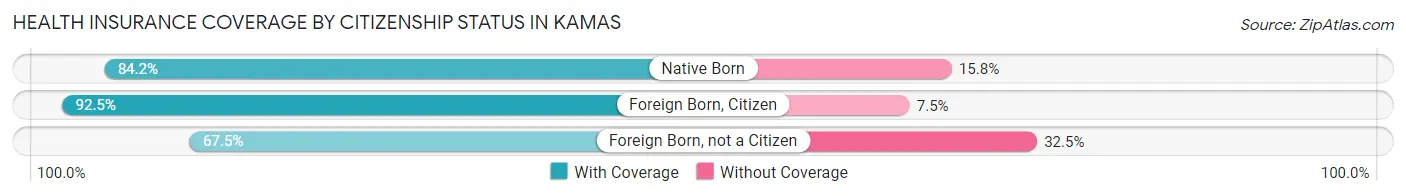
| Citizenship Status | With Coverage | Without Coverage |
| Native Born | 155 (84.2%) | 29 (15.8%) |
| Foreign Born, Citizen | 656 (92.5%) | 53 (7.5%) |
| Foreign Born, not a Citizen | 193 (67.5%) | 93 (32.5%) |
Health Insurance Coverage by Household Income in Kamas
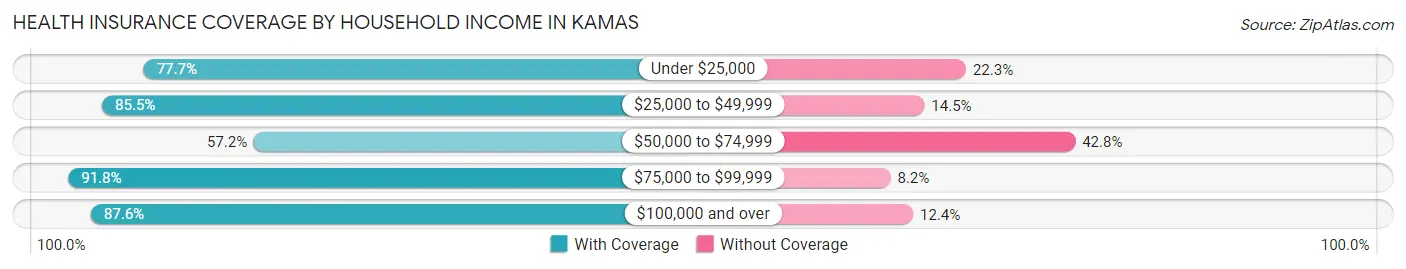
| Household Income | With Coverage | Without Coverage |
| Under $25,000 | 80 (77.7%) | 23 (22.3%) |
| $25,000 to $49,999 | 341 (85.5%) | 58 (14.5%) |
| $50,000 to $74,999 | 147 (57.2%) | 110 (42.8%) |
| $75,000 to $99,999 | 493 (91.8%) | 44 (8.2%) |
| $100,000 and over | 972 (87.6%) | 138 (12.4%) |
Public vs Private Health Insurance Coverage by Age in Kamas
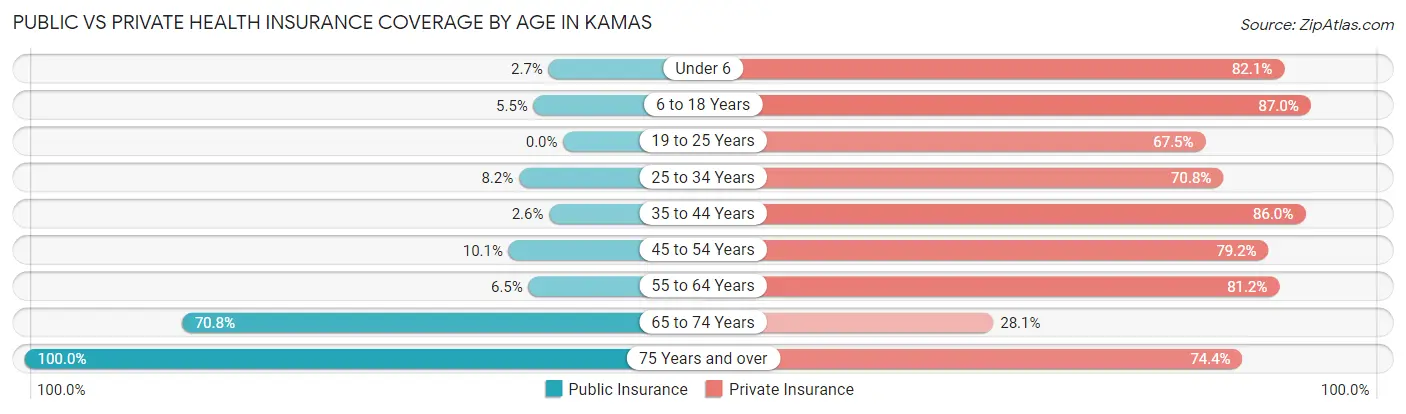
| Age Bracket | Public Insurance | Private Insurance |
| Under 6 | 5 (2.7%) | 151 (82.1%) |
| 6 to 18 Years | 39 (5.5%) | 617 (87.0%) |
| 19 to 25 Years | 0 (0.0%) | 193 (67.5%) |
| 25 to 34 Years | 18 (8.2%) | 155 (70.8%) |
| 35 to 44 Years | 8 (2.6%) | 264 (86.0%) |
| 45 to 54 Years | 35 (10.1%) | 274 (79.2%) |
| 55 to 64 Years | 12 (6.5%) | 151 (81.2%) |
| 65 to 74 Years | 68 (70.8%) | 27 (28.1%) |
| 75 Years and over | 78 (100.0%) | 58 (74.4%) |
| Total | 263 (10.9%) | 1,890 (78.4%) |
Disability Status by Sex by Age in Kamas
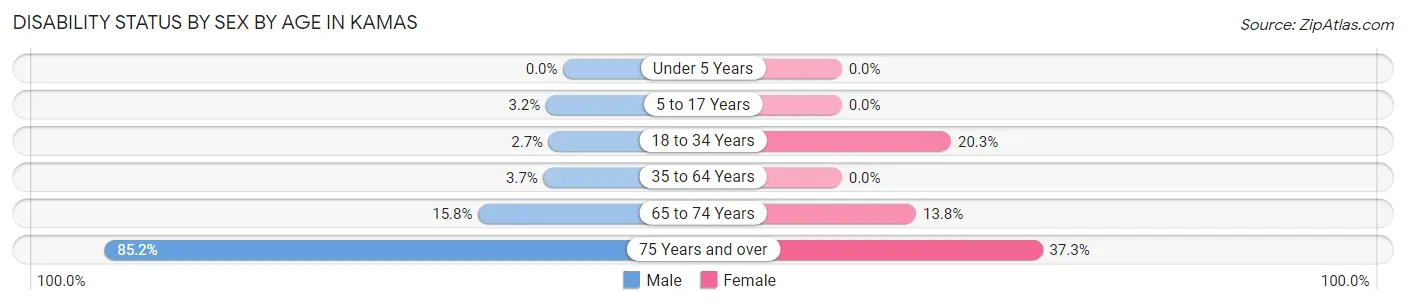
| Age Bracket | Male | Female |
| Under 5 Years | 0 (0.0%) | 0 (0.0%) |
| 5 to 17 Years | 12 (3.2%) | 0 (0.0%) |
| 18 to 34 Years | 7 (2.7%) | 57 (20.3%) |
| 35 to 64 Years | 15 (3.6%) | 0 (0.0%) |
| 65 to 74 Years | 6 (15.8%) | 8 (13.8%) |
| 75 Years and over | 23 (85.2%) | 19 (37.2%) |
Disability Class by Sex by Age in Kamas
Disability Class: Hearing Difficulty
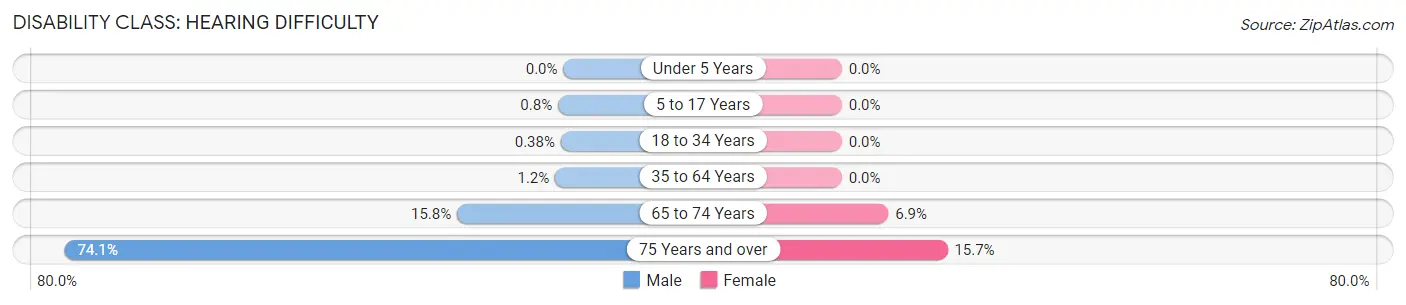
| Age Bracket | Male | Female |
| Under 5 Years | 0 (0.0%) | 0 (0.0%) |
| 5 to 17 Years | 3 (0.8%) | 0 (0.0%) |
| 18 to 34 Years | 1 (0.4%) | 0 (0.0%) |
| 35 to 64 Years | 5 (1.2%) | 0 (0.0%) |
| 65 to 74 Years | 6 (15.8%) | 4 (6.9%) |
| 75 Years and over | 20 (74.1%) | 8 (15.7%) |
Disability Class: Vision Difficulty
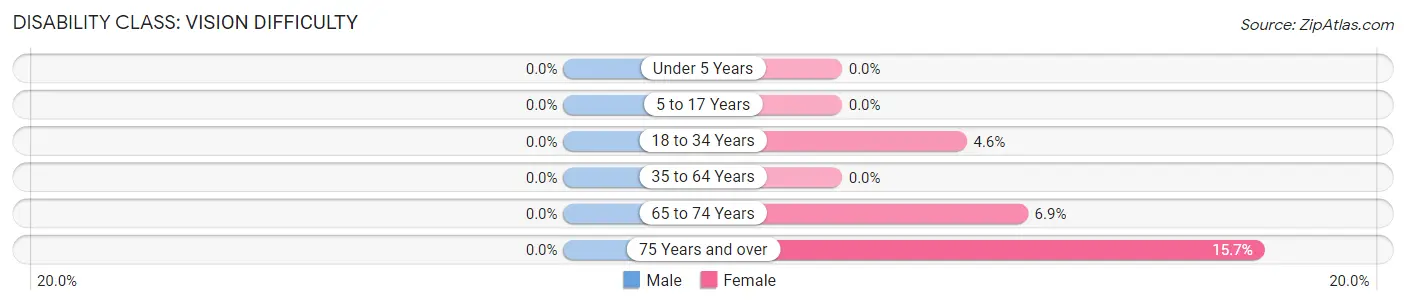
| Age Bracket | Male | Female |
| Under 5 Years | 0 (0.0%) | 0 (0.0%) |
| 5 to 17 Years | 0 (0.0%) | 0 (0.0%) |
| 18 to 34 Years | 0 (0.0%) | 13 (4.6%) |
| 35 to 64 Years | 0 (0.0%) | 0 (0.0%) |
| 65 to 74 Years | 0 (0.0%) | 4 (6.9%) |
| 75 Years and over | 0 (0.0%) | 8 (15.7%) |
Disability Class: Cognitive Difficulty
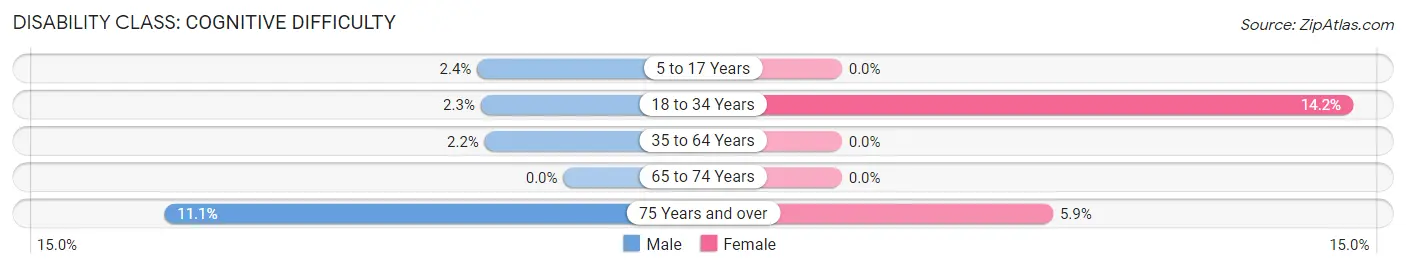
| Age Bracket | Male | Female |
| 5 to 17 Years | 9 (2.4%) | 0 (0.0%) |
| 18 to 34 Years | 6 (2.3%) | 40 (14.2%) |
| 35 to 64 Years | 9 (2.2%) | 0 (0.0%) |
| 65 to 74 Years | 0 (0.0%) | 0 (0.0%) |
| 75 Years and over | 3 (11.1%) | 3 (5.9%) |
Disability Class: Ambulatory Difficulty
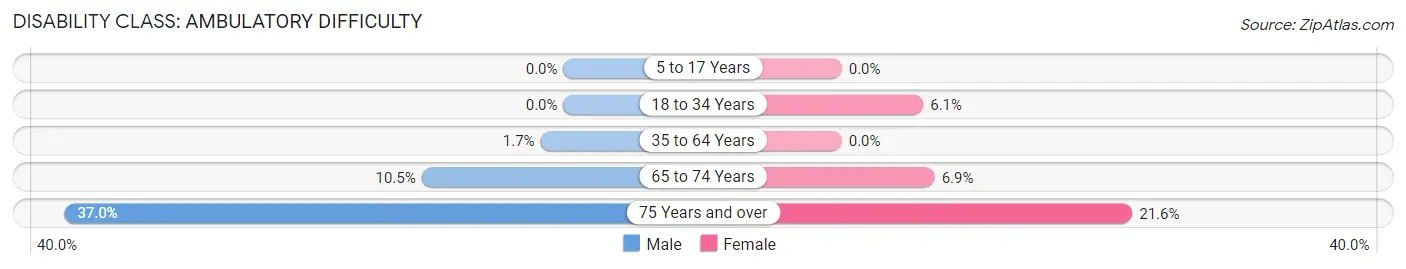
| Age Bracket | Male | Female |
| 5 to 17 Years | 0 (0.0%) | 0 (0.0%) |
| 18 to 34 Years | 0 (0.0%) | 17 (6.0%) |
| 35 to 64 Years | 7 (1.7%) | 0 (0.0%) |
| 65 to 74 Years | 4 (10.5%) | 4 (6.9%) |
| 75 Years and over | 10 (37.0%) | 11 (21.6%) |
Disability Class: Self-Care Difficulty
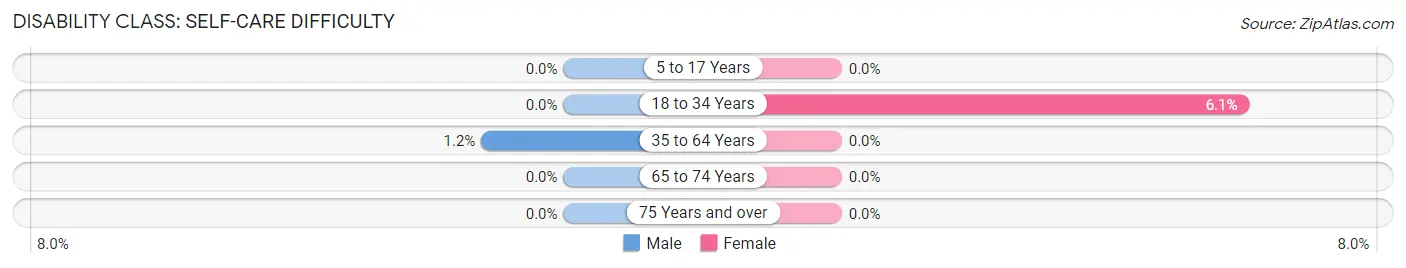
| Age Bracket | Male | Female |
| 5 to 17 Years | 0 (0.0%) | 0 (0.0%) |
| 18 to 34 Years | 0 (0.0%) | 17 (6.0%) |
| 35 to 64 Years | 5 (1.2%) | 0 (0.0%) |
| 65 to 74 Years | 0 (0.0%) | 0 (0.0%) |
| 75 Years and over | 0 (0.0%) | 0 (0.0%) |
Technology Access in Kamas
Computing Device Access in Kamas
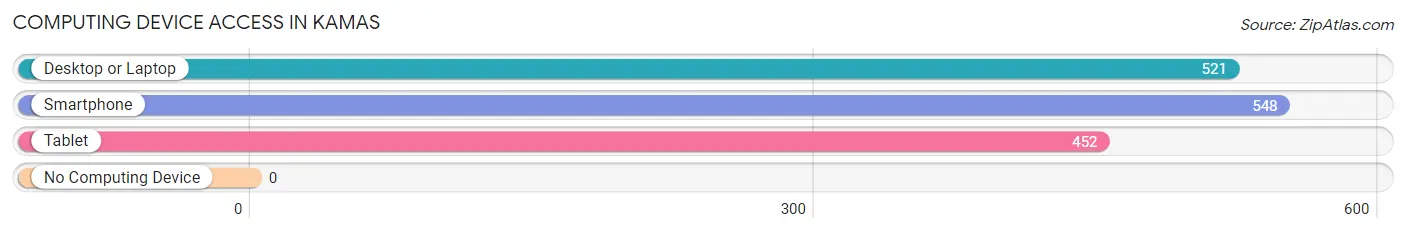
| Device Type | # Households | % Households |
| Desktop or Laptop | 521 | 90.4% |
| Smartphone | 548 | 95.1% |
| Tablet | 452 | 78.5% |
| No Computing Device | 0 | 0.0% |
| Total | 576 | 100.0% |
Internet Access in Kamas
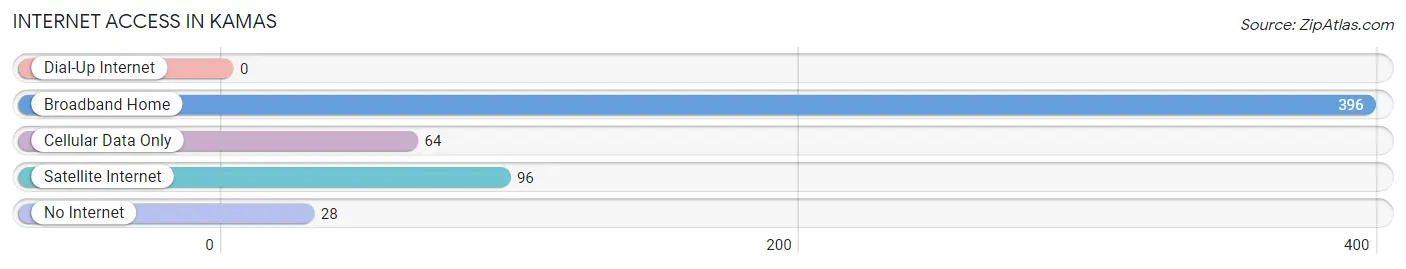
| Internet Type | # Households | % Households |
| Dial-Up Internet | 0 | 0.0% |
| Broadband Home | 396 | 68.8% |
| Cellular Data Only | 64 | 11.1% |
| Satellite Internet | 96 | 16.7% |
| No Internet | 28 | 4.9% |
| Total | 576 | 100.0% |
Kamas Summary
Kamas, Utah is a small city located in Summit County, Utah. It is situated in the Wasatch Mountains, approximately 40 miles east of Salt Lake City. The city is known for its rural atmosphere and its proximity to the Uinta National Forest.
History
Kamas was first settled in 1864 by a group of Mormon pioneers led by John W. Van Cott. The pioneers named the settlement after the Greek word for “beautiful”, as they were impressed by the beauty of the surrounding mountains. The settlement was initially used as a way station for travelers and as a trading post for local Native American tribes.
In 1868, the first post office was established in Kamas. The town was officially incorporated in 1891. During the early 20th century, Kamas was a popular destination for tourists, who came to enjoy the area’s natural beauty and outdoor activities.
Geography
Kamas is located in the Wasatch Mountains, at an elevation of 6,000 feet. The city is situated on the western edge of the Uinta National Forest, which covers over 1.2 million acres of land. The forest is home to a variety of wildlife, including elk, deer, and moose.
The city is located near several ski resorts, including Park City Mountain Resort, Deer Valley Resort, and The Canyons. Kamas is also close to several popular hiking trails, including the Mirror Lake Trail and the Highline Trail.
Economy
Kamas’ economy is largely based on tourism and outdoor recreation. The city is home to several ski resorts, which attract visitors from all over the world. The city is also home to several restaurants, hotels, and other businesses that cater to tourists.
In addition to tourism, Kamas is home to several manufacturing companies, including a paper mill and a wood products plant. The city is also home to several small businesses, including a grocery store, a hardware store, and a gas station.
Demographics
As of the 2010 census, Kamas had a population of 1,717. The racial makeup of the city was 94.3% White, 0.2% African American, 0.3% Native American, 0.3% Asian, 0.1% Pacific Islander, 0.7% from other races, and 3.4% from two or more races. Hispanic or Latino of any race were 3.2% of the population.
Kamas is a predominantly Mormon city, with over 70% of the population identifying as members of The Church of Jesus Christ of Latter-day Saints. The city is also home to a small Catholic community.
Kamas is a small city with a rural atmosphere and a strong sense of community. The city is known for its outdoor recreation opportunities and its proximity to the Uinta National Forest. The city’s economy is largely based on tourism and outdoor recreation, and the city is home to several ski resorts and other businesses that cater to tourists. Kamas is a predominantly Mormon city, with over 70% of the population identifying as members of The Church of Jesus Christ of Latter-day Saints.
Common Questions
What is the Total Population of Kamas?
Total Population of Kamas is 2,411.
What is the Total Male Population of Kamas?
Total Male Population of Kamas is 1,197.
What is the Total Female Population of Kamas?
Total Female Population of Kamas is 1,214.
What is the Ratio of Males per 100 Females in Kamas?
There are 98.60 Males per 100 Females in Kamas.
What is the Ratio of Females per 100 Males in Kamas?
There are 101.42 Females per 100 Males in Kamas.
What is the Median Population Age in Kamas?
Median Population Age in Kamas is 28.2 Years.
What is the Average Family Size in Kamas
Average Family Size in Kamas is 4.7 People.
What is the Average Household Size in Kamas
Average Household Size in Kamas is 4.2 People.
What is Per Capita Income in Kamas?
Per Capita income in Kamas is $29,386.
What is the Median Family Income in Kamas?
Median Family Income in Kamas is $83,385.
What is the Median Household income in Kamas?
Median Household Income in Kamas is $81,341.
What is Income or Wage Gap in Kamas?
Income or Wage Gap in Kamas is 24.4%.
Women in Kamas earn 75.6 cents for every dollar earned by a man.
What is Inequality or Gini Index in Kamas?
Inequality or Gini Index in Kamas is 0.37.
How Large is the Labor Force in Kamas?
There are 1,348 People in the Labor Forcein in Kamas.
What is the Percentage of People in the Labor Force in Kamas?
81.7% of People are in the Labor Force in Kamas.
What is the Unemployment Rate in Kamas?
Unemployment Rate in Kamas is 0.9%.