Forty Fort borough, PA
Forty Fort borough Overview
4,242
TOTAL POPULATION
2,143
MALE POPULATION
2,099
FEMALE POPULATION
102.10
MALES / 100 FEMALES
97.95
FEMALES / 100 MALES
40.5
MEDIAN AGE
3.0
AVG FAMILY SIZE
2.5
AVG HOUSEHOLD SIZE
$34,842
PER CAPITA INCOME
$95,870
AVG FAMILY INCOME
$74,091
AVG HOUSEHOLD INCOME
23.0%
WAGE / INCOME GAP [ % ]
77.0¢/ $1
WAGE / INCOME GAP [ $ ]
0.36
INEQUALITY / GINI INDEX
2,563
LABOR FORCE [ PEOPLE ]
71.5%
PERCENT IN LABOR FORCE
8.8%
UNEMPLOYMENT RATE
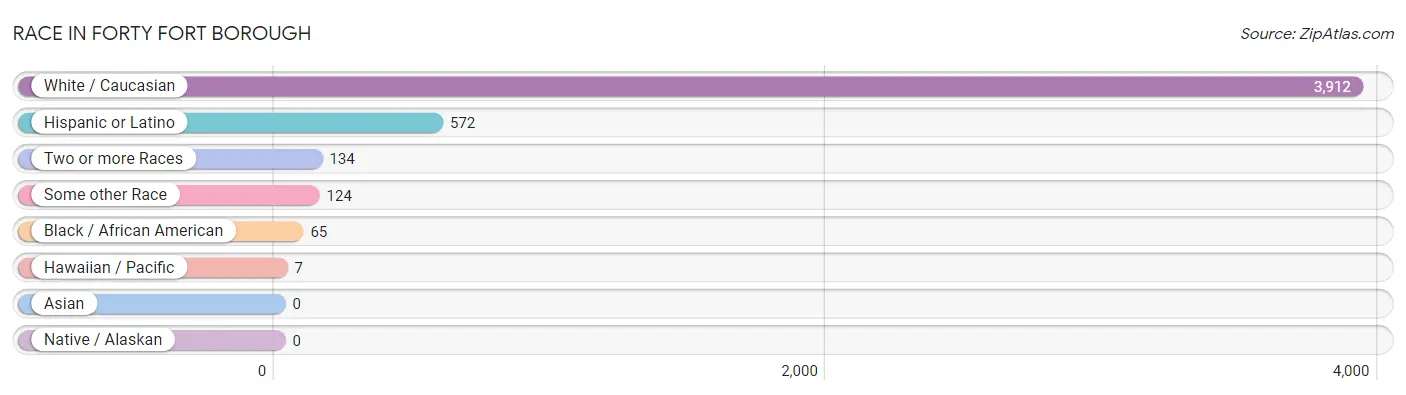
Race in Forty Fort borough
The most populous races in Forty Fort borough are White / Caucasian (3,912 | 92.2%), Hispanic or Latino (572 | 13.5%), and Two or more Races (134 | 3.2%).
| Race | # Population | % Population |
| Asian | 0 | 0.0% |
| Black / African American | 65 | 1.5% |
| Hawaiian / Pacific | 7 | 0.2% |
| Hispanic or Latino | 572 | 13.5% |
| Native / Alaskan | 0 | 0.0% |
| White / Caucasian | 3,912 | 92.2% |
| Two or more Races | 134 | 3.2% |
| Some other Race | 124 | 2.9% |
| Total | 4,242 | 100.0% |
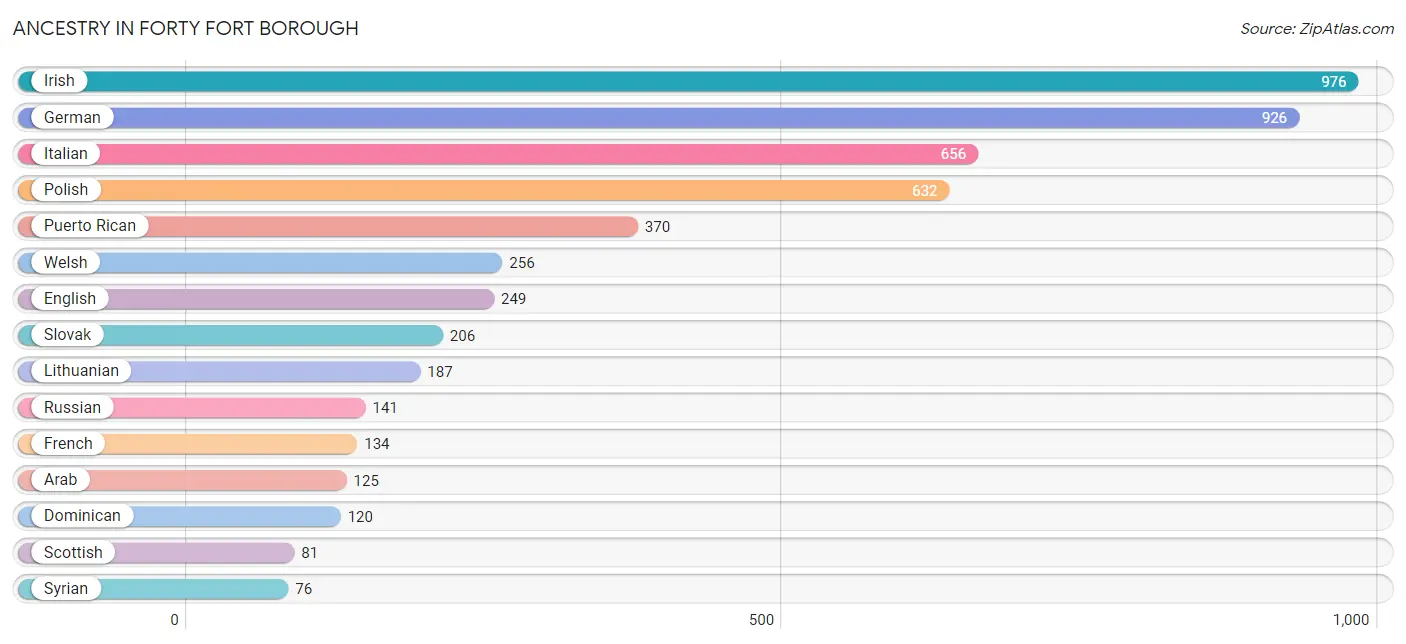
Ancestry in Forty Fort borough
The most populous ancestries reported in Forty Fort borough are Irish (976 | 23.0%), German (926 | 21.8%), Italian (656 | 15.5%), Polish (632 | 14.9%), and Puerto Rican (370 | 8.7%), together accounting for 83.9% of all Forty Fort borough residents.
| Ancestry | # Population | % Population |
| African | 5 | 0.1% |
| American | 50 | 1.2% |
| Arab | 125 | 2.9% |
| Austrian | 19 | 0.4% |
| Bhutanese | 10 | 0.2% |
| British | 16 | 0.4% |
| Canadian | 7 | 0.2% |
| Chilean | 12 | 0.3% |
| Croatian | 9 | 0.2% |
| Czech | 36 | 0.9% |
| Czechoslovakian | 8 | 0.2% |
| Dominican | 120 | 2.8% |
| Dutch | 20 | 0.5% |
| Eastern European | 35 | 0.8% |
| English | 249 | 5.9% |
| French | 134 | 3.2% |
| French Canadian | 4 | 0.1% |
| German | 926 | 21.8% |
| Greek | 7 | 0.2% |
| Hungarian | 10 | 0.2% |
| Irish | 976 | 23.0% |
| Italian | 656 | 15.5% |
| Latvian | 24 | 0.6% |
| Lebanese | 49 | 1.2% |
| Lithuanian | 187 | 4.4% |
| Mexican | 69 | 1.6% |
| Native Hawaiian | 10 | 0.2% |
| Pennsylvania German | 46 | 1.1% |
| Polish | 632 | 14.9% |
| Portuguese | 36 | 0.9% |
| Puerto Rican | 370 | 8.7% |
| Romanian | 12 | 0.3% |
| Russian | 141 | 3.3% |
| Scotch-Irish | 47 | 1.1% |
| Scottish | 81 | 1.9% |
| Slovak | 206 | 4.9% |
| South American | 12 | 0.3% |
| Subsaharan African | 5 | 0.1% |
| Swedish | 35 | 0.8% |
| Syrian | 76 | 1.8% |
| Ukrainian | 40 | 0.9% |
| Welsh | 256 | 6.0% |
| Yugoslavian | 10 | 0.2% | View All 43 Rows |
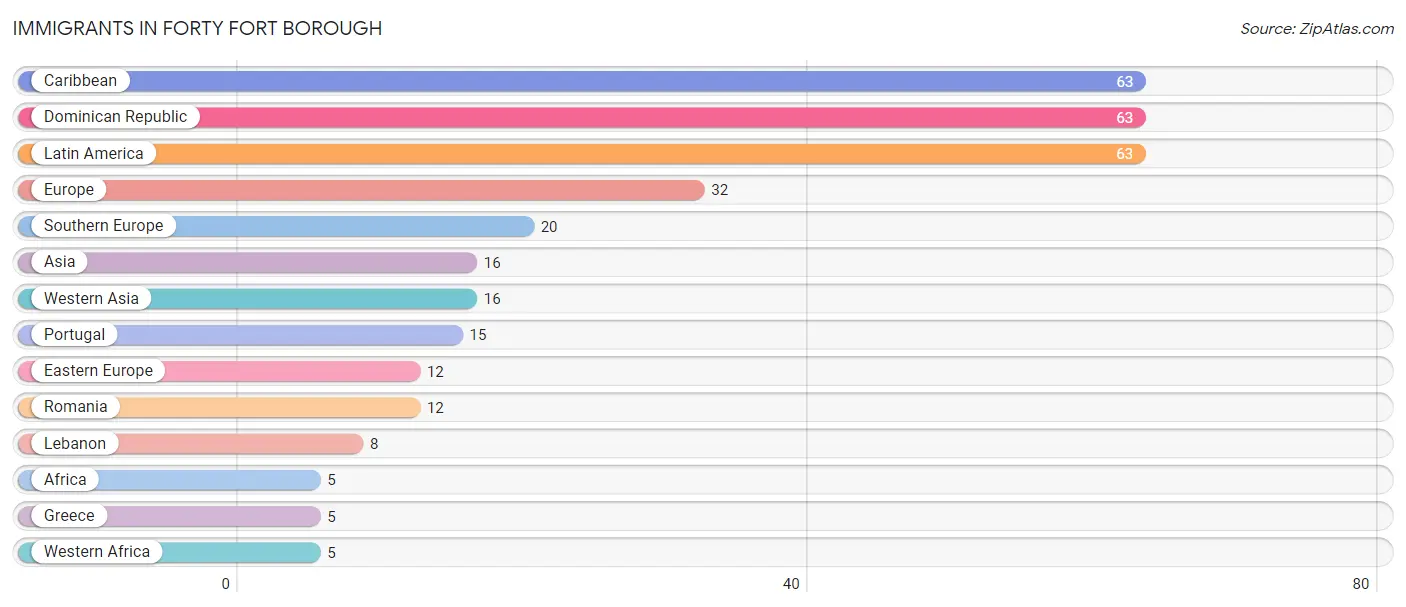
Immigrants in Forty Fort borough
The most numerous immigrant groups reported in Forty Fort borough came from Caribbean (63 | 1.5%), Dominican Republic (63 | 1.5%), Latin America (63 | 1.5%), Europe (32 | 0.7%), and Southern Europe (20 | 0.5%), together accounting for 5.7% of all Forty Fort borough residents.
| Immigration Origin | # Population | % Population |
| Africa | 5 | 0.1% |
| Asia | 16 | 0.4% |
| Caribbean | 63 | 1.5% |
| Dominican Republic | 63 | 1.5% |
| Eastern Europe | 12 | 0.3% |
| Europe | 32 | 0.7% |
| Greece | 5 | 0.1% |
| Latin America | 63 | 1.5% |
| Lebanon | 8 | 0.2% |
| Portugal | 15 | 0.4% |
| Romania | 12 | 0.3% |
| Southern Europe | 20 | 0.5% |
| Western Africa | 5 | 0.1% |
| Western Asia | 16 | 0.4% | View All 14 Rows |
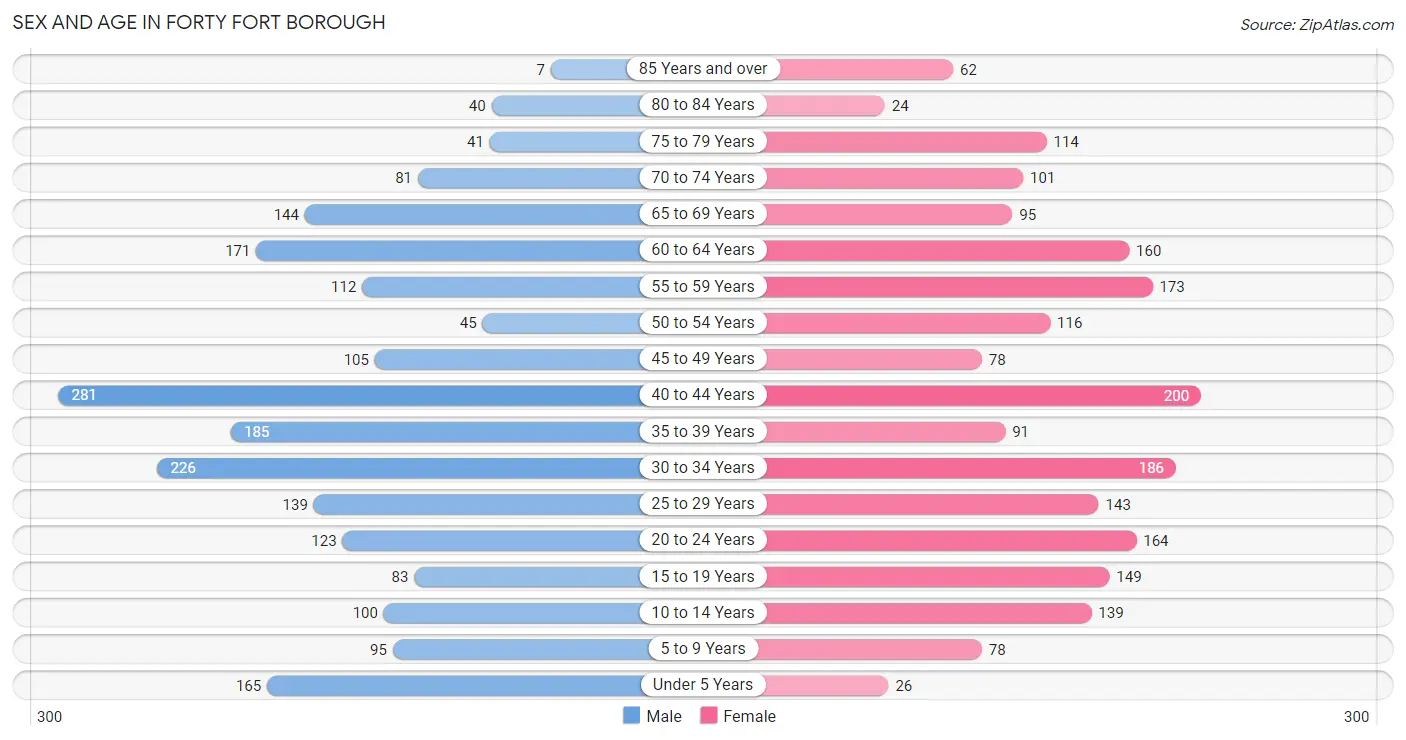
Sex and Age in Forty Fort borough
Sex and Age in Forty Fort borough
The most populous age groups in Forty Fort borough are 40 to 44 Years (281 | 13.1%) for men and 40 to 44 Years (200 | 9.5%) for women.
| Age Bracket | Male | Female |
| Under 5 Years | 165 (7.7%) | 26 (1.2%) |
| 5 to 9 Years | 95 (4.4%) | 78 (3.7%) |
| 10 to 14 Years | 100 (4.7%) | 139 (6.6%) |
| 15 to 19 Years | 83 (3.9%) | 149 (7.1%) |
| 20 to 24 Years | 123 (5.7%) | 164 (7.8%) |
| 25 to 29 Years | 139 (6.5%) | 143 (6.8%) |
| 30 to 34 Years | 226 (10.5%) | 186 (8.9%) |
| 35 to 39 Years | 185 (8.6%) | 91 (4.3%) |
| 40 to 44 Years | 281 (13.1%) | 200 (9.5%) |
| 45 to 49 Years | 105 (4.9%) | 78 (3.7%) |
| 50 to 54 Years | 45 (2.1%) | 116 (5.5%) |
| 55 to 59 Years | 112 (5.2%) | 173 (8.2%) |
| 60 to 64 Years | 171 (8.0%) | 160 (7.6%) |
| 65 to 69 Years | 144 (6.7%) | 95 (4.5%) |
| 70 to 74 Years | 81 (3.8%) | 101 (4.8%) |
| 75 to 79 Years | 41 (1.9%) | 114 (5.4%) |
| 80 to 84 Years | 40 (1.9%) | 24 (1.1%) |
| 85 Years and over | 7 (0.3%) | 62 (2.9%) |
| Total | 2,143 (100.0%) | 2,099 (100.0%) |
Families and Households in Forty Fort borough
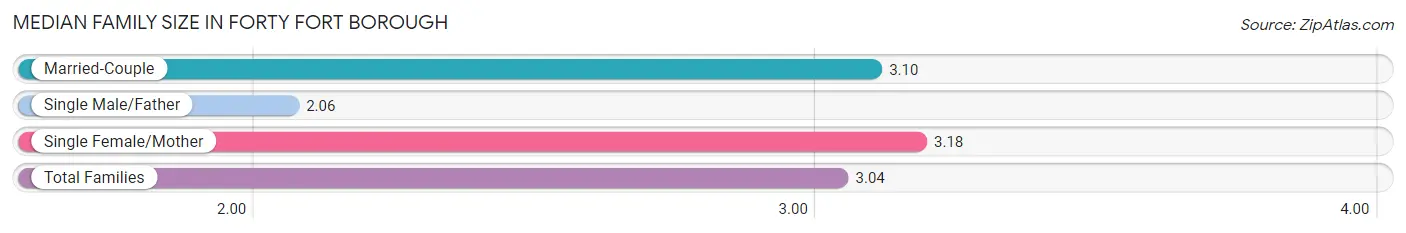
Median Family Size in Forty Fort borough
The median family size in Forty Fort borough is 3.04 persons per family, with single female/mother families (192 | 17.4%) accounting for the largest median family size of 3.18 persons per family. On the other hand, single male/father families (70 | 6.4%) represent the smallest median family size with 2.06 persons per family.
| Family Type | # Families | Family Size |
| Married-Couple | 840 (76.2%) | 3.10 |
| Single Male/Father | 70 (6.4%) | 2.06 |
| Single Female/Mother | 192 (17.4%) | 3.18 |
| Total Families | 1,102 (100.0%) | 3.04 |
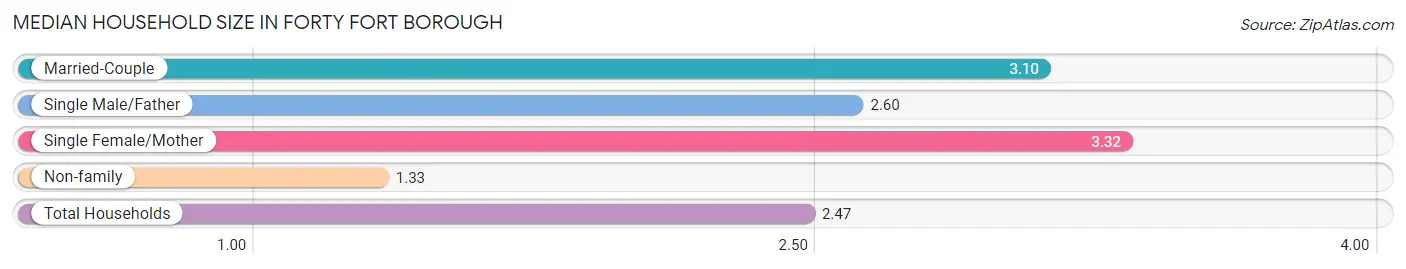
Median Household Size in Forty Fort borough
The median household size in Forty Fort borough is 2.47 persons per household, with single female/mother households (192 | 11.2%) accounting for the largest median household size of 3.32 persons per household. non-family households (608 | 35.6%) represent the smallest median household size with 1.33 persons per household.
| Household Type | # Households | Household Size |
| Married-Couple | 840 (49.1%) | 3.10 |
| Single Male/Father | 70 (4.1%) | 2.60 |
| Single Female/Mother | 192 (11.2%) | 3.32 |
| Non-family | 608 (35.6%) | 1.33 |
| Total Households | 1,710 (100.0%) | 2.47 |
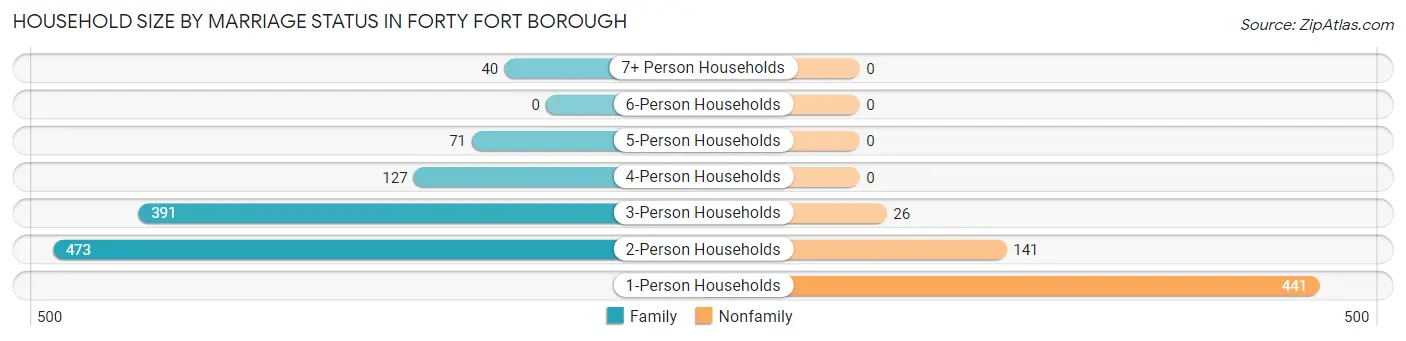
Household Size by Marriage Status in Forty Fort borough
Out of a total of 1,710 households in Forty Fort borough, 1,102 (64.4%) are family households, while 608 (35.6%) are nonfamily households. The most numerous type of family households are 2-person households, comprising 473, and the most common type of nonfamily households are 1-person households, comprising 441.
| Household Size | Family Households | Nonfamily Households |
| 1-Person Households | - | 441 (25.8%) |
| 2-Person Households | 473 (27.7%) | 141 (8.3%) |
| 3-Person Households | 391 (22.9%) | 26 (1.5%) |
| 4-Person Households | 127 (7.4%) | 0 (0.0%) |
| 5-Person Households | 71 (4.2%) | 0 (0.0%) |
| 6-Person Households | 0 (0.0%) | 0 (0.0%) |
| 7+ Person Households | 40 (2.3%) | 0 (0.0%) |
| Total | 1,102 (64.4%) | 608 (35.6%) |
Female Fertility in Forty Fort borough
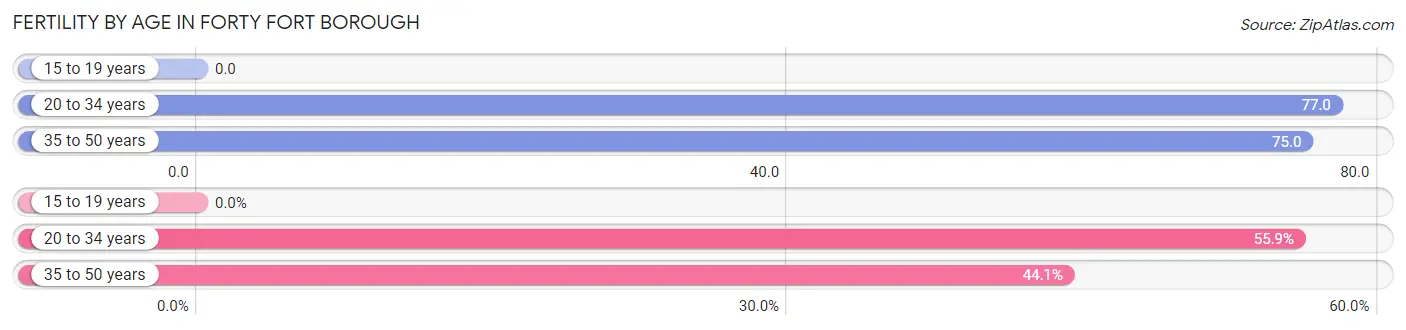
Fertility by Age in Forty Fort borough
Average fertility rate in Forty Fort borough is 65.0 births per 1,000 women. Women in the age bracket of 20 to 34 years have the highest fertility rate with 77.0 births per 1,000 women. Women in the age bracket of 20 to 34 years acount for 55.9% of all women with births.
| Age Bracket | Women with Births | Births / 1,000 Women |
| 15 to 19 years | 0 (0.0%) | 0.0 |
| 20 to 34 years | 38 (55.9%) | 77.0 |
| 35 to 50 years | 30 (44.1%) | 75.0 |
| Total | 68 (100.0%) | 65.0 |
Fertility by Age by Marriage Status in Forty Fort borough
55.9% of women with births (68) in Forty Fort borough are married. The highest percentage of unmarried women with births falls into 35 to 50 years age bracket with 100.0% of them unmarried at the time of birth, while the lowest percentage of unmarried women with births belong to 20 to 34 years age bracket with 0.0% of them unmarried.
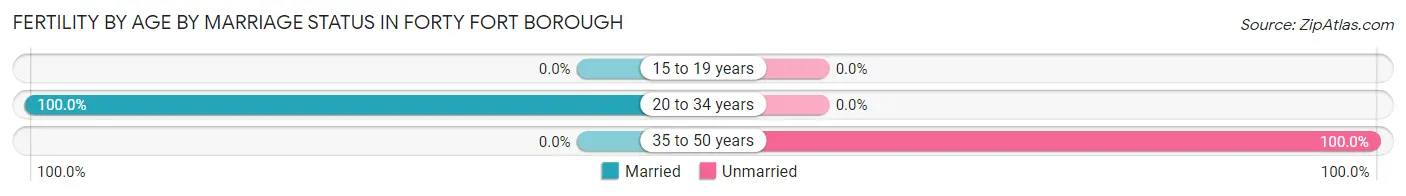
| Age Bracket | Married | Unmarried |
| 15 to 19 years | 0 (0.0%) | 0 (0.0%) |
| 20 to 34 years | 38 (100.0%) | 0 (0.0%) |
| 35 to 50 years | 0 (0.0%) | 30 (100.0%) |
| Total | 38 (55.9%) | 30 (44.1%) |
Fertility by Education in Forty Fort borough
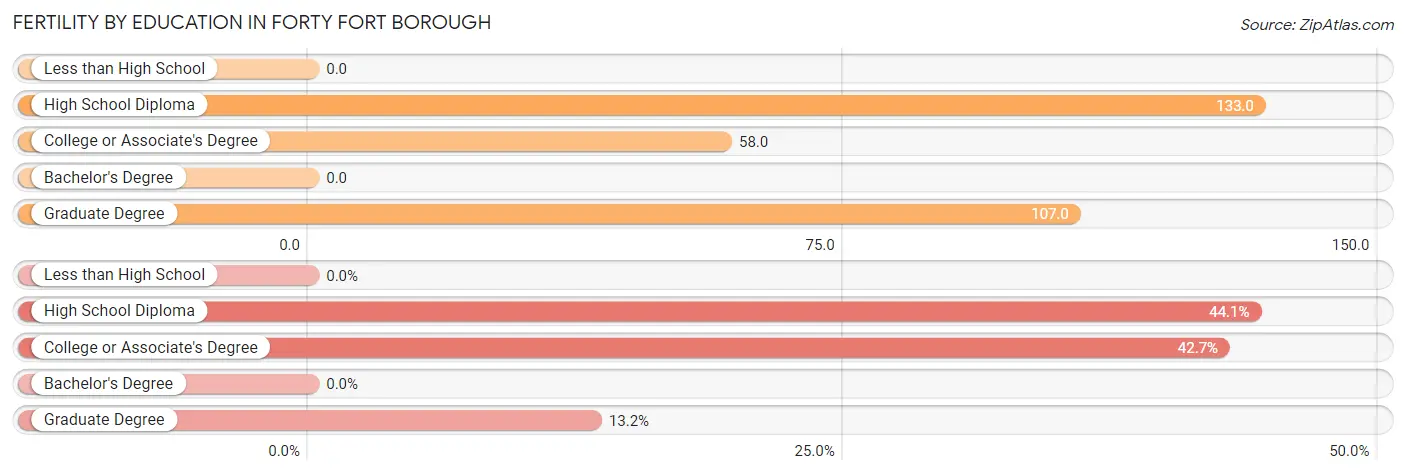
| Educational Attainment | Women with Births | Births / 1,000 Women |
| Less than High School | 0 (0.0%) | 0.0 |
| High School Diploma | 30 (44.1%) | 133.0 |
| College or Associate's Degree | 29 (42.6%) | 58.0 |
| Bachelor's Degree | 0 (0.0%) | 0.0 |
| Graduate Degree | 9 (13.2%) | 107.0 |
| Total | 68 (100.0%) | 65.0 |
Fertility by Education by Marriage Status in Forty Fort borough
44.1% of women with births in Forty Fort borough are unmarried. Women with the educational attainment of college or associate's degree are most likely to be married with 100.0% of them married at childbirth, while women with the educational attainment of high school diploma are least likely to be married with 100.0% of them unmarried at childbirth.
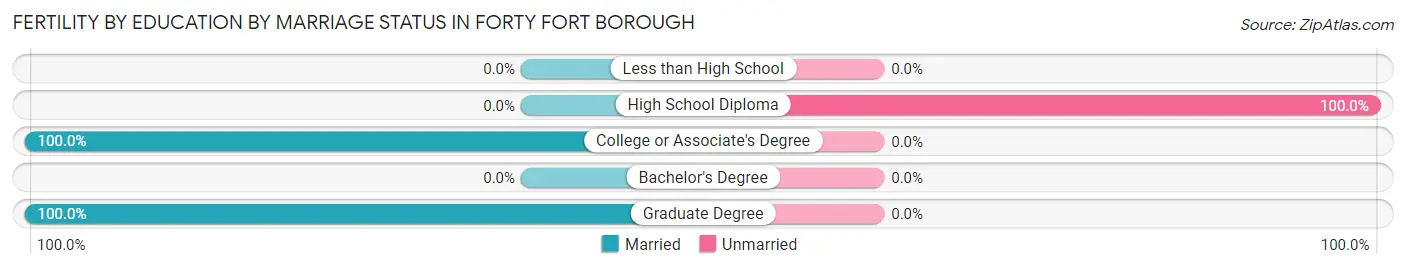
| Educational Attainment | Married | Unmarried |
| Less than High School | 0 (0.0%) | 0 (0.0%) |
| High School Diploma | 0 (0.0%) | 30 (100.0%) |
| College or Associate's Degree | 29 (100.0%) | 0 (0.0%) |
| Bachelor's Degree | 0 (0.0%) | 0 (0.0%) |
| Graduate Degree | 9 (100.0%) | 0 (0.0%) |
| Total | 38 (55.9%) | 30 (44.1%) |
Income in Forty Fort borough
Income Overview in Forty Fort borough
Per Capita Income in Forty Fort borough is $34,842, while median incomes of families and households are $95,870 and $74,091 respectively.
| Characteristic | Number | Measure |
| Per Capita Income | 4,242 | $34,842 |
| Median Family Income | 1,102 | $95,870 |
| Mean Family Income | 1,102 | $96,649 |
| Median Household Income | 1,710 | $74,091 |
| Mean Household Income | 1,710 | $83,960 |
| Income Deficit | 1,102 | $0 |
| Wage / Income Gap (%) | 4,242 | 22.99% |
| Wage / Income Gap ($) | 4,242 | 77.01¢ per $1 |
| Gini / Inequality Index | 4,242 | 0.36 |
Earnings by Sex in Forty Fort borough
Average Earnings in Forty Fort borough are $41,538, $47,261 for men and $36,394 for women, a difference of 23.0%.
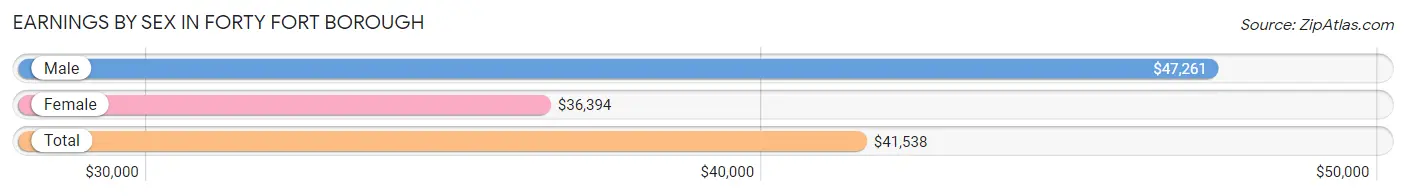
| Sex | Number | Average Earnings |
| Male | 1,313 (52.1%) | $47,261 |
| Female | 1,209 (47.9%) | $36,394 |
| Total | 2,522 (100.0%) | $41,538 |
Earnings by Sex by Income Bracket in Forty Fort borough
The most common earnings brackets in Forty Fort borough are $75,000 to $99,999 for men (244 | 18.6%) and $45,000 to $49,999 for women (123 | 10.2%).
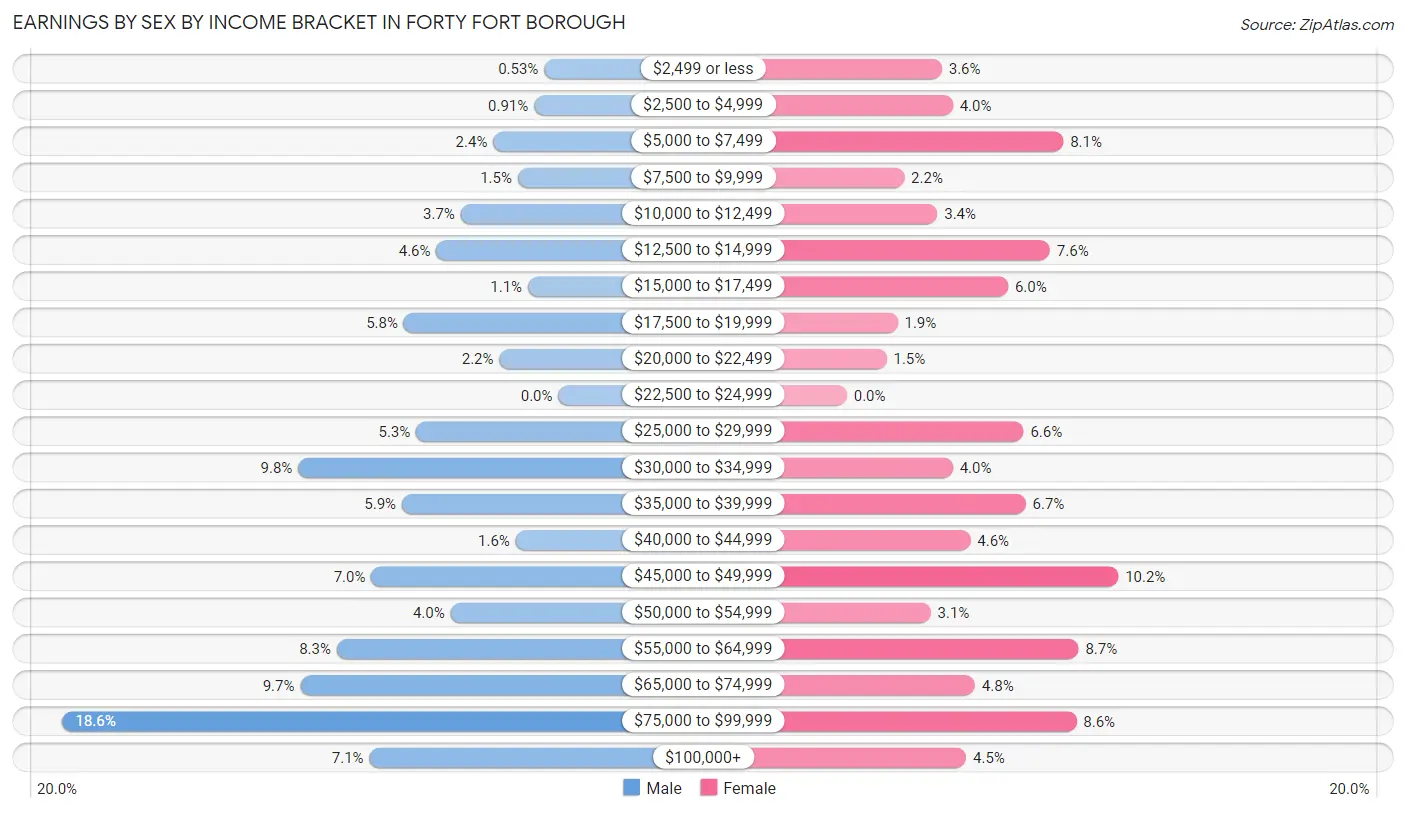
| Income | Male | Female |
| $2,499 or less | 7 (0.5%) | 43 (3.6%) |
| $2,500 to $4,999 | 12 (0.9%) | 48 (4.0%) |
| $5,000 to $7,499 | 32 (2.4%) | 98 (8.1%) |
| $7,500 to $9,999 | 20 (1.5%) | 26 (2.1%) |
| $10,000 to $12,499 | 48 (3.7%) | 41 (3.4%) |
| $12,500 to $14,999 | 60 (4.6%) | 92 (7.6%) |
| $15,000 to $17,499 | 15 (1.1%) | 73 (6.0%) |
| $17,500 to $19,999 | 76 (5.8%) | 23 (1.9%) |
| $20,000 to $22,499 | 29 (2.2%) | 18 (1.5%) |
| $22,500 to $24,999 | 0 (0.0%) | 0 (0.0%) |
| $25,000 to $29,999 | 70 (5.3%) | 80 (6.6%) |
| $30,000 to $34,999 | 128 (9.8%) | 48 (4.0%) |
| $35,000 to $39,999 | 77 (5.9%) | 81 (6.7%) |
| $40,000 to $44,999 | 21 (1.6%) | 56 (4.6%) |
| $45,000 to $49,999 | 92 (7.0%) | 123 (10.2%) |
| $50,000 to $54,999 | 53 (4.0%) | 38 (3.1%) |
| $55,000 to $64,999 | 109 (8.3%) | 105 (8.7%) |
| $65,000 to $74,999 | 127 (9.7%) | 58 (4.8%) |
| $75,000 to $99,999 | 244 (18.6%) | 104 (8.6%) |
| $100,000+ | 93 (7.1%) | 54 (4.5%) |
| Total | 1,313 (100.0%) | 1,209 (100.0%) |
Earnings by Sex by Educational Attainment in Forty Fort borough
Average earnings in Forty Fort borough are $52,647 for men and $42,781 for women, a difference of 18.7%. Men with an educational attainment of graduate degree enjoy the highest average annual earnings of $84,375, while those with college or associate's degree education earn the least with $44,205. Women with an educational attainment of graduate degree earn the most with the average annual earnings of $64,500, while those with high school diploma education have the smallest earnings of $30,642.
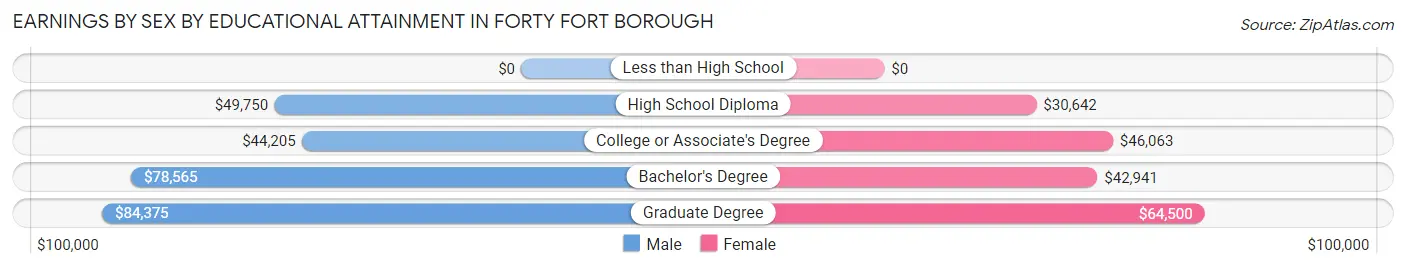
| Educational Attainment | Male Income | Female Income |
| Less than High School | - | - |
| High School Diploma | $49,750 | $30,642 |
| College or Associate's Degree | $44,205 | $46,063 |
| Bachelor's Degree | $78,565 | $42,941 |
| Graduate Degree | $84,375 | $64,500 |
| Total | $52,647 | $42,781 |
Family Income in Forty Fort borough
Family Income Brackets in Forty Fort borough
According to the Forty Fort borough family income data, there are 349 families falling into the $100,000 to $149,999 income range, which is the most common income bracket and makes up 31.7% of all families. Conversely, the less than $10,000 income bracket is the least frequent group with only 6 families (0.5%) belonging to this category.
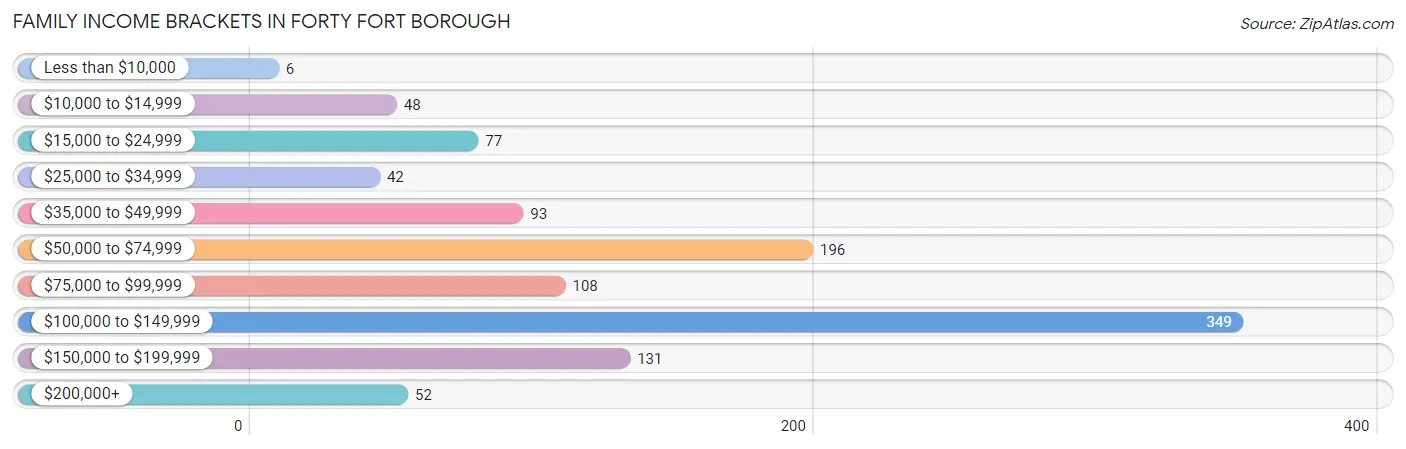
| Income Bracket | # Families | % Families |
| Less than $10,000 | 6 | 0.5% |
| $10,000 to $14,999 | 48 | 4.4% |
| $15,000 to $24,999 | 77 | 7.0% |
| $25,000 to $34,999 | 42 | 3.8% |
| $35,000 to $49,999 | 93 | 8.4% |
| $50,000 to $74,999 | 196 | 17.8% |
| $75,000 to $99,999 | 108 | 9.8% |
| $100,000 to $149,999 | 349 | 31.7% |
| $150,000 to $199,999 | 131 | 11.9% |
| $200,000+ | 52 | 4.7% |
Family Income by Famaliy Size in Forty Fort borough
4-person families (118 | 10.7%) account for the highest median family income in Forty Fort borough with $117,976 per family, while 2-person families (513 | 46.6%) have the highest median income of $38,807 per family member.
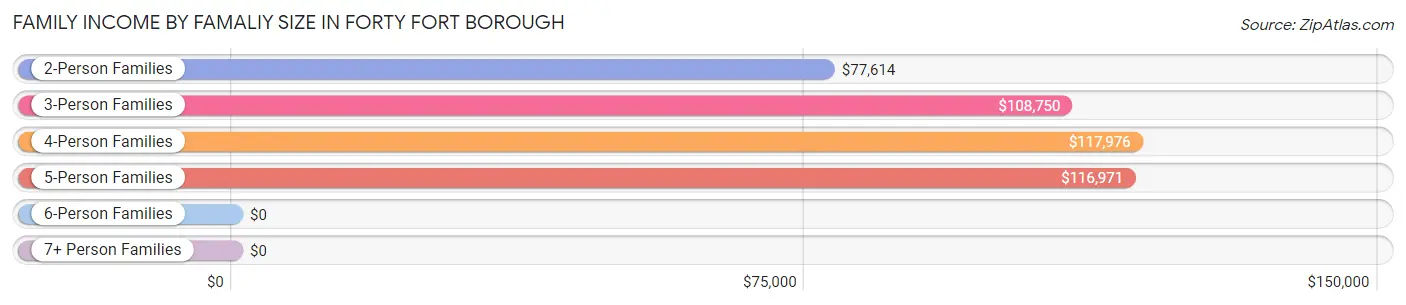
| Income Bracket | # Families | Median Income |
| 2-Person Families | 513 (46.6%) | $77,614 |
| 3-Person Families | 360 (32.7%) | $108,750 |
| 4-Person Families | 118 (10.7%) | $117,976 |
| 5-Person Families | 71 (6.4%) | $116,971 |
| 6-Person Families | 15 (1.4%) | $0 |
| 7+ Person Families | 25 (2.3%) | $0 |
| Total | 1,102 (100.0%) | $95,870 |
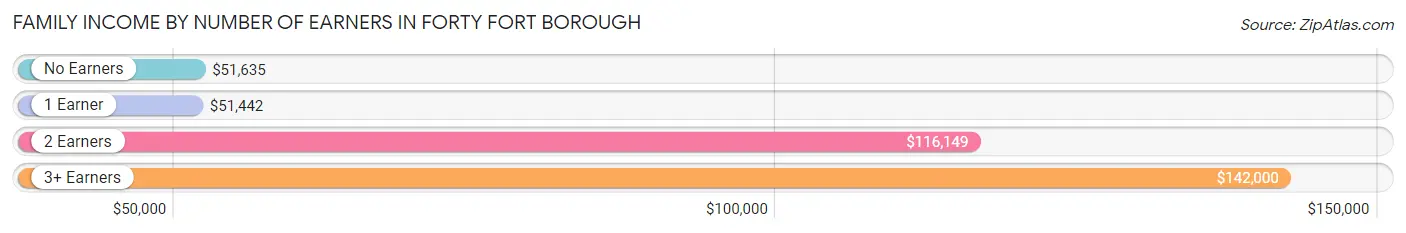
Family Income by Number of Earners in Forty Fort borough
The median family income in Forty Fort borough is $95,870, with families comprising 3+ earners (180) having the highest median family income of $142,000, while families with 1 earner (377) have the lowest median family income of $51,442, accounting for 16.3% and 34.2% of families, respectively.
| Number of Earners | # Families | Median Income |
| No Earners | 119 (10.8%) | $51,635 |
| 1 Earner | 377 (34.2%) | $51,442 |
| 2 Earners | 426 (38.7%) | $116,149 |
| 3+ Earners | 180 (16.3%) | $142,000 |
| Total | 1,102 (100.0%) | $95,870 |
Household Income in Forty Fort borough
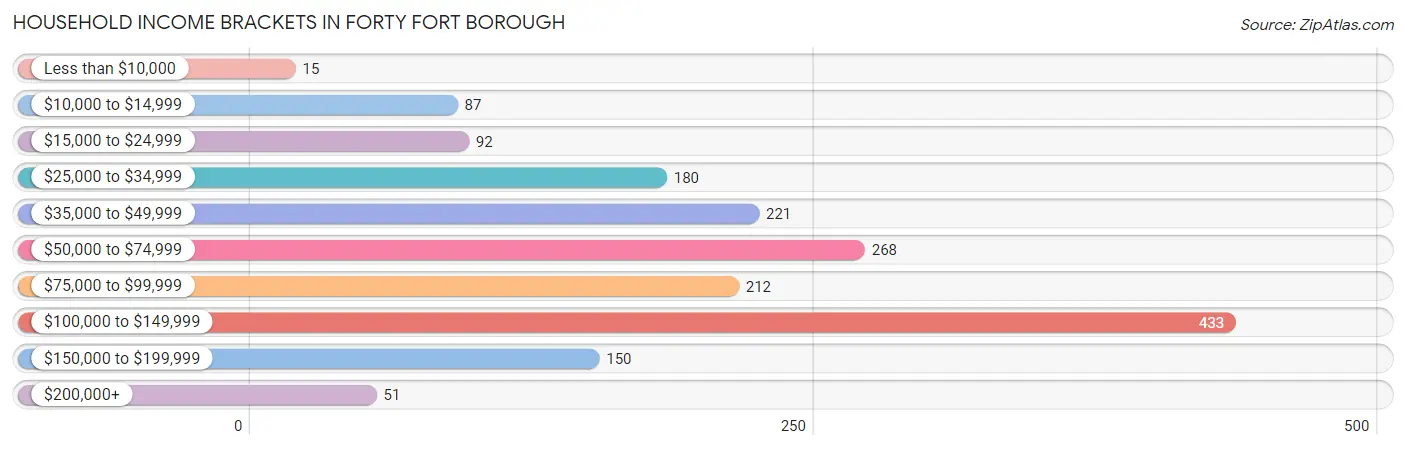
Household Income Brackets in Forty Fort borough
With 433 households falling in the category, the $100,000 to $149,999 income range is the most frequent in Forty Fort borough, accounting for 25.3% of all households. In contrast, only 15 households (0.9%) fall into the less than $10,000 income bracket, making it the least populous group.
| Income Bracket | # Households | % Households |
| Less than $10,000 | 15 | 0.9% |
| $10,000 to $14,999 | 87 | 5.1% |
| $15,000 to $24,999 | 92 | 5.4% |
| $25,000 to $34,999 | 180 | 10.5% |
| $35,000 to $49,999 | 221 | 12.9% |
| $50,000 to $74,999 | 268 | 15.7% |
| $75,000 to $99,999 | 212 | 12.4% |
| $100,000 to $149,999 | 433 | 25.3% |
| $150,000 to $199,999 | 150 | 8.8% |
| $200,000+ | 51 | 3.0% |
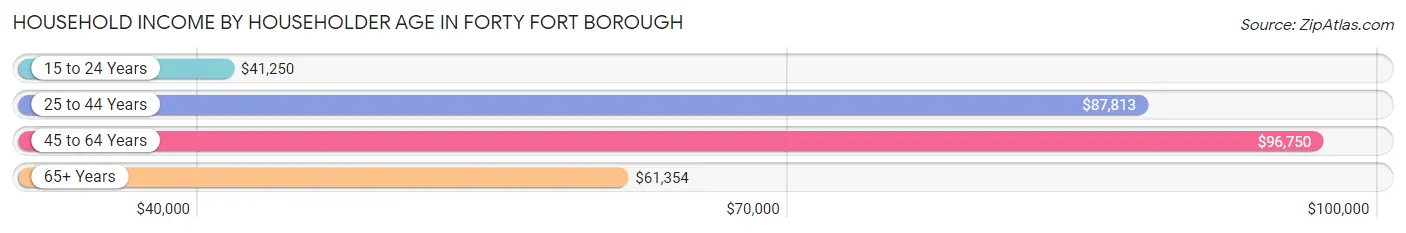
Household Income by Householder Age in Forty Fort borough
The median household income in Forty Fort borough is $74,091, with the highest median household income of $96,750 found in the 45 to 64 years age bracket for the primary householder. A total of 545 households (31.9%) fall into this category. Meanwhile, the 15 to 24 years age bracket for the primary householder has the lowest median household income of $41,250, with 42 households (2.5%) in this group.
| Income Bracket | # Households | Median Income |
| 15 to 24 Years | 42 (2.5%) | $41,250 |
| 25 to 44 Years | 671 (39.2%) | $87,813 |
| 45 to 64 Years | 545 (31.9%) | $96,750 |
| 65+ Years | 452 (26.4%) | $61,354 |
| Total | 1,710 (100.0%) | $74,091 |
Poverty in Forty Fort borough
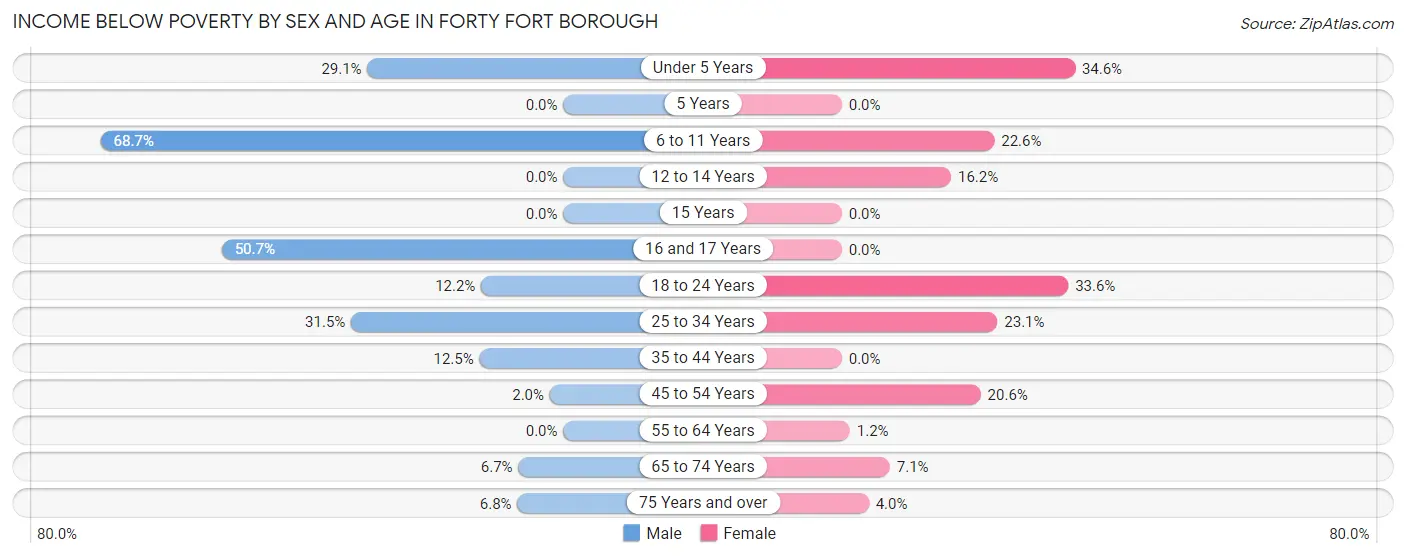
Income Below Poverty by Sex and Age in Forty Fort borough
With 18.5% poverty level for males and 13.0% for females among the residents of Forty Fort borough, 6 to 11 year old males and under 5 year old females are the most vulnerable to poverty, with 101 males (68.7%) and 9 females (34.6%) in their respective age groups living below the poverty level.
| Age Bracket | Male | Female |
| Under 5 Years | 48 (29.1%) | 9 (34.6%) |
| 5 Years | 0 (0.0%) | 0 (0.0%) |
| 6 to 11 Years | 101 (68.7%) | 24 (22.6%) |
| 12 to 14 Years | 0 (0.0%) | 18 (16.2%) |
| 15 Years | 0 (0.0%) | 0 (0.0%) |
| 16 and 17 Years | 35 (50.7%) | 0 (0.0%) |
| 18 to 24 Years | 15 (12.2%) | 79 (33.6%) |
| 25 to 34 Years | 115 (31.5%) | 76 (23.1%) |
| 35 to 44 Years | 58 (12.4%) | 0 (0.0%) |
| 45 to 54 Years | 3 (2.0%) | 40 (20.6%) |
| 55 to 64 Years | 0 (0.0%) | 4 (1.2%) |
| 65 to 74 Years | 15 (6.7%) | 14 (7.1%) |
| 75 Years and over | 6 (6.8%) | 8 (4.0%) |
| Total | 396 (18.5%) | 272 (13.0%) |
Income Above Poverty by Sex and Age in Forty Fort borough
According to the poverty statistics in Forty Fort borough, males aged 12 to 14 years and females aged 15 years are the age groups that are most secure financially, with 100.0% of males and 100.0% of females in these age groups living above the poverty line.
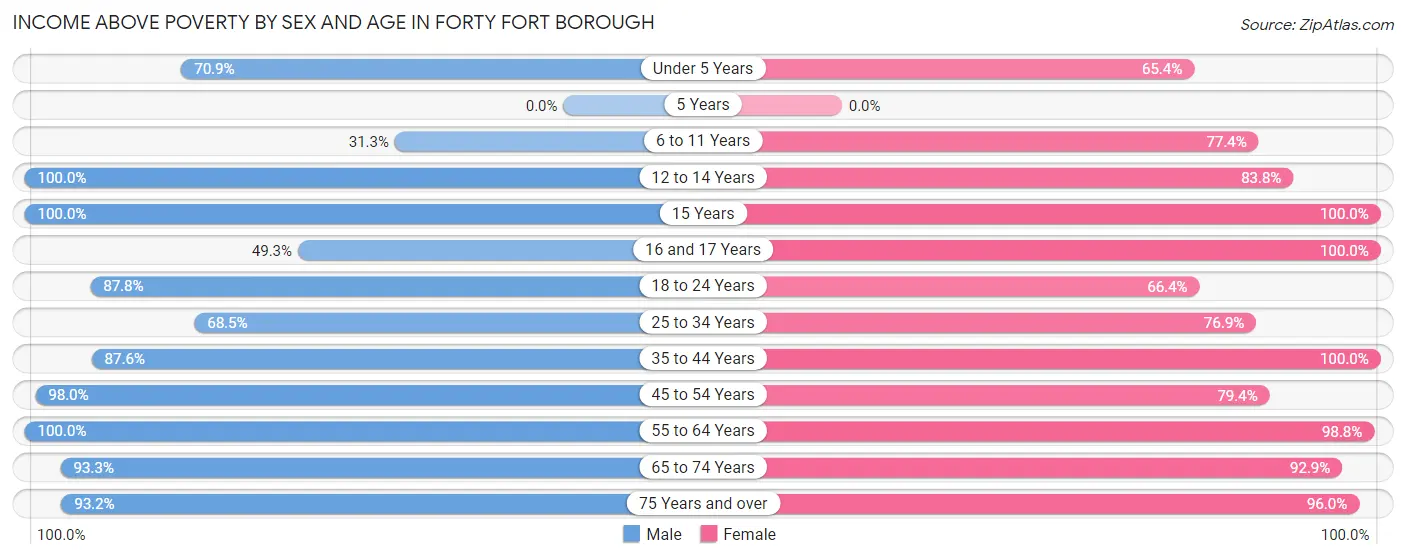
| Age Bracket | Male | Female |
| Under 5 Years | 117 (70.9%) | 17 (65.4%) |
| 5 Years | 0 (0.0%) | 0 (0.0%) |
| 6 to 11 Years | 46 (31.3%) | 82 (77.4%) |
| 12 to 14 Years | 48 (100.0%) | 93 (83.8%) |
| 15 Years | 14 (100.0%) | 40 (100.0%) |
| 16 and 17 Years | 34 (49.3%) | 38 (100.0%) |
| 18 to 24 Years | 108 (87.8%) | 156 (66.4%) |
| 25 to 34 Years | 250 (68.5%) | 253 (76.9%) |
| 35 to 44 Years | 408 (87.5%) | 291 (100.0%) |
| 45 to 54 Years | 147 (98.0%) | 154 (79.4%) |
| 55 to 64 Years | 283 (100.0%) | 329 (98.8%) |
| 65 to 74 Years | 210 (93.3%) | 182 (92.9%) |
| 75 Years and over | 82 (93.2%) | 192 (96.0%) |
| Total | 1,747 (81.5%) | 1,827 (87.0%) |
Income Below Poverty Among Married-Couple Families in Forty Fort borough
The poverty statistics for married-couple families in Forty Fort borough show that 4.6% or 39 of the total 840 families live below the poverty line. Families with 5 or more children have the highest poverty rate of 100.0%, comprising of 25 families. On the other hand, families with 1 or 2 children have the lowest poverty rate of 0.0%, which includes 0 families.
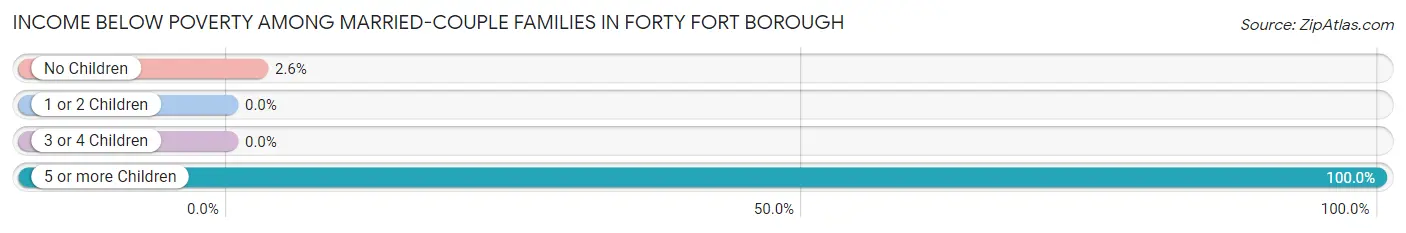
| Children | Above Poverty | Below Poverty |
| No Children | 522 (97.4%) | 14 (2.6%) |
| 1 or 2 Children | 247 (100.0%) | 0 (0.0%) |
| 3 or 4 Children | 32 (100.0%) | 0 (0.0%) |
| 5 or more Children | 0 (0.0%) | 25 (100.0%) |
| Total | 801 (95.4%) | 39 (4.6%) |
Income Below Poverty Among Single-Parent Households in Forty Fort borough
According to the poverty data in Forty Fort borough, 57.1% or 40 single-father households and 18.8% or 36 single-mother households are living below the poverty line. Among single-father households, those with 1 or 2 children have the highest poverty rate, with 40 households (81.6%) experiencing poverty. Likewise, among single-mother households, those with 1 or 2 children have the highest poverty rate, with 32 households (50.8%) falling below the poverty line.
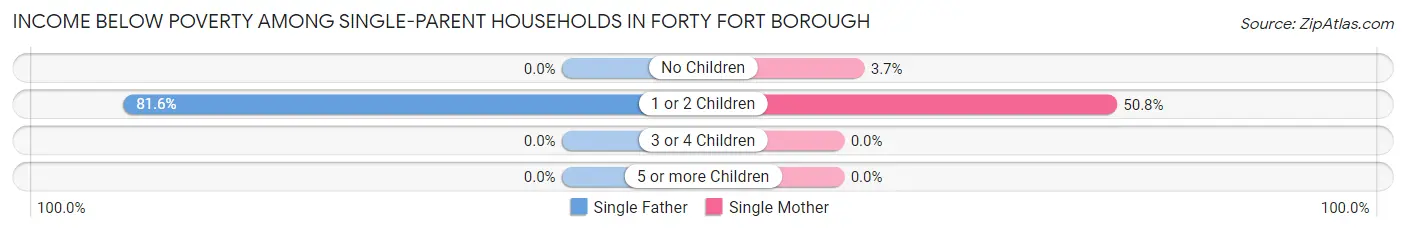
| Children | Single Father | Single Mother |
| No Children | 0 (0.0%) | 4 (3.7%) |
| 1 or 2 Children | 40 (81.6%) | 32 (50.8%) |
| 3 or 4 Children | 0 (0.0%) | 0 (0.0%) |
| 5 or more Children | 0 (0.0%) | 0 (0.0%) |
| Total | 40 (57.1%) | 36 (18.8%) |
Income Below Poverty Among Married-Couple vs Single-Parent Households in Forty Fort borough
The poverty data for Forty Fort borough shows that 39 of the married-couple family households (4.6%) and 76 of the single-parent households (29.0%) are living below the poverty level. Within the married-couple family households, those with 5 or more children have the highest poverty rate, with 25 households (100.0%) falling below the poverty line. Among the single-parent households, those with 1 or 2 children have the highest poverty rate, with 72 household (64.3%) living below poverty.
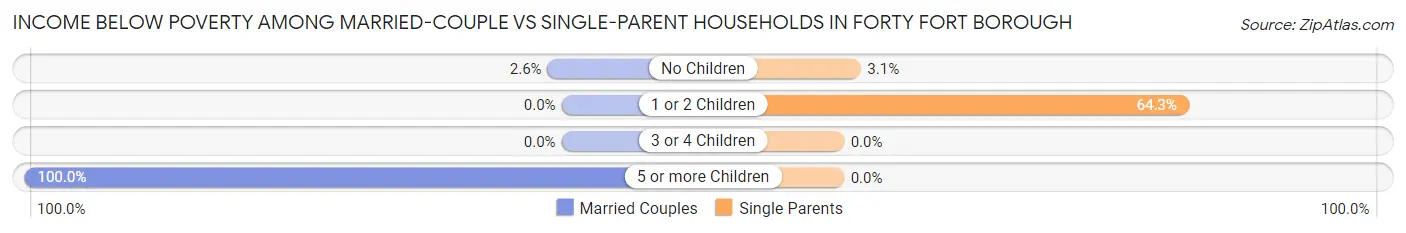
| Children | Married-Couple Families | Single-Parent Households |
| No Children | 14 (2.6%) | 4 (3.1%) |
| 1 or 2 Children | 0 (0.0%) | 72 (64.3%) |
| 3 or 4 Children | 0 (0.0%) | 0 (0.0%) |
| 5 or more Children | 25 (100.0%) | 0 (0.0%) |
| Total | 39 (4.6%) | 76 (29.0%) |
Employment Characteristics in Forty Fort borough
Employment by Class of Employer in Forty Fort borough
Among the 2,309 employed individuals in Forty Fort borough, private company employees (1,591 | 68.9%), not-for-profit organizations (229 | 9.9%), and state government employees (174 | 7.5%) make up the most common classes of employment.
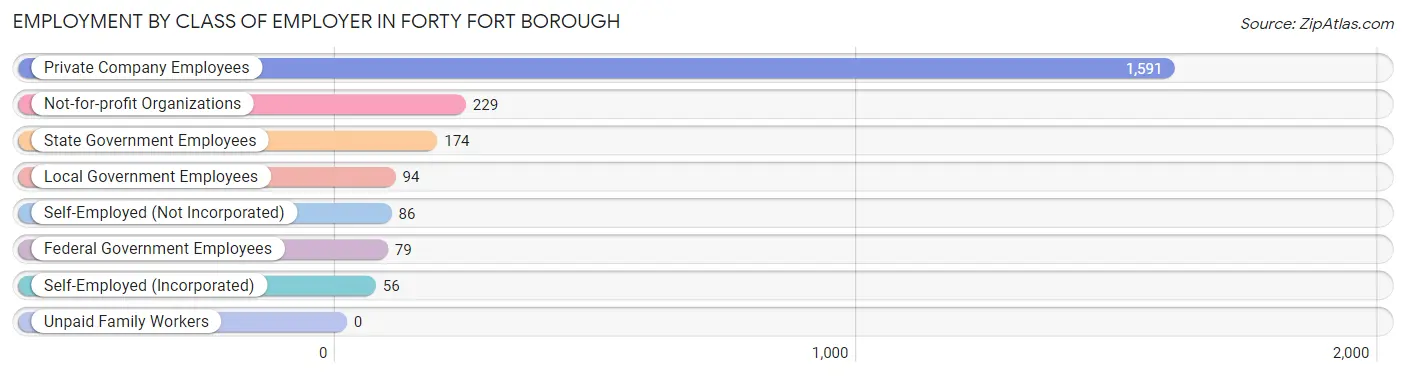
| Employer Class | # Employees | % Employees |
| Private Company Employees | 1,591 | 68.9% |
| Self-Employed (Incorporated) | 56 | 2.4% |
| Self-Employed (Not Incorporated) | 86 | 3.7% |
| Not-for-profit Organizations | 229 | 9.9% |
| Local Government Employees | 94 | 4.1% |
| State Government Employees | 174 | 7.5% |
| Federal Government Employees | 79 | 3.4% |
| Unpaid Family Workers | 0 | 0.0% |
| Total | 2,309 | 100.0% |
Employment Status by Age in Forty Fort borough
According to the labor force statistics for Forty Fort borough, out of the total population over 16 years of age (3,585), 71.5% or 2,563 individuals are in the labor force, with 8.8% or 226 of them unemployed. The age group with the highest labor force participation rate is 20 to 24 years, with 94.1% or 270 individuals in the labor force. Within the labor force, the 16 to 19 years age range has the highest percentage of unemployed individuals, with 31.4% or 33 of them being unemployed.
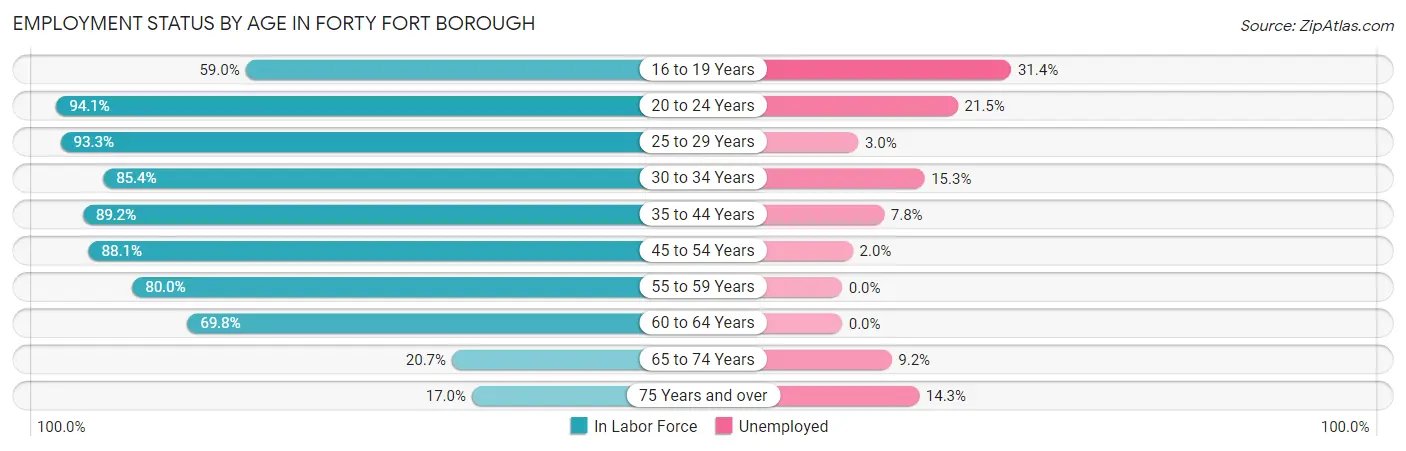
| Age Bracket | In Labor Force | Unemployed |
| 16 to 19 Years | 105 (59.0%) | 33 (31.4%) |
| 20 to 24 Years | 270 (94.1%) | 58 (21.5%) |
| 25 to 29 Years | 263 (93.3%) | 8 (3.0%) |
| 30 to 34 Years | 352 (85.4%) | 54 (15.3%) |
| 35 to 44 Years | 675 (89.2%) | 53 (7.8%) |
| 45 to 54 Years | 303 (88.1%) | 6 (2.0%) |
| 55 to 59 Years | 228 (80.0%) | 0 (0.0%) |
| 60 to 64 Years | 231 (69.8%) | 0 (0.0%) |
| 65 to 74 Years | 87 (20.7%) | 8 (9.2%) |
| 75 Years and over | 49 (17.0%) | 7 (14.3%) |
| Total | 2,563 (71.5%) | 226 (8.8%) |
Employment Status by Educational Attainment in Forty Fort borough
According to labor force statistics for Forty Fort borough, 85.1% of individuals (2,052) out of the total population between 25 and 64 years of age (2,411) are in the labor force, with 5.9% or 121 of them being unemployed. The group with the highest labor force participation rate are those with the educational attainment of college / associate degree, with 90.8% or 977 individuals in the labor force. Within the labor force, individuals with college / associate degree education have the highest percentage of unemployment, with 11.6% or 113 of them being unemployed.
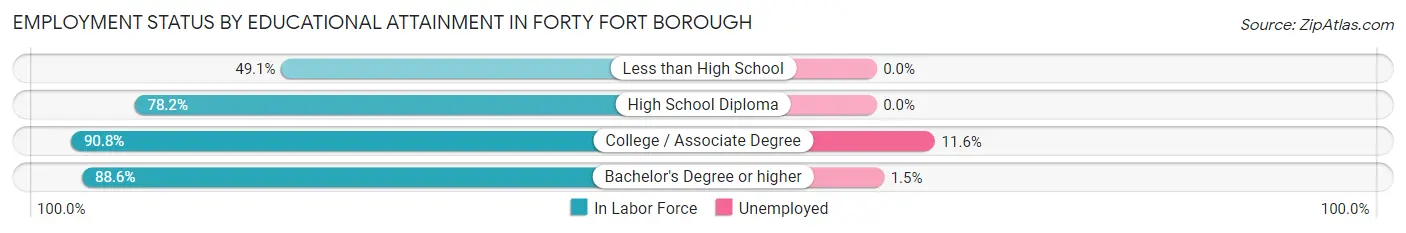
| Educational Attainment | In Labor Force | Unemployed |
| Less than High School | 53 (49.1%) | 0 (0.0%) |
| High School Diploma | 488 (78.2%) | 0 (0.0%) |
| College / Associate Degree | 977 (90.8%) | 125 (11.6%) |
| Bachelor's Degree or higher | 534 (88.6%) | 9 (1.5%) |
| Total | 2,052 (85.1%) | 142 (5.9%) |
Employment Occupations by Sex in Forty Fort borough
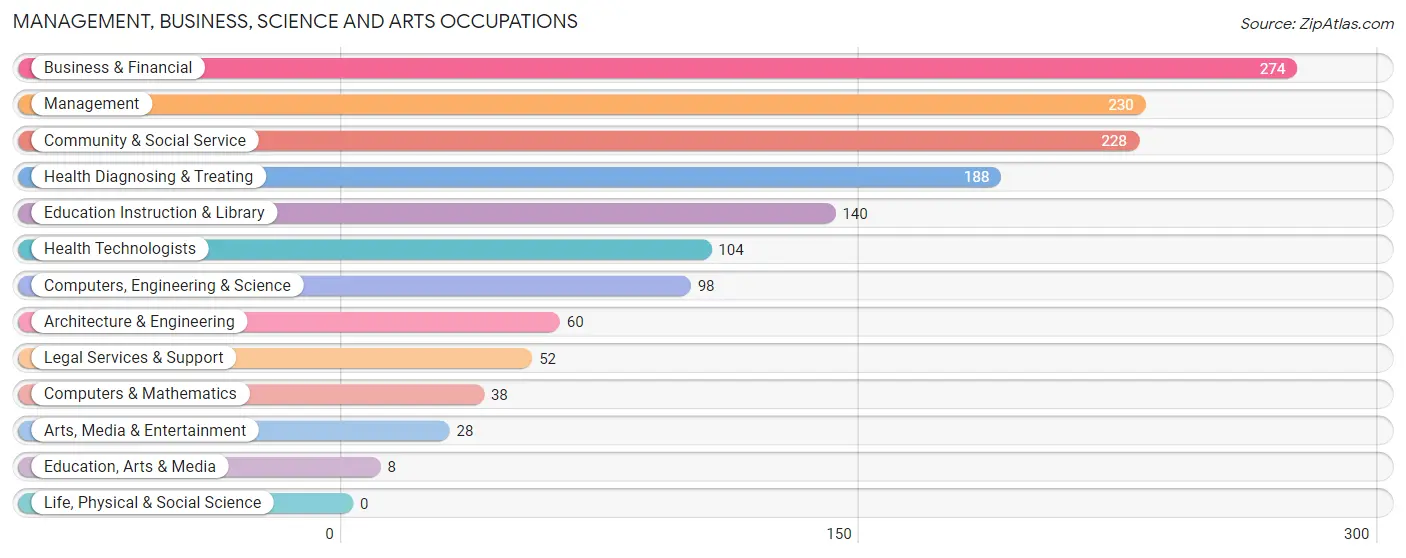
Management, Business, Science and Arts Occupations
The most common Management, Business, Science and Arts occupations in Forty Fort borough are Business & Financial (274 | 11.8%), Management (230 | 9.9%), Community & Social Service (228 | 9.8%), Health Diagnosing & Treating (188 | 8.1%), and Education Instruction & Library (140 | 6.0%).
Management, Business, Science and Arts Occupations by Sex
Within the Management, Business, Science and Arts occupations in Forty Fort borough, the most male-oriented occupations are Education, Arts & Media (100.0%), Legal Services & Support (100.0%), and Arts, Media & Entertainment (85.7%), while the most female-oriented occupations are Health Diagnosing & Treating (79.8%), Education Instruction & Library (78.6%), and Health Technologists (63.5%).
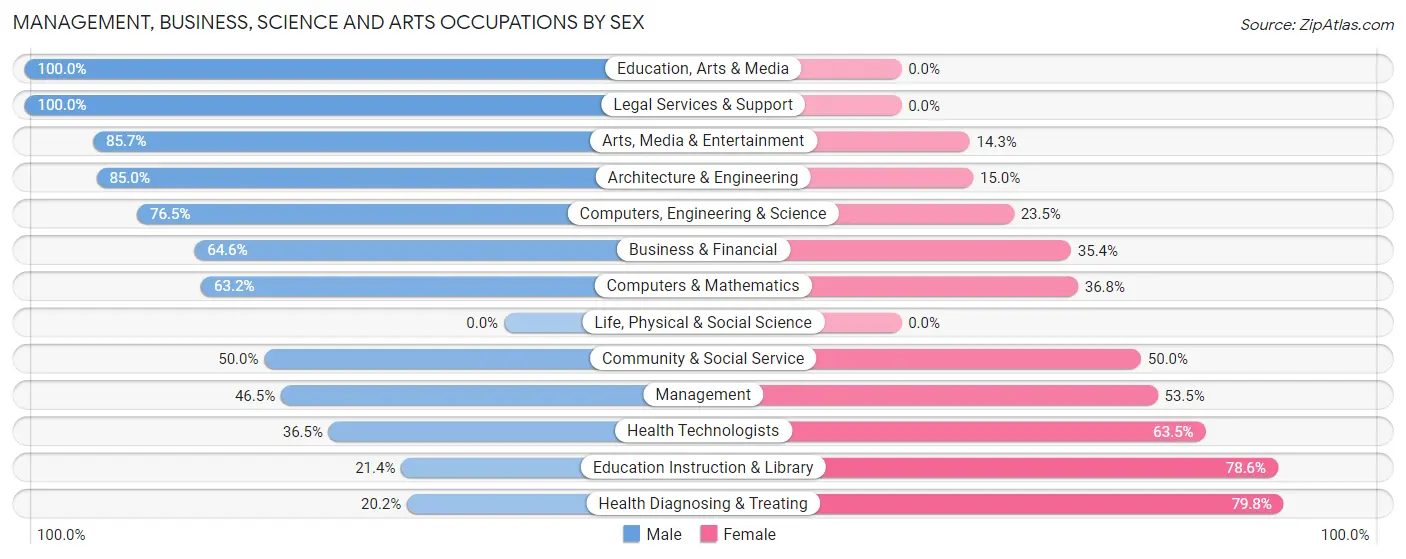
| Occupation | Male | Female |
| Management | 107 (46.5%) | 123 (53.5%) |
| Business & Financial | 177 (64.6%) | 97 (35.4%) |
| Computers, Engineering & Science | 75 (76.5%) | 23 (23.5%) |
| Computers & Mathematics | 24 (63.2%) | 14 (36.8%) |
| Architecture & Engineering | 51 (85.0%) | 9 (15.0%) |
| Life, Physical & Social Science | 0 (0.0%) | 0 (0.0%) |
| Community & Social Service | 114 (50.0%) | 114 (50.0%) |
| Education, Arts & Media | 8 (100.0%) | 0 (0.0%) |
| Legal Services & Support | 52 (100.0%) | 0 (0.0%) |
| Education Instruction & Library | 30 (21.4%) | 110 (78.6%) |
| Arts, Media & Entertainment | 24 (85.7%) | 4 (14.3%) |
| Health Diagnosing & Treating | 38 (20.2%) | 150 (79.8%) |
| Health Technologists | 38 (36.5%) | 66 (63.5%) |
| Total (Category) | 511 (50.2%) | 507 (49.8%) |
| Total (Overall) | 1,221 (52.4%) | 1,108 (47.6%) |
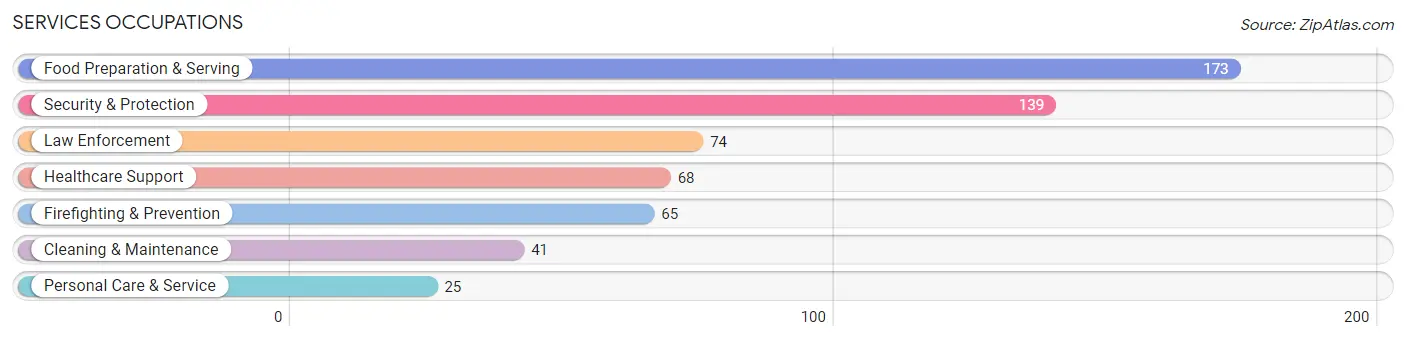
Services Occupations
The most common Services occupations in Forty Fort borough are Food Preparation & Serving (173 | 7.4%), Security & Protection (139 | 6.0%), Law Enforcement (74 | 3.2%), Healthcare Support (68 | 2.9%), and Firefighting & Prevention (65 | 2.8%).
Services Occupations by Sex
Within the Services occupations in Forty Fort borough, the most male-oriented occupations are Law Enforcement (100.0%), Security & Protection (94.2%), and Firefighting & Prevention (87.7%), while the most female-oriented occupations are Healthcare Support (82.4%), Food Preparation & Serving (70.5%), and Personal Care & Service (52.0%).
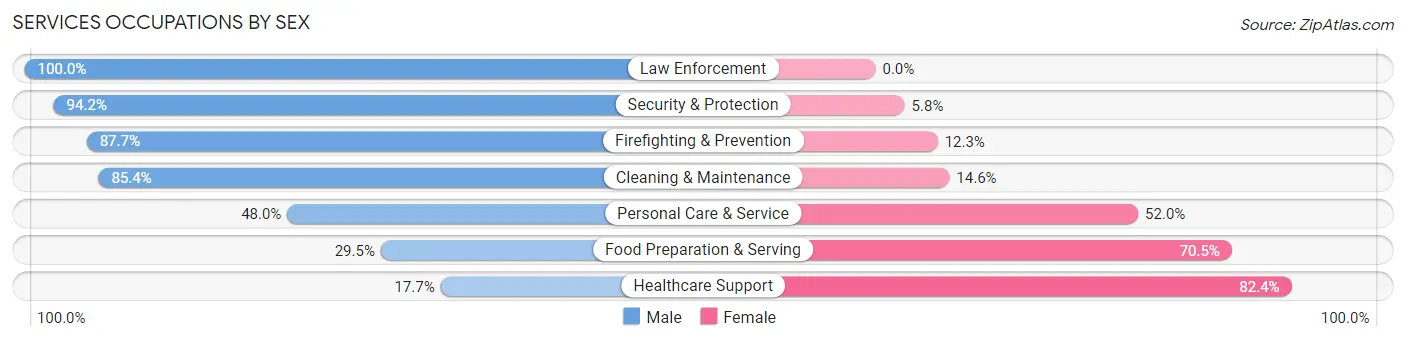
| Occupation | Male | Female |
| Healthcare Support | 12 (17.6%) | 56 (82.4%) |
| Security & Protection | 131 (94.2%) | 8 (5.8%) |
| Firefighting & Prevention | 57 (87.7%) | 8 (12.3%) |
| Law Enforcement | 74 (100.0%) | 0 (0.0%) |
| Food Preparation & Serving | 51 (29.5%) | 122 (70.5%) |
| Cleaning & Maintenance | 35 (85.4%) | 6 (14.6%) |
| Personal Care & Service | 12 (48.0%) | 13 (52.0%) |
| Total (Category) | 241 (54.0%) | 205 (46.0%) |
| Total (Overall) | 1,221 (52.4%) | 1,108 (47.6%) |
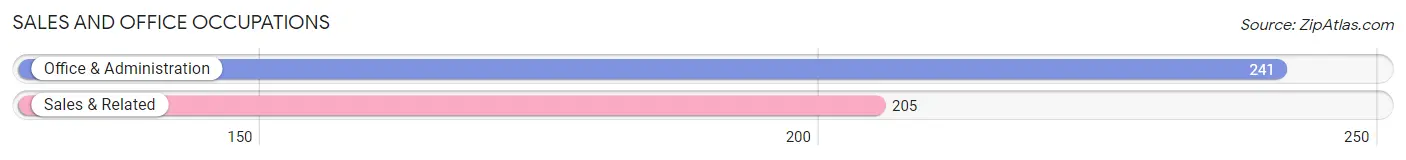
Sales and Office Occupations
The most common Sales and Office occupations in Forty Fort borough are Office & Administration (241 | 10.3%), and Sales & Related (205 | 8.8%).
Sales and Office Occupations by Sex
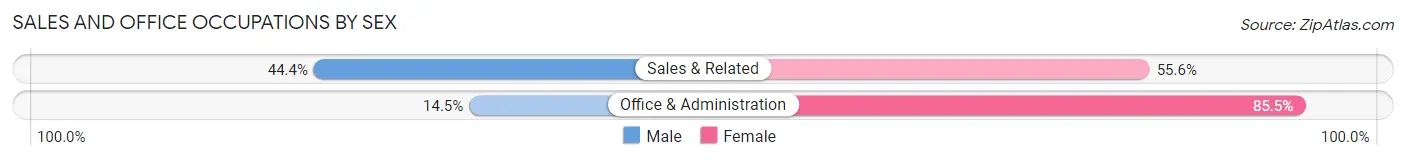
| Occupation | Male | Female |
| Sales & Related | 91 (44.4%) | 114 (55.6%) |
| Office & Administration | 35 (14.5%) | 206 (85.5%) |
| Total (Category) | 126 (28.2%) | 320 (71.8%) |
| Total (Overall) | 1,221 (52.4%) | 1,108 (47.6%) |
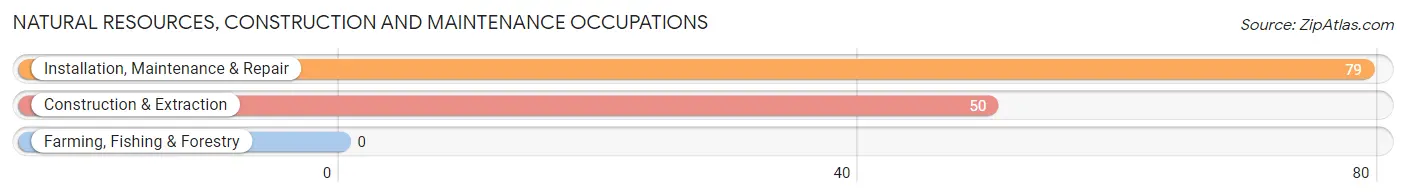
Natural Resources, Construction and Maintenance Occupations
The most common Natural Resources, Construction and Maintenance occupations in Forty Fort borough are Installation, Maintenance & Repair (79 | 3.4%), and Construction & Extraction (50 | 2.1%).
Natural Resources, Construction and Maintenance Occupations by Sex
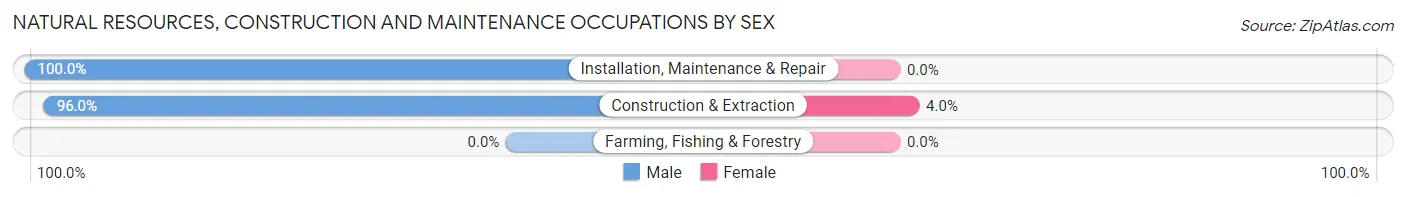
| Occupation | Male | Female |
| Farming, Fishing & Forestry | 0 (0.0%) | 0 (0.0%) |
| Construction & Extraction | 48 (96.0%) | 2 (4.0%) |
| Installation, Maintenance & Repair | 79 (100.0%) | 0 (0.0%) |
| Total (Category) | 127 (98.5%) | 2 (1.5%) |
| Total (Overall) | 1,221 (52.4%) | 1,108 (47.6%) |
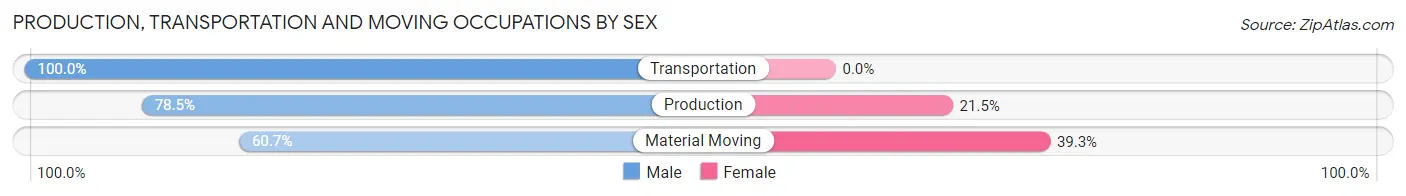
Production, Transportation and Moving Occupations
The most common Production, Transportation and Moving occupations in Forty Fort borough are Material Moving (122 | 5.2%), Production (121 | 5.2%), and Transportation (47 | 2.0%).
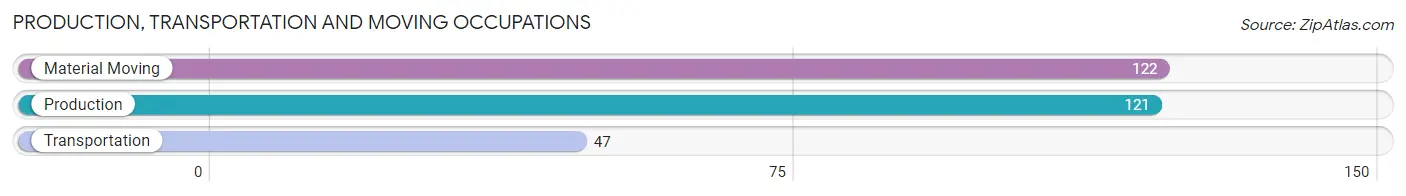
Production, Transportation and Moving Occupations by Sex
| Occupation | Male | Female |
| Production | 95 (78.5%) | 26 (21.5%) |
| Transportation | 47 (100.0%) | 0 (0.0%) |
| Material Moving | 74 (60.7%) | 48 (39.3%) |
| Total (Category) | 216 (74.5%) | 74 (25.5%) |
| Total (Overall) | 1,221 (52.4%) | 1,108 (47.6%) |
Employment Industries by Sex in Forty Fort borough
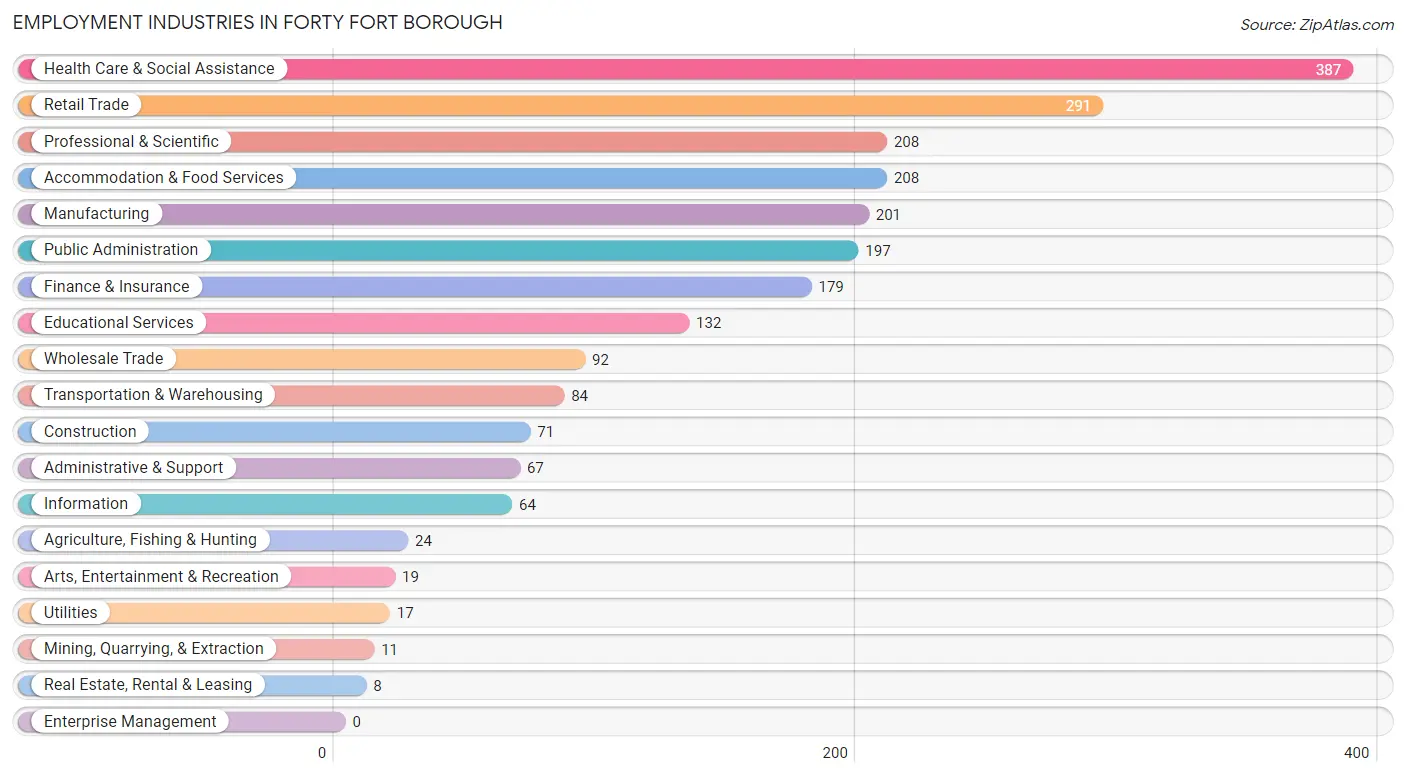
Employment Industries in Forty Fort borough
The major employment industries in Forty Fort borough include Health Care & Social Assistance (387 | 16.6%), Retail Trade (291 | 12.5%), Professional & Scientific (208 | 8.9%), Accommodation & Food Services (208 | 8.9%), and Manufacturing (201 | 8.6%).
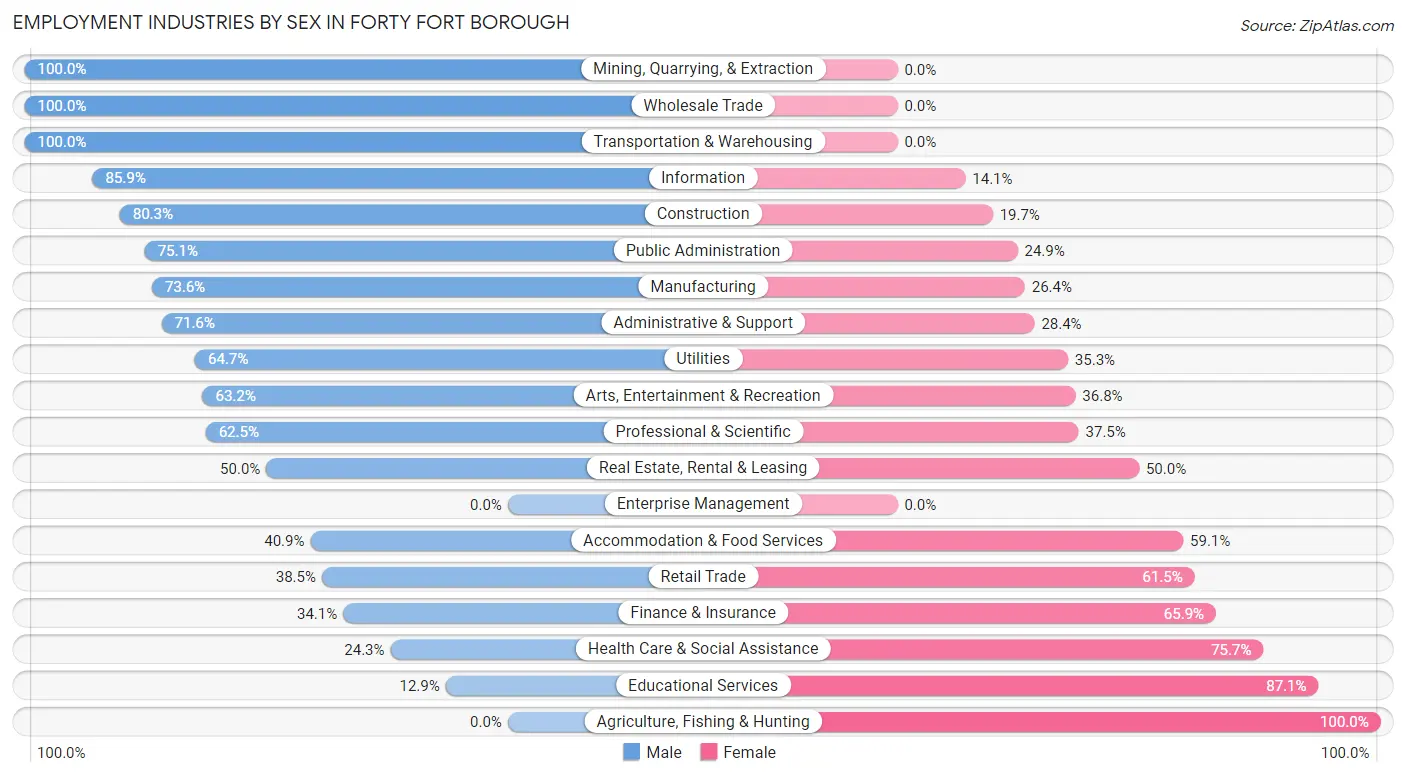
Employment Industries by Sex in Forty Fort borough
The Forty Fort borough industries that see more men than women are Mining, Quarrying, & Extraction (100.0%), Wholesale Trade (100.0%), and Transportation & Warehousing (100.0%), whereas the industries that tend to have a higher number of women are Agriculture, Fishing & Hunting (100.0%), Educational Services (87.1%), and Health Care & Social Assistance (75.7%).
| Industry | Male | Female |
| Agriculture, Fishing & Hunting | 0 (0.0%) | 24 (100.0%) |
| Mining, Quarrying, & Extraction | 11 (100.0%) | 0 (0.0%) |
| Construction | 57 (80.3%) | 14 (19.7%) |
| Manufacturing | 148 (73.6%) | 53 (26.4%) |
| Wholesale Trade | 92 (100.0%) | 0 (0.0%) |
| Retail Trade | 112 (38.5%) | 179 (61.5%) |
| Transportation & Warehousing | 84 (100.0%) | 0 (0.0%) |
| Utilities | 11 (64.7%) | 6 (35.3%) |
| Information | 55 (85.9%) | 9 (14.1%) |
| Finance & Insurance | 61 (34.1%) | 118 (65.9%) |
| Real Estate, Rental & Leasing | 4 (50.0%) | 4 (50.0%) |
| Professional & Scientific | 130 (62.5%) | 78 (37.5%) |
| Enterprise Management | 0 (0.0%) | 0 (0.0%) |
| Administrative & Support | 48 (71.6%) | 19 (28.4%) |
| Educational Services | 17 (12.9%) | 115 (87.1%) |
| Health Care & Social Assistance | 94 (24.3%) | 293 (75.7%) |
| Arts, Entertainment & Recreation | 12 (63.2%) | 7 (36.8%) |
| Accommodation & Food Services | 85 (40.9%) | 123 (59.1%) |
| Public Administration | 148 (75.1%) | 49 (24.9%) |
| Total | 1,221 (52.4%) | 1,108 (47.6%) |
Education in Forty Fort borough
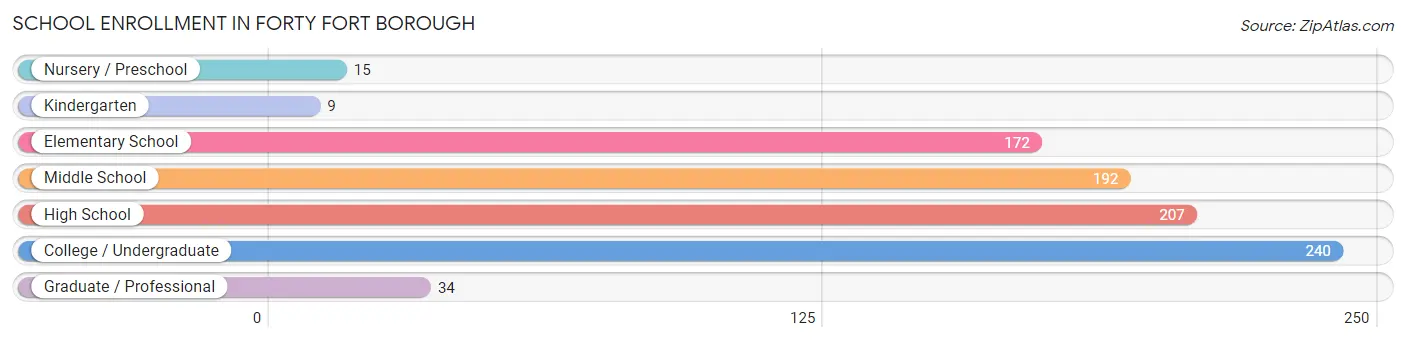
School Enrollment in Forty Fort borough
The most common levels of schooling among the 869 students in Forty Fort borough are college / undergraduate (240 | 27.6%), high school (207 | 23.8%), and middle school (192 | 22.1%).
| School Level | # Students | % Students |
| Nursery / Preschool | 15 | 1.7% |
| Kindergarten | 9 | 1.0% |
| Elementary School | 172 | 19.8% |
| Middle School | 192 | 22.1% |
| High School | 207 | 23.8% |
| College / Undergraduate | 240 | 27.6% |
| Graduate / Professional | 34 | 3.9% |
| Total | 869 | 100.0% |
School Enrollment by Age by Funding Source in Forty Fort borough
Out of a total of 869 students who are enrolled in schools in Forty Fort borough, 216 (24.9%) attend a private institution, while the remaining 653 (75.1%) are enrolled in public schools. The age group of 20 to 24 year olds has the highest likelihood of being enrolled in private schools, with 130 (75.1% in the age bracket) enrolled. Conversely, the age group of 3 to 4 year olds has the lowest likelihood of being enrolled in a private school, with 15 (100.0% in the age bracket) attending a public institution.
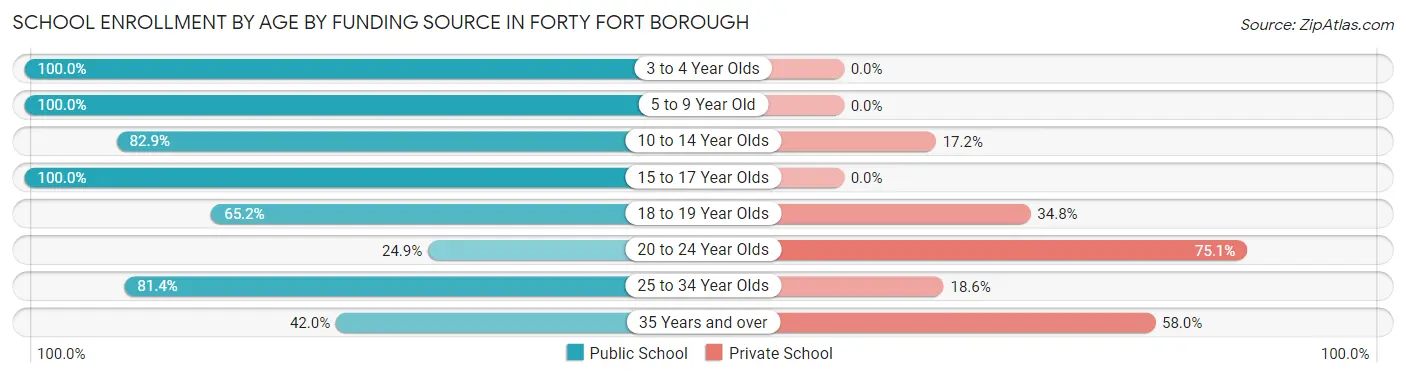
| Age Bracket | Public School | Private School |
| 3 to 4 Year Olds | 15 (100.0%) | 0 (0.0%) |
| 5 to 9 Year Old | 165 (100.0%) | 0 (0.0%) |
| 10 to 14 Year Olds | 198 (82.9%) | 41 (17.2%) |
| 15 to 17 Year Olds | 161 (100.0%) | 0 (0.0%) |
| 18 to 19 Year Olds | 15 (65.2%) | 8 (34.8%) |
| 20 to 24 Year Olds | 43 (24.9%) | 130 (75.1%) |
| 25 to 34 Year Olds | 35 (81.4%) | 8 (18.6%) |
| 35 Years and over | 21 (42.0%) | 29 (58.0%) |
| Total | 653 (75.1%) | 216 (24.9%) |
Educational Attainment by Field of Study in Forty Fort borough
Business (260 | 31.8%), education (129 | 15.8%), science & technology (95 | 11.6%), social sciences (78 | 9.6%), and liberal arts & history (71 | 8.7%) are the most common fields of study among 817 individuals in Forty Fort borough who have obtained a bachelor's degree or higher.
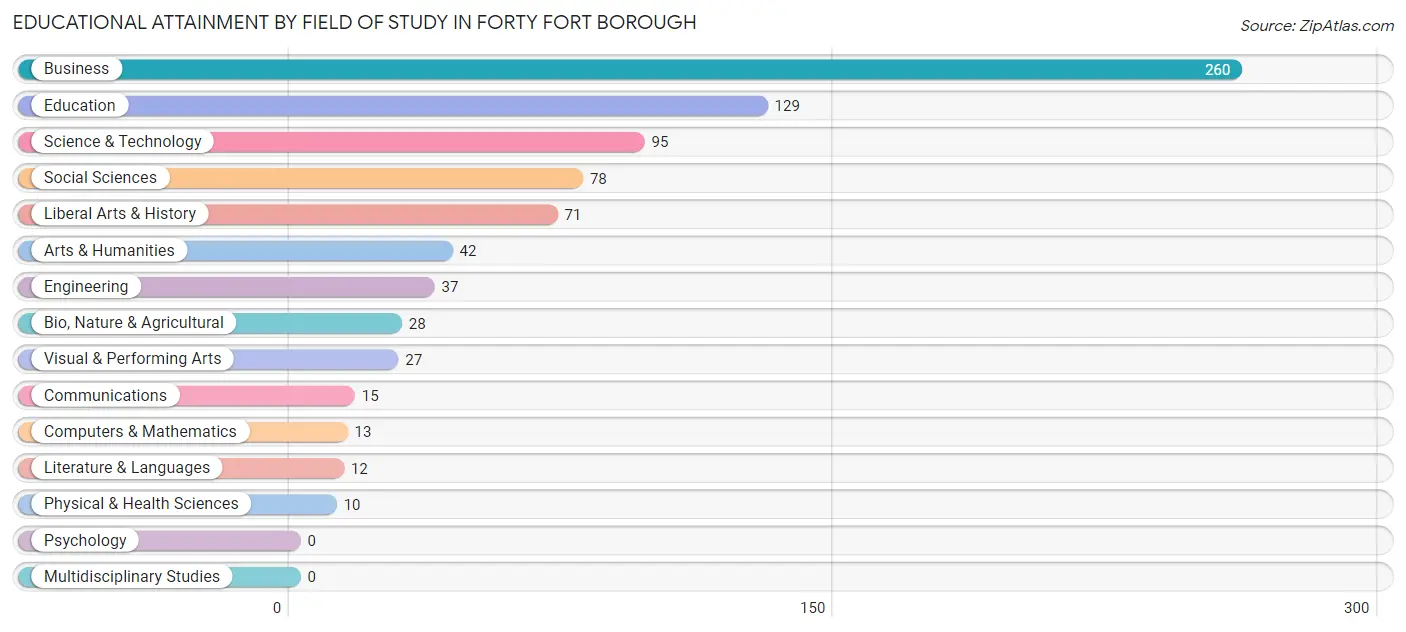
| Field of Study | # Graduates | % Graduates |
| Computers & Mathematics | 13 | 1.6% |
| Bio, Nature & Agricultural | 28 | 3.4% |
| Physical & Health Sciences | 10 | 1.2% |
| Psychology | 0 | 0.0% |
| Social Sciences | 78 | 9.6% |
| Engineering | 37 | 4.5% |
| Multidisciplinary Studies | 0 | 0.0% |
| Science & Technology | 95 | 11.6% |
| Business | 260 | 31.8% |
| Education | 129 | 15.8% |
| Literature & Languages | 12 | 1.5% |
| Liberal Arts & History | 71 | 8.7% |
| Visual & Performing Arts | 27 | 3.3% |
| Communications | 15 | 1.8% |
| Arts & Humanities | 42 | 5.1% |
| Total | 817 | 100.0% |
Transportation & Commute in Forty Fort borough
Vehicle Availability by Sex in Forty Fort borough
The most prevalent vehicle ownership categories in Forty Fort borough are males with 2 vehicles (490, accounting for 40.7%) and females with 2 vehicles (325, making up 44.4%).
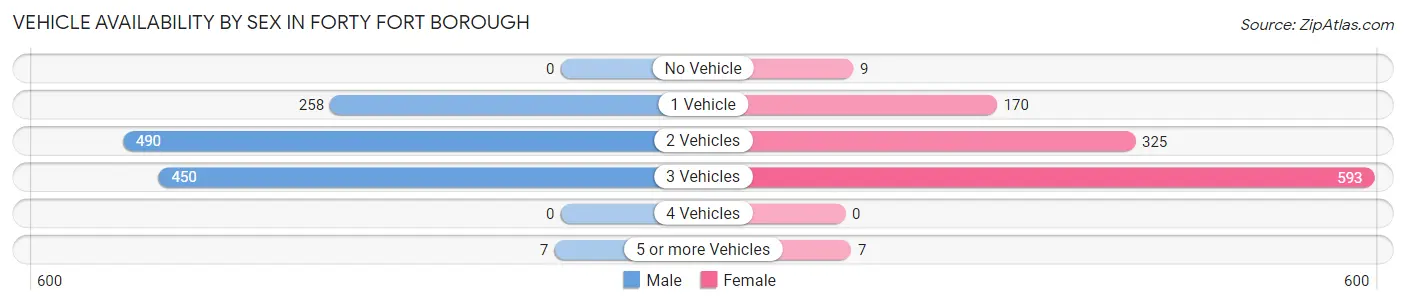
| Vehicles Available | Male | Female |
| No Vehicle | 0 (0.0%) | 9 (0.8%) |
| 1 Vehicle | 258 (21.4%) | 170 (15.4%) |
| 2 Vehicles | 490 (40.7%) | 325 (29.4%) |
| 3 Vehicles | 450 (37.3%) | 593 (53.7%) |
| 4 Vehicles | 0 (0.0%) | 0 (0.0%) |
| 5 or more Vehicles | 7 (0.6%) | 7 (0.6%) |
| Total | 1,205 (100.0%) | 1,104 (100.0%) |
Commute Time in Forty Fort borough
The most frequently occuring commute durations in Forty Fort borough are 10 to 14 minutes (621 commuters, 28.6%), 15 to 19 minutes (467 commuters, 21.5%), and 5 to 9 minutes (293 commuters, 13.5%).
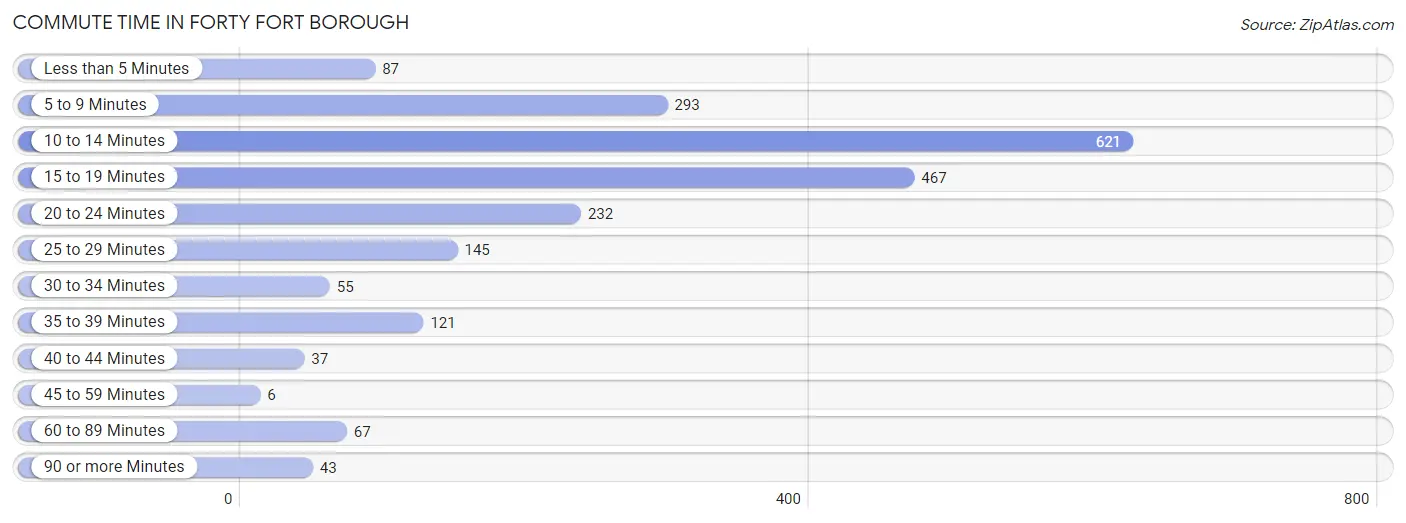
| Commute Time | # Commuters | % Commuters |
| Less than 5 Minutes | 87 | 4.0% |
| 5 to 9 Minutes | 293 | 13.5% |
| 10 to 14 Minutes | 621 | 28.6% |
| 15 to 19 Minutes | 467 | 21.5% |
| 20 to 24 Minutes | 232 | 10.7% |
| 25 to 29 Minutes | 145 | 6.7% |
| 30 to 34 Minutes | 55 | 2.5% |
| 35 to 39 Minutes | 121 | 5.6% |
| 40 to 44 Minutes | 37 | 1.7% |
| 45 to 59 Minutes | 6 | 0.3% |
| 60 to 89 Minutes | 67 | 3.1% |
| 90 or more Minutes | 43 | 2.0% |
Commute Time by Sex in Forty Fort borough
The most common commute times in Forty Fort borough are 10 to 14 minutes (330 commuters, 28.4%) for males and 10 to 14 minutes (291 commuters, 28.7%) for females.
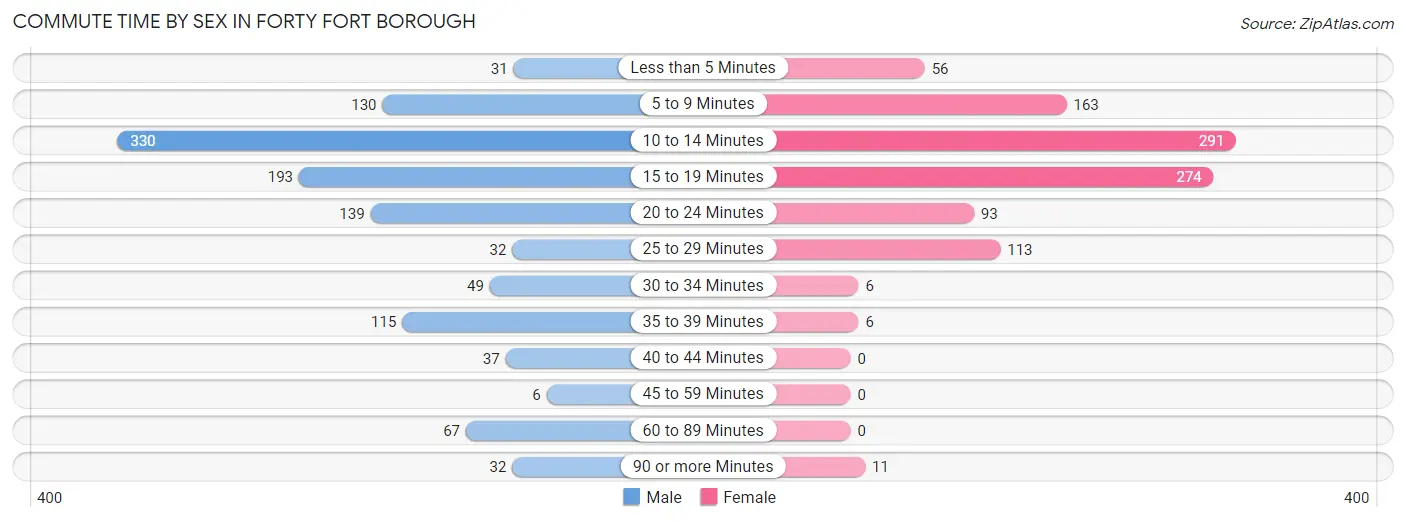
| Commute Time | Male | Female |
| Less than 5 Minutes | 31 (2.7%) | 56 (5.5%) |
| 5 to 9 Minutes | 130 (11.2%) | 163 (16.1%) |
| 10 to 14 Minutes | 330 (28.4%) | 291 (28.7%) |
| 15 to 19 Minutes | 193 (16.6%) | 274 (27.1%) |
| 20 to 24 Minutes | 139 (12.0%) | 93 (9.2%) |
| 25 to 29 Minutes | 32 (2.8%) | 113 (11.2%) |
| 30 to 34 Minutes | 49 (4.2%) | 6 (0.6%) |
| 35 to 39 Minutes | 115 (9.9%) | 6 (0.6%) |
| 40 to 44 Minutes | 37 (3.2%) | 0 (0.0%) |
| 45 to 59 Minutes | 6 (0.5%) | 0 (0.0%) |
| 60 to 89 Minutes | 67 (5.8%) | 0 (0.0%) |
| 90 or more Minutes | 32 (2.8%) | 11 (1.1%) |
Time of Departure to Work by Sex in Forty Fort borough
The most frequent times of departure to work in Forty Fort borough are 7:00 AM to 7:29 AM (325, 28.0%) for males and 12:00 PM to 3:59 PM (206, 20.3%) for females.
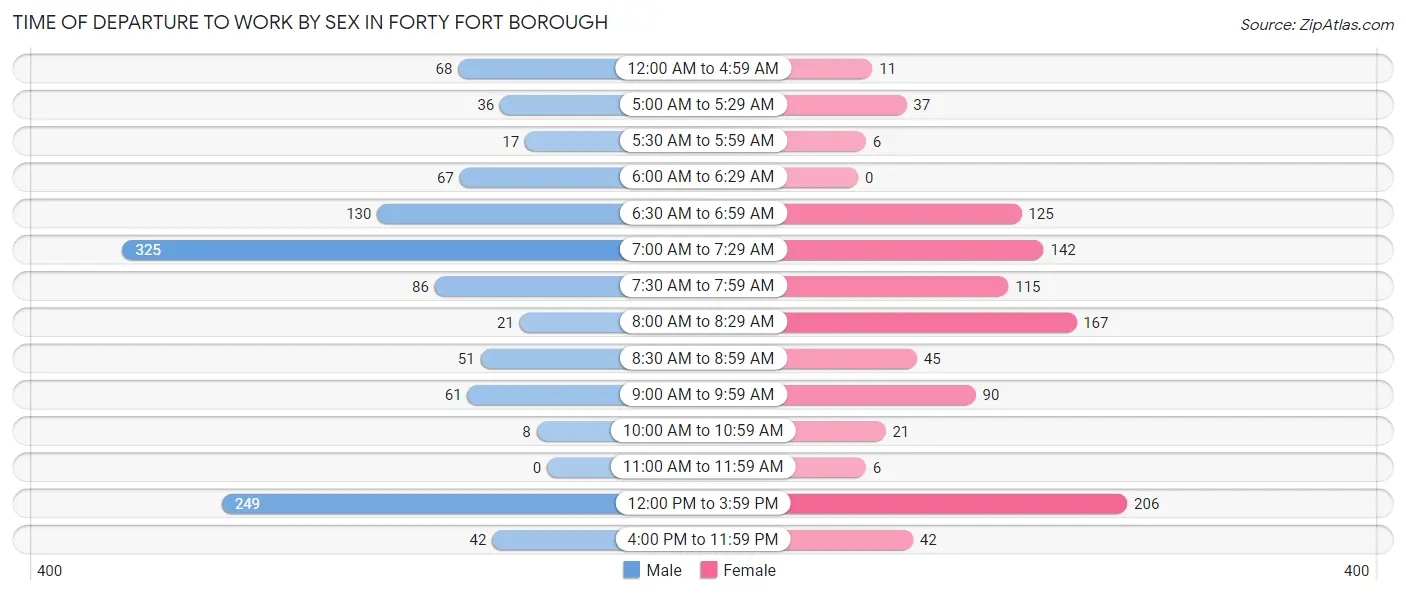
| Time of Departure | Male | Female |
| 12:00 AM to 4:59 AM | 68 (5.9%) | 11 (1.1%) |
| 5:00 AM to 5:29 AM | 36 (3.1%) | 37 (3.6%) |
| 5:30 AM to 5:59 AM | 17 (1.5%) | 6 (0.6%) |
| 6:00 AM to 6:29 AM | 67 (5.8%) | 0 (0.0%) |
| 6:30 AM to 6:59 AM | 130 (11.2%) | 125 (12.3%) |
| 7:00 AM to 7:29 AM | 325 (28.0%) | 142 (14.0%) |
| 7:30 AM to 7:59 AM | 86 (7.4%) | 115 (11.4%) |
| 8:00 AM to 8:29 AM | 21 (1.8%) | 167 (16.5%) |
| 8:30 AM to 8:59 AM | 51 (4.4%) | 45 (4.4%) |
| 9:00 AM to 9:59 AM | 61 (5.2%) | 90 (8.9%) |
| 10:00 AM to 10:59 AM | 8 (0.7%) | 21 (2.1%) |
| 11:00 AM to 11:59 AM | 0 (0.0%) | 6 (0.6%) |
| 12:00 PM to 3:59 PM | 249 (21.4%) | 206 (20.3%) |
| 4:00 PM to 11:59 PM | 42 (3.6%) | 42 (4.2%) |
| Total | 1,161 (100.0%) | 1,013 (100.0%) |
Housing Occupancy in Forty Fort borough
Occupancy by Ownership in Forty Fort borough
Of the total 1,710 dwellings in Forty Fort borough, owner-occupied units account for 1,158 (67.7%), while renter-occupied units make up 552 (32.3%).
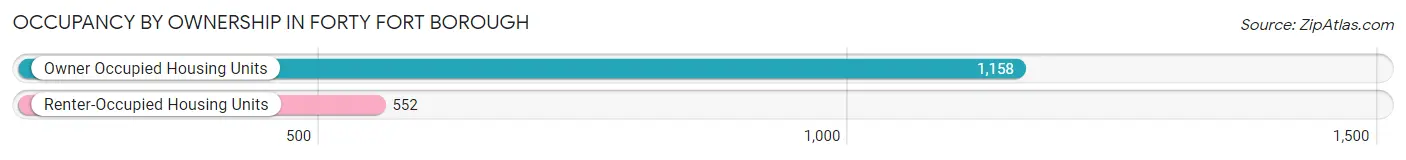
| Occupancy | # Housing Units | % Housing Units |
| Owner Occupied Housing Units | 1,158 | 67.7% |
| Renter-Occupied Housing Units | 552 | 32.3% |
| Total Occupied Housing Units | 1,710 | 100.0% |
Occupancy by Household Size in Forty Fort borough
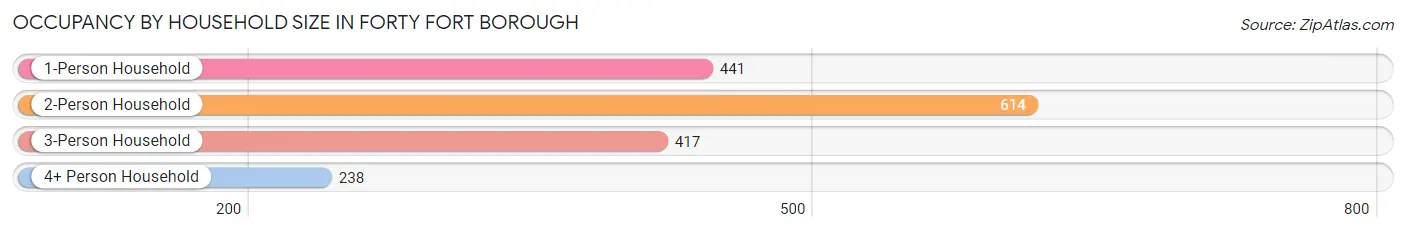
| Household Size | # Housing Units | % Housing Units |
| 1-Person Household | 441 | 25.8% |
| 2-Person Household | 614 | 35.9% |
| 3-Person Household | 417 | 24.4% |
| 4+ Person Household | 238 | 13.9% |
| Total Housing Units | 1,710 | 100.0% |
Occupancy by Ownership by Household Size in Forty Fort borough
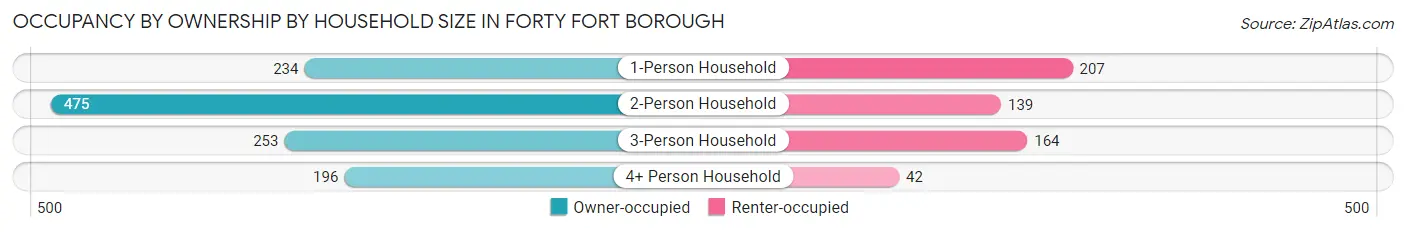
| Household Size | Owner-occupied | Renter-occupied |
| 1-Person Household | 234 (53.1%) | 207 (46.9%) |
| 2-Person Household | 475 (77.4%) | 139 (22.6%) |
| 3-Person Household | 253 (60.7%) | 164 (39.3%) |
| 4+ Person Household | 196 (82.4%) | 42 (17.6%) |
| Total Housing Units | 1,158 (67.7%) | 552 (32.3%) |
Occupancy by Educational Attainment in Forty Fort borough
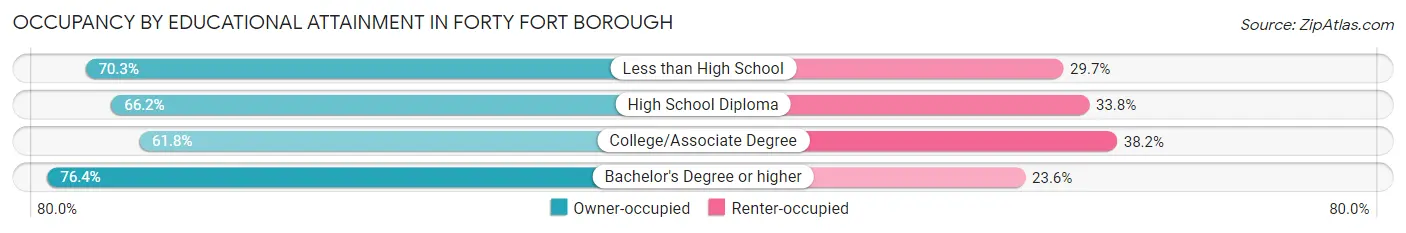
| Household Size | Owner-occupied | Renter-occupied |
| Less than High School | 83 (70.3%) | 35 (29.7%) |
| High School Diploma | 251 (66.2%) | 128 (33.8%) |
| College/Associate Degree | 436 (61.8%) | 269 (38.2%) |
| Bachelor's Degree or higher | 388 (76.4%) | 120 (23.6%) |
Occupancy by Age of Householder in Forty Fort borough
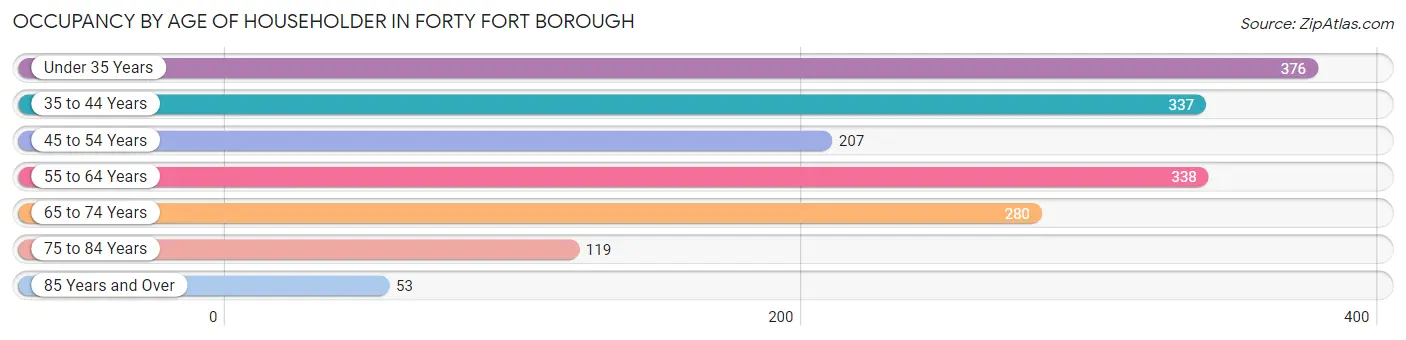
| Age Bracket | # Households | % Households |
| Under 35 Years | 376 | 22.0% |
| 35 to 44 Years | 337 | 19.7% |
| 45 to 54 Years | 207 | 12.1% |
| 55 to 64 Years | 338 | 19.8% |
| 65 to 74 Years | 280 | 16.4% |
| 75 to 84 Years | 119 | 7.0% |
| 85 Years and Over | 53 | 3.1% |
| Total | 1,710 | 100.0% |
Housing Finances in Forty Fort borough
Median Income by Occupancy in Forty Fort borough
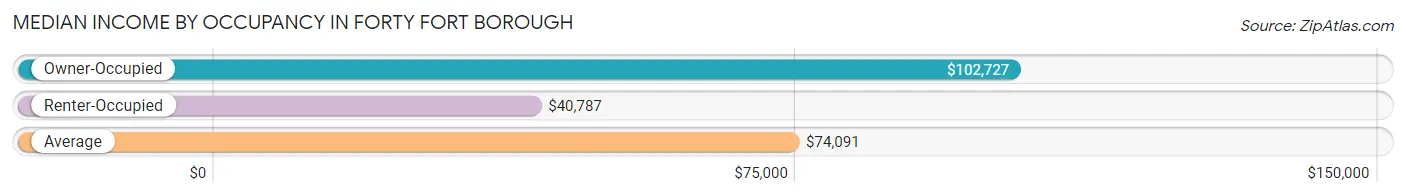
| Occupancy Type | # Households | Median Income |
| Owner-Occupied | 1,158 (67.7%) | $102,727 |
| Renter-Occupied | 552 (32.3%) | $40,787 |
| Average | 1,710 (100.0%) | $74,091 |
Occupancy by Householder Income Bracket in Forty Fort borough
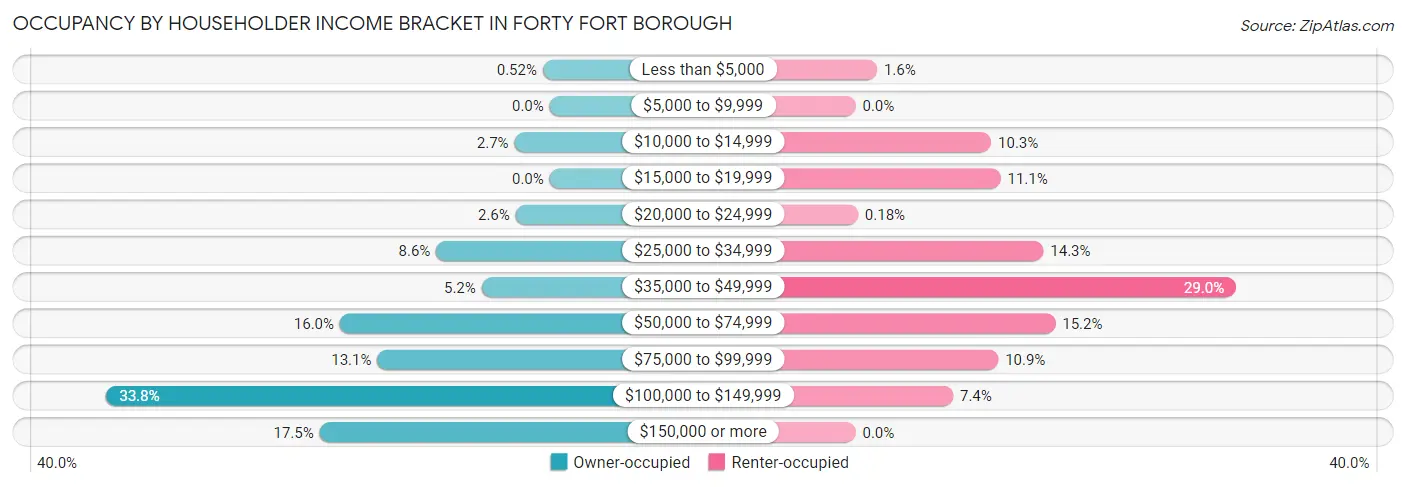
| Income Bracket | Owner-occupied | Renter-occupied |
| Less than $5,000 | 6 (0.5%) | 9 (1.6%) |
| $5,000 to $9,999 | 0 (0.0%) | 0 (0.0%) |
| $10,000 to $14,999 | 31 (2.7%) | 57 (10.3%) |
| $15,000 to $19,999 | 0 (0.0%) | 61 (11.1%) |
| $20,000 to $24,999 | 30 (2.6%) | 1 (0.2%) |
| $25,000 to $34,999 | 100 (8.6%) | 79 (14.3%) |
| $35,000 to $49,999 | 60 (5.2%) | 160 (29.0%) |
| $50,000 to $74,999 | 185 (16.0%) | 84 (15.2%) |
| $75,000 to $99,999 | 152 (13.1%) | 60 (10.9%) |
| $100,000 to $149,999 | 391 (33.8%) | 41 (7.4%) |
| $150,000 or more | 203 (17.5%) | 0 (0.0%) |
| Total | 1,158 (100.0%) | 552 (100.0%) |
Monthly Housing Cost Tiers in Forty Fort borough
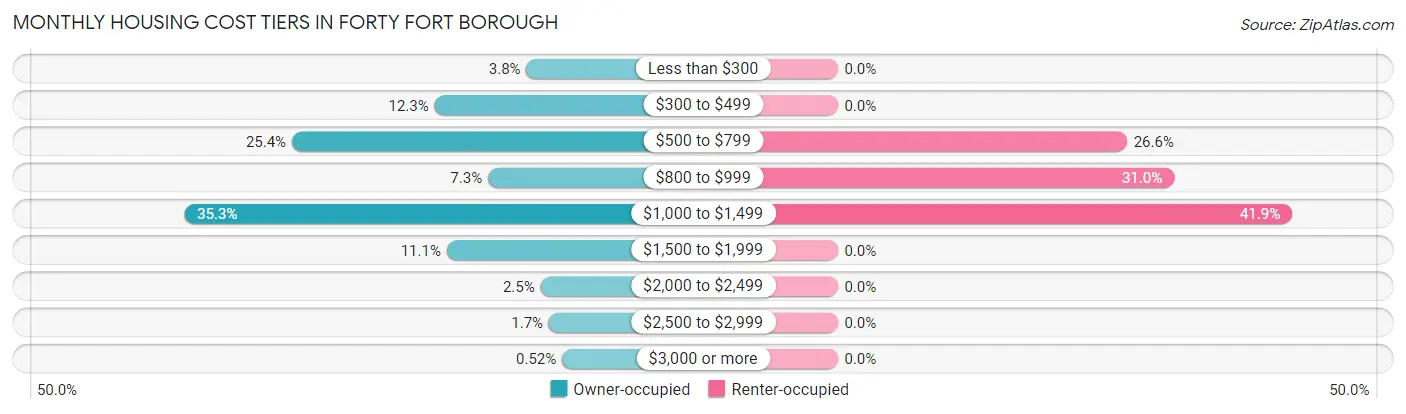
| Monthly Cost | Owner-occupied | Renter-occupied |
| Less than $300 | 44 (3.8%) | 0 (0.0%) |
| $300 to $499 | 142 (12.3%) | 0 (0.0%) |
| $500 to $799 | 294 (25.4%) | 147 (26.6%) |
| $800 to $999 | 85 (7.3%) | 171 (31.0%) |
| $1,000 to $1,499 | 409 (35.3%) | 231 (41.8%) |
| $1,500 to $1,999 | 129 (11.1%) | 0 (0.0%) |
| $2,000 to $2,499 | 29 (2.5%) | 0 (0.0%) |
| $2,500 to $2,999 | 20 (1.7%) | 0 (0.0%) |
| $3,000 or more | 6 (0.5%) | 0 (0.0%) |
| Total | 1,158 (100.0%) | 552 (100.0%) |
Physical Housing Characteristics in Forty Fort borough
Housing Structures in Forty Fort borough
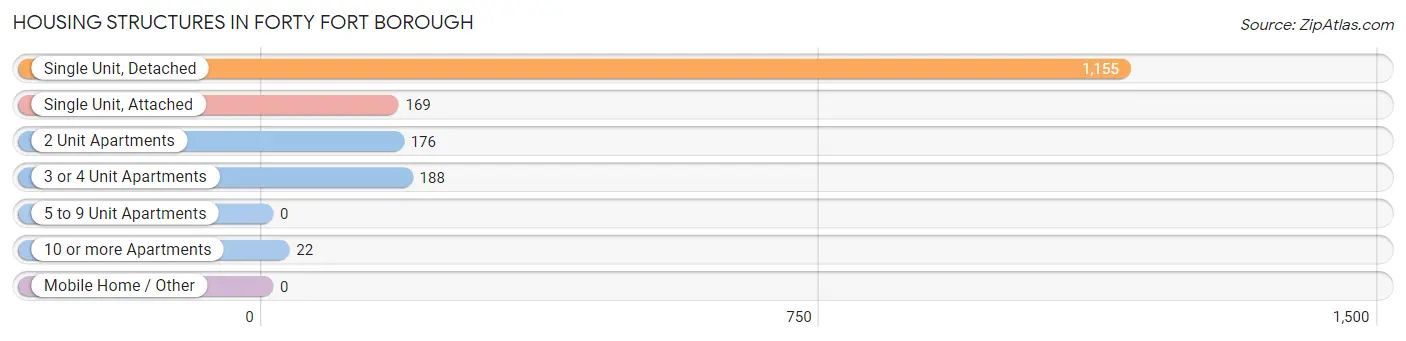
| Structure Type | # Housing Units | % Housing Units |
| Single Unit, Detached | 1,155 | 67.5% |
| Single Unit, Attached | 169 | 9.9% |
| 2 Unit Apartments | 176 | 10.3% |
| 3 or 4 Unit Apartments | 188 | 11.0% |
| 5 to 9 Unit Apartments | 0 | 0.0% |
| 10 or more Apartments | 22 | 1.3% |
| Mobile Home / Other | 0 | 0.0% |
| Total | 1,710 | 100.0% |
Housing Structures by Occupancy in Forty Fort borough
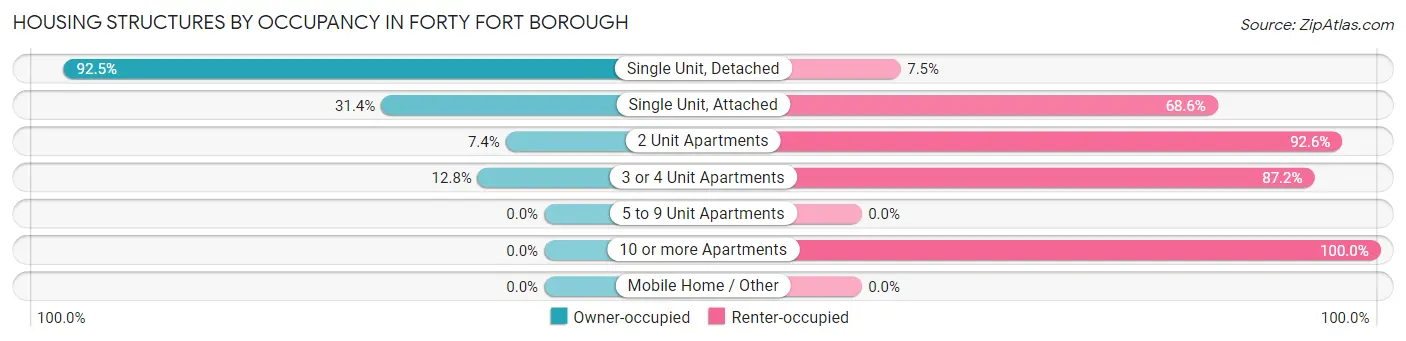
| Structure Type | Owner-occupied | Renter-occupied |
| Single Unit, Detached | 1,068 (92.5%) | 87 (7.5%) |
| Single Unit, Attached | 53 (31.4%) | 116 (68.6%) |
| 2 Unit Apartments | 13 (7.4%) | 163 (92.6%) |
| 3 or 4 Unit Apartments | 24 (12.8%) | 164 (87.2%) |
| 5 to 9 Unit Apartments | 0 (0.0%) | 0 (0.0%) |
| 10 or more Apartments | 0 (0.0%) | 22 (100.0%) |
| Mobile Home / Other | 0 (0.0%) | 0 (0.0%) |
| Total | 1,158 (67.7%) | 552 (32.3%) |
Housing Structures by Number of Rooms in Forty Fort borough
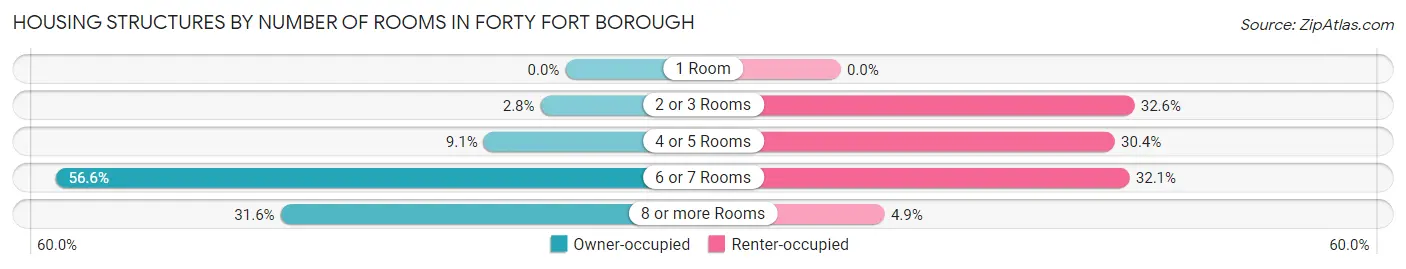
| Number of Rooms | Owner-occupied | Renter-occupied |
| 1 Room | 0 (0.0%) | 0 (0.0%) |
| 2 or 3 Rooms | 32 (2.8%) | 180 (32.6%) |
| 4 or 5 Rooms | 105 (9.1%) | 168 (30.4%) |
| 6 or 7 Rooms | 655 (56.6%) | 177 (32.1%) |
| 8 or more Rooms | 366 (31.6%) | 27 (4.9%) |
| Total | 1,158 (100.0%) | 552 (100.0%) |
Housing Structure by Heating Type in Forty Fort borough
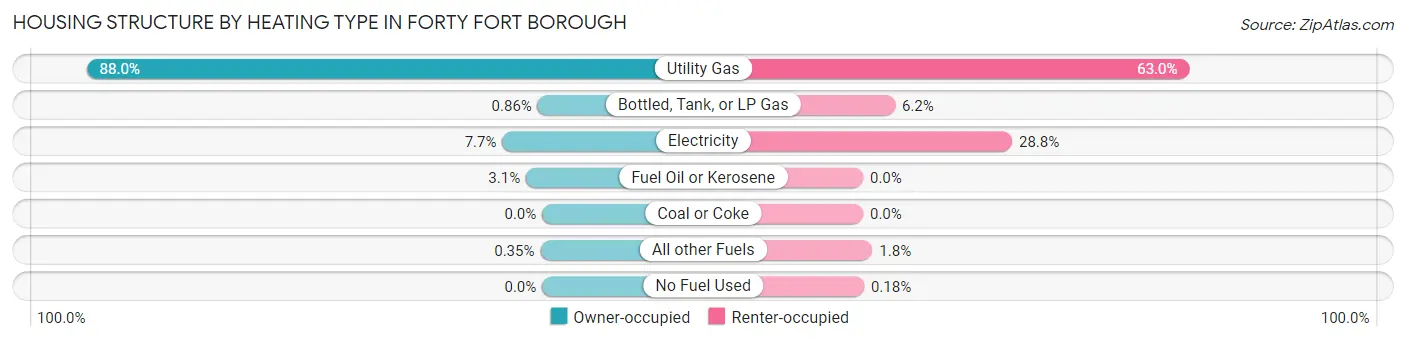
| Heating Type | Owner-occupied | Renter-occupied |
| Utility Gas | 1,019 (88.0%) | 348 (63.0%) |
| Bottled, Tank, or LP Gas | 10 (0.9%) | 34 (6.2%) |
| Electricity | 89 (7.7%) | 159 (28.8%) |
| Fuel Oil or Kerosene | 36 (3.1%) | 0 (0.0%) |
| Coal or Coke | 0 (0.0%) | 0 (0.0%) |
| All other Fuels | 4 (0.4%) | 10 (1.8%) |
| No Fuel Used | 0 (0.0%) | 1 (0.2%) |
| Total | 1,158 (100.0%) | 552 (100.0%) |
Household Vehicle Usage in Forty Fort borough
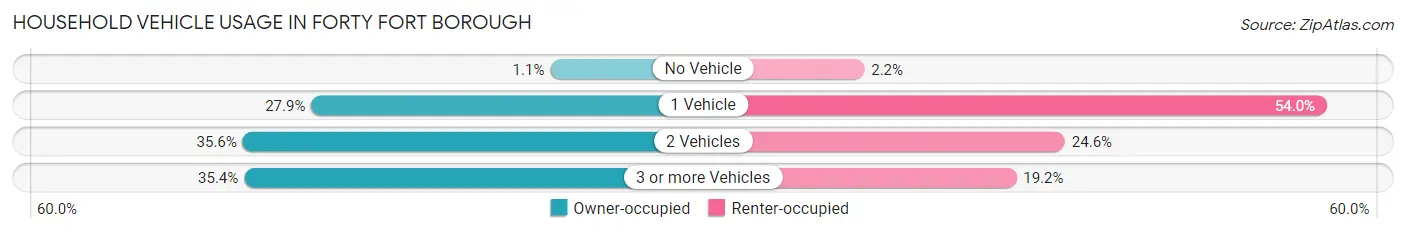
| Vehicles per Household | Owner-occupied | Renter-occupied |
| No Vehicle | 13 (1.1%) | 12 (2.2%) |
| 1 Vehicle | 323 (27.9%) | 298 (54.0%) |
| 2 Vehicles | 412 (35.6%) | 136 (24.6%) |
| 3 or more Vehicles | 410 (35.4%) | 106 (19.2%) |
| Total | 1,158 (100.0%) | 552 (100.0%) |
Real Estate & Mortgages in Forty Fort borough
Real Estate and Mortgage Overview in Forty Fort borough
| Characteristic | Without Mortgage | With Mortgage |
| Housing Units | 483 | 675 |
| Median Property Value | $154,600 | $148,400 |
| Median Household Income | $61,397 | $122 |
| Monthly Housing Costs | $554 | $6 |
| Real Estate Taxes | $2,254 | $13 |
Property Value by Mortgage Status in Forty Fort borough
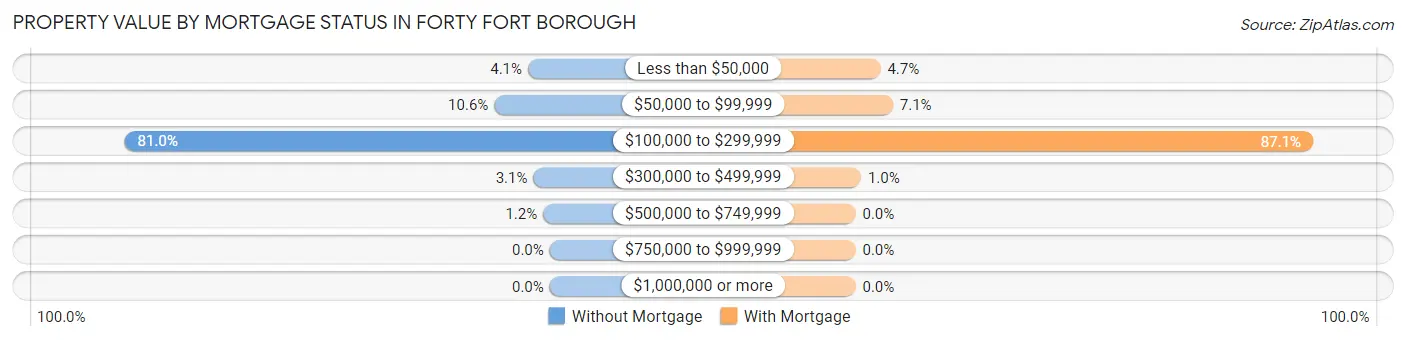
| Property Value | Without Mortgage | With Mortgage |
| Less than $50,000 | 20 (4.1%) | 32 (4.7%) |
| $50,000 to $99,999 | 51 (10.6%) | 48 (7.1%) |
| $100,000 to $299,999 | 391 (80.9%) | 588 (87.1%) |
| $300,000 to $499,999 | 15 (3.1%) | 7 (1.0%) |
| $500,000 to $749,999 | 6 (1.2%) | 0 (0.0%) |
| $750,000 to $999,999 | 0 (0.0%) | 0 (0.0%) |
| $1,000,000 or more | 0 (0.0%) | 0 (0.0%) |
| Total | 483 (100.0%) | 675 (100.0%) |
Household Income by Mortgage Status in Forty Fort borough
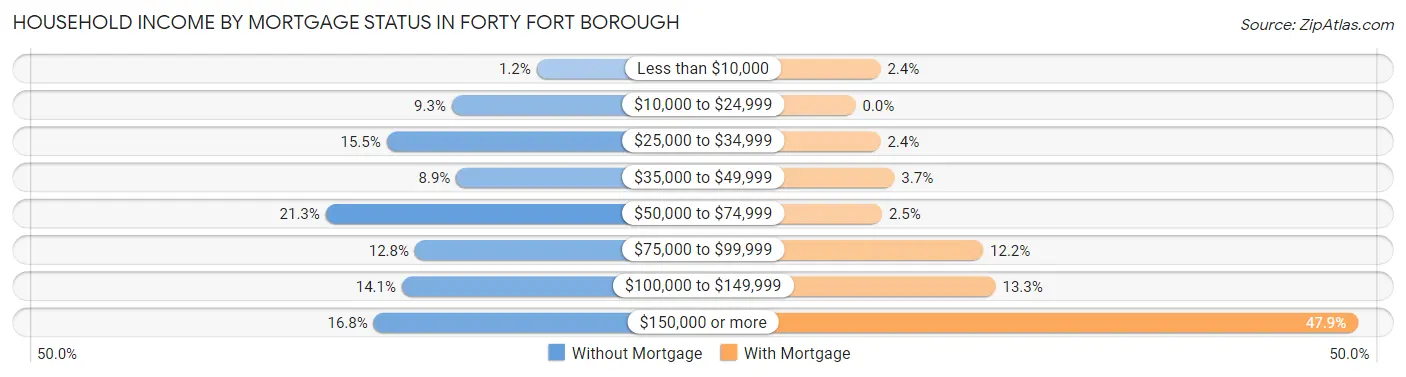
| Household Income | Without Mortgage | With Mortgage |
| Less than $10,000 | 6 (1.2%) | 16 (2.4%) |
| $10,000 to $24,999 | 45 (9.3%) | 0 (0.0%) |
| $25,000 to $34,999 | 75 (15.5%) | 16 (2.4%) |
| $35,000 to $49,999 | 43 (8.9%) | 25 (3.7%) |
| $50,000 to $74,999 | 103 (21.3%) | 17 (2.5%) |
| $75,000 to $99,999 | 62 (12.8%) | 82 (12.1%) |
| $100,000 to $149,999 | 68 (14.1%) | 90 (13.3%) |
| $150,000 or more | 81 (16.8%) | 323 (47.8%) |
| Total | 483 (100.0%) | 675 (100.0%) |
Property Value to Household Income Ratio in Forty Fort borough
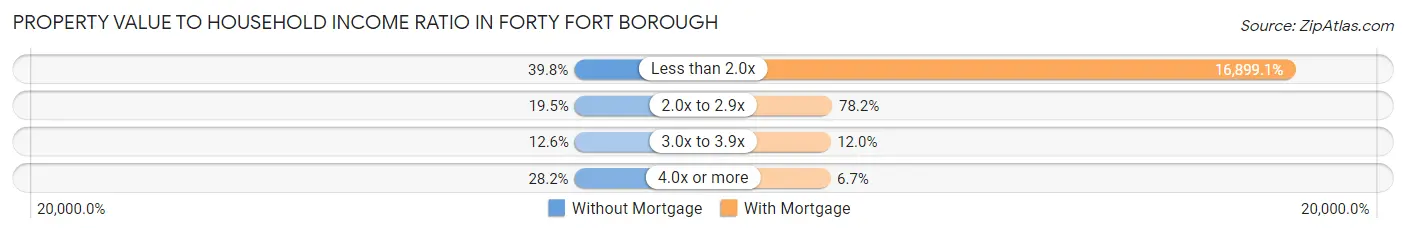
| Value-to-Income Ratio | Without Mortgage | With Mortgage |
| Less than 2.0x | 192 (39.8%) | 114,069 (16,899.1%) |
| 2.0x to 2.9x | 94 (19.5%) | 528 (78.2%) |
| 3.0x to 3.9x | 61 (12.6%) | 81 (12.0%) |
| 4.0x or more | 136 (28.2%) | 45 (6.7%) |
| Total | 483 (100.0%) | 675 (100.0%) |
Real Estate Taxes by Mortgage Status in Forty Fort borough
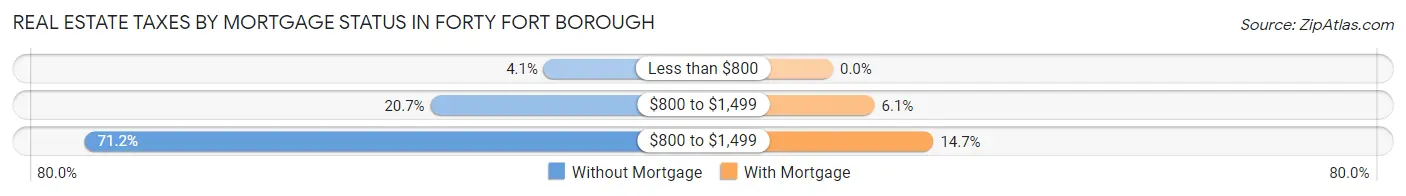
| Property Taxes | Without Mortgage | With Mortgage |
| Less than $800 | 20 (4.1%) | 0 (0.0%) |
| $800 to $1,499 | 100 (20.7%) | 41 (6.1%) |
| $800 to $1,499 | 344 (71.2%) | 99 (14.7%) |
| Total | 483 (100.0%) | 675 (100.0%) |
Health & Disability in Forty Fort borough
Health Insurance Coverage by Age in Forty Fort borough
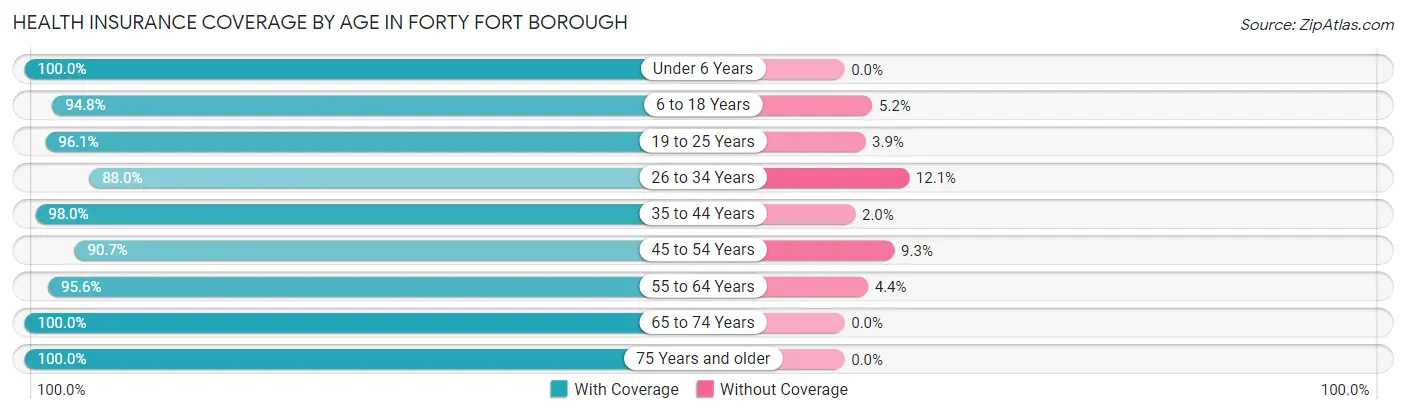
| Age Bracket | With Coverage | Without Coverage |
| Under 6 Years | 191 (100.0%) | 0 (0.0%) |
| 6 to 18 Years | 568 (94.8%) | 31 (5.2%) |
| 19 to 25 Years | 396 (96.1%) | 16 (3.9%) |
| 26 to 34 Years | 540 (87.9%) | 74 (12.0%) |
| 35 to 44 Years | 734 (98.0%) | 15 (2.0%) |
| 45 to 54 Years | 312 (90.7%) | 32 (9.3%) |
| 55 to 64 Years | 589 (95.6%) | 27 (4.4%) |
| 65 to 74 Years | 421 (100.0%) | 0 (0.0%) |
| 75 Years and older | 288 (100.0%) | 0 (0.0%) |
| Total | 4,039 (95.4%) | 195 (4.6%) |
Health Insurance Coverage by Citizenship Status in Forty Fort borough
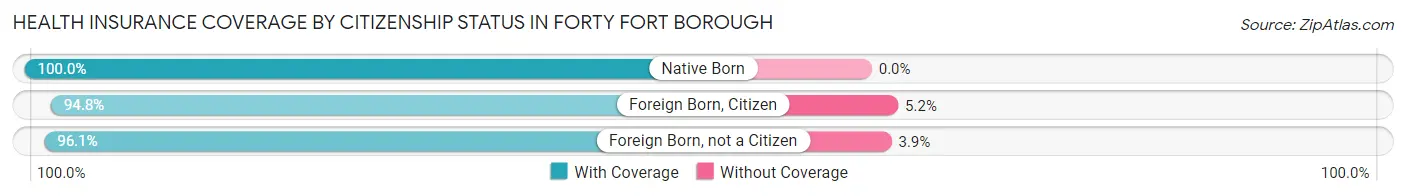
| Citizenship Status | With Coverage | Without Coverage |
| Native Born | 191 (100.0%) | 0 (0.0%) |
| Foreign Born, Citizen | 568 (94.8%) | 31 (5.2%) |
| Foreign Born, not a Citizen | 396 (96.1%) | 16 (3.9%) |
Health Insurance Coverage by Household Income in Forty Fort borough
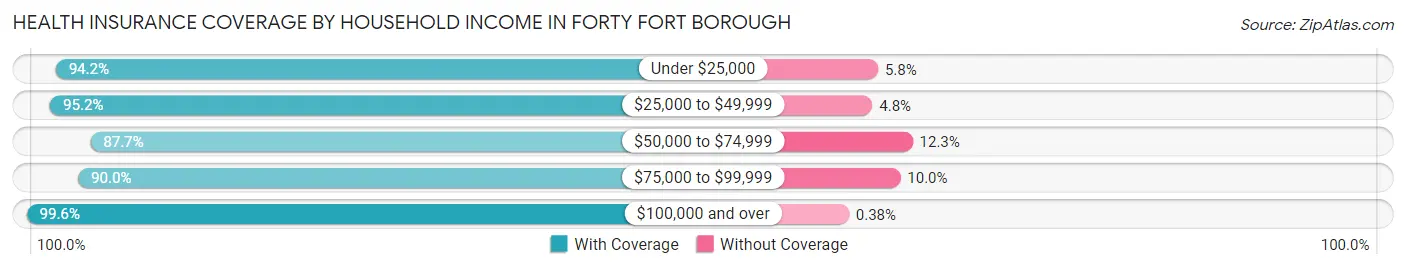
| Household Income | With Coverage | Without Coverage |
| Under $25,000 | 500 (94.2%) | 31 (5.8%) |
| $25,000 to $49,999 | 716 (95.2%) | 36 (4.8%) |
| $50,000 to $74,999 | 505 (87.7%) | 71 (12.3%) |
| $75,000 to $99,999 | 448 (90.0%) | 50 (10.0%) |
| $100,000 and over | 1,858 (99.6%) | 7 (0.4%) |
Public vs Private Health Insurance Coverage by Age in Forty Fort borough
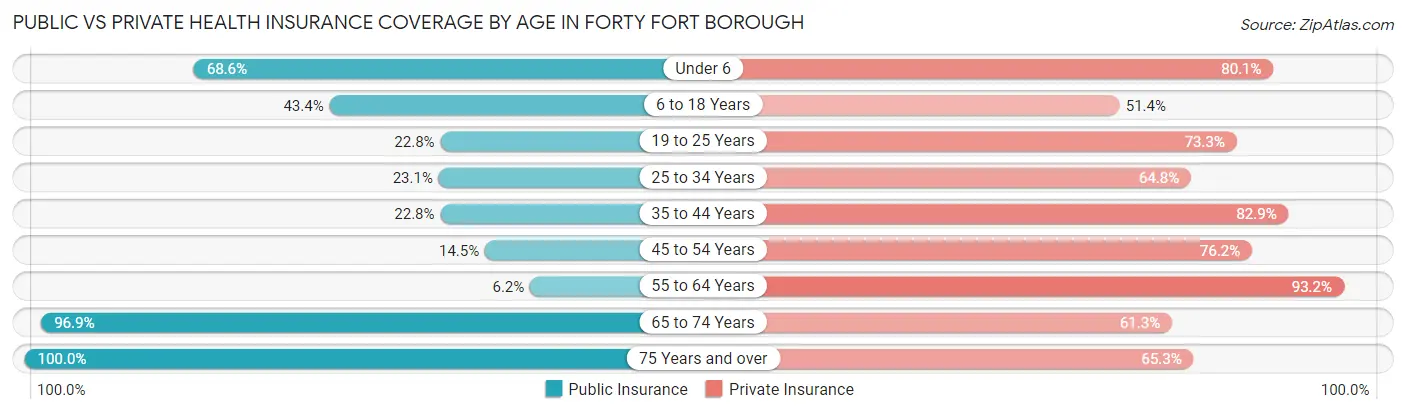
| Age Bracket | Public Insurance | Private Insurance |
| Under 6 | 131 (68.6%) | 153 (80.1%) |
| 6 to 18 Years | 260 (43.4%) | 308 (51.4%) |
| 19 to 25 Years | 94 (22.8%) | 302 (73.3%) |
| 25 to 34 Years | 142 (23.1%) | 398 (64.8%) |
| 35 to 44 Years | 171 (22.8%) | 621 (82.9%) |
| 45 to 54 Years | 50 (14.5%) | 262 (76.2%) |
| 55 to 64 Years | 38 (6.2%) | 574 (93.2%) |
| 65 to 74 Years | 408 (96.9%) | 258 (61.3%) |
| 75 Years and over | 288 (100.0%) | 188 (65.3%) |
| Total | 1,582 (37.4%) | 3,064 (72.4%) |
Disability Status by Sex by Age in Forty Fort borough
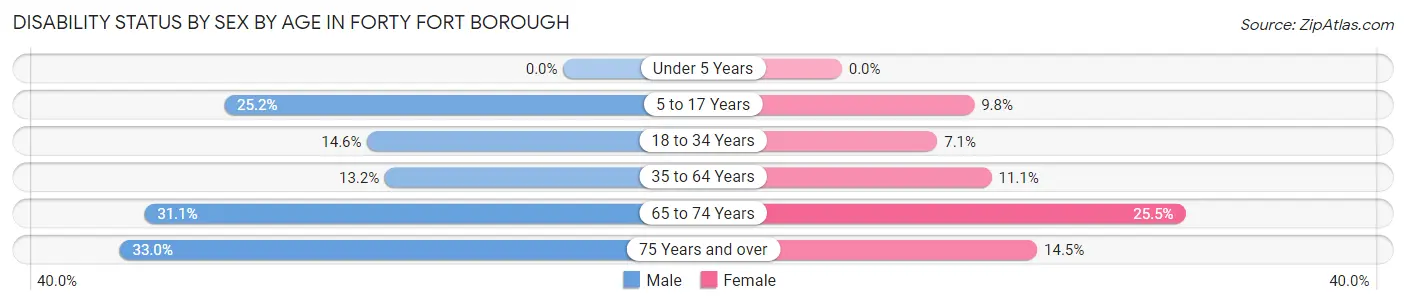
| Age Bracket | Male | Female |
| Under 5 Years | 0 (0.0%) | 0 (0.0%) |
| 5 to 17 Years | 70 (25.2%) | 29 (9.8%) |
| 18 to 34 Years | 71 (14.5%) | 40 (7.1%) |
| 35 to 64 Years | 118 (13.2%) | 91 (11.1%) |
| 65 to 74 Years | 70 (31.1%) | 50 (25.5%) |
| 75 Years and over | 29 (33.0%) | 29 (14.5%) |
Disability Class by Sex by Age in Forty Fort borough
Disability Class: Hearing Difficulty
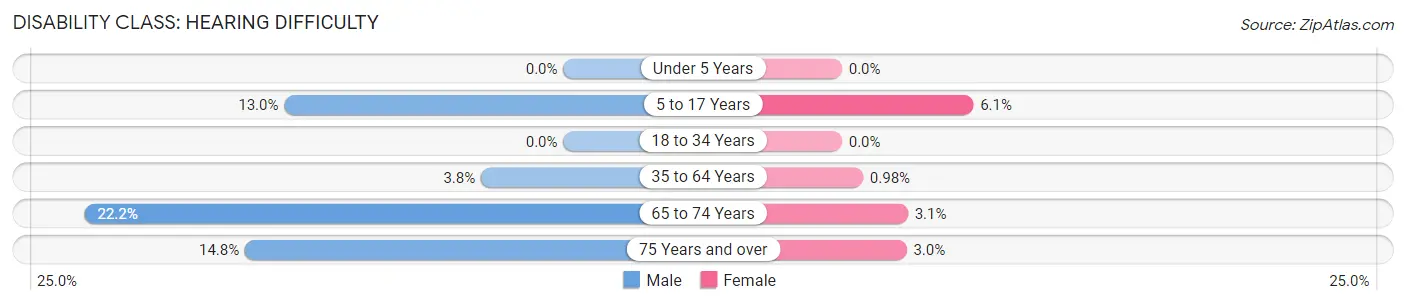
| Age Bracket | Male | Female |
| Under 5 Years | 0 (0.0%) | 0 (0.0%) |
| 5 to 17 Years | 36 (13.0%) | 18 (6.1%) |
| 18 to 34 Years | 0 (0.0%) | 0 (0.0%) |
| 35 to 64 Years | 34 (3.8%) | 8 (1.0%) |
| 65 to 74 Years | 50 (22.2%) | 6 (3.1%) |
| 75 Years and over | 13 (14.8%) | 6 (3.0%) |
Disability Class: Vision Difficulty
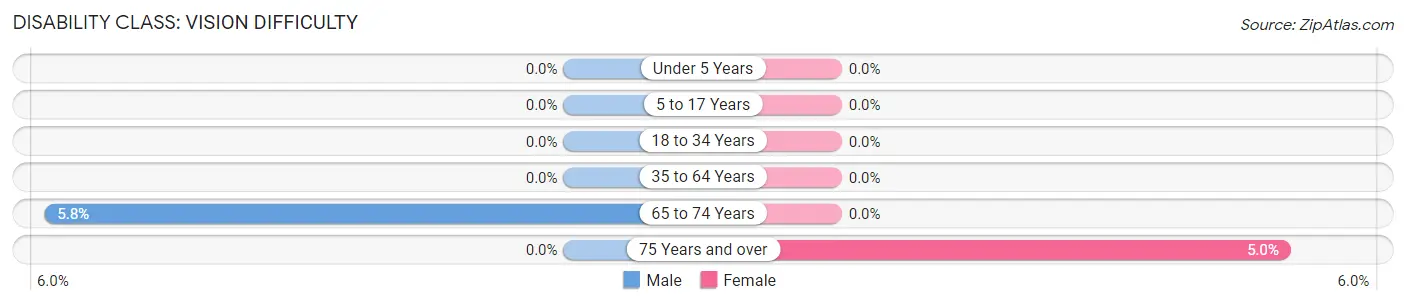
| Age Bracket | Male | Female |
| Under 5 Years | 0 (0.0%) | 0 (0.0%) |
| 5 to 17 Years | 0 (0.0%) | 0 (0.0%) |
| 18 to 34 Years | 0 (0.0%) | 0 (0.0%) |
| 35 to 64 Years | 0 (0.0%) | 0 (0.0%) |
| 65 to 74 Years | 13 (5.8%) | 0 (0.0%) |
| 75 Years and over | 0 (0.0%) | 10 (5.0%) |
Disability Class: Cognitive Difficulty
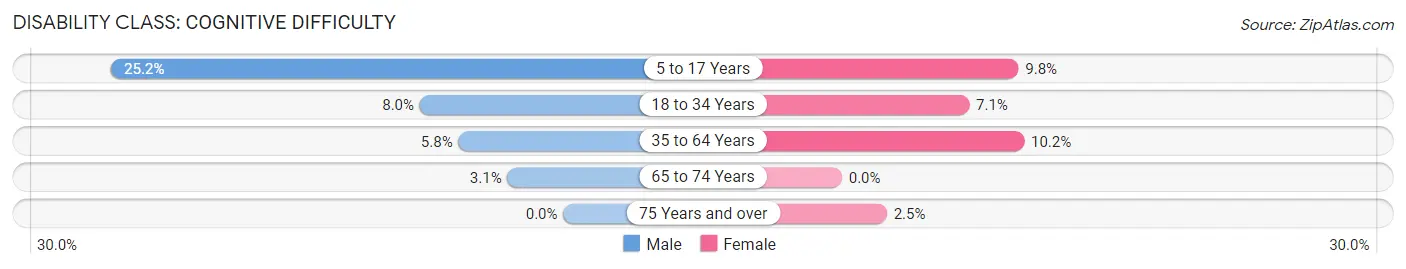
| Age Bracket | Male | Female |
| 5 to 17 Years | 70 (25.2%) | 29 (9.8%) |
| 18 to 34 Years | 39 (8.0%) | 40 (7.1%) |
| 35 to 64 Years | 52 (5.8%) | 83 (10.2%) |
| 65 to 74 Years | 7 (3.1%) | 0 (0.0%) |
| 75 Years and over | 0 (0.0%) | 5 (2.5%) |
Disability Class: Ambulatory Difficulty
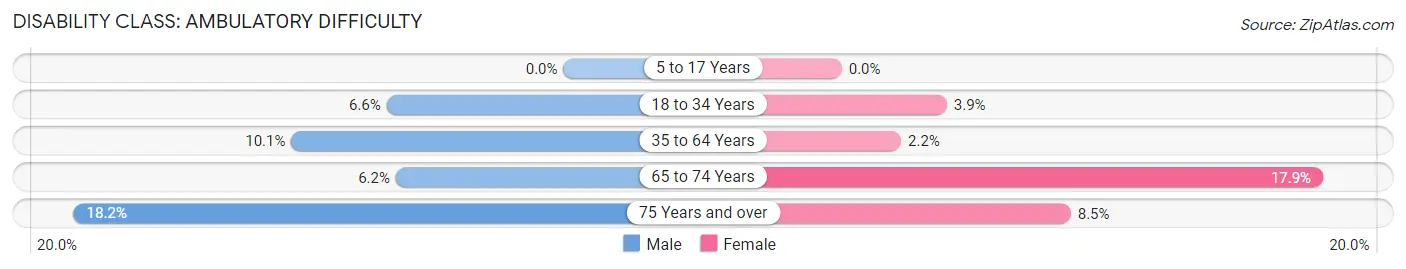
| Age Bracket | Male | Female |
| 5 to 17 Years | 0 (0.0%) | 0 (0.0%) |
| 18 to 34 Years | 32 (6.6%) | 22 (3.9%) |
| 35 to 64 Years | 90 (10.1%) | 18 (2.2%) |
| 65 to 74 Years | 14 (6.2%) | 35 (17.9%) |
| 75 Years and over | 16 (18.2%) | 17 (8.5%) |
Disability Class: Self-Care Difficulty
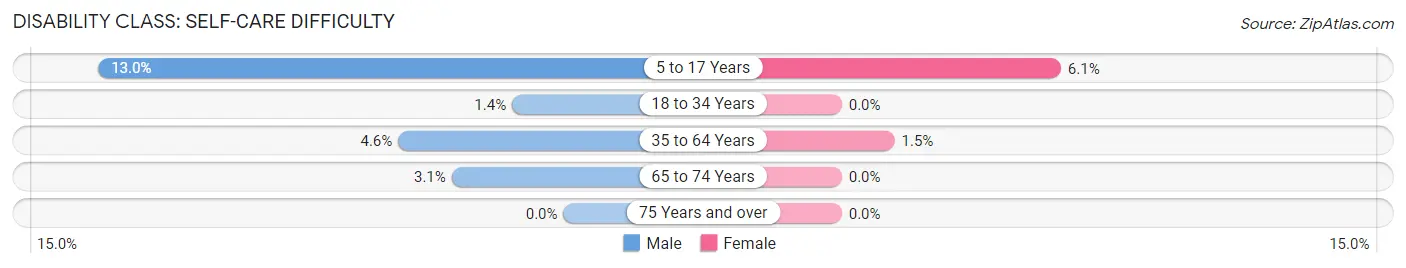
| Age Bracket | Male | Female |
| 5 to 17 Years | 36 (13.0%) | 18 (6.1%) |
| 18 to 34 Years | 7 (1.4%) | 0 (0.0%) |
| 35 to 64 Years | 41 (4.6%) | 12 (1.5%) |
| 65 to 74 Years | 7 (3.1%) | 0 (0.0%) |
| 75 Years and over | 0 (0.0%) | 0 (0.0%) |
Technology Access in Forty Fort borough
Computing Device Access in Forty Fort borough
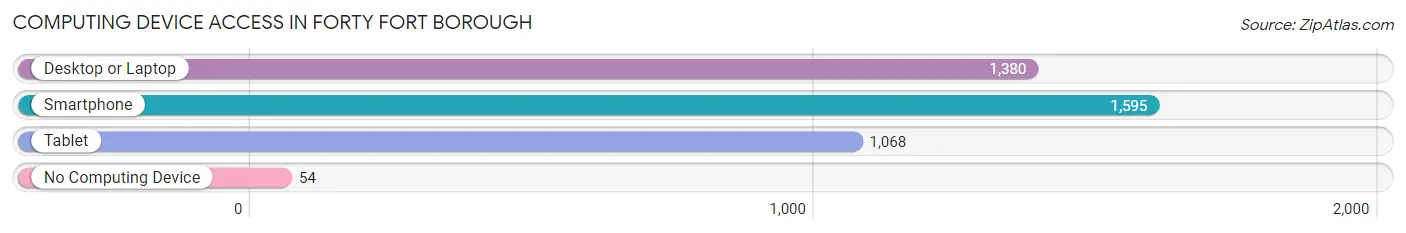
| Device Type | # Households | % Households |
| Desktop or Laptop | 1,380 | 80.7% |
| Smartphone | 1,595 | 93.3% |
| Tablet | 1,068 | 62.5% |
| No Computing Device | 54 | 3.2% |
| Total | 1,710 | 100.0% |
Internet Access in Forty Fort borough
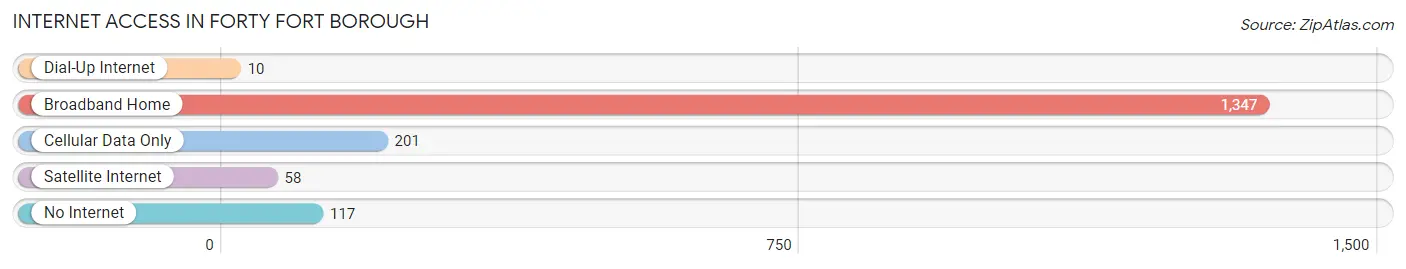
| Internet Type | # Households | % Households |
| Dial-Up Internet | 10 | 0.6% |
| Broadband Home | 1,347 | 78.8% |
| Cellular Data Only | 201 | 11.7% |
| Satellite Internet | 58 | 3.4% |
| No Internet | 117 | 6.8% |
| Total | 1,710 | 100.0% |
Forty Fort borough Summary
Forty Fort Borough is a small borough located in Luzerne County, Pennsylvania. It is situated in the Wyoming Valley, a region of the Northeastern United States. The borough is located on the Susquehanna River, and is part of the Wilkes-Barre metropolitan area. As of the 2010 census, the population of Forty Fort was 4,214.
History
Forty Fort was founded in 1769 by a group of settlers from Connecticut. The settlers named the town after a fort they had built to protect themselves from Native American attacks. The fort was located on a hill overlooking the Susquehanna River, and was made of logs and earthworks. The fort was never attacked, and the settlers eventually abandoned it.
In 1776, the town was incorporated as a borough. During the Revolutionary War, Forty Fort was the site of a major battle between the Continental Army and the British. The battle, known as the Battle of Wyoming, was a decisive victory for the Continental Army.
In the 19th century, Forty Fort became an important industrial center. The town was home to several mills, including a paper mill, a woolen mill, and a tannery. The town also had a large brickyard, which produced bricks for many of the buildings in the area.
Geography
Forty Fort is located in Luzerne County, Pennsylvania. It is situated in the Wyoming Valley, a region of the Northeastern United States. The borough is located on the Susquehanna River, and is part of the Wilkes-Barre metropolitan area.
The borough has a total area of 1.2 square miles, all of which is land. The borough is bordered by the Susquehanna River to the east, and by the townships of Kingston and Swoyersville to the west.
Economy
Forty Fort is a small borough, and its economy is largely based on local businesses. The borough is home to several small businesses, including restaurants, retail stores, and professional services. The borough also has a few industrial businesses, including a paper mill and a tannery.
The borough is also home to several educational institutions, including Luzerne County Community College and Wilkes University. These institutions provide employment opportunities for local residents.
Demographics
As of the 2010 census, the population of Forty Fort was 4,214. The racial makeup of the borough was 95.3% White, 1.2% African American, 0.3% Native American, 0.7% Asian, 0.1% Pacific Islander, 0.7% from other races, and 1.7% from two or more races. Hispanic or Latino of any race were 2.7% of the population.
The median income for a household in the borough was $41,944, and the median income for a family was $50,972. The per capita income for the borough was $20,945. About 8.2% of families and 10.2% of the population were below the poverty line, including 14.2% of those under age 18 and 6.2% of those age 65 or over.
Common Questions
What is the Total Population of Forty Fort borough?
Total Population of Forty Fort borough is 4,242.
What is the Total Male Population of Forty Fort borough?
Total Male Population of Forty Fort borough is 2,143.
What is the Total Female Population of Forty Fort borough?
Total Female Population of Forty Fort borough is 2,099.
What is the Ratio of Males per 100 Females in Forty Fort borough?
There are 102.10 Males per 100 Females in Forty Fort borough.
What is the Ratio of Females per 100 Males in Forty Fort borough?
There are 97.95 Females per 100 Males in Forty Fort borough.
What is the Median Population Age in Forty Fort borough?
Median Population Age in Forty Fort borough is 40.5 Years.
What is the Average Family Size in Forty Fort borough
Average Family Size in Forty Fort borough is 3.0 People.
What is the Average Household Size in Forty Fort borough
Average Household Size in Forty Fort borough is 2.5 People.
What is Per Capita Income in Forty Fort borough?
Per Capita income in Forty Fort borough is $34,842.
What is the Median Family Income in Forty Fort borough?
Median Family Income in Forty Fort borough is $95,870.
What is the Median Household income in Forty Fort borough?
Median Household Income in Forty Fort borough is $74,091.
What is Income or Wage Gap in Forty Fort borough?
Income or Wage Gap in Forty Fort borough is 23.0%.
Women in Forty Fort borough earn 77.0 cents for every dollar earned by a man.
What is Inequality or Gini Index in Forty Fort borough?
Inequality or Gini Index in Forty Fort borough is 0.36.
How Large is the Labor Force in Forty Fort borough?
There are 2,563 People in the Labor Forcein in Forty Fort borough.
What is the Percentage of People in the Labor Force in Forty Fort borough?
71.5% of People are in the Labor Force in Forty Fort borough.
What is the Unemployment Rate in Forty Fort borough?
Unemployment Rate in Forty Fort borough is 8.8%.