Lorane, PA
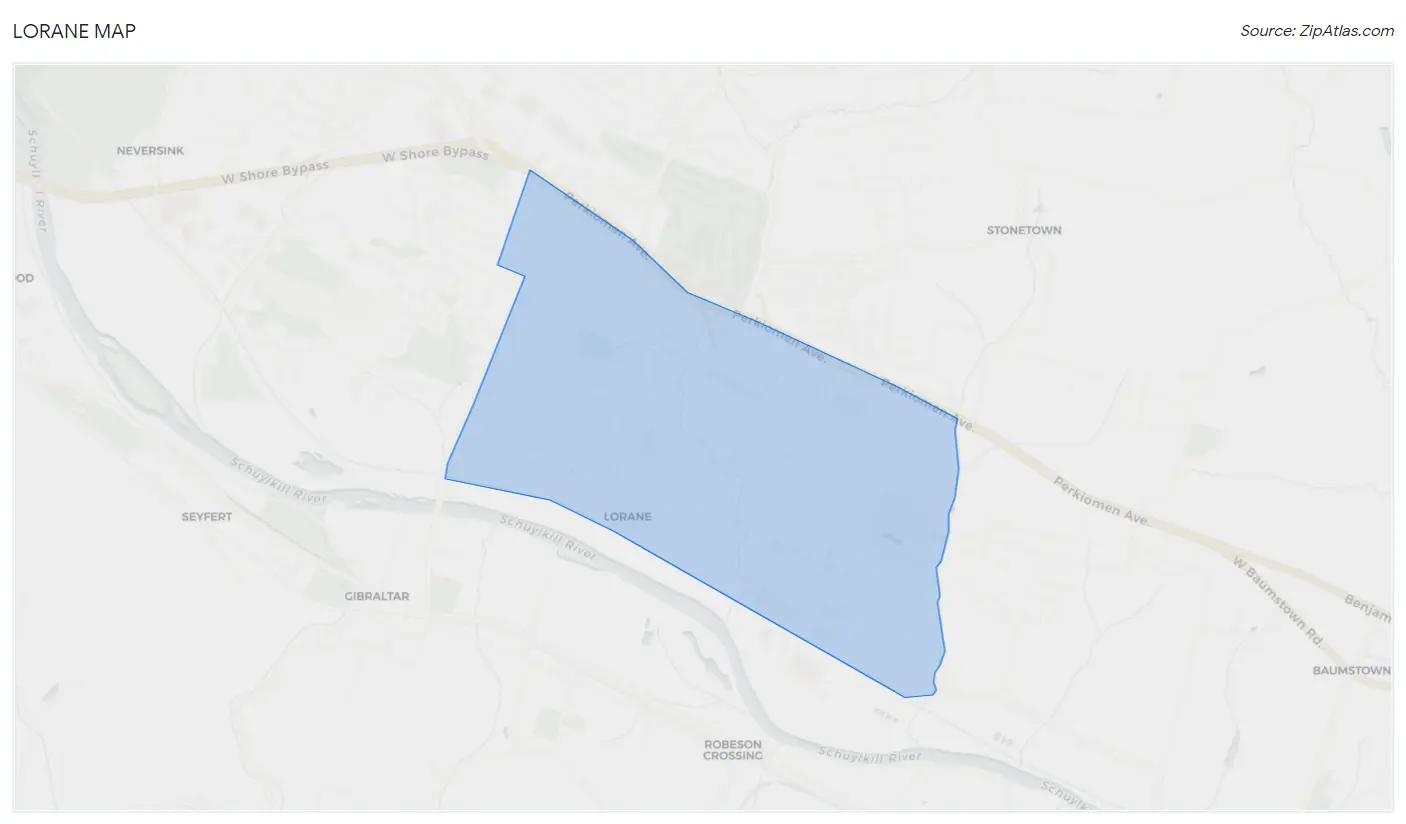
Lorane Map
Lorane Overview
4,365
TOTAL POPULATION
2,058
MALE POPULATION
2,307
FEMALE POPULATION
89.21
MALES / 100 FEMALES
112.10
FEMALES / 100 MALES
47.4
MEDIAN AGE
3.1
AVG FAMILY SIZE
2.5
AVG HOUSEHOLD SIZE
$42,510
PER CAPITA INCOME
$119,722
AVG FAMILY INCOME
$82,875
AVG HOUSEHOLD INCOME
53.1%
WAGE / INCOME GAP [ % ]
46.9¢/ $1
WAGE / INCOME GAP [ $ ]
0.42
INEQUALITY / GINI INDEX
2,521
LABOR FORCE [ PEOPLE ]
68.2%
PERCENT IN LABOR FORCE
9.0%
UNEMPLOYMENT RATE
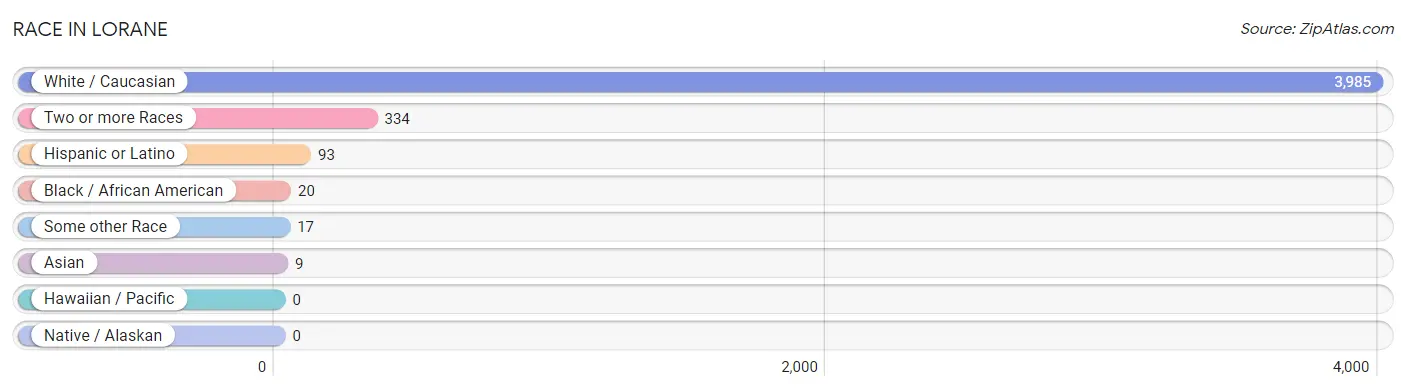
Race in Lorane
The most populous races in Lorane are White / Caucasian (3,985 | 91.3%), Two or more Races (334 | 7.6%), and Hispanic or Latino (93 | 2.1%).
| Race | # Population | % Population |
| Asian | 9 | 0.2% |
| Black / African American | 20 | 0.5% |
| Hawaiian / Pacific | 0 | 0.0% |
| Hispanic or Latino | 93 | 2.1% |
| Native / Alaskan | 0 | 0.0% |
| White / Caucasian | 3,985 | 91.3% |
| Two or more Races | 334 | 7.6% |
| Some other Race | 17 | 0.4% |
| Total | 4,365 | 100.0% |
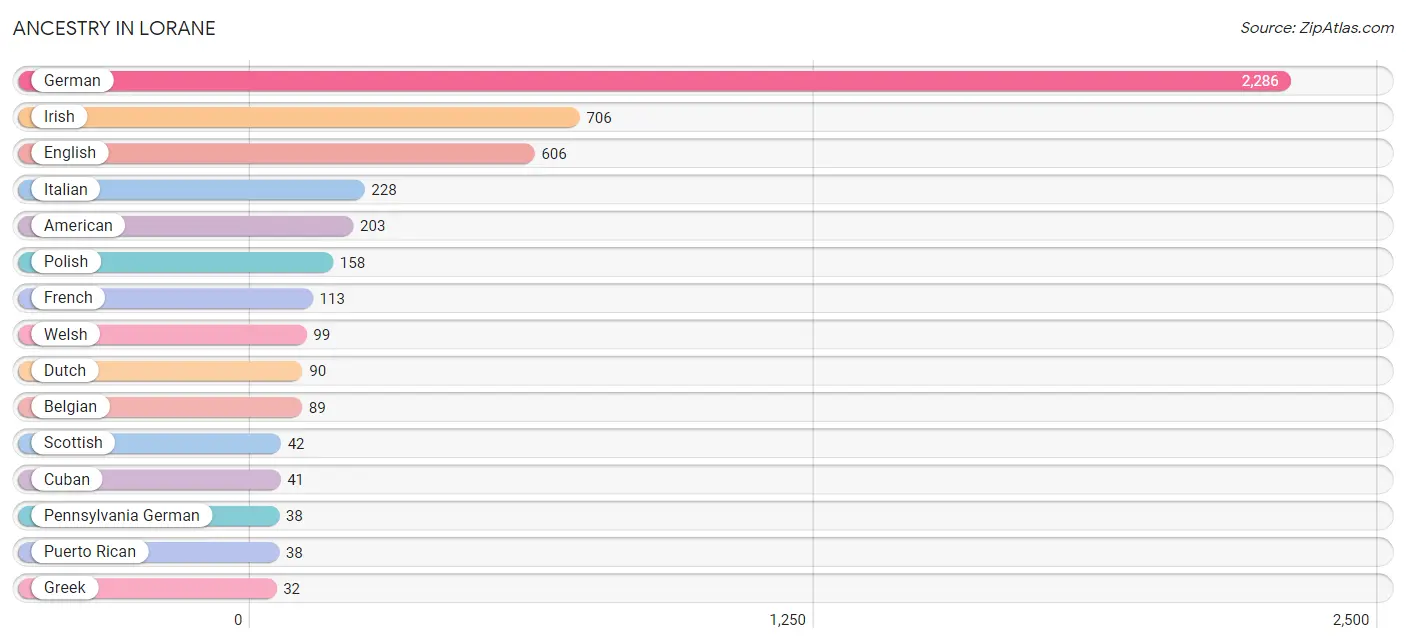
Ancestry in Lorane
The most populous ancestries reported in Lorane are German (2,286 | 52.4%), Irish (706 | 16.2%), English (606 | 13.9%), Italian (228 | 5.2%), and American (203 | 4.6%), together accounting for 92.3% of all Lorane residents.
| Ancestry | # Population | % Population |
| American | 203 | 4.6% |
| Arab | 12 | 0.3% |
| Belgian | 89 | 2.0% |
| British | 11 | 0.3% |
| Canadian | 7 | 0.2% |
| Cuban | 41 | 0.9% |
| Czech | 13 | 0.3% |
| Dutch | 90 | 2.1% |
| Ecuadorian | 14 | 0.3% |
| English | 606 | 13.9% |
| French | 113 | 2.6% |
| French Canadian | 13 | 0.3% |
| German | 2,286 | 52.4% |
| Ghanaian | 20 | 0.5% |
| Greek | 32 | 0.7% |
| Indian (Asian) | 9 | 0.2% |
| Irish | 706 | 16.2% |
| Italian | 228 | 5.2% |
| Lebanese | 12 | 0.3% |
| Lithuanian | 8 | 0.2% |
| Norwegian | 11 | 0.3% |
| Pakistani | 29 | 0.7% |
| Pennsylvania German | 38 | 0.9% |
| Polish | 158 | 3.6% |
| Portuguese | 16 | 0.4% |
| Puerto Rican | 38 | 0.9% |
| Scotch-Irish | 20 | 0.5% |
| Scottish | 42 | 1.0% |
| Slovak | 9 | 0.2% |
| South American | 14 | 0.3% |
| Subsaharan African | 20 | 0.5% |
| Swedish | 10 | 0.2% |
| Swiss | 27 | 0.6% |
| Ukrainian | 12 | 0.3% |
| Welsh | 99 | 2.3% | View All 35 Rows |
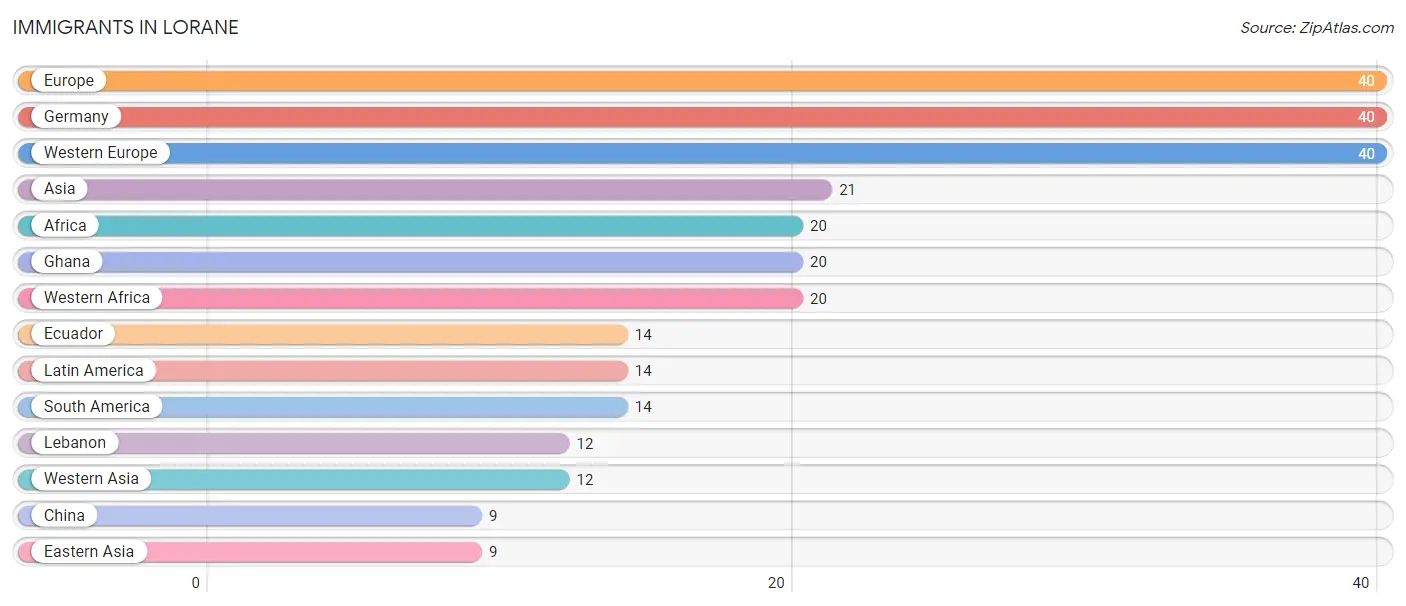
Immigrants in Lorane
The most numerous immigrant groups reported in Lorane came from Europe (40 | 0.9%), Germany (40 | 0.9%), Western Europe (40 | 0.9%), Asia (21 | 0.5%), and Africa (20 | 0.5%), together accounting for 3.7% of all Lorane residents.
| Immigration Origin | # Population | % Population |
| Africa | 20 | 0.5% |
| Asia | 21 | 0.5% |
| China | 9 | 0.2% |
| Eastern Asia | 9 | 0.2% |
| Ecuador | 14 | 0.3% |
| Europe | 40 | 0.9% |
| Germany | 40 | 0.9% |
| Ghana | 20 | 0.5% |
| Latin America | 14 | 0.3% |
| Lebanon | 12 | 0.3% |
| South America | 14 | 0.3% |
| Western Africa | 20 | 0.5% |
| Western Asia | 12 | 0.3% |
| Western Europe | 40 | 0.9% | View All 14 Rows |
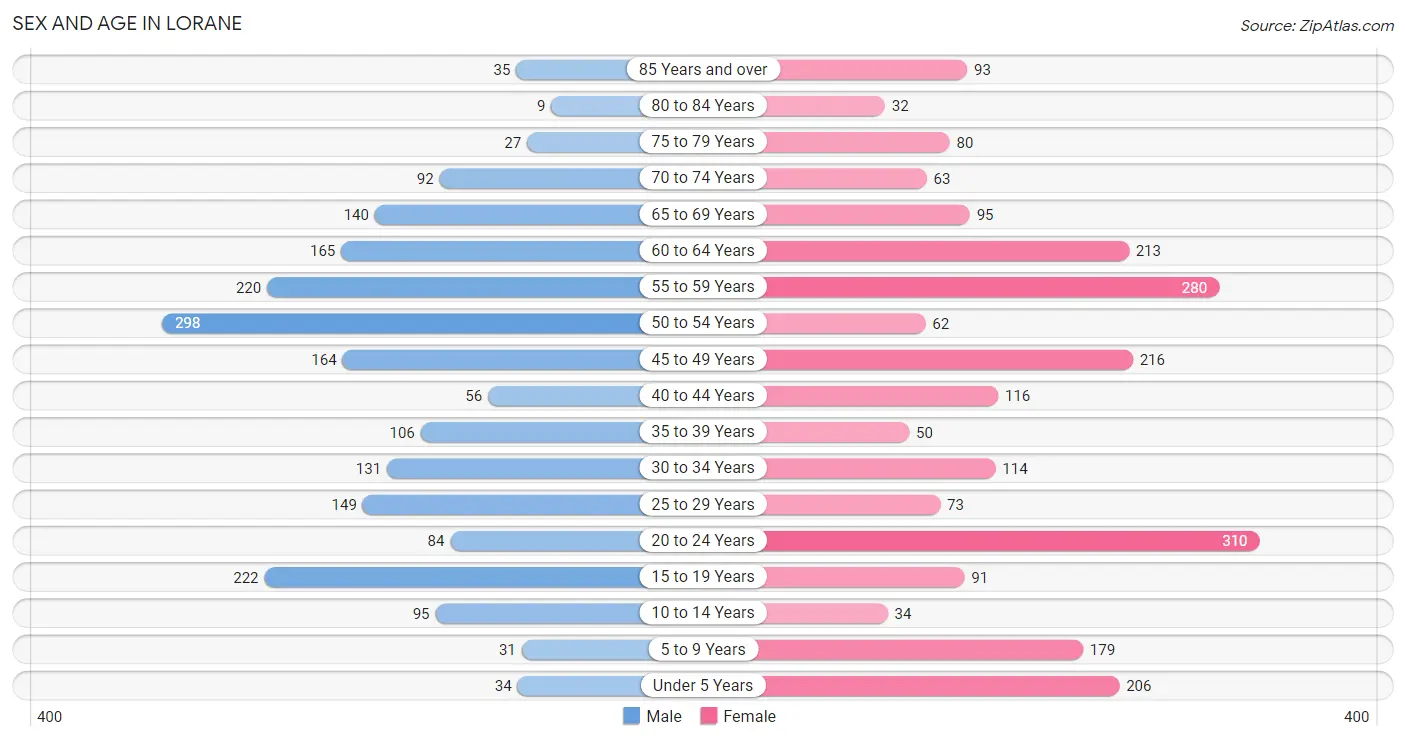
Sex and Age in Lorane
Sex and Age in Lorane
The most populous age groups in Lorane are 50 to 54 Years (298 | 14.5%) for men and 20 to 24 Years (310 | 13.4%) for women.
| Age Bracket | Male | Female |
| Under 5 Years | 34 (1.7%) | 206 (8.9%) |
| 5 to 9 Years | 31 (1.5%) | 179 (7.8%) |
| 10 to 14 Years | 95 (4.6%) | 34 (1.5%) |
| 15 to 19 Years | 222 (10.8%) | 91 (3.9%) |
| 20 to 24 Years | 84 (4.1%) | 310 (13.4%) |
| 25 to 29 Years | 149 (7.2%) | 73 (3.2%) |
| 30 to 34 Years | 131 (6.4%) | 114 (4.9%) |
| 35 to 39 Years | 106 (5.1%) | 50 (2.2%) |
| 40 to 44 Years | 56 (2.7%) | 116 (5.0%) |
| 45 to 49 Years | 164 (8.0%) | 216 (9.4%) |
| 50 to 54 Years | 298 (14.5%) | 62 (2.7%) |
| 55 to 59 Years | 220 (10.7%) | 280 (12.1%) |
| 60 to 64 Years | 165 (8.0%) | 213 (9.2%) |
| 65 to 69 Years | 140 (6.8%) | 95 (4.1%) |
| 70 to 74 Years | 92 (4.5%) | 63 (2.7%) |
| 75 to 79 Years | 27 (1.3%) | 80 (3.5%) |
| 80 to 84 Years | 9 (0.4%) | 32 (1.4%) |
| 85 Years and over | 35 (1.7%) | 93 (4.0%) |
| Total | 2,058 (100.0%) | 2,307 (100.0%) |
Families and Households in Lorane
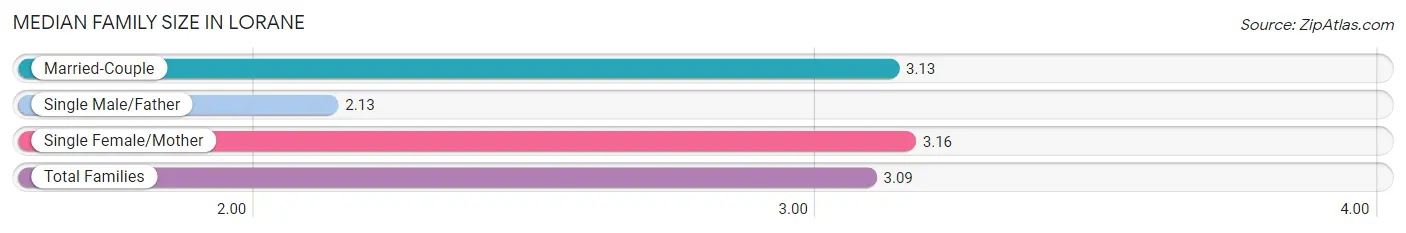
Median Family Size in Lorane
The median family size in Lorane is 3.09 persons per family, with single female/mother families (143 | 11.7%) accounting for the largest median family size of 3.16 persons per family. On the other hand, single male/father families (53 | 4.3%) represent the smallest median family size with 2.13 persons per family.
| Family Type | # Families | Family Size |
| Married-Couple | 1,026 (84.0%) | 3.13 |
| Single Male/Father | 53 (4.3%) | 2.13 |
| Single Female/Mother | 143 (11.7%) | 3.16 |
| Total Families | 1,222 (100.0%) | 3.09 |
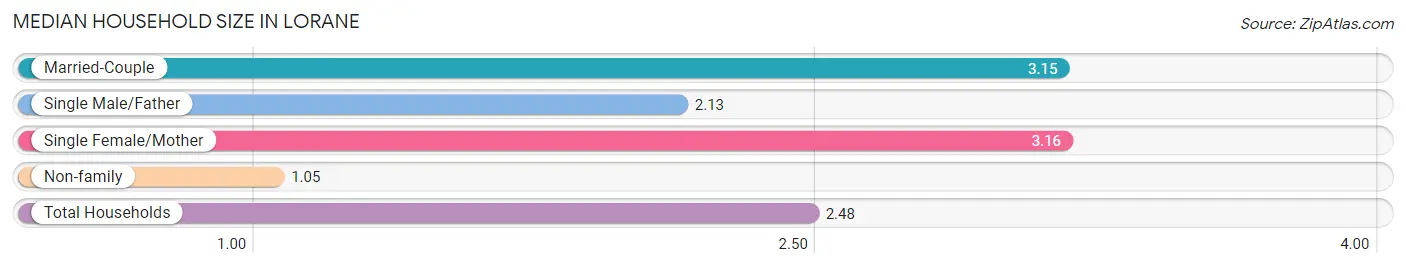
Median Household Size in Lorane
The median household size in Lorane is 2.48 persons per household, with single female/mother households (143 | 8.1%) accounting for the largest median household size of 3.16 persons per household. non-family households (541 | 30.7%) represent the smallest median household size with 1.05 persons per household.
| Household Type | # Households | Household Size |
| Married-Couple | 1,026 (58.2%) | 3.15 |
| Single Male/Father | 53 (3.0%) | 2.13 |
| Single Female/Mother | 143 (8.1%) | 3.16 |
| Non-family | 541 (30.7%) | 1.05 |
| Total Households | 1,763 (100.0%) | 2.48 |
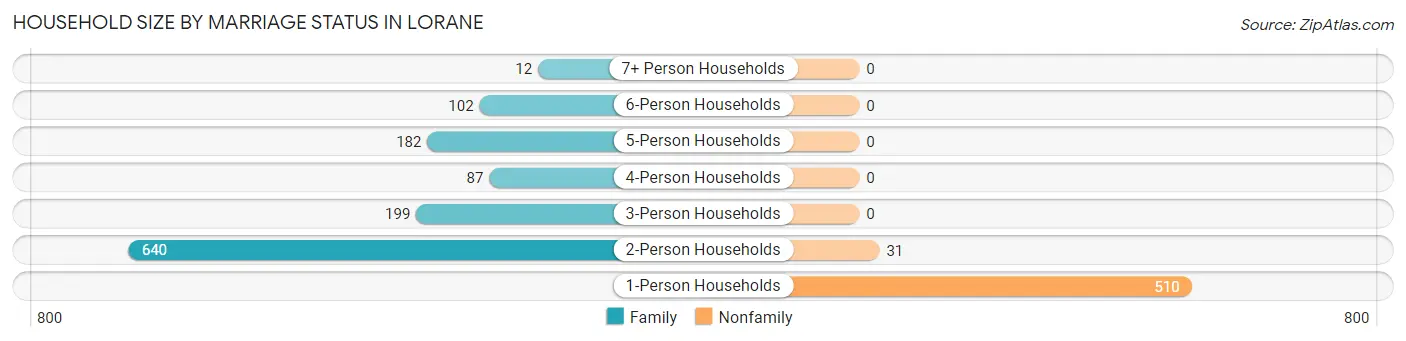
Household Size by Marriage Status in Lorane
Out of a total of 1,763 households in Lorane, 1,222 (69.3%) are family households, while 541 (30.7%) are nonfamily households. The most numerous type of family households are 2-person households, comprising 640, and the most common type of nonfamily households are 1-person households, comprising 510.
| Household Size | Family Households | Nonfamily Households |
| 1-Person Households | - | 510 (28.9%) |
| 2-Person Households | 640 (36.3%) | 31 (1.8%) |
| 3-Person Households | 199 (11.3%) | 0 (0.0%) |
| 4-Person Households | 87 (4.9%) | 0 (0.0%) |
| 5-Person Households | 182 (10.3%) | 0 (0.0%) |
| 6-Person Households | 102 (5.8%) | 0 (0.0%) |
| 7+ Person Households | 12 (0.7%) | 0 (0.0%) |
| Total | 1,222 (69.3%) | 541 (30.7%) |
Female Fertility in Lorane
Fertility by Age in Lorane
Average fertility rate in Lorane is 53.0 births per 1,000 women. Women in the age bracket of 20 to 34 years have the highest fertility rate with 105.0 births per 1,000 women. Women in the age bracket of 20 to 34 years acount for 100.0% of all women with births.
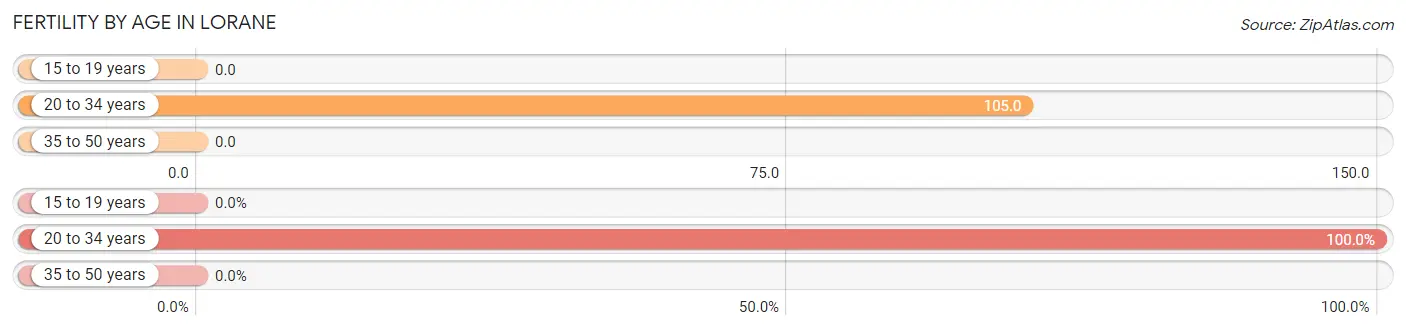
| Age Bracket | Women with Births | Births / 1,000 Women |
| 15 to 19 years | 0 (0.0%) | 0.0 |
| 20 to 34 years | 52 (100.0%) | 105.0 |
| 35 to 50 years | 0 (0.0%) | 0.0 |
| Total | 52 (100.0%) | 53.0 |
Fertility by Age by Marriage Status in Lorane
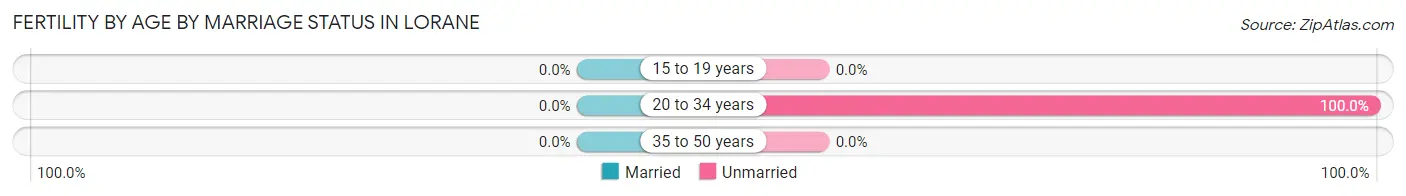
| Age Bracket | Married | Unmarried |
| 15 to 19 years | 0 (0.0%) | 0 (0.0%) |
| 20 to 34 years | 0 (0.0%) | 52 (100.0%) |
| 35 to 50 years | 0 (0.0%) | 0 (0.0%) |
| Total | 0 (0.0%) | 52 (100.0%) |
Fertility by Education in Lorane
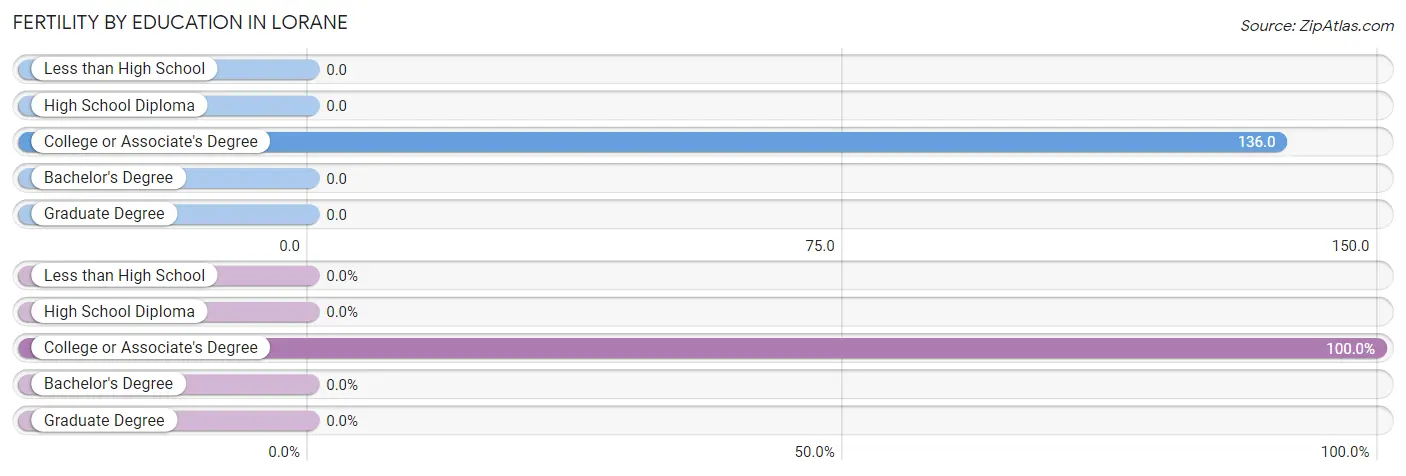
| Educational Attainment | Women with Births | Births / 1,000 Women |
| Less than High School | 0 (0.0%) | 0.0 |
| High School Diploma | 0 (0.0%) | 0.0 |
| College or Associate's Degree | 52 (100.0%) | 136.0 |
| Bachelor's Degree | 0 (0.0%) | 0.0 |
| Graduate Degree | 0 (0.0%) | 0.0 |
| Total | 52 (100.0%) | 53.0 |
Fertility by Education by Marriage Status in Lorane
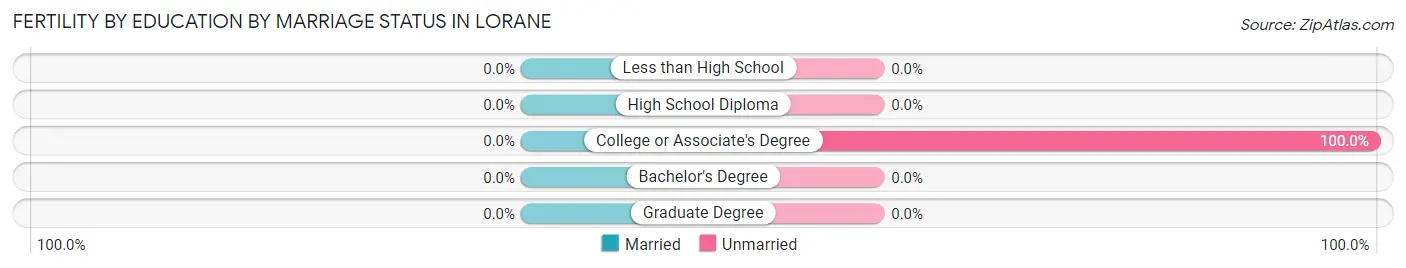
| Educational Attainment | Married | Unmarried |
| Less than High School | 0 (0.0%) | 0 (0.0%) |
| High School Diploma | 0 (0.0%) | 0 (0.0%) |
| College or Associate's Degree | 0 (0.0%) | 52 (100.0%) |
| Bachelor's Degree | 0 (0.0%) | 0 (0.0%) |
| Graduate Degree | 0 (0.0%) | 0 (0.0%) |
| Total | 0 (0.0%) | 52 (100.0%) |
Income in Lorane
Income Overview in Lorane
Per Capita Income in Lorane is $42,510, while median incomes of families and households are $119,722 and $82,875 respectively.
| Characteristic | Number | Measure |
| Per Capita Income | 4,365 | $42,510 |
| Median Family Income | 1,222 | $119,722 |
| Mean Family Income | 1,222 | $122,835 |
| Median Household Income | 1,763 | $82,875 |
| Mean Household Income | 1,763 | $103,341 |
| Income Deficit | 1,222 | $0 |
| Wage / Income Gap (%) | 4,365 | 53.10% |
| Wage / Income Gap ($) | 4,365 | 46.90¢ per $1 |
| Gini / Inequality Index | 4,365 | 0.42 |
Earnings by Sex in Lorane
Average Earnings in Lorane are $42,835, $68,804 for men and $32,271 for women, a difference of 53.1%.
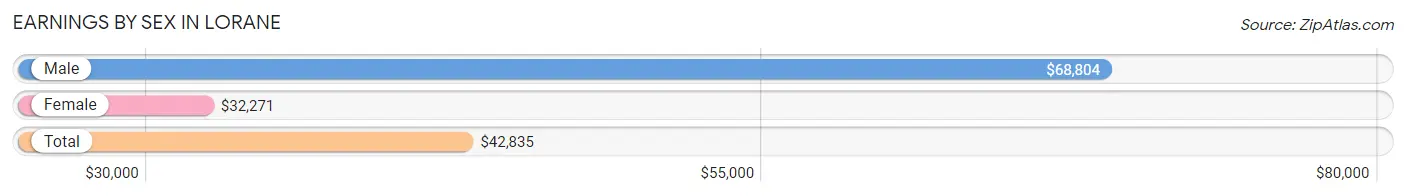
| Sex | Number | Average Earnings |
| Male | 1,372 (50.6%) | $68,804 |
| Female | 1,337 (49.3%) | $32,271 |
| Total | 2,709 (100.0%) | $42,835 |
Earnings by Sex by Income Bracket in Lorane
The most common earnings brackets in Lorane are $75,000 to $99,999 for men (300 | 21.9%) and $100,000+ for women (215 | 16.1%).
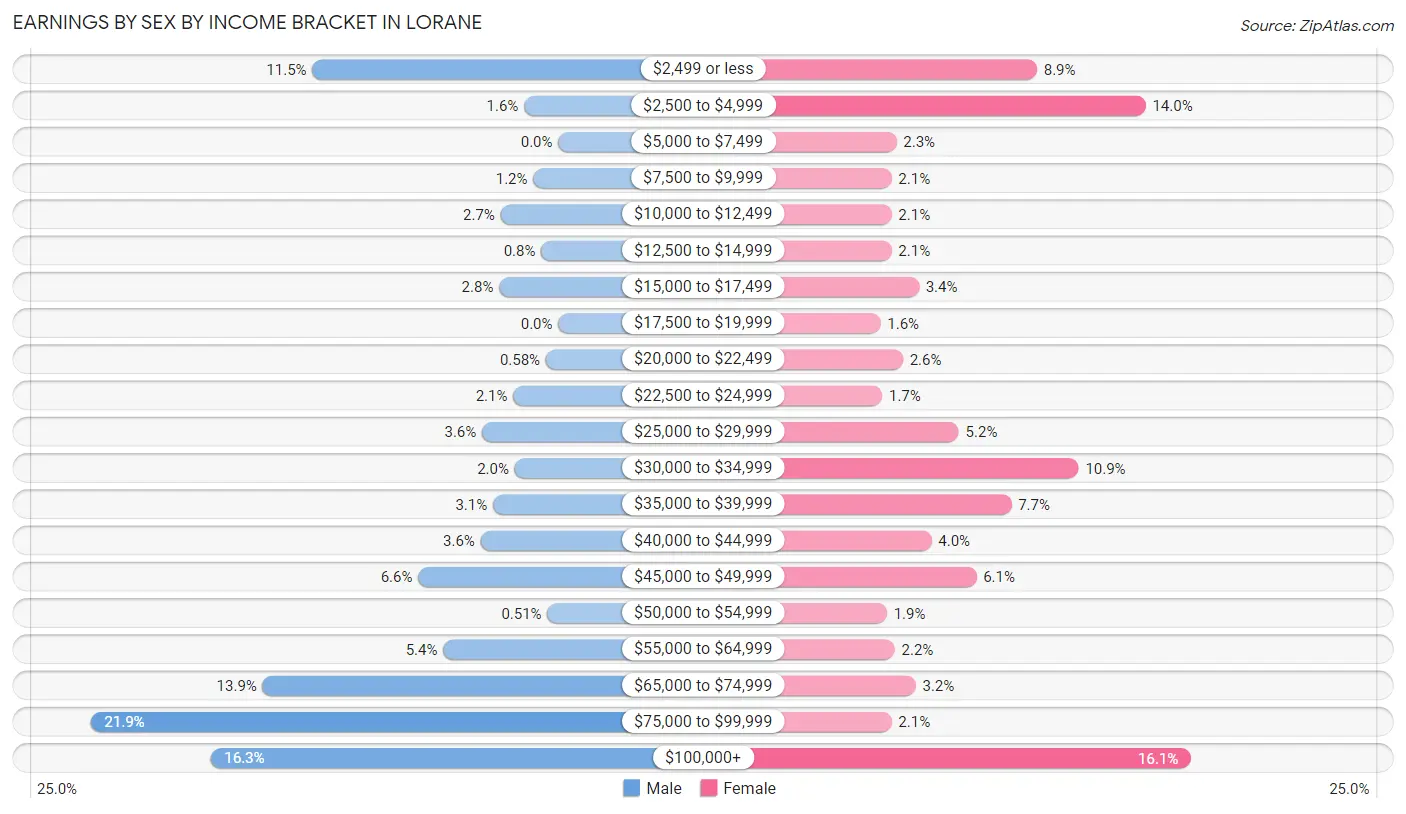
| Income | Male | Female |
| $2,499 or less | 158 (11.5%) | 119 (8.9%) |
| $2,500 to $4,999 | 22 (1.6%) | 187 (14.0%) |
| $5,000 to $7,499 | 0 (0.0%) | 31 (2.3%) |
| $7,500 to $9,999 | 16 (1.2%) | 28 (2.1%) |
| $10,000 to $12,499 | 37 (2.7%) | 28 (2.1%) |
| $12,500 to $14,999 | 11 (0.8%) | 28 (2.1%) |
| $15,000 to $17,499 | 38 (2.8%) | 45 (3.4%) |
| $17,500 to $19,999 | 0 (0.0%) | 21 (1.6%) |
| $20,000 to $22,499 | 8 (0.6%) | 35 (2.6%) |
| $22,500 to $24,999 | 29 (2.1%) | 22 (1.7%) |
| $25,000 to $29,999 | 49 (3.6%) | 70 (5.2%) |
| $30,000 to $34,999 | 28 (2.0%) | 145 (10.8%) |
| $35,000 to $39,999 | 42 (3.1%) | 103 (7.7%) |
| $40,000 to $44,999 | 50 (3.6%) | 53 (4.0%) |
| $45,000 to $49,999 | 90 (6.6%) | 81 (6.1%) |
| $50,000 to $54,999 | 7 (0.5%) | 25 (1.9%) |
| $55,000 to $64,999 | 74 (5.4%) | 30 (2.2%) |
| $65,000 to $74,999 | 190 (13.9%) | 43 (3.2%) |
| $75,000 to $99,999 | 300 (21.9%) | 28 (2.1%) |
| $100,000+ | 223 (16.3%) | 215 (16.1%) |
| Total | 1,372 (100.0%) | 1,337 (100.0%) |
Earnings by Sex by Educational Attainment in Lorane
Average earnings in Lorane are $74,131 for men and $38,293 for women, a difference of 48.3%. Men with an educational attainment of bachelor's degree enjoy the highest average annual earnings of $95,972, while those with high school diploma education earn the least with $63,299. Women with an educational attainment of graduate degree earn the most with the average annual earnings of $91,250, while those with high school diploma education have the smallest earnings of $33,559.
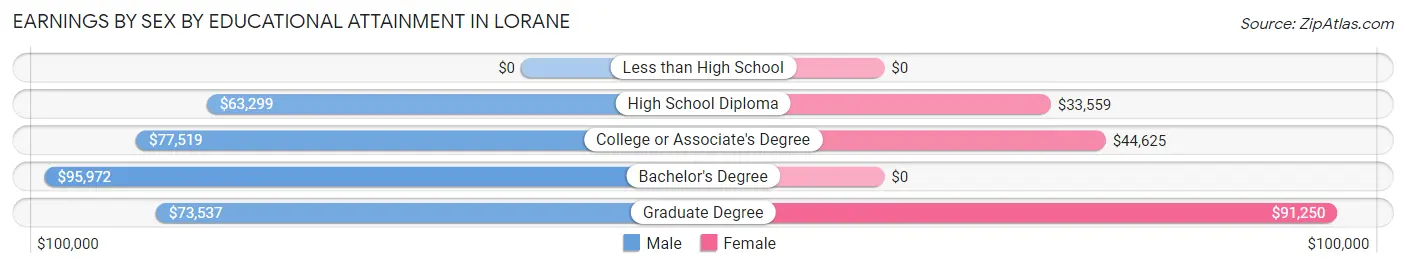
| Educational Attainment | Male Income | Female Income |
| Less than High School | - | - |
| High School Diploma | $63,299 | $33,559 |
| College or Associate's Degree | $77,519 | $44,625 |
| Bachelor's Degree | $95,972 | $0 |
| Graduate Degree | $73,537 | $91,250 |
| Total | $74,131 | $38,293 |
Family Income in Lorane
Family Income Brackets in Lorane
According to the Lorane family income data, there are 334 families falling into the $100,000 to $149,999 income range, which is the most common income bracket and makes up 27.3% of all families.
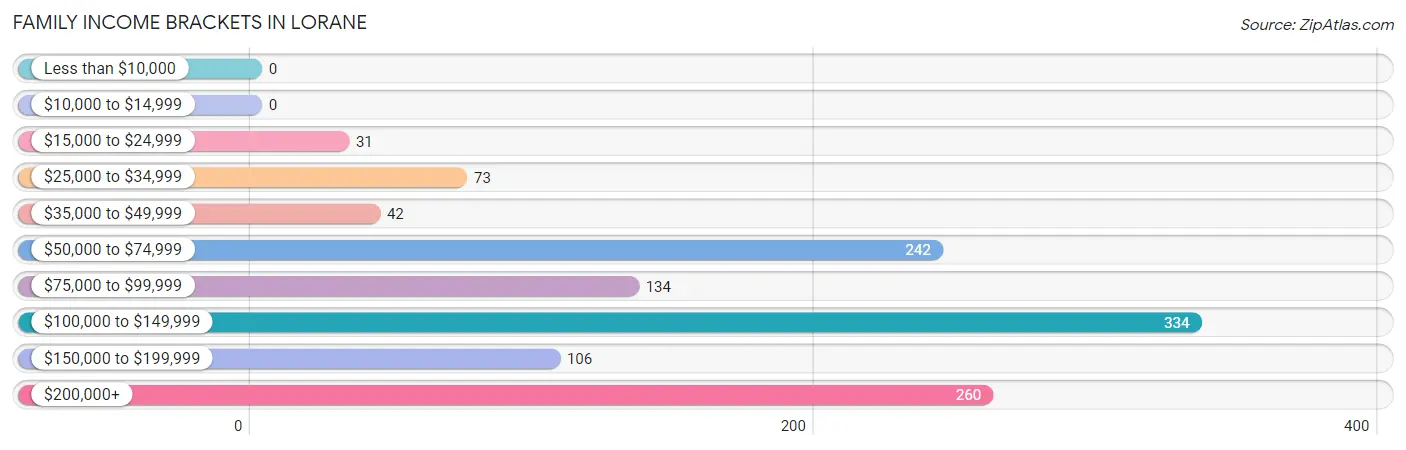
| Income Bracket | # Families | % Families |
| Less than $10,000 | 0 | 0.0% |
| $10,000 to $14,999 | 0 | 0.0% |
| $15,000 to $24,999 | 31 | 2.5% |
| $25,000 to $34,999 | 73 | 6.0% |
| $35,000 to $49,999 | 42 | 3.4% |
| $50,000 to $74,999 | 242 | 19.8% |
| $75,000 to $99,999 | 134 | 11.0% |
| $100,000 to $149,999 | 334 | 27.3% |
| $150,000 to $199,999 | 106 | 8.7% |
| $200,000+ | 260 | 21.3% |
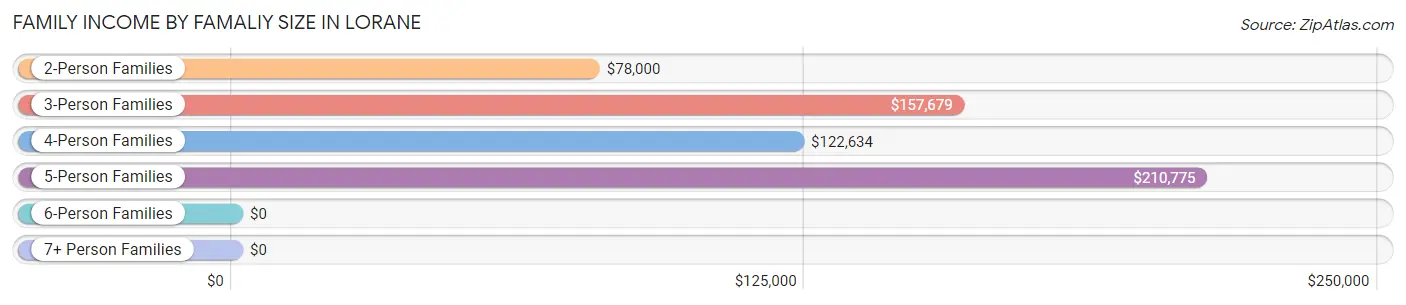
Family Income by Famaliy Size in Lorane
5-person families (197 | 16.1%) account for the highest median family income in Lorane with $210,775 per family, while 3-person families (199 | 16.3%) have the highest median income of $52,560 per family member.
| Income Bracket | # Families | Median Income |
| 2-Person Families | 640 (52.4%) | $78,000 |
| 3-Person Families | 199 (16.3%) | $157,679 |
| 4-Person Families | 87 (7.1%) | $122,634 |
| 5-Person Families | 197 (16.1%) | $210,775 |
| 6-Person Families | 87 (7.1%) | $0 |
| 7+ Person Families | 12 (1.0%) | $0 |
| Total | 1,222 (100.0%) | $119,722 |
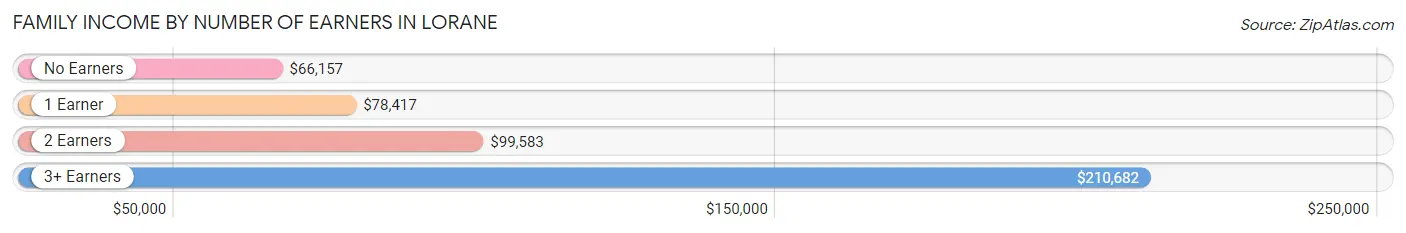
Family Income by Number of Earners in Lorane
The median family income in Lorane is $119,722, with families comprising 3+ earners (358) having the highest median family income of $210,682, while families with no earners (152) have the lowest median family income of $66,157, accounting for 29.3% and 12.4% of families, respectively.
| Number of Earners | # Families | Median Income |
| No Earners | 152 (12.4%) | $66,157 |
| 1 Earner | 235 (19.2%) | $78,417 |
| 2 Earners | 477 (39.0%) | $99,583 |
| 3+ Earners | 358 (29.3%) | $210,682 |
| Total | 1,222 (100.0%) | $119,722 |
Household Income in Lorane
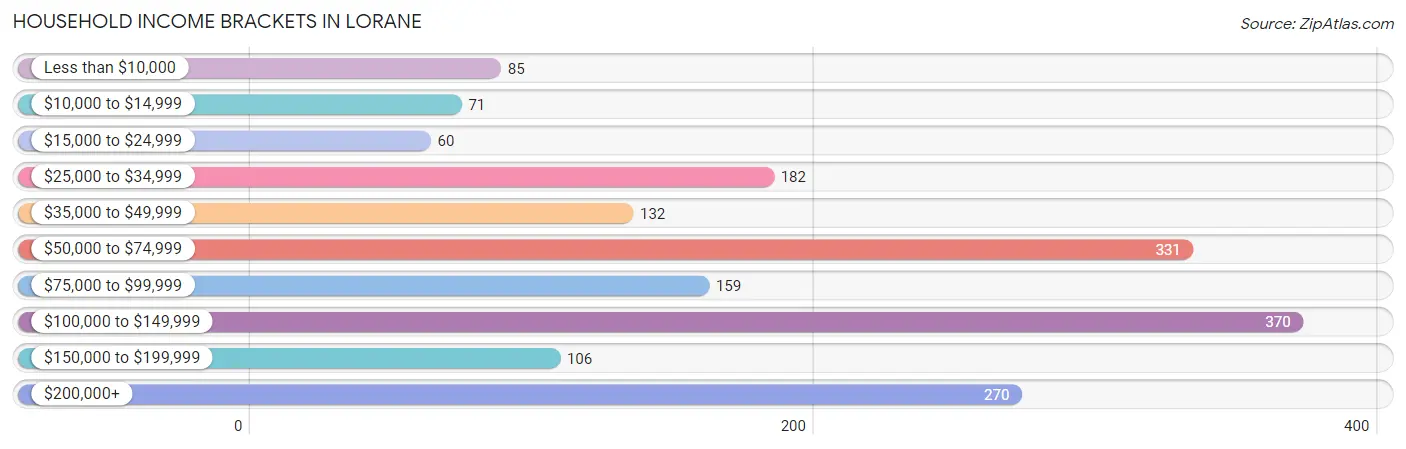
Household Income Brackets in Lorane
With 370 households falling in the category, the $100,000 to $149,999 income range is the most frequent in Lorane, accounting for 21.0% of all households. In contrast, only 60 households (3.4%) fall into the $15,000 to $24,999 income bracket, making it the least populous group.
| Income Bracket | # Households | % Households |
| Less than $10,000 | 85 | 4.8% |
| $10,000 to $14,999 | 71 | 4.0% |
| $15,000 to $24,999 | 60 | 3.4% |
| $25,000 to $34,999 | 182 | 10.3% |
| $35,000 to $49,999 | 132 | 7.5% |
| $50,000 to $74,999 | 331 | 18.8% |
| $75,000 to $99,999 | 159 | 9.0% |
| $100,000 to $149,999 | 370 | 21.0% |
| $150,000 to $199,999 | 106 | 6.0% |
| $200,000+ | 270 | 15.3% |
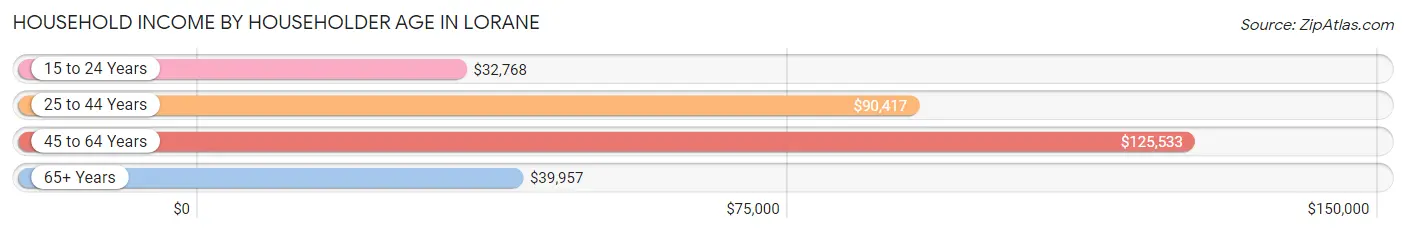
Household Income by Householder Age in Lorane
The median household income in Lorane is $82,875, with the highest median household income of $125,533 found in the 45 to 64 years age bracket for the primary householder. A total of 902 households (51.2%) fall into this category. Meanwhile, the 15 to 24 years age bracket for the primary householder has the lowest median household income of $32,768, with 59 households (3.4%) in this group.
| Income Bracket | # Households | Median Income |
| 15 to 24 Years | 59 (3.4%) | $32,768 |
| 25 to 44 Years | 327 (18.5%) | $90,417 |
| 45 to 64 Years | 902 (51.2%) | $125,533 |
| 65+ Years | 475 (26.9%) | $39,957 |
| Total | 1,763 (100.0%) | $82,875 |
Poverty in Lorane
Income Below Poverty by Sex and Age in Lorane
With 5.0% poverty level for males and 5.2% for females among the residents of Lorane, 35 to 44 year old males and 75 year old and over females are the most vulnerable to poverty, with 50 males (30.9%) and 75 females (36.6%) in their respective age groups living below the poverty level.
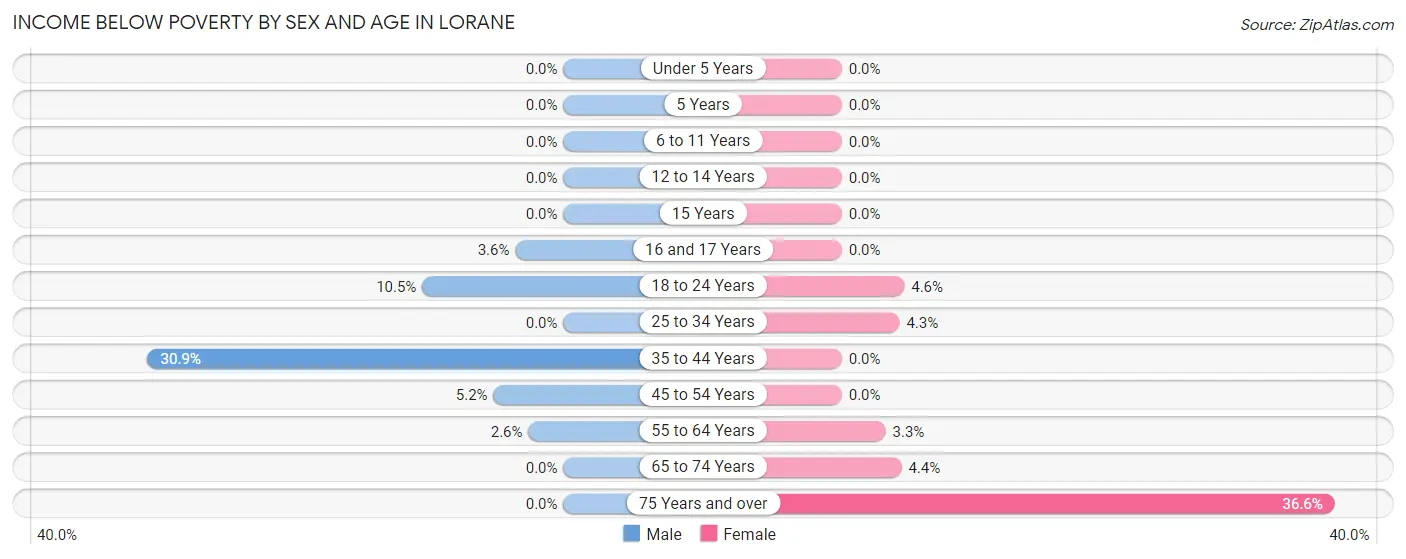
| Age Bracket | Male | Female |
| Under 5 Years | 0 (0.0%) | 0 (0.0%) |
| 5 Years | 0 (0.0%) | 0 (0.0%) |
| 6 to 11 Years | 0 (0.0%) | 0 (0.0%) |
| 12 to 14 Years | 0 (0.0%) | 0 (0.0%) |
| 15 Years | 0 (0.0%) | 0 (0.0%) |
| 16 and 17 Years | 6 (3.6%) | 0 (0.0%) |
| 18 to 24 Years | 13 (10.5%) | 15 (4.6%) |
| 25 to 34 Years | 0 (0.0%) | 8 (4.3%) |
| 35 to 44 Years | 50 (30.9%) | 0 (0.0%) |
| 45 to 54 Years | 24 (5.2%) | 0 (0.0%) |
| 55 to 64 Years | 10 (2.6%) | 16 (3.3%) |
| 65 to 74 Years | 0 (0.0%) | 7 (4.4%) |
| 75 Years and over | 0 (0.0%) | 75 (36.6%) |
| Total | 103 (5.0%) | 121 (5.2%) |
Income Above Poverty by Sex and Age in Lorane
According to the poverty statistics in Lorane, males aged under 5 years and females aged under 5 years are the age groups that are most secure financially, with 100.0% of males and 100.0% of females in these age groups living above the poverty line.
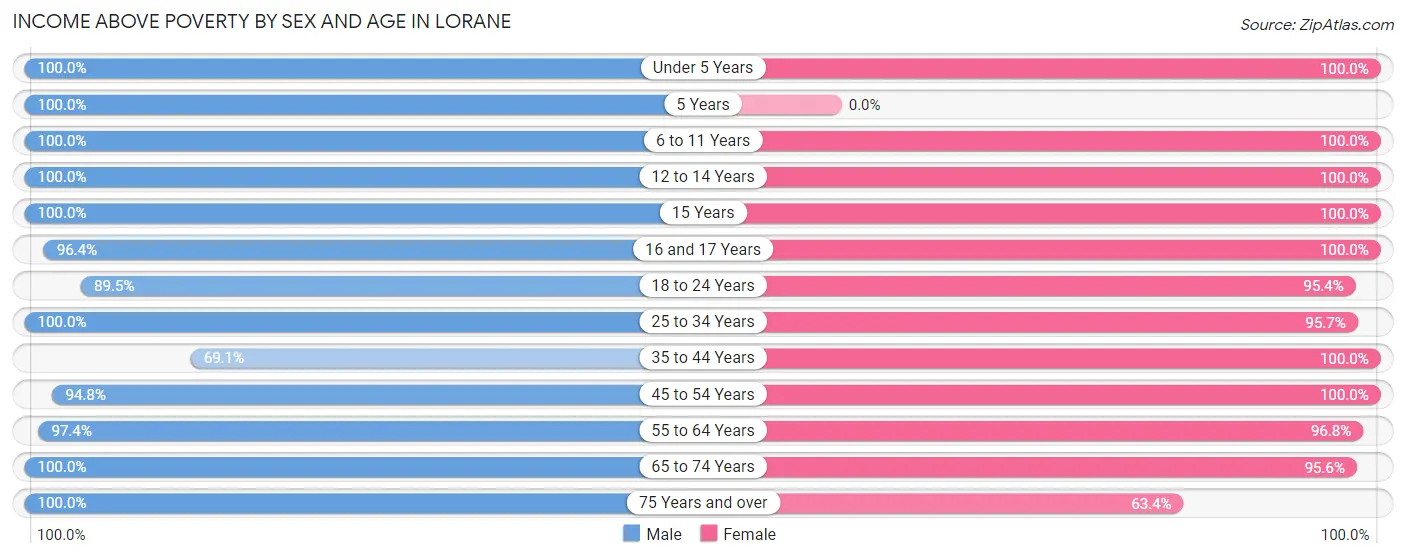
| Age Bracket | Male | Female |
| Under 5 Years | 34 (100.0%) | 206 (100.0%) |
| 5 Years | 14 (100.0%) | 0 (0.0%) |
| 6 to 11 Years | 42 (100.0%) | 179 (100.0%) |
| 12 to 14 Years | 70 (100.0%) | 34 (100.0%) |
| 15 Years | 14 (100.0%) | 75 (100.0%) |
| 16 and 17 Years | 162 (96.4%) | 3 (100.0%) |
| 18 to 24 Years | 111 (89.5%) | 308 (95.4%) |
| 25 to 34 Years | 280 (100.0%) | 179 (95.7%) |
| 35 to 44 Years | 112 (69.1%) | 166 (100.0%) |
| 45 to 54 Years | 438 (94.8%) | 278 (100.0%) |
| 55 to 64 Years | 375 (97.4%) | 477 (96.8%) |
| 65 to 74 Years | 232 (100.0%) | 151 (95.6%) |
| 75 Years and over | 71 (100.0%) | 130 (63.4%) |
| Total | 1,955 (95.0%) | 2,186 (94.8%) |
Income Below Poverty Among Married-Couple Families in Lorane
The poverty statistics for married-couple families in Lorane show that 1.1% or 11 of the total 1,026 families live below the poverty line. Families with 1 or 2 children have the highest poverty rate of 3.2%, comprising of 11 families. On the other hand, families with no children have the lowest poverty rate of 0.0%, which includes 0 families.
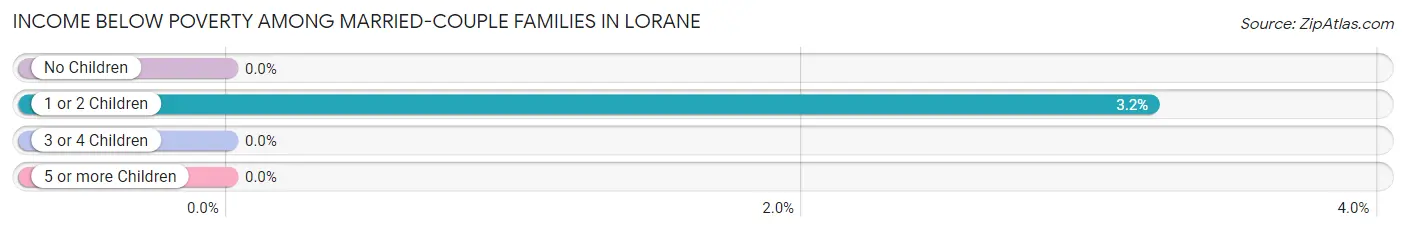
| Children | Above Poverty | Below Poverty |
| No Children | 656 (100.0%) | 0 (0.0%) |
| 1 or 2 Children | 332 (96.8%) | 11 (3.2%) |
| 3 or 4 Children | 27 (100.0%) | 0 (0.0%) |
| 5 or more Children | 0 (0.0%) | 0 (0.0%) |
| Total | 1,015 (98.9%) | 11 (1.1%) |
Income Below Poverty Among Single-Parent Households in Lorane
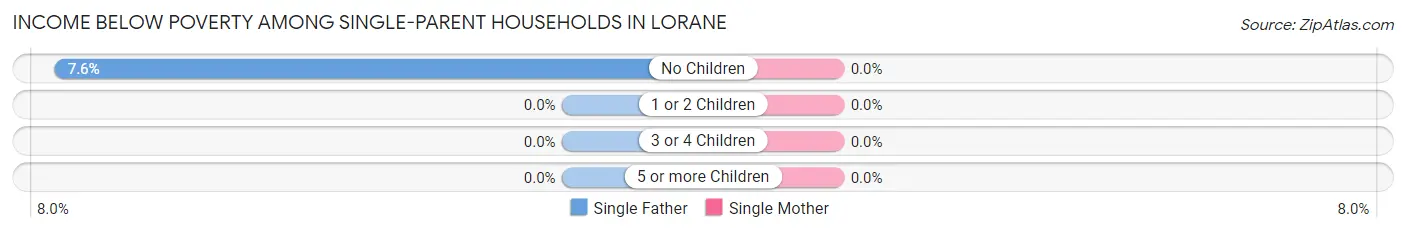
| Children | Single Father | Single Mother |
| No Children | 4 (7.5%) | 0 (0.0%) |
| 1 or 2 Children | 0 (0.0%) | 0 (0.0%) |
| 3 or 4 Children | 0 (0.0%) | 0 (0.0%) |
| 5 or more Children | 0 (0.0%) | 0 (0.0%) |
| Total | 4 (7.5%) | 0 (0.0%) |
Income Below Poverty Among Married-Couple vs Single-Parent Households in Lorane
The poverty data for Lorane shows that 11 of the married-couple family households (1.1%) and 4 of the single-parent households (2.0%) are living below the poverty level. Within the married-couple family households, those with 1 or 2 children have the highest poverty rate, with 11 households (3.2%) falling below the poverty line. Among the single-parent households, those with no children have the highest poverty rate, with 4 household (4.9%) living below poverty.
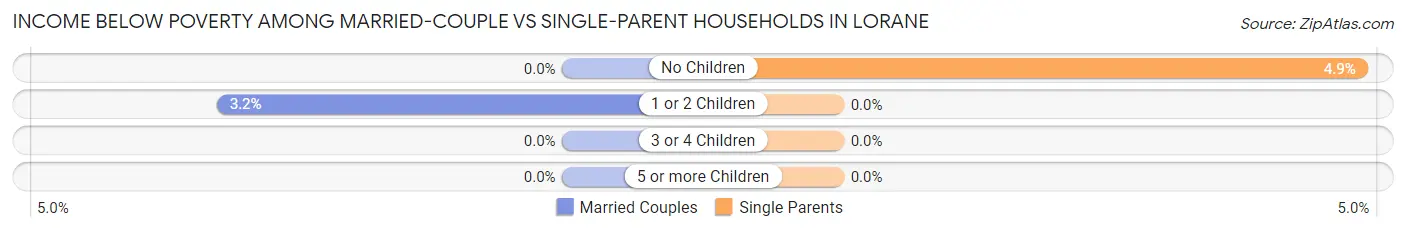
| Children | Married-Couple Families | Single-Parent Households |
| No Children | 0 (0.0%) | 4 (4.9%) |
| 1 or 2 Children | 11 (3.2%) | 0 (0.0%) |
| 3 or 4 Children | 0 (0.0%) | 0 (0.0%) |
| 5 or more Children | 0 (0.0%) | 0 (0.0%) |
| Total | 11 (1.1%) | 4 (2.0%) |
Employment Characteristics in Lorane
Employment by Class of Employer in Lorane
Among the 2,261 employed individuals in Lorane, private company employees (1,905 | 84.3%), not-for-profit organizations (174 | 7.7%), and local government employees (135 | 6.0%) make up the most common classes of employment.
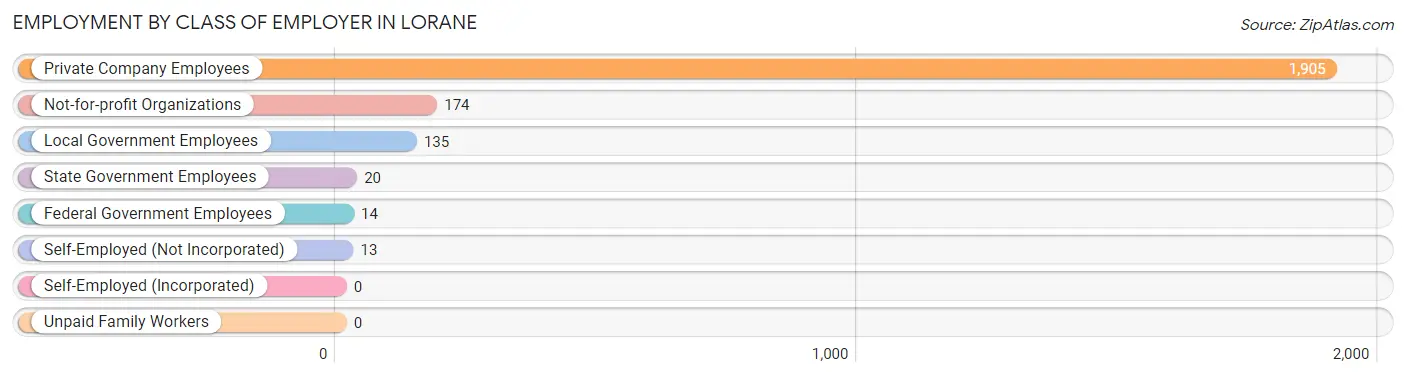
| Employer Class | # Employees | % Employees |
| Private Company Employees | 1,905 | 84.3% |
| Self-Employed (Incorporated) | 0 | 0.0% |
| Self-Employed (Not Incorporated) | 13 | 0.6% |
| Not-for-profit Organizations | 174 | 7.7% |
| Local Government Employees | 135 | 6.0% |
| State Government Employees | 20 | 0.9% |
| Federal Government Employees | 14 | 0.6% |
| Unpaid Family Workers | 0 | 0.0% |
| Total | 2,261 | 100.0% |
Employment Status by Age in Lorane
According to the labor force statistics for Lorane, out of the total population over 16 years of age (3,697), 68.2% or 2,521 individuals are in the labor force, with 9.0% or 227 of them unemployed. The age group with the highest labor force participation rate is 25 to 29 years, with 100.0% or 222 individuals in the labor force. Within the labor force, the 16 to 19 years age range has the highest percentage of unemployed individuals, with 46.2% or 36 of them being unemployed.
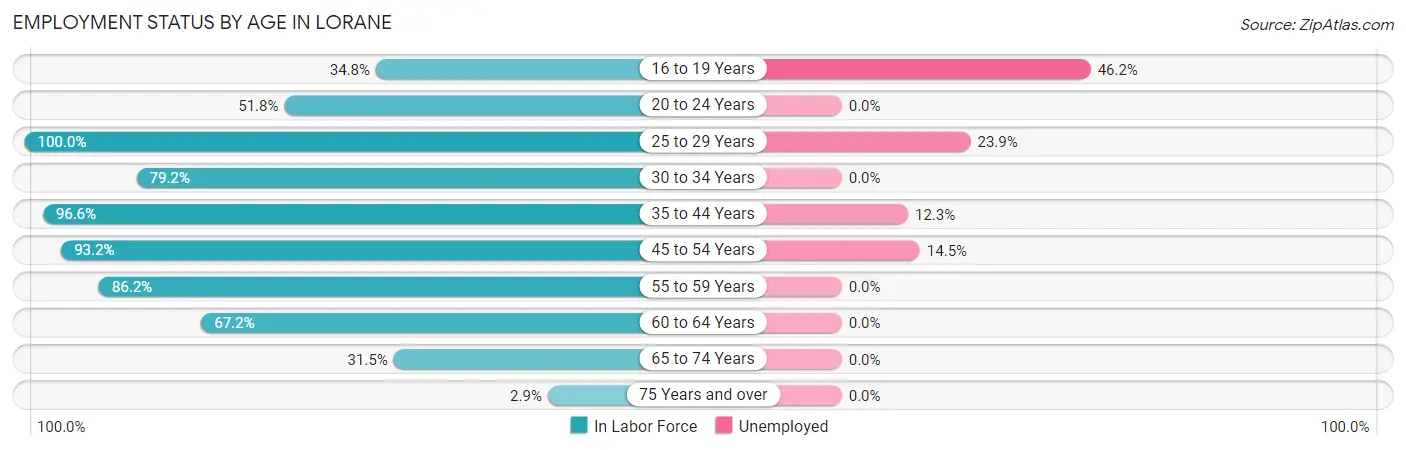
| Age Bracket | In Labor Force | Unemployed |
| 16 to 19 Years | 78 (34.8%) | 36 (46.2%) |
| 20 to 24 Years | 204 (51.8%) | 0 (0.0%) |
| 25 to 29 Years | 222 (100.0%) | 53 (23.9%) |
| 30 to 34 Years | 194 (79.2%) | 0 (0.0%) |
| 35 to 44 Years | 317 (96.6%) | 39 (12.3%) |
| 45 to 54 Years | 690 (93.2%) | 100 (14.5%) |
| 55 to 59 Years | 431 (86.2%) | 0 (0.0%) |
| 60 to 64 Years | 254 (67.2%) | 0 (0.0%) |
| 65 to 74 Years | 123 (31.5%) | 0 (0.0%) |
| 75 Years and over | 8 (2.9%) | 0 (0.0%) |
| Total | 2,521 (68.2%) | 227 (9.0%) |
Employment Status by Educational Attainment in Lorane
According to labor force statistics for Lorane, 87.4% of individuals (2,109) out of the total population between 25 and 64 years of age (2,413) are in the labor force, with 9.1% or 192 of them being unemployed. The group with the highest labor force participation rate are those with the educational attainment of bachelor's degree or higher, with 95.1% or 819 individuals in the labor force. Within the labor force, individuals with high school diploma education have the highest percentage of unemployment, with 14.5% or 119 of them being unemployed.
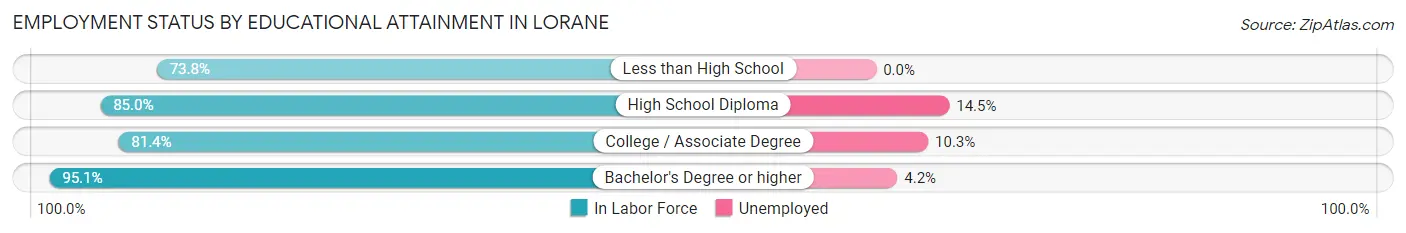
| Educational Attainment | In Labor Force | Unemployed |
| Less than High School | 90 (73.8%) | 0 (0.0%) |
| High School Diploma | 822 (85.0%) | 140 (14.5%) |
| College / Associate Degree | 377 (81.4%) | 48 (10.3%) |
| Bachelor's Degree or higher | 819 (95.1%) | 36 (4.2%) |
| Total | 2,109 (87.4%) | 220 (9.1%) |
Employment Occupations by Sex in Lorane
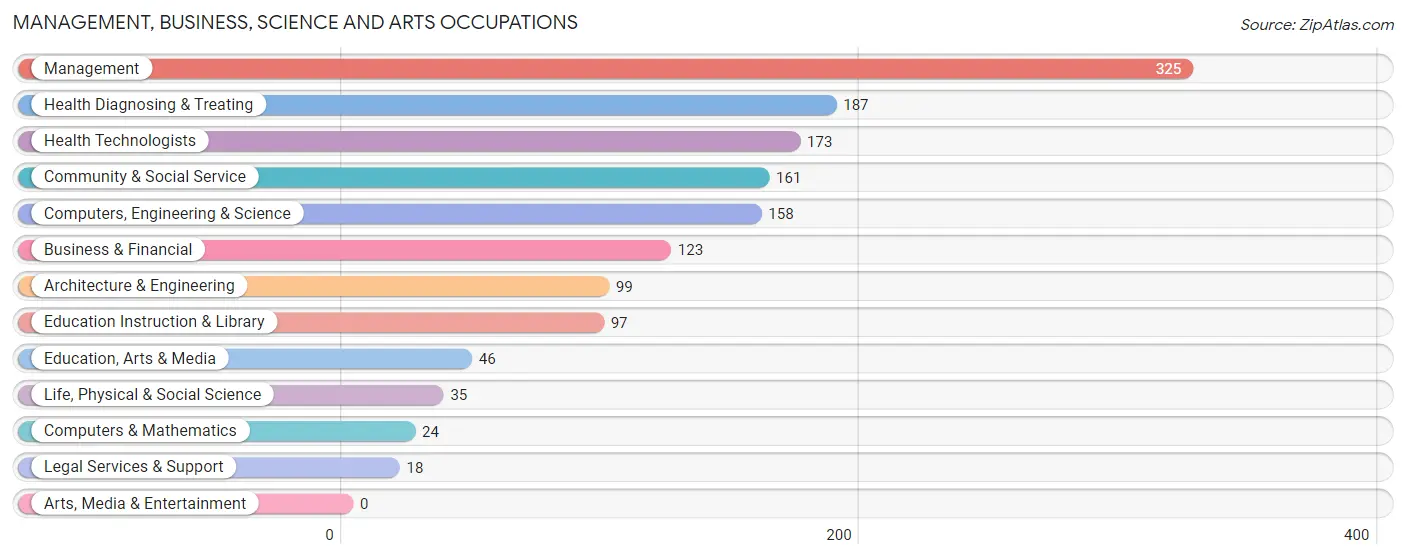
Management, Business, Science and Arts Occupations
The most common Management, Business, Science and Arts occupations in Lorane are Management (325 | 14.2%), Health Diagnosing & Treating (187 | 8.2%), Health Technologists (173 | 7.5%), Community & Social Service (161 | 7.0%), and Computers, Engineering & Science (158 | 6.9%).
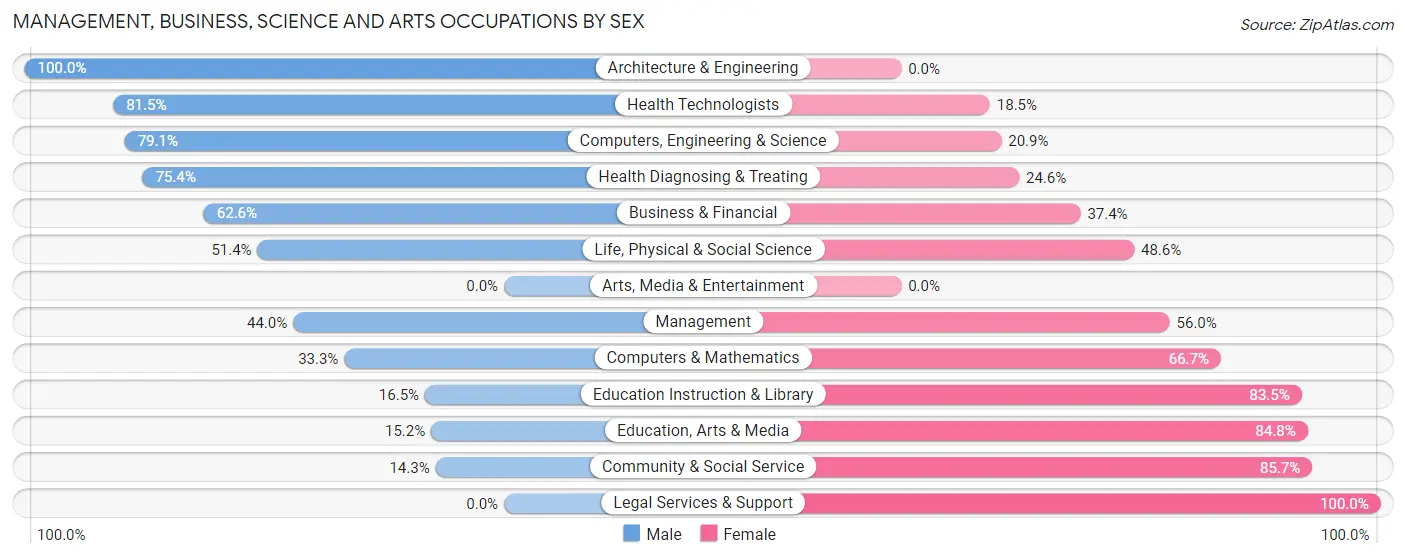
Management, Business, Science and Arts Occupations by Sex
Within the Management, Business, Science and Arts occupations in Lorane, the most male-oriented occupations are Architecture & Engineering (100.0%), Health Technologists (81.5%), and Computers, Engineering & Science (79.1%), while the most female-oriented occupations are Legal Services & Support (100.0%), Community & Social Service (85.7%), and Education, Arts & Media (84.8%).
| Occupation | Male | Female |
| Management | 143 (44.0%) | 182 (56.0%) |
| Business & Financial | 77 (62.6%) | 46 (37.4%) |
| Computers, Engineering & Science | 125 (79.1%) | 33 (20.9%) |
| Computers & Mathematics | 8 (33.3%) | 16 (66.7%) |
| Architecture & Engineering | 99 (100.0%) | 0 (0.0%) |
| Life, Physical & Social Science | 18 (51.4%) | 17 (48.6%) |
| Community & Social Service | 23 (14.3%) | 138 (85.7%) |
| Education, Arts & Media | 7 (15.2%) | 39 (84.8%) |
| Legal Services & Support | 0 (0.0%) | 18 (100.0%) |
| Education Instruction & Library | 16 (16.5%) | 81 (83.5%) |
| Arts, Media & Entertainment | 0 (0.0%) | 0 (0.0%) |
| Health Diagnosing & Treating | 141 (75.4%) | 46 (24.6%) |
| Health Technologists | 141 (81.5%) | 32 (18.5%) |
| Total (Category) | 509 (53.3%) | 445 (46.7%) |
| Total (Overall) | 1,199 (52.3%) | 1,094 (47.7%) |
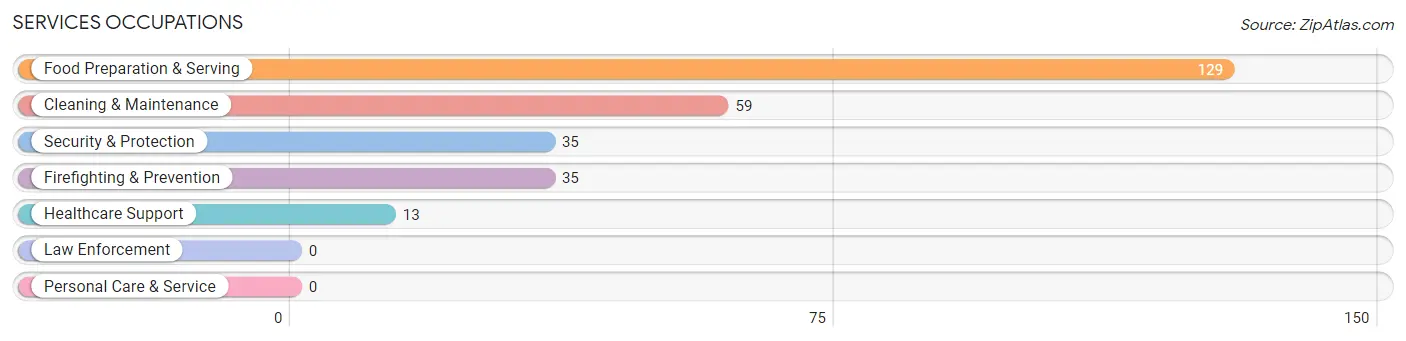
Services Occupations
The most common Services occupations in Lorane are Food Preparation & Serving (129 | 5.6%), Cleaning & Maintenance (59 | 2.6%), Security & Protection (35 | 1.5%), Firefighting & Prevention (35 | 1.5%), and Healthcare Support (13 | 0.6%).
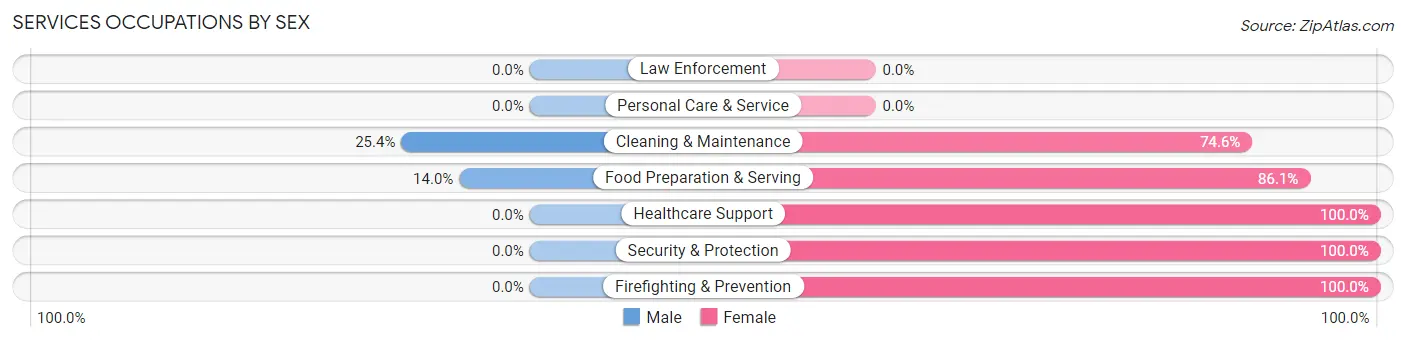
Services Occupations by Sex
Within the Services occupations in Lorane, the most male-oriented occupations are Cleaning & Maintenance (25.4%), and Food Preparation & Serving (14.0%), while the most female-oriented occupations are Healthcare Support (100.0%), Security & Protection (100.0%), and Firefighting & Prevention (100.0%).
| Occupation | Male | Female |
| Healthcare Support | 0 (0.0%) | 13 (100.0%) |
| Security & Protection | 0 (0.0%) | 35 (100.0%) |
| Firefighting & Prevention | 0 (0.0%) | 35 (100.0%) |
| Law Enforcement | 0 (0.0%) | 0 (0.0%) |
| Food Preparation & Serving | 18 (14.0%) | 111 (86.1%) |
| Cleaning & Maintenance | 15 (25.4%) | 44 (74.6%) |
| Personal Care & Service | 0 (0.0%) | 0 (0.0%) |
| Total (Category) | 33 (14.0%) | 203 (86.0%) |
| Total (Overall) | 1,199 (52.3%) | 1,094 (47.7%) |
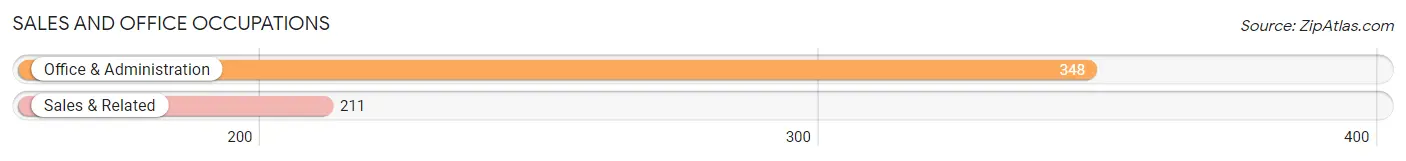
Sales and Office Occupations
The most common Sales and Office occupations in Lorane are Office & Administration (348 | 15.2%), and Sales & Related (211 | 9.2%).
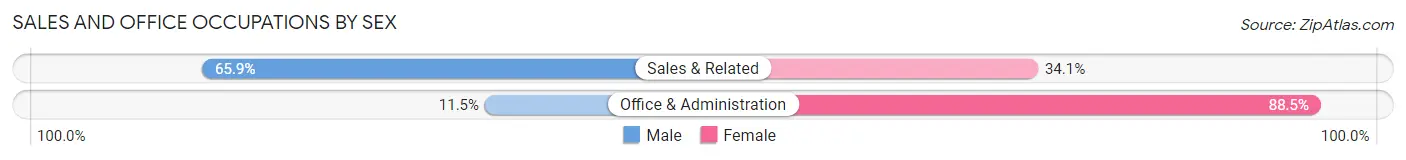
Sales and Office Occupations by Sex
| Occupation | Male | Female |
| Sales & Related | 139 (65.9%) | 72 (34.1%) |
| Office & Administration | 40 (11.5%) | 308 (88.5%) |
| Total (Category) | 179 (32.0%) | 380 (68.0%) |
| Total (Overall) | 1,199 (52.3%) | 1,094 (47.7%) |
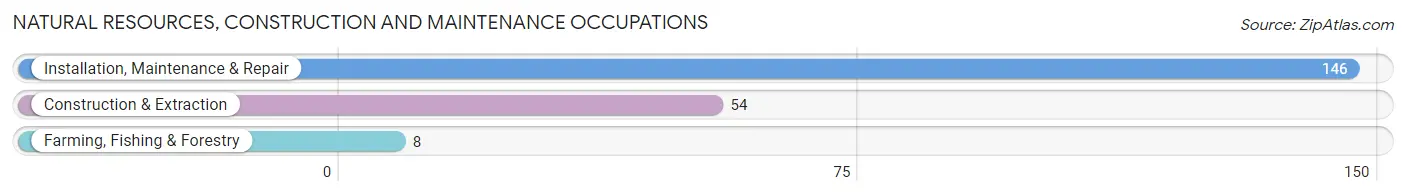
Natural Resources, Construction and Maintenance Occupations
The most common Natural Resources, Construction and Maintenance occupations in Lorane are Installation, Maintenance & Repair (146 | 6.4%), Construction & Extraction (54 | 2.4%), and Farming, Fishing & Forestry (8 | 0.4%).
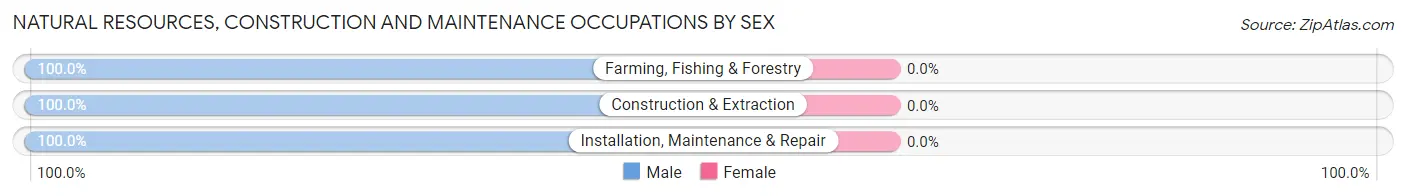
Natural Resources, Construction and Maintenance Occupations by Sex
| Occupation | Male | Female |
| Farming, Fishing & Forestry | 8 (100.0%) | 0 (0.0%) |
| Construction & Extraction | 54 (100.0%) | 0 (0.0%) |
| Installation, Maintenance & Repair | 146 (100.0%) | 0 (0.0%) |
| Total (Category) | 208 (100.0%) | 0 (0.0%) |
| Total (Overall) | 1,199 (52.3%) | 1,094 (47.7%) |
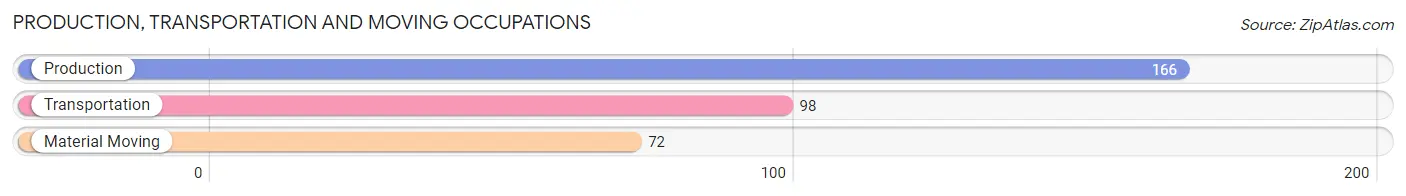
Production, Transportation and Moving Occupations
The most common Production, Transportation and Moving occupations in Lorane are Production (166 | 7.2%), Transportation (98 | 4.3%), and Material Moving (72 | 3.1%).
Production, Transportation and Moving Occupations by Sex
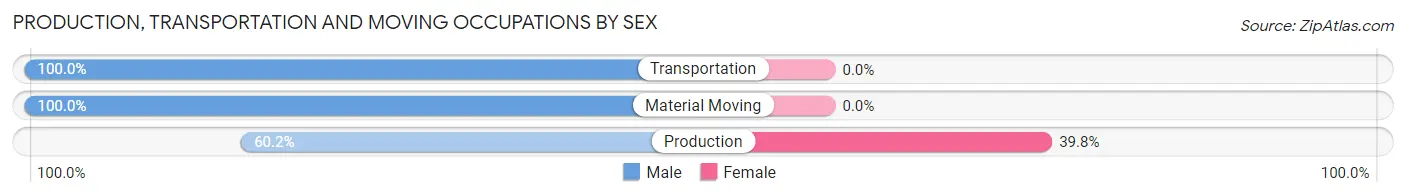
| Occupation | Male | Female |
| Production | 100 (60.2%) | 66 (39.8%) |
| Transportation | 98 (100.0%) | 0 (0.0%) |
| Material Moving | 72 (100.0%) | 0 (0.0%) |
| Total (Category) | 270 (80.4%) | 66 (19.6%) |
| Total (Overall) | 1,199 (52.3%) | 1,094 (47.7%) |
Employment Industries by Sex in Lorane
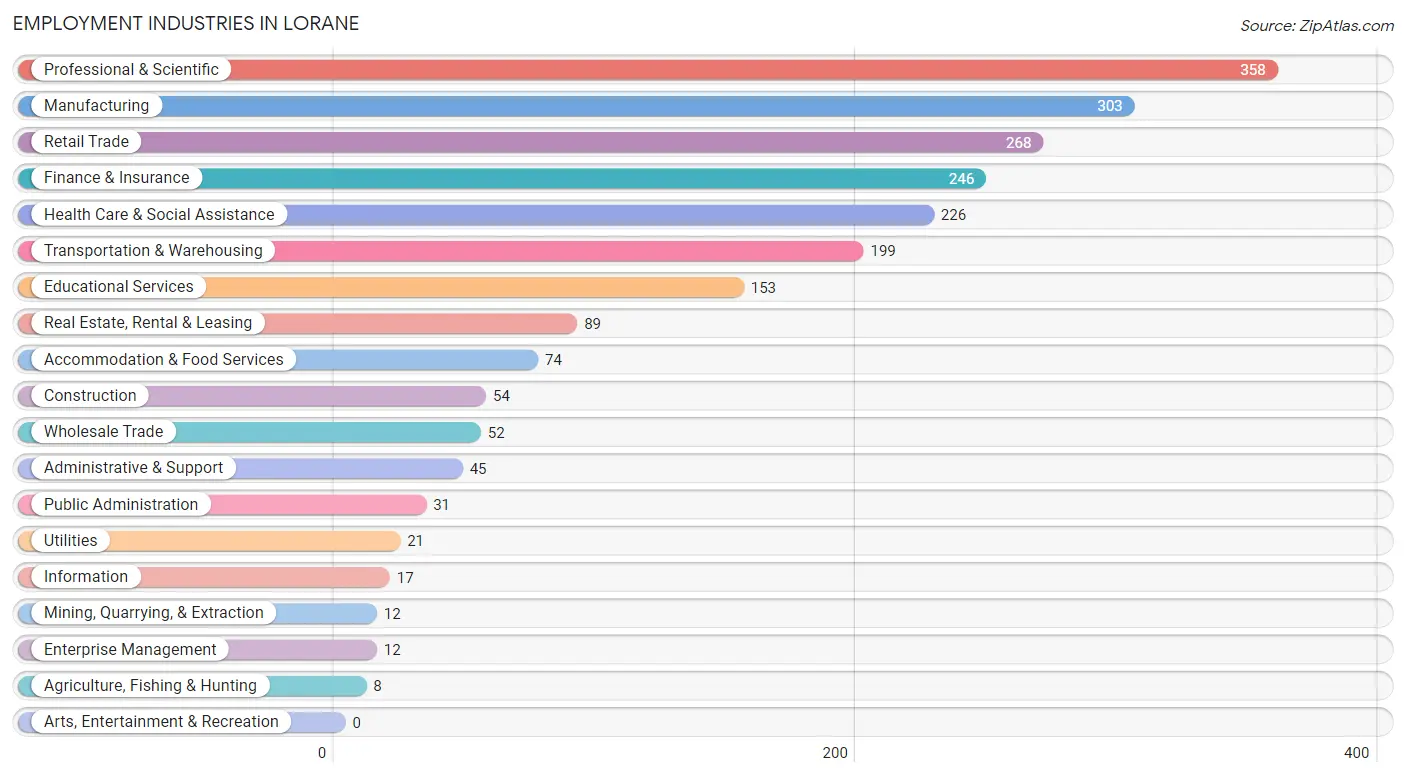
Employment Industries in Lorane
The major employment industries in Lorane include Professional & Scientific (358 | 15.6%), Manufacturing (303 | 13.2%), Retail Trade (268 | 11.7%), Finance & Insurance (246 | 10.7%), and Health Care & Social Assistance (226 | 9.9%).
Employment Industries by Sex in Lorane
The Lorane industries that see more men than women are Agriculture, Fishing & Hunting (100.0%), Mining, Quarrying, & Extraction (100.0%), and Construction (100.0%), whereas the industries that tend to have a higher number of women are Utilities (100.0%), Finance & Insurance (100.0%), and Administrative & Support (100.0%).
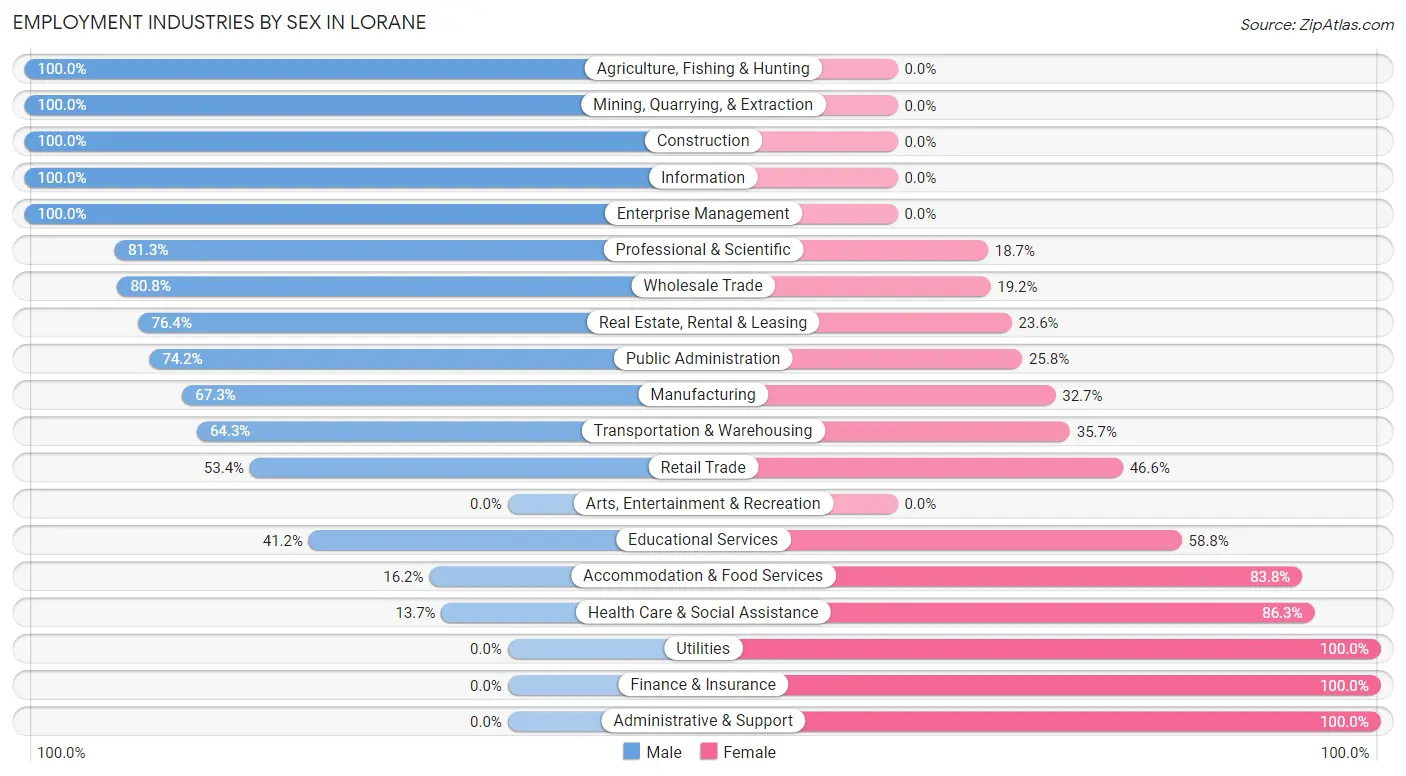
| Industry | Male | Female |
| Agriculture, Fishing & Hunting | 8 (100.0%) | 0 (0.0%) |
| Mining, Quarrying, & Extraction | 12 (100.0%) | 0 (0.0%) |
| Construction | 54 (100.0%) | 0 (0.0%) |
| Manufacturing | 204 (67.3%) | 99 (32.7%) |
| Wholesale Trade | 42 (80.8%) | 10 (19.2%) |
| Retail Trade | 143 (53.4%) | 125 (46.6%) |
| Transportation & Warehousing | 128 (64.3%) | 71 (35.7%) |
| Utilities | 0 (0.0%) | 21 (100.0%) |
| Information | 17 (100.0%) | 0 (0.0%) |
| Finance & Insurance | 0 (0.0%) | 246 (100.0%) |
| Real Estate, Rental & Leasing | 68 (76.4%) | 21 (23.6%) |
| Professional & Scientific | 291 (81.3%) | 67 (18.7%) |
| Enterprise Management | 12 (100.0%) | 0 (0.0%) |
| Administrative & Support | 0 (0.0%) | 45 (100.0%) |
| Educational Services | 63 (41.2%) | 90 (58.8%) |
| Health Care & Social Assistance | 31 (13.7%) | 195 (86.3%) |
| Arts, Entertainment & Recreation | 0 (0.0%) | 0 (0.0%) |
| Accommodation & Food Services | 12 (16.2%) | 62 (83.8%) |
| Public Administration | 23 (74.2%) | 8 (25.8%) |
| Total | 1,199 (52.3%) | 1,094 (47.7%) |
Education in Lorane
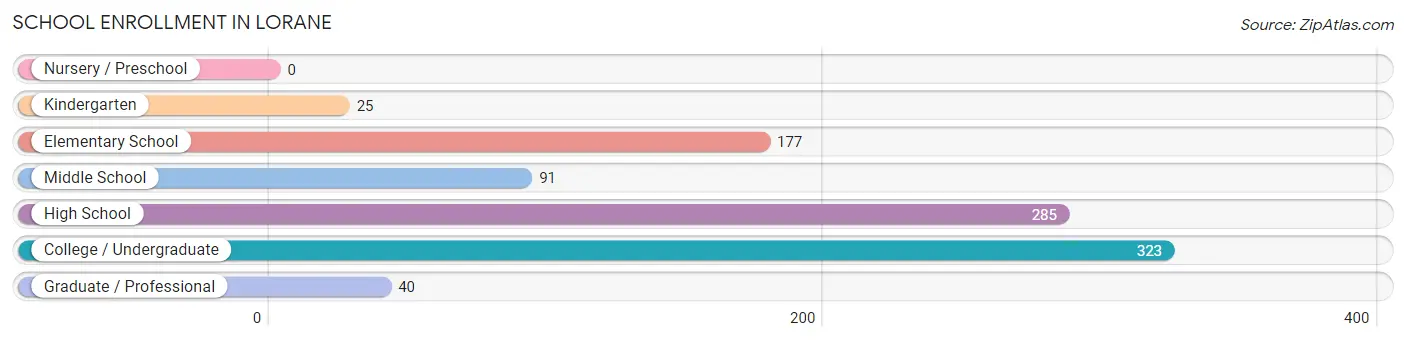
School Enrollment in Lorane
The most common levels of schooling among the 941 students in Lorane are college / undergraduate (323 | 34.3%), high school (285 | 30.3%), and elementary school (177 | 18.8%).
| School Level | # Students | % Students |
| Nursery / Preschool | 0 | 0.0% |
| Kindergarten | 25 | 2.7% |
| Elementary School | 177 | 18.8% |
| Middle School | 91 | 9.7% |
| High School | 285 | 30.3% |
| College / Undergraduate | 323 | 34.3% |
| Graduate / Professional | 40 | 4.3% |
| Total | 941 | 100.0% |
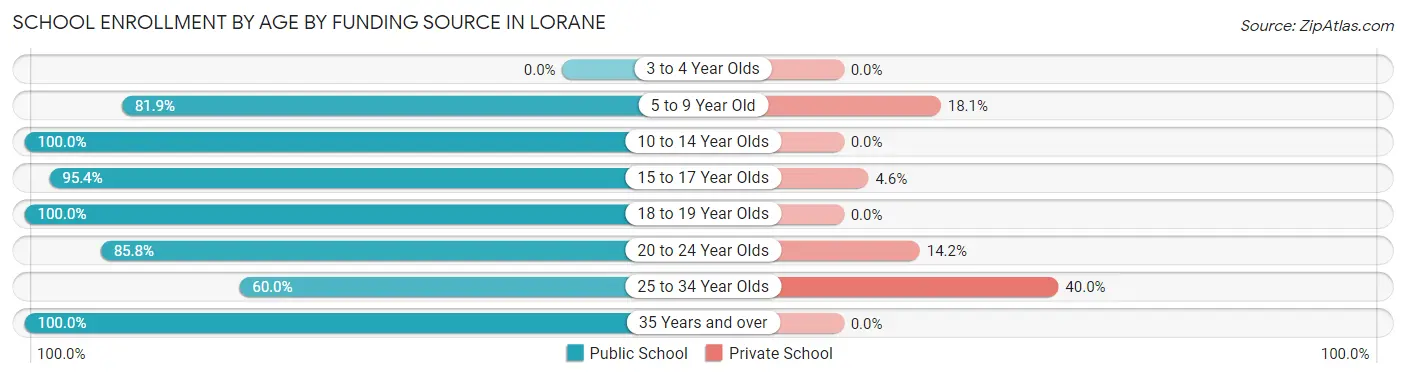
School Enrollment by Age by Funding Source in Lorane
Out of a total of 941 students who are enrolled in schools in Lorane, 103 (10.9%) attend a private institution, while the remaining 838 (89.1%) are enrolled in public schools. The age group of 25 to 34 year olds has the highest likelihood of being enrolled in private schools, with 16 (40.0% in the age bracket) enrolled. Conversely, the age group of 10 to 14 year olds has the lowest likelihood of being enrolled in a private school, with 94 (100.0% in the age bracket) attending a public institution.
| Age Bracket | Public School | Private School |
| 3 to 4 Year Olds | 0 (0.0%) | 0 (0.0%) |
| 5 to 9 Year Old | 163 (81.9%) | 36 (18.1%) |
| 10 to 14 Year Olds | 94 (100.0%) | 0 (0.0%) |
| 15 to 17 Year Olds | 248 (95.4%) | 12 (4.6%) |
| 18 to 19 Year Olds | 53 (100.0%) | 0 (0.0%) |
| 20 to 24 Year Olds | 236 (85.8%) | 39 (14.2%) |
| 25 to 34 Year Olds | 24 (60.0%) | 16 (40.0%) |
| 35 Years and over | 20 (100.0%) | 0 (0.0%) |
| Total | 838 (89.1%) | 103 (10.9%) |
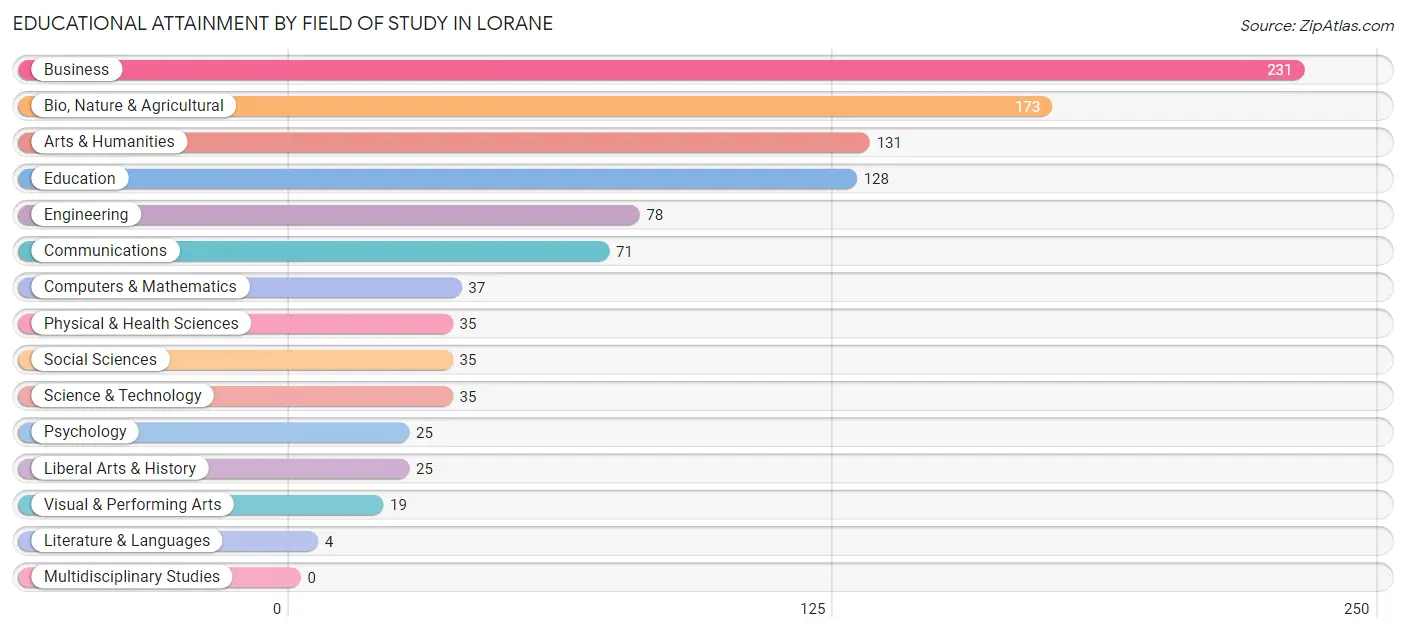
Educational Attainment by Field of Study in Lorane
Business (231 | 22.5%), bio, nature & agricultural (173 | 16.9%), arts & humanities (131 | 12.8%), education (128 | 12.5%), and engineering (78 | 7.6%) are the most common fields of study among 1,027 individuals in Lorane who have obtained a bachelor's degree or higher.
| Field of Study | # Graduates | % Graduates |
| Computers & Mathematics | 37 | 3.6% |
| Bio, Nature & Agricultural | 173 | 16.9% |
| Physical & Health Sciences | 35 | 3.4% |
| Psychology | 25 | 2.4% |
| Social Sciences | 35 | 3.4% |
| Engineering | 78 | 7.6% |
| Multidisciplinary Studies | 0 | 0.0% |
| Science & Technology | 35 | 3.4% |
| Business | 231 | 22.5% |
| Education | 128 | 12.5% |
| Literature & Languages | 4 | 0.4% |
| Liberal Arts & History | 25 | 2.4% |
| Visual & Performing Arts | 19 | 1.8% |
| Communications | 71 | 6.9% |
| Arts & Humanities | 131 | 12.8% |
| Total | 1,027 | 100.0% |
Transportation & Commute in Lorane
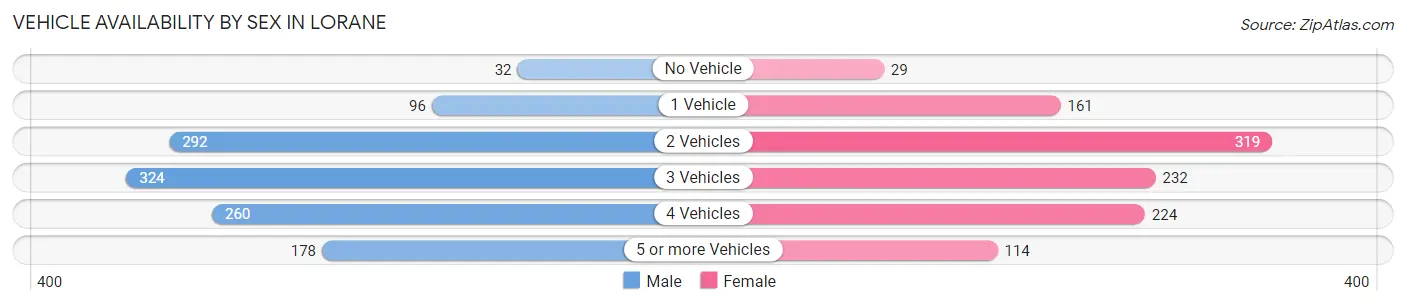
Vehicle Availability by Sex in Lorane
The most prevalent vehicle ownership categories in Lorane are males with 3 vehicles (324, accounting for 27.4%) and females with 3 vehicles (232, making up 30.0%).
| Vehicles Available | Male | Female |
| No Vehicle | 32 (2.7%) | 29 (2.7%) |
| 1 Vehicle | 96 (8.1%) | 161 (14.9%) |
| 2 Vehicles | 292 (24.7%) | 319 (29.6%) |
| 3 Vehicles | 324 (27.4%) | 232 (21.5%) |
| 4 Vehicles | 260 (22.0%) | 224 (20.8%) |
| 5 or more Vehicles | 178 (15.1%) | 114 (10.6%) |
| Total | 1,182 (100.0%) | 1,079 (100.0%) |
Commute Time in Lorane
The most frequently occuring commute durations in Lorane are 20 to 24 minutes (440 commuters, 23.9%), 15 to 19 minutes (435 commuters, 23.6%), and 10 to 14 minutes (204 commuters, 11.1%).
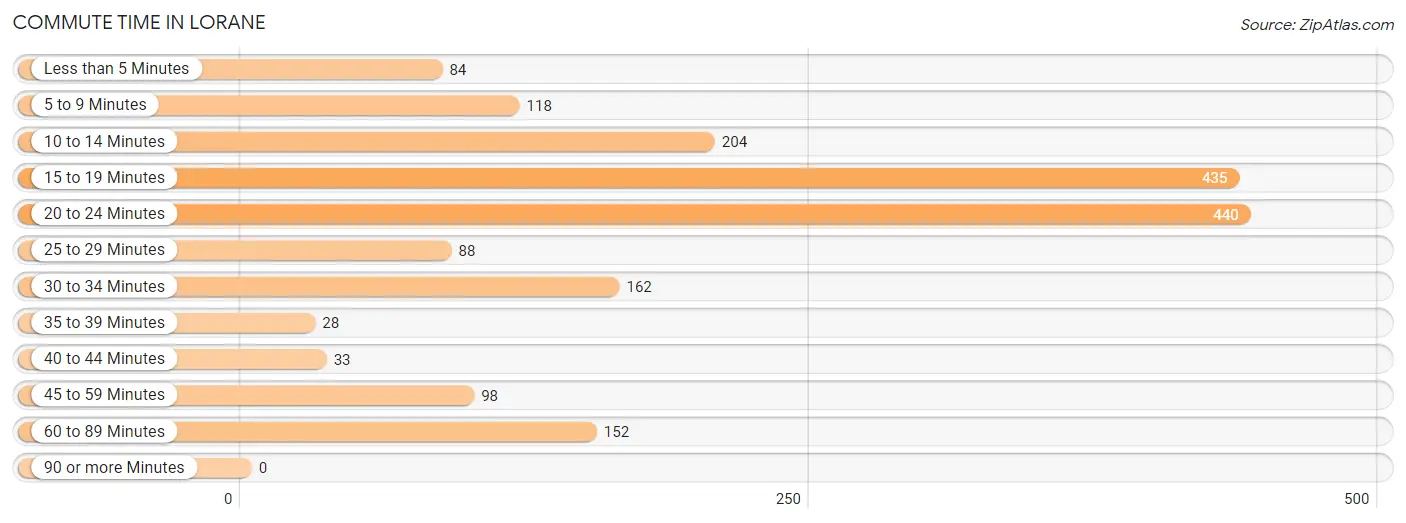
| Commute Time | # Commuters | % Commuters |
| Less than 5 Minutes | 84 | 4.6% |
| 5 to 9 Minutes | 118 | 6.4% |
| 10 to 14 Minutes | 204 | 11.1% |
| 15 to 19 Minutes | 435 | 23.6% |
| 20 to 24 Minutes | 440 | 23.9% |
| 25 to 29 Minutes | 88 | 4.8% |
| 30 to 34 Minutes | 162 | 8.8% |
| 35 to 39 Minutes | 28 | 1.5% |
| 40 to 44 Minutes | 33 | 1.8% |
| 45 to 59 Minutes | 98 | 5.3% |
| 60 to 89 Minutes | 152 | 8.3% |
| 90 or more Minutes | 0 | 0.0% |
Commute Time by Sex in Lorane
The most common commute times in Lorane are 15 to 19 minutes (293 commuters, 27.5%) for males and 20 to 24 minutes (282 commuters, 36.3%) for females.
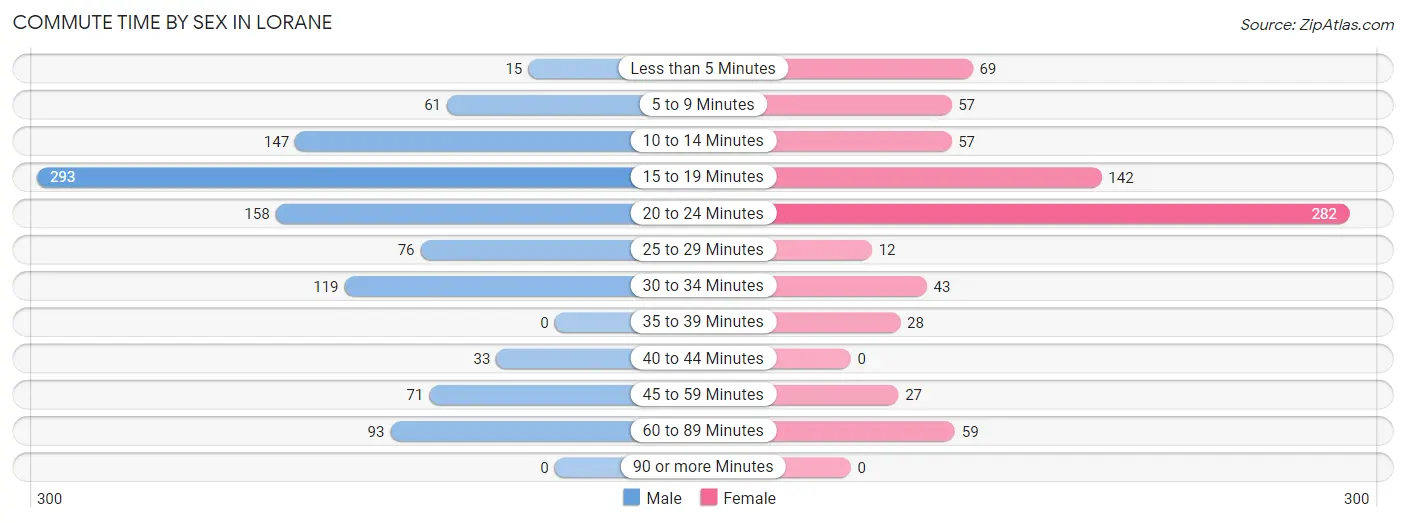
| Commute Time | Male | Female |
| Less than 5 Minutes | 15 (1.4%) | 69 (8.9%) |
| 5 to 9 Minutes | 61 (5.7%) | 57 (7.3%) |
| 10 to 14 Minutes | 147 (13.8%) | 57 (7.3%) |
| 15 to 19 Minutes | 293 (27.5%) | 142 (18.3%) |
| 20 to 24 Minutes | 158 (14.8%) | 282 (36.3%) |
| 25 to 29 Minutes | 76 (7.1%) | 12 (1.5%) |
| 30 to 34 Minutes | 119 (11.2%) | 43 (5.5%) |
| 35 to 39 Minutes | 0 (0.0%) | 28 (3.6%) |
| 40 to 44 Minutes | 33 (3.1%) | 0 (0.0%) |
| 45 to 59 Minutes | 71 (6.7%) | 27 (3.5%) |
| 60 to 89 Minutes | 93 (8.7%) | 59 (7.6%) |
| 90 or more Minutes | 0 (0.0%) | 0 (0.0%) |
Time of Departure to Work by Sex in Lorane
The most frequent times of departure to work in Lorane are 7:00 AM to 7:29 AM (256, 24.0%) for males and 12:00 PM to 3:59 PM (171, 22.0%) for females.
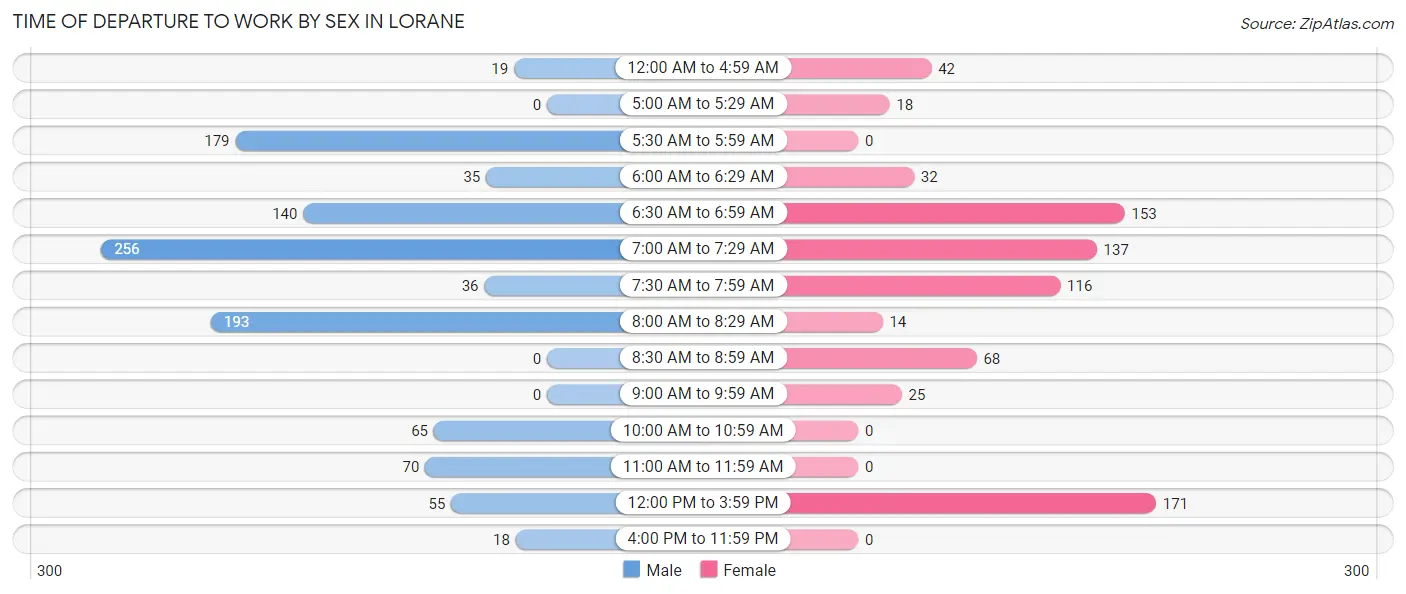
| Time of Departure | Male | Female |
| 12:00 AM to 4:59 AM | 19 (1.8%) | 42 (5.4%) |
| 5:00 AM to 5:29 AM | 0 (0.0%) | 18 (2.3%) |
| 5:30 AM to 5:59 AM | 179 (16.8%) | 0 (0.0%) |
| 6:00 AM to 6:29 AM | 35 (3.3%) | 32 (4.1%) |
| 6:30 AM to 6:59 AM | 140 (13.1%) | 153 (19.7%) |
| 7:00 AM to 7:29 AM | 256 (24.0%) | 137 (17.6%) |
| 7:30 AM to 7:59 AM | 36 (3.4%) | 116 (14.9%) |
| 8:00 AM to 8:29 AM | 193 (18.1%) | 14 (1.8%) |
| 8:30 AM to 8:59 AM | 0 (0.0%) | 68 (8.8%) |
| 9:00 AM to 9:59 AM | 0 (0.0%) | 25 (3.2%) |
| 10:00 AM to 10:59 AM | 65 (6.1%) | 0 (0.0%) |
| 11:00 AM to 11:59 AM | 70 (6.6%) | 0 (0.0%) |
| 12:00 PM to 3:59 PM | 55 (5.2%) | 171 (22.0%) |
| 4:00 PM to 11:59 PM | 18 (1.7%) | 0 (0.0%) |
| Total | 1,066 (100.0%) | 776 (100.0%) |
Housing Occupancy in Lorane
Occupancy by Ownership in Lorane
Of the total 1,763 dwellings in Lorane, owner-occupied units account for 1,459 (82.8%), while renter-occupied units make up 304 (17.2%).
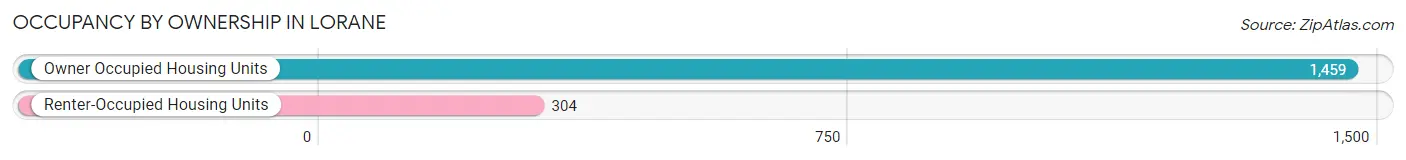
| Occupancy | # Housing Units | % Housing Units |
| Owner Occupied Housing Units | 1,459 | 82.8% |
| Renter-Occupied Housing Units | 304 | 17.2% |
| Total Occupied Housing Units | 1,763 | 100.0% |
Occupancy by Household Size in Lorane
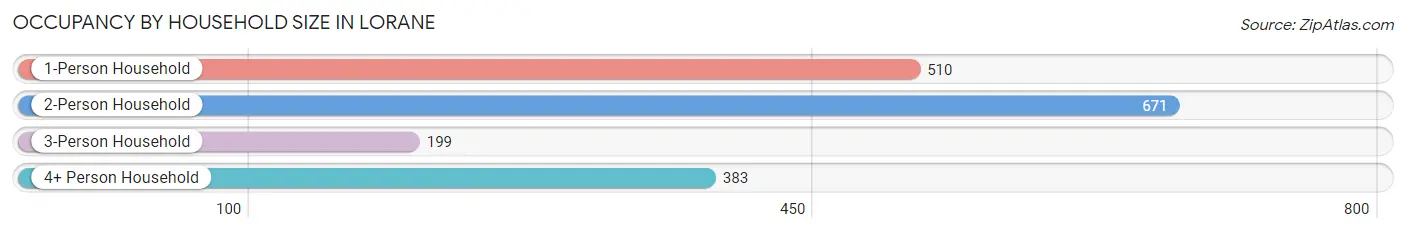
| Household Size | # Housing Units | % Housing Units |
| 1-Person Household | 510 | 28.9% |
| 2-Person Household | 671 | 38.1% |
| 3-Person Household | 199 | 11.3% |
| 4+ Person Household | 383 | 21.7% |
| Total Housing Units | 1,763 | 100.0% |
Occupancy by Ownership by Household Size in Lorane
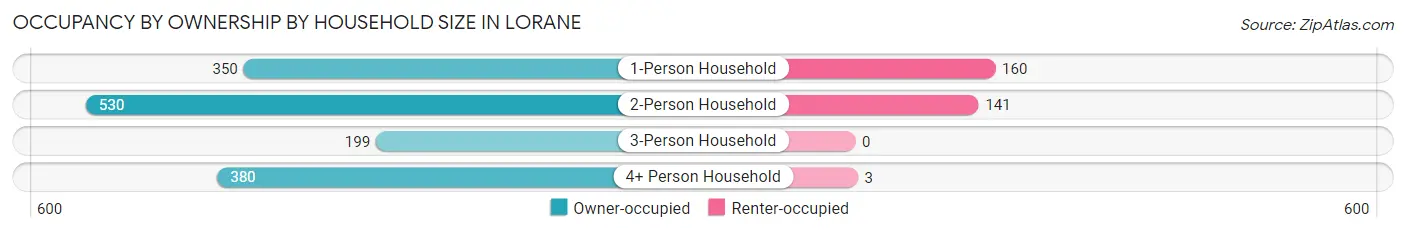
| Household Size | Owner-occupied | Renter-occupied |
| 1-Person Household | 350 (68.6%) | 160 (31.4%) |
| 2-Person Household | 530 (79.0%) | 141 (21.0%) |
| 3-Person Household | 199 (100.0%) | 0 (0.0%) |
| 4+ Person Household | 380 (99.2%) | 3 (0.8%) |
| Total Housing Units | 1,459 (82.8%) | 304 (17.2%) |
Occupancy by Educational Attainment in Lorane
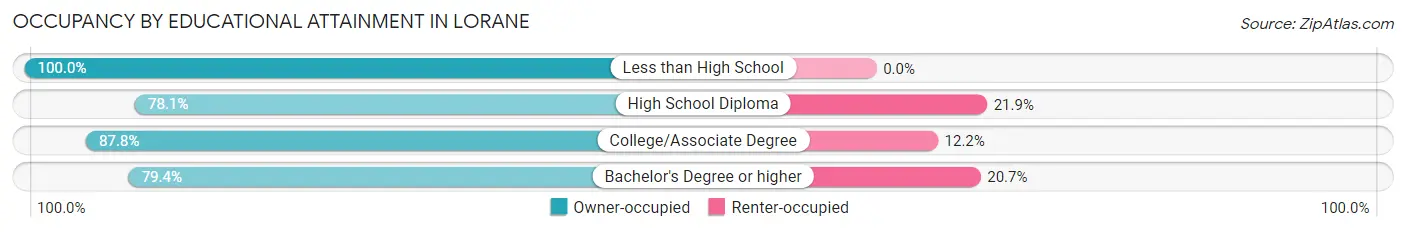
| Household Size | Owner-occupied | Renter-occupied |
| Less than High School | 173 (100.0%) | 0 (0.0%) |
| High School Diploma | 552 (78.1%) | 155 (21.9%) |
| College/Associate Degree | 346 (87.8%) | 48 (12.2%) |
| Bachelor's Degree or higher | 388 (79.3%) | 101 (20.6%) |
Occupancy by Age of Householder in Lorane
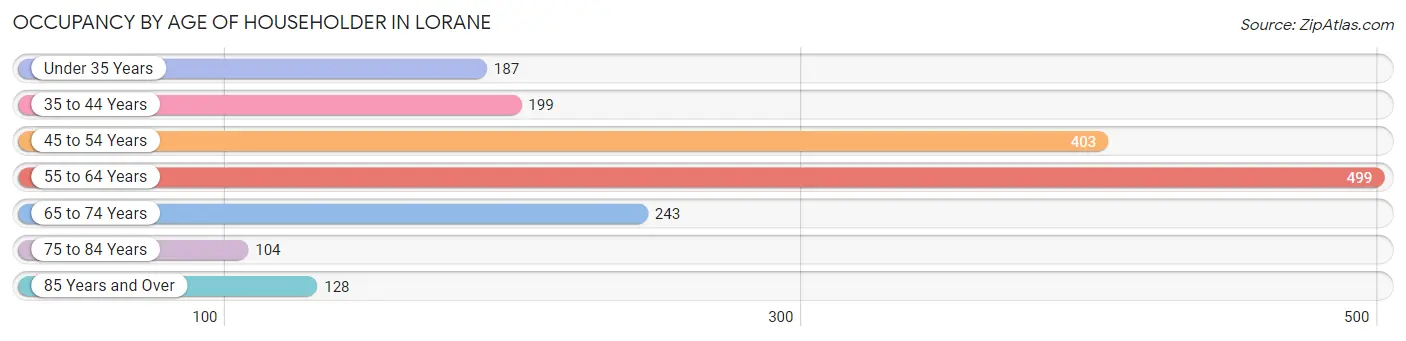
| Age Bracket | # Households | % Households |
| Under 35 Years | 187 | 10.6% |
| 35 to 44 Years | 199 | 11.3% |
| 45 to 54 Years | 403 | 22.9% |
| 55 to 64 Years | 499 | 28.3% |
| 65 to 74 Years | 243 | 13.8% |
| 75 to 84 Years | 104 | 5.9% |
| 85 Years and Over | 128 | 7.3% |
| Total | 1,763 | 100.0% |
Housing Finances in Lorane
Median Income by Occupancy in Lorane
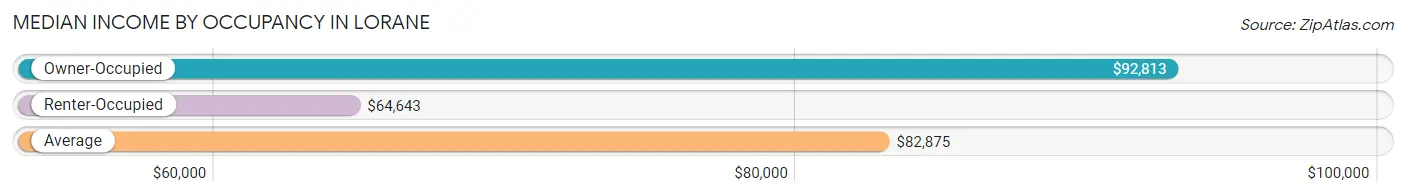
| Occupancy Type | # Households | Median Income |
| Owner-Occupied | 1,459 (82.8%) | $92,813 |
| Renter-Occupied | 304 (17.2%) | $64,643 |
| Average | 1,763 (100.0%) | $82,875 |
Occupancy by Householder Income Bracket in Lorane
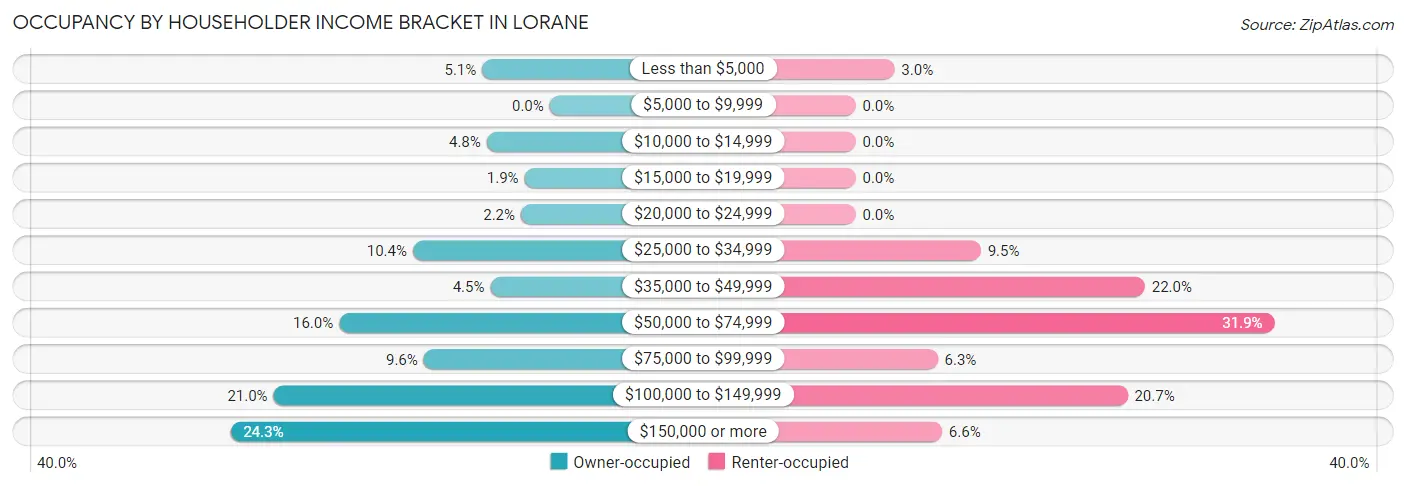
| Income Bracket | Owner-occupied | Renter-occupied |
| Less than $5,000 | 75 (5.1%) | 9 (3.0%) |
| $5,000 to $9,999 | 0 (0.0%) | 0 (0.0%) |
| $10,000 to $14,999 | 70 (4.8%) | 0 (0.0%) |
| $15,000 to $19,999 | 28 (1.9%) | 0 (0.0%) |
| $20,000 to $24,999 | 32 (2.2%) | 0 (0.0%) |
| $25,000 to $34,999 | 152 (10.4%) | 29 (9.5%) |
| $35,000 to $49,999 | 66 (4.5%) | 67 (22.0%) |
| $50,000 to $74,999 | 234 (16.0%) | 97 (31.9%) |
| $75,000 to $99,999 | 140 (9.6%) | 19 (6.2%) |
| $100,000 to $149,999 | 307 (21.0%) | 63 (20.7%) |
| $150,000 or more | 355 (24.3%) | 20 (6.6%) |
| Total | 1,459 (100.0%) | 304 (100.0%) |
Monthly Housing Cost Tiers in Lorane
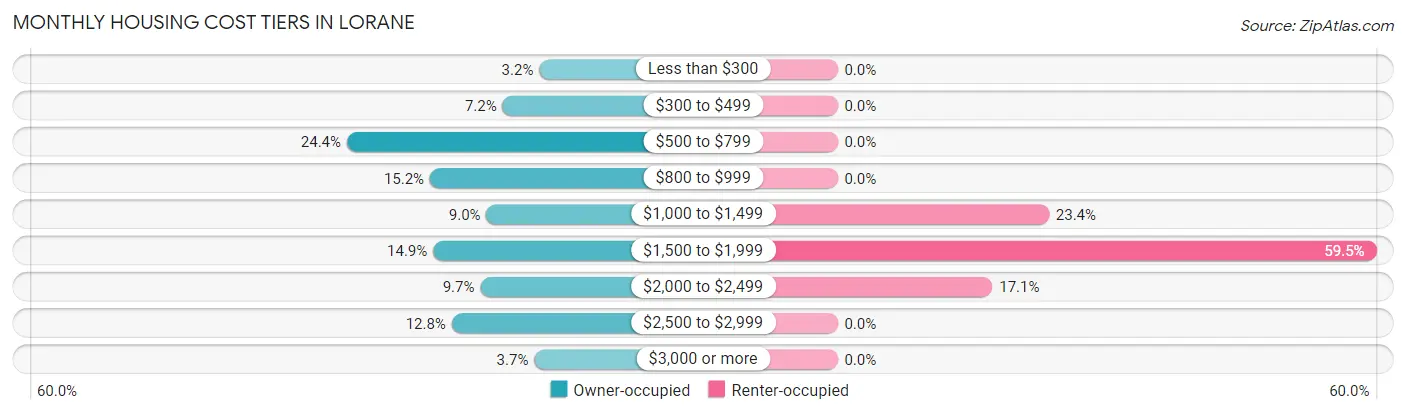
| Monthly Cost | Owner-occupied | Renter-occupied |
| Less than $300 | 46 (3.2%) | 0 (0.0%) |
| $300 to $499 | 105 (7.2%) | 0 (0.0%) |
| $500 to $799 | 356 (24.4%) | 0 (0.0%) |
| $800 to $999 | 222 (15.2%) | 0 (0.0%) |
| $1,000 to $1,499 | 131 (9.0%) | 71 (23.4%) |
| $1,500 to $1,999 | 217 (14.9%) | 181 (59.5%) |
| $2,000 to $2,499 | 141 (9.7%) | 52 (17.1%) |
| $2,500 to $2,999 | 187 (12.8%) | 0 (0.0%) |
| $3,000 or more | 54 (3.7%) | 0 (0.0%) |
| Total | 1,459 (100.0%) | 304 (100.0%) |
Physical Housing Characteristics in Lorane
Housing Structures in Lorane
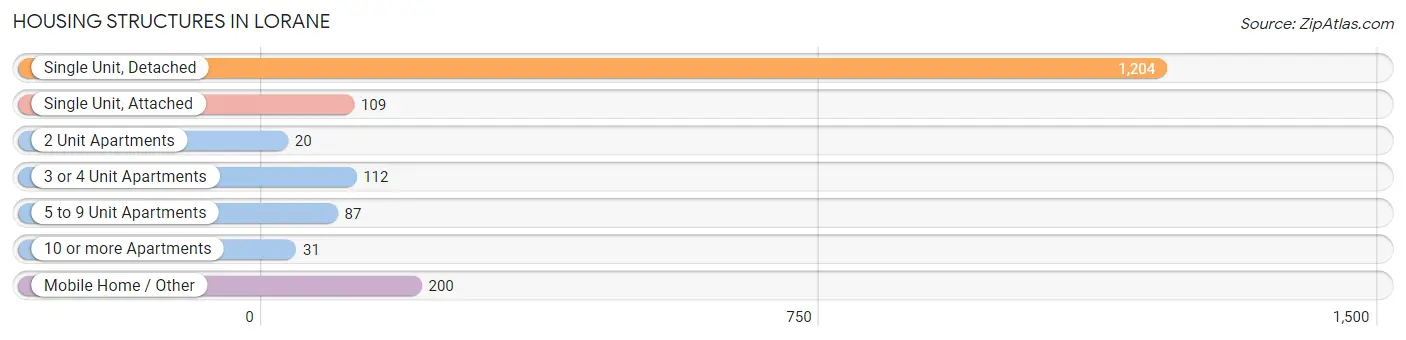
| Structure Type | # Housing Units | % Housing Units |
| Single Unit, Detached | 1,204 | 68.3% |
| Single Unit, Attached | 109 | 6.2% |
| 2 Unit Apartments | 20 | 1.1% |
| 3 or 4 Unit Apartments | 112 | 6.4% |
| 5 to 9 Unit Apartments | 87 | 4.9% |
| 10 or more Apartments | 31 | 1.8% |
| Mobile Home / Other | 200 | 11.3% |
| Total | 1,763 | 100.0% |
Housing Structures by Occupancy in Lorane
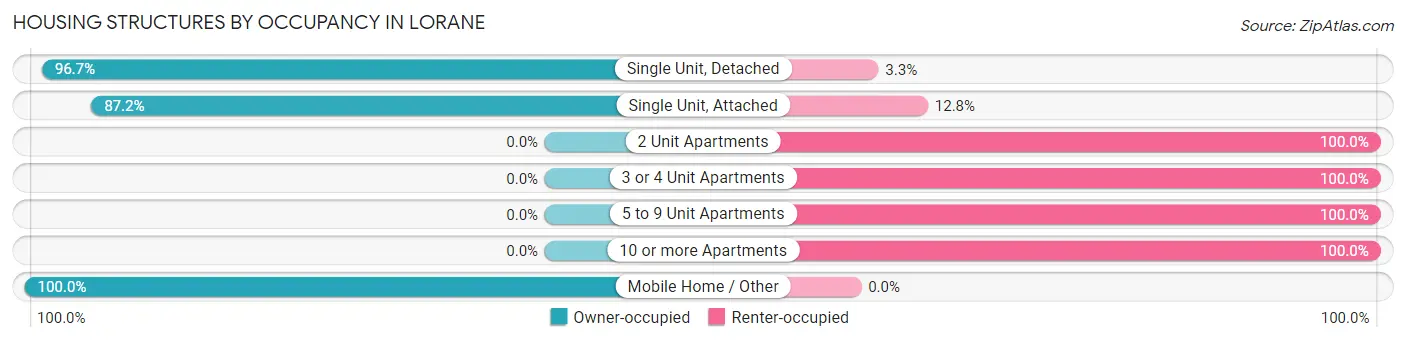
| Structure Type | Owner-occupied | Renter-occupied |
| Single Unit, Detached | 1,164 (96.7%) | 40 (3.3%) |
| Single Unit, Attached | 95 (87.2%) | 14 (12.8%) |
| 2 Unit Apartments | 0 (0.0%) | 20 (100.0%) |
| 3 or 4 Unit Apartments | 0 (0.0%) | 112 (100.0%) |
| 5 to 9 Unit Apartments | 0 (0.0%) | 87 (100.0%) |
| 10 or more Apartments | 0 (0.0%) | 31 (100.0%) |
| Mobile Home / Other | 200 (100.0%) | 0 (0.0%) |
| Total | 1,459 (82.8%) | 304 (17.2%) |
Housing Structures by Number of Rooms in Lorane
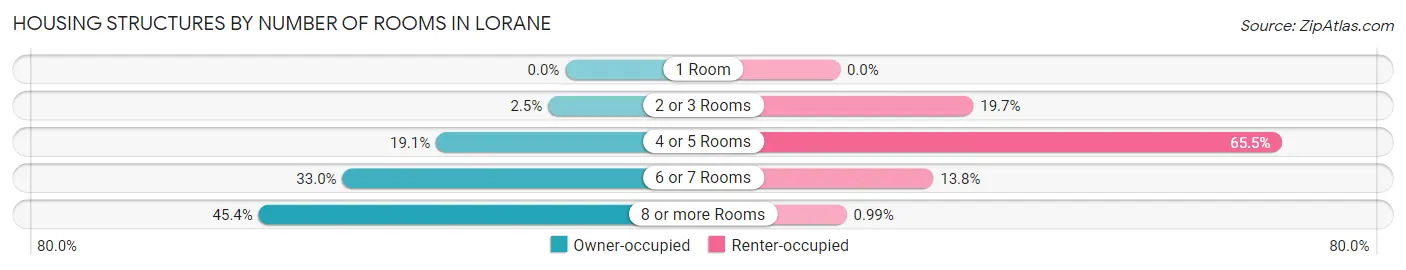
| Number of Rooms | Owner-occupied | Renter-occupied |
| 1 Room | 0 (0.0%) | 0 (0.0%) |
| 2 or 3 Rooms | 37 (2.5%) | 60 (19.7%) |
| 4 or 5 Rooms | 279 (19.1%) | 199 (65.5%) |
| 6 or 7 Rooms | 481 (33.0%) | 42 (13.8%) |
| 8 or more Rooms | 662 (45.4%) | 3 (1.0%) |
| Total | 1,459 (100.0%) | 304 (100.0%) |
Housing Structure by Heating Type in Lorane
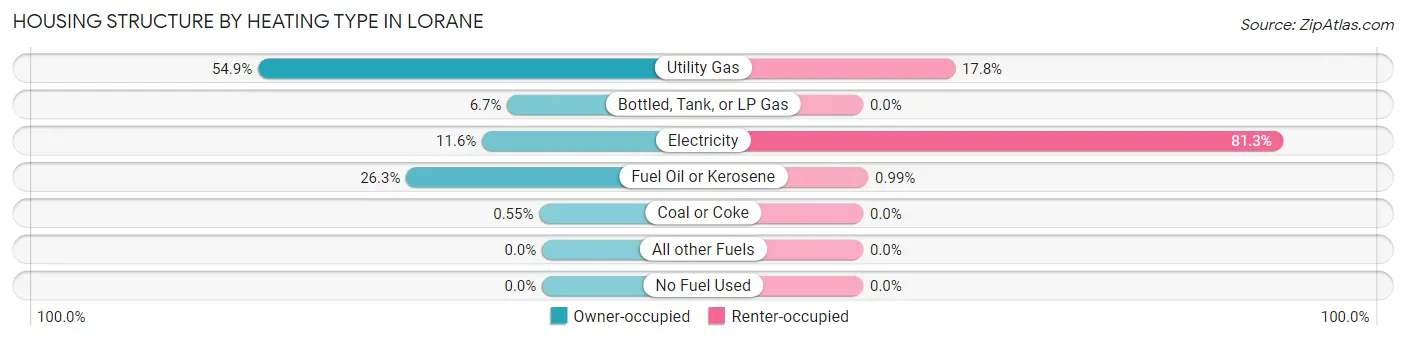
| Heating Type | Owner-occupied | Renter-occupied |
| Utility Gas | 801 (54.9%) | 54 (17.8%) |
| Bottled, Tank, or LP Gas | 98 (6.7%) | 0 (0.0%) |
| Electricity | 169 (11.6%) | 247 (81.2%) |
| Fuel Oil or Kerosene | 383 (26.3%) | 3 (1.0%) |
| Coal or Coke | 8 (0.5%) | 0 (0.0%) |
| All other Fuels | 0 (0.0%) | 0 (0.0%) |
| No Fuel Used | 0 (0.0%) | 0 (0.0%) |
| Total | 1,459 (100.0%) | 304 (100.0%) |
Household Vehicle Usage in Lorane
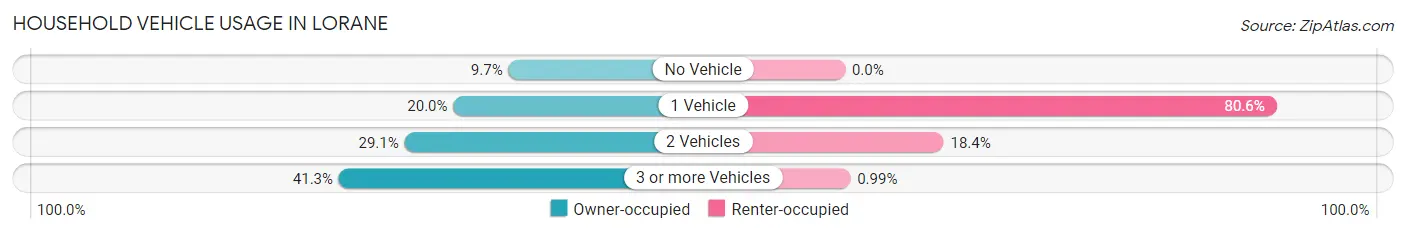
| Vehicles per Household | Owner-occupied | Renter-occupied |
| No Vehicle | 141 (9.7%) | 0 (0.0%) |
| 1 Vehicle | 291 (20.0%) | 245 (80.6%) |
| 2 Vehicles | 424 (29.1%) | 56 (18.4%) |
| 3 or more Vehicles | 603 (41.3%) | 3 (1.0%) |
| Total | 1,459 (100.0%) | 304 (100.0%) |
Real Estate & Mortgages in Lorane
Real Estate and Mortgage Overview in Lorane
| Characteristic | Without Mortgage | With Mortgage |
| Housing Units | 716 | 743 |
| Median Property Value | $214,000 | $249,000 |
| Median Household Income | $51,250 | $307 |
| Monthly Housing Costs | $678 | $54 |
| Real Estate Taxes | $3,442 | $10 |
Property Value by Mortgage Status in Lorane
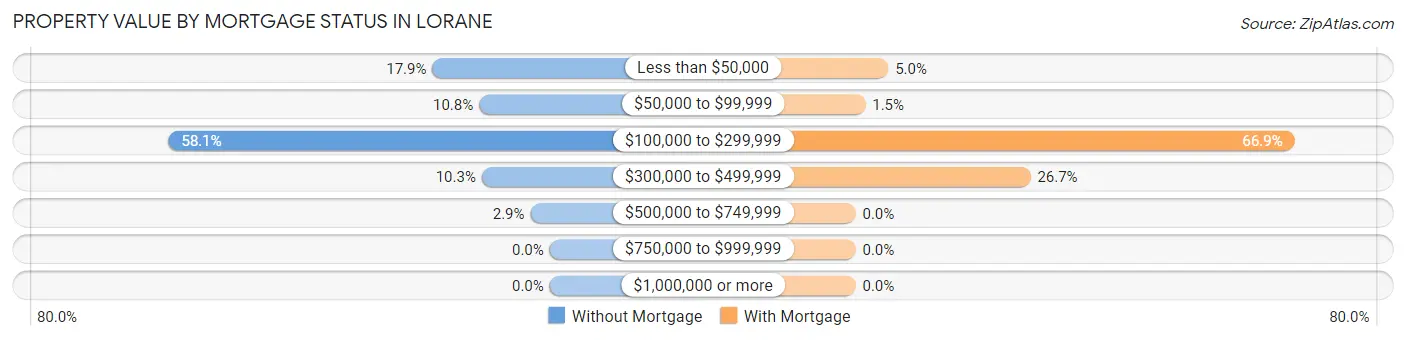
| Property Value | Without Mortgage | With Mortgage |
| Less than $50,000 | 128 (17.9%) | 37 (5.0%) |
| $50,000 to $99,999 | 77 (10.7%) | 11 (1.5%) |
| $100,000 to $299,999 | 416 (58.1%) | 497 (66.9%) |
| $300,000 to $499,999 | 74 (10.3%) | 198 (26.7%) |
| $500,000 to $749,999 | 21 (2.9%) | 0 (0.0%) |
| $750,000 to $999,999 | 0 (0.0%) | 0 (0.0%) |
| $1,000,000 or more | 0 (0.0%) | 0 (0.0%) |
| Total | 716 (100.0%) | 743 (100.0%) |
Household Income by Mortgage Status in Lorane
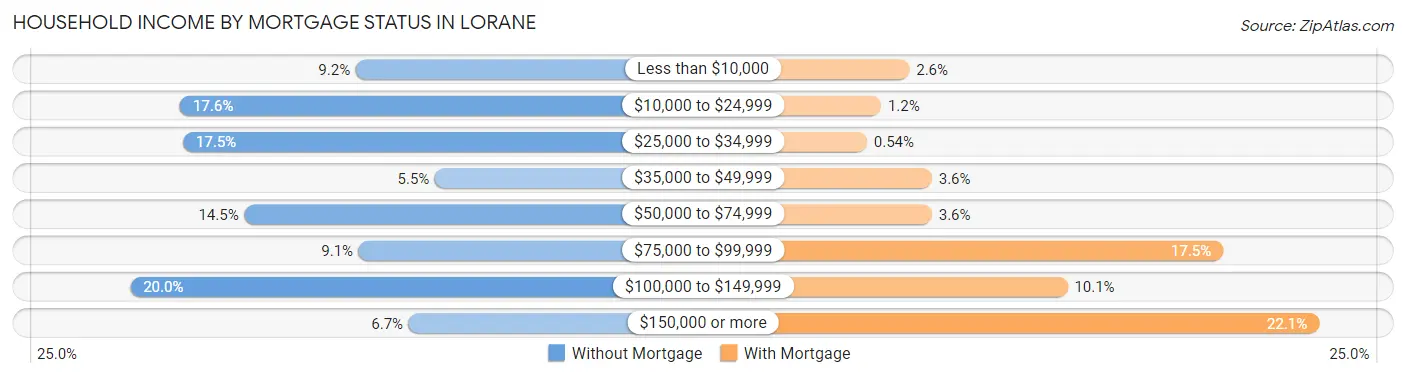
| Household Income | Without Mortgage | With Mortgage |
| Less than $10,000 | 66 (9.2%) | 19 (2.6%) |
| $10,000 to $24,999 | 126 (17.6%) | 9 (1.2%) |
| $25,000 to $34,999 | 125 (17.5%) | 4 (0.5%) |
| $35,000 to $49,999 | 39 (5.4%) | 27 (3.6%) |
| $50,000 to $74,999 | 104 (14.5%) | 27 (3.6%) |
| $75,000 to $99,999 | 65 (9.1%) | 130 (17.5%) |
| $100,000 to $149,999 | 143 (20.0%) | 75 (10.1%) |
| $150,000 or more | 48 (6.7%) | 164 (22.1%) |
| Total | 716 (100.0%) | 743 (100.0%) |
Property Value to Household Income Ratio in Lorane
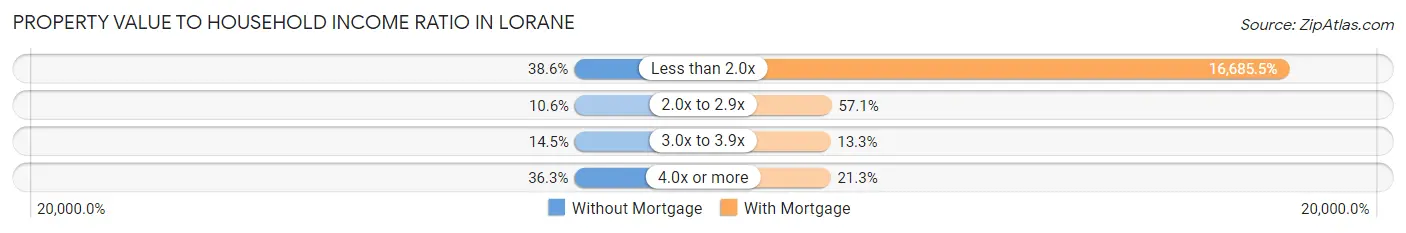
| Value-to-Income Ratio | Without Mortgage | With Mortgage |
| Less than 2.0x | 276 (38.6%) | 123,973 (16,685.5%) |
| 2.0x to 2.9x | 76 (10.6%) | 424 (57.1%) |
| 3.0x to 3.9x | 104 (14.5%) | 99 (13.3%) |
| 4.0x or more | 260 (36.3%) | 158 (21.3%) |
| Total | 716 (100.0%) | 743 (100.0%) |
Real Estate Taxes by Mortgage Status in Lorane
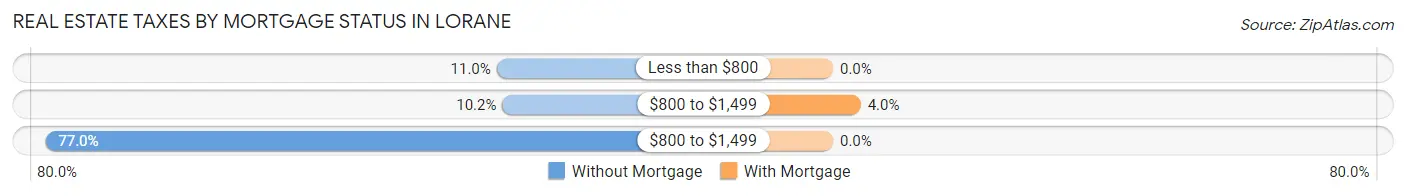
| Property Taxes | Without Mortgage | With Mortgage |
| Less than $800 | 79 (11.0%) | 0 (0.0%) |
| $800 to $1,499 | 73 (10.2%) | 30 (4.0%) |
| $800 to $1,499 | 551 (77.0%) | 0 (0.0%) |
| Total | 716 (100.0%) | 743 (100.0%) |
Health & Disability in Lorane
Health Insurance Coverage by Age in Lorane
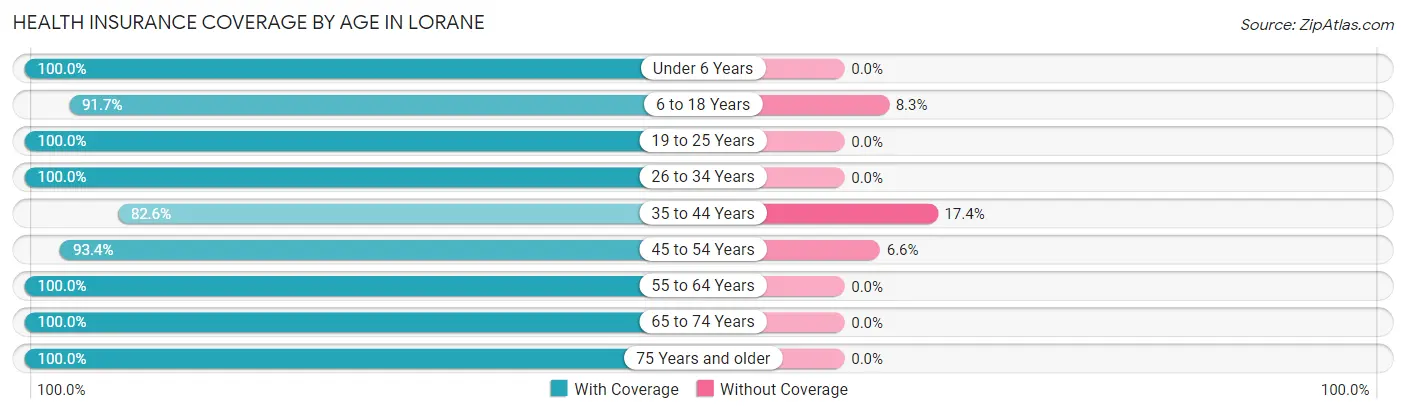
| Age Bracket | With Coverage | Without Coverage |
| Under 6 Years | 254 (100.0%) | 0 (0.0%) |
| 6 to 18 Years | 565 (91.7%) | 51 (8.3%) |
| 19 to 25 Years | 462 (100.0%) | 0 (0.0%) |
| 26 to 34 Years | 421 (100.0%) | 0 (0.0%) |
| 35 to 44 Years | 271 (82.6%) | 57 (17.4%) |
| 45 to 54 Years | 691 (93.4%) | 49 (6.6%) |
| 55 to 64 Years | 878 (100.0%) | 0 (0.0%) |
| 65 to 74 Years | 390 (100.0%) | 0 (0.0%) |
| 75 Years and older | 276 (100.0%) | 0 (0.0%) |
| Total | 4,208 (96.4%) | 157 (3.6%) |
Health Insurance Coverage by Citizenship Status in Lorane
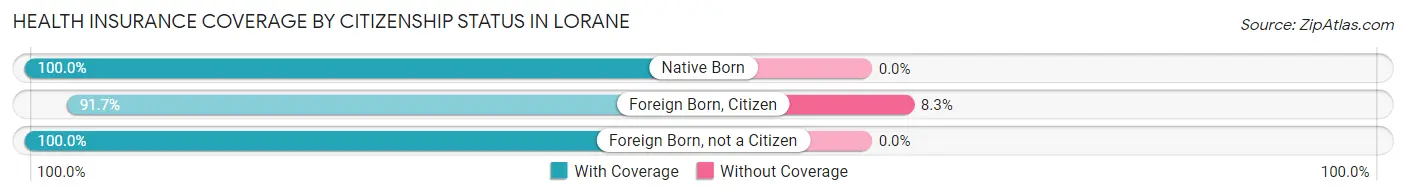
| Citizenship Status | With Coverage | Without Coverage |
| Native Born | 254 (100.0%) | 0 (0.0%) |
| Foreign Born, Citizen | 565 (91.7%) | 51 (8.3%) |
| Foreign Born, not a Citizen | 462 (100.0%) | 0 (0.0%) |
Health Insurance Coverage by Household Income in Lorane
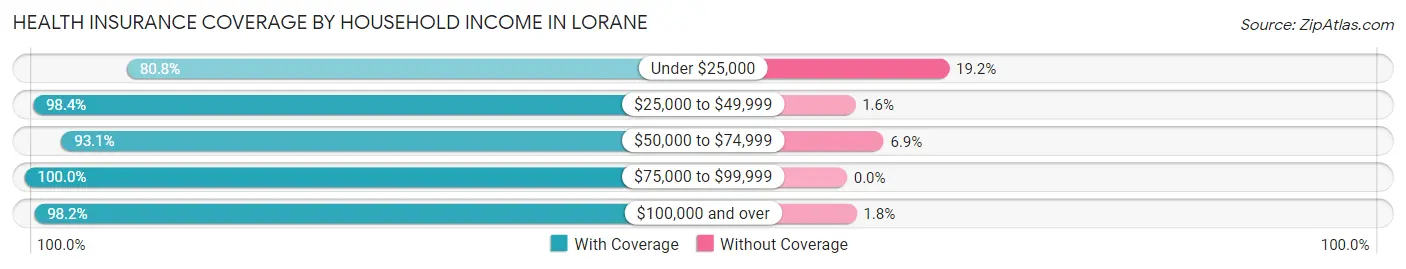
| Household Income | With Coverage | Without Coverage |
| Under $25,000 | 211 (80.8%) | 50 (19.2%) |
| $25,000 to $49,999 | 440 (98.4%) | 7 (1.6%) |
| $50,000 to $74,999 | 731 (93.1%) | 54 (6.9%) |
| $75,000 to $99,999 | 330 (100.0%) | 0 (0.0%) |
| $100,000 and over | 2,496 (98.2%) | 46 (1.8%) |
Public vs Private Health Insurance Coverage by Age in Lorane
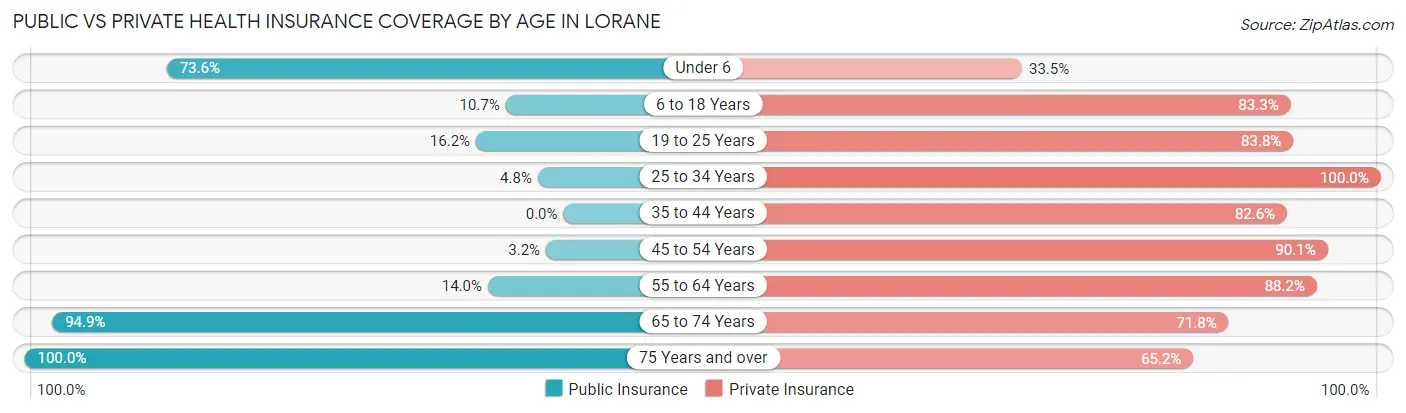
| Age Bracket | Public Insurance | Private Insurance |
| Under 6 | 187 (73.6%) | 85 (33.5%) |
| 6 to 18 Years | 66 (10.7%) | 513 (83.3%) |
| 19 to 25 Years | 75 (16.2%) | 387 (83.8%) |
| 25 to 34 Years | 20 (4.8%) | 421 (100.0%) |
| 35 to 44 Years | 0 (0.0%) | 271 (82.6%) |
| 45 to 54 Years | 24 (3.2%) | 667 (90.1%) |
| 55 to 64 Years | 123 (14.0%) | 774 (88.1%) |
| 65 to 74 Years | 370 (94.9%) | 280 (71.8%) |
| 75 Years and over | 276 (100.0%) | 180 (65.2%) |
| Total | 1,141 (26.1%) | 3,578 (82.0%) |
Disability Status by Sex by Age in Lorane
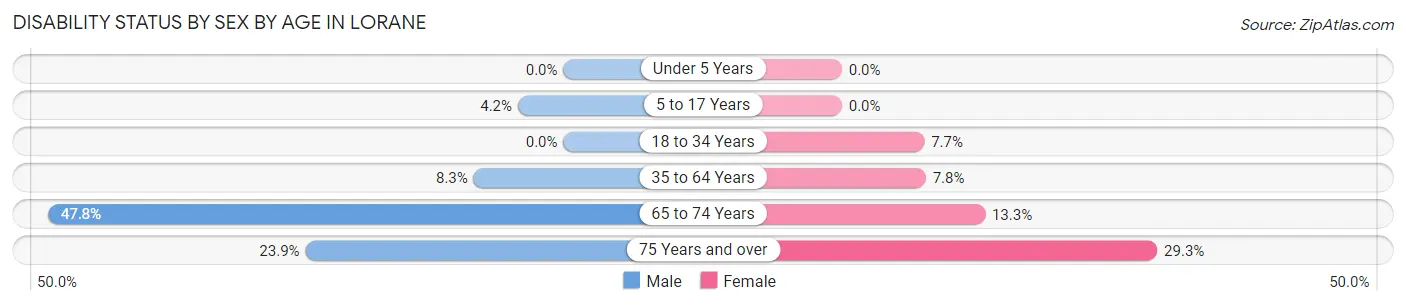
| Age Bracket | Male | Female |
| Under 5 Years | 0 (0.0%) | 0 (0.0%) |
| 5 to 17 Years | 13 (4.2%) | 0 (0.0%) |
| 18 to 34 Years | 0 (0.0%) | 39 (7.6%) |
| 35 to 64 Years | 84 (8.3%) | 73 (7.8%) |
| 65 to 74 Years | 111 (47.8%) | 21 (13.3%) |
| 75 Years and over | 17 (23.9%) | 60 (29.3%) |
Disability Class by Sex by Age in Lorane
Disability Class: Hearing Difficulty
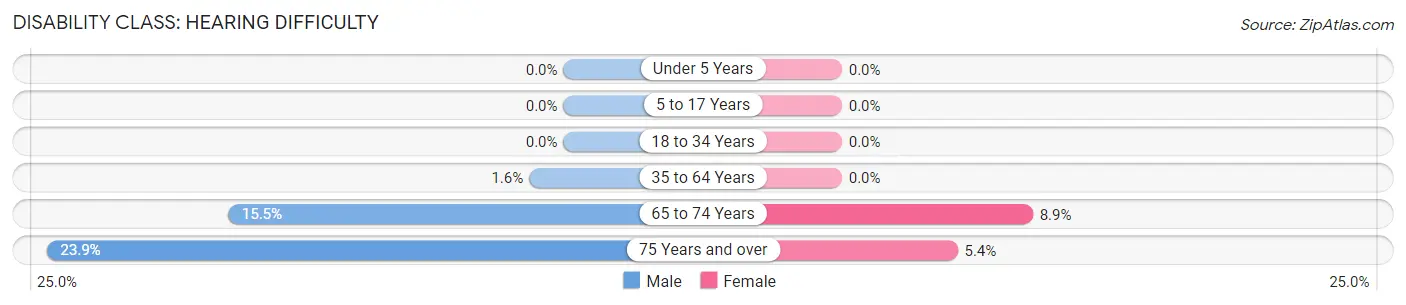
| Age Bracket | Male | Female |
| Under 5 Years | 0 (0.0%) | 0 (0.0%) |
| 5 to 17 Years | 0 (0.0%) | 0 (0.0%) |
| 18 to 34 Years | 0 (0.0%) | 0 (0.0%) |
| 35 to 64 Years | 16 (1.6%) | 0 (0.0%) |
| 65 to 74 Years | 36 (15.5%) | 14 (8.9%) |
| 75 Years and over | 17 (23.9%) | 11 (5.4%) |
Disability Class: Vision Difficulty
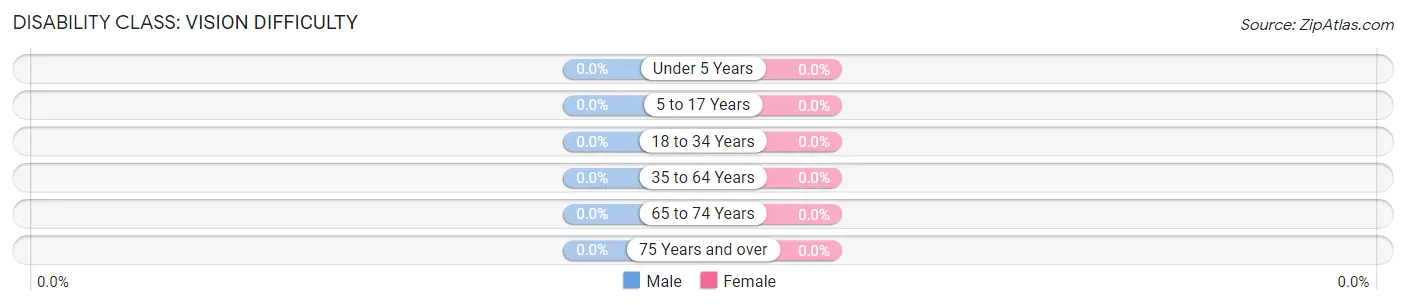
| Age Bracket | Male | Female |
| Under 5 Years | 0 (0.0%) | 0 (0.0%) |
| 5 to 17 Years | 0 (0.0%) | 0 (0.0%) |
| 18 to 34 Years | 0 (0.0%) | 0 (0.0%) |
| 35 to 64 Years | 0 (0.0%) | 0 (0.0%) |
| 65 to 74 Years | 0 (0.0%) | 0 (0.0%) |
| 75 Years and over | 0 (0.0%) | 0 (0.0%) |
Disability Class: Cognitive Difficulty
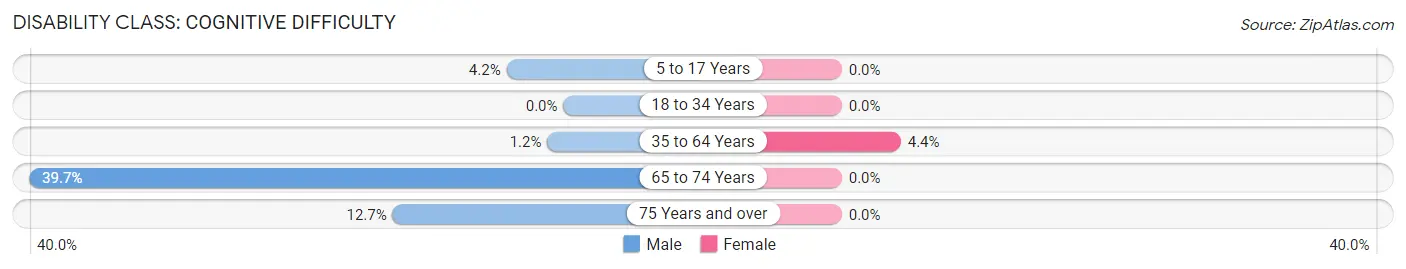
| Age Bracket | Male | Female |
| 5 to 17 Years | 13 (4.2%) | 0 (0.0%) |
| 18 to 34 Years | 0 (0.0%) | 0 (0.0%) |
| 35 to 64 Years | 12 (1.2%) | 41 (4.4%) |
| 65 to 74 Years | 92 (39.7%) | 0 (0.0%) |
| 75 Years and over | 9 (12.7%) | 0 (0.0%) |
Disability Class: Ambulatory Difficulty
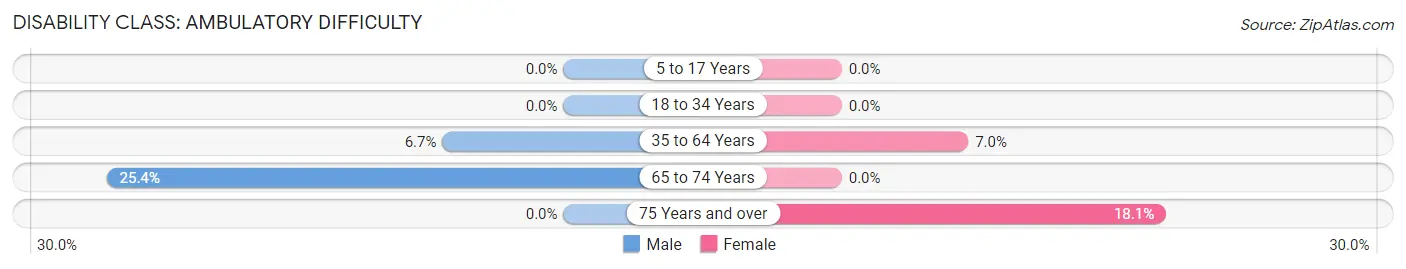
| Age Bracket | Male | Female |
| 5 to 17 Years | 0 (0.0%) | 0 (0.0%) |
| 18 to 34 Years | 0 (0.0%) | 0 (0.0%) |
| 35 to 64 Years | 68 (6.7%) | 66 (7.0%) |
| 65 to 74 Years | 59 (25.4%) | 0 (0.0%) |
| 75 Years and over | 0 (0.0%) | 37 (18.0%) |
Disability Class: Self-Care Difficulty
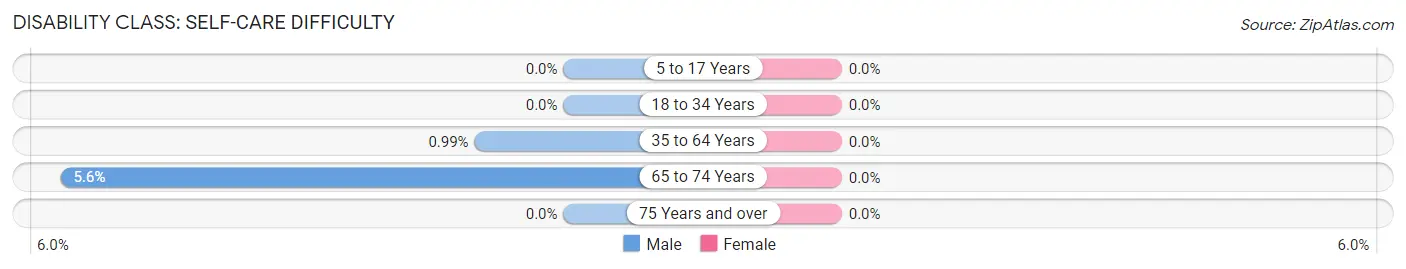
| Age Bracket | Male | Female |
| 5 to 17 Years | 0 (0.0%) | 0 (0.0%) |
| 18 to 34 Years | 0 (0.0%) | 0 (0.0%) |
| 35 to 64 Years | 10 (1.0%) | 0 (0.0%) |
| 65 to 74 Years | 13 (5.6%) | 0 (0.0%) |
| 75 Years and over | 0 (0.0%) | 0 (0.0%) |
Technology Access in Lorane
Computing Device Access in Lorane
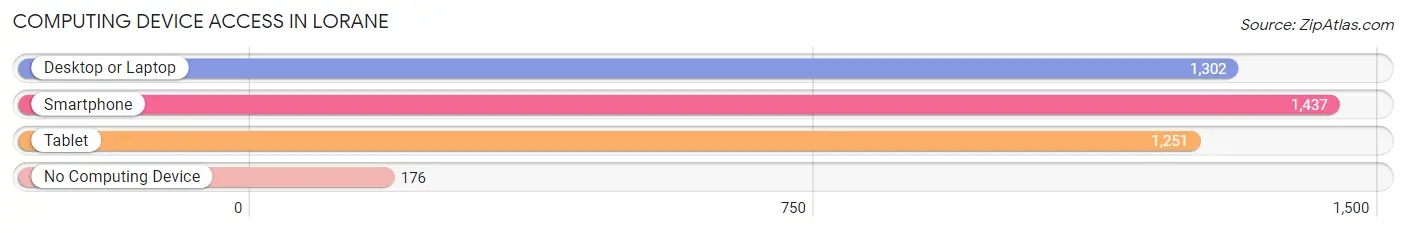
| Device Type | # Households | % Households |
| Desktop or Laptop | 1,302 | 73.9% |
| Smartphone | 1,437 | 81.5% |
| Tablet | 1,251 | 71.0% |
| No Computing Device | 176 | 10.0% |
| Total | 1,763 | 100.0% |
Internet Access in Lorane
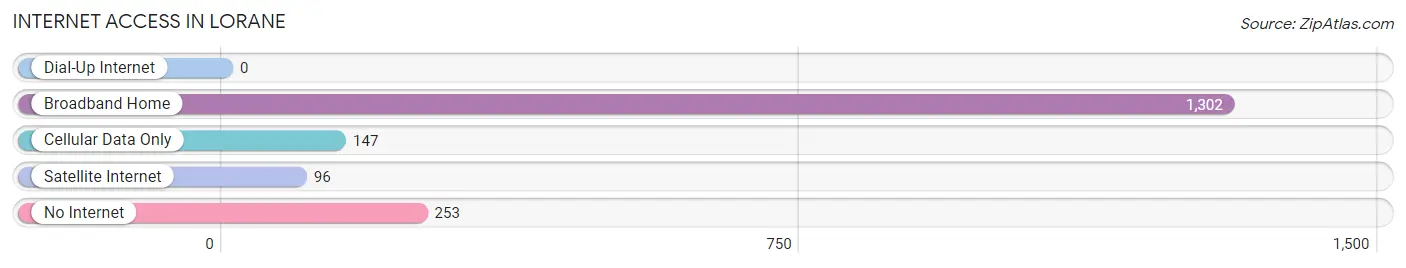
| Internet Type | # Households | % Households |
| Dial-Up Internet | 0 | 0.0% |
| Broadband Home | 1,302 | 73.9% |
| Cellular Data Only | 147 | 8.3% |
| Satellite Internet | 96 | 5.4% |
| No Internet | 253 | 14.3% |
| Total | 1,763 | 100.0% |
Lorane Summary
Lorane, Pennsylvania is a small borough located in the southeastern corner of Berks County. It is situated in the Schuylkill Valley, a region of Pennsylvania known for its rolling hills and lush farmland. The borough is home to a population of just over 1,000 people, and is a quiet, rural community.
History
Lorane was founded in 1790 by a group of German settlers who had recently arrived in the area. The settlers named the town after a nearby stream, which was named after a Native American chief. The town was originally a farming community, and the settlers grew a variety of crops, including wheat, corn, and potatoes. As the town grew, it became a center for trade and commerce, and a number of businesses were established in the area.
In the late 19th century, Lorane experienced a period of rapid growth. The town was connected to the Reading Railroad, which allowed for the transportation of goods and people to and from the area. This connection also allowed for the development of a number of industries, including a brickyard, a sawmill, and a flour mill.
Geography
Lorane is located in the southeastern corner of Berks County, Pennsylvania. It is situated in the Schuylkill Valley, a region of Pennsylvania known for its rolling hills and lush farmland. The borough is bordered by the towns of Oley, Exeter, and Birdsboro. The town is located approximately 25 miles northwest of Philadelphia.
The terrain of Lorane is mostly flat, with some rolling hills. The town is situated on the banks of the Schuylkill River, and is surrounded by a number of small streams and creeks. The climate of the area is temperate, with hot summers and cold winters.
Economy
The economy of Lorane is largely based on agriculture. The town is home to a number of farms, which produce a variety of crops, including wheat, corn, and potatoes. The town is also home to a number of small businesses, including a grocery store, a hardware store, and a few restaurants.
Demographics
As of the 2010 census, the population of Lorane was 1,072. The racial makeup of the town was 97.3% White, 0.9% African American, 0.3% Native American, 0.3% Asian, and 0.9% from other races. The median household income was $50,000, and the median age was 43.
Lorane is a small, rural community with a strong sense of community. The town is home to a number of churches, and there are a number of community events and activities throughout the year. The town is also home to a number of parks and recreational areas, including a public pool and a skate park.
Common Questions
What is the Total Population of Lorane?
Total Population of Lorane is 4,365.
What is the Total Male Population of Lorane?
Total Male Population of Lorane is 2,058.
What is the Total Female Population of Lorane?
Total Female Population of Lorane is 2,307.
What is the Ratio of Males per 100 Females in Lorane?
There are 89.21 Males per 100 Females in Lorane.
What is the Ratio of Females per 100 Males in Lorane?
There are 112.10 Females per 100 Males in Lorane.
What is the Median Population Age in Lorane?
Median Population Age in Lorane is 47.4 Years.
What is the Average Family Size in Lorane
Average Family Size in Lorane is 3.1 People.
What is the Average Household Size in Lorane
Average Household Size in Lorane is 2.5 People.
What is Per Capita Income in Lorane?
Per Capita income in Lorane is $42,510.
What is the Median Family Income in Lorane?
Median Family Income in Lorane is $119,722.
What is the Median Household income in Lorane?
Median Household Income in Lorane is $82,875.
What is Income or Wage Gap in Lorane?
Income or Wage Gap in Lorane is 53.1%.
Women in Lorane earn 46.9 cents for every dollar earned by a man.
What is Inequality or Gini Index in Lorane?
Inequality or Gini Index in Lorane is 0.42.
How Large is the Labor Force in Lorane?
There are 2,521 People in the Labor Forcein in Lorane.
What is the Percentage of People in the Labor Force in Lorane?
68.2% of People are in the Labor Force in Lorane.
What is the Unemployment Rate in Lorane?
Unemployment Rate in Lorane is 9.0%.