Williston, ND
Williston Map
Williston Overview
27,783
TOTAL POPULATION
14,838
MALE POPULATION
12,945
FEMALE POPULATION
114.62
MALES / 100 FEMALES
87.24
FEMALES / 100 MALES
31.4
MEDIAN AGE
3.2
AVG FAMILY SIZE
2.4
AVG HOUSEHOLD SIZE
$44,173
PER CAPITA INCOME
$101,530
AVG FAMILY INCOME
$80,352
AVG HOUSEHOLD INCOME
46.7%
WAGE / INCOME GAP [ % ]
53.3¢/ $1
WAGE / INCOME GAP [ $ ]
0.44
INEQUALITY / GINI INDEX
15,478
LABOR FORCE [ PEOPLE ]
76.8%
PERCENT IN LABOR FORCE
2.9%
UNEMPLOYMENT RATE
Williston Zip Codes
Williston Area Codes
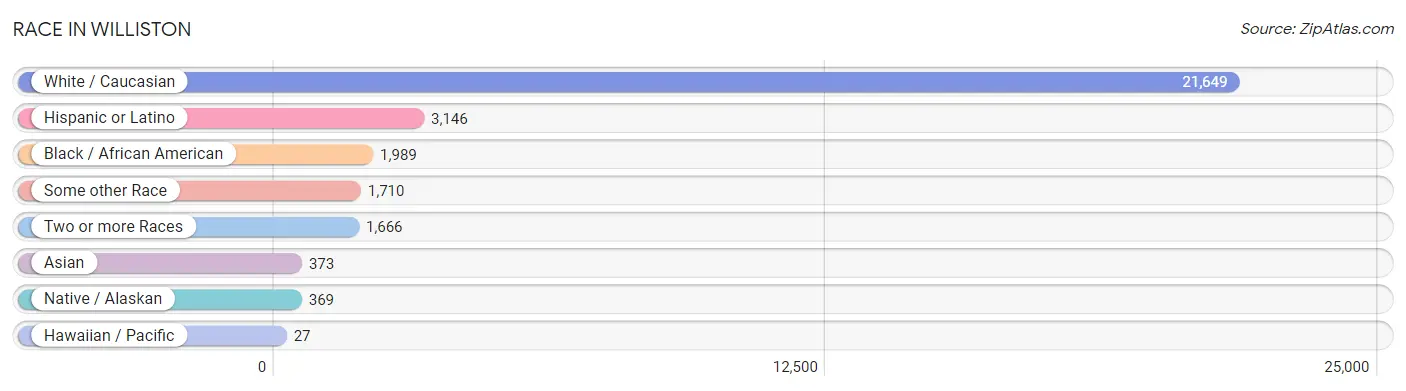
Race in Williston
The most populous races in Williston are White / Caucasian (21,649 | 77.9%), Hispanic or Latino (3,146 | 11.3%), and Black / African American (1,989 | 7.2%).
| Race | # Population | % Population |
| Asian | 373 | 1.3% |
| Black / African American | 1,989 | 7.2% |
| Hawaiian / Pacific | 27 | 0.1% |
| Hispanic or Latino | 3,146 | 11.3% |
| Native / Alaskan | 369 | 1.3% |
| White / Caucasian | 21,649 | 77.9% |
| Two or more Races | 1,666 | 6.0% |
| Some other Race | 1,710 | 6.1% |
| Total | 27,783 | 100.0% |
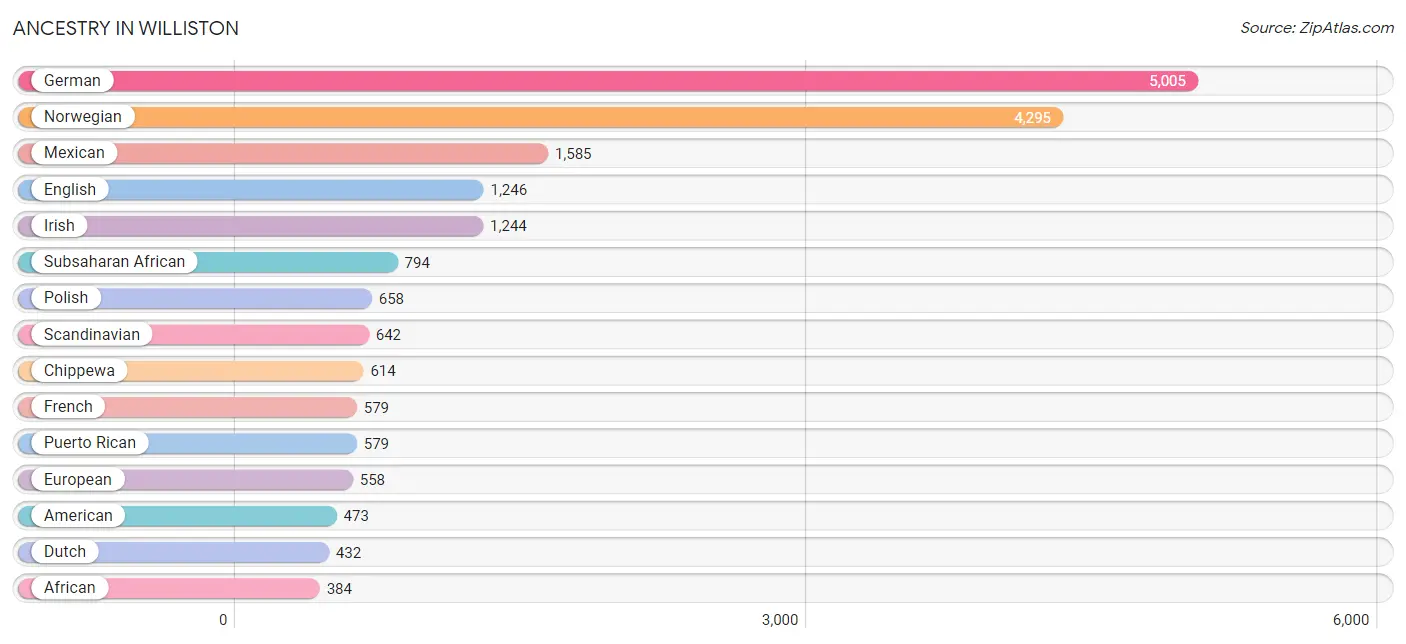
Ancestry in Williston
The most populous ancestries reported in Williston are German (5,005 | 18.0%), Norwegian (4,295 | 15.5%), Mexican (1,585 | 5.7%), English (1,246 | 4.5%), and Irish (1,244 | 4.5%), together accounting for 48.1% of all Williston residents.
| Ancestry | # Population | % Population |
| African | 384 | 1.4% |
| American | 473 | 1.7% |
| Arab | 281 | 1.0% |
| Australian | 12 | 0.0% |
| Austrian | 76 | 0.3% |
| Basque | 10 | 0.0% |
| Belgian | 57 | 0.2% |
| Bhutanese | 17 | 0.1% |
| Blackfeet | 13 | 0.1% |
| British | 32 | 0.1% |
| Burmese | 71 | 0.3% |
| Canadian | 5 | 0.0% |
| Central American | 150 | 0.5% |
| Cherokee | 1 | 0.0% |
| Chilean | 146 | 0.5% |
| Chippewa | 614 | 2.2% |
| Choctaw | 60 | 0.2% |
| Colombian | 40 | 0.1% |
| Cree | 67 | 0.2% |
| Czech | 21 | 0.1% |
| Danish | 171 | 0.6% |
| Dominican | 91 | 0.3% |
| Dutch | 432 | 1.5% |
| Eastern European | 159 | 0.6% |
| English | 1,246 | 4.5% |
| European | 558 | 2.0% |
| Fijian | 131 | 0.5% |
| Finnish | 10 | 0.0% |
| French | 579 | 2.1% |
| French American Indian | 104 | 0.4% |
| French Canadian | 194 | 0.7% |
| German | 5,005 | 18.0% |
| Greek | 146 | 0.5% |
| Houma | 199 | 0.7% |
| Icelander | 21 | 0.1% |
| Indian (Asian) | 57 | 0.2% |
| Irish | 1,244 | 4.5% |
| Italian | 209 | 0.7% |
| Jamaican | 79 | 0.3% |
| Korean | 274 | 1.0% |
| Lebanese | 93 | 0.3% |
| Liberian | 355 | 1.3% |
| Luxembourger | 1 | 0.0% |
| Mexican | 1,585 | 5.7% |
| Mexican American Indian | 14 | 0.1% |
| Native Hawaiian | 103 | 0.4% |
| Navajo | 15 | 0.1% |
| Northern European | 15 | 0.1% |
| Norwegian | 4,295 | 15.5% |
| Palestinian | 127 | 0.5% |
| Peruvian | 181 | 0.6% |
| Polish | 658 | 2.4% |
| Portuguese | 47 | 0.2% |
| Puerto Rican | 579 | 2.1% |
| Romanian | 35 | 0.1% |
| Russian | 203 | 0.7% |
| Salvadoran | 56 | 0.2% |
| Scandinavian | 642 | 2.3% |
| Scotch-Irish | 194 | 0.7% |
| Scottish | 370 | 1.3% |
| Seminole | 3 | 0.0% |
| Shoshone | 25 | 0.1% |
| Sioux | 202 | 0.7% |
| Slovak | 10 | 0.0% |
| Somali | 2 | 0.0% |
| South African | 51 | 0.2% |
| South American | 367 | 1.3% |
| Spaniard | 168 | 0.6% |
| Subsaharan African | 794 | 2.9% |
| Swedish | 300 | 1.1% |
| Swiss | 12 | 0.0% |
| Syrian | 61 | 0.2% |
| Turkish | 85 | 0.3% |
| Ukrainian | 56 | 0.2% |
| Welsh | 74 | 0.3% | View All 75 Rows |
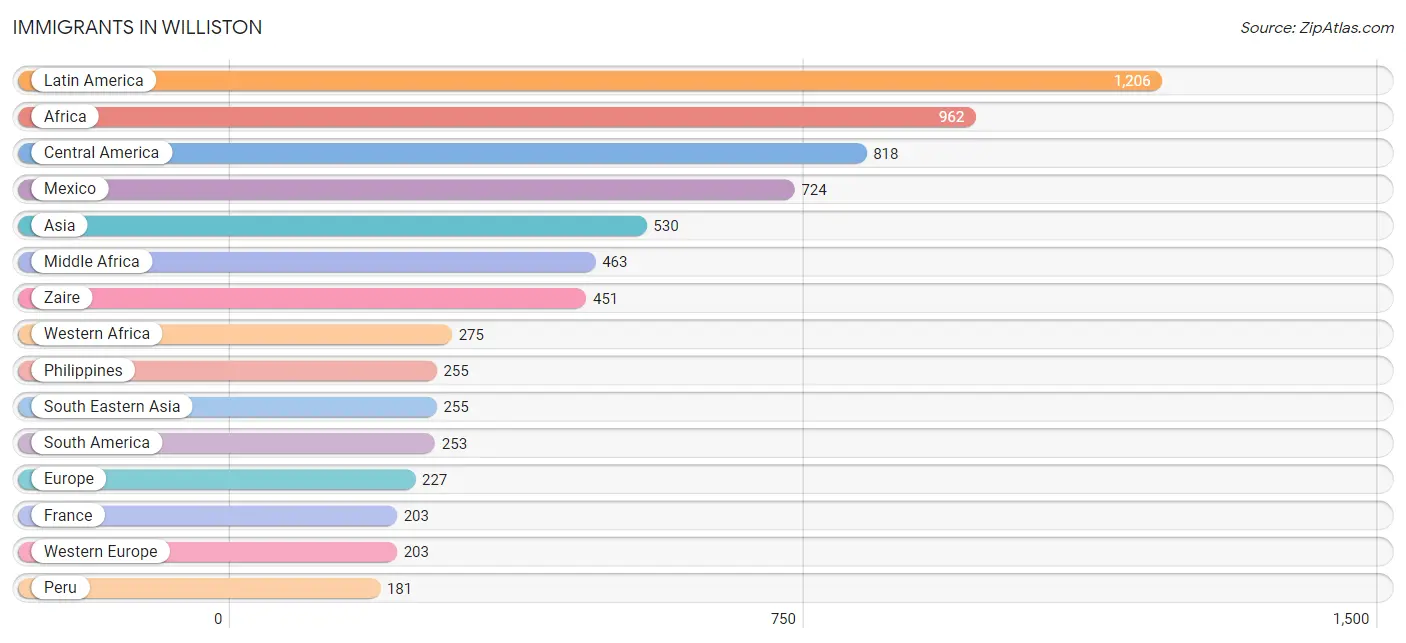
Immigrants in Williston
The most numerous immigrant groups reported in Williston came from Latin America (1,206 | 4.3%), Africa (962 | 3.5%), Central America (818 | 2.9%), Mexico (724 | 2.6%), and Asia (530 | 1.9%), together accounting for 15.3% of all Williston residents.
| Immigration Origin | # Population | % Population |
| Africa | 962 | 3.5% |
| Asia | 530 | 1.9% |
| Australia | 12 | 0.0% |
| Cameroon | 10 | 0.0% |
| Canada | 174 | 0.6% |
| Caribbean | 135 | 0.5% |
| Central America | 818 | 2.9% |
| China | 32 | 0.1% |
| Colombia | 72 | 0.3% |
| Congo | 2 | 0.0% |
| Dominican Republic | 91 | 0.3% |
| Eastern Africa | 2 | 0.0% |
| Eastern Asia | 102 | 0.4% |
| Europe | 227 | 0.8% |
| France | 203 | 0.7% |
| Ghana | 85 | 0.3% |
| Jamaica | 44 | 0.2% |
| Japan | 17 | 0.1% |
| Korea | 53 | 0.2% |
| Latin America | 1,206 | 4.3% |
| Liberia | 159 | 0.6% |
| Mexico | 724 | 2.6% |
| Middle Africa | 463 | 1.7% |
| Nigeria | 31 | 0.1% |
| Northern Europe | 24 | 0.1% |
| Oceania | 26 | 0.1% |
| Peru | 181 | 0.6% |
| Philippines | 255 | 0.9% |
| Scotland | 24 | 0.1% |
| Somalia | 2 | 0.0% |
| South Africa | 51 | 0.2% |
| South America | 253 | 0.9% |
| South Eastern Asia | 255 | 0.9% |
| Taiwan | 16 | 0.1% |
| Turkey | 85 | 0.3% |
| Western Africa | 275 | 1.0% |
| Western Asia | 85 | 0.3% |
| Western Europe | 203 | 0.7% |
| Zaire | 451 | 1.6% | View All 39 Rows |
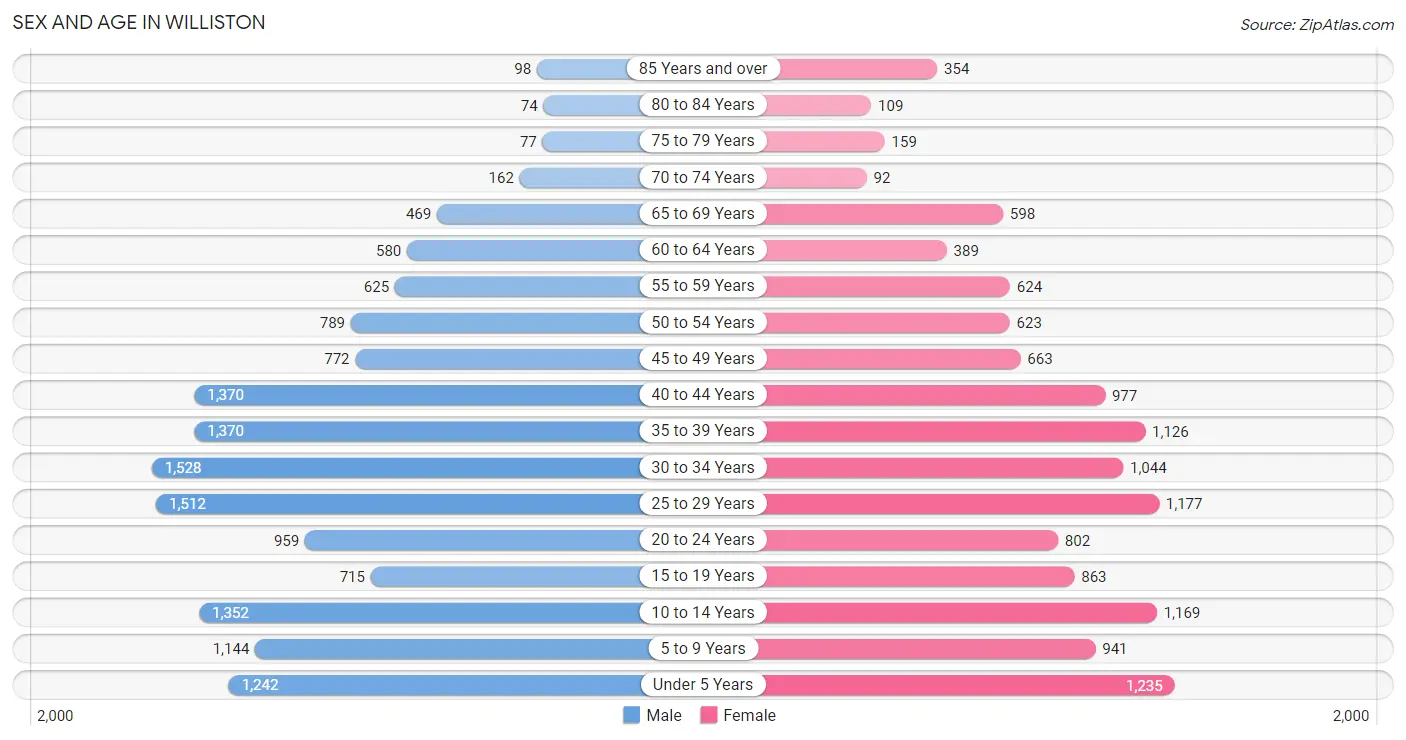
Sex and Age in Williston
Sex and Age in Williston
The most populous age groups in Williston are 30 to 34 Years (1,528 | 10.3%) for men and Under 5 Years (1,235 | 9.5%) for women.
| Age Bracket | Male | Female |
| Under 5 Years | 1,242 (8.4%) | 1,235 (9.5%) |
| 5 to 9 Years | 1,144 (7.7%) | 941 (7.3%) |
| 10 to 14 Years | 1,352 (9.1%) | 1,169 (9.0%) |
| 15 to 19 Years | 715 (4.8%) | 863 (6.7%) |
| 20 to 24 Years | 959 (6.5%) | 802 (6.2%) |
| 25 to 29 Years | 1,512 (10.2%) | 1,177 (9.1%) |
| 30 to 34 Years | 1,528 (10.3%) | 1,044 (8.1%) |
| 35 to 39 Years | 1,370 (9.2%) | 1,126 (8.7%) |
| 40 to 44 Years | 1,370 (9.2%) | 977 (7.5%) |
| 45 to 49 Years | 772 (5.2%) | 663 (5.1%) |
| 50 to 54 Years | 789 (5.3%) | 623 (4.8%) |
| 55 to 59 Years | 625 (4.2%) | 624 (4.8%) |
| 60 to 64 Years | 580 (3.9%) | 389 (3.0%) |
| 65 to 69 Years | 469 (3.2%) | 598 (4.6%) |
| 70 to 74 Years | 162 (1.1%) | 92 (0.7%) |
| 75 to 79 Years | 77 (0.5%) | 159 (1.2%) |
| 80 to 84 Years | 74 (0.5%) | 109 (0.8%) |
| 85 Years and over | 98 (0.7%) | 354 (2.7%) |
| Total | 14,838 (100.0%) | 12,945 (100.0%) |
Families and Households in Williston
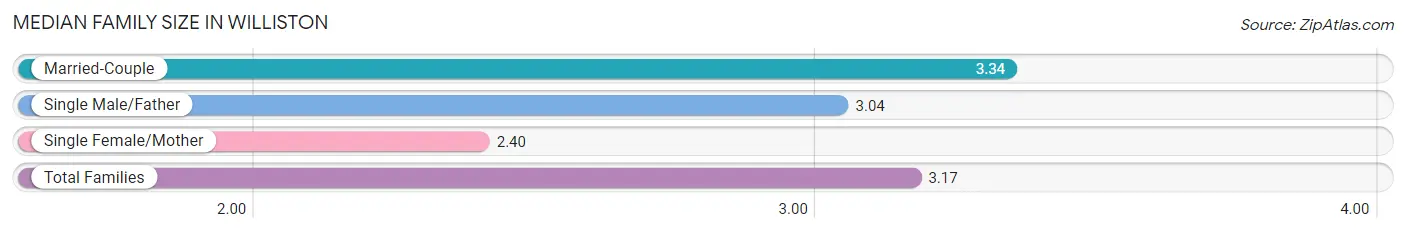
Median Family Size in Williston
The median family size in Williston is 3.17 persons per family, with married-couple families (4,631 | 70.8%) accounting for the largest median family size of 3.34 persons per family. On the other hand, single female/mother families (842 | 12.9%) represent the smallest median family size with 2.40 persons per family.
| Family Type | # Families | Family Size |
| Married-Couple | 4,631 (70.8%) | 3.34 |
| Single Male/Father | 1,071 (16.4%) | 3.04 |
| Single Female/Mother | 842 (12.9%) | 2.40 |
| Total Families | 6,544 (100.0%) | 3.17 |
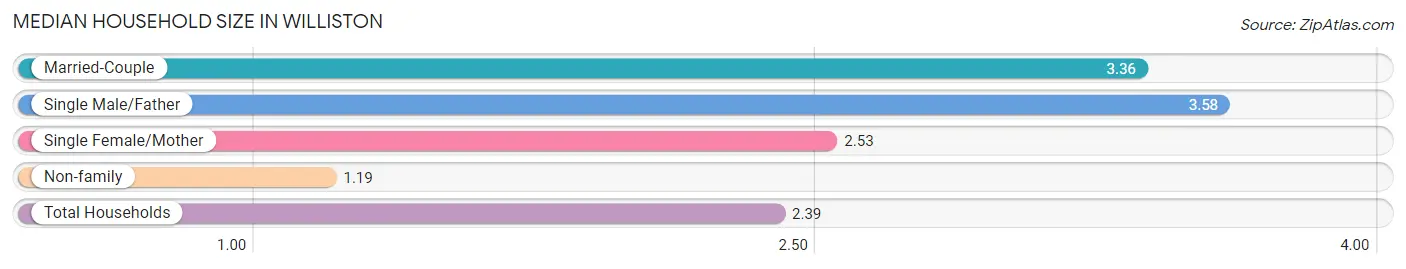
Median Household Size in Williston
The median household size in Williston is 2.39 persons per household, with single male/father households (1,071 | 9.4%) accounting for the largest median household size of 3.58 persons per household. non-family households (4,866 | 42.6%) represent the smallest median household size with 1.19 persons per household.
| Household Type | # Households | Household Size |
| Married-Couple | 4,631 (40.6%) | 3.36 |
| Single Male/Father | 1,071 (9.4%) | 3.58 |
| Single Female/Mother | 842 (7.4%) | 2.53 |
| Non-family | 4,866 (42.6%) | 1.19 |
| Total Households | 11,410 (100.0%) | 2.39 |
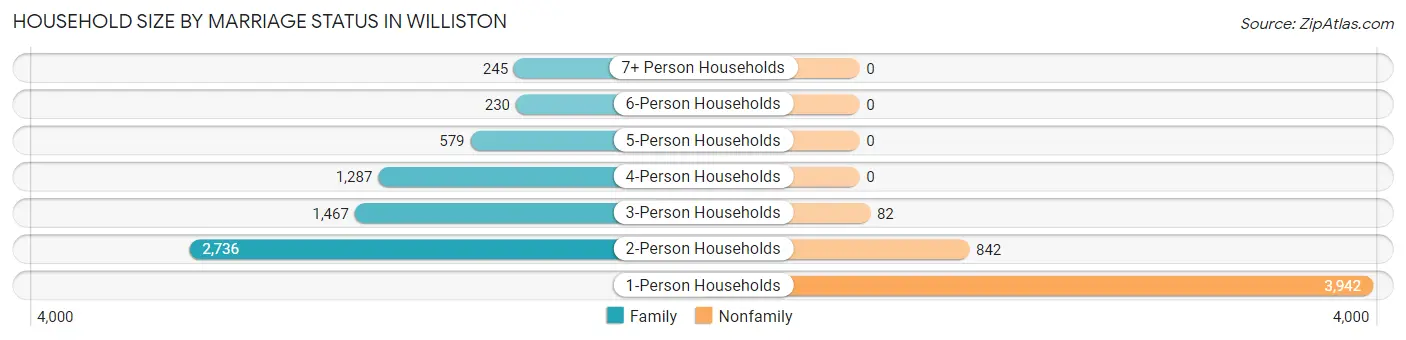
Household Size by Marriage Status in Williston
Out of a total of 11,410 households in Williston, 6,544 (57.4%) are family households, while 4,866 (42.6%) are nonfamily households. The most numerous type of family households are 2-person households, comprising 2,736, and the most common type of nonfamily households are 1-person households, comprising 3,942.
| Household Size | Family Households | Nonfamily Households |
| 1-Person Households | - | 3,942 (34.5%) |
| 2-Person Households | 2,736 (24.0%) | 842 (7.4%) |
| 3-Person Households | 1,467 (12.9%) | 82 (0.7%) |
| 4-Person Households | 1,287 (11.3%) | 0 (0.0%) |
| 5-Person Households | 579 (5.1%) | 0 (0.0%) |
| 6-Person Households | 230 (2.0%) | 0 (0.0%) |
| 7+ Person Households | 245 (2.1%) | 0 (0.0%) |
| Total | 6,544 (57.4%) | 4,866 (42.6%) |
Female Fertility in Williston
Fertility by Age in Williston
Average fertility rate in Williston is 26.0 births per 1,000 women. Women in the age bracket of 20 to 34 years have the highest fertility rate with 45.0 births per 1,000 women. Women in the age bracket of 20 to 34 years acount for 78.0% of all women with births.
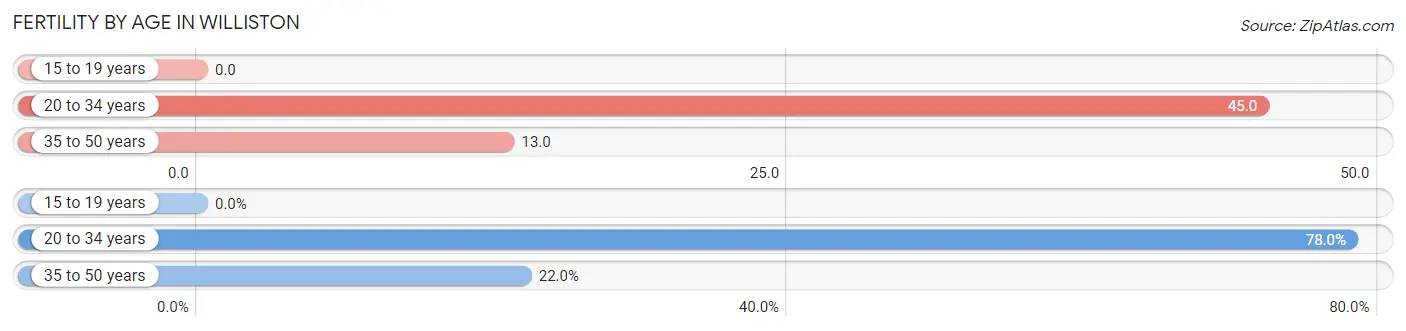
| Age Bracket | Women with Births | Births / 1,000 Women |
| 15 to 19 years | 0 (0.0%) | 0.0 |
| 20 to 34 years | 135 (78.0%) | 45.0 |
| 35 to 50 years | 38 (22.0%) | 13.0 |
| Total | 173 (100.0%) | 26.0 |
Fertility by Age by Marriage Status in Williston
89.6% of women with births (173) in Williston are married. The highest percentage of unmarried women with births falls into 20 to 34 years age bracket with 13.3% of them unmarried at the time of birth, while the lowest percentage of unmarried women with births belong to 35 to 50 years age bracket with 0.0% of them unmarried.
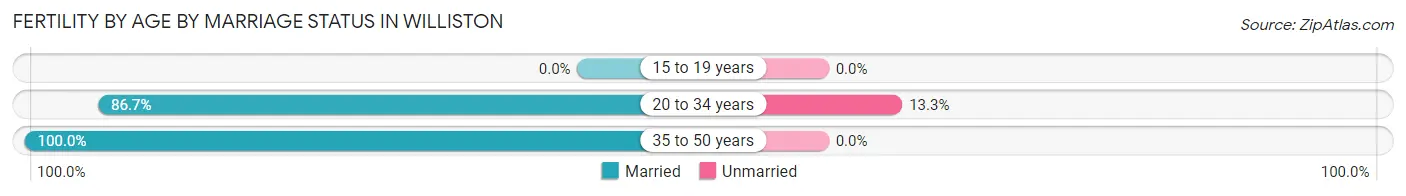
| Age Bracket | Married | Unmarried |
| 15 to 19 years | 0 (0.0%) | 0 (0.0%) |
| 20 to 34 years | 117 (86.7%) | 18 (13.3%) |
| 35 to 50 years | 38 (100.0%) | 0 (0.0%) |
| Total | 155 (89.6%) | 18 (10.4%) |
Fertility by Education in Williston
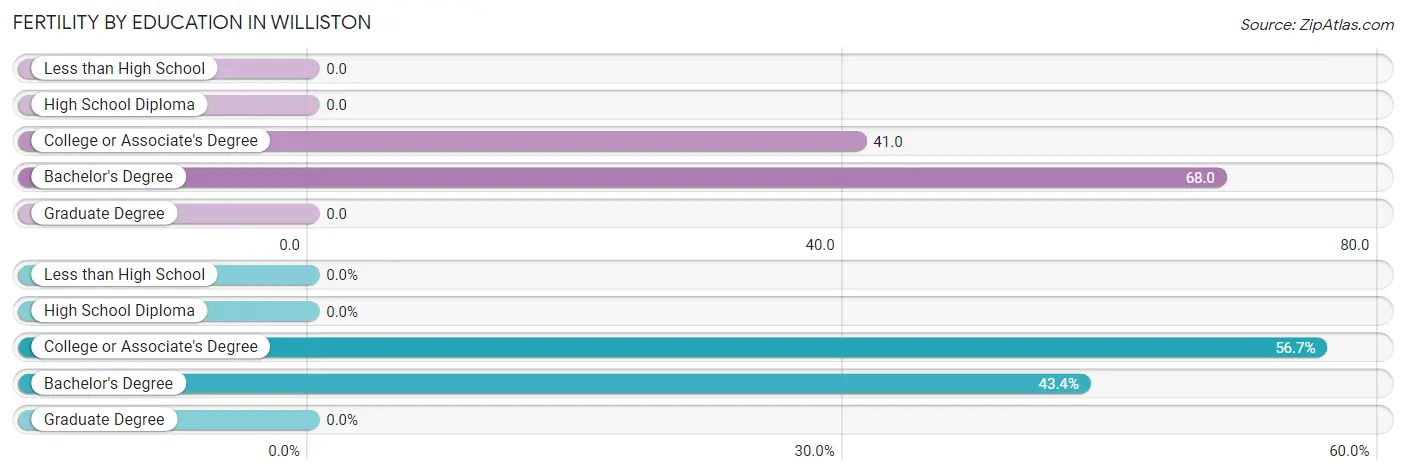
| Educational Attainment | Women with Births | Births / 1,000 Women |
| Less than High School | 0 (0.0%) | 0.0 |
| High School Diploma | 0 (0.0%) | 0.0 |
| College or Associate's Degree | 98 (56.7%) | 41.0 |
| Bachelor's Degree | 75 (43.3%) | 68.0 |
| Graduate Degree | 0 (0.0%) | 0.0 |
| Total | 173 (100.0%) | 26.0 |
Fertility by Education by Marriage Status in Williston
10.4% of women with births in Williston are unmarried. Women with the educational attainment of bachelor's degree are most likely to be married with 100.0% of them married at childbirth, while women with the educational attainment of college or associate's degree are least likely to be married with 18.4% of them unmarried at childbirth.
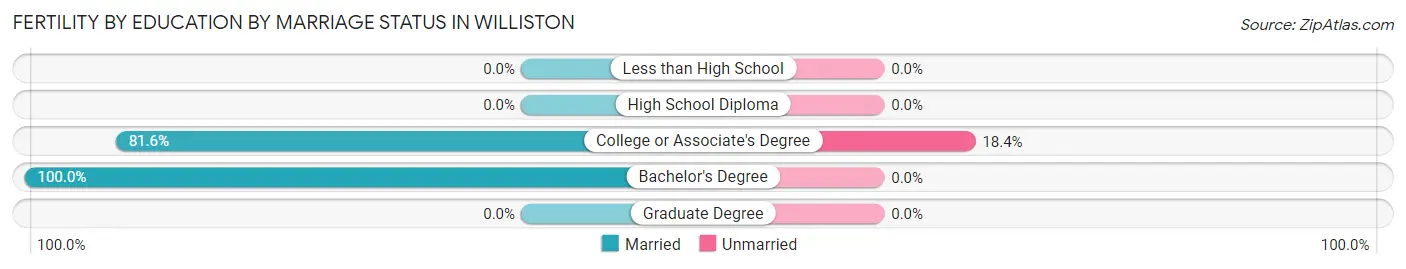
| Educational Attainment | Married | Unmarried |
| Less than High School | 0 (0.0%) | 0 (0.0%) |
| High School Diploma | 0 (0.0%) | 0 (0.0%) |
| College or Associate's Degree | 80 (81.6%) | 18 (18.4%) |
| Bachelor's Degree | 75 (100.0%) | 0 (0.0%) |
| Graduate Degree | 0 (0.0%) | 0 (0.0%) |
| Total | 155 (89.6%) | 18 (10.4%) |
Income in Williston
Income Overview in Williston
Per Capita Income in Williston is $44,173, while median incomes of families and households are $101,530 and $80,352 respectively.
| Characteristic | Number | Measure |
| Per Capita Income | 27,783 | $44,173 |
| Median Family Income | 6,544 | $101,530 |
| Mean Family Income | 6,544 | $126,095 |
| Median Household Income | 11,410 | $80,352 |
| Mean Household Income | 11,410 | $106,859 |
| Income Deficit | 6,544 | $0 |
| Wage / Income Gap (%) | 27,783 | 46.74% |
| Wage / Income Gap ($) | 27,783 | 53.26¢ per $1 |
| Gini / Inequality Index | 27,783 | 0.44 |
Earnings by Sex in Williston
Average Earnings in Williston are $47,345, $66,284 for men and $35,302 for women, a difference of 46.7%.
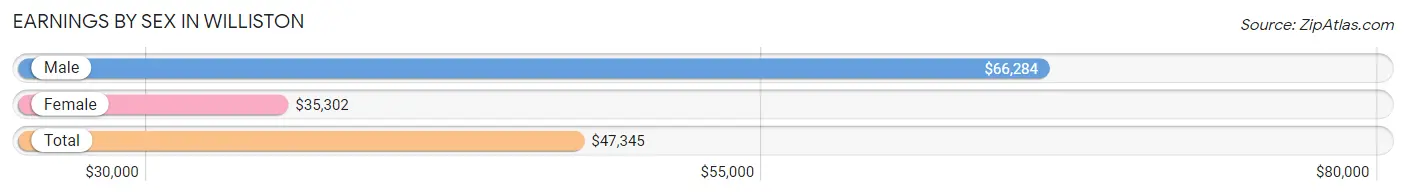
| Sex | Number | Average Earnings |
| Male | 9,294 (58.2%) | $66,284 |
| Female | 6,672 (41.8%) | $35,302 |
| Total | 15,966 (100.0%) | $47,345 |
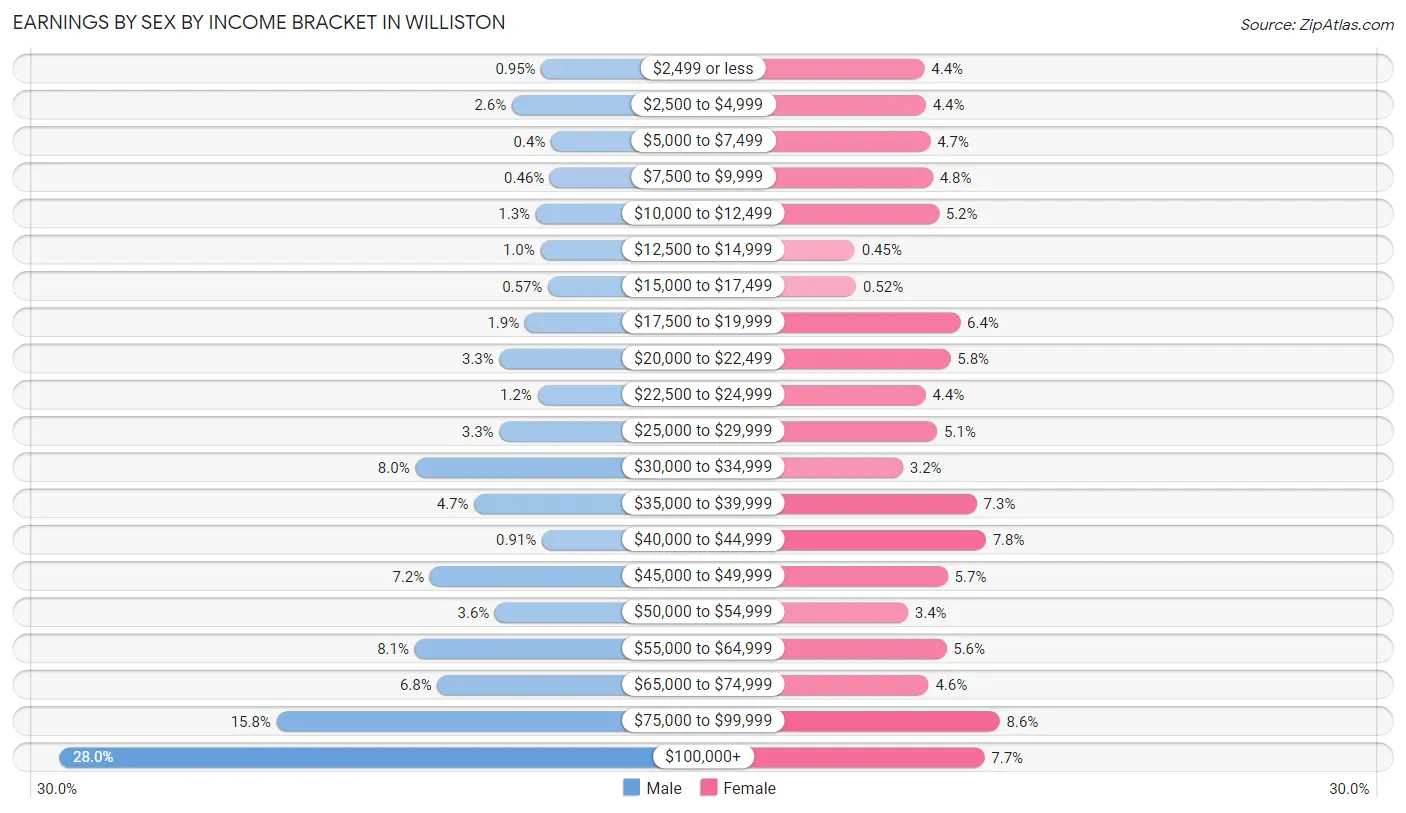
Earnings by Sex by Income Bracket in Williston
The most common earnings brackets in Williston are $100,000+ for men (2,602 | 28.0%) and $75,000 to $99,999 for women (573 | 8.6%).
| Income | Male | Female |
| $2,499 or less | 88 (0.9%) | 291 (4.4%) |
| $2,500 to $4,999 | 242 (2.6%) | 296 (4.4%) |
| $5,000 to $7,499 | 37 (0.4%) | 313 (4.7%) |
| $7,500 to $9,999 | 43 (0.5%) | 322 (4.8%) |
| $10,000 to $12,499 | 117 (1.3%) | 345 (5.2%) |
| $12,500 to $14,999 | 93 (1.0%) | 30 (0.4%) |
| $15,000 to $17,499 | 53 (0.6%) | 35 (0.5%) |
| $17,500 to $19,999 | 174 (1.9%) | 425 (6.4%) |
| $20,000 to $22,499 | 307 (3.3%) | 388 (5.8%) |
| $22,500 to $24,999 | 108 (1.2%) | 295 (4.4%) |
| $25,000 to $29,999 | 308 (3.3%) | 339 (5.1%) |
| $30,000 to $34,999 | 746 (8.0%) | 210 (3.2%) |
| $35,000 to $39,999 | 439 (4.7%) | 487 (7.3%) |
| $40,000 to $44,999 | 85 (0.9%) | 521 (7.8%) |
| $45,000 to $49,999 | 670 (7.2%) | 378 (5.7%) |
| $50,000 to $54,999 | 330 (3.5%) | 229 (3.4%) |
| $55,000 to $64,999 | 750 (8.1%) | 373 (5.6%) |
| $65,000 to $74,999 | 631 (6.8%) | 306 (4.6%) |
| $75,000 to $99,999 | 1,471 (15.8%) | 573 (8.6%) |
| $100,000+ | 2,602 (28.0%) | 516 (7.7%) |
| Total | 9,294 (100.0%) | 6,672 (100.0%) |
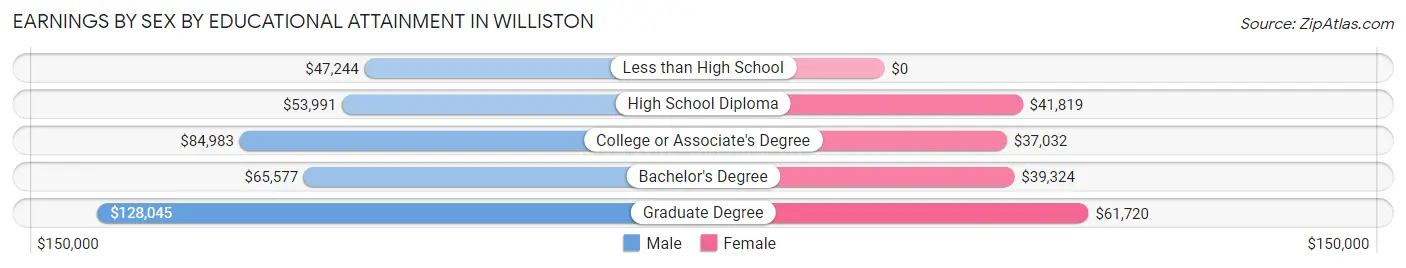
Earnings by Sex by Educational Attainment in Williston
Average earnings in Williston are $70,693 for men and $40,298 for women, a difference of 43.0%. Men with an educational attainment of graduate degree enjoy the highest average annual earnings of $128,045, while those with less than high school education earn the least with $47,244. Women with an educational attainment of graduate degree earn the most with the average annual earnings of $61,720, while those with college or associate's degree education have the smallest earnings of $37,032.
| Educational Attainment | Male Income | Female Income |
| Less than High School | $47,244 | $0 |
| High School Diploma | $53,991 | $41,819 |
| College or Associate's Degree | $84,983 | $37,032 |
| Bachelor's Degree | $65,577 | $39,324 |
| Graduate Degree | $128,045 | $61,720 |
| Total | $70,693 | $40,298 |
Family Income in Williston
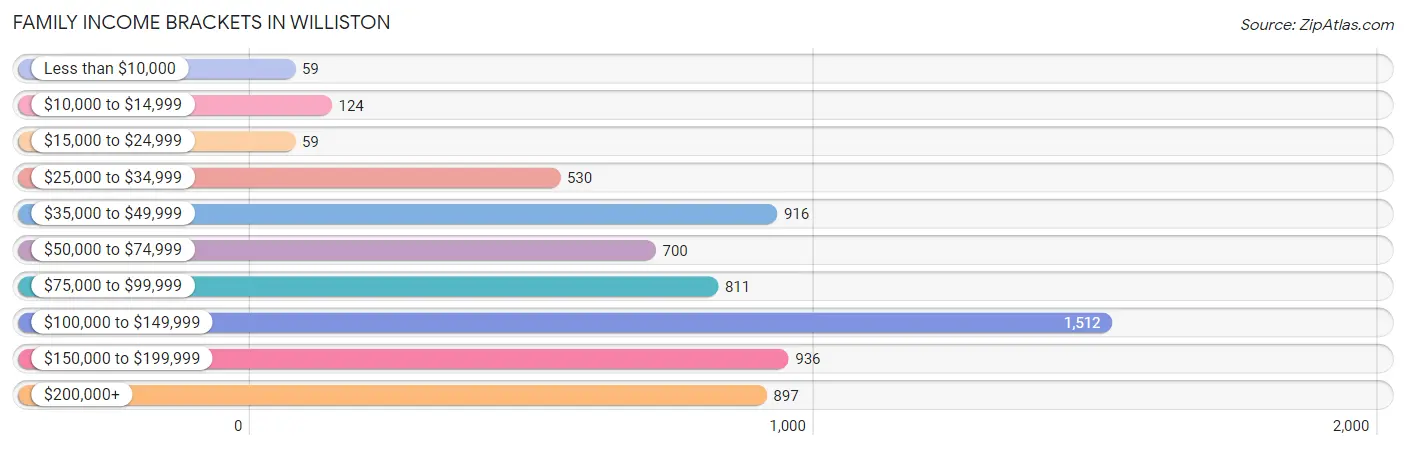
Family Income Brackets in Williston
According to the Williston family income data, there are 1,512 families falling into the $100,000 to $149,999 income range, which is the most common income bracket and makes up 23.1% of all families. Conversely, the less than $10,000 income bracket is the least frequent group with only 59 families (0.9%) belonging to this category.
| Income Bracket | # Families | % Families |
| Less than $10,000 | 59 | 0.9% |
| $10,000 to $14,999 | 124 | 1.9% |
| $15,000 to $24,999 | 59 | 0.9% |
| $25,000 to $34,999 | 530 | 8.1% |
| $35,000 to $49,999 | 916 | 14.0% |
| $50,000 to $74,999 | 700 | 10.7% |
| $75,000 to $99,999 | 811 | 12.4% |
| $100,000 to $149,999 | 1,512 | 23.1% |
| $150,000 to $199,999 | 936 | 14.3% |
| $200,000+ | 897 | 13.7% |
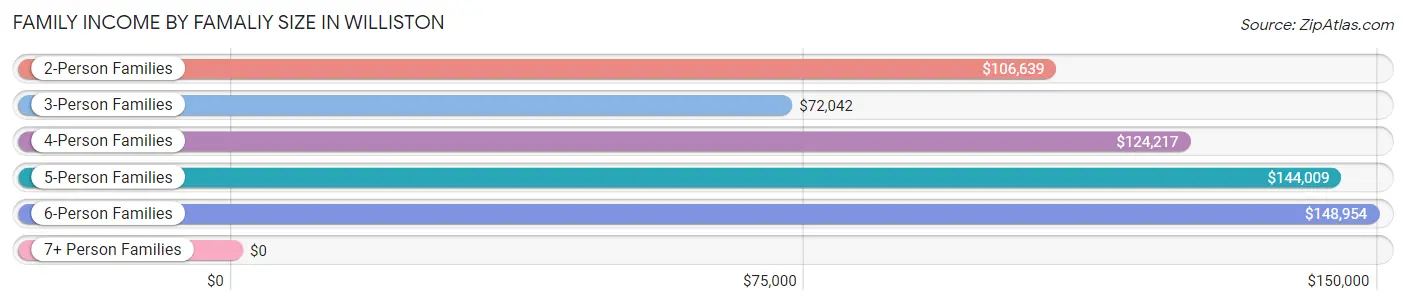
Family Income by Famaliy Size in Williston
6-person families (229 | 3.5%) account for the highest median family income in Williston with $148,954 per family, while 2-person families (2,908 | 44.4%) have the highest median income of $53,320 per family member.
| Income Bracket | # Families | Median Income |
| 2-Person Families | 2,908 (44.4%) | $106,639 |
| 3-Person Families | 1,784 (27.3%) | $72,042 |
| 4-Person Families | 864 (13.2%) | $124,217 |
| 5-Person Families | 566 (8.6%) | $144,009 |
| 6-Person Families | 229 (3.5%) | $148,954 |
| 7+ Person Families | 193 (2.9%) | $0 |
| Total | 6,544 (100.0%) | $101,530 |
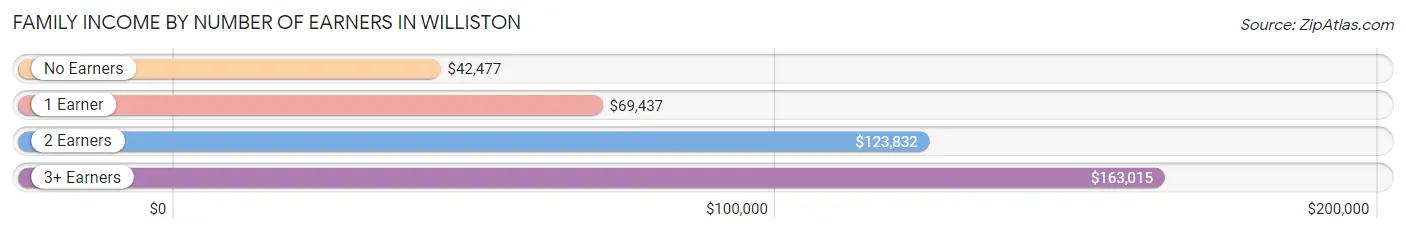
Family Income by Number of Earners in Williston
The median family income in Williston is $101,530, with families comprising 3+ earners (521) having the highest median family income of $163,015, while families with no earners (445) have the lowest median family income of $42,477, accounting for 8.0% and 6.8% of families, respectively.
| Number of Earners | # Families | Median Income |
| No Earners | 445 (6.8%) | $42,477 |
| 1 Earner | 2,295 (35.1%) | $69,437 |
| 2 Earners | 3,283 (50.2%) | $123,832 |
| 3+ Earners | 521 (8.0%) | $163,015 |
| Total | 6,544 (100.0%) | $101,530 |
Household Income in Williston
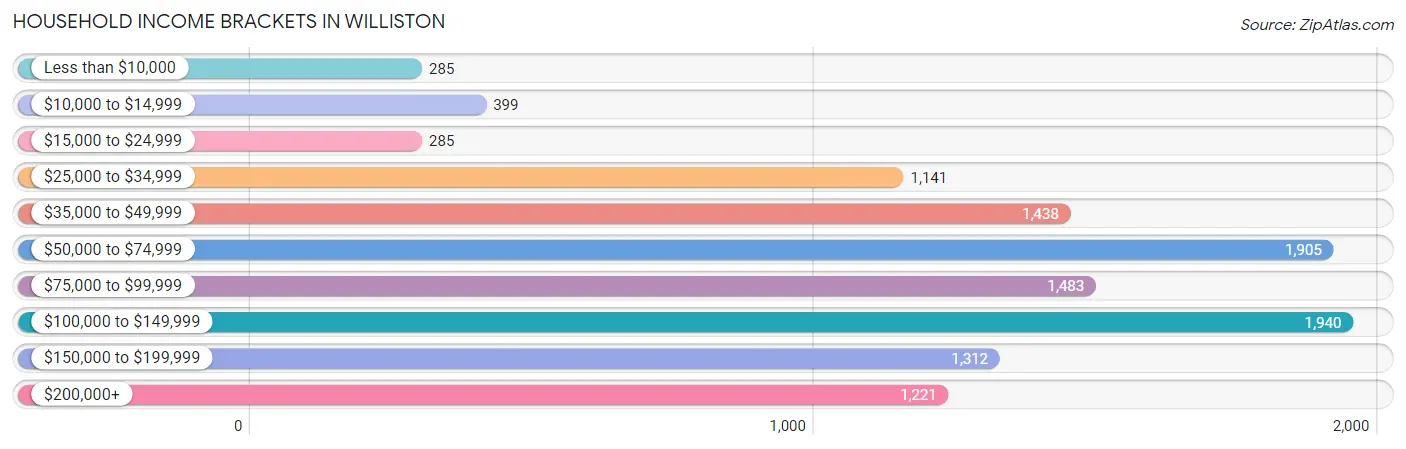
Household Income Brackets in Williston
With 1,940 households falling in the category, the $100,000 to $149,999 income range is the most frequent in Williston, accounting for 17.0% of all households. In contrast, only 285 households (2.5%) fall into the less than $10,000 income bracket, making it the least populous group.
| Income Bracket | # Households | % Households |
| Less than $10,000 | 285 | 2.5% |
| $10,000 to $14,999 | 399 | 3.5% |
| $15,000 to $24,999 | 285 | 2.5% |
| $25,000 to $34,999 | 1,141 | 10.0% |
| $35,000 to $49,999 | 1,438 | 12.6% |
| $50,000 to $74,999 | 1,905 | 16.7% |
| $75,000 to $99,999 | 1,483 | 13.0% |
| $100,000 to $149,999 | 1,940 | 17.0% |
| $150,000 to $199,999 | 1,312 | 11.5% |
| $200,000+ | 1,221 | 10.7% |
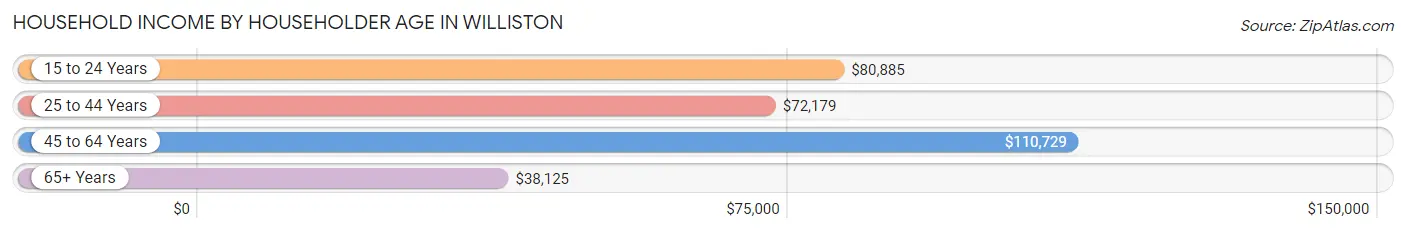
Household Income by Householder Age in Williston
The median household income in Williston is $80,352, with the highest median household income of $110,729 found in the 45 to 64 years age bracket for the primary householder. A total of 3,017 households (26.4%) fall into this category. Meanwhile, the 65+ years age bracket for the primary householder has the lowest median household income of $38,125, with 1,549 households (13.6%) in this group.
| Income Bracket | # Households | Median Income |
| 15 to 24 Years | 815 (7.1%) | $80,885 |
| 25 to 44 Years | 6,029 (52.8%) | $72,179 |
| 45 to 64 Years | 3,017 (26.4%) | $110,729 |
| 65+ Years | 1,549 (13.6%) | $38,125 |
| Total | 11,410 (100.0%) | $80,352 |
Poverty in Williston
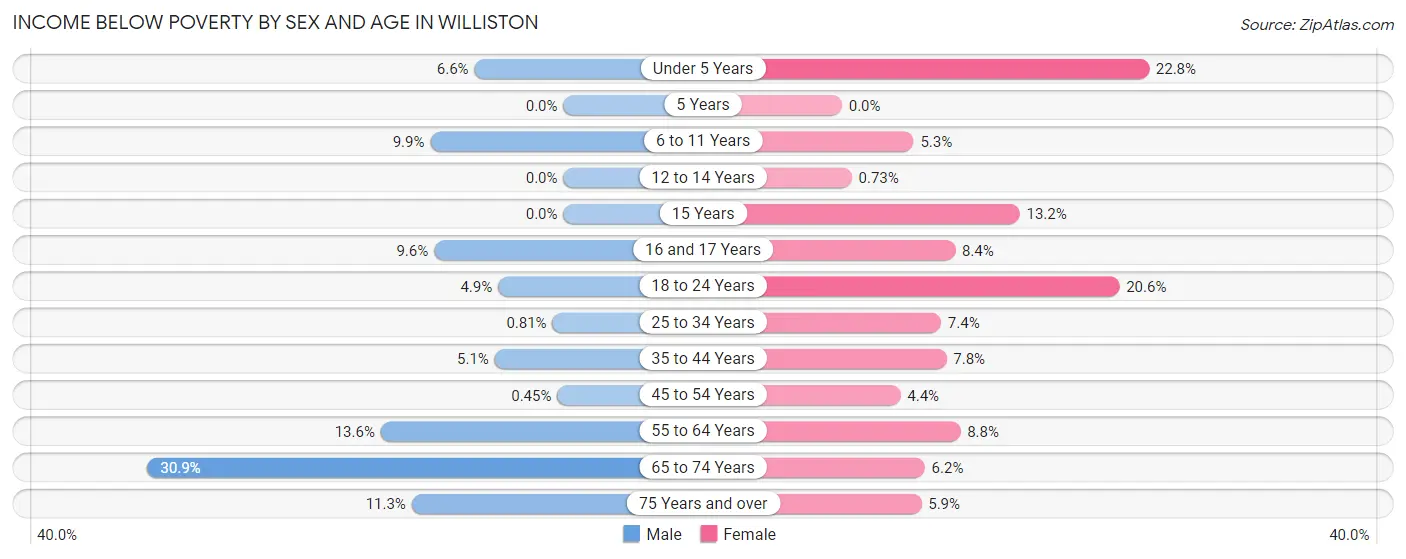
Income Below Poverty by Sex and Age in Williston
With 5.8% poverty level for males and 9.2% for females among the residents of Williston, 65 to 74 year old males and under 5 year old females are the most vulnerable to poverty, with 193 males (30.9%) and 275 females (22.8%) in their respective age groups living below the poverty level.
| Age Bracket | Male | Female |
| Under 5 Years | 82 (6.6%) | 275 (22.8%) |
| 5 Years | 0 (0.0%) | 0 (0.0%) |
| 6 to 11 Years | 149 (9.9%) | 58 (5.3%) |
| 12 to 14 Years | 0 (0.0%) | 6 (0.7%) |
| 15 Years | 0 (0.0%) | 33 (13.2%) |
| 16 and 17 Years | 12 (9.6%) | 22 (8.4%) |
| 18 to 24 Years | 58 (4.9%) | 228 (20.6%) |
| 25 to 34 Years | 24 (0.8%) | 163 (7.4%) |
| 35 to 44 Years | 139 (5.1%) | 163 (7.8%) |
| 45 to 54 Years | 7 (0.4%) | 56 (4.3%) |
| 55 to 64 Years | 162 (13.6%) | 89 (8.8%) |
| 65 to 74 Years | 193 (30.9%) | 41 (6.1%) |
| 75 Years and over | 25 (11.3%) | 31 (5.9%) |
| Total | 851 (5.8%) | 1,165 (9.2%) |
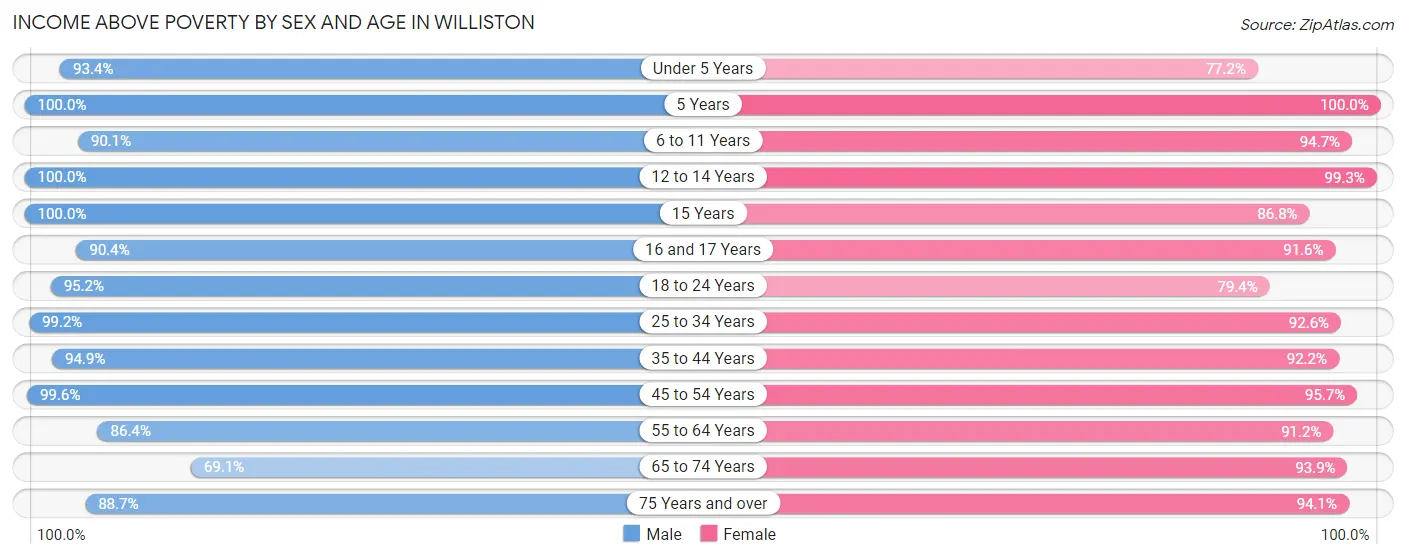
Income Above Poverty by Sex and Age in Williston
According to the poverty statistics in Williston, males aged 5 years and females aged 5 years are the age groups that are most secure financially, with 100.0% of males and 100.0% of females in these age groups living above the poverty line.
| Age Bracket | Male | Female |
| Under 5 Years | 1,160 (93.4%) | 931 (77.2%) |
| 5 Years | 216 (100.0%) | 175 (100.0%) |
| 6 to 11 Years | 1,359 (90.1%) | 1,033 (94.7%) |
| 12 to 14 Years | 770 (100.0%) | 819 (99.3%) |
| 15 Years | 297 (100.0%) | 217 (86.8%) |
| 16 and 17 Years | 113 (90.4%) | 240 (91.6%) |
| 18 to 24 Years | 1,139 (95.2%) | 879 (79.4%) |
| 25 to 34 Years | 2,957 (99.2%) | 2,052 (92.6%) |
| 35 to 44 Years | 2,587 (94.9%) | 1,938 (92.2%) |
| 45 to 54 Years | 1,550 (99.6%) | 1,230 (95.7%) |
| 55 to 64 Years | 1,033 (86.4%) | 924 (91.2%) |
| 65 to 74 Years | 432 (69.1%) | 626 (93.9%) |
| 75 Years and over | 197 (88.7%) | 494 (94.1%) |
| Total | 13,810 (94.2%) | 11,558 (90.8%) |
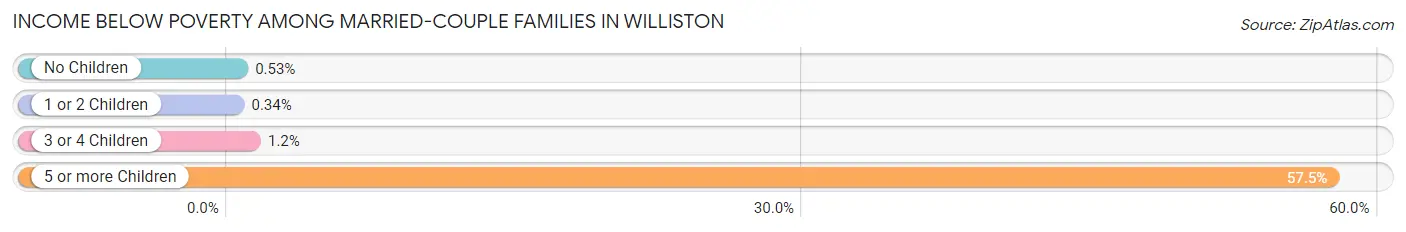
Income Below Poverty Among Married-Couple Families in Williston
The poverty statistics for married-couple families in Williston show that 2.9% or 135 of the total 4,631 families live below the poverty line. Families with 5 or more children have the highest poverty rate of 57.5%, comprising of 111 families. On the other hand, families with 1 or 2 children have the lowest poverty rate of 0.3%, which includes 5 families.
| Children | Above Poverty | Below Poverty |
| No Children | 2,460 (99.5%) | 13 (0.5%) |
| 1 or 2 Children | 1,460 (99.7%) | 5 (0.3%) |
| 3 or 4 Children | 494 (98.8%) | 6 (1.2%) |
| 5 or more Children | 82 (42.5%) | 111 (57.5%) |
| Total | 4,496 (97.1%) | 135 (2.9%) |
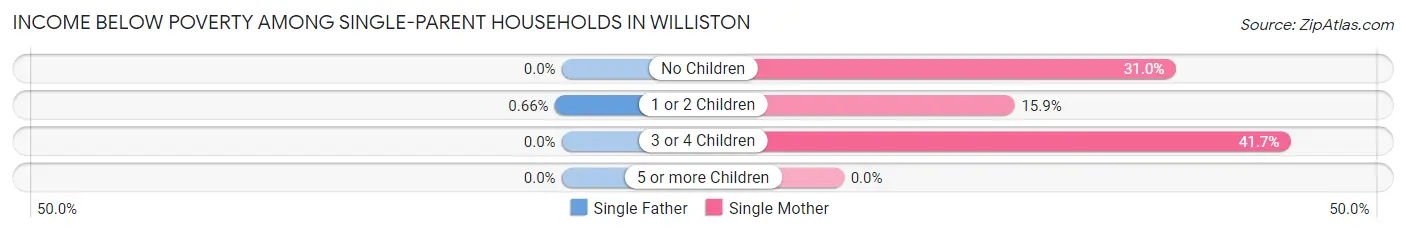
Income Below Poverty Among Single-Parent Households in Williston
According to the poverty data in Williston, 0.5% or 5 single-father households and 20.9% or 176 single-mother households are living below the poverty line. Among single-father households, those with 1 or 2 children have the highest poverty rate, with 5 households (0.7%) experiencing poverty. Likewise, among single-mother households, those with 3 or 4 children have the highest poverty rate, with 20 households (41.7%) falling below the poverty line.
| Children | Single Father | Single Mother |
| No Children | 0 (0.0%) | 61 (31.0%) |
| 1 or 2 Children | 5 (0.7%) | 95 (15.9%) |
| 3 or 4 Children | 0 (0.0%) | 20 (41.7%) |
| 5 or more Children | 0 (0.0%) | 0 (0.0%) |
| Total | 5 (0.5%) | 176 (20.9%) |
Income Below Poverty Among Married-Couple vs Single-Parent Households in Williston
The poverty data for Williston shows that 135 of the married-couple family households (2.9%) and 181 of the single-parent households (9.5%) are living below the poverty level. Within the married-couple family households, those with 5 or more children have the highest poverty rate, with 111 households (57.5%) falling below the poverty line. Among the single-parent households, those with 3 or 4 children have the highest poverty rate, with 20 household (22.7%) living below poverty.
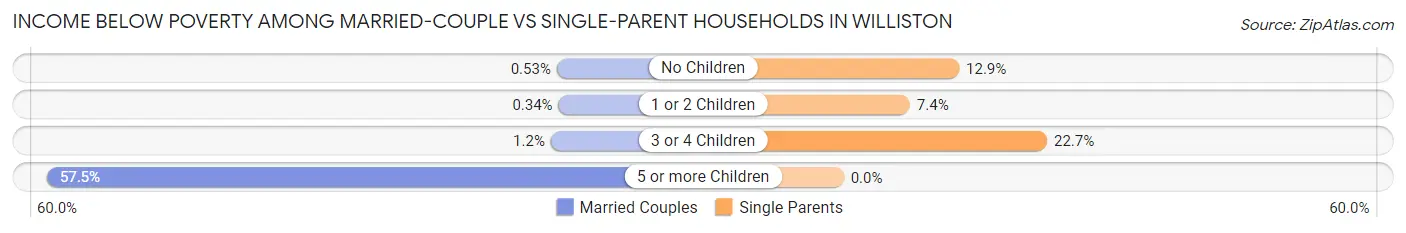
| Children | Married-Couple Families | Single-Parent Households |
| No Children | 13 (0.5%) | 61 (12.9%) |
| 1 or 2 Children | 5 (0.3%) | 100 (7.4%) |
| 3 or 4 Children | 6 (1.2%) | 20 (22.7%) |
| 5 or more Children | 111 (57.5%) | 0 (0.0%) |
| Total | 135 (2.9%) | 181 (9.5%) |
Employment Characteristics in Williston
Employment by Class of Employer in Williston
Among the 14,809 employed individuals in Williston, private company employees (10,544 | 71.2%), not-for-profit organizations (1,386 | 9.4%), and local government employees (1,139 | 7.7%) make up the most common classes of employment.
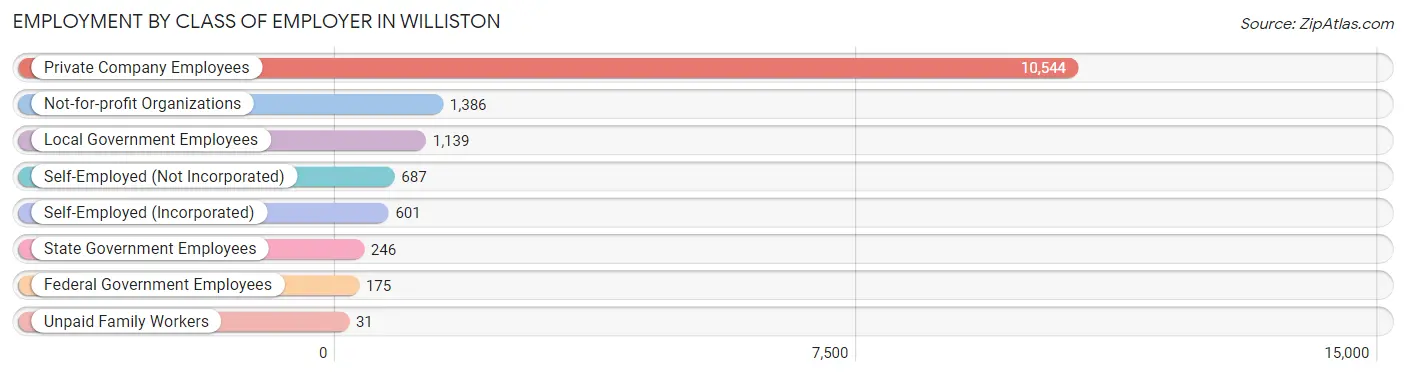
| Employer Class | # Employees | % Employees |
| Private Company Employees | 10,544 | 71.2% |
| Self-Employed (Incorporated) | 601 | 4.1% |
| Self-Employed (Not Incorporated) | 687 | 4.6% |
| Not-for-profit Organizations | 1,386 | 9.4% |
| Local Government Employees | 1,139 | 7.7% |
| State Government Employees | 246 | 1.7% |
| Federal Government Employees | 175 | 1.2% |
| Unpaid Family Workers | 31 | 0.2% |
| Total | 14,809 | 100.0% |
Employment Status by Age in Williston
According to the labor force statistics for Williston, out of the total population over 16 years of age (20,153), 76.8% or 15,478 individuals are in the labor force, with 2.9% or 449 of them unemployed. The age group with the highest labor force participation rate is 20 to 24 years, with 90.1% or 1,587 individuals in the labor force. Within the labor force, the 20 to 24 years age range has the highest percentage of unemployed individuals, with 8.9% or 141 of them being unemployed.
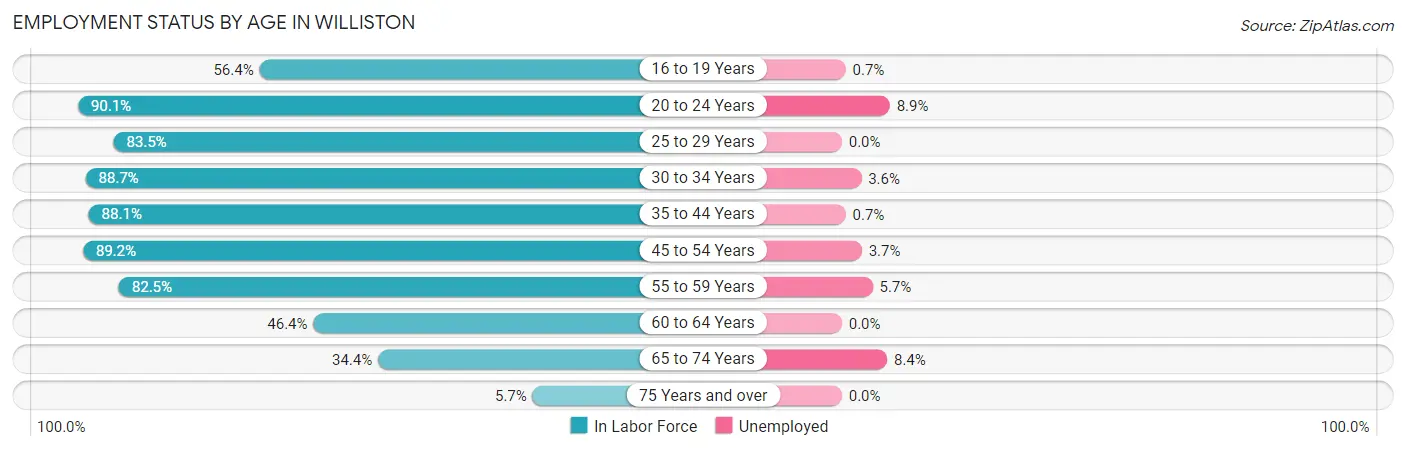
| Age Bracket | In Labor Force | Unemployed |
| 16 to 19 Years | 581 (56.4%) | 4 (0.7%) |
| 20 to 24 Years | 1,587 (90.1%) | 141 (8.9%) |
| 25 to 29 Years | 2,245 (83.5%) | 0 (0.0%) |
| 30 to 34 Years | 2,281 (88.7%) | 82 (3.6%) |
| 35 to 44 Years | 4,267 (88.1%) | 30 (0.7%) |
| 45 to 54 Years | 2,540 (89.2%) | 94 (3.7%) |
| 55 to 59 Years | 1,030 (82.5%) | 59 (5.7%) |
| 60 to 64 Years | 450 (46.4%) | 0 (0.0%) |
| 65 to 74 Years | 454 (34.4%) | 38 (8.4%) |
| 75 Years and over | 50 (5.7%) | 0 (0.0%) |
| Total | 15,478 (76.8%) | 449 (2.9%) |
Employment Status by Educational Attainment in Williston
According to labor force statistics for Williston, 84.5% of individuals (12,818) out of the total population between 25 and 64 years of age (15,169) are in the labor force, with 2.1% or 269 of them being unemployed. The group with the highest labor force participation rate are those with the educational attainment of bachelor's degree or higher, with 93.0% or 3,616 individuals in the labor force. Within the labor force, individuals with college / associate degree education have the highest percentage of unemployment, with 4.1% or 173 of them being unemployed.
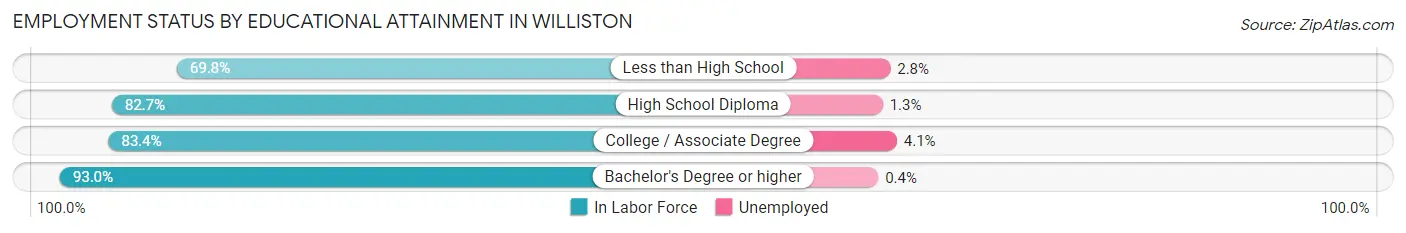
| Educational Attainment | In Labor Force | Unemployed |
| Less than High School | 900 (69.8%) | 36 (2.8%) |
| High School Diploma | 4,076 (82.7%) | 64 (1.3%) |
| College / Associate Degree | 4,223 (83.4%) | 208 (4.1%) |
| Bachelor's Degree or higher | 3,616 (93.0%) | 16 (0.4%) |
| Total | 12,818 (84.5%) | 319 (2.1%) |
Employment Occupations by Sex in Williston
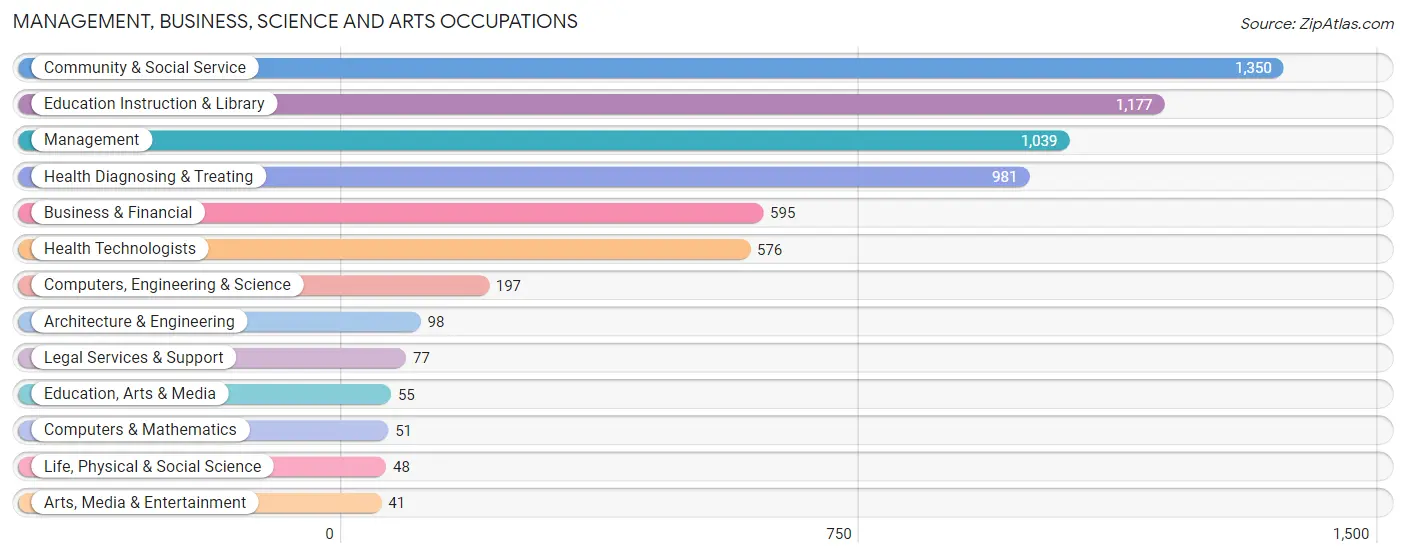
Management, Business, Science and Arts Occupations
The most common Management, Business, Science and Arts occupations in Williston are Community & Social Service (1,350 | 9.0%), Education Instruction & Library (1,177 | 7.8%), Management (1,039 | 6.9%), Health Diagnosing & Treating (981 | 6.5%), and Business & Financial (595 | 4.0%).
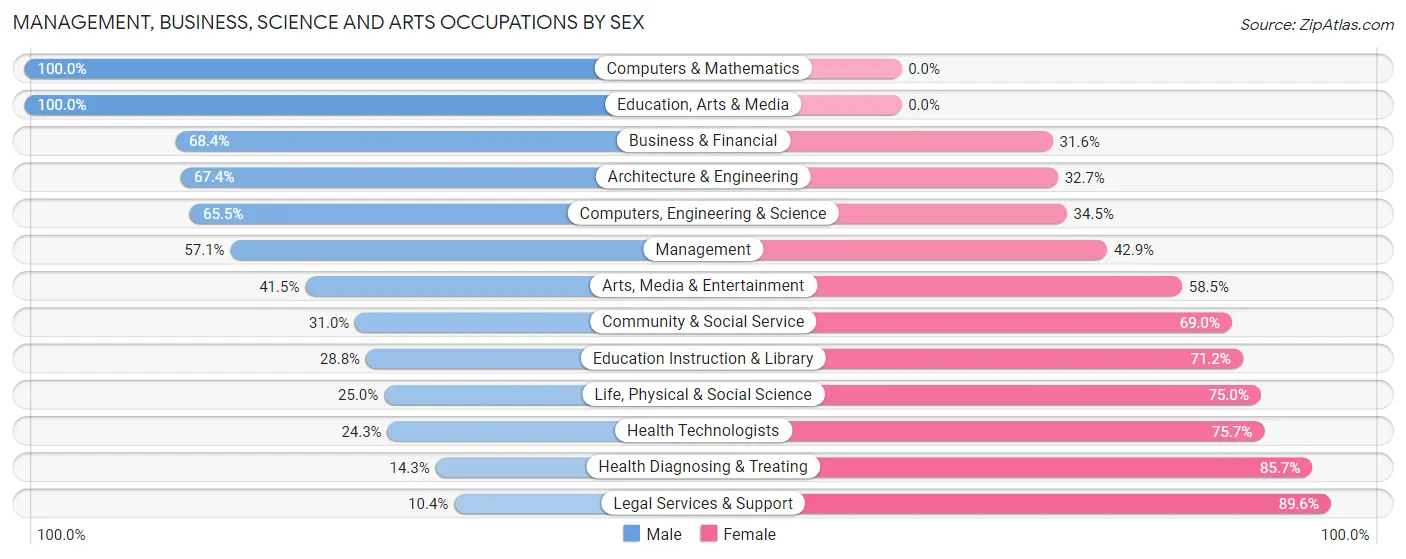
Management, Business, Science and Arts Occupations by Sex
Within the Management, Business, Science and Arts occupations in Williston, the most male-oriented occupations are Computers & Mathematics (100.0%), Education, Arts & Media (100.0%), and Business & Financial (68.4%), while the most female-oriented occupations are Legal Services & Support (89.6%), Health Diagnosing & Treating (85.7%), and Health Technologists (75.7%).
| Occupation | Male | Female |
| Management | 593 (57.1%) | 446 (42.9%) |
| Business & Financial | 407 (68.4%) | 188 (31.6%) |
| Computers, Engineering & Science | 129 (65.5%) | 68 (34.5%) |
| Computers & Mathematics | 51 (100.0%) | 0 (0.0%) |
| Architecture & Engineering | 66 (67.3%) | 32 (32.7%) |
| Life, Physical & Social Science | 12 (25.0%) | 36 (75.0%) |
| Community & Social Service | 419 (31.0%) | 931 (69.0%) |
| Education, Arts & Media | 55 (100.0%) | 0 (0.0%) |
| Legal Services & Support | 8 (10.4%) | 69 (89.6%) |
| Education Instruction & Library | 339 (28.8%) | 838 (71.2%) |
| Arts, Media & Entertainment | 17 (41.5%) | 24 (58.5%) |
| Health Diagnosing & Treating | 140 (14.3%) | 841 (85.7%) |
| Health Technologists | 140 (24.3%) | 436 (75.7%) |
| Total (Category) | 1,688 (40.6%) | 2,474 (59.4%) |
| Total (Overall) | 8,702 (57.9%) | 6,328 (42.1%) |
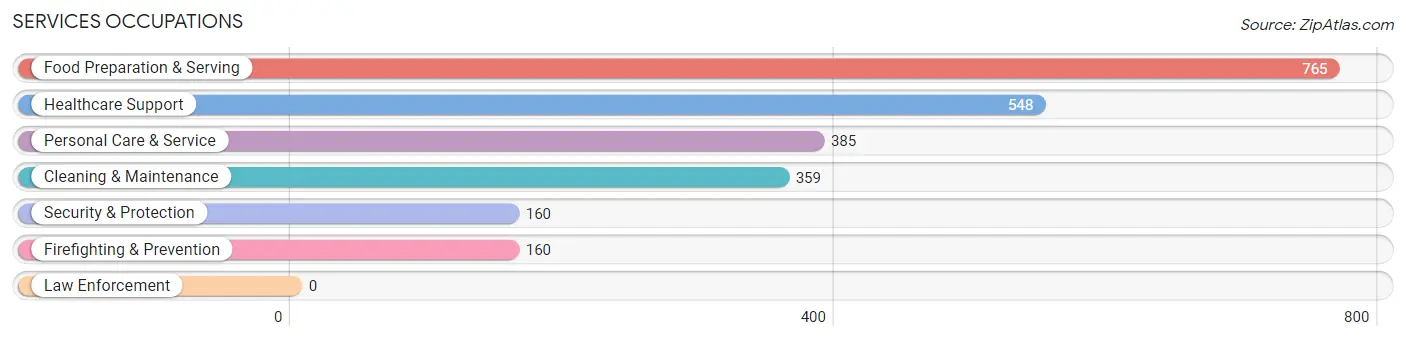
Services Occupations
The most common Services occupations in Williston are Food Preparation & Serving (765 | 5.1%), Healthcare Support (548 | 3.6%), Personal Care & Service (385 | 2.6%), Cleaning & Maintenance (359 | 2.4%), and Security & Protection (160 | 1.1%).
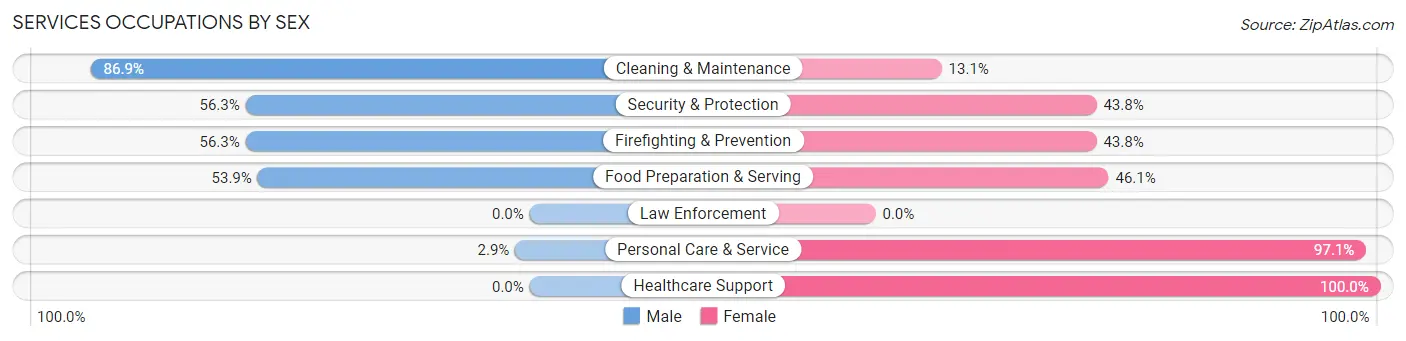
Services Occupations by Sex
Within the Services occupations in Williston, the most male-oriented occupations are Cleaning & Maintenance (86.9%), Security & Protection (56.2%), and Firefighting & Prevention (56.2%), while the most female-oriented occupations are Healthcare Support (100.0%), Personal Care & Service (97.1%), and Food Preparation & Serving (46.1%).
| Occupation | Male | Female |
| Healthcare Support | 0 (0.0%) | 548 (100.0%) |
| Security & Protection | 90 (56.2%) | 70 (43.8%) |
| Firefighting & Prevention | 90 (56.2%) | 70 (43.8%) |
| Law Enforcement | 0 (0.0%) | 0 (0.0%) |
| Food Preparation & Serving | 412 (53.9%) | 353 (46.1%) |
| Cleaning & Maintenance | 312 (86.9%) | 47 (13.1%) |
| Personal Care & Service | 11 (2.9%) | 374 (97.1%) |
| Total (Category) | 825 (37.2%) | 1,392 (62.8%) |
| Total (Overall) | 8,702 (57.9%) | 6,328 (42.1%) |
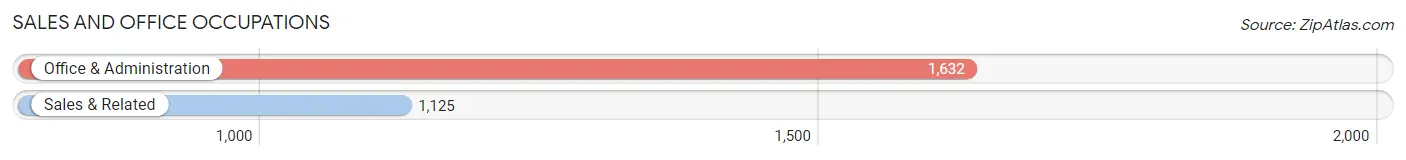
Sales and Office Occupations
The most common Sales and Office occupations in Williston are Office & Administration (1,632 | 10.9%), and Sales & Related (1,125 | 7.5%).
Sales and Office Occupations by Sex
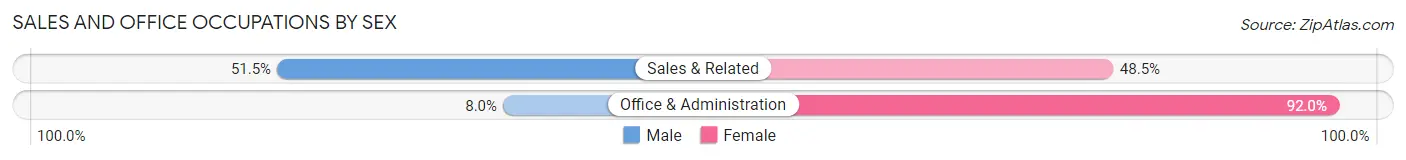
| Occupation | Male | Female |
| Sales & Related | 579 (51.5%) | 546 (48.5%) |
| Office & Administration | 131 (8.0%) | 1,501 (92.0%) |
| Total (Category) | 710 (25.8%) | 2,047 (74.3%) |
| Total (Overall) | 8,702 (57.9%) | 6,328 (42.1%) |
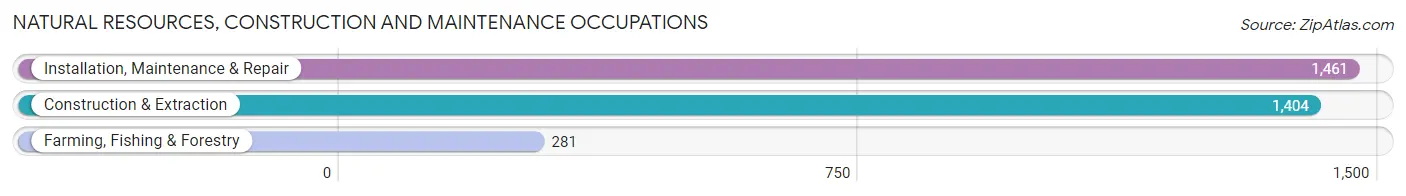
Natural Resources, Construction and Maintenance Occupations
The most common Natural Resources, Construction and Maintenance occupations in Williston are Installation, Maintenance & Repair (1,461 | 9.7%), Construction & Extraction (1,404 | 9.3%), and Farming, Fishing & Forestry (281 | 1.9%).
Natural Resources, Construction and Maintenance Occupations by Sex
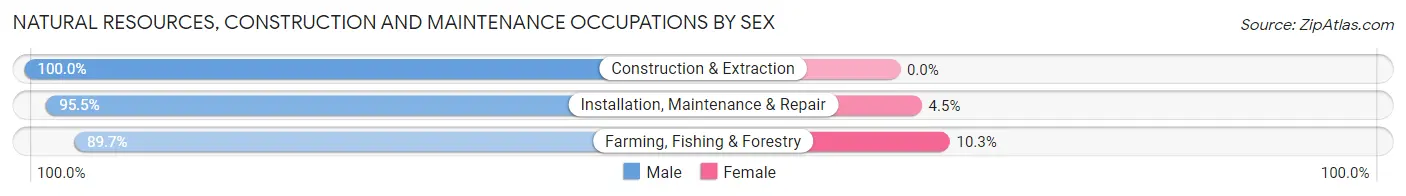
| Occupation | Male | Female |
| Farming, Fishing & Forestry | 252 (89.7%) | 29 (10.3%) |
| Construction & Extraction | 1,404 (100.0%) | 0 (0.0%) |
| Installation, Maintenance & Repair | 1,395 (95.5%) | 66 (4.5%) |
| Total (Category) | 3,051 (97.0%) | 95 (3.0%) |
| Total (Overall) | 8,702 (57.9%) | 6,328 (42.1%) |
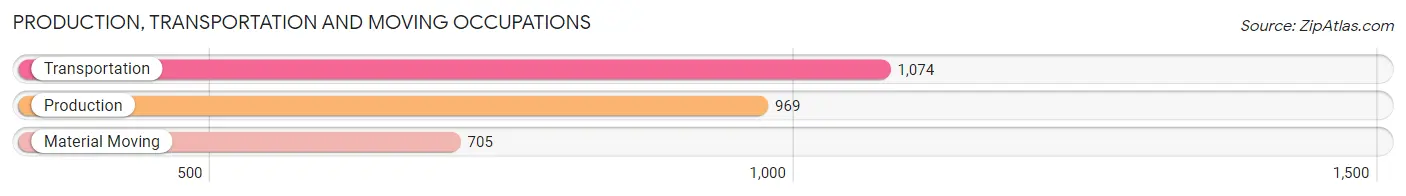
Production, Transportation and Moving Occupations
The most common Production, Transportation and Moving occupations in Williston are Transportation (1,074 | 7.1%), Production (969 | 6.5%), and Material Moving (705 | 4.7%).
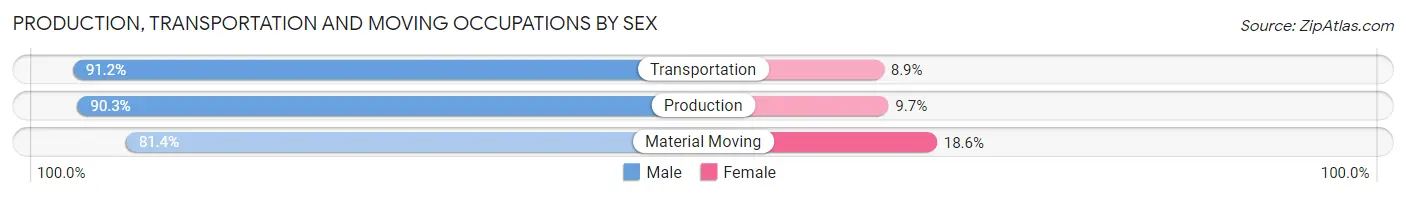
Production, Transportation and Moving Occupations by Sex
| Occupation | Male | Female |
| Production | 875 (90.3%) | 94 (9.7%) |
| Transportation | 979 (91.1%) | 95 (8.8%) |
| Material Moving | 574 (81.4%) | 131 (18.6%) |
| Total (Category) | 2,428 (88.4%) | 320 (11.6%) |
| Total (Overall) | 8,702 (57.9%) | 6,328 (42.1%) |
Employment Industries by Sex in Williston
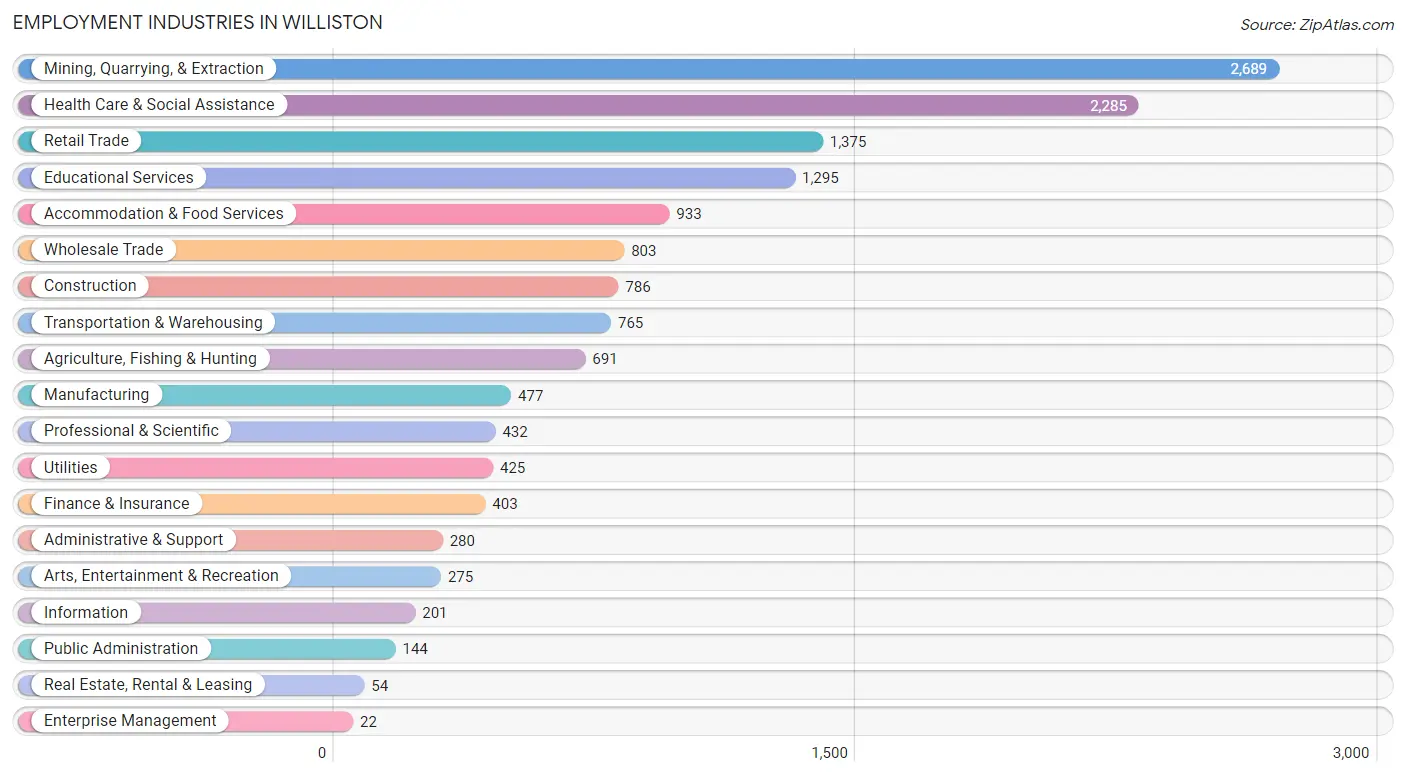
Employment Industries in Williston
The major employment industries in Williston include Mining, Quarrying, & Extraction (2,689 | 17.9%), Health Care & Social Assistance (2,285 | 15.2%), Retail Trade (1,375 | 9.1%), Educational Services (1,295 | 8.6%), and Accommodation & Food Services (933 | 6.2%).
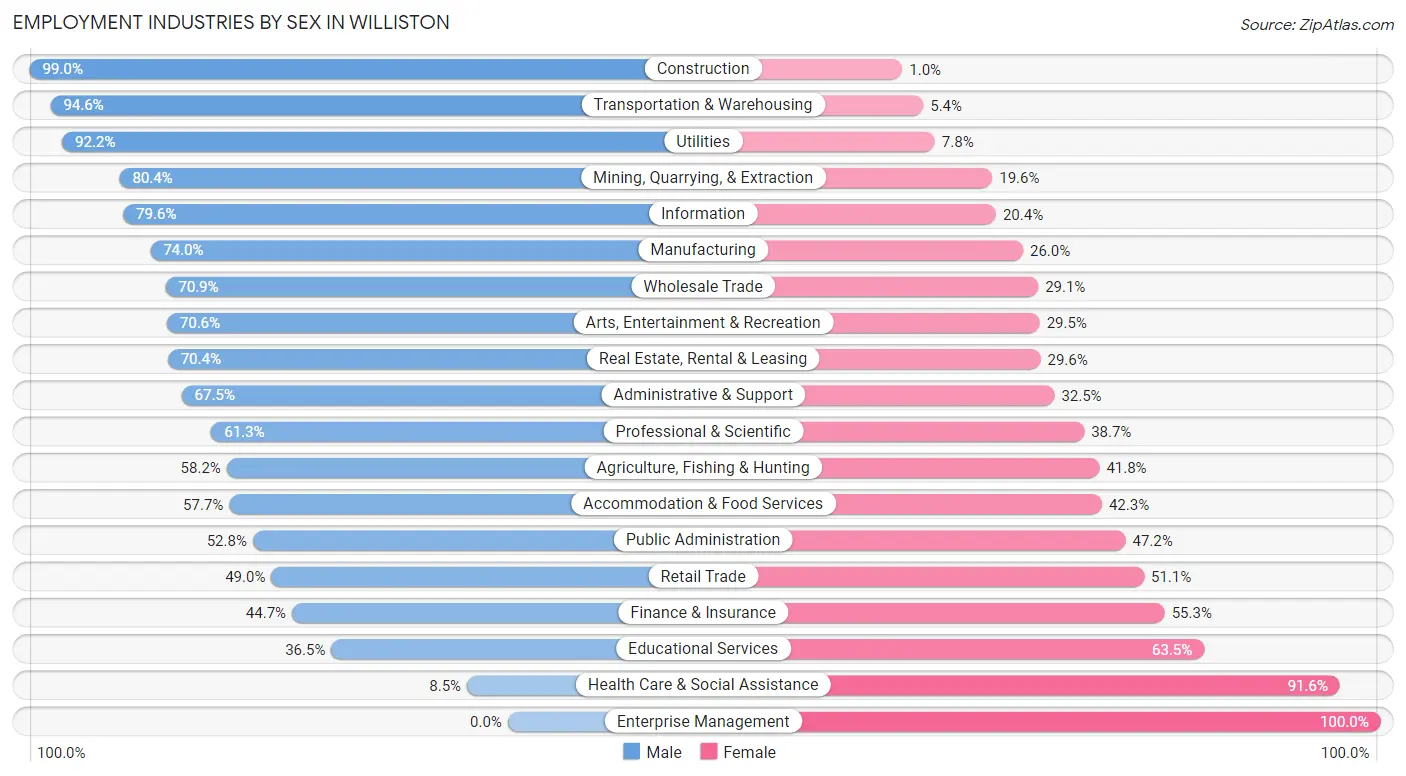
Employment Industries by Sex in Williston
The Williston industries that see more men than women are Construction (99.0%), Transportation & Warehousing (94.6%), and Utilities (92.2%), whereas the industries that tend to have a higher number of women are Enterprise Management (100.0%), Health Care & Social Assistance (91.5%), and Educational Services (63.5%).
| Industry | Male | Female |
| Agriculture, Fishing & Hunting | 402 (58.2%) | 289 (41.8%) |
| Mining, Quarrying, & Extraction | 2,161 (80.4%) | 528 (19.6%) |
| Construction | 778 (99.0%) | 8 (1.0%) |
| Manufacturing | 353 (74.0%) | 124 (26.0%) |
| Wholesale Trade | 569 (70.9%) | 234 (29.1%) |
| Retail Trade | 673 (48.9%) | 702 (51.0%) |
| Transportation & Warehousing | 724 (94.6%) | 41 (5.4%) |
| Utilities | 392 (92.2%) | 33 (7.8%) |
| Information | 160 (79.6%) | 41 (20.4%) |
| Finance & Insurance | 180 (44.7%) | 223 (55.3%) |
| Real Estate, Rental & Leasing | 38 (70.4%) | 16 (29.6%) |
| Professional & Scientific | 265 (61.3%) | 167 (38.7%) |
| Enterprise Management | 0 (0.0%) | 22 (100.0%) |
| Administrative & Support | 189 (67.5%) | 91 (32.5%) |
| Educational Services | 473 (36.5%) | 822 (63.5%) |
| Health Care & Social Assistance | 193 (8.5%) | 2,092 (91.5%) |
| Arts, Entertainment & Recreation | 194 (70.6%) | 81 (29.4%) |
| Accommodation & Food Services | 538 (57.7%) | 395 (42.3%) |
| Public Administration | 76 (52.8%) | 68 (47.2%) |
| Total | 8,702 (57.9%) | 6,328 (42.1%) |
Education in Williston
School Enrollment in Williston
The most common levels of schooling among the 7,025 students in Williston are middle school (1,902 | 27.1%), elementary school (1,623 | 23.1%), and high school (1,363 | 19.4%).
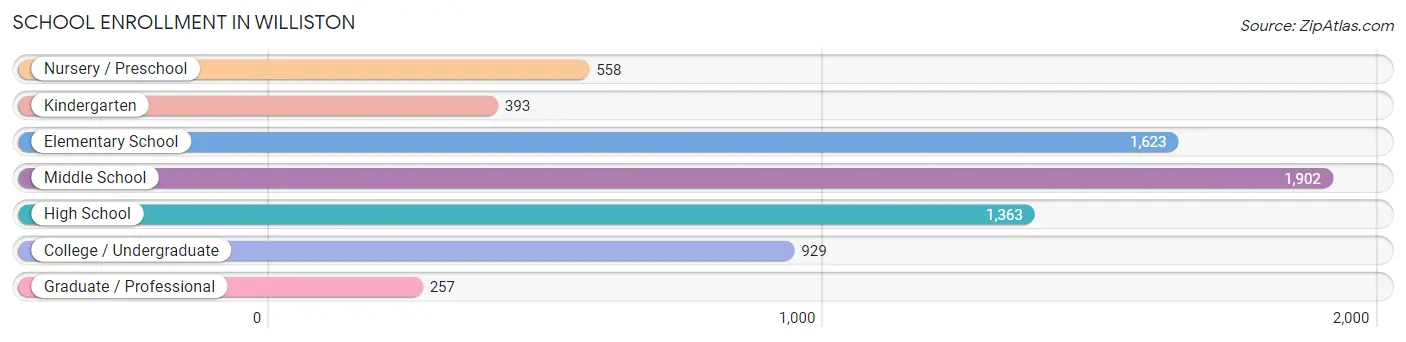
| School Level | # Students | % Students |
| Nursery / Preschool | 558 | 7.9% |
| Kindergarten | 393 | 5.6% |
| Elementary School | 1,623 | 23.1% |
| Middle School | 1,902 | 27.1% |
| High School | 1,363 | 19.4% |
| College / Undergraduate | 929 | 13.2% |
| Graduate / Professional | 257 | 3.7% |
| Total | 7,025 | 100.0% |
School Enrollment by Age by Funding Source in Williston
Out of a total of 7,025 students who are enrolled in schools in Williston, 611 (8.7%) attend a private institution, while the remaining 6,414 (91.3%) are enrolled in public schools. The age group of 25 to 34 year olds has the highest likelihood of being enrolled in private schools, with 53 (31.7% in the age bracket) enrolled. Conversely, the age group of 18 to 19 year olds has the lowest likelihood of being enrolled in a private school, with 458 (100.0% in the age bracket) attending a public institution.
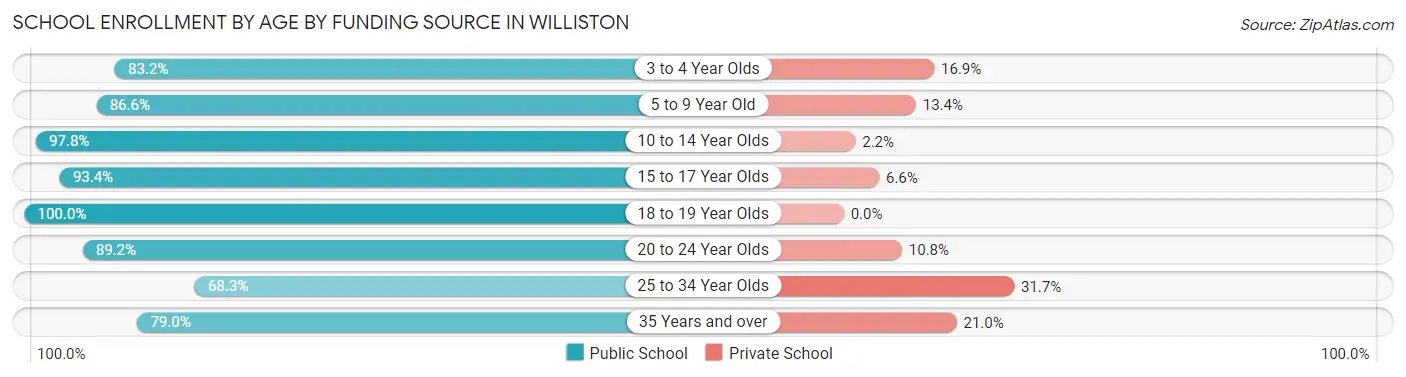
| Age Bracket | Public School | Private School |
| 3 to 4 Year Olds | 301 (83.2%) | 61 (16.9%) |
| 5 to 9 Year Old | 1,629 (86.6%) | 253 (13.4%) |
| 10 to 14 Year Olds | 2,403 (97.8%) | 53 (2.2%) |
| 15 to 17 Year Olds | 851 (93.4%) | 60 (6.6%) |
| 18 to 19 Year Olds | 458 (100.0%) | 0 (0.0%) |
| 20 to 24 Year Olds | 288 (89.2%) | 35 (10.8%) |
| 25 to 34 Year Olds | 114 (68.3%) | 53 (31.7%) |
| 35 Years and over | 368 (79.0%) | 98 (21.0%) |
| Total | 6,414 (91.3%) | 611 (8.7%) |
Educational Attainment by Field of Study in Williston
Business (1,060 | 21.7%), education (735 | 15.0%), arts & humanities (571 | 11.7%), science & technology (565 | 11.6%), and social sciences (365 | 7.5%) are the most common fields of study among 4,889 individuals in Williston who have obtained a bachelor's degree or higher.
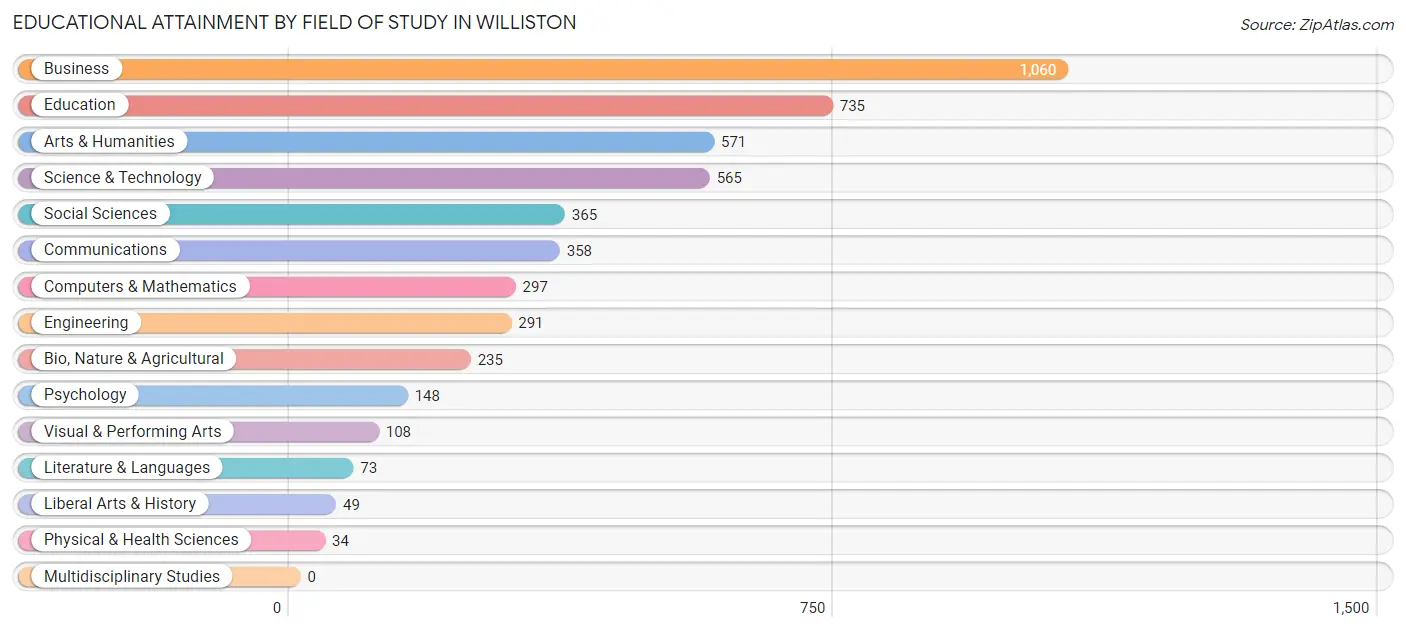
| Field of Study | # Graduates | % Graduates |
| Computers & Mathematics | 297 | 6.1% |
| Bio, Nature & Agricultural | 235 | 4.8% |
| Physical & Health Sciences | 34 | 0.7% |
| Psychology | 148 | 3.0% |
| Social Sciences | 365 | 7.5% |
| Engineering | 291 | 5.9% |
| Multidisciplinary Studies | 0 | 0.0% |
| Science & Technology | 565 | 11.6% |
| Business | 1,060 | 21.7% |
| Education | 735 | 15.0% |
| Literature & Languages | 73 | 1.5% |
| Liberal Arts & History | 49 | 1.0% |
| Visual & Performing Arts | 108 | 2.2% |
| Communications | 358 | 7.3% |
| Arts & Humanities | 571 | 11.7% |
| Total | 4,889 | 100.0% |
Transportation & Commute in Williston
Vehicle Availability by Sex in Williston
The most prevalent vehicle ownership categories in Williston are males with 2 vehicles (3,890, accounting for 45.4%) and females with 2 vehicles (3,183, making up 63.4%).
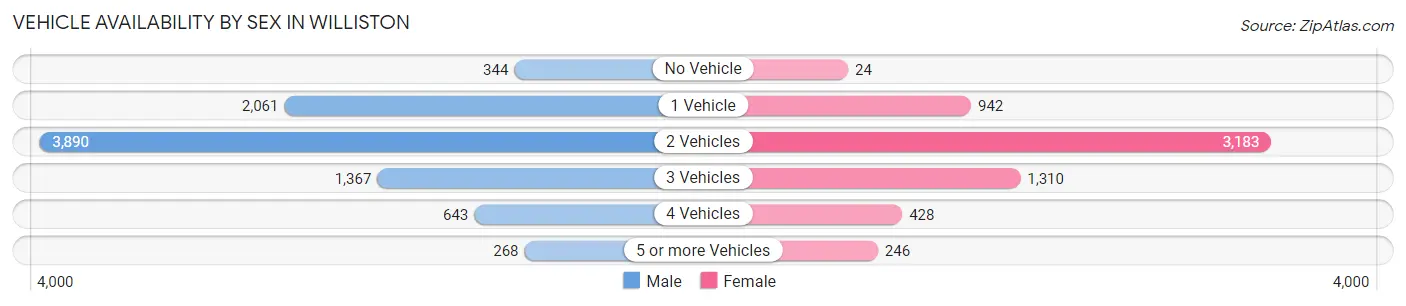
| Vehicles Available | Male | Female |
| No Vehicle | 344 (4.0%) | 24 (0.4%) |
| 1 Vehicle | 2,061 (24.0%) | 942 (15.4%) |
| 2 Vehicles | 3,890 (45.4%) | 3,183 (51.9%) |
| 3 Vehicles | 1,367 (16.0%) | 1,310 (21.4%) |
| 4 Vehicles | 643 (7.5%) | 428 (7.0%) |
| 5 or more Vehicles | 268 (3.1%) | 246 (4.0%) |
| Total | 8,573 (100.0%) | 6,133 (100.0%) |
Commute Time in Williston
The most frequently occuring commute durations in Williston are 10 to 14 minutes (4,174 commuters, 28.9%), 15 to 19 minutes (3,753 commuters, 26.0%), and 5 to 9 minutes (3,307 commuters, 22.9%).
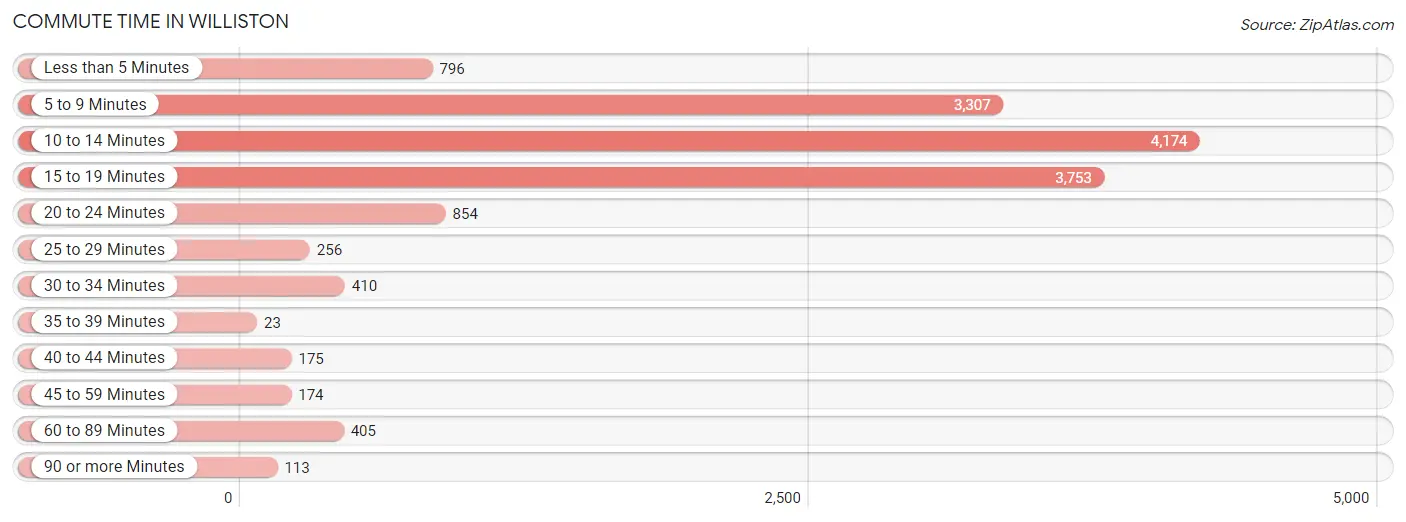
| Commute Time | # Commuters | % Commuters |
| Less than 5 Minutes | 796 | 5.5% |
| 5 to 9 Minutes | 3,307 | 22.9% |
| 10 to 14 Minutes | 4,174 | 28.9% |
| 15 to 19 Minutes | 3,753 | 26.0% |
| 20 to 24 Minutes | 854 | 5.9% |
| 25 to 29 Minutes | 256 | 1.8% |
| 30 to 34 Minutes | 410 | 2.8% |
| 35 to 39 Minutes | 23 | 0.2% |
| 40 to 44 Minutes | 175 | 1.2% |
| 45 to 59 Minutes | 174 | 1.2% |
| 60 to 89 Minutes | 405 | 2.8% |
| 90 or more Minutes | 113 | 0.8% |
Commute Time by Sex in Williston
The most common commute times in Williston are 15 to 19 minutes (2,765 commuters, 33.2%) for males and 10 to 14 minutes (2,155 commuters, 35.3%) for females.
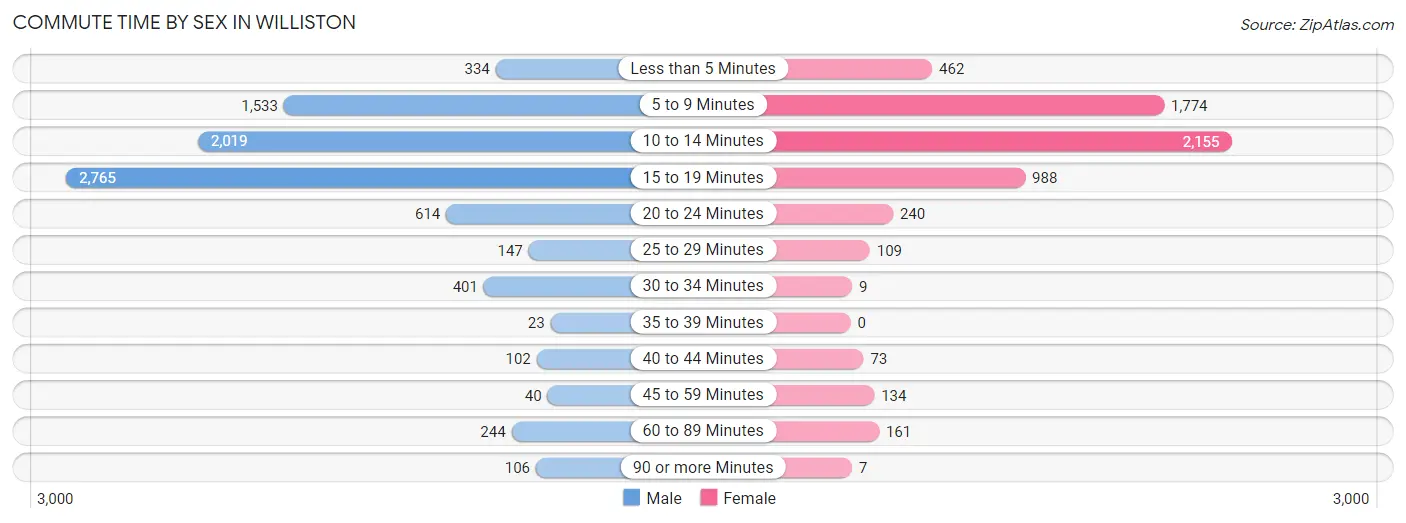
| Commute Time | Male | Female |
| Less than 5 Minutes | 334 (4.0%) | 462 (7.6%) |
| 5 to 9 Minutes | 1,533 (18.4%) | 1,774 (29.0%) |
| 10 to 14 Minutes | 2,019 (24.2%) | 2,155 (35.3%) |
| 15 to 19 Minutes | 2,765 (33.2%) | 988 (16.2%) |
| 20 to 24 Minutes | 614 (7.4%) | 240 (3.9%) |
| 25 to 29 Minutes | 147 (1.8%) | 109 (1.8%) |
| 30 to 34 Minutes | 401 (4.8%) | 9 (0.2%) |
| 35 to 39 Minutes | 23 (0.3%) | 0 (0.0%) |
| 40 to 44 Minutes | 102 (1.2%) | 73 (1.2%) |
| 45 to 59 Minutes | 40 (0.5%) | 134 (2.2%) |
| 60 to 89 Minutes | 244 (2.9%) | 161 (2.6%) |
| 90 or more Minutes | 106 (1.3%) | 7 (0.1%) |
Time of Departure to Work by Sex in Williston
The most frequent times of departure to work in Williston are 7:30 AM to 7:59 AM (1,814, 21.8%) for males and 7:30 AM to 7:59 AM (1,904, 31.1%) for females.
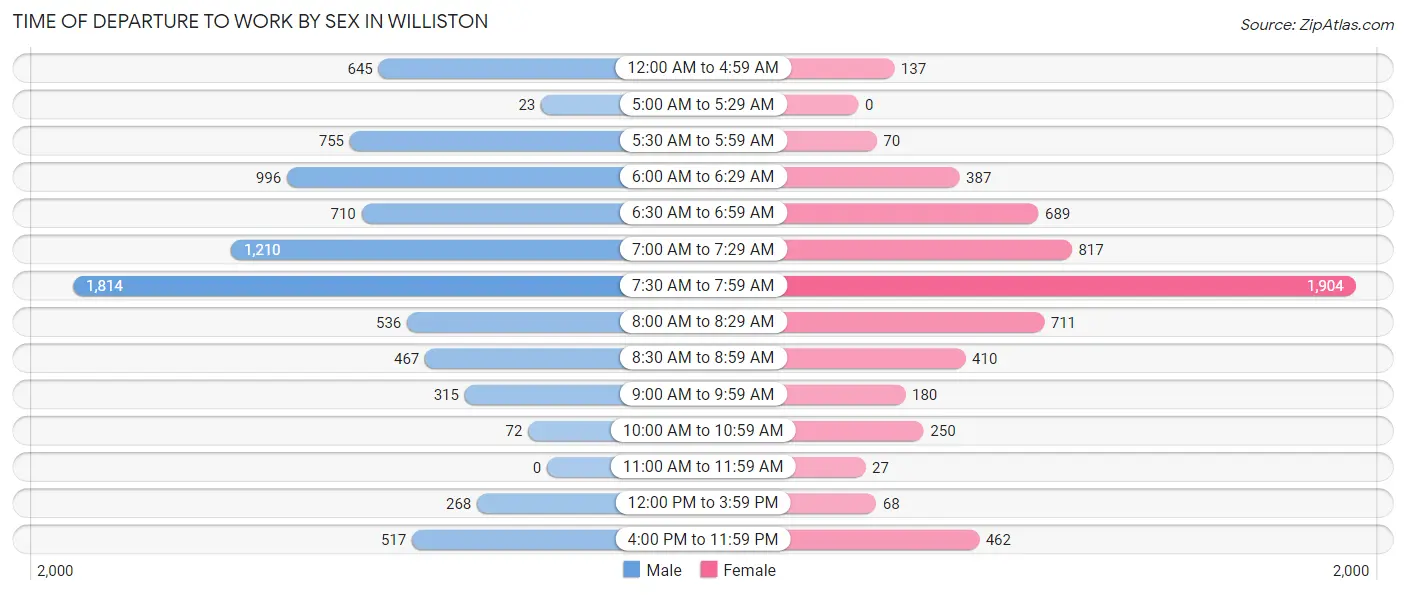
| Time of Departure | Male | Female |
| 12:00 AM to 4:59 AM | 645 (7.7%) | 137 (2.2%) |
| 5:00 AM to 5:29 AM | 23 (0.3%) | 0 (0.0%) |
| 5:30 AM to 5:59 AM | 755 (9.1%) | 70 (1.1%) |
| 6:00 AM to 6:29 AM | 996 (12.0%) | 387 (6.3%) |
| 6:30 AM to 6:59 AM | 710 (8.5%) | 689 (11.3%) |
| 7:00 AM to 7:29 AM | 1,210 (14.5%) | 817 (13.4%) |
| 7:30 AM to 7:59 AM | 1,814 (21.8%) | 1,904 (31.1%) |
| 8:00 AM to 8:29 AM | 536 (6.4%) | 711 (11.6%) |
| 8:30 AM to 8:59 AM | 467 (5.6%) | 410 (6.7%) |
| 9:00 AM to 9:59 AM | 315 (3.8%) | 180 (2.9%) |
| 10:00 AM to 10:59 AM | 72 (0.9%) | 250 (4.1%) |
| 11:00 AM to 11:59 AM | 0 (0.0%) | 27 (0.4%) |
| 12:00 PM to 3:59 PM | 268 (3.2%) | 68 (1.1%) |
| 4:00 PM to 11:59 PM | 517 (6.2%) | 462 (7.6%) |
| Total | 8,328 (100.0%) | 6,112 (100.0%) |
Housing Occupancy in Williston
Occupancy by Ownership in Williston
Of the total 11,410 dwellings in Williston, owner-occupied units account for 5,198 (45.6%), while renter-occupied units make up 6,212 (54.4%).
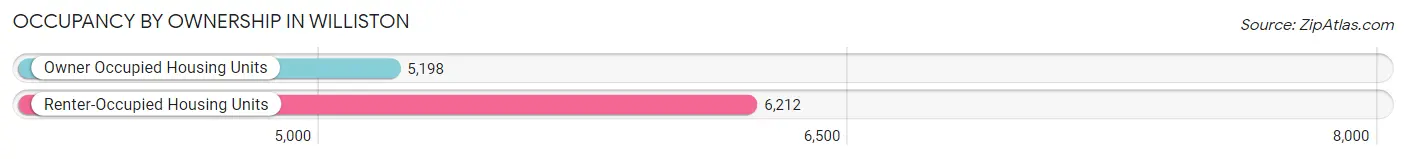
| Occupancy | # Housing Units | % Housing Units |
| Owner Occupied Housing Units | 5,198 | 45.6% |
| Renter-Occupied Housing Units | 6,212 | 54.4% |
| Total Occupied Housing Units | 11,410 | 100.0% |
Occupancy by Household Size in Williston
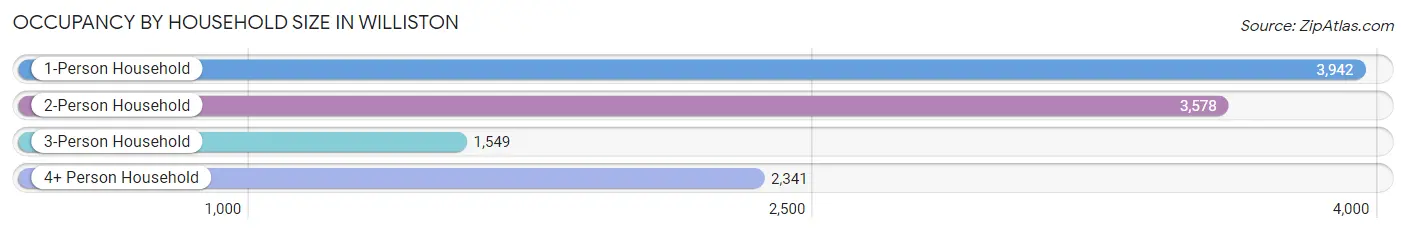
| Household Size | # Housing Units | % Housing Units |
| 1-Person Household | 3,942 | 34.5% |
| 2-Person Household | 3,578 | 31.4% |
| 3-Person Household | 1,549 | 13.6% |
| 4+ Person Household | 2,341 | 20.5% |
| Total Housing Units | 11,410 | 100.0% |
Occupancy by Ownership by Household Size in Williston
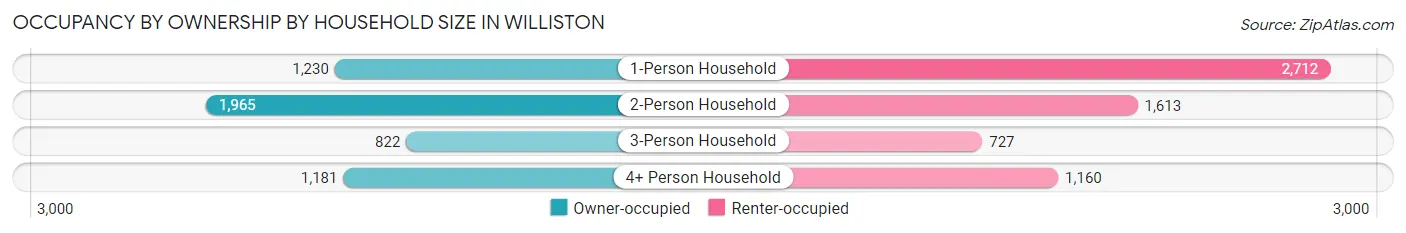
| Household Size | Owner-occupied | Renter-occupied |
| 1-Person Household | 1,230 (31.2%) | 2,712 (68.8%) |
| 2-Person Household | 1,965 (54.9%) | 1,613 (45.1%) |
| 3-Person Household | 822 (53.1%) | 727 (46.9%) |
| 4+ Person Household | 1,181 (50.4%) | 1,160 (49.5%) |
| Total Housing Units | 5,198 (45.6%) | 6,212 (54.4%) |
Occupancy by Educational Attainment in Williston
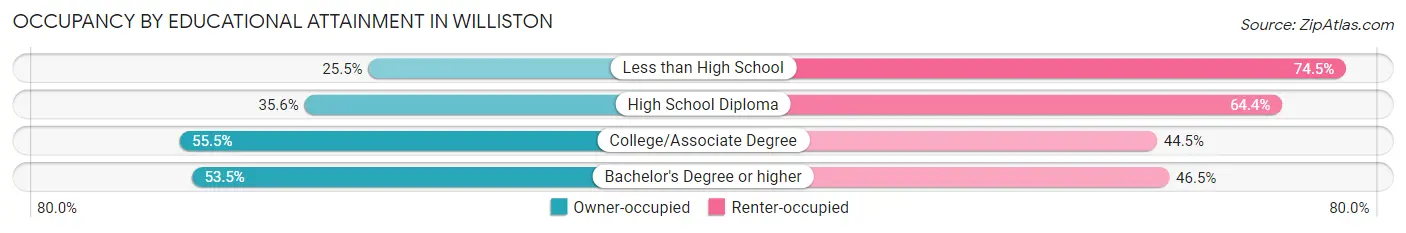
| Household Size | Owner-occupied | Renter-occupied |
| Less than High School | 309 (25.5%) | 904 (74.5%) |
| High School Diploma | 1,270 (35.6%) | 2,297 (64.4%) |
| College/Associate Degree | 1,989 (55.5%) | 1,596 (44.5%) |
| Bachelor's Degree or higher | 1,630 (53.5%) | 1,415 (46.5%) |
Occupancy by Age of Householder in Williston
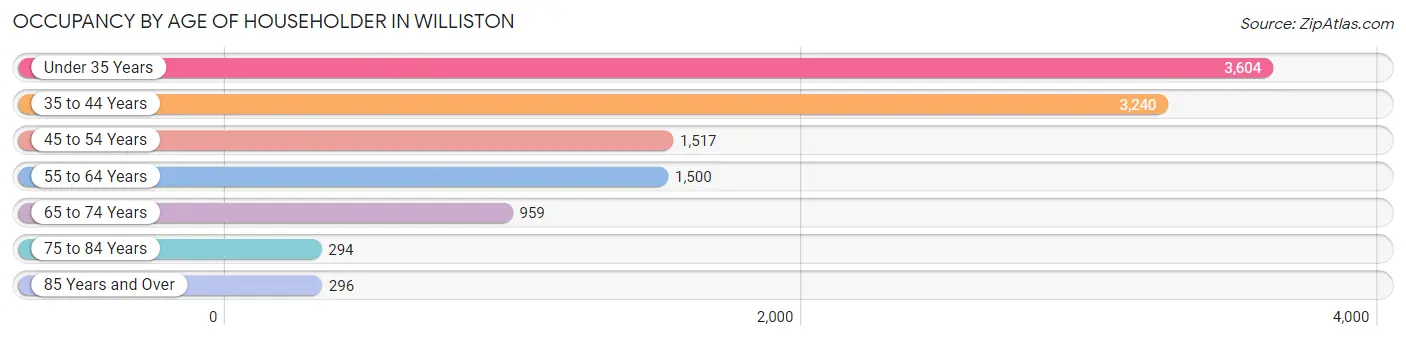
| Age Bracket | # Households | % Households |
| Under 35 Years | 3,604 | 31.6% |
| 35 to 44 Years | 3,240 | 28.4% |
| 45 to 54 Years | 1,517 | 13.3% |
| 55 to 64 Years | 1,500 | 13.2% |
| 65 to 74 Years | 959 | 8.4% |
| 75 to 84 Years | 294 | 2.6% |
| 85 Years and Over | 296 | 2.6% |
| Total | 11,410 | 100.0% |
Housing Finances in Williston
Median Income by Occupancy in Williston
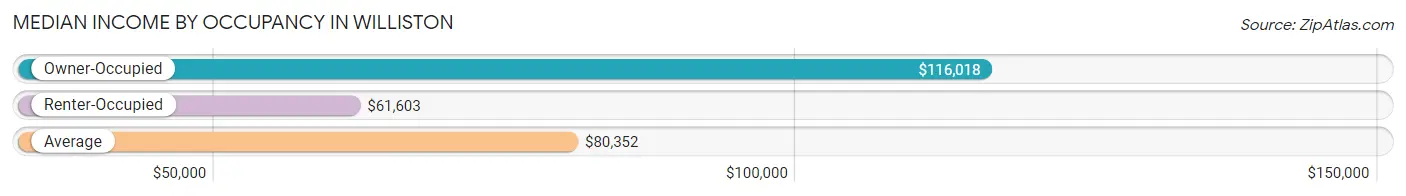
| Occupancy Type | # Households | Median Income |
| Owner-Occupied | 5,198 (45.6%) | $116,018 |
| Renter-Occupied | 6,212 (54.4%) | $61,603 |
| Average | 11,410 (100.0%) | $80,352 |
Occupancy by Householder Income Bracket in Williston
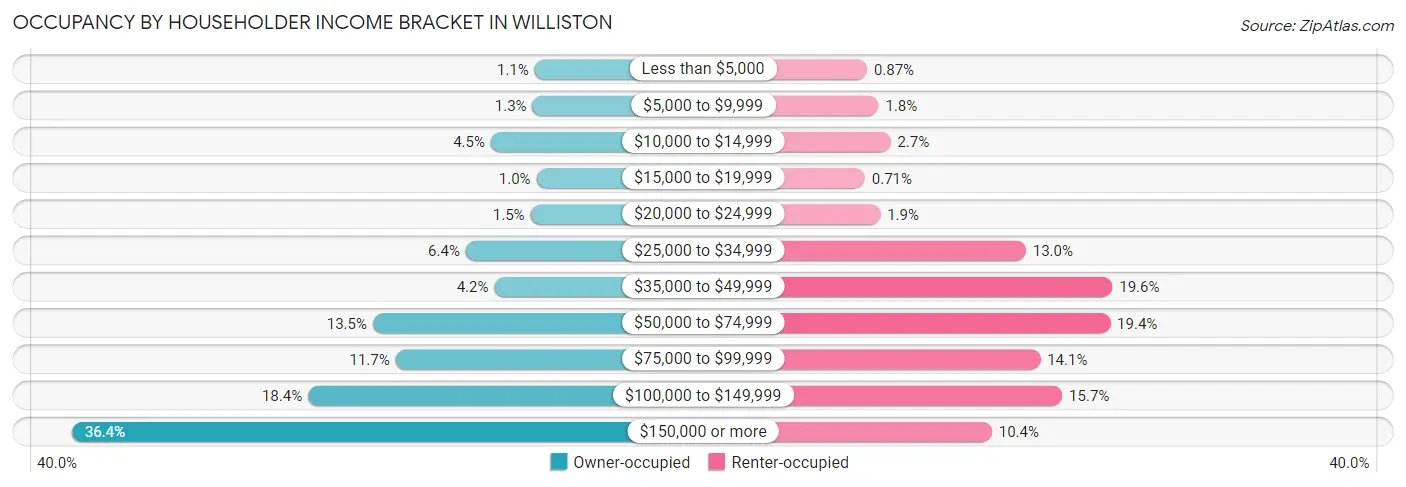
| Income Bracket | Owner-occupied | Renter-occupied |
| Less than $5,000 | 59 (1.1%) | 54 (0.9%) |
| $5,000 to $9,999 | 68 (1.3%) | 109 (1.8%) |
| $10,000 to $14,999 | 233 (4.5%) | 165 (2.7%) |
| $15,000 to $19,999 | 52 (1.0%) | 44 (0.7%) |
| $20,000 to $24,999 | 76 (1.5%) | 117 (1.9%) |
| $25,000 to $34,999 | 332 (6.4%) | 806 (13.0%) |
| $35,000 to $49,999 | 219 (4.2%) | 1,215 (19.6%) |
| $50,000 to $74,999 | 700 (13.5%) | 1,205 (19.4%) |
| $75,000 to $99,999 | 610 (11.7%) | 874 (14.1%) |
| $100,000 to $149,999 | 957 (18.4%) | 978 (15.7%) |
| $150,000 or more | 1,892 (36.4%) | 645 (10.4%) |
| Total | 5,198 (100.0%) | 6,212 (100.0%) |
Monthly Housing Cost Tiers in Williston
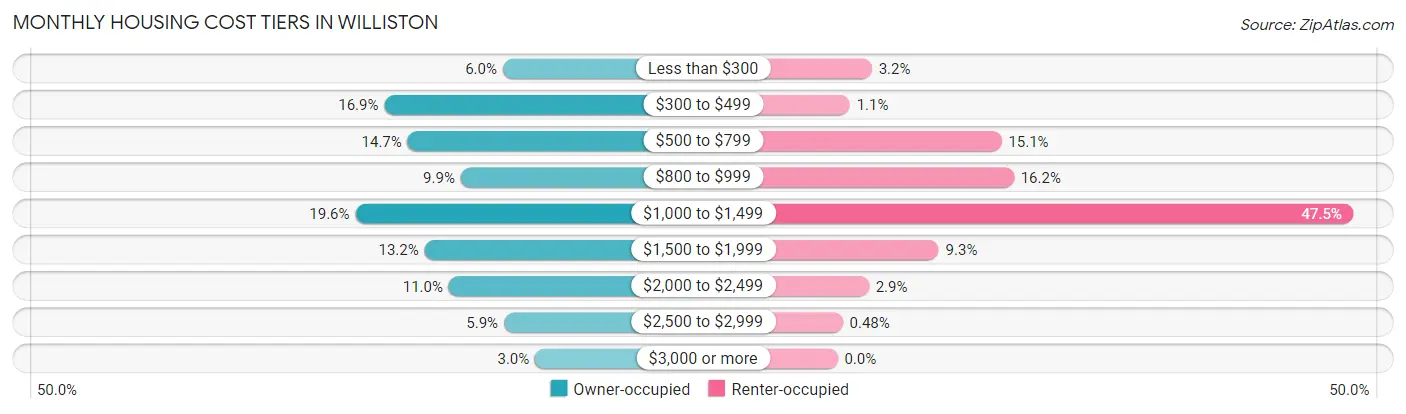
| Monthly Cost | Owner-occupied | Renter-occupied |
| Less than $300 | 311 (6.0%) | 196 (3.2%) |
| $300 to $499 | 878 (16.9%) | 70 (1.1%) |
| $500 to $799 | 766 (14.7%) | 938 (15.1%) |
| $800 to $999 | 512 (9.9%) | 1,008 (16.2%) |
| $1,000 to $1,499 | 1,016 (19.6%) | 2,952 (47.5%) |
| $1,500 to $1,999 | 685 (13.2%) | 579 (9.3%) |
| $2,000 to $2,499 | 569 (11.0%) | 179 (2.9%) |
| $2,500 to $2,999 | 305 (5.9%) | 30 (0.5%) |
| $3,000 or more | 156 (3.0%) | 0 (0.0%) |
| Total | 5,198 (100.0%) | 6,212 (100.0%) |
Physical Housing Characteristics in Williston
Housing Structures in Williston
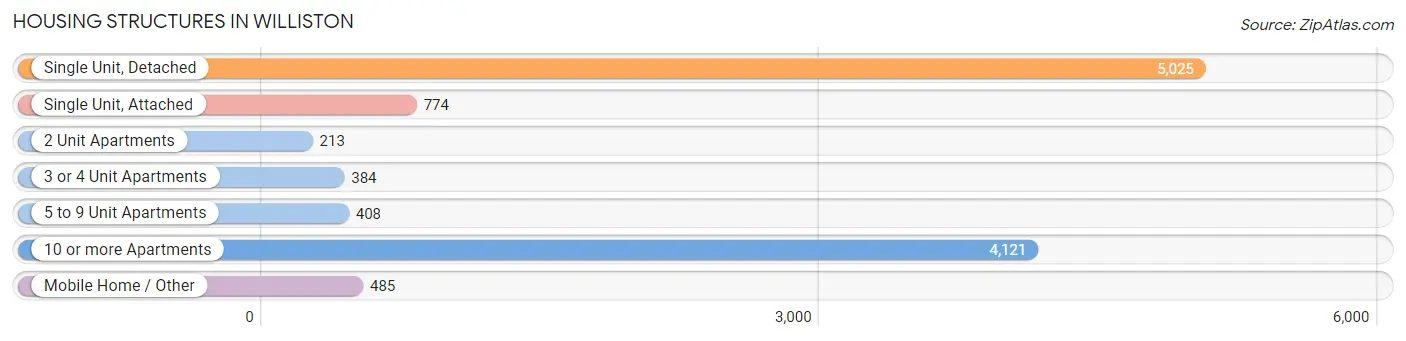
| Structure Type | # Housing Units | % Housing Units |
| Single Unit, Detached | 5,025 | 44.0% |
| Single Unit, Attached | 774 | 6.8% |
| 2 Unit Apartments | 213 | 1.9% |
| 3 or 4 Unit Apartments | 384 | 3.4% |
| 5 to 9 Unit Apartments | 408 | 3.6% |
| 10 or more Apartments | 4,121 | 36.1% |
| Mobile Home / Other | 485 | 4.3% |
| Total | 11,410 | 100.0% |
Housing Structures by Occupancy in Williston
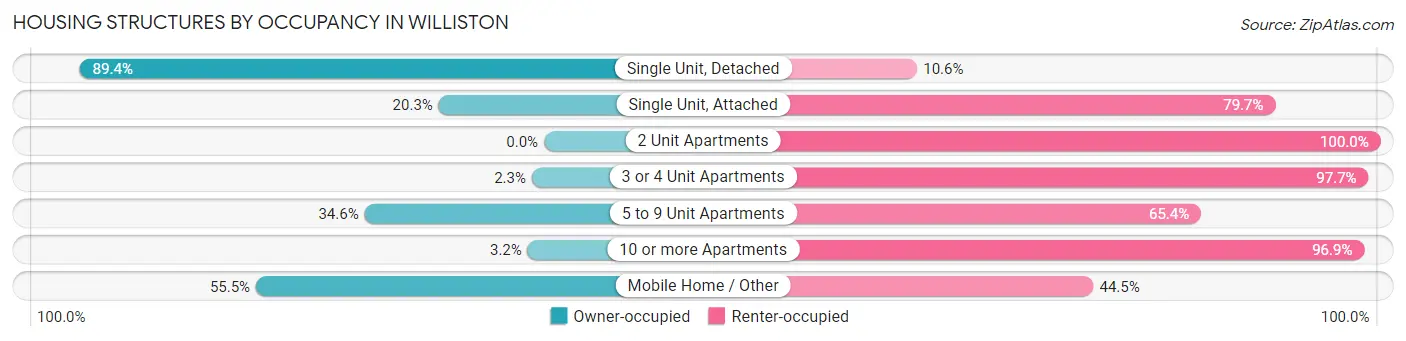
| Structure Type | Owner-occupied | Renter-occupied |
| Single Unit, Detached | 4,492 (89.4%) | 533 (10.6%) |
| Single Unit, Attached | 157 (20.3%) | 617 (79.7%) |
| 2 Unit Apartments | 0 (0.0%) | 213 (100.0%) |
| 3 or 4 Unit Apartments | 9 (2.3%) | 375 (97.7%) |
| 5 to 9 Unit Apartments | 141 (34.6%) | 267 (65.4%) |
| 10 or more Apartments | 130 (3.2%) | 3,991 (96.9%) |
| Mobile Home / Other | 269 (55.5%) | 216 (44.5%) |
| Total | 5,198 (45.6%) | 6,212 (54.4%) |
Housing Structures by Number of Rooms in Williston
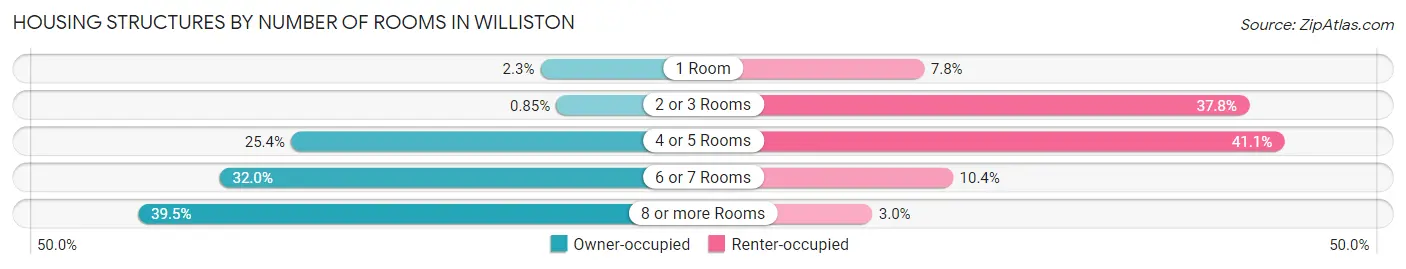
| Number of Rooms | Owner-occupied | Renter-occupied |
| 1 Room | 120 (2.3%) | 482 (7.8%) |
| 2 or 3 Rooms | 44 (0.9%) | 2,349 (37.8%) |
| 4 or 5 Rooms | 1,319 (25.4%) | 2,551 (41.1%) |
| 6 or 7 Rooms | 1,662 (32.0%) | 647 (10.4%) |
| 8 or more Rooms | 2,053 (39.5%) | 183 (2.9%) |
| Total | 5,198 (100.0%) | 6,212 (100.0%) |
Housing Structure by Heating Type in Williston
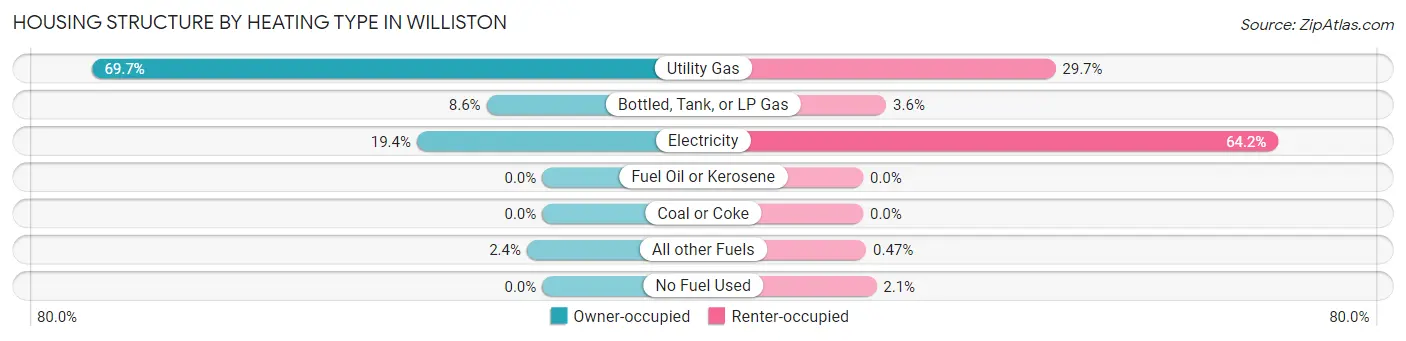
| Heating Type | Owner-occupied | Renter-occupied |
| Utility Gas | 3,621 (69.7%) | 1,847 (29.7%) |
| Bottled, Tank, or LP Gas | 447 (8.6%) | 222 (3.6%) |
| Electricity | 1,007 (19.4%) | 3,986 (64.2%) |
| Fuel Oil or Kerosene | 0 (0.0%) | 0 (0.0%) |
| Coal or Coke | 0 (0.0%) | 0 (0.0%) |
| All other Fuels | 123 (2.4%) | 29 (0.5%) |
| No Fuel Used | 0 (0.0%) | 128 (2.1%) |
| Total | 5,198 (100.0%) | 6,212 (100.0%) |
Household Vehicle Usage in Williston
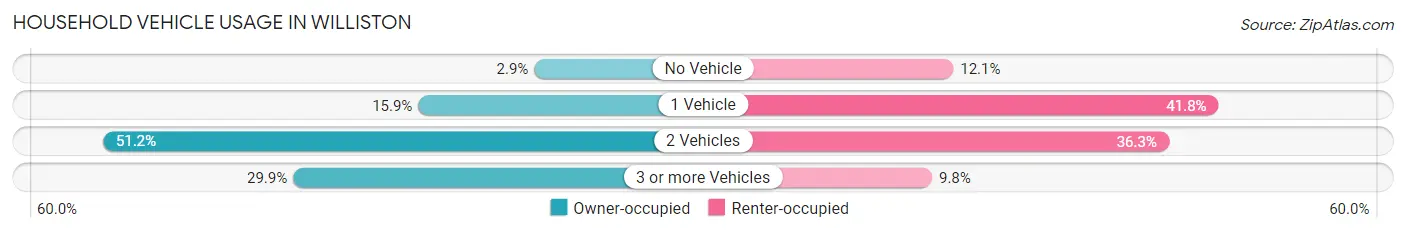
| Vehicles per Household | Owner-occupied | Renter-occupied |
| No Vehicle | 152 (2.9%) | 754 (12.1%) |
| 1 Vehicle | 827 (15.9%) | 2,599 (41.8%) |
| 2 Vehicles | 2,663 (51.2%) | 2,253 (36.3%) |
| 3 or more Vehicles | 1,556 (29.9%) | 606 (9.8%) |
| Total | 5,198 (100.0%) | 6,212 (100.0%) |
Real Estate & Mortgages in Williston
Real Estate and Mortgage Overview in Williston
| Characteristic | Without Mortgage | With Mortgage |
| Housing Units | 2,121 | 3,077 |
| Median Property Value | $216,300 | $267,400 |
| Median Household Income | $68,315 | $1,361 |
| Monthly Housing Costs | $487 | $156 |
| Real Estate Taxes | $1,580 | $135 |
Property Value by Mortgage Status in Williston
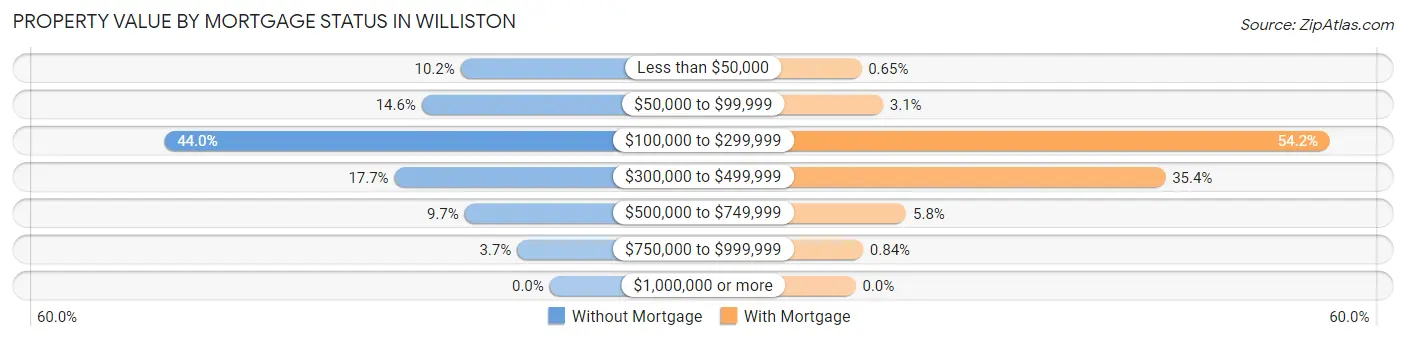
| Property Value | Without Mortgage | With Mortgage |
| Less than $50,000 | 216 (10.2%) | 20 (0.6%) |
| $50,000 to $99,999 | 310 (14.6%) | 96 (3.1%) |
| $100,000 to $299,999 | 934 (44.0%) | 1,668 (54.2%) |
| $300,000 to $499,999 | 376 (17.7%) | 1,089 (35.4%) |
| $500,000 to $749,999 | 206 (9.7%) | 178 (5.8%) |
| $750,000 to $999,999 | 79 (3.7%) | 26 (0.8%) |
| $1,000,000 or more | 0 (0.0%) | 0 (0.0%) |
| Total | 2,121 (100.0%) | 3,077 (100.0%) |
Household Income by Mortgage Status in Williston
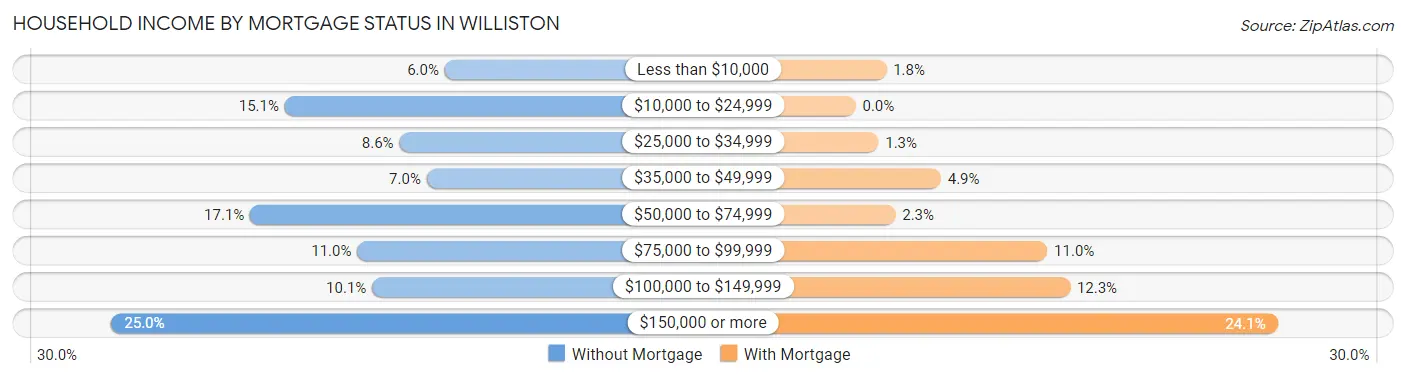
| Household Income | Without Mortgage | With Mortgage |
| Less than $10,000 | 127 (6.0%) | 54 (1.8%) |
| $10,000 to $24,999 | 321 (15.1%) | 0 (0.0%) |
| $25,000 to $34,999 | 182 (8.6%) | 40 (1.3%) |
| $35,000 to $49,999 | 149 (7.0%) | 150 (4.9%) |
| $50,000 to $74,999 | 363 (17.1%) | 70 (2.3%) |
| $75,000 to $99,999 | 233 (11.0%) | 337 (11.0%) |
| $100,000 to $149,999 | 215 (10.1%) | 377 (12.2%) |
| $150,000 or more | 531 (25.0%) | 742 (24.1%) |
| Total | 2,121 (100.0%) | 3,077 (100.0%) |
Property Value to Household Income Ratio in Williston
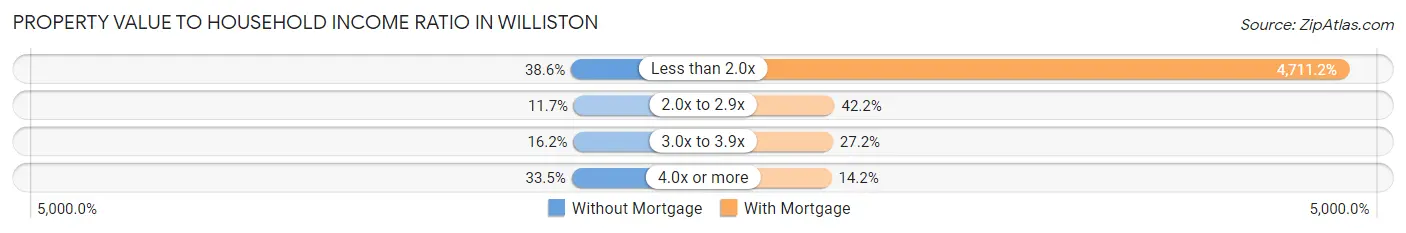
| Value-to-Income Ratio | Without Mortgage | With Mortgage |
| Less than 2.0x | 819 (38.6%) | 144,964 (4,711.2%) |
| 2.0x to 2.9x | 247 (11.7%) | 1,298 (42.2%) |
| 3.0x to 3.9x | 344 (16.2%) | 837 (27.2%) |
| 4.0x or more | 711 (33.5%) | 437 (14.2%) |
| Total | 2,121 (100.0%) | 3,077 (100.0%) |
Real Estate Taxes by Mortgage Status in Williston
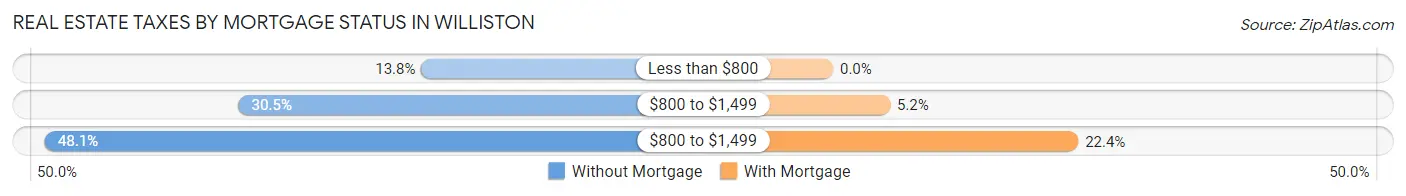
| Property Taxes | Without Mortgage | With Mortgage |
| Less than $800 | 292 (13.8%) | 0 (0.0%) |
| $800 to $1,499 | 646 (30.5%) | 160 (5.2%) |
| $800 to $1,499 | 1,021 (48.1%) | 689 (22.4%) |
| Total | 2,121 (100.0%) | 3,077 (100.0%) |
Health & Disability in Williston
Health Insurance Coverage by Age in Williston
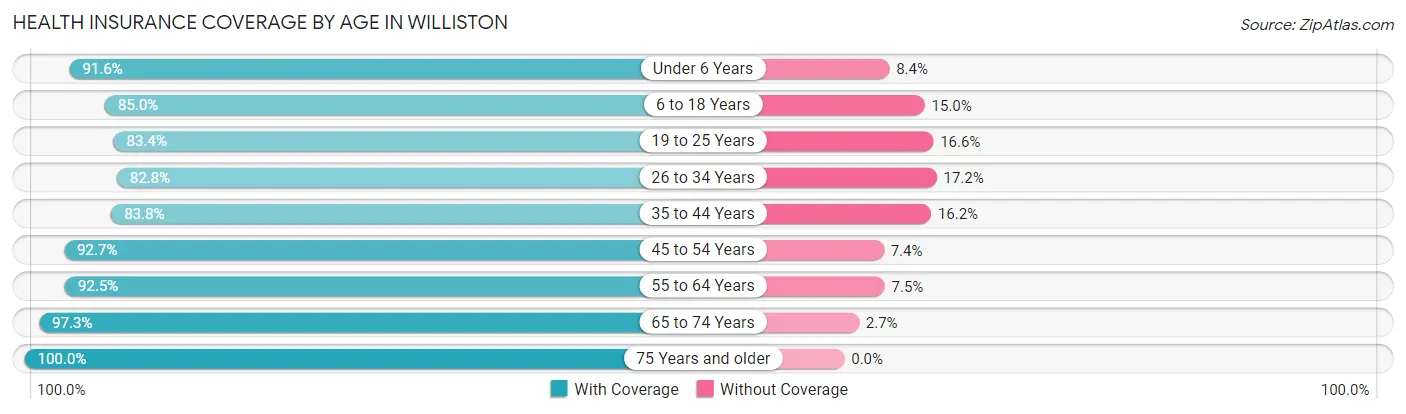
| Age Bracket | With Coverage | Without Coverage |
| Under 6 Years | 2,628 (91.6%) | 240 (8.4%) |
| 6 to 18 Years | 4,734 (85.0%) | 834 (15.0%) |
| 19 to 25 Years | 2,073 (83.4%) | 412 (16.6%) |
| 26 to 34 Years | 3,880 (82.8%) | 806 (17.2%) |
| 35 to 44 Years | 4,042 (83.8%) | 779 (16.2%) |
| 45 to 54 Years | 2,634 (92.6%) | 209 (7.3%) |
| 55 to 64 Years | 2,042 (92.5%) | 166 (7.5%) |
| 65 to 74 Years | 1,257 (97.3%) | 35 (2.7%) |
| 75 Years and older | 747 (100.0%) | 0 (0.0%) |
| Total | 24,037 (87.4%) | 3,481 (12.7%) |
Health Insurance Coverage by Citizenship Status in Williston
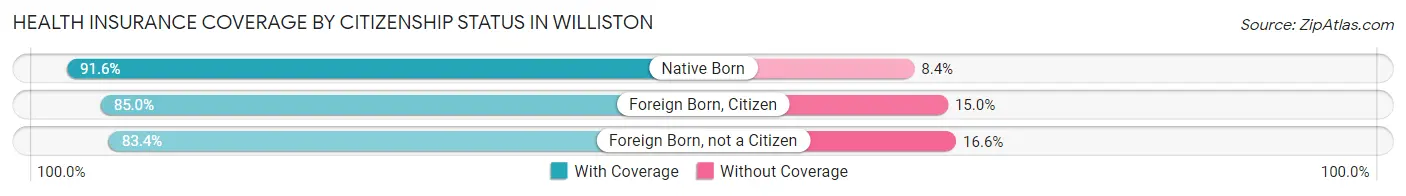
| Citizenship Status | With Coverage | Without Coverage |
| Native Born | 2,628 (91.6%) | 240 (8.4%) |
| Foreign Born, Citizen | 4,734 (85.0%) | 834 (15.0%) |
| Foreign Born, not a Citizen | 2,073 (83.4%) | 412 (16.6%) |
Health Insurance Coverage by Household Income in Williston
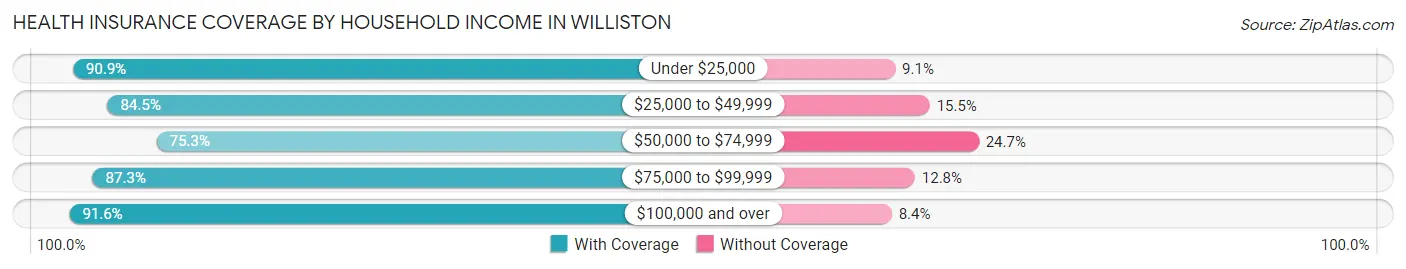
| Household Income | With Coverage | Without Coverage |
| Under $25,000 | 1,295 (90.9%) | 129 (9.1%) |
| $25,000 to $49,999 | 3,785 (84.5%) | 696 (15.5%) |
| $50,000 to $74,999 | 2,999 (75.3%) | 985 (24.7%) |
| $75,000 to $99,999 | 4,032 (87.3%) | 589 (12.8%) |
| $100,000 and over | 11,723 (91.6%) | 1,077 (8.4%) |
Public vs Private Health Insurance Coverage by Age in Williston
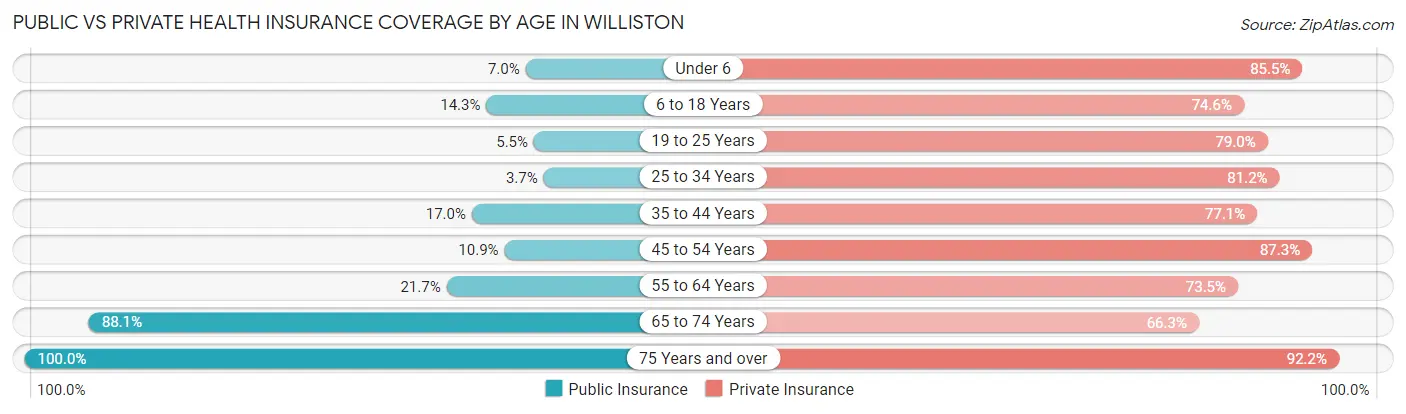
| Age Bracket | Public Insurance | Private Insurance |
| Under 6 | 201 (7.0%) | 2,451 (85.5%) |
| 6 to 18 Years | 796 (14.3%) | 4,154 (74.6%) |
| 19 to 25 Years | 136 (5.5%) | 1,964 (79.0%) |
| 25 to 34 Years | 172 (3.7%) | 3,806 (81.2%) |
| 35 to 44 Years | 819 (17.0%) | 3,716 (77.1%) |
| 45 to 54 Years | 311 (10.9%) | 2,481 (87.3%) |
| 55 to 64 Years | 479 (21.7%) | 1,623 (73.5%) |
| 65 to 74 Years | 1,138 (88.1%) | 856 (66.2%) |
| 75 Years and over | 747 (100.0%) | 689 (92.2%) |
| Total | 4,799 (17.4%) | 21,740 (79.0%) |
Disability Status by Sex by Age in Williston
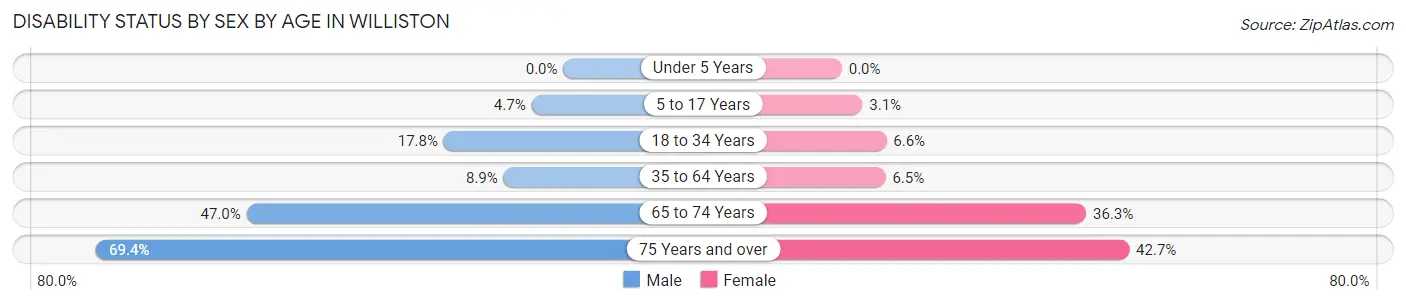
| Age Bracket | Male | Female |
| Under 5 Years | 0 (0.0%) | 0 (0.0%) |
| 5 to 17 Years | 138 (4.7%) | 80 (3.0%) |
| 18 to 34 Years | 750 (17.7%) | 223 (6.6%) |
| 35 to 64 Years | 486 (8.9%) | 285 (6.5%) |
| 65 to 74 Years | 294 (47.0%) | 242 (36.3%) |
| 75 Years and over | 154 (69.4%) | 224 (42.7%) |
Disability Class by Sex by Age in Williston
Disability Class: Hearing Difficulty
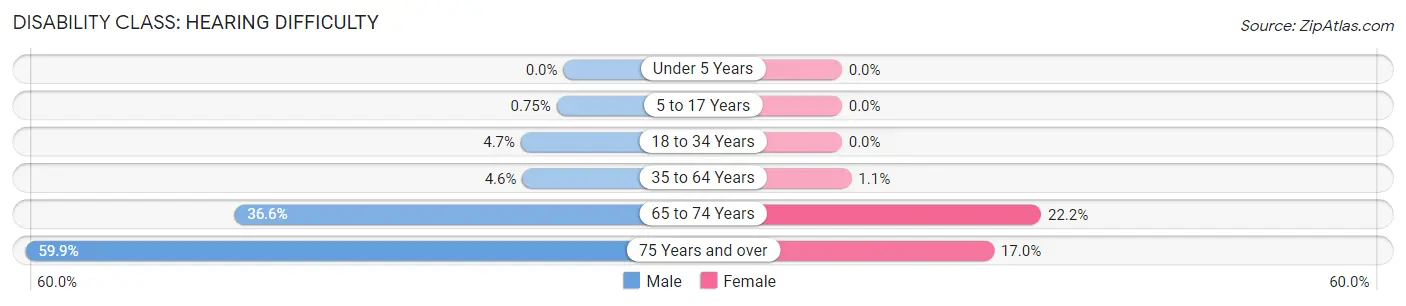
| Age Bracket | Male | Female |
| Under 5 Years | 0 (0.0%) | 0 (0.0%) |
| 5 to 17 Years | 22 (0.7%) | 0 (0.0%) |
| 18 to 34 Years | 200 (4.7%) | 0 (0.0%) |
| 35 to 64 Years | 250 (4.6%) | 47 (1.1%) |
| 65 to 74 Years | 229 (36.6%) | 148 (22.2%) |
| 75 Years and over | 133 (59.9%) | 89 (17.0%) |
Disability Class: Vision Difficulty
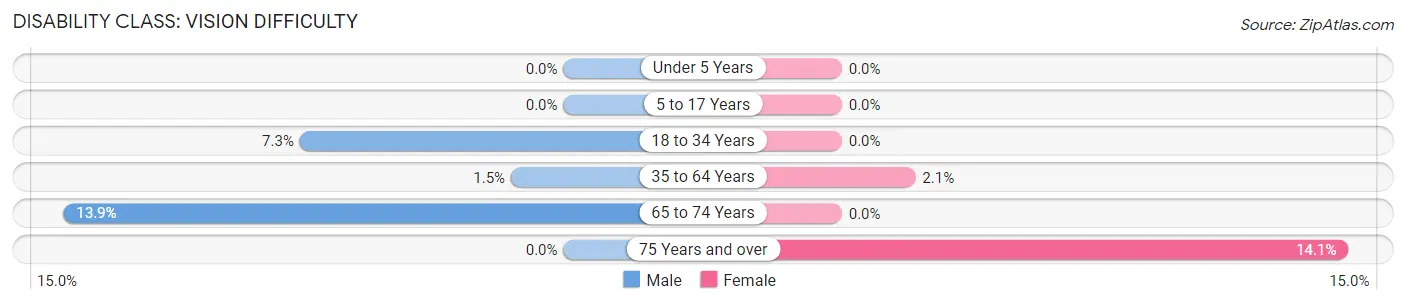
| Age Bracket | Male | Female |
| Under 5 Years | 0 (0.0%) | 0 (0.0%) |
| 5 to 17 Years | 0 (0.0%) | 0 (0.0%) |
| 18 to 34 Years | 310 (7.3%) | 0 (0.0%) |
| 35 to 64 Years | 80 (1.5%) | 90 (2.1%) |
| 65 to 74 Years | 87 (13.9%) | 0 (0.0%) |
| 75 Years and over | 0 (0.0%) | 74 (14.1%) |
Disability Class: Cognitive Difficulty
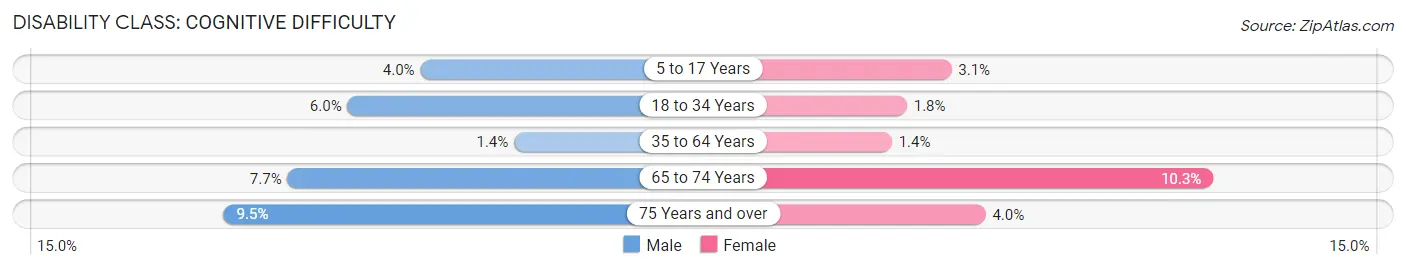
| Age Bracket | Male | Female |
| 5 to 17 Years | 116 (4.0%) | 80 (3.0%) |
| 18 to 34 Years | 254 (6.0%) | 61 (1.8%) |
| 35 to 64 Years | 75 (1.4%) | 61 (1.4%) |
| 65 to 74 Years | 48 (7.7%) | 69 (10.3%) |
| 75 Years and over | 21 (9.5%) | 21 (4.0%) |
Disability Class: Ambulatory Difficulty
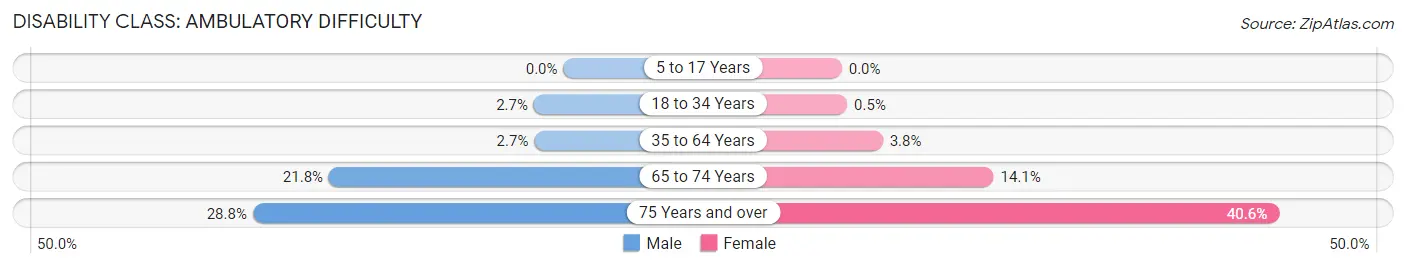
| Age Bracket | Male | Female |
| 5 to 17 Years | 0 (0.0%) | 0 (0.0%) |
| 18 to 34 Years | 116 (2.7%) | 17 (0.5%) |
| 35 to 64 Years | 148 (2.7%) | 167 (3.8%) |
| 65 to 74 Years | 136 (21.8%) | 94 (14.1%) |
| 75 Years and over | 64 (28.8%) | 213 (40.6%) |
Disability Class: Self-Care Difficulty
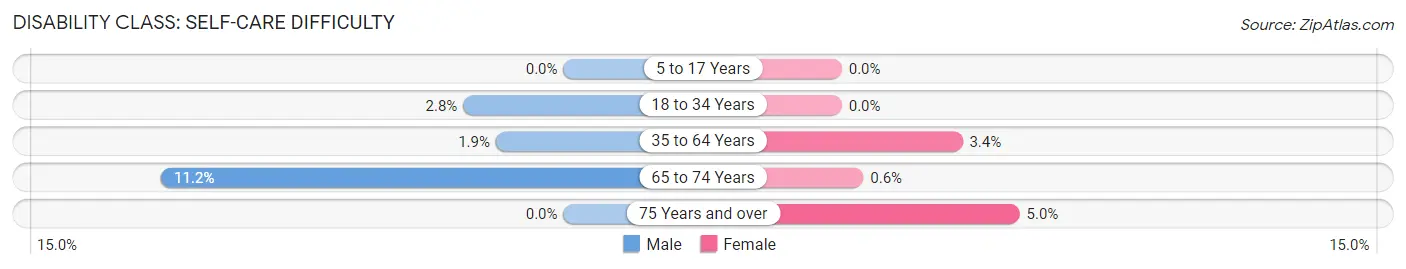
| Age Bracket | Male | Female |
| 5 to 17 Years | 0 (0.0%) | 0 (0.0%) |
| 18 to 34 Years | 118 (2.8%) | 0 (0.0%) |
| 35 to 64 Years | 103 (1.9%) | 148 (3.4%) |
| 65 to 74 Years | 70 (11.2%) | 4 (0.6%) |
| 75 Years and over | 0 (0.0%) | 26 (5.0%) |
Technology Access in Williston
Computing Device Access in Williston
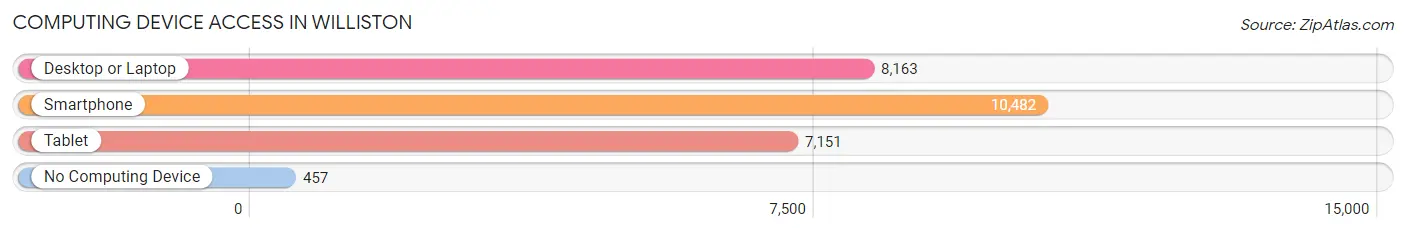
| Device Type | # Households | % Households |
| Desktop or Laptop | 8,163 | 71.5% |
| Smartphone | 10,482 | 91.9% |
| Tablet | 7,151 | 62.7% |
| No Computing Device | 457 | 4.0% |
| Total | 11,410 | 100.0% |
Internet Access in Williston
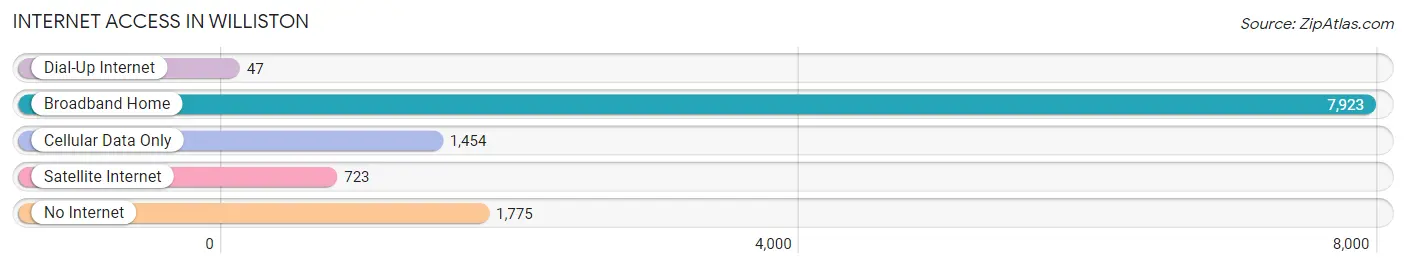
| Internet Type | # Households | % Households |
| Dial-Up Internet | 47 | 0.4% |
| Broadband Home | 7,923 | 69.4% |
| Cellular Data Only | 1,454 | 12.7% |
| Satellite Internet | 723 | 6.3% |
| No Internet | 1,775 | 15.6% |
| Total | 11,410 | 100.0% |
Williston Summary
Williston, North Dakota is a city located in the northwestern corner of the state, in Williams County. It is the county seat and the largest city in the county, with a population of 14,716 as of the 2010 census. The city is situated on the Missouri River, and is the hub of the Bakken oil shale formation, which has made it one of the fastest growing cities in the United States.
History
The area that is now Williston was first settled in 1887, when the Northern Pacific Railway was built through the area. The city was named after Daniel Willis James, a railroad official. The city was incorporated in 1887, and the first post office was established in 1888.
In the early 1900s, Williston was a thriving agricultural center, with a population of over 2,000. The city was home to a number of businesses, including a flour mill, a creamery, a brickyard, and a lumberyard.
In the 1950s, the discovery of oil in the area led to a boom in the city’s economy. The population grew rapidly, and by the 1970s, Williston had become the largest city in Williams County.
Geography
Williston is located in the northwestern corner of North Dakota, in Williams County. It is situated on the Missouri River, and is the hub of the Bakken oil shale formation. The city is located at the intersection of U.S. Highways 2 and 85.
The city has a total area of 8.7 square miles, of which 8.6 square miles is land and 0.1 square miles is water. The city is located at an elevation of 1,890 feet above sea level.
Economy
Williston’s economy is largely based on the oil and gas industry. The city is the hub of the Bakken oil shale formation, and is home to a number of oil and gas companies. The city is also home to a number of other businesses, including manufacturing, retail, and healthcare.
The city is also home to a number of educational institutions, including Williston State College, the University of Mary, and the North Dakota School of Science.
Demographics
As of the 2010 census, Williston had a population of 14,716. The racial makeup of the city was 90.2% White, 0.7% African American, 4.2% Native American, 0.7% Asian, 0.1% Pacific Islander, 1.2% from other races, and 2.9% from two or more races. Hispanic or Latino of any race were 4.2% of the population.
The median income for a household in the city was $45,945, and the median income for a family was $54,945. The per capita income for the city was $25,945. About 11.2% of families and 14.2% of the population were below the poverty line, including 19.2% of those under age 18 and 8.2% of those age 65 or over.
Common Questions
What is the Total Population of Williston?
Total Population of Williston is 27,783.
What is the Total Male Population of Williston?
Total Male Population of Williston is 14,838.
What is the Total Female Population of Williston?
Total Female Population of Williston is 12,945.
What is the Ratio of Males per 100 Females in Williston?
There are 114.62 Males per 100 Females in Williston.
What is the Ratio of Females per 100 Males in Williston?
There are 87.24 Females per 100 Males in Williston.
What is the Median Population Age in Williston?
Median Population Age in Williston is 31.4 Years.
What is the Average Family Size in Williston
Average Family Size in Williston is 3.2 People.
What is the Average Household Size in Williston
Average Household Size in Williston is 2.4 People.
What is Per Capita Income in Williston?
Per Capita income in Williston is $44,173.
What is the Median Family Income in Williston?
Median Family Income in Williston is $101,530.
What is the Median Household income in Williston?
Median Household Income in Williston is $80,352.
What is Income or Wage Gap in Williston?
Income or Wage Gap in Williston is 46.7%.
Women in Williston earn 53.3 cents for every dollar earned by a man.
What is Inequality or Gini Index in Williston?
Inequality or Gini Index in Williston is 0.44.
How Large is the Labor Force in Williston?
There are 15,478 People in the Labor Forcein in Williston.
What is the Percentage of People in the Labor Force in Williston?
76.8% of People are in the Labor Force in Williston.
What is the Unemployment Rate in Williston?
Unemployment Rate in Williston is 2.9%.