Mayville, ND
Mayville Map
Mayville Overview
2,102
TOTAL POPULATION
1,071
MALE POPULATION
1,031
FEMALE POPULATION
103.88
MALES / 100 FEMALES
96.27
FEMALES / 100 MALES
28.5
MEDIAN AGE
3.1
AVG FAMILY SIZE
2.3
AVG HOUSEHOLD SIZE
$34,579
PER CAPITA INCOME
$105,625
AVG FAMILY INCOME
$67,813
AVG HOUSEHOLD INCOME
34.7%
WAGE / INCOME GAP [ % ]
65.3¢/ $1
WAGE / INCOME GAP [ $ ]
0.49
INEQUALITY / GINI INDEX
1,142
LABOR FORCE [ PEOPLE ]
64.0%
PERCENT IN LABOR FORCE
3.6%
UNEMPLOYMENT RATE
Mayville Zip Codes
Mayville Area Codes
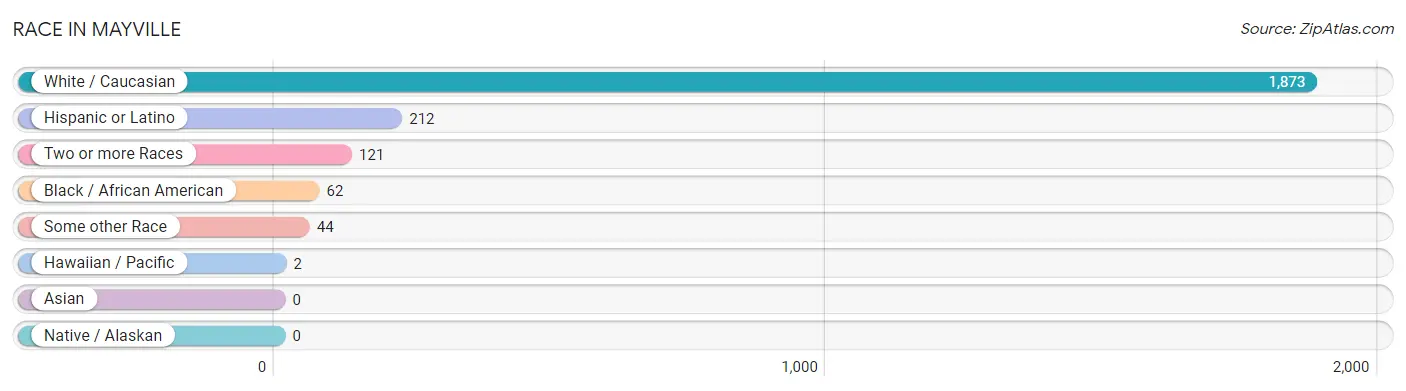
Race in Mayville
The most populous races in Mayville are White / Caucasian (1,873 | 89.1%), Hispanic or Latino (212 | 10.1%), and Two or more Races (121 | 5.8%).
| Race | # Population | % Population |
| Asian | 0 | 0.0% |
| Black / African American | 62 | 2.9% |
| Hawaiian / Pacific | 2 | 0.1% |
| Hispanic or Latino | 212 | 10.1% |
| Native / Alaskan | 0 | 0.0% |
| White / Caucasian | 1,873 | 89.1% |
| Two or more Races | 121 | 5.8% |
| Some other Race | 44 | 2.1% |
| Total | 2,102 | 100.0% |
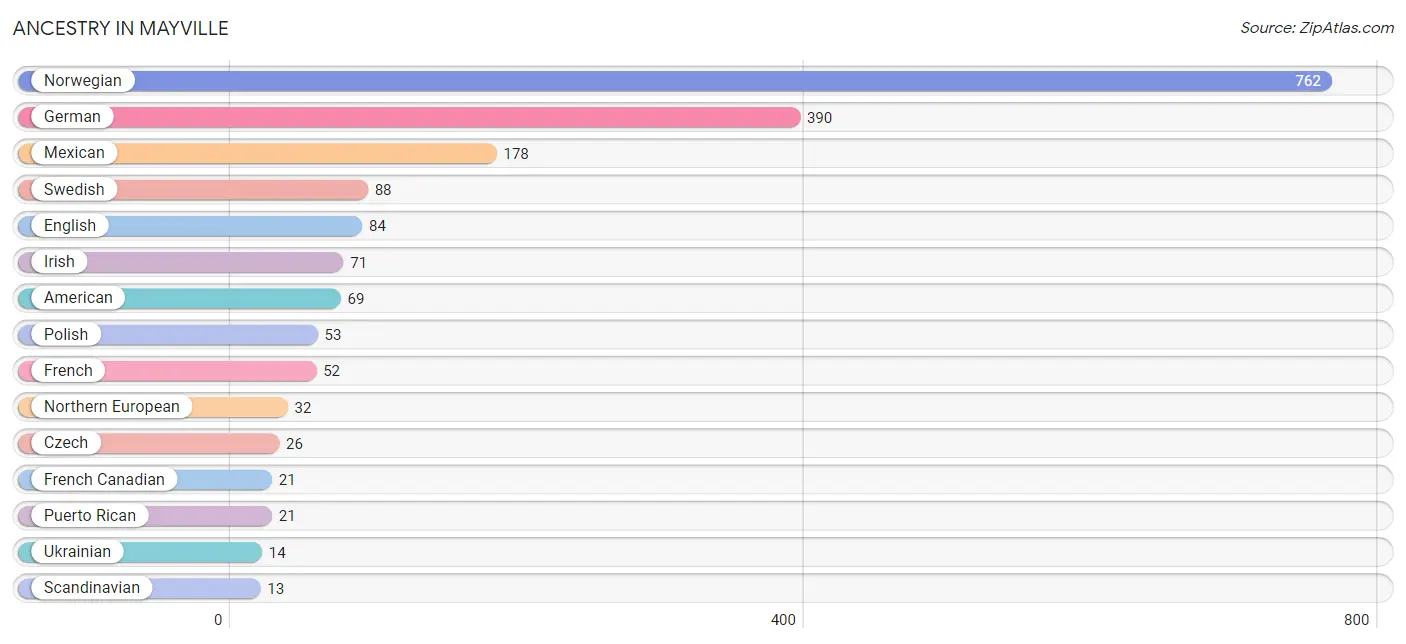
Ancestry in Mayville
The most populous ancestries reported in Mayville are Norwegian (762 | 36.2%), German (390 | 18.5%), Mexican (178 | 8.5%), Swedish (88 | 4.2%), and English (84 | 4.0%), together accounting for 71.5% of all Mayville residents.
| Ancestry | # Population | % Population |
| American | 69 | 3.3% |
| Australian | 5 | 0.2% |
| Bhutanese | 2 | 0.1% |
| British | 5 | 0.2% |
| Burmese | 5 | 0.2% |
| Chippewa | 11 | 0.5% |
| Czech | 26 | 1.2% |
| Czechoslovakian | 3 | 0.1% |
| Danish | 11 | 0.5% |
| Dominican | 2 | 0.1% |
| Dutch | 3 | 0.1% |
| English | 84 | 4.0% |
| European | 9 | 0.4% |
| Finnish | 6 | 0.3% |
| French | 52 | 2.5% |
| French Canadian | 21 | 1.0% |
| German | 390 | 18.5% |
| Irish | 71 | 3.4% |
| Israeli | 2 | 0.1% |
| Italian | 12 | 0.6% |
| Mexican | 178 | 8.5% |
| Native Hawaiian | 2 | 0.1% |
| Northern European | 32 | 1.5% |
| Norwegian | 762 | 36.2% |
| Polish | 53 | 2.5% |
| Puerto Rican | 21 | 1.0% |
| Russian | 11 | 0.5% |
| Scandinavian | 13 | 0.6% |
| Scotch-Irish | 5 | 0.2% |
| Scottish | 12 | 0.6% |
| Spaniard | 11 | 0.5% |
| Swedish | 88 | 4.2% |
| Swiss | 3 | 0.1% |
| Ukrainian | 14 | 0.7% |
| Welsh | 10 | 0.5% | View All 35 Rows |
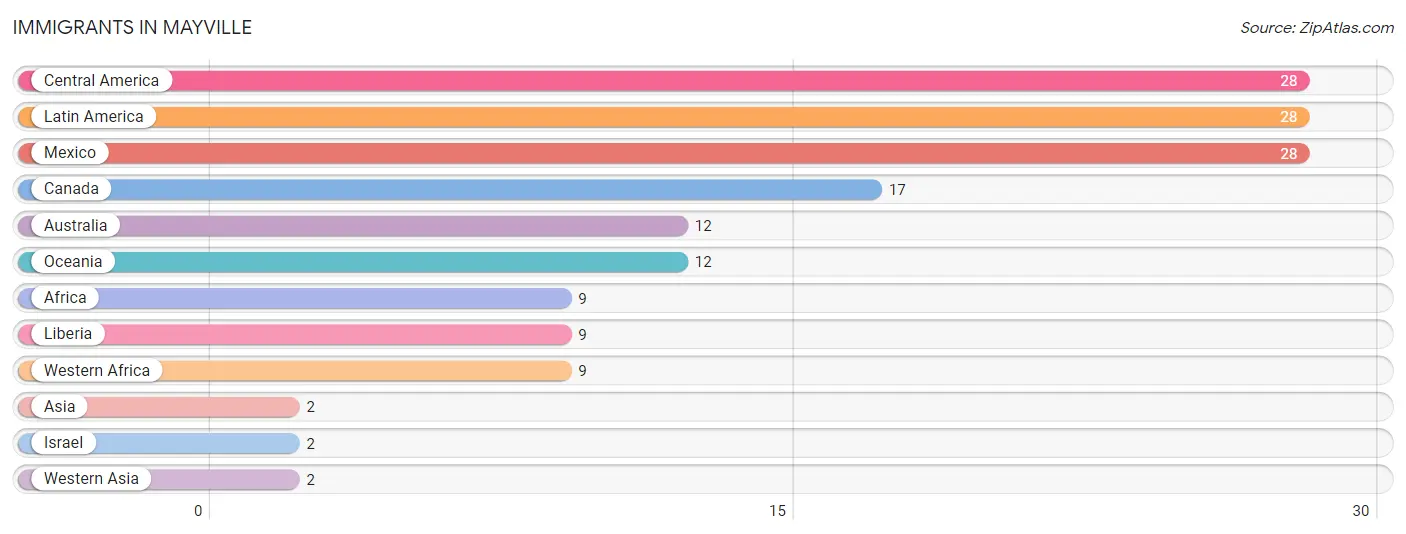
Immigrants in Mayville
The most numerous immigrant groups reported in Mayville came from Central America (28 | 1.3%), Latin America (28 | 1.3%), Mexico (28 | 1.3%), Canada (17 | 0.8%), and Australia (12 | 0.6%), together accounting for 5.4% of all Mayville residents.
| Immigration Origin | # Population | % Population |
| Africa | 9 | 0.4% |
| Asia | 2 | 0.1% |
| Australia | 12 | 0.6% |
| Canada | 17 | 0.8% |
| Central America | 28 | 1.3% |
| Israel | 2 | 0.1% |
| Latin America | 28 | 1.3% |
| Liberia | 9 | 0.4% |
| Mexico | 28 | 1.3% |
| Oceania | 12 | 0.6% |
| Western Africa | 9 | 0.4% |
| Western Asia | 2 | 0.1% | View All 12 Rows |
Sex and Age in Mayville
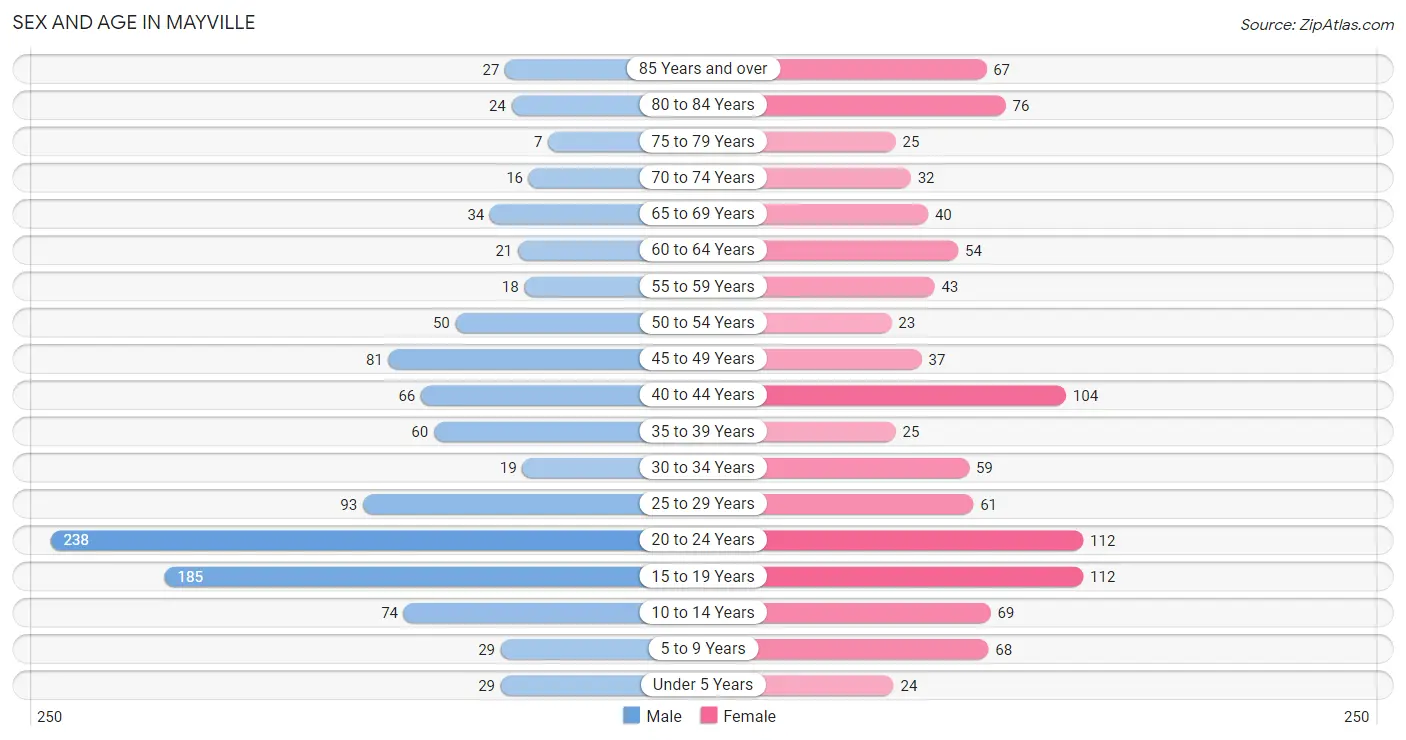
Sex and Age in Mayville
The most populous age groups in Mayville are 20 to 24 Years (238 | 22.2%) for men and 15 to 19 Years (112 | 10.9%) for women.
| Age Bracket | Male | Female |
| Under 5 Years | 29 (2.7%) | 24 (2.3%) |
| 5 to 9 Years | 29 (2.7%) | 68 (6.6%) |
| 10 to 14 Years | 74 (6.9%) | 69 (6.7%) |
| 15 to 19 Years | 185 (17.3%) | 112 (10.9%) |
| 20 to 24 Years | 238 (22.2%) | 112 (10.9%) |
| 25 to 29 Years | 93 (8.7%) | 61 (5.9%) |
| 30 to 34 Years | 19 (1.8%) | 59 (5.7%) |
| 35 to 39 Years | 60 (5.6%) | 25 (2.4%) |
| 40 to 44 Years | 66 (6.2%) | 104 (10.1%) |
| 45 to 49 Years | 81 (7.6%) | 37 (3.6%) |
| 50 to 54 Years | 50 (4.7%) | 23 (2.2%) |
| 55 to 59 Years | 18 (1.7%) | 43 (4.2%) |
| 60 to 64 Years | 21 (2.0%) | 54 (5.2%) |
| 65 to 69 Years | 34 (3.2%) | 40 (3.9%) |
| 70 to 74 Years | 16 (1.5%) | 32 (3.1%) |
| 75 to 79 Years | 7 (0.6%) | 25 (2.4%) |
| 80 to 84 Years | 24 (2.2%) | 76 (7.4%) |
| 85 Years and over | 27 (2.5%) | 67 (6.5%) |
| Total | 1,071 (100.0%) | 1,031 (100.0%) |
Families and Households in Mayville
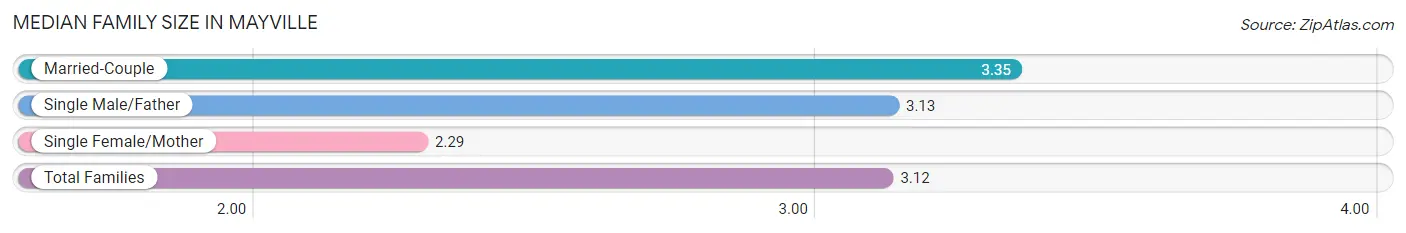
Median Family Size in Mayville
The median family size in Mayville is 3.12 persons per family, with married-couple families (298 | 75.2%) accounting for the largest median family size of 3.35 persons per family. On the other hand, single female/mother families (82 | 20.7%) represent the smallest median family size with 2.29 persons per family.
| Family Type | # Families | Family Size |
| Married-Couple | 298 (75.2%) | 3.35 |
| Single Male/Father | 16 (4.0%) | 3.13 |
| Single Female/Mother | 82 (20.7%) | 2.29 |
| Total Families | 396 (100.0%) | 3.12 |
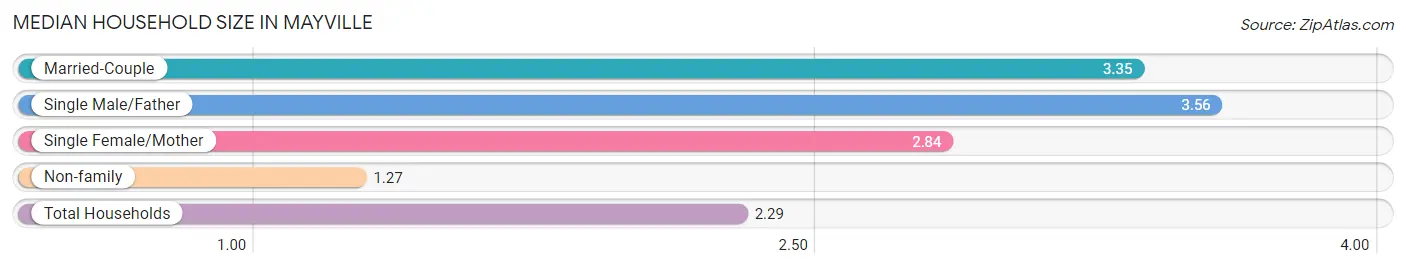
Median Household Size in Mayville
The median household size in Mayville is 2.29 persons per household, with single male/father households (16 | 2.1%) accounting for the largest median household size of 3.56 persons per household. non-family households (369 | 48.2%) represent the smallest median household size with 1.27 persons per household.
| Household Type | # Households | Household Size |
| Married-Couple | 298 (39.0%) | 3.35 |
| Single Male/Father | 16 (2.1%) | 3.56 |
| Single Female/Mother | 82 (10.7%) | 2.84 |
| Non-family | 369 (48.2%) | 1.27 |
| Total Households | 765 (100.0%) | 2.29 |
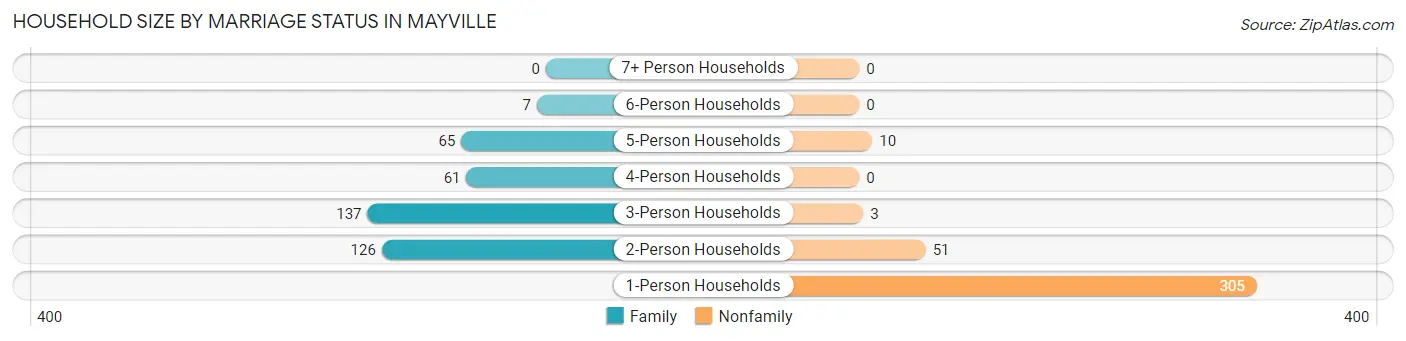
Household Size by Marriage Status in Mayville
Out of a total of 765 households in Mayville, 396 (51.8%) are family households, while 369 (48.2%) are nonfamily households. The most numerous type of family households are 3-person households, comprising 137, and the most common type of nonfamily households are 1-person households, comprising 305.
| Household Size | Family Households | Nonfamily Households |
| 1-Person Households | - | 305 (39.9%) |
| 2-Person Households | 126 (16.5%) | 51 (6.7%) |
| 3-Person Households | 137 (17.9%) | 3 (0.4%) |
| 4-Person Households | 61 (8.0%) | 0 (0.0%) |
| 5-Person Households | 65 (8.5%) | 10 (1.3%) |
| 6-Person Households | 7 (0.9%) | 0 (0.0%) |
| 7+ Person Households | 0 (0.0%) | 0 (0.0%) |
| Total | 396 (51.8%) | 369 (48.2%) |
Female Fertility in Mayville
Fertility by Age in Mayville
Average fertility rate in Mayville is 12.0 births per 1,000 women. Women in the age bracket of 35 to 50 years have the highest fertility rate with 17.0 births per 1,000 women. Women in the age bracket of 20 to 34 years acount for 50.0% of all women with births.
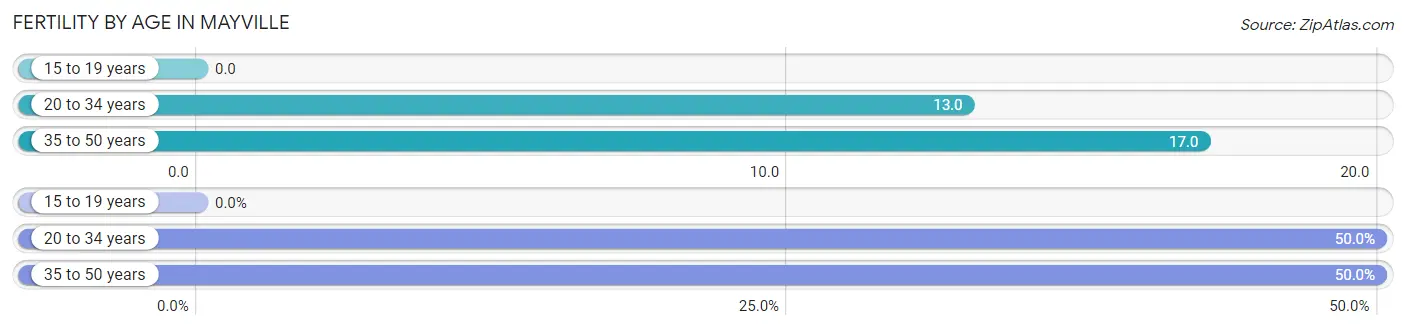
| Age Bracket | Women with Births | Births / 1,000 Women |
| 15 to 19 years | 0 (0.0%) | 0.0 |
| 20 to 34 years | 3 (50.0%) | 13.0 |
| 35 to 50 years | 3 (50.0%) | 17.0 |
| Total | 6 (100.0%) | 12.0 |
Fertility by Age by Marriage Status in Mayville
50.0% of women with births (6) in Mayville are married. The highest percentage of unmarried women with births falls into 35 to 50 years age bracket with 100.0% of them unmarried at the time of birth, while the lowest percentage of unmarried women with births belong to 20 to 34 years age bracket with 0.0% of them unmarried.
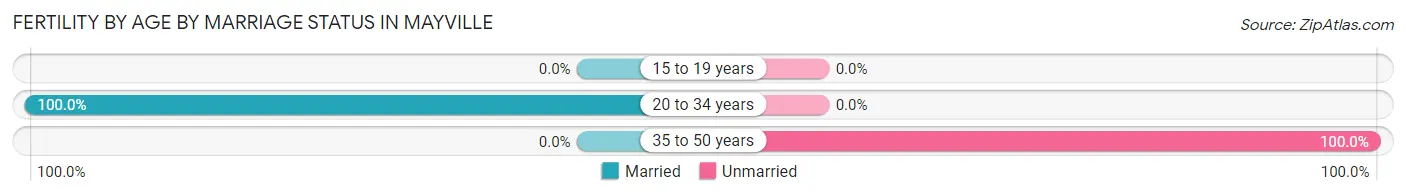
| Age Bracket | Married | Unmarried |
| 15 to 19 years | 0 (0.0%) | 0 (0.0%) |
| 20 to 34 years | 3 (100.0%) | 0 (0.0%) |
| 35 to 50 years | 0 (0.0%) | 3 (100.0%) |
| Total | 3 (50.0%) | 3 (50.0%) |
Fertility by Education in Mayville
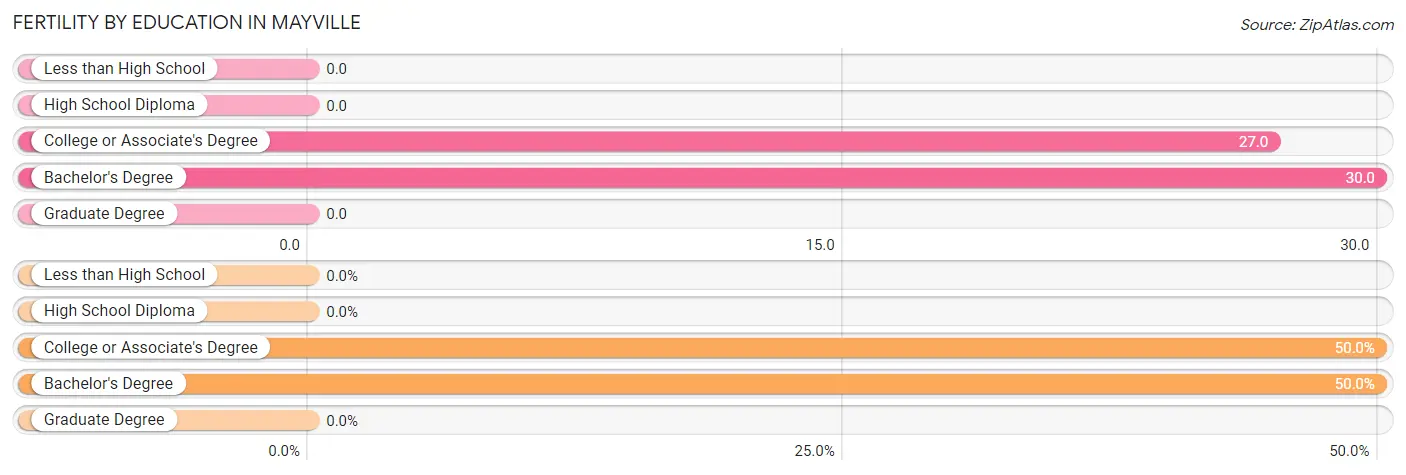
| Educational Attainment | Women with Births | Births / 1,000 Women |
| Less than High School | 0 (0.0%) | 0.0 |
| High School Diploma | 0 (0.0%) | 0.0 |
| College or Associate's Degree | 3 (50.0%) | 27.0 |
| Bachelor's Degree | 3 (50.0%) | 30.0 |
| Graduate Degree | 0 (0.0%) | 0.0 |
| Total | 6 (100.0%) | 12.0 |
Fertility by Education by Marriage Status in Mayville
50.0% of women with births in Mayville are unmarried. Women with the educational attainment of bachelor's degree are most likely to be married with 100.0% of them married at childbirth, while women with the educational attainment of college or associate's degree are least likely to be married with 100.0% of them unmarried at childbirth.
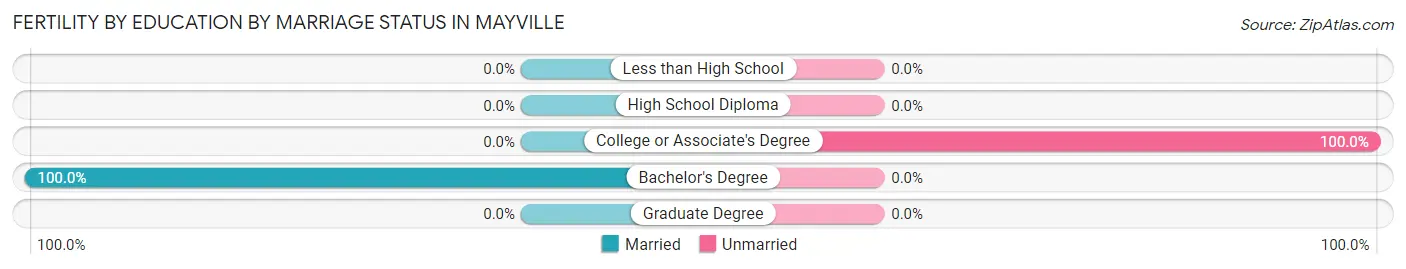
| Educational Attainment | Married | Unmarried |
| Less than High School | 0 (0.0%) | 0 (0.0%) |
| High School Diploma | 0 (0.0%) | 0 (0.0%) |
| College or Associate's Degree | 0 (0.0%) | 3 (100.0%) |
| Bachelor's Degree | 3 (100.0%) | 0 (0.0%) |
| Graduate Degree | 0 (0.0%) | 0 (0.0%) |
| Total | 3 (50.0%) | 3 (50.0%) |
Income in Mayville
Income Overview in Mayville
Per Capita Income in Mayville is $34,579, while median incomes of families and households are $105,625 and $67,813 respectively.
| Characteristic | Number | Measure |
| Per Capita Income | 2,102 | $34,579 |
| Median Family Income | 396 | $105,625 |
| Mean Family Income | 396 | $124,322 |
| Median Household Income | 765 | $67,813 |
| Mean Household Income | 765 | $90,641 |
| Income Deficit | 396 | $0 |
| Wage / Income Gap (%) | 2,102 | 34.69% |
| Wage / Income Gap ($) | 2,102 | 65.31¢ per $1 |
| Gini / Inequality Index | 2,102 | 0.49 |
Earnings by Sex in Mayville
Average Earnings in Mayville are $33,092, $39,292 for men and $25,662 for women, a difference of 34.7%.
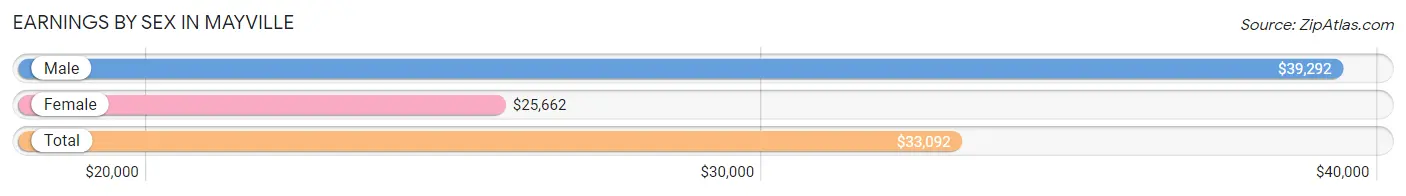
| Sex | Number | Average Earnings |
| Male | 683 (54.1%) | $39,292 |
| Female | 579 (45.9%) | $25,662 |
| Total | 1,262 (100.0%) | $33,092 |
Earnings by Sex by Income Bracket in Mayville
The most common earnings brackets in Mayville are $100,000+ for men (85 | 12.4%) and $40,000 to $44,999 for women (59 | 10.2%).
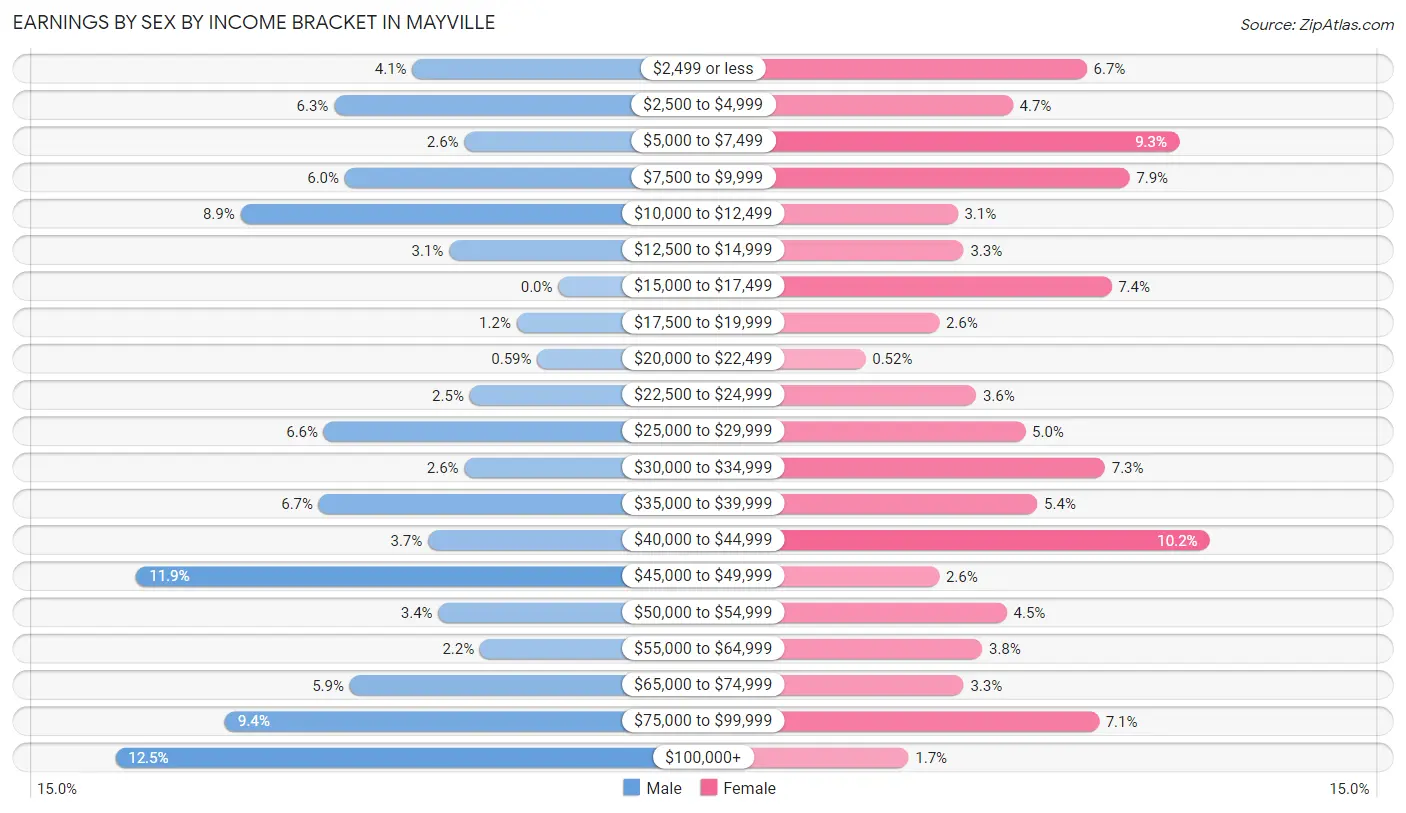
| Income | Male | Female |
| $2,499 or less | 28 (4.1%) | 39 (6.7%) |
| $2,500 to $4,999 | 43 (6.3%) | 27 (4.7%) |
| $5,000 to $7,499 | 18 (2.6%) | 54 (9.3%) |
| $7,500 to $9,999 | 41 (6.0%) | 46 (7.9%) |
| $10,000 to $12,499 | 61 (8.9%) | 18 (3.1%) |
| $12,500 to $14,999 | 21 (3.1%) | 19 (3.3%) |
| $15,000 to $17,499 | 0 (0.0%) | 43 (7.4%) |
| $17,500 to $19,999 | 8 (1.2%) | 15 (2.6%) |
| $20,000 to $22,499 | 4 (0.6%) | 3 (0.5%) |
| $22,500 to $24,999 | 17 (2.5%) | 21 (3.6%) |
| $25,000 to $29,999 | 45 (6.6%) | 29 (5.0%) |
| $30,000 to $34,999 | 18 (2.6%) | 42 (7.2%) |
| $35,000 to $39,999 | 46 (6.7%) | 31 (5.3%) |
| $40,000 to $44,999 | 25 (3.7%) | 59 (10.2%) |
| $45,000 to $49,999 | 81 (11.9%) | 15 (2.6%) |
| $50,000 to $54,999 | 23 (3.4%) | 26 (4.5%) |
| $55,000 to $64,999 | 15 (2.2%) | 22 (3.8%) |
| $65,000 to $74,999 | 40 (5.9%) | 19 (3.3%) |
| $75,000 to $99,999 | 64 (9.4%) | 41 (7.1%) |
| $100,000+ | 85 (12.4%) | 10 (1.7%) |
| Total | 683 (100.0%) | 579 (100.0%) |
Earnings by Sex by Educational Attainment in Mayville
Average earnings in Mayville are $54,583 for men and $38,625 for women, a difference of 29.2%. Men with an educational attainment of graduate degree enjoy the highest average annual earnings of $81,042, while those with high school diploma education earn the least with $49,808. Women with an educational attainment of graduate degree earn the most with the average annual earnings of $54,844, while those with college or associate's degree education have the smallest earnings of $38,750.
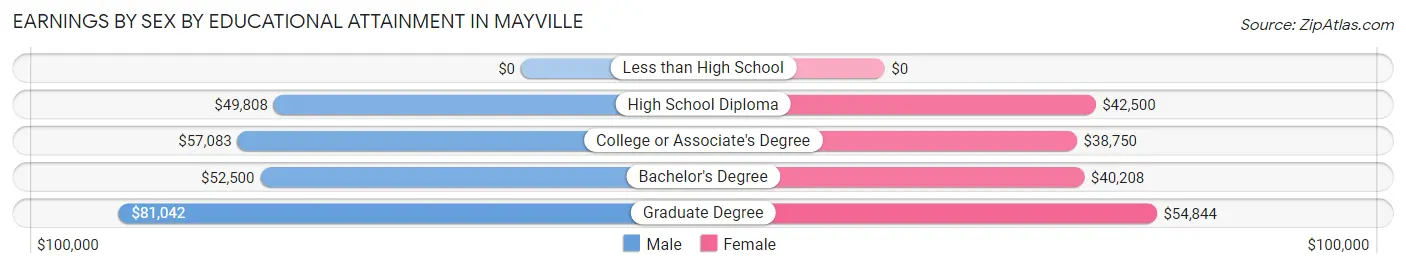
| Educational Attainment | Male Income | Female Income |
| Less than High School | - | - |
| High School Diploma | $49,808 | $42,500 |
| College or Associate's Degree | $57,083 | $38,750 |
| Bachelor's Degree | $52,500 | $40,208 |
| Graduate Degree | $81,042 | $54,844 |
| Total | $54,583 | $38,625 |
Family Income in Mayville
Family Income Brackets in Mayville
According to the Mayville family income data, there are 99 families falling into the $100,000 to $149,999 income range, which is the most common income bracket and makes up 25.0% of all families.
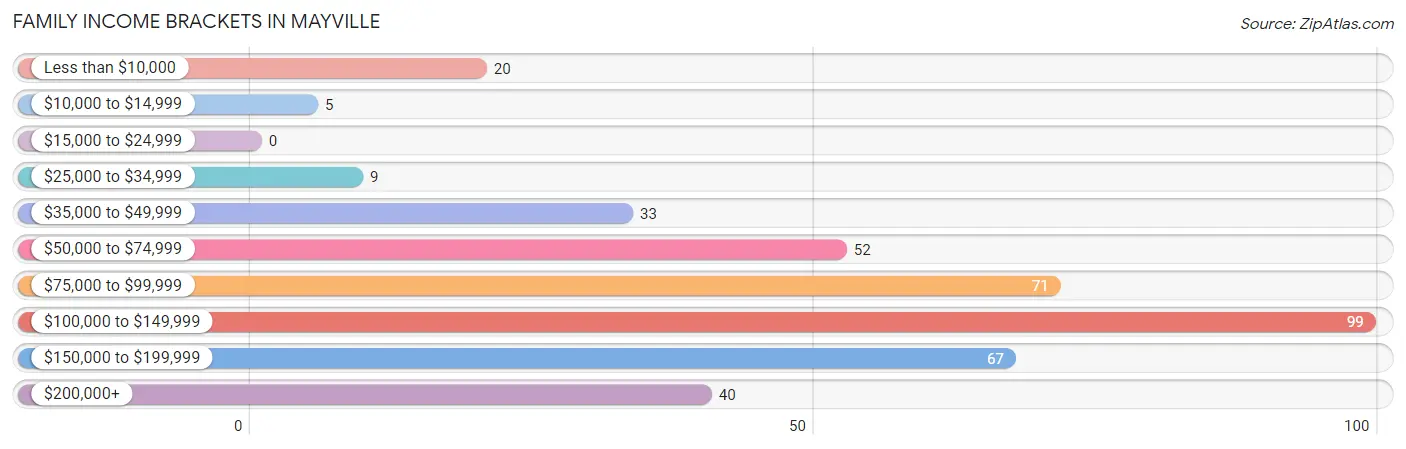
| Income Bracket | # Families | % Families |
| Less than $10,000 | 20 | 5.1% |
| $10,000 to $14,999 | 5 | 1.3% |
| $15,000 to $24,999 | 0 | 0.0% |
| $25,000 to $34,999 | 9 | 2.3% |
| $35,000 to $49,999 | 33 | 8.3% |
| $50,000 to $74,999 | 52 | 13.1% |
| $75,000 to $99,999 | 71 | 17.9% |
| $100,000 to $149,999 | 99 | 25.0% |
| $150,000 to $199,999 | 67 | 16.9% |
| $200,000+ | 40 | 10.1% |
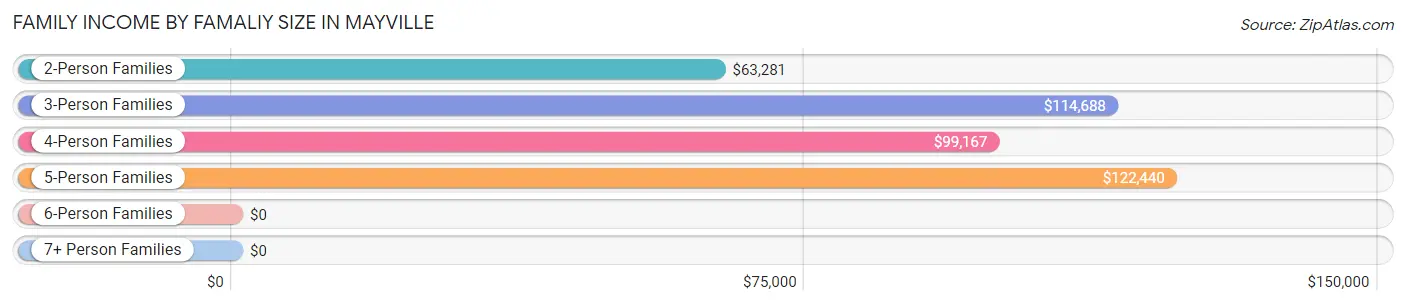
Family Income by Famaliy Size in Mayville
5-person families (63 | 15.9%) account for the highest median family income in Mayville with $122,440 per family, while 3-person families (87 | 22.0%) have the highest median income of $38,229 per family member.
| Income Bracket | # Families | Median Income |
| 2-Person Families | 179 (45.2%) | $63,281 |
| 3-Person Families | 87 (22.0%) | $114,688 |
| 4-Person Families | 60 (15.1%) | $99,167 |
| 5-Person Families | 63 (15.9%) | $122,440 |
| 6-Person Families | 7 (1.8%) | $0 |
| 7+ Person Families | 0 (0.0%) | $0 |
| Total | 396 (100.0%) | $105,625 |
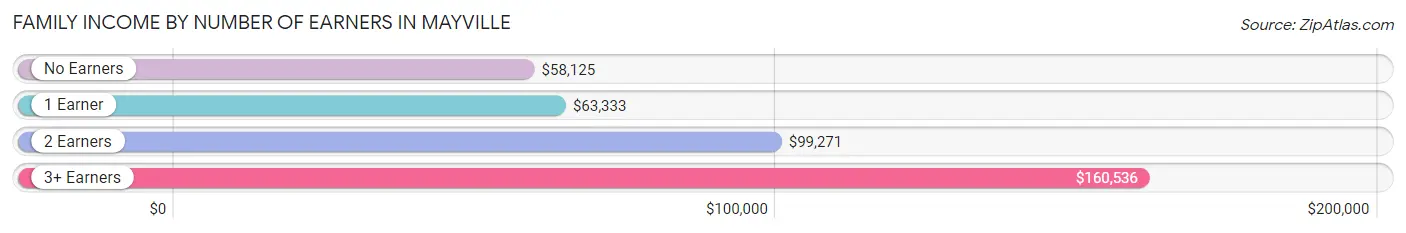
Family Income by Number of Earners in Mayville
The median family income in Mayville is $105,625, with families comprising 3+ earners (90) having the highest median family income of $160,536, while families with no earners (19) have the lowest median family income of $58,125, accounting for 22.7% and 4.8% of families, respectively.
| Number of Earners | # Families | Median Income |
| No Earners | 19 (4.8%) | $58,125 |
| 1 Earner | 134 (33.8%) | $63,333 |
| 2 Earners | 153 (38.6%) | $99,271 |
| 3+ Earners | 90 (22.7%) | $160,536 |
| Total | 396 (100.0%) | $105,625 |
Household Income in Mayville
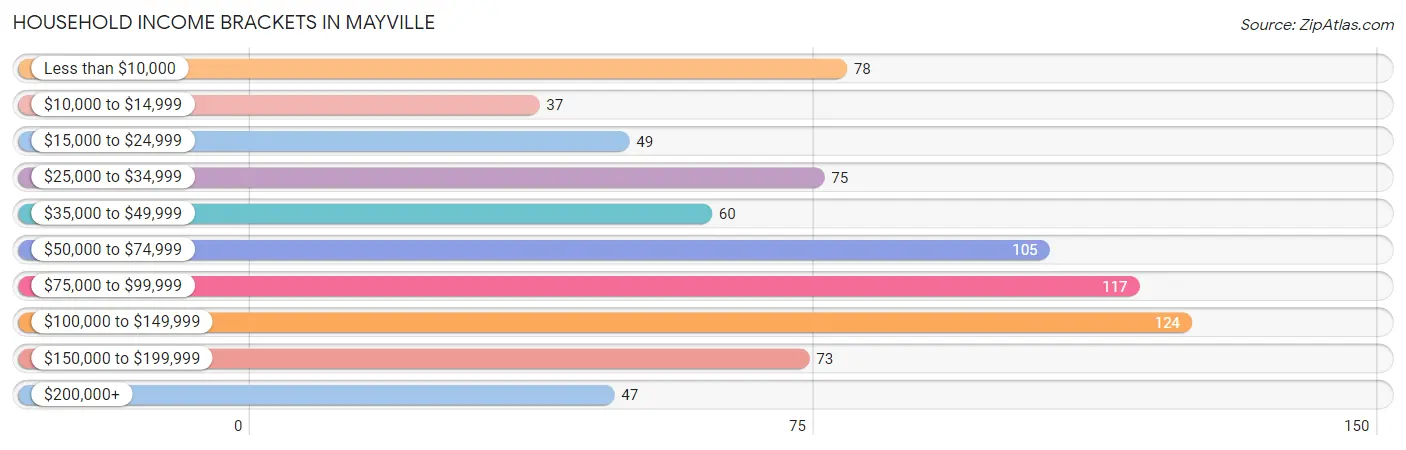
Household Income Brackets in Mayville
With 124 households falling in the category, the $100,000 to $149,999 income range is the most frequent in Mayville, accounting for 16.2% of all households. In contrast, only 37 households (4.8%) fall into the $10,000 to $14,999 income bracket, making it the least populous group.
| Income Bracket | # Households | % Households |
| Less than $10,000 | 78 | 10.2% |
| $10,000 to $14,999 | 37 | 4.8% |
| $15,000 to $24,999 | 49 | 6.4% |
| $25,000 to $34,999 | 75 | 9.8% |
| $35,000 to $49,999 | 60 | 7.8% |
| $50,000 to $74,999 | 105 | 13.7% |
| $75,000 to $99,999 | 117 | 15.3% |
| $100,000 to $149,999 | 124 | 16.2% |
| $150,000 to $199,999 | 73 | 9.5% |
| $200,000+ | 47 | 6.1% |
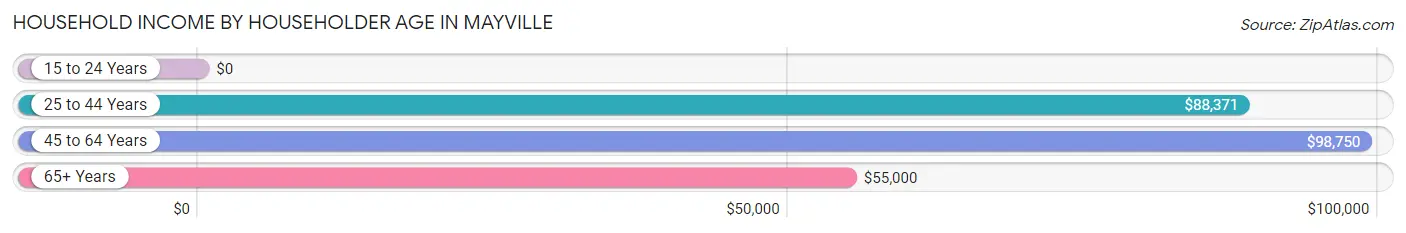
Household Income by Householder Age in Mayville
The median household income in Mayville is $67,813, with the highest median household income of $98,750 found in the 45 to 64 years age bracket for the primary householder. A total of 219 households (28.6%) fall into this category. Meanwhile, the 15 to 24 years age bracket for the primary householder has the lowest median household income of $0, with 93 households (12.2%) in this group.
| Income Bracket | # Households | Median Income |
| 15 to 24 Years | 93 (12.2%) | $0 |
| 25 to 44 Years | 259 (33.9%) | $88,371 |
| 45 to 64 Years | 219 (28.6%) | $98,750 |
| 65+ Years | 194 (25.4%) | $55,000 |
| Total | 765 (100.0%) | $67,813 |
Poverty in Mayville
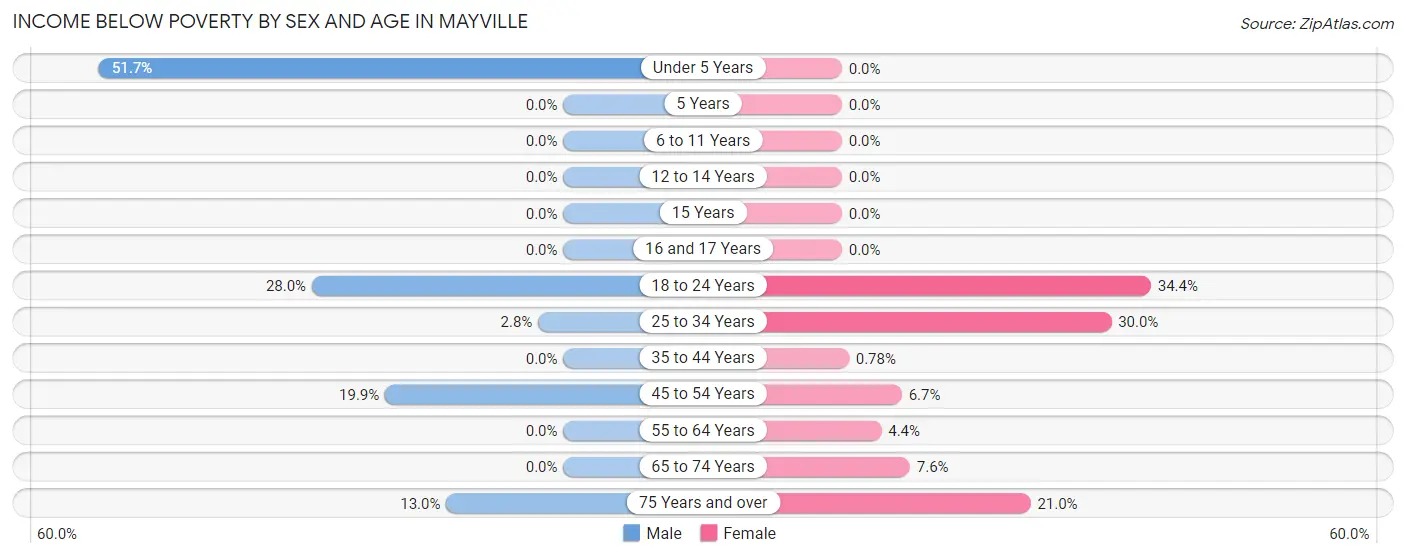
Income Below Poverty by Sex and Age in Mayville
With 11.8% poverty level for males and 12.1% for females among the residents of Mayville, under 5 year old males and 18 to 24 year old females are the most vulnerable to poverty, with 15 males (51.7%) and 32 females (34.4%) in their respective age groups living below the poverty level.
| Age Bracket | Male | Female |
| Under 5 Years | 15 (51.7%) | 0 (0.0%) |
| 5 Years | 0 (0.0%) | 0 (0.0%) |
| 6 to 11 Years | 0 (0.0%) | 0 (0.0%) |
| 12 to 14 Years | 0 (0.0%) | 0 (0.0%) |
| 15 Years | 0 (0.0%) | 0 (0.0%) |
| 16 and 17 Years | 0 (0.0%) | 0 (0.0%) |
| 18 to 24 Years | 56 (28.0%) | 32 (34.4%) |
| 25 to 34 Years | 3 (2.8%) | 36 (30.0%) |
| 35 to 44 Years | 0 (0.0%) | 1 (0.8%) |
| 45 to 54 Years | 26 (19.9%) | 4 (6.7%) |
| 55 to 64 Years | 0 (0.0%) | 4 (4.4%) |
| 65 to 74 Years | 0 (0.0%) | 5 (7.6%) |
| 75 Years and over | 3 (13.0%) | 25 (21.0%) |
| Total | 103 (11.8%) | 107 (12.1%) |
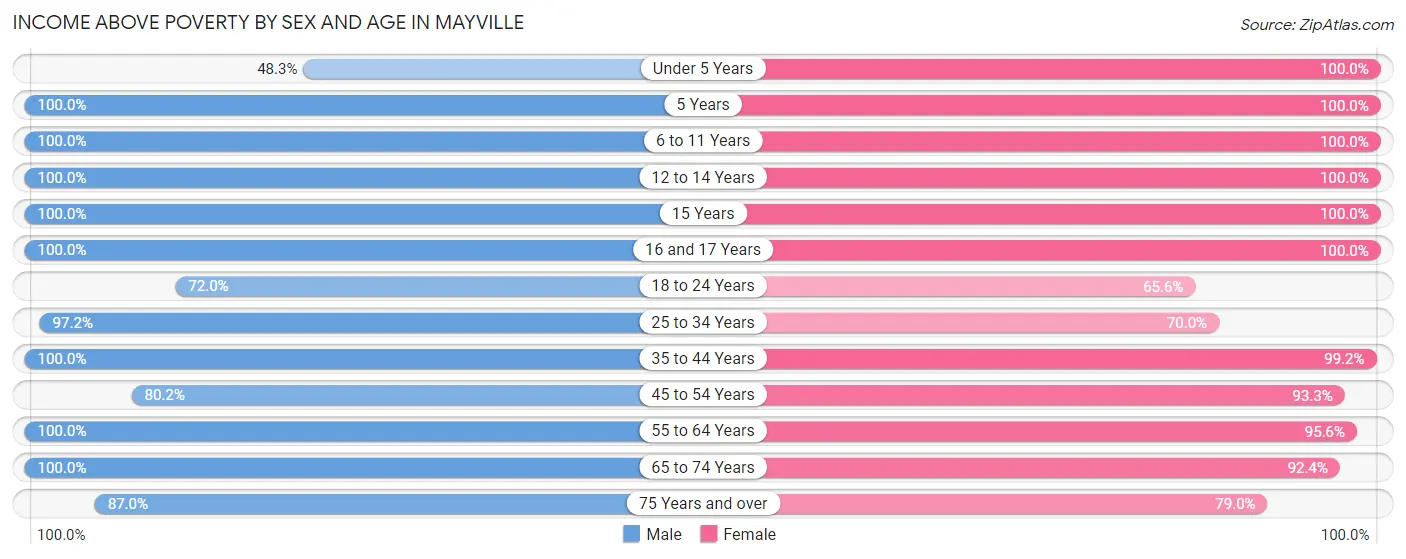
Income Above Poverty by Sex and Age in Mayville
According to the poverty statistics in Mayville, males aged 5 years and females aged under 5 years are the age groups that are most secure financially, with 100.0% of males and 100.0% of females in these age groups living above the poverty line.
| Age Bracket | Male | Female |
| Under 5 Years | 14 (48.3%) | 24 (100.0%) |
| 5 Years | 6 (100.0%) | 5 (100.0%) |
| 6 to 11 Years | 40 (100.0%) | 98 (100.0%) |
| 12 to 14 Years | 57 (100.0%) | 34 (100.0%) |
| 15 Years | 18 (100.0%) | 6 (100.0%) |
| 16 and 17 Years | 55 (100.0%) | 36 (100.0%) |
| 18 to 24 Years | 144 (72.0%) | 61 (65.6%) |
| 25 to 34 Years | 104 (97.2%) | 84 (70.0%) |
| 35 to 44 Years | 120 (100.0%) | 128 (99.2%) |
| 45 to 54 Years | 105 (80.1%) | 56 (93.3%) |
| 55 to 64 Years | 39 (100.0%) | 87 (95.6%) |
| 65 to 74 Years | 50 (100.0%) | 61 (92.4%) |
| 75 Years and over | 20 (87.0%) | 94 (79.0%) |
| Total | 772 (88.2%) | 774 (87.8%) |
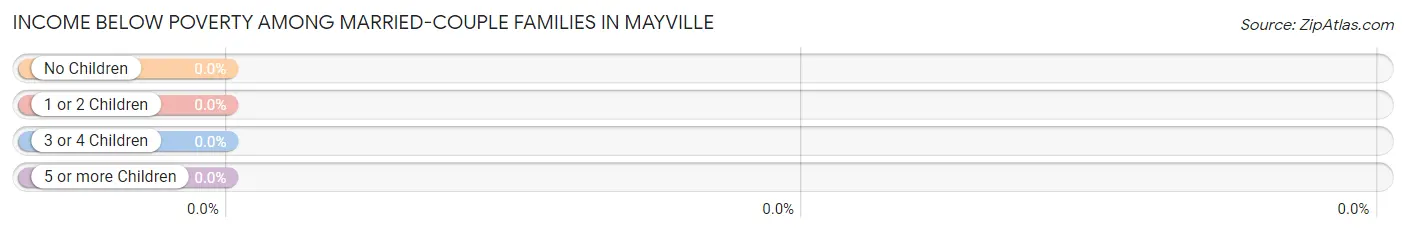
Income Below Poverty Among Married-Couple Families in Mayville
| Children | Above Poverty | Below Poverty |
| No Children | 132 (100.0%) | 0 (0.0%) |
| 1 or 2 Children | 135 (100.0%) | 0 (0.0%) |
| 3 or 4 Children | 31 (100.0%) | 0 (0.0%) |
| 5 or more Children | 0 (0.0%) | 0 (0.0%) |
| Total | 298 (100.0%) | 0 (0.0%) |
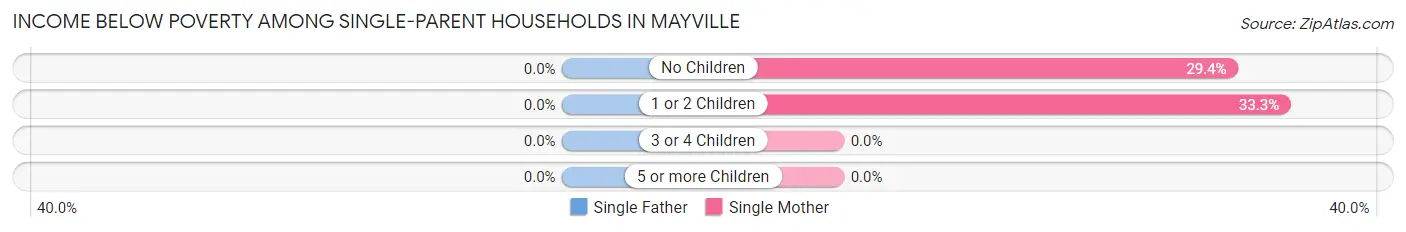
Income Below Poverty Among Single-Parent Households in Mayville
| Children | Single Father | Single Mother |
| No Children | 0 (0.0%) | 5 (29.4%) |
| 1 or 2 Children | 0 (0.0%) | 20 (33.3%) |
| 3 or 4 Children | 0 (0.0%) | 0 (0.0%) |
| 5 or more Children | 0 (0.0%) | 0 (0.0%) |
| Total | 0 (0.0%) | 25 (30.5%) |
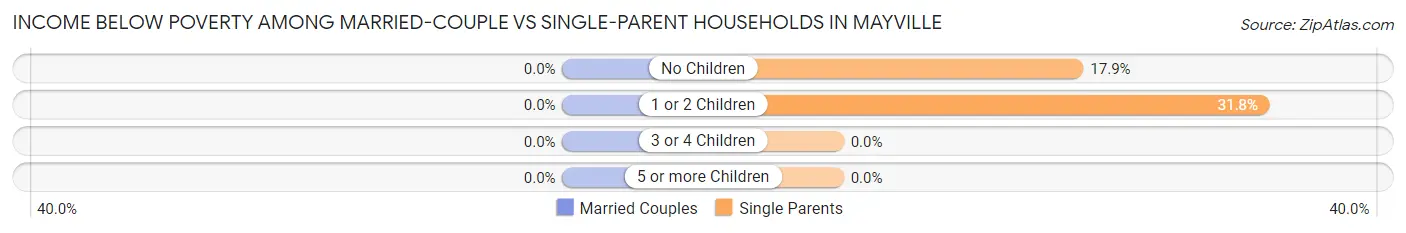
Income Below Poverty Among Married-Couple vs Single-Parent Households in Mayville
| Children | Married-Couple Families | Single-Parent Households |
| No Children | 0 (0.0%) | 5 (17.9%) |
| 1 or 2 Children | 0 (0.0%) | 20 (31.8%) |
| 3 or 4 Children | 0 (0.0%) | 0 (0.0%) |
| 5 or more Children | 0 (0.0%) | 0 (0.0%) |
| Total | 0 (0.0%) | 25 (25.5%) |
Employment Characteristics in Mayville
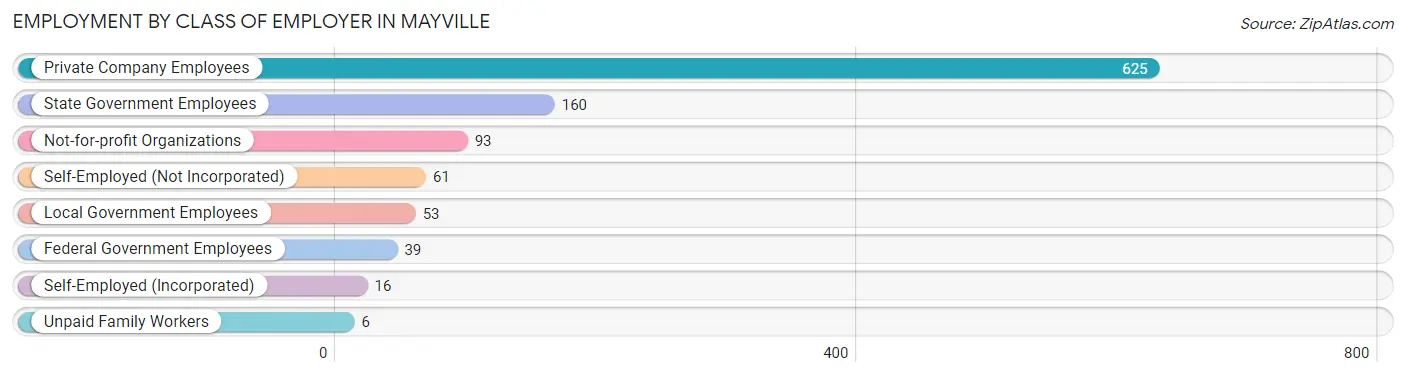
Employment by Class of Employer in Mayville
Among the 1,053 employed individuals in Mayville, private company employees (625 | 59.4%), state government employees (160 | 15.2%), and not-for-profit organizations (93 | 8.8%) make up the most common classes of employment.
| Employer Class | # Employees | % Employees |
| Private Company Employees | 625 | 59.4% |
| Self-Employed (Incorporated) | 16 | 1.5% |
| Self-Employed (Not Incorporated) | 61 | 5.8% |
| Not-for-profit Organizations | 93 | 8.8% |
| Local Government Employees | 53 | 5.0% |
| State Government Employees | 160 | 15.2% |
| Federal Government Employees | 39 | 3.7% |
| Unpaid Family Workers | 6 | 0.6% |
| Total | 1,053 | 100.0% |
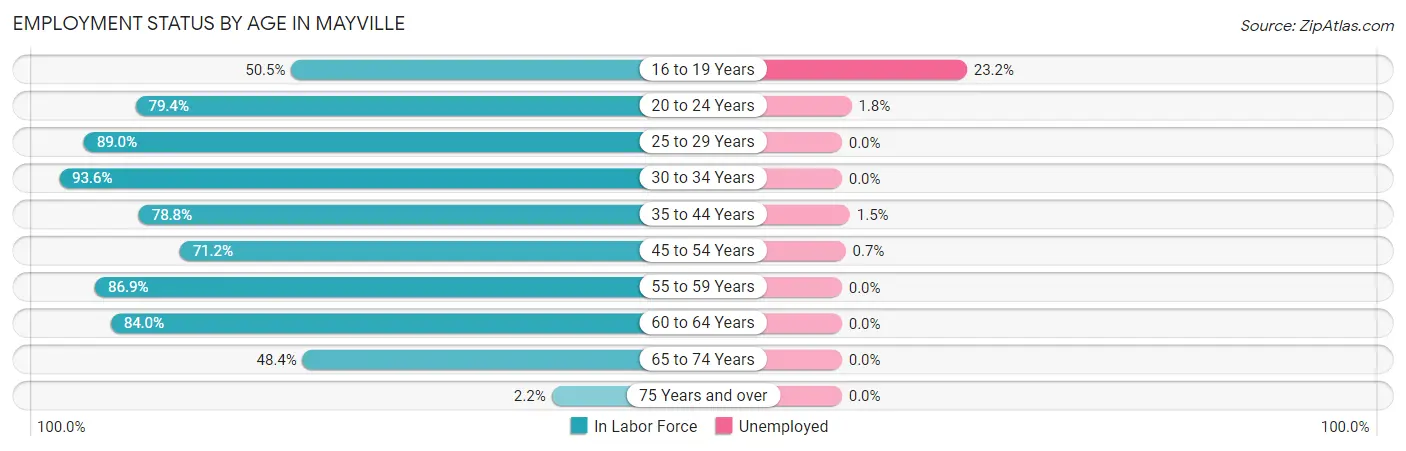
Employment Status by Age in Mayville
According to the labor force statistics for Mayville, out of the total population over 16 years of age (1,785), 64.0% or 1,142 individuals are in the labor force, with 3.6% or 41 of them unemployed. The age group with the highest labor force participation rate is 30 to 34 years, with 93.6% or 73 individuals in the labor force. Within the labor force, the 16 to 19 years age range has the highest percentage of unemployed individuals, with 23.2% or 32 of them being unemployed.
| Age Bracket | In Labor Force | Unemployed |
| 16 to 19 Years | 138 (50.5%) | 32 (23.2%) |
| 20 to 24 Years | 278 (79.4%) | 5 (1.8%) |
| 25 to 29 Years | 137 (89.0%) | 0 (0.0%) |
| 30 to 34 Years | 73 (93.6%) | 0 (0.0%) |
| 35 to 44 Years | 201 (78.8%) | 3 (1.5%) |
| 45 to 54 Years | 136 (71.2%) | 1 (0.7%) |
| 55 to 59 Years | 53 (86.9%) | 0 (0.0%) |
| 60 to 64 Years | 63 (84.0%) | 0 (0.0%) |
| 65 to 74 Years | 59 (48.4%) | 0 (0.0%) |
| 75 Years and over | 5 (2.2%) | 0 (0.0%) |
| Total | 1,142 (64.0%) | 41 (3.6%) |
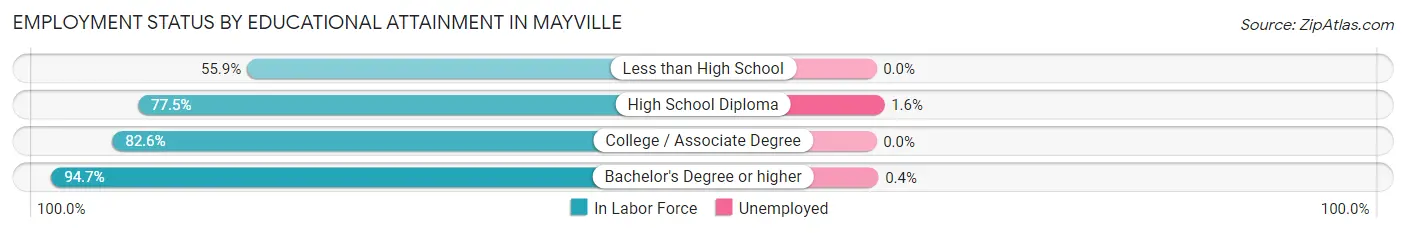
Employment Status by Educational Attainment in Mayville
According to labor force statistics for Mayville, 81.4% of individuals (663) out of the total population between 25 and 64 years of age (814) are in the labor force, with 0.6% or 4 of them being unemployed. The group with the highest labor force participation rate are those with the educational attainment of bachelor's degree or higher, with 94.7% or 233 individuals in the labor force. Within the labor force, individuals with high school diploma education have the highest percentage of unemployment, with 1.6% or 3 of them being unemployed.
| Educational Attainment | In Labor Force | Unemployed |
| Less than High School | 57 (55.9%) | 0 (0.0%) |
| High School Diploma | 183 (77.5%) | 4 (1.6%) |
| College / Associate Degree | 190 (82.6%) | 0 (0.0%) |
| Bachelor's Degree or higher | 233 (94.7%) | 1 (0.4%) |
| Total | 663 (81.4%) | 5 (0.6%) |
Employment Occupations by Sex in Mayville
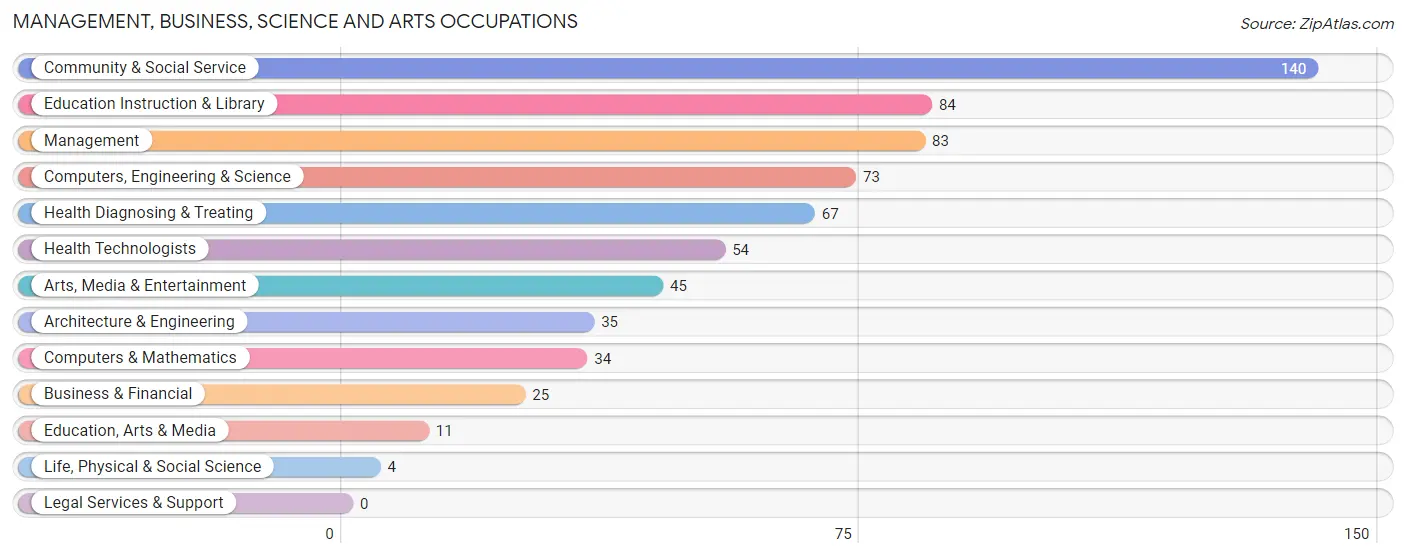
Management, Business, Science and Arts Occupations
The most common Management, Business, Science and Arts occupations in Mayville are Community & Social Service (140 | 12.7%), Education Instruction & Library (84 | 7.6%), Management (83 | 7.5%), Computers, Engineering & Science (73 | 6.6%), and Health Diagnosing & Treating (67 | 6.1%).
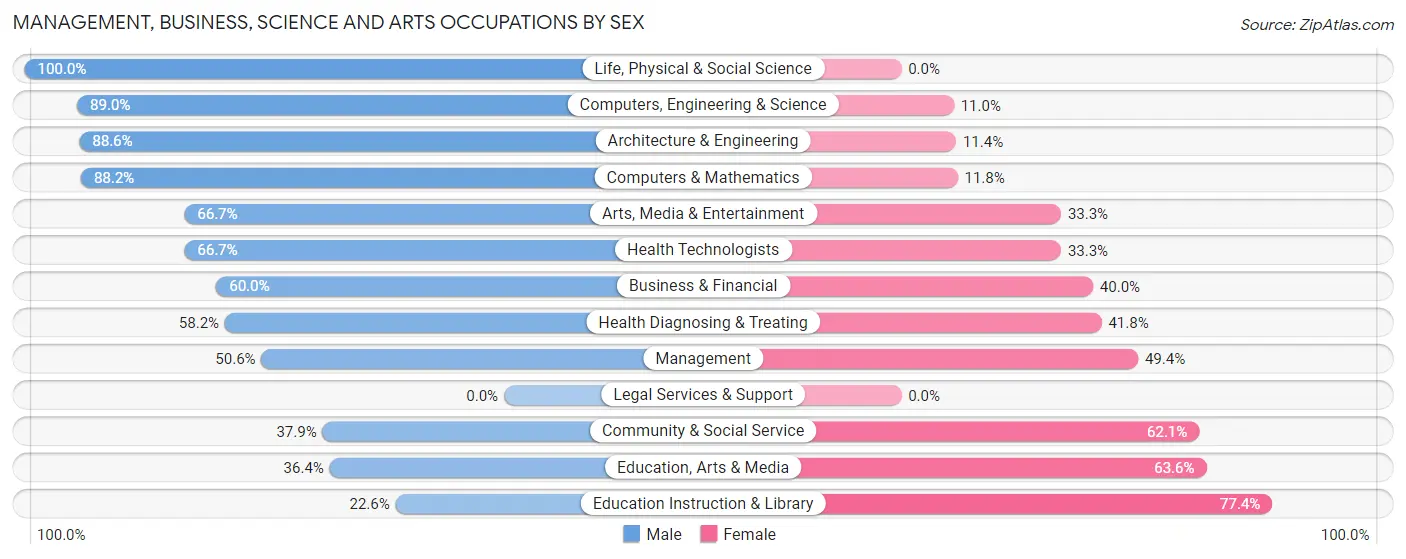
Management, Business, Science and Arts Occupations by Sex
Within the Management, Business, Science and Arts occupations in Mayville, the most male-oriented occupations are Life, Physical & Social Science (100.0%), Computers, Engineering & Science (89.0%), and Architecture & Engineering (88.6%), while the most female-oriented occupations are Education Instruction & Library (77.4%), Education, Arts & Media (63.6%), and Community & Social Service (62.1%).
| Occupation | Male | Female |
| Management | 42 (50.6%) | 41 (49.4%) |
| Business & Financial | 15 (60.0%) | 10 (40.0%) |
| Computers, Engineering & Science | 65 (89.0%) | 8 (11.0%) |
| Computers & Mathematics | 30 (88.2%) | 4 (11.8%) |
| Architecture & Engineering | 31 (88.6%) | 4 (11.4%) |
| Life, Physical & Social Science | 4 (100.0%) | 0 (0.0%) |
| Community & Social Service | 53 (37.9%) | 87 (62.1%) |
| Education, Arts & Media | 4 (36.4%) | 7 (63.6%) |
| Legal Services & Support | 0 (0.0%) | 0 (0.0%) |
| Education Instruction & Library | 19 (22.6%) | 65 (77.4%) |
| Arts, Media & Entertainment | 30 (66.7%) | 15 (33.3%) |
| Health Diagnosing & Treating | 39 (58.2%) | 28 (41.8%) |
| Health Technologists | 36 (66.7%) | 18 (33.3%) |
| Total (Category) | 214 (55.1%) | 174 (44.9%) |
| Total (Overall) | 599 (54.4%) | 503 (45.6%) |
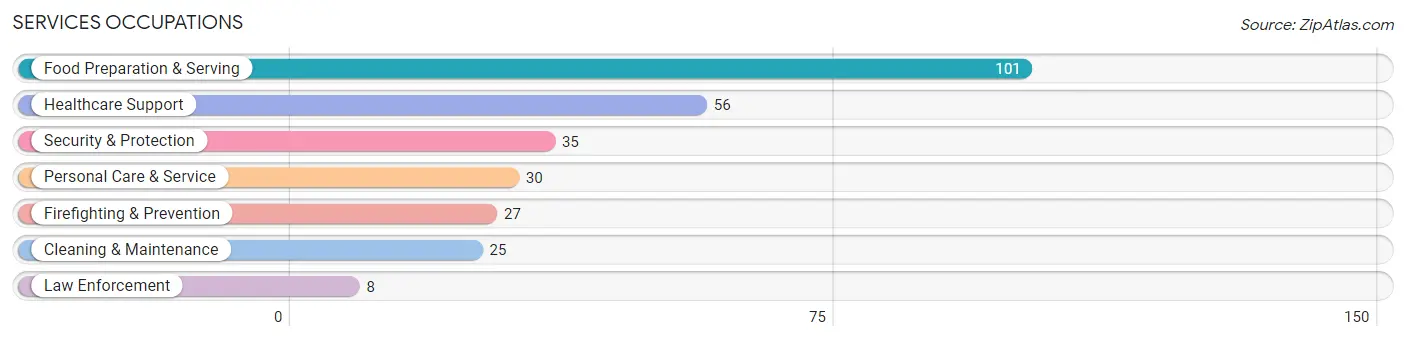
Services Occupations
The most common Services occupations in Mayville are Food Preparation & Serving (101 | 9.2%), Healthcare Support (56 | 5.1%), Security & Protection (35 | 3.2%), Personal Care & Service (30 | 2.7%), and Firefighting & Prevention (27 | 2.5%).
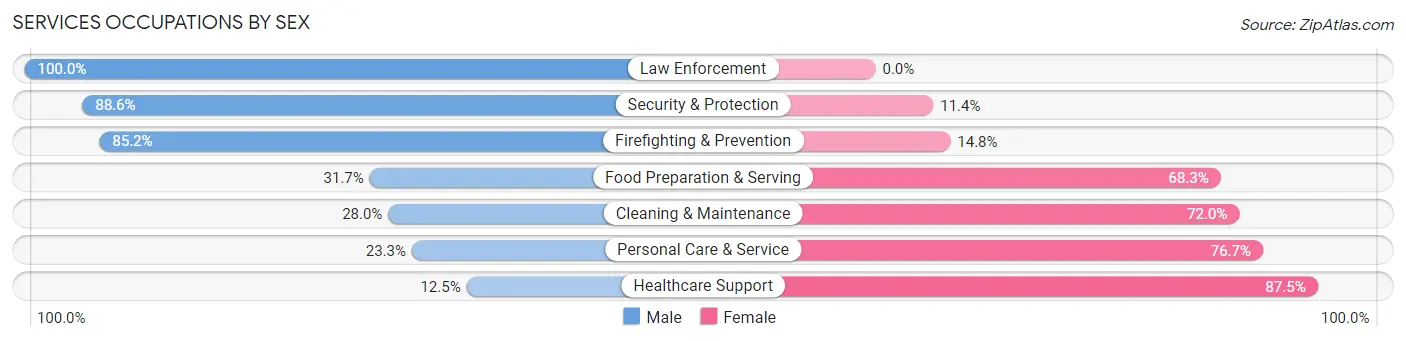
Services Occupations by Sex
Within the Services occupations in Mayville, the most male-oriented occupations are Law Enforcement (100.0%), Security & Protection (88.6%), and Firefighting & Prevention (85.2%), while the most female-oriented occupations are Healthcare Support (87.5%), Personal Care & Service (76.7%), and Cleaning & Maintenance (72.0%).
| Occupation | Male | Female |
| Healthcare Support | 7 (12.5%) | 49 (87.5%) |
| Security & Protection | 31 (88.6%) | 4 (11.4%) |
| Firefighting & Prevention | 23 (85.2%) | 4 (14.8%) |
| Law Enforcement | 8 (100.0%) | 0 (0.0%) |
| Food Preparation & Serving | 32 (31.7%) | 69 (68.3%) |
| Cleaning & Maintenance | 7 (28.0%) | 18 (72.0%) |
| Personal Care & Service | 7 (23.3%) | 23 (76.7%) |
| Total (Category) | 84 (34.0%) | 163 (66.0%) |
| Total (Overall) | 599 (54.4%) | 503 (45.6%) |
Sales and Office Occupations
The most common Sales and Office occupations in Mayville are Office & Administration (120 | 10.9%), and Sales & Related (83 | 7.5%).

Sales and Office Occupations by Sex

| Occupation | Male | Female |
| Sales & Related | 60 (72.3%) | 23 (27.7%) |
| Office & Administration | 15 (12.5%) | 105 (87.5%) |
| Total (Category) | 75 (36.9%) | 128 (63.0%) |
| Total (Overall) | 599 (54.4%) | 503 (45.6%) |
Natural Resources, Construction and Maintenance Occupations
The most common Natural Resources, Construction and Maintenance occupations in Mayville are Construction & Extraction (70 | 6.4%), Installation, Maintenance & Repair (38 | 3.5%), and Farming, Fishing & Forestry (30 | 2.7%).
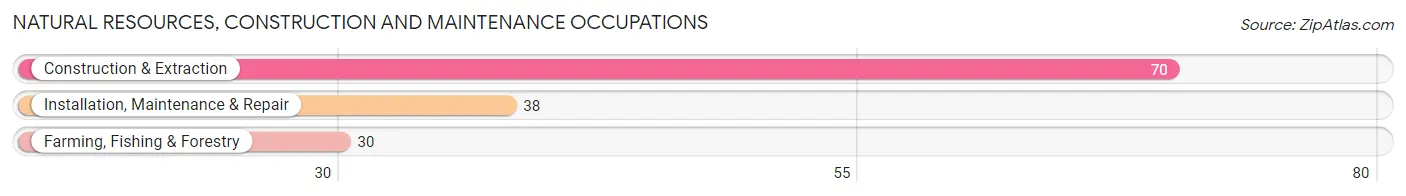
Natural Resources, Construction and Maintenance Occupations by Sex

| Occupation | Male | Female |
| Farming, Fishing & Forestry | 30 (100.0%) | 0 (0.0%) |
| Construction & Extraction | 70 (100.0%) | 0 (0.0%) |
| Installation, Maintenance & Repair | 38 (100.0%) | 0 (0.0%) |
| Total (Category) | 138 (100.0%) | 0 (0.0%) |
| Total (Overall) | 599 (54.4%) | 503 (45.6%) |
Production, Transportation and Moving Occupations
The most common Production, Transportation and Moving occupations in Mayville are Production (66 | 6.0%), Transportation (35 | 3.2%), and Material Moving (25 | 2.3%).
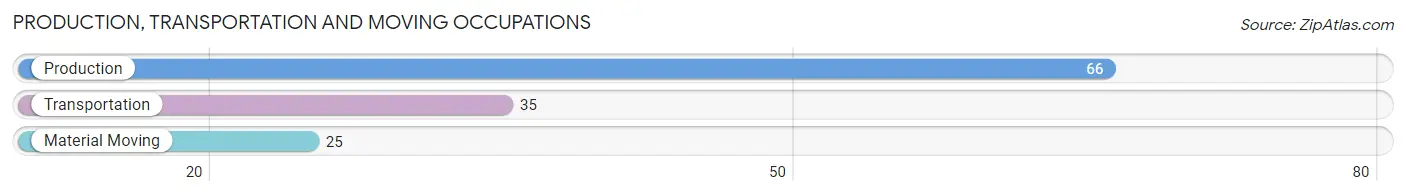
Production, Transportation and Moving Occupations by Sex
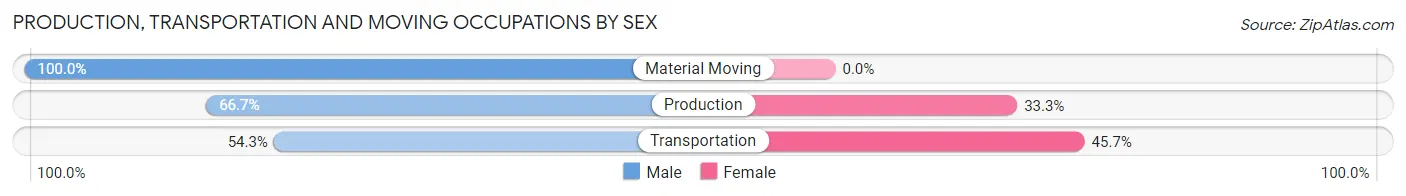
| Occupation | Male | Female |
| Production | 44 (66.7%) | 22 (33.3%) |
| Transportation | 19 (54.3%) | 16 (45.7%) |
| Material Moving | 25 (100.0%) | 0 (0.0%) |
| Total (Category) | 88 (69.8%) | 38 (30.2%) |
| Total (Overall) | 599 (54.4%) | 503 (45.6%) |
Employment Industries by Sex in Mayville
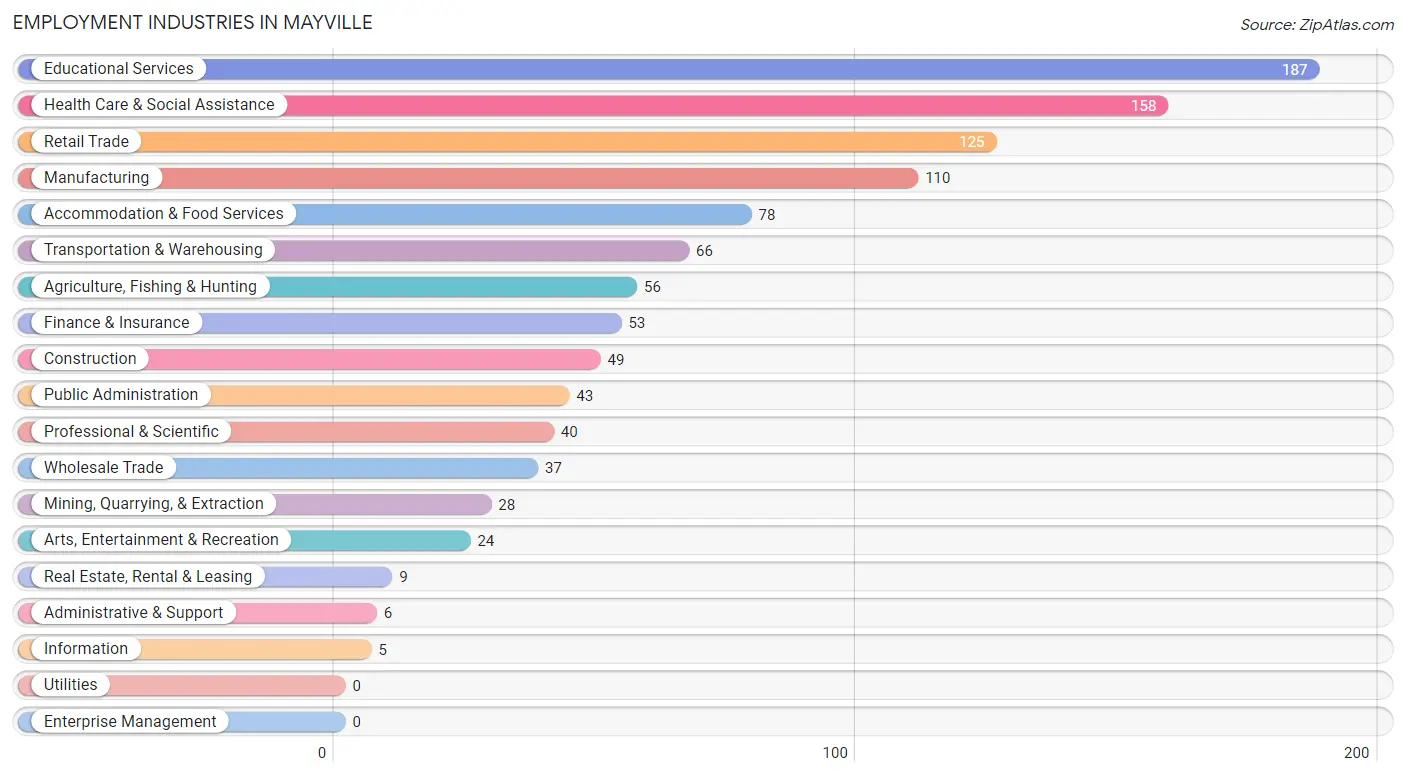
Employment Industries in Mayville
The major employment industries in Mayville include Educational Services (187 | 17.0%), Health Care & Social Assistance (158 | 14.3%), Retail Trade (125 | 11.3%), Manufacturing (110 | 10.0%), and Accommodation & Food Services (78 | 7.1%).
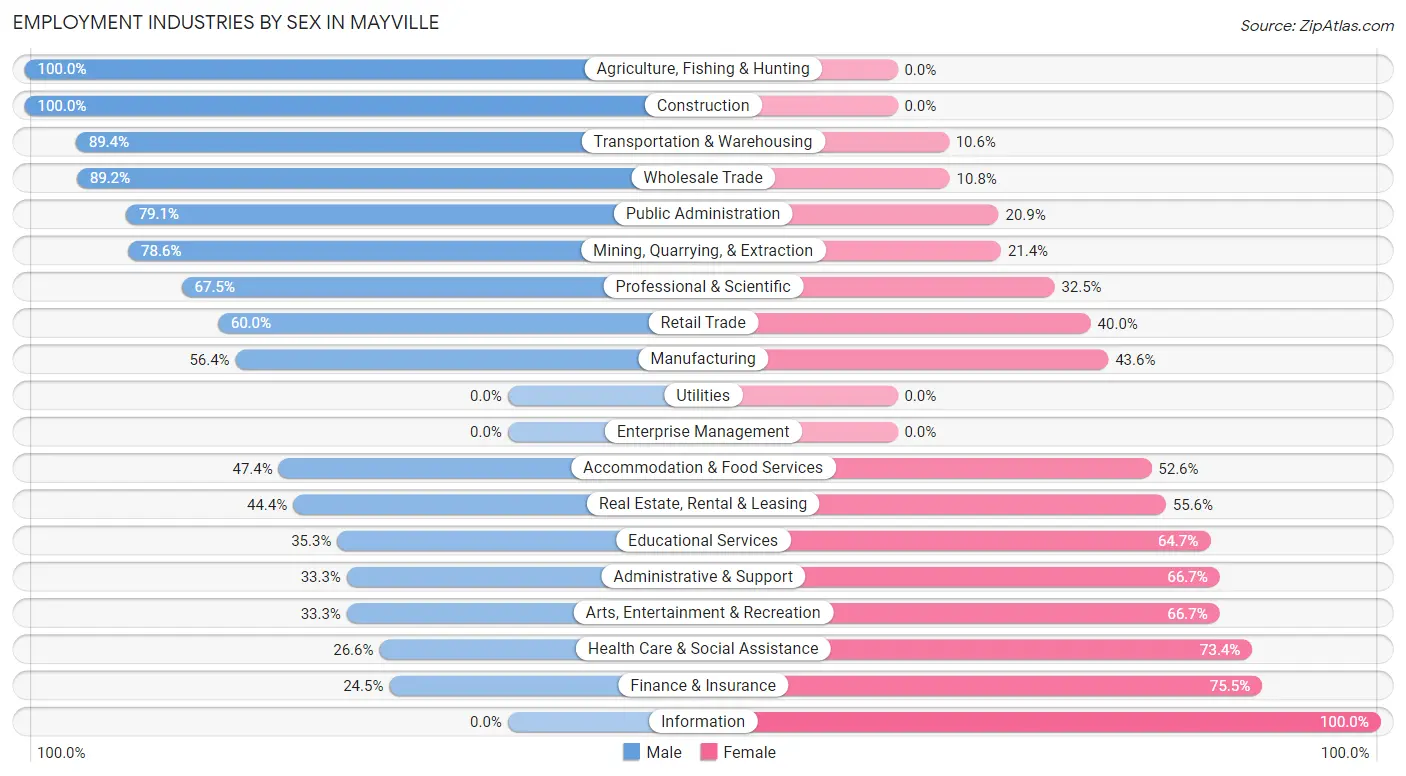
Employment Industries by Sex in Mayville
The Mayville industries that see more men than women are Agriculture, Fishing & Hunting (100.0%), Construction (100.0%), and Transportation & Warehousing (89.4%), whereas the industries that tend to have a higher number of women are Information (100.0%), Finance & Insurance (75.5%), and Health Care & Social Assistance (73.4%).
| Industry | Male | Female |
| Agriculture, Fishing & Hunting | 56 (100.0%) | 0 (0.0%) |
| Mining, Quarrying, & Extraction | 22 (78.6%) | 6 (21.4%) |
| Construction | 49 (100.0%) | 0 (0.0%) |
| Manufacturing | 62 (56.4%) | 48 (43.6%) |
| Wholesale Trade | 33 (89.2%) | 4 (10.8%) |
| Retail Trade | 75 (60.0%) | 50 (40.0%) |
| Transportation & Warehousing | 59 (89.4%) | 7 (10.6%) |
| Utilities | 0 (0.0%) | 0 (0.0%) |
| Information | 0 (0.0%) | 5 (100.0%) |
| Finance & Insurance | 13 (24.5%) | 40 (75.5%) |
| Real Estate, Rental & Leasing | 4 (44.4%) | 5 (55.6%) |
| Professional & Scientific | 27 (67.5%) | 13 (32.5%) |
| Enterprise Management | 0 (0.0%) | 0 (0.0%) |
| Administrative & Support | 2 (33.3%) | 4 (66.7%) |
| Educational Services | 66 (35.3%) | 121 (64.7%) |
| Health Care & Social Assistance | 42 (26.6%) | 116 (73.4%) |
| Arts, Entertainment & Recreation | 8 (33.3%) | 16 (66.7%) |
| Accommodation & Food Services | 37 (47.4%) | 41 (52.6%) |
| Public Administration | 34 (79.1%) | 9 (20.9%) |
| Total | 599 (54.4%) | 503 (45.6%) |
Education in Mayville
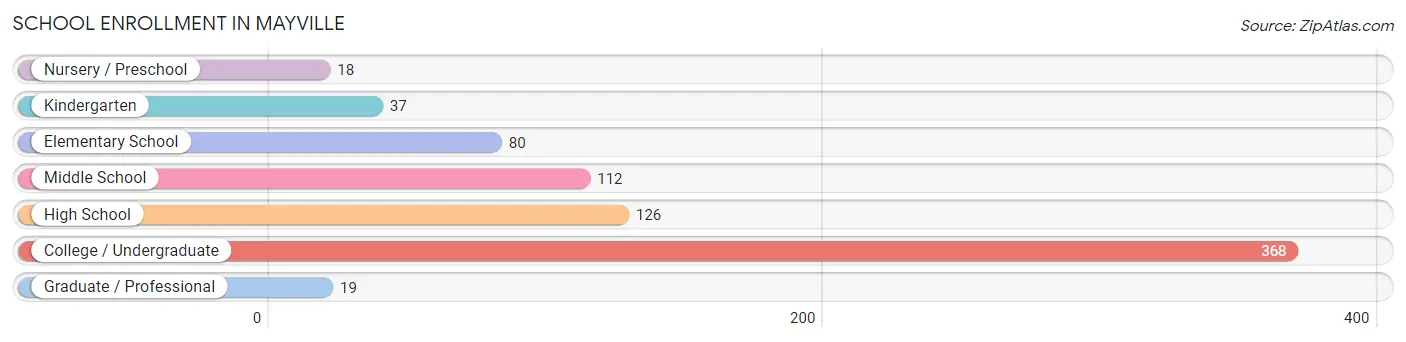
School Enrollment in Mayville
The most common levels of schooling among the 760 students in Mayville are college / undergraduate (368 | 48.4%), high school (126 | 16.6%), and middle school (112 | 14.7%).
| School Level | # Students | % Students |
| Nursery / Preschool | 18 | 2.4% |
| Kindergarten | 37 | 4.9% |
| Elementary School | 80 | 10.5% |
| Middle School | 112 | 14.7% |
| High School | 126 | 16.6% |
| College / Undergraduate | 368 | 48.4% |
| Graduate / Professional | 19 | 2.5% |
| Total | 760 | 100.0% |
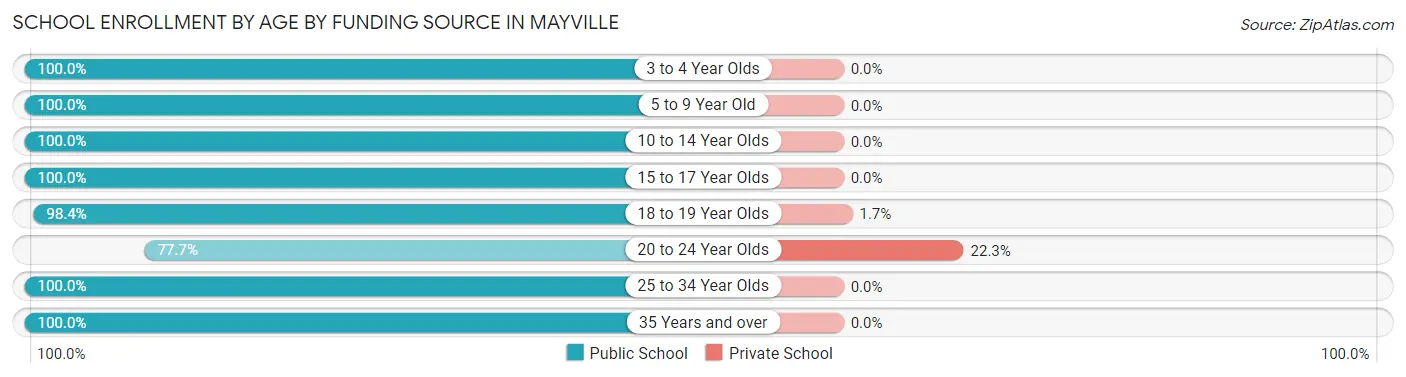
School Enrollment by Age by Funding Source in Mayville
Out of a total of 760 students who are enrolled in schools in Mayville, 45 (5.9%) attend a private institution, while the remaining 715 (94.1%) are enrolled in public schools. The age group of 20 to 24 year olds has the highest likelihood of being enrolled in private schools, with 42 (22.3% in the age bracket) enrolled. Conversely, the age group of 3 to 4 year olds has the lowest likelihood of being enrolled in a private school, with 10 (100.0% in the age bracket) attending a public institution.
| Age Bracket | Public School | Private School |
| 3 to 4 Year Olds | 10 (100.0%) | 0 (0.0%) |
| 5 to 9 Year Old | 94 (100.0%) | 0 (0.0%) |
| 10 to 14 Year Olds | 143 (100.0%) | 0 (0.0%) |
| 15 to 17 Year Olds | 115 (100.0%) | 0 (0.0%) |
| 18 to 19 Year Olds | 179 (98.4%) | 3 (1.7%) |
| 20 to 24 Year Olds | 146 (77.7%) | 42 (22.3%) |
| 25 to 34 Year Olds | 9 (100.0%) | 0 (0.0%) |
| 35 Years and over | 19 (100.0%) | 0 (0.0%) |
| Total | 715 (94.1%) | 45 (5.9%) |
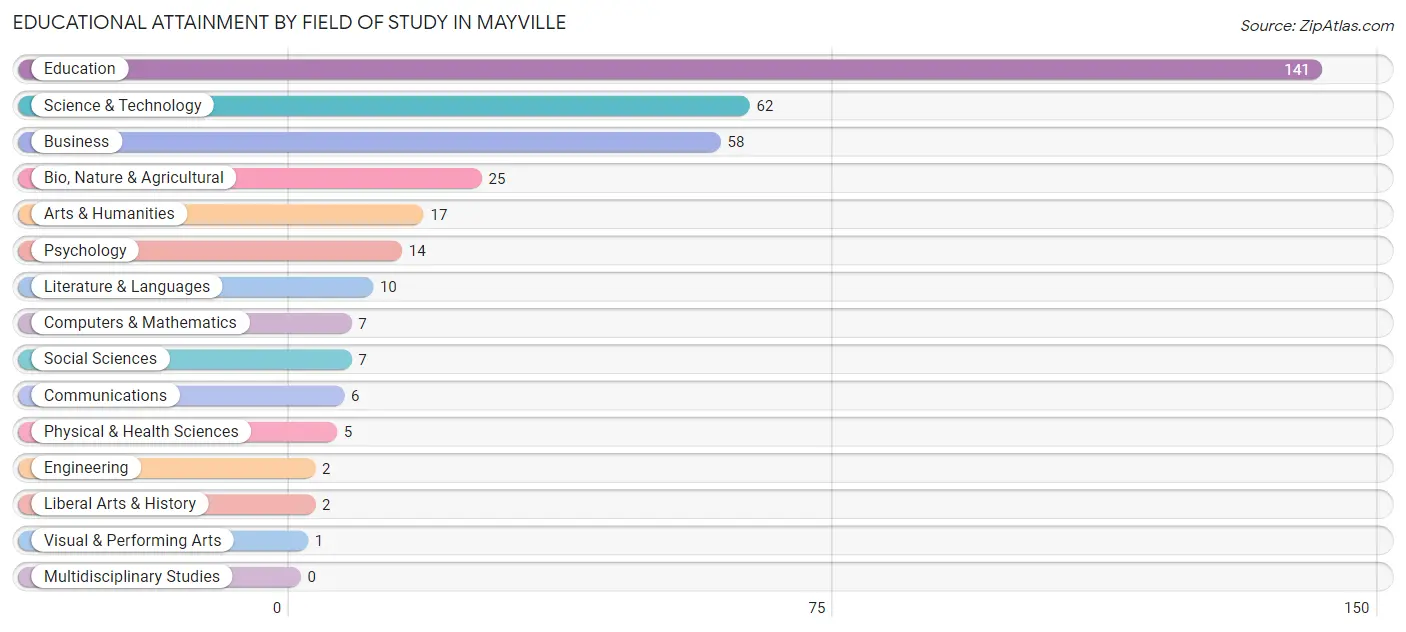
Educational Attainment by Field of Study in Mayville
Education (141 | 39.5%), science & technology (62 | 17.4%), business (58 | 16.3%), bio, nature & agricultural (25 | 7.0%), and arts & humanities (17 | 4.8%) are the most common fields of study among 357 individuals in Mayville who have obtained a bachelor's degree or higher.
| Field of Study | # Graduates | % Graduates |
| Computers & Mathematics | 7 | 2.0% |
| Bio, Nature & Agricultural | 25 | 7.0% |
| Physical & Health Sciences | 5 | 1.4% |
| Psychology | 14 | 3.9% |
| Social Sciences | 7 | 2.0% |
| Engineering | 2 | 0.6% |
| Multidisciplinary Studies | 0 | 0.0% |
| Science & Technology | 62 | 17.4% |
| Business | 58 | 16.3% |
| Education | 141 | 39.5% |
| Literature & Languages | 10 | 2.8% |
| Liberal Arts & History | 2 | 0.6% |
| Visual & Performing Arts | 1 | 0.3% |
| Communications | 6 | 1.7% |
| Arts & Humanities | 17 | 4.8% |
| Total | 357 | 100.0% |
Transportation & Commute in Mayville
Vehicle Availability by Sex in Mayville
The most prevalent vehicle ownership categories in Mayville are males with 2 vehicles (235, accounting for 48.1%) and females with 2 vehicles (262, making up 52.1%).
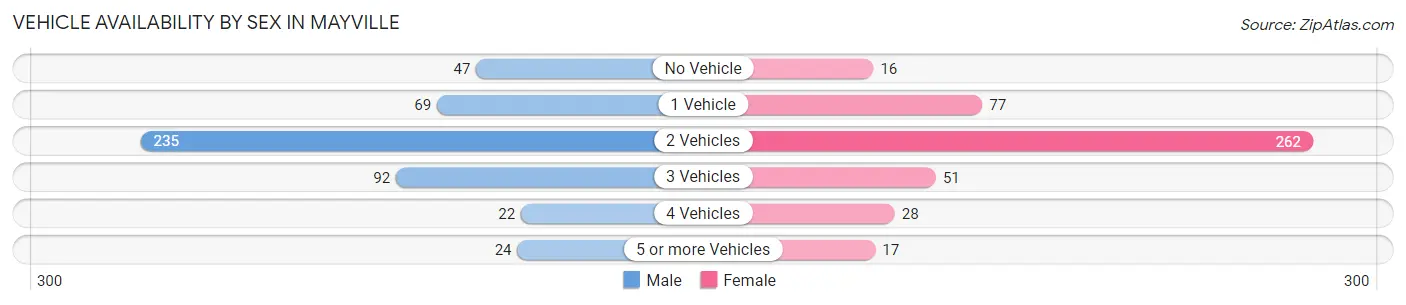
| Vehicles Available | Male | Female |
| No Vehicle | 47 (9.6%) | 16 (3.5%) |
| 1 Vehicle | 69 (14.1%) | 77 (17.1%) |
| 2 Vehicles | 235 (48.1%) | 262 (58.1%) |
| 3 Vehicles | 92 (18.8%) | 51 (11.3%) |
| 4 Vehicles | 22 (4.5%) | 28 (6.2%) |
| 5 or more Vehicles | 24 (4.9%) | 17 (3.8%) |
| Total | 489 (100.0%) | 451 (100.0%) |
Commute Time in Mayville
The most frequently occuring commute durations in Mayville are 5 to 9 minutes (304 commuters, 29.7%), less than 5 minutes (293 commuters, 28.6%), and 20 to 24 minutes (111 commuters, 10.8%).
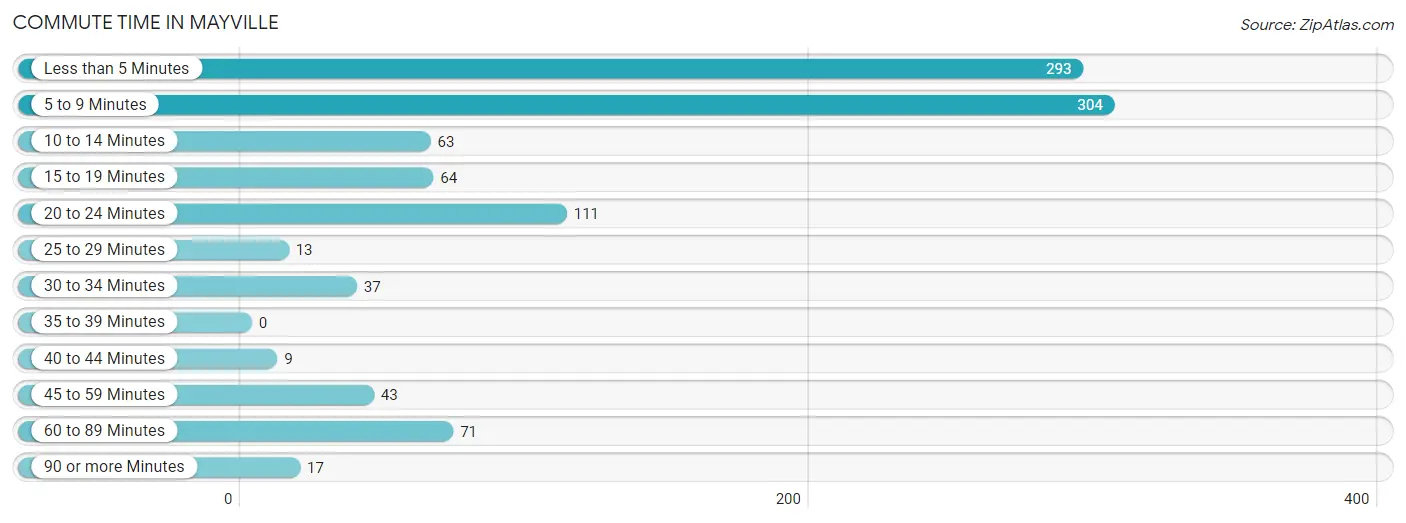
| Commute Time | # Commuters | % Commuters |
| Less than 5 Minutes | 293 | 28.6% |
| 5 to 9 Minutes | 304 | 29.7% |
| 10 to 14 Minutes | 63 | 6.1% |
| 15 to 19 Minutes | 64 | 6.2% |
| 20 to 24 Minutes | 111 | 10.8% |
| 25 to 29 Minutes | 13 | 1.3% |
| 30 to 34 Minutes | 37 | 3.6% |
| 35 to 39 Minutes | 0 | 0.0% |
| 40 to 44 Minutes | 9 | 0.9% |
| 45 to 59 Minutes | 43 | 4.2% |
| 60 to 89 Minutes | 71 | 6.9% |
| 90 or more Minutes | 17 | 1.7% |
Commute Time by Sex in Mayville
The most common commute times in Mayville are 5 to 9 minutes (154 commuters, 27.3%) for males and less than 5 minutes (164 commuters, 35.6%) for females.
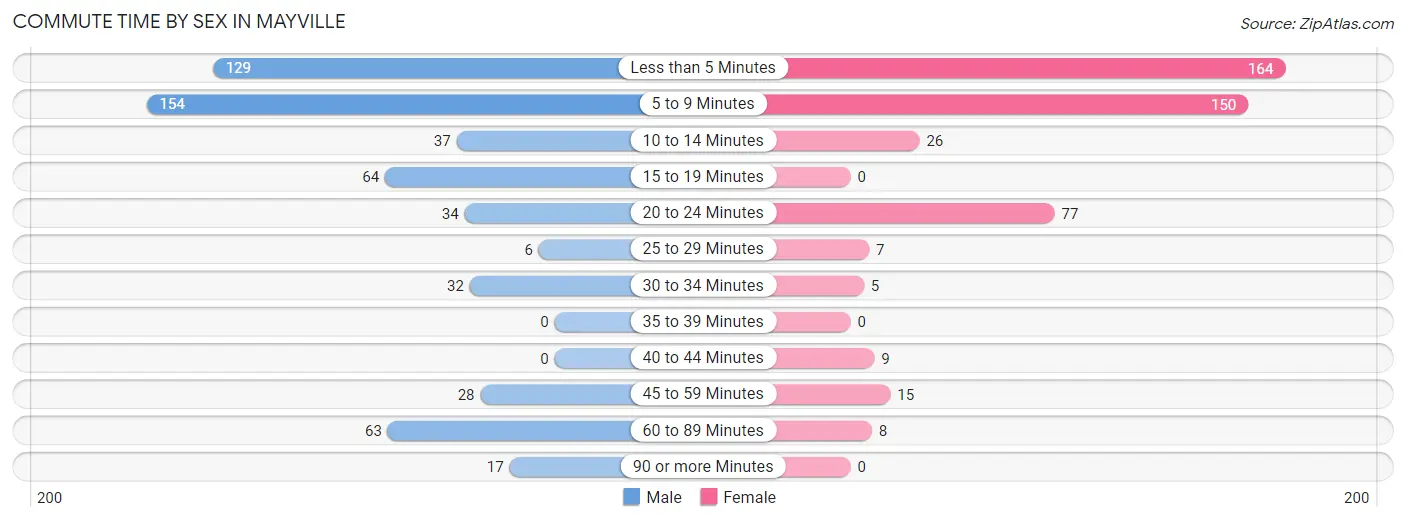
| Commute Time | Male | Female |
| Less than 5 Minutes | 129 (22.9%) | 164 (35.6%) |
| 5 to 9 Minutes | 154 (27.3%) | 150 (32.5%) |
| 10 to 14 Minutes | 37 (6.6%) | 26 (5.6%) |
| 15 to 19 Minutes | 64 (11.4%) | 0 (0.0%) |
| 20 to 24 Minutes | 34 (6.0%) | 77 (16.7%) |
| 25 to 29 Minutes | 6 (1.1%) | 7 (1.5%) |
| 30 to 34 Minutes | 32 (5.7%) | 5 (1.1%) |
| 35 to 39 Minutes | 0 (0.0%) | 0 (0.0%) |
| 40 to 44 Minutes | 0 (0.0%) | 9 (1.9%) |
| 45 to 59 Minutes | 28 (5.0%) | 15 (3.3%) |
| 60 to 89 Minutes | 63 (11.2%) | 8 (1.7%) |
| 90 or more Minutes | 17 (3.0%) | 0 (0.0%) |
Time of Departure to Work by Sex in Mayville
The most frequent times of departure to work in Mayville are 6:30 AM to 6:59 AM (82, 14.5%) for males and 7:30 AM to 7:59 AM (196, 42.5%) for females.
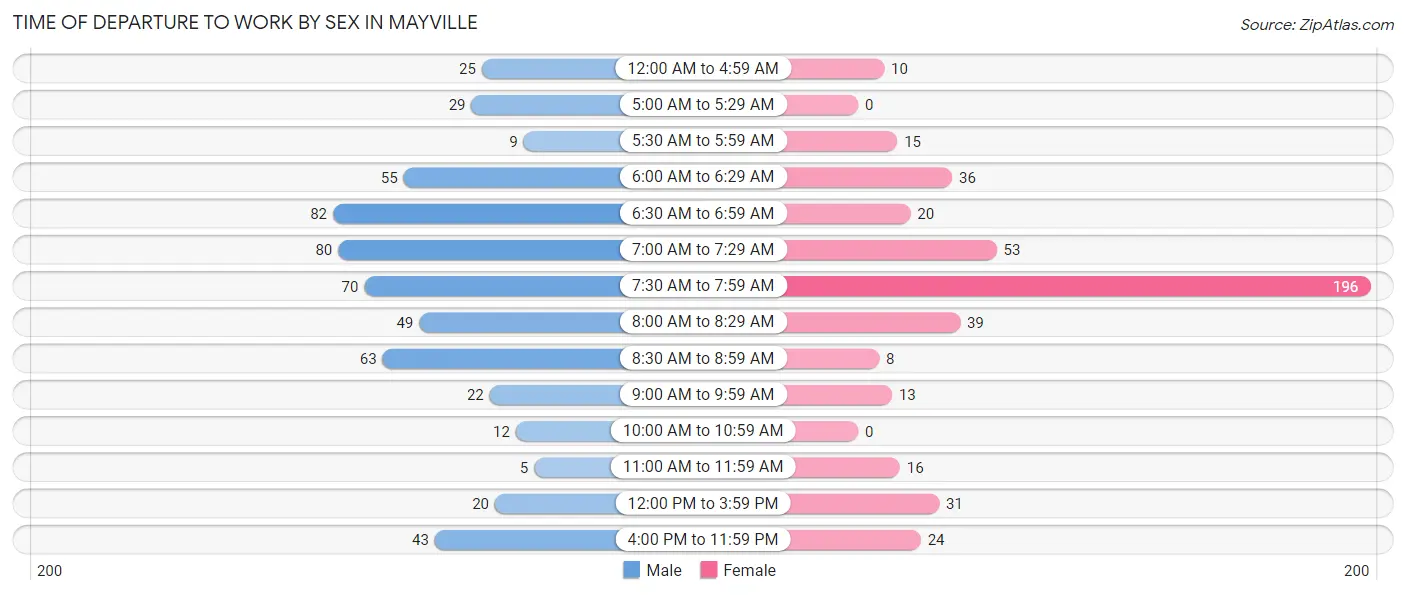
| Time of Departure | Male | Female |
| 12:00 AM to 4:59 AM | 25 (4.4%) | 10 (2.2%) |
| 5:00 AM to 5:29 AM | 29 (5.1%) | 0 (0.0%) |
| 5:30 AM to 5:59 AM | 9 (1.6%) | 15 (3.3%) |
| 6:00 AM to 6:29 AM | 55 (9.8%) | 36 (7.8%) |
| 6:30 AM to 6:59 AM | 82 (14.5%) | 20 (4.3%) |
| 7:00 AM to 7:29 AM | 80 (14.2%) | 53 (11.5%) |
| 7:30 AM to 7:59 AM | 70 (12.4%) | 196 (42.5%) |
| 8:00 AM to 8:29 AM | 49 (8.7%) | 39 (8.5%) |
| 8:30 AM to 8:59 AM | 63 (11.2%) | 8 (1.7%) |
| 9:00 AM to 9:59 AM | 22 (3.9%) | 13 (2.8%) |
| 10:00 AM to 10:59 AM | 12 (2.1%) | 0 (0.0%) |
| 11:00 AM to 11:59 AM | 5 (0.9%) | 16 (3.5%) |
| 12:00 PM to 3:59 PM | 20 (3.5%) | 31 (6.7%) |
| 4:00 PM to 11:59 PM | 43 (7.6%) | 24 (5.2%) |
| Total | 564 (100.0%) | 461 (100.0%) |
Housing Occupancy in Mayville
Occupancy by Ownership in Mayville
Of the total 765 dwellings in Mayville, owner-occupied units account for 342 (44.7%), while renter-occupied units make up 423 (55.3%).
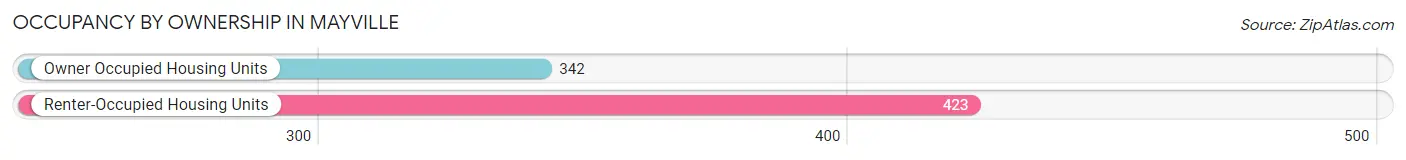
| Occupancy | # Housing Units | % Housing Units |
| Owner Occupied Housing Units | 342 | 44.7% |
| Renter-Occupied Housing Units | 423 | 55.3% |
| Total Occupied Housing Units | 765 | 100.0% |
Occupancy by Household Size in Mayville
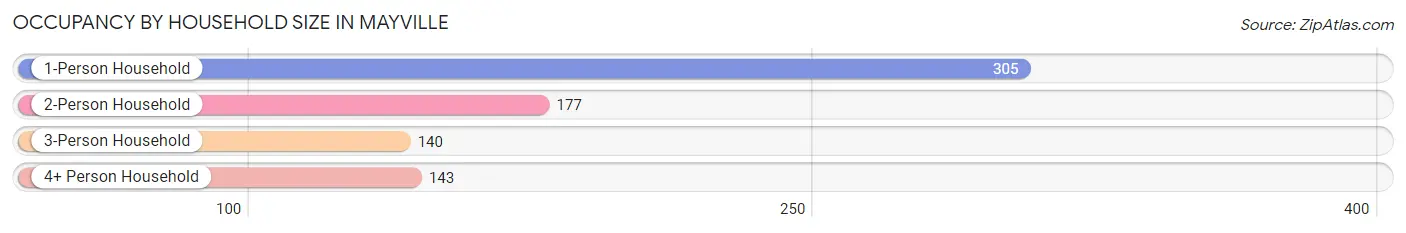
| Household Size | # Housing Units | % Housing Units |
| 1-Person Household | 305 | 39.9% |
| 2-Person Household | 177 | 23.1% |
| 3-Person Household | 140 | 18.3% |
| 4+ Person Household | 143 | 18.7% |
| Total Housing Units | 765 | 100.0% |
Occupancy by Ownership by Household Size in Mayville
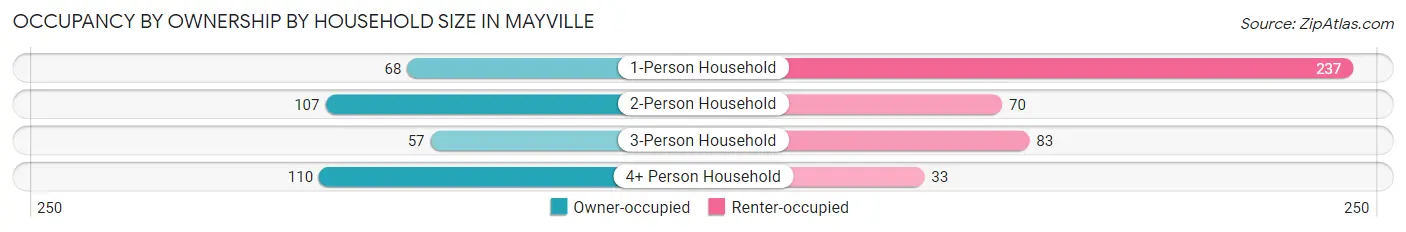
| Household Size | Owner-occupied | Renter-occupied |
| 1-Person Household | 68 (22.3%) | 237 (77.7%) |
| 2-Person Household | 107 (60.5%) | 70 (39.6%) |
| 3-Person Household | 57 (40.7%) | 83 (59.3%) |
| 4+ Person Household | 110 (76.9%) | 33 (23.1%) |
| Total Housing Units | 342 (44.7%) | 423 (55.3%) |
Occupancy by Educational Attainment in Mayville
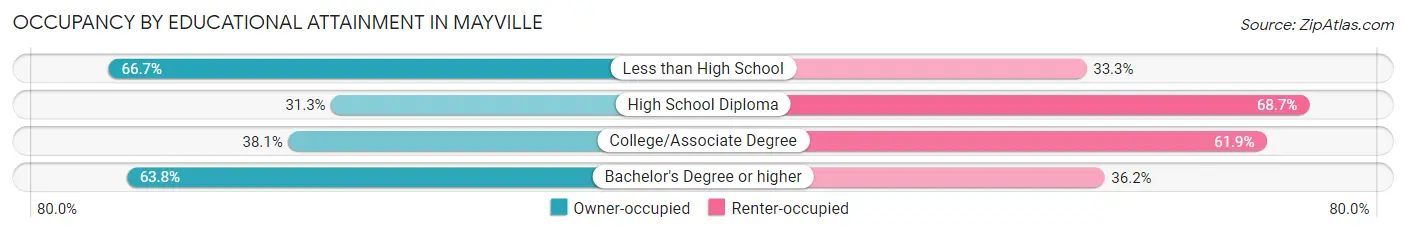
| Household Size | Owner-occupied | Renter-occupied |
| Less than High School | 22 (66.7%) | 11 (33.3%) |
| High School Diploma | 73 (31.3%) | 160 (68.7%) |
| College/Associate Degree | 106 (38.1%) | 172 (61.9%) |
| Bachelor's Degree or higher | 141 (63.8%) | 80 (36.2%) |
Occupancy by Age of Householder in Mayville
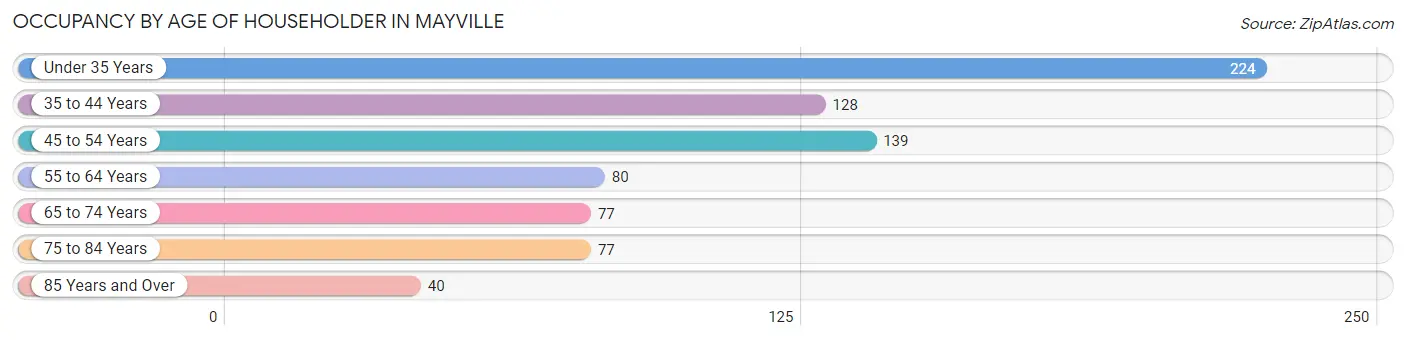
| Age Bracket | # Households | % Households |
| Under 35 Years | 224 | 29.3% |
| 35 to 44 Years | 128 | 16.7% |
| 45 to 54 Years | 139 | 18.2% |
| 55 to 64 Years | 80 | 10.5% |
| 65 to 74 Years | 77 | 10.1% |
| 75 to 84 Years | 77 | 10.1% |
| 85 Years and Over | 40 | 5.2% |
| Total | 765 | 100.0% |
Housing Finances in Mayville
Median Income by Occupancy in Mayville
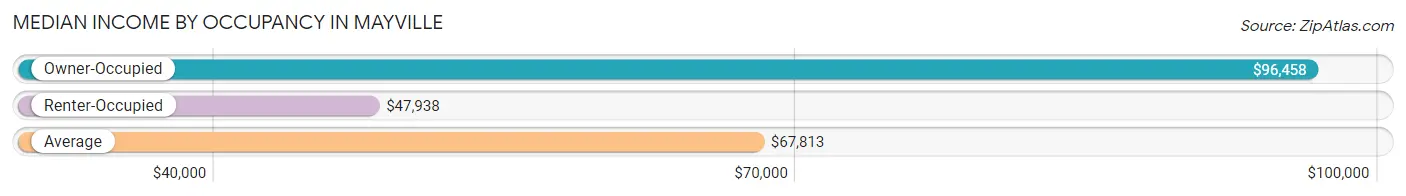
| Occupancy Type | # Households | Median Income |
| Owner-Occupied | 342 (44.7%) | $96,458 |
| Renter-Occupied | 423 (55.3%) | $47,938 |
| Average | 765 (100.0%) | $67,813 |
Occupancy by Householder Income Bracket in Mayville
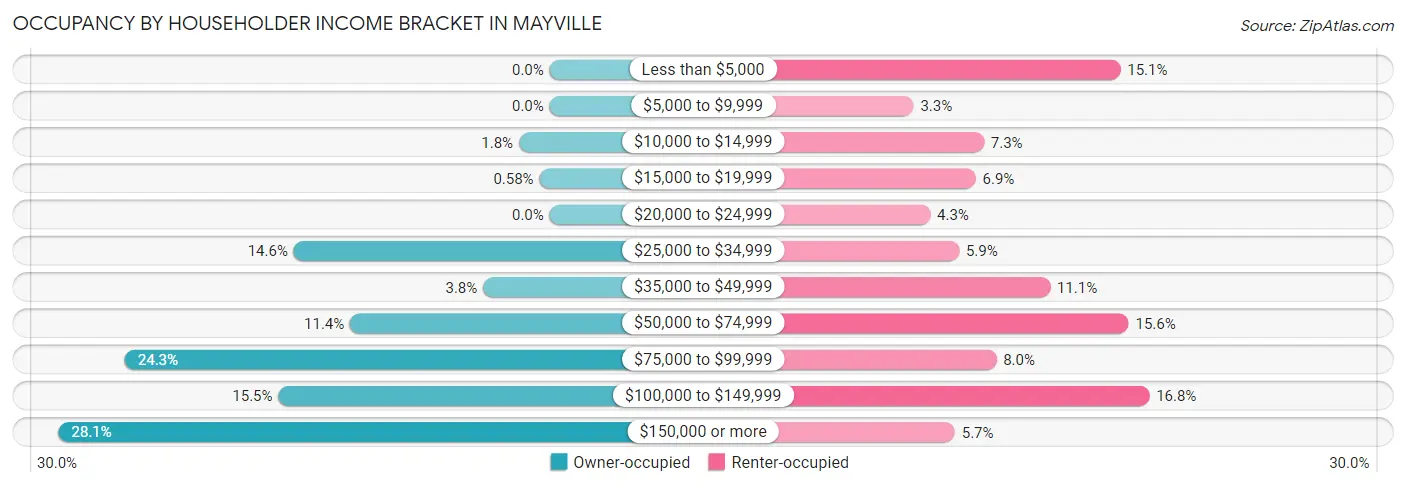
| Income Bracket | Owner-occupied | Renter-occupied |
| Less than $5,000 | 0 (0.0%) | 64 (15.1%) |
| $5,000 to $9,999 | 0 (0.0%) | 14 (3.3%) |
| $10,000 to $14,999 | 6 (1.8%) | 31 (7.3%) |
| $15,000 to $19,999 | 2 (0.6%) | 29 (6.9%) |
| $20,000 to $24,999 | 0 (0.0%) | 18 (4.3%) |
| $25,000 to $34,999 | 50 (14.6%) | 25 (5.9%) |
| $35,000 to $49,999 | 13 (3.8%) | 47 (11.1%) |
| $50,000 to $74,999 | 39 (11.4%) | 66 (15.6%) |
| $75,000 to $99,999 | 83 (24.3%) | 34 (8.0%) |
| $100,000 to $149,999 | 53 (15.5%) | 71 (16.8%) |
| $150,000 or more | 96 (28.1%) | 24 (5.7%) |
| Total | 342 (100.0%) | 423 (100.0%) |
Monthly Housing Cost Tiers in Mayville
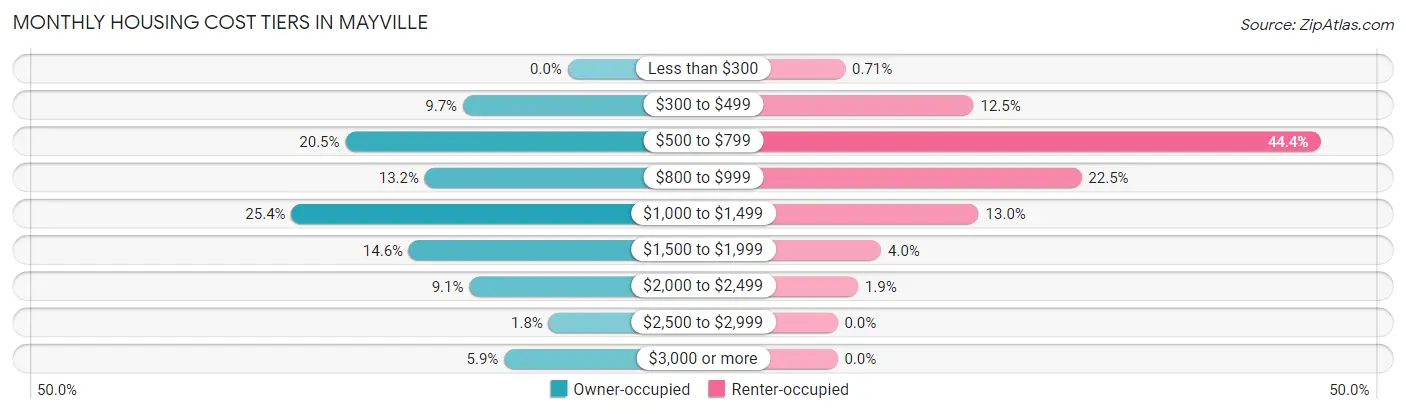
| Monthly Cost | Owner-occupied | Renter-occupied |
| Less than $300 | 0 (0.0%) | 3 (0.7%) |
| $300 to $499 | 33 (9.7%) | 53 (12.5%) |
| $500 to $799 | 70 (20.5%) | 188 (44.4%) |
| $800 to $999 | 45 (13.2%) | 95 (22.5%) |
| $1,000 to $1,499 | 87 (25.4%) | 55 (13.0%) |
| $1,500 to $1,999 | 50 (14.6%) | 17 (4.0%) |
| $2,000 to $2,499 | 31 (9.1%) | 8 (1.9%) |
| $2,500 to $2,999 | 6 (1.8%) | 0 (0.0%) |
| $3,000 or more | 20 (5.9%) | 0 (0.0%) |
| Total | 342 (100.0%) | 423 (100.0%) |
Physical Housing Characteristics in Mayville
Housing Structures in Mayville
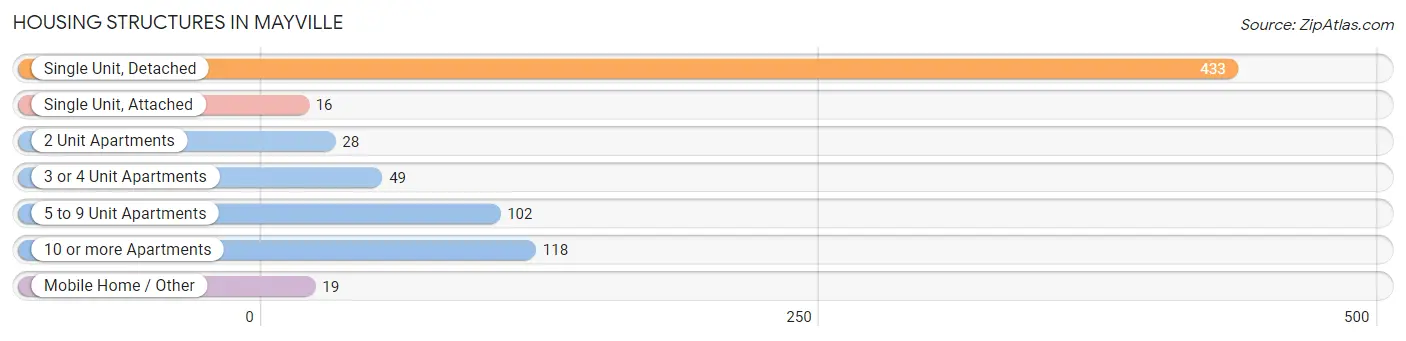
| Structure Type | # Housing Units | % Housing Units |
| Single Unit, Detached | 433 | 56.6% |
| Single Unit, Attached | 16 | 2.1% |
| 2 Unit Apartments | 28 | 3.7% |
| 3 or 4 Unit Apartments | 49 | 6.4% |
| 5 to 9 Unit Apartments | 102 | 13.3% |
| 10 or more Apartments | 118 | 15.4% |
| Mobile Home / Other | 19 | 2.5% |
| Total | 765 | 100.0% |
Housing Structures by Occupancy in Mayville
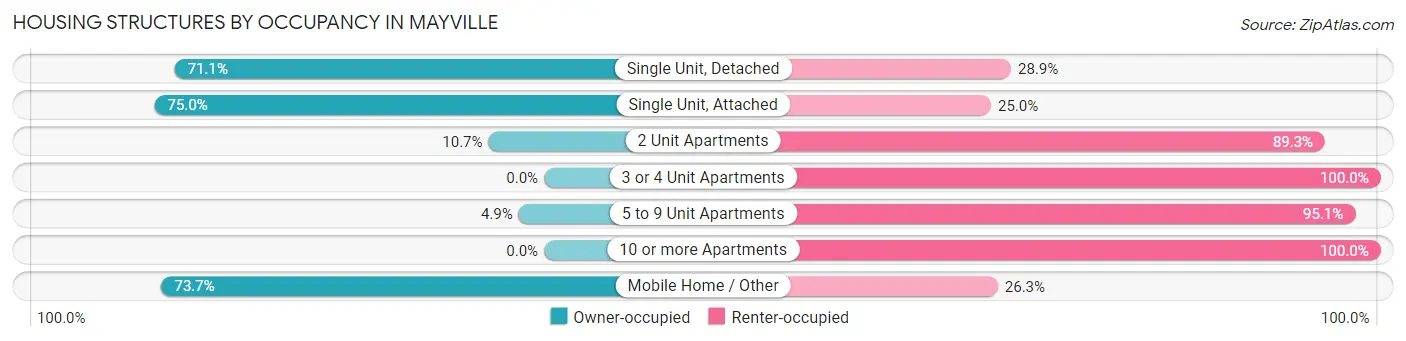
| Structure Type | Owner-occupied | Renter-occupied |
| Single Unit, Detached | 308 (71.1%) | 125 (28.9%) |
| Single Unit, Attached | 12 (75.0%) | 4 (25.0%) |
| 2 Unit Apartments | 3 (10.7%) | 25 (89.3%) |
| 3 or 4 Unit Apartments | 0 (0.0%) | 49 (100.0%) |
| 5 to 9 Unit Apartments | 5 (4.9%) | 97 (95.1%) |
| 10 or more Apartments | 0 (0.0%) | 118 (100.0%) |
| Mobile Home / Other | 14 (73.7%) | 5 (26.3%) |
| Total | 342 (44.7%) | 423 (55.3%) |
Housing Structures by Number of Rooms in Mayville
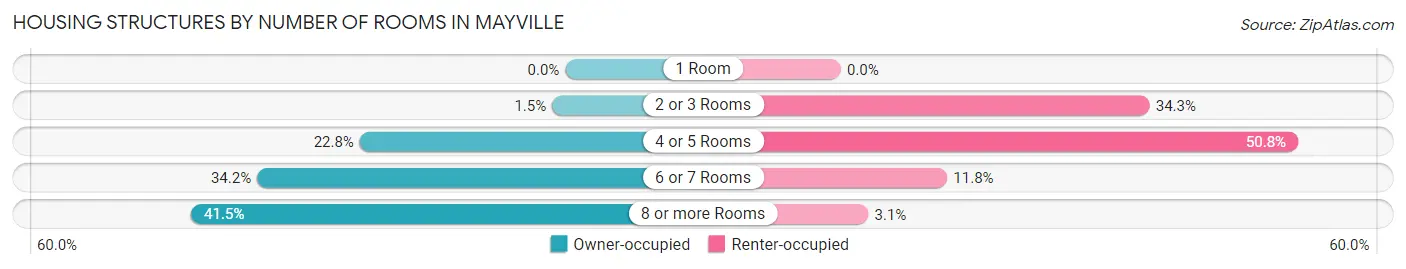
| Number of Rooms | Owner-occupied | Renter-occupied |
| 1 Room | 0 (0.0%) | 0 (0.0%) |
| 2 or 3 Rooms | 5 (1.5%) | 145 (34.3%) |
| 4 or 5 Rooms | 78 (22.8%) | 215 (50.8%) |
| 6 or 7 Rooms | 117 (34.2%) | 50 (11.8%) |
| 8 or more Rooms | 142 (41.5%) | 13 (3.1%) |
| Total | 342 (100.0%) | 423 (100.0%) |
Housing Structure by Heating Type in Mayville
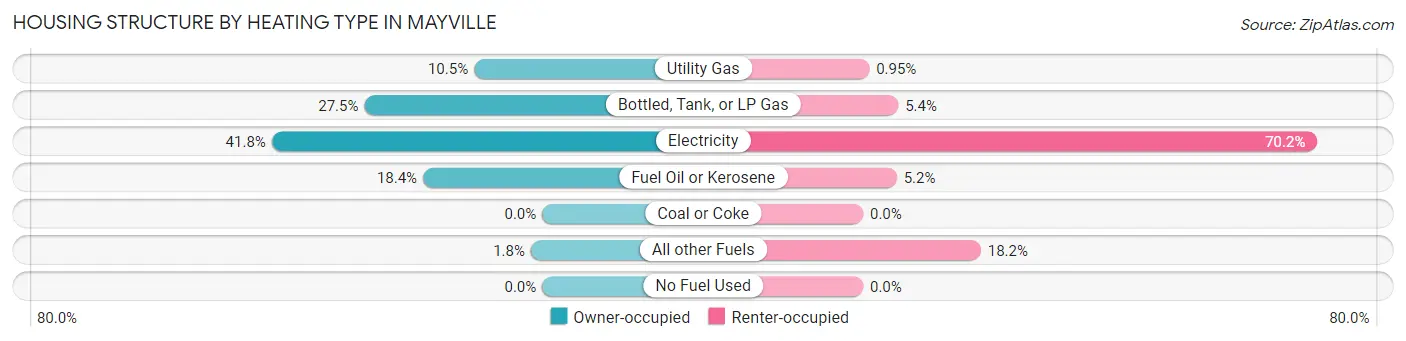
| Heating Type | Owner-occupied | Renter-occupied |
| Utility Gas | 36 (10.5%) | 4 (0.9%) |
| Bottled, Tank, or LP Gas | 94 (27.5%) | 23 (5.4%) |
| Electricity | 143 (41.8%) | 297 (70.2%) |
| Fuel Oil or Kerosene | 63 (18.4%) | 22 (5.2%) |
| Coal or Coke | 0 (0.0%) | 0 (0.0%) |
| All other Fuels | 6 (1.8%) | 77 (18.2%) |
| No Fuel Used | 0 (0.0%) | 0 (0.0%) |
| Total | 342 (100.0%) | 423 (100.0%) |
Household Vehicle Usage in Mayville
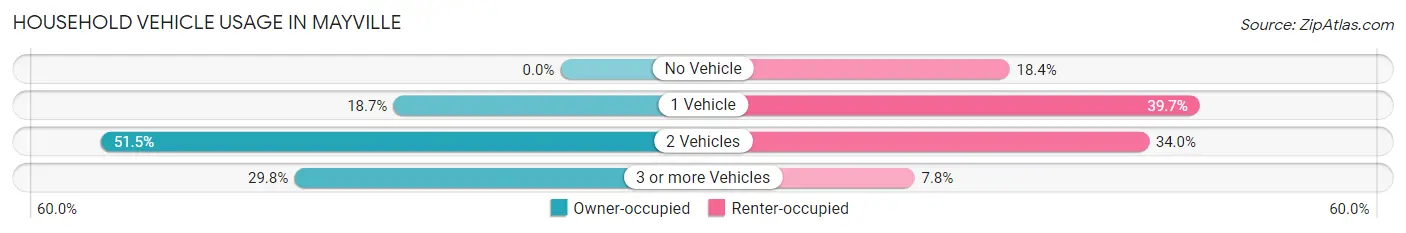
| Vehicles per Household | Owner-occupied | Renter-occupied |
| No Vehicle | 0 (0.0%) | 78 (18.4%) |
| 1 Vehicle | 64 (18.7%) | 168 (39.7%) |
| 2 Vehicles | 176 (51.5%) | 144 (34.0%) |
| 3 or more Vehicles | 102 (29.8%) | 33 (7.8%) |
| Total | 342 (100.0%) | 423 (100.0%) |
Real Estate & Mortgages in Mayville
Real Estate and Mortgage Overview in Mayville
| Characteristic | Without Mortgage | With Mortgage |
| Housing Units | 137 | 205 |
| Median Property Value | $144,800 | $181,000 |
| Median Household Income | $86,696 | $61 |
| Monthly Housing Costs | $638 | $20 |
| Real Estate Taxes | $1,882 | $0 |
Property Value by Mortgage Status in Mayville
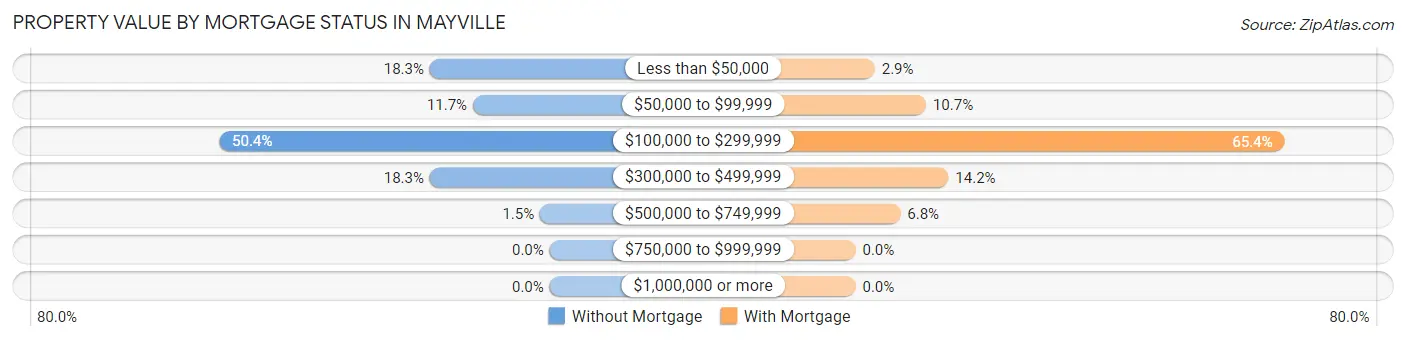
| Property Value | Without Mortgage | With Mortgage |
| Less than $50,000 | 25 (18.2%) | 6 (2.9%) |
| $50,000 to $99,999 | 16 (11.7%) | 22 (10.7%) |
| $100,000 to $299,999 | 69 (50.4%) | 134 (65.4%) |
| $300,000 to $499,999 | 25 (18.2%) | 29 (14.1%) |
| $500,000 to $749,999 | 2 (1.5%) | 14 (6.8%) |
| $750,000 to $999,999 | 0 (0.0%) | 0 (0.0%) |
| $1,000,000 or more | 0 (0.0%) | 0 (0.0%) |
| Total | 137 (100.0%) | 205 (100.0%) |
Household Income by Mortgage Status in Mayville
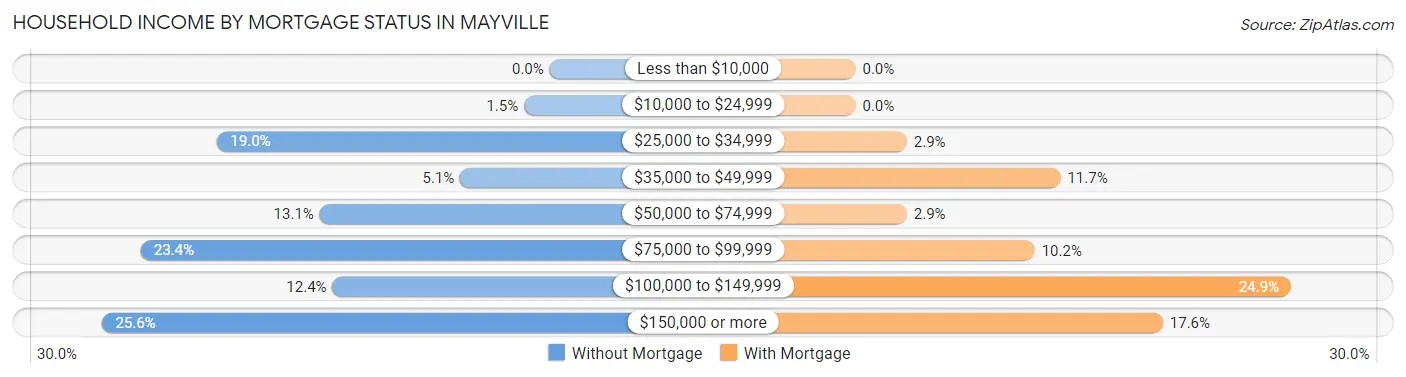
| Household Income | Without Mortgage | With Mortgage |
| Less than $10,000 | 0 (0.0%) | 0 (0.0%) |
| $10,000 to $24,999 | 2 (1.5%) | 0 (0.0%) |
| $25,000 to $34,999 | 26 (19.0%) | 6 (2.9%) |
| $35,000 to $49,999 | 7 (5.1%) | 24 (11.7%) |
| $50,000 to $74,999 | 18 (13.1%) | 6 (2.9%) |
| $75,000 to $99,999 | 32 (23.4%) | 21 (10.2%) |
| $100,000 to $149,999 | 17 (12.4%) | 51 (24.9%) |
| $150,000 or more | 35 (25.6%) | 36 (17.6%) |
| Total | 137 (100.0%) | 205 (100.0%) |
Property Value to Household Income Ratio in Mayville
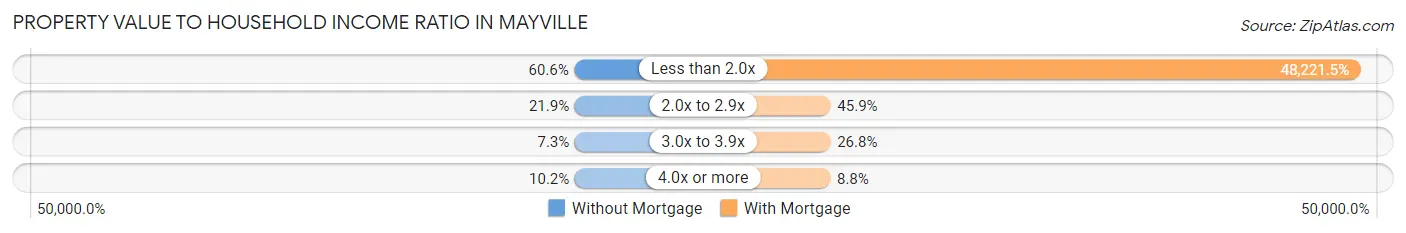
| Value-to-Income Ratio | Without Mortgage | With Mortgage |
| Less than 2.0x | 83 (60.6%) | 98,854 (48,221.5%) |
| 2.0x to 2.9x | 30 (21.9%) | 94 (45.9%) |
| 3.0x to 3.9x | 10 (7.3%) | 55 (26.8%) |
| 4.0x or more | 14 (10.2%) | 18 (8.8%) |
| Total | 137 (100.0%) | 205 (100.0%) |
Real Estate Taxes by Mortgage Status in Mayville
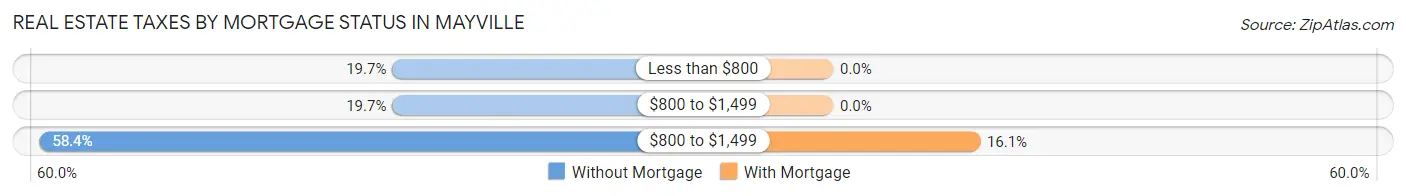
| Property Taxes | Without Mortgage | With Mortgage |
| Less than $800 | 27 (19.7%) | 0 (0.0%) |
| $800 to $1,499 | 27 (19.7%) | 0 (0.0%) |
| $800 to $1,499 | 80 (58.4%) | 33 (16.1%) |
| Total | 137 (100.0%) | 205 (100.0%) |
Health & Disability in Mayville
Health Insurance Coverage by Age in Mayville
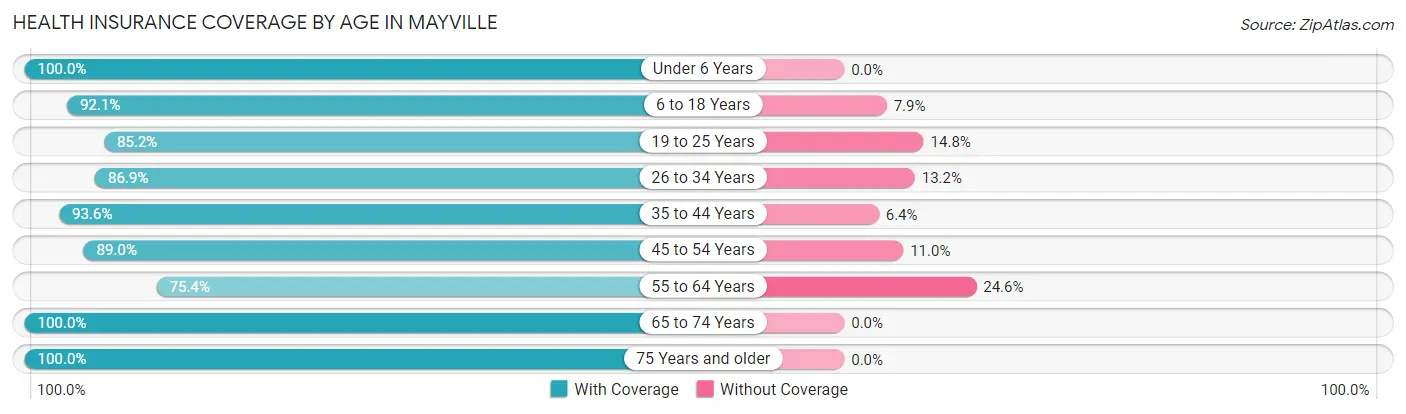
| Age Bracket | With Coverage | Without Coverage |
| Under 6 Years | 64 (100.0%) | 0 (0.0%) |
| 6 to 18 Years | 384 (92.1%) | 33 (7.9%) |
| 19 to 25 Years | 403 (85.2%) | 70 (14.8%) |
| 26 to 34 Years | 185 (86.9%) | 28 (13.2%) |
| 35 to 44 Years | 233 (93.6%) | 16 (6.4%) |
| 45 to 54 Years | 170 (89.0%) | 21 (11.0%) |
| 55 to 64 Years | 98 (75.4%) | 32 (24.6%) |
| 65 to 74 Years | 116 (100.0%) | 0 (0.0%) |
| 75 Years and older | 142 (100.0%) | 0 (0.0%) |
| Total | 1,795 (90.0%) | 200 (10.0%) |
Health Insurance Coverage by Citizenship Status in Mayville
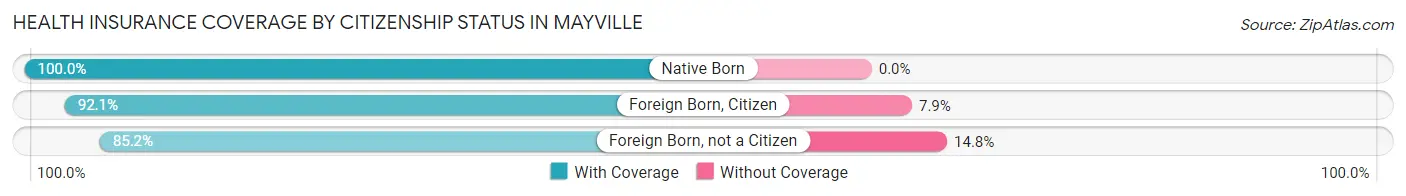
| Citizenship Status | With Coverage | Without Coverage |
| Native Born | 64 (100.0%) | 0 (0.0%) |
| Foreign Born, Citizen | 384 (92.1%) | 33 (7.9%) |
| Foreign Born, not a Citizen | 403 (85.2%) | 70 (14.8%) |
Health Insurance Coverage by Household Income in Mayville
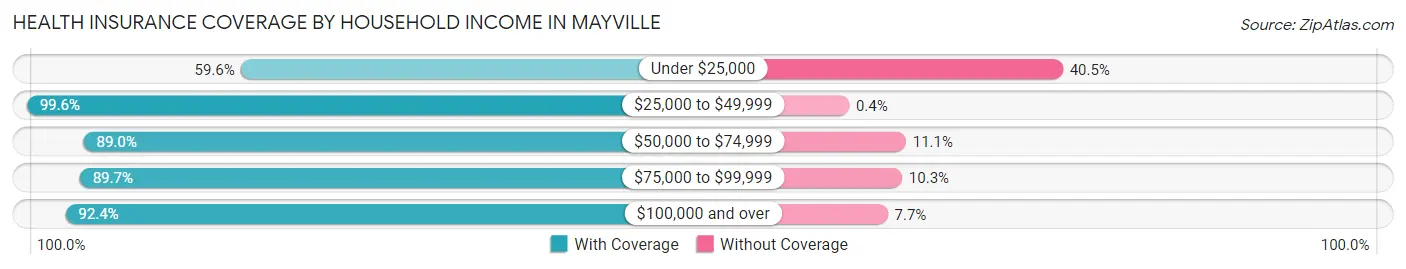
| Household Income | With Coverage | Without Coverage |
| Under $25,000 | 106 (59.6%) | 72 (40.5%) |
| $25,000 to $49,999 | 247 (99.6%) | 1 (0.4%) |
| $50,000 to $74,999 | 169 (88.9%) | 21 (11.1%) |
| $75,000 to $99,999 | 295 (89.7%) | 34 (10.3%) |
| $100,000 and over | 748 (92.3%) | 62 (7.6%) |
Public vs Private Health Insurance Coverage by Age in Mayville
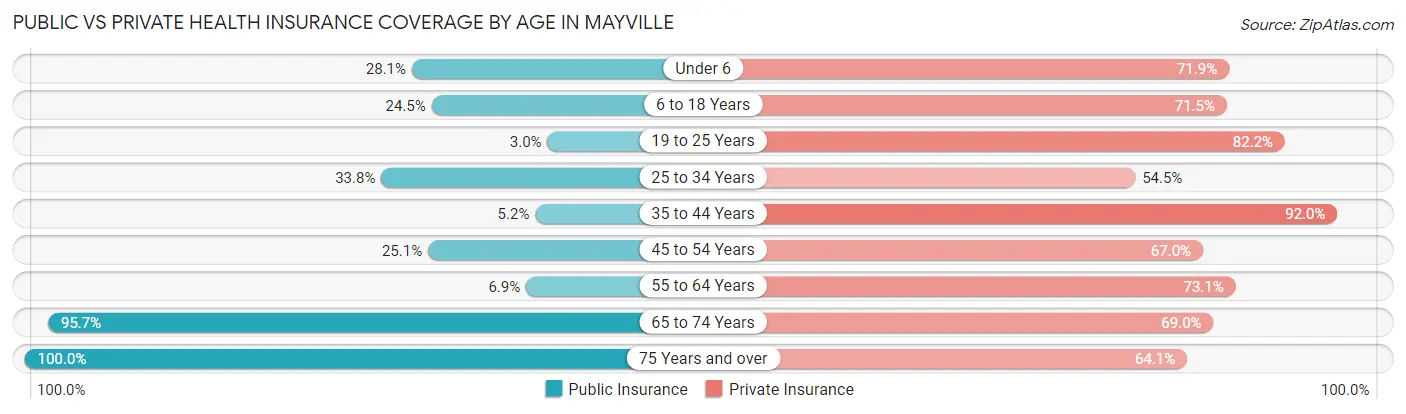
| Age Bracket | Public Insurance | Private Insurance |
| Under 6 | 18 (28.1%) | 46 (71.9%) |
| 6 to 18 Years | 102 (24.5%) | 298 (71.5%) |
| 19 to 25 Years | 14 (3.0%) | 389 (82.2%) |
| 25 to 34 Years | 72 (33.8%) | 116 (54.5%) |
| 35 to 44 Years | 13 (5.2%) | 229 (92.0%) |
| 45 to 54 Years | 48 (25.1%) | 128 (67.0%) |
| 55 to 64 Years | 9 (6.9%) | 95 (73.1%) |
| 65 to 74 Years | 111 (95.7%) | 80 (69.0%) |
| 75 Years and over | 142 (100.0%) | 91 (64.1%) |
| Total | 529 (26.5%) | 1,472 (73.8%) |
Disability Status by Sex by Age in Mayville
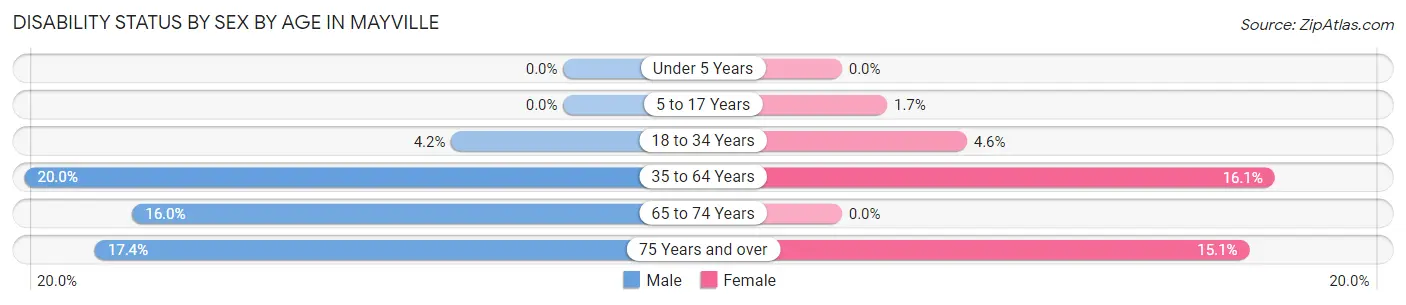
| Age Bracket | Male | Female |
| Under 5 Years | 0 (0.0%) | 0 (0.0%) |
| 5 to 17 Years | 0 (0.0%) | 3 (1.7%) |
| 18 to 34 Years | 19 (4.2%) | 14 (4.6%) |
| 35 to 64 Years | 58 (20.0%) | 45 (16.1%) |
| 65 to 74 Years | 8 (16.0%) | 0 (0.0%) |
| 75 Years and over | 4 (17.4%) | 18 (15.1%) |
Disability Class by Sex by Age in Mayville
Disability Class: Hearing Difficulty
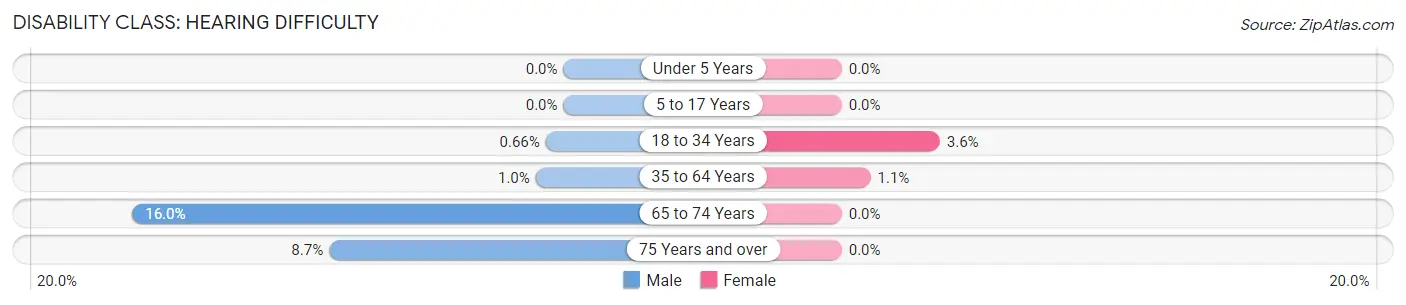
| Age Bracket | Male | Female |
| Under 5 Years | 0 (0.0%) | 0 (0.0%) |
| 5 to 17 Years | 0 (0.0%) | 0 (0.0%) |
| 18 to 34 Years | 3 (0.7%) | 11 (3.6%) |
| 35 to 64 Years | 3 (1.0%) | 3 (1.1%) |
| 65 to 74 Years | 8 (16.0%) | 0 (0.0%) |
| 75 Years and over | 2 (8.7%) | 0 (0.0%) |
Disability Class: Vision Difficulty
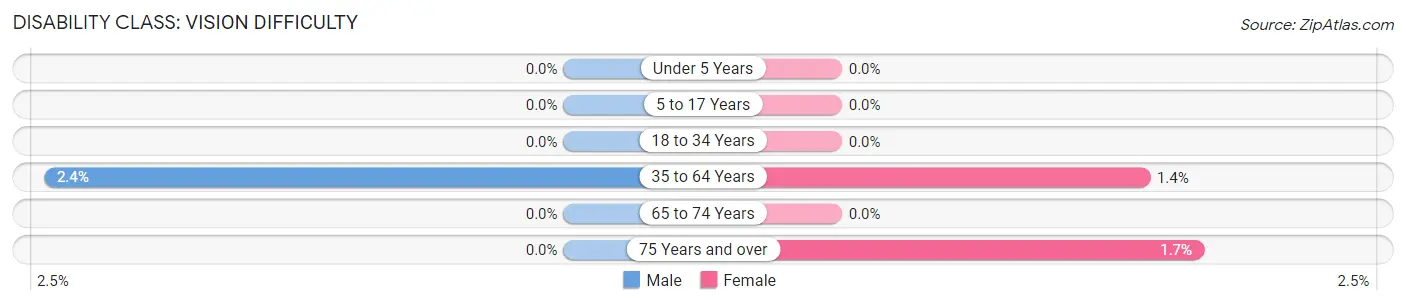
| Age Bracket | Male | Female |
| Under 5 Years | 0 (0.0%) | 0 (0.0%) |
| 5 to 17 Years | 0 (0.0%) | 0 (0.0%) |
| 18 to 34 Years | 0 (0.0%) | 0 (0.0%) |
| 35 to 64 Years | 7 (2.4%) | 4 (1.4%) |
| 65 to 74 Years | 0 (0.0%) | 0 (0.0%) |
| 75 Years and over | 0 (0.0%) | 2 (1.7%) |
Disability Class: Cognitive Difficulty
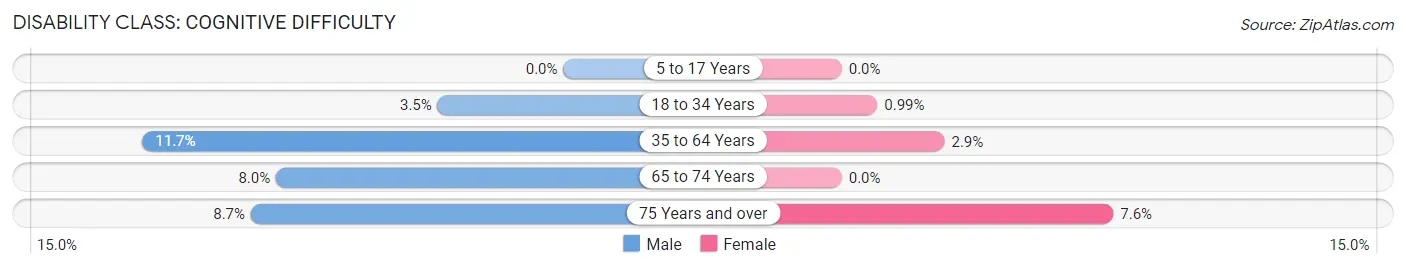
| Age Bracket | Male | Female |
| 5 to 17 Years | 0 (0.0%) | 0 (0.0%) |
| 18 to 34 Years | 16 (3.5%) | 3 (1.0%) |
| 35 to 64 Years | 34 (11.7%) | 8 (2.9%) |
| 65 to 74 Years | 4 (8.0%) | 0 (0.0%) |
| 75 Years and over | 2 (8.7%) | 9 (7.6%) |
Disability Class: Ambulatory Difficulty
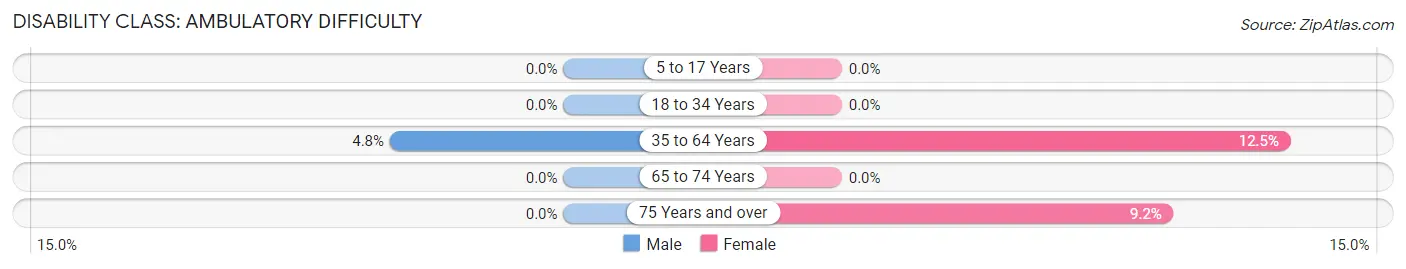
| Age Bracket | Male | Female |
| 5 to 17 Years | 0 (0.0%) | 0 (0.0%) |
| 18 to 34 Years | 0 (0.0%) | 0 (0.0%) |
| 35 to 64 Years | 14 (4.8%) | 35 (12.5%) |
| 65 to 74 Years | 0 (0.0%) | 0 (0.0%) |
| 75 Years and over | 0 (0.0%) | 11 (9.2%) |
Disability Class: Self-Care Difficulty
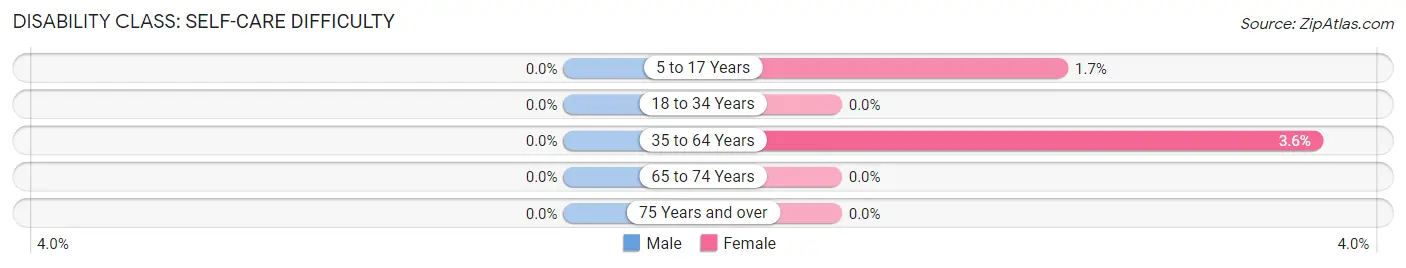
| Age Bracket | Male | Female |
| 5 to 17 Years | 0 (0.0%) | 3 (1.7%) |
| 18 to 34 Years | 0 (0.0%) | 0 (0.0%) |
| 35 to 64 Years | 0 (0.0%) | 10 (3.6%) |
| 65 to 74 Years | 0 (0.0%) | 0 (0.0%) |
| 75 Years and over | 0 (0.0%) | 0 (0.0%) |
Technology Access in Mayville
Computing Device Access in Mayville
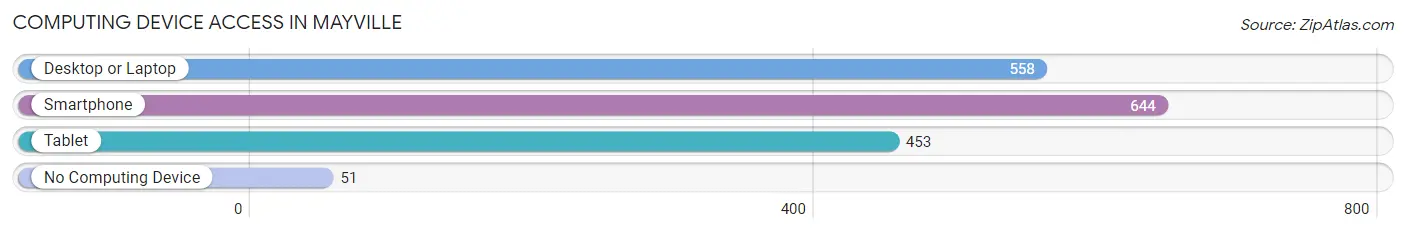
| Device Type | # Households | % Households |
| Desktop or Laptop | 558 | 72.9% |
| Smartphone | 644 | 84.2% |
| Tablet | 453 | 59.2% |
| No Computing Device | 51 | 6.7% |
| Total | 765 | 100.0% |
Internet Access in Mayville

| Internet Type | # Households | % Households |
| Dial-Up Internet | 0 | 0.0% |
| Broadband Home | 467 | 61.1% |
| Cellular Data Only | 105 | 13.7% |
| Satellite Internet | 41 | 5.4% |
| No Internet | 169 | 22.1% |
| Total | 765 | 100.0% |
Mayville Summary
Mayville, North Dakota is a small city located in Traill County, in the eastern part of the state. It is situated on the banks of the Red River of the North, and is the county seat of Traill County. The city has a population of 2,845 people, according to the 2010 census.
Mayville was founded in 1881, and was named after Mayville, Wisconsin, the hometown of the first postmaster. The city was incorporated in 1883, and has since grown to become the largest city in Traill County.
Geography
Mayville is located in the Red River Valley, a flat, fertile region of the Great Plains. The city is situated on the banks of the Red River of the North, and is surrounded by rolling hills and farmland. The city is located at the intersection of U.S. Highway 75 and North Dakota Highway 200.
The climate in Mayville is continental, with cold winters and hot summers. The average annual temperature is 45°F (7°C), and the average annual precipitation is 22 inches (56 cm).
Economy
Mayville’s economy is largely based on agriculture and manufacturing. The city is home to several large agricultural businesses, including a grain elevator, a feed mill, and a fertilizer plant. The city also has several manufacturing businesses, including a furniture factory, a plastics factory, and a printing company.
The city is also home to several retail businesses, including a grocery store, a hardware store, and a variety of specialty shops. The city also has several restaurants, bars, and hotels.
Demographics
According to the 2010 census, the population of Mayville was 2,845 people. The racial makeup of the city was 97.3% White, 0.7% African American, 0.3% Native American, 0.3% Asian, 0.1% Pacific Islander, and 1.3% from other races. The median household income was $41,944, and the median family income was $50,944.
The city is served by the Mayville Public School District, which includes two elementary schools, a middle school, and a high school. The city is also home to Mayville State University, a four-year public university.
Mayville is a small city with a rich history and a vibrant economy. The city is home to a diverse population, and is a great place to live, work, and raise a family.
Common Questions
What is the Total Population of Mayville?
Total Population of Mayville is 2,102.
What is the Total Male Population of Mayville?
Total Male Population of Mayville is 1,071.
What is the Total Female Population of Mayville?
Total Female Population of Mayville is 1,031.
What is the Ratio of Males per 100 Females in Mayville?
There are 103.88 Males per 100 Females in Mayville.
What is the Ratio of Females per 100 Males in Mayville?
There are 96.27 Females per 100 Males in Mayville.
What is the Median Population Age in Mayville?
Median Population Age in Mayville is 28.5 Years.
What is the Average Family Size in Mayville
Average Family Size in Mayville is 3.1 People.
What is the Average Household Size in Mayville
Average Household Size in Mayville is 2.3 People.
What is Per Capita Income in Mayville?
Per Capita income in Mayville is $34,579.
What is the Median Family Income in Mayville?
Median Family Income in Mayville is $105,625.
What is the Median Household income in Mayville?
Median Household Income in Mayville is $67,813.
What is Income or Wage Gap in Mayville?
Income or Wage Gap in Mayville is 34.7%.
Women in Mayville earn 65.3 cents for every dollar earned by a man.
What is Inequality or Gini Index in Mayville?
Inequality or Gini Index in Mayville is 0.49.
How Large is the Labor Force in Mayville?
There are 1,142 People in the Labor Forcein in Mayville.
What is the Percentage of People in the Labor Force in Mayville?
64.0% of People are in the Labor Force in Mayville.
What is the Unemployment Rate in Mayville?
Unemployment Rate in Mayville is 3.6%.