Dickinson, ND
Dickinson Map
Dickinson Overview
25,116
TOTAL POPULATION
13,093
MALE POPULATION
12,023
FEMALE POPULATION
108.90
MALES / 100 FEMALES
91.83
FEMALES / 100 MALES
33.1
MEDIAN AGE
3.1
AVG FAMILY SIZE
2.4
AVG HOUSEHOLD SIZE
$39,128
PER CAPITA INCOME
$103,794
AVG FAMILY INCOME
$75,767
AVG HOUSEHOLD INCOME
43.1%
WAGE / INCOME GAP [ % ]
56.9¢/ $1
WAGE / INCOME GAP [ $ ]
0.43
INEQUALITY / GINI INDEX
13,297
LABOR FORCE [ PEOPLE ]
69.5%
PERCENT IN LABOR FORCE
3.0%
UNEMPLOYMENT RATE
Dickinson Zip Codes
Dickinson Area Codes
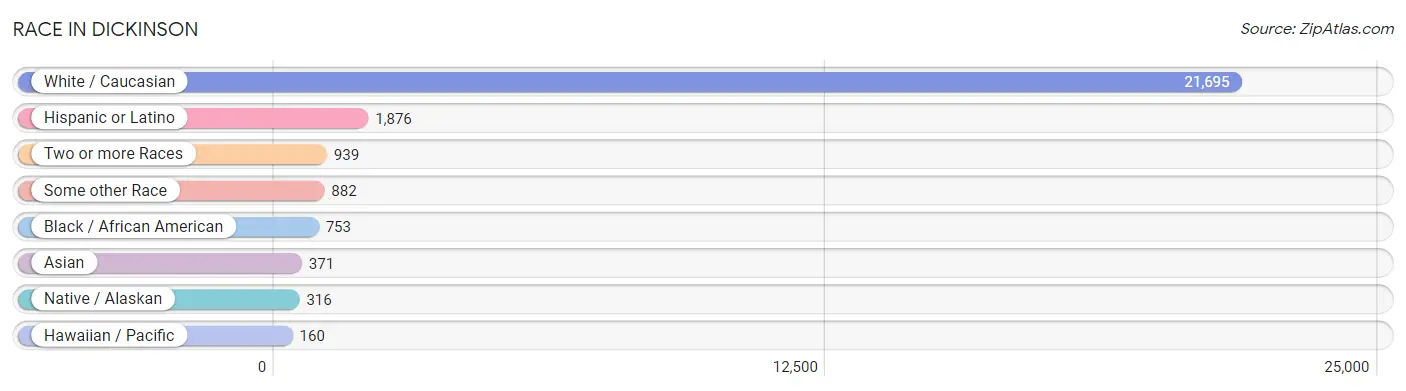
Race in Dickinson
The most populous races in Dickinson are White / Caucasian (21,695 | 86.4%), Hispanic or Latino (1,876 | 7.5%), and Two or more Races (939 | 3.7%).
| Race | # Population | % Population |
| Asian | 371 | 1.5% |
| Black / African American | 753 | 3.0% |
| Hawaiian / Pacific | 160 | 0.6% |
| Hispanic or Latino | 1,876 | 7.5% |
| Native / Alaskan | 316 | 1.3% |
| White / Caucasian | 21,695 | 86.4% |
| Two or more Races | 939 | 3.7% |
| Some other Race | 882 | 3.5% |
| Total | 25,116 | 100.0% |
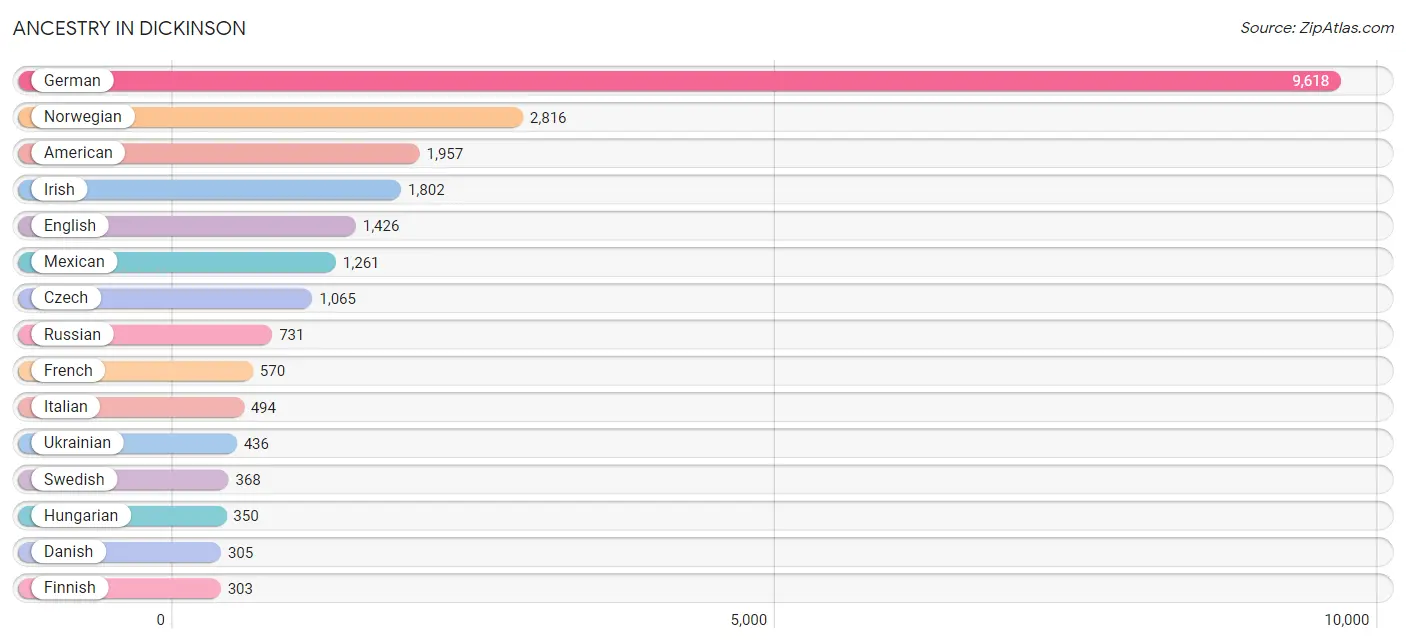
Ancestry in Dickinson
The most populous ancestries reported in Dickinson are German (9,618 | 38.3%), Norwegian (2,816 | 11.2%), American (1,957 | 7.8%), Irish (1,802 | 7.2%), and English (1,426 | 5.7%), together accounting for 70.1% of all Dickinson residents.
| Ancestry | # Population | % Population |
| Alaska Native | 2 | 0.0% |
| American | 1,957 | 7.8% |
| Arab | 40 | 0.2% |
| Basque | 29 | 0.1% |
| Bhutanese | 15 | 0.1% |
| British | 53 | 0.2% |
| Burmese | 62 | 0.3% |
| Cape Verdean | 18 | 0.1% |
| Central American | 59 | 0.2% |
| Chippewa | 25 | 0.1% |
| Colombian | 3 | 0.0% |
| Croatian | 27 | 0.1% |
| Crow | 34 | 0.1% |
| Czech | 1,065 | 4.2% |
| Czechoslovakian | 32 | 0.1% |
| Danish | 305 | 1.2% |
| Dutch | 127 | 0.5% |
| Eastern European | 20 | 0.1% |
| English | 1,426 | 5.7% |
| European | 262 | 1.0% |
| Finnish | 303 | 1.2% |
| French | 570 | 2.3% |
| French American Indian | 25 | 0.1% |
| French Canadian | 140 | 0.6% |
| German | 9,618 | 38.3% |
| German Russian | 188 | 0.7% |
| Ghanaian | 7 | 0.0% |
| Haitian | 17 | 0.1% |
| Hungarian | 350 | 1.4% |
| Indian (Asian) | 92 | 0.4% |
| Irish | 1,802 | 7.2% |
| Italian | 494 | 2.0% |
| Jamaican | 16 | 0.1% |
| Korean | 221 | 0.9% |
| Lebanese | 7 | 0.0% |
| Mexican | 1,261 | 5.0% |
| Navajo | 63 | 0.3% |
| Northern European | 38 | 0.2% |
| Norwegian | 2,816 | 11.2% |
| Panamanian | 54 | 0.2% |
| Pennsylvania German | 40 | 0.2% |
| Polish | 244 | 1.0% |
| Portuguese | 16 | 0.1% |
| Puerto Rican | 103 | 0.4% |
| Russian | 731 | 2.9% |
| Salvadoran | 5 | 0.0% |
| Samoan | 60 | 0.2% |
| Scandinavian | 78 | 0.3% |
| Scotch-Irish | 188 | 0.7% |
| Scottish | 262 | 1.0% |
| Seminole | 1 | 0.0% |
| Serbian | 26 | 0.1% |
| Sioux | 124 | 0.5% |
| South American | 3 | 0.0% |
| Spaniard | 302 | 1.2% |
| Spanish | 29 | 0.1% |
| Sri Lankan | 91 | 0.4% |
| Subsaharan African | 68 | 0.3% |
| Swedish | 368 | 1.5% |
| Swiss | 141 | 0.6% |
| Thai | 81 | 0.3% |
| Ukrainian | 436 | 1.7% |
| Welsh | 164 | 0.6% |
| Zimbabwean | 43 | 0.2% | View All 64 Rows |
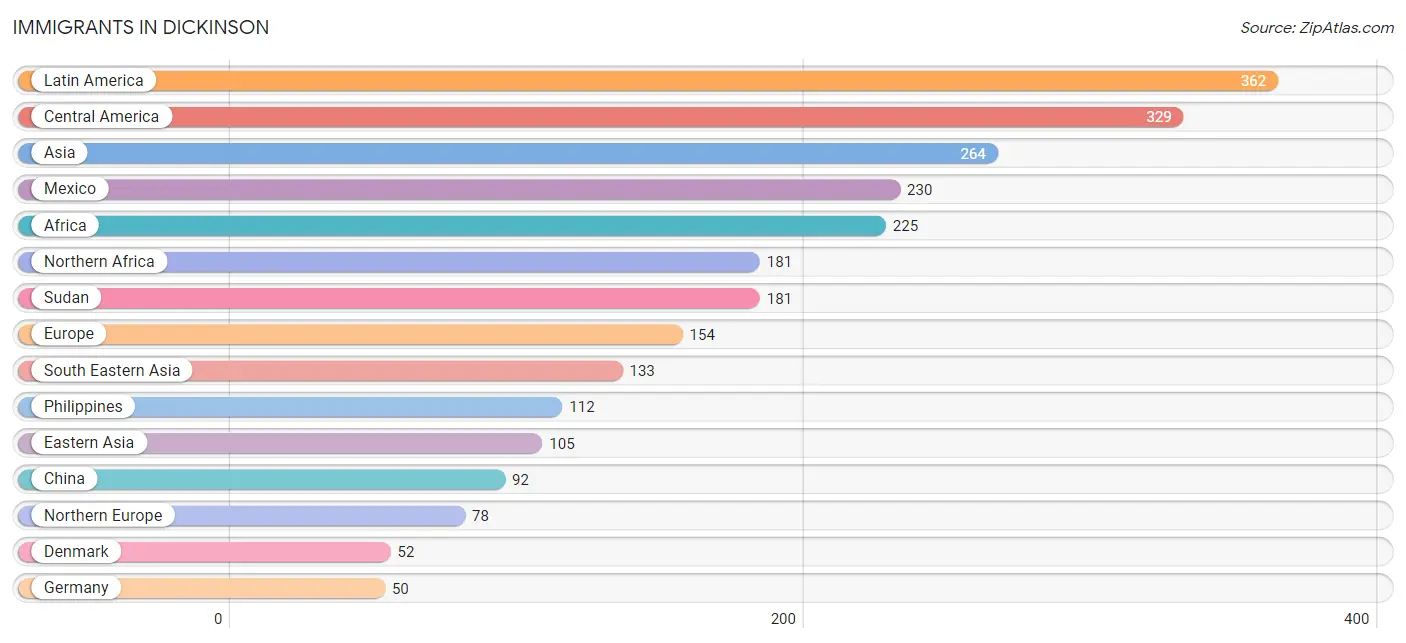
Immigrants in Dickinson
The most numerous immigrant groups reported in Dickinson came from Latin America (362 | 1.4%), Central America (329 | 1.3%), Asia (264 | 1.1%), Mexico (230 | 0.9%), and Africa (225 | 0.9%), together accounting for 5.6% of all Dickinson residents.
| Immigration Origin | # Population | % Population |
| Africa | 225 | 0.9% |
| Asia | 264 | 1.1% |
| Bangladesh | 12 | 0.1% |
| Belize | 45 | 0.2% |
| Caribbean | 33 | 0.1% |
| Central America | 329 | 1.3% |
| China | 92 | 0.4% |
| Denmark | 52 | 0.2% |
| Eastern Africa | 43 | 0.2% |
| Eastern Asia | 105 | 0.4% |
| Eastern Europe | 26 | 0.1% |
| England | 26 | 0.1% |
| Europe | 154 | 0.6% |
| Germany | 50 | 0.2% |
| Ghana | 1 | 0.0% |
| Guatemala | 28 | 0.1% |
| Haiti | 17 | 0.1% |
| India | 14 | 0.1% |
| Jamaica | 16 | 0.1% |
| Korea | 13 | 0.1% |
| Latin America | 362 | 1.4% |
| Mexico | 230 | 0.9% |
| Northern Africa | 181 | 0.7% |
| Northern Europe | 78 | 0.3% |
| Panama | 26 | 0.1% |
| Philippines | 112 | 0.4% |
| Serbia | 26 | 0.1% |
| South Central Asia | 26 | 0.1% |
| South Eastern Asia | 133 | 0.5% |
| Sudan | 181 | 0.7% |
| Vietnam | 21 | 0.1% |
| Western Africa | 1 | 0.0% |
| Western Europe | 50 | 0.2% |
| Zimbabwe | 43 | 0.2% | View All 34 Rows |
Sex and Age in Dickinson
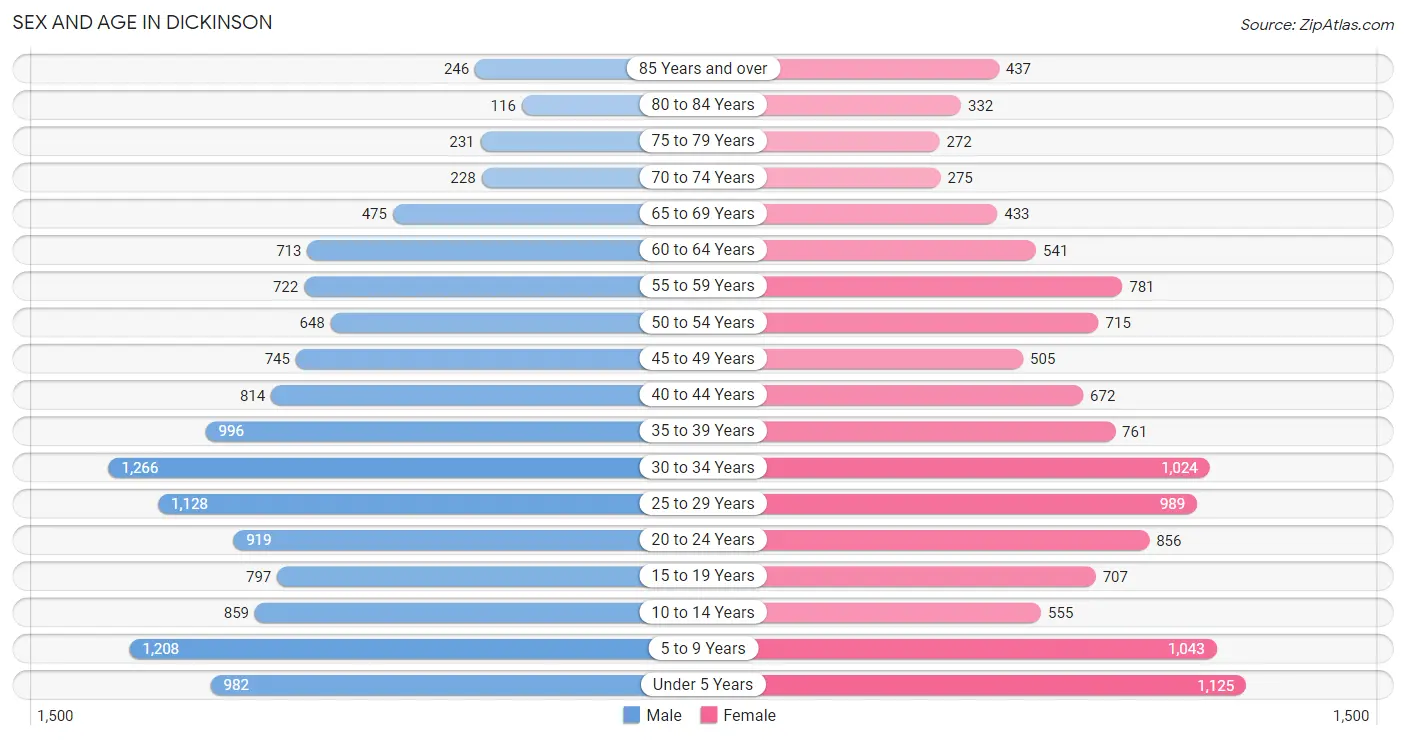
Sex and Age in Dickinson
The most populous age groups in Dickinson are 30 to 34 Years (1,266 | 9.7%) for men and Under 5 Years (1,125 | 9.4%) for women.
| Age Bracket | Male | Female |
| Under 5 Years | 982 (7.5%) | 1,125 (9.4%) |
| 5 to 9 Years | 1,208 (9.2%) | 1,043 (8.7%) |
| 10 to 14 Years | 859 (6.6%) | 555 (4.6%) |
| 15 to 19 Years | 797 (6.1%) | 707 (5.9%) |
| 20 to 24 Years | 919 (7.0%) | 856 (7.1%) |
| 25 to 29 Years | 1,128 (8.6%) | 989 (8.2%) |
| 30 to 34 Years | 1,266 (9.7%) | 1,024 (8.5%) |
| 35 to 39 Years | 996 (7.6%) | 761 (6.3%) |
| 40 to 44 Years | 814 (6.2%) | 672 (5.6%) |
| 45 to 49 Years | 745 (5.7%) | 505 (4.2%) |
| 50 to 54 Years | 648 (5.0%) | 715 (5.9%) |
| 55 to 59 Years | 722 (5.5%) | 781 (6.5%) |
| 60 to 64 Years | 713 (5.4%) | 541 (4.5%) |
| 65 to 69 Years | 475 (3.6%) | 433 (3.6%) |
| 70 to 74 Years | 228 (1.7%) | 275 (2.3%) |
| 75 to 79 Years | 231 (1.8%) | 272 (2.3%) |
| 80 to 84 Years | 116 (0.9%) | 332 (2.8%) |
| 85 Years and over | 246 (1.9%) | 437 (3.6%) |
| Total | 13,093 (100.0%) | 12,023 (100.0%) |
Families and Households in Dickinson
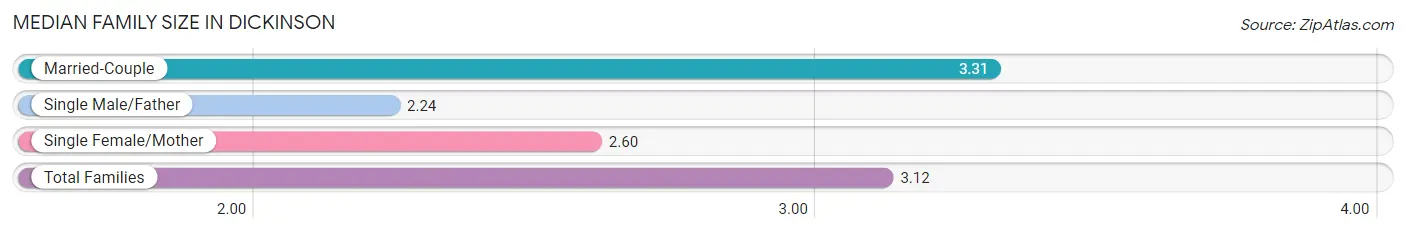
Median Family Size in Dickinson
The median family size in Dickinson is 3.12 persons per family, with married-couple families (4,664 | 78.9%) accounting for the largest median family size of 3.31 persons per family. On the other hand, single male/father families (622 | 10.5%) represent the smallest median family size with 2.24 persons per family.
| Family Type | # Families | Family Size |
| Married-Couple | 4,664 (78.9%) | 3.31 |
| Single Male/Father | 622 (10.5%) | 2.24 |
| Single Female/Mother | 625 (10.6%) | 2.60 |
| Total Families | 5,911 (100.0%) | 3.12 |
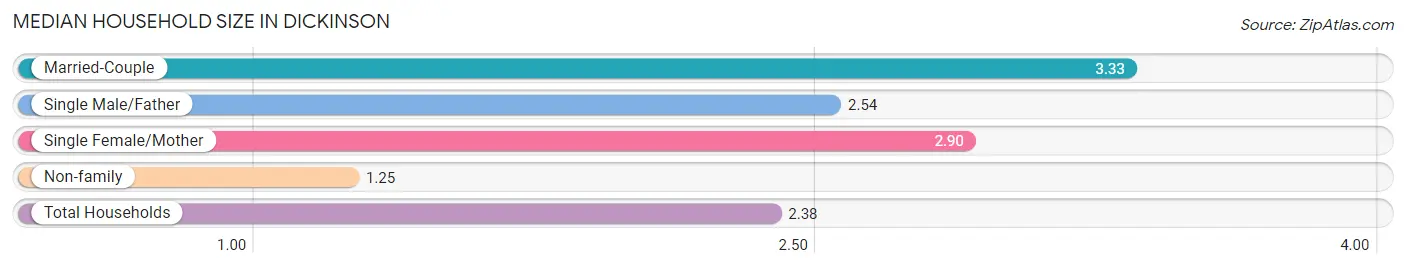
Median Household Size in Dickinson
The median household size in Dickinson is 2.38 persons per household, with married-couple households (4,664 | 45.5%) accounting for the largest median household size of 3.33 persons per household. non-family households (4,336 | 42.3%) represent the smallest median household size with 1.25 persons per household.
| Household Type | # Households | Household Size |
| Married-Couple | 4,664 (45.5%) | 3.33 |
| Single Male/Father | 622 (6.1%) | 2.54 |
| Single Female/Mother | 625 (6.1%) | 2.90 |
| Non-family | 4,336 (42.3%) | 1.25 |
| Total Households | 10,247 (100.0%) | 2.38 |
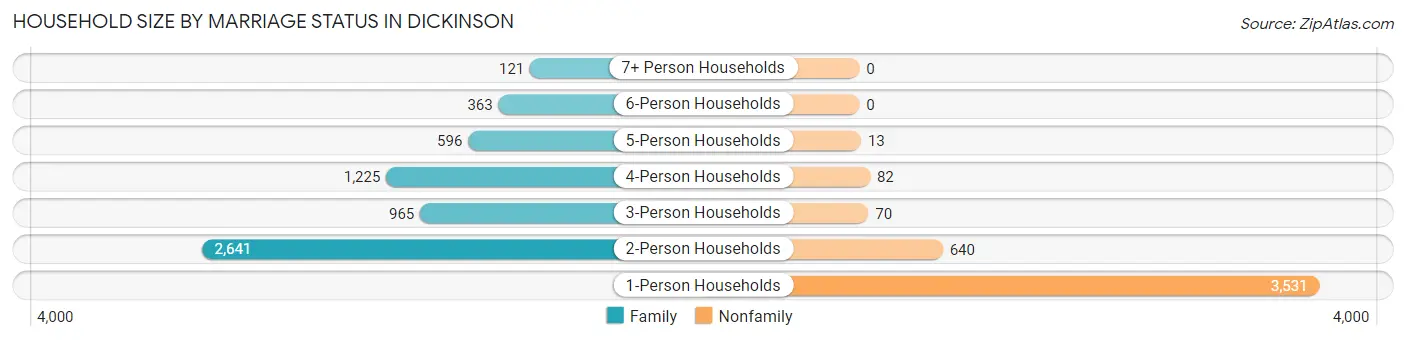
Household Size by Marriage Status in Dickinson
Out of a total of 10,247 households in Dickinson, 5,911 (57.7%) are family households, while 4,336 (42.3%) are nonfamily households. The most numerous type of family households are 2-person households, comprising 2,641, and the most common type of nonfamily households are 1-person households, comprising 3,531.
| Household Size | Family Households | Nonfamily Households |
| 1-Person Households | - | 3,531 (34.5%) |
| 2-Person Households | 2,641 (25.8%) | 640 (6.2%) |
| 3-Person Households | 965 (9.4%) | 70 (0.7%) |
| 4-Person Households | 1,225 (11.9%) | 82 (0.8%) |
| 5-Person Households | 596 (5.8%) | 13 (0.1%) |
| 6-Person Households | 363 (3.5%) | 0 (0.0%) |
| 7+ Person Households | 121 (1.2%) | 0 (0.0%) |
| Total | 5,911 (57.7%) | 4,336 (42.3%) |
Female Fertility in Dickinson
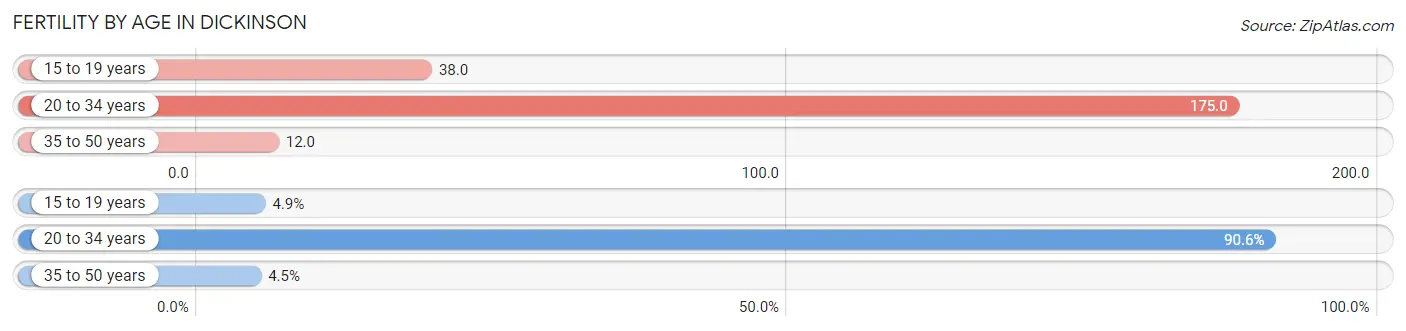
Fertility by Age in Dickinson
Average fertility rate in Dickinson is 99.0 births per 1,000 women. Women in the age bracket of 20 to 34 years have the highest fertility rate with 175.0 births per 1,000 women. Women in the age bracket of 20 to 34 years acount for 90.6% of all women with births.
| Age Bracket | Women with Births | Births / 1,000 Women |
| 15 to 19 years | 27 (4.9%) | 38.0 |
| 20 to 34 years | 502 (90.6%) | 175.0 |
| 35 to 50 years | 25 (4.5%) | 12.0 |
| Total | 554 (100.0%) | 99.0 |
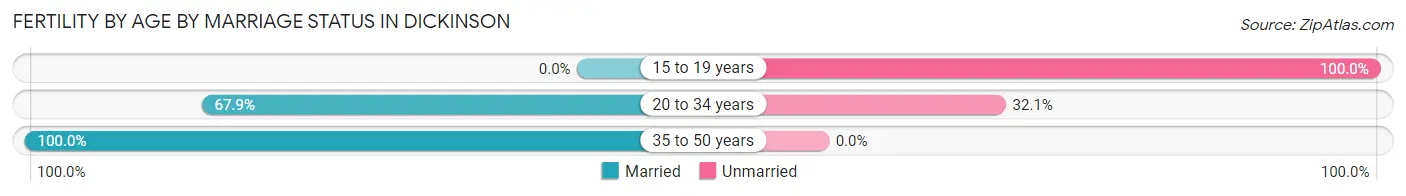
Fertility by Age by Marriage Status in Dickinson
66.1% of women with births (554) in Dickinson are married. The highest percentage of unmarried women with births falls into 15 to 19 years age bracket with 100.0% of them unmarried at the time of birth, while the lowest percentage of unmarried women with births belong to 35 to 50 years age bracket with 0.0% of them unmarried.
| Age Bracket | Married | Unmarried |
| 15 to 19 years | 0 (0.0%) | 27 (100.0%) |
| 20 to 34 years | 341 (67.9%) | 161 (32.1%) |
| 35 to 50 years | 25 (100.0%) | 0 (0.0%) |
| Total | 366 (66.1%) | 188 (33.9%) |
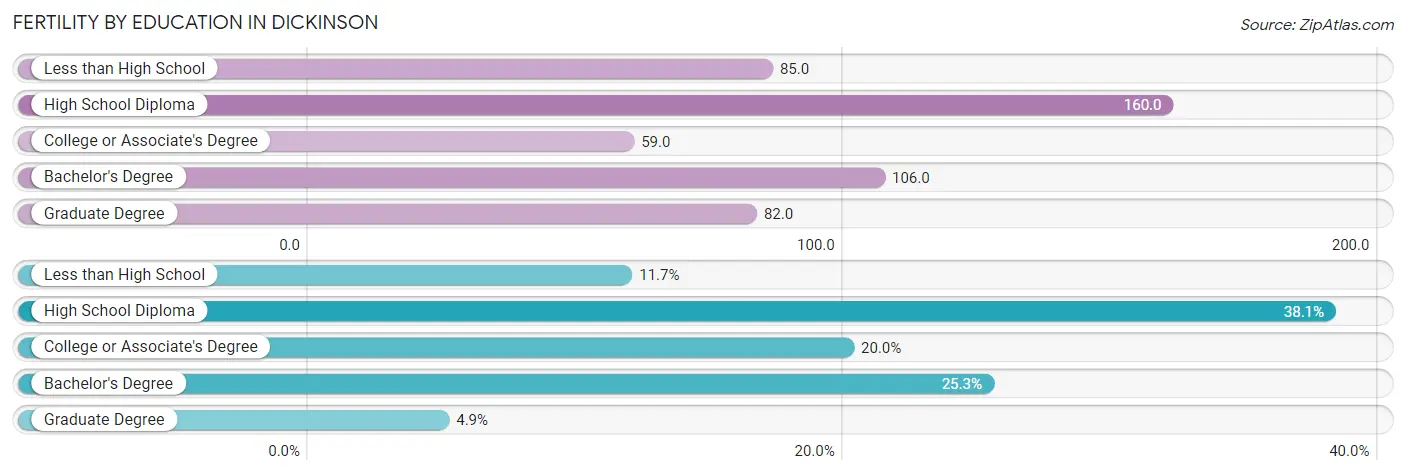
Fertility by Education in Dickinson
Average fertility rate in Dickinson is 99.0 births per 1,000 women. Women with the education attainment of high school diploma have the highest fertility rate of 160.0 births per 1,000 women, while women with the education attainment of college or associate's degree have the lowest fertility at 59.0 births per 1,000 women. Women with the education attainment of high school diploma represent 38.1% of all women with births.
| Educational Attainment | Women with Births | Births / 1,000 Women |
| Less than High School | 65 (11.7%) | 85.0 |
| High School Diploma | 211 (38.1%) | 160.0 |
| College or Associate's Degree | 111 (20.0%) | 59.0 |
| Bachelor's Degree | 140 (25.3%) | 106.0 |
| Graduate Degree | 27 (4.9%) | 82.0 |
| Total | 554 (100.0%) | 99.0 |
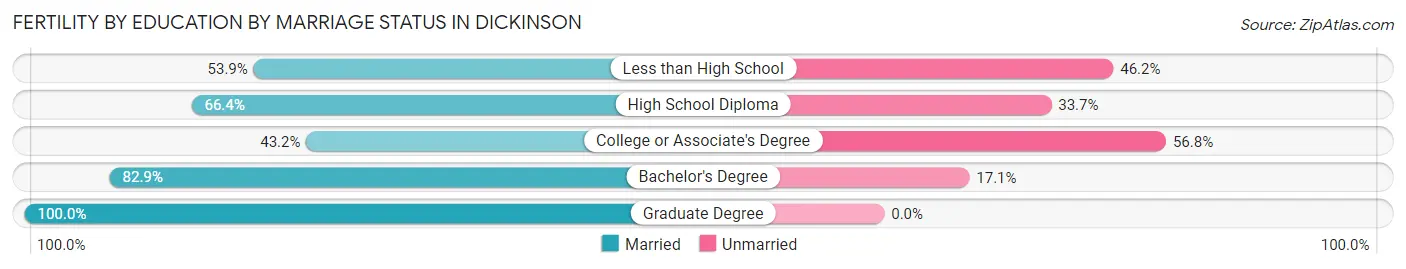
Fertility by Education by Marriage Status in Dickinson
33.9% of women with births in Dickinson are unmarried. Women with the educational attainment of graduate degree are most likely to be married with 100.0% of them married at childbirth, while women with the educational attainment of college or associate's degree are least likely to be married with 56.8% of them unmarried at childbirth.
| Educational Attainment | Married | Unmarried |
| Less than High School | 35 (53.8%) | 30 (46.2%) |
| High School Diploma | 140 (66.3%) | 71 (33.7%) |
| College or Associate's Degree | 48 (43.2%) | 63 (56.8%) |
| Bachelor's Degree | 116 (82.9%) | 24 (17.1%) |
| Graduate Degree | 27 (100.0%) | 0 (0.0%) |
| Total | 366 (66.1%) | 188 (33.9%) |
Income in Dickinson
Income Overview in Dickinson
Per Capita Income in Dickinson is $39,128, while median incomes of families and households are $103,794 and $75,767 respectively.
| Characteristic | Number | Measure |
| Per Capita Income | 25,116 | $39,128 |
| Median Family Income | 5,911 | $103,794 |
| Mean Family Income | 5,911 | $121,032 |
| Median Household Income | 10,247 | $75,767 |
| Mean Household Income | 10,247 | $94,179 |
| Income Deficit | 5,911 | $0 |
| Wage / Income Gap (%) | 25,116 | 43.14% |
| Wage / Income Gap ($) | 25,116 | 56.86¢ per $1 |
| Gini / Inequality Index | 25,116 | 0.43 |
Earnings by Sex in Dickinson
Average Earnings in Dickinson are $47,199, $57,909 for men and $32,927 for women, a difference of 43.1%.
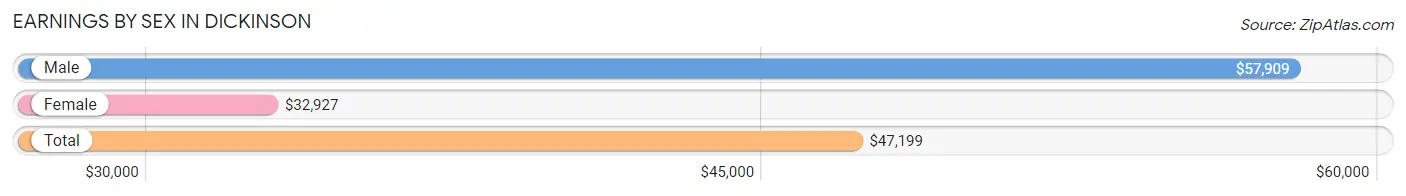
| Sex | Number | Average Earnings |
| Male | 8,259 (57.6%) | $57,909 |
| Female | 6,070 (42.4%) | $32,927 |
| Total | 14,329 (100.0%) | $47,199 |
Earnings by Sex by Income Bracket in Dickinson
The most common earnings brackets in Dickinson are $100,000+ for men (1,693 | 20.5%) and $75,000 to $99,999 for women (569 | 9.4%).
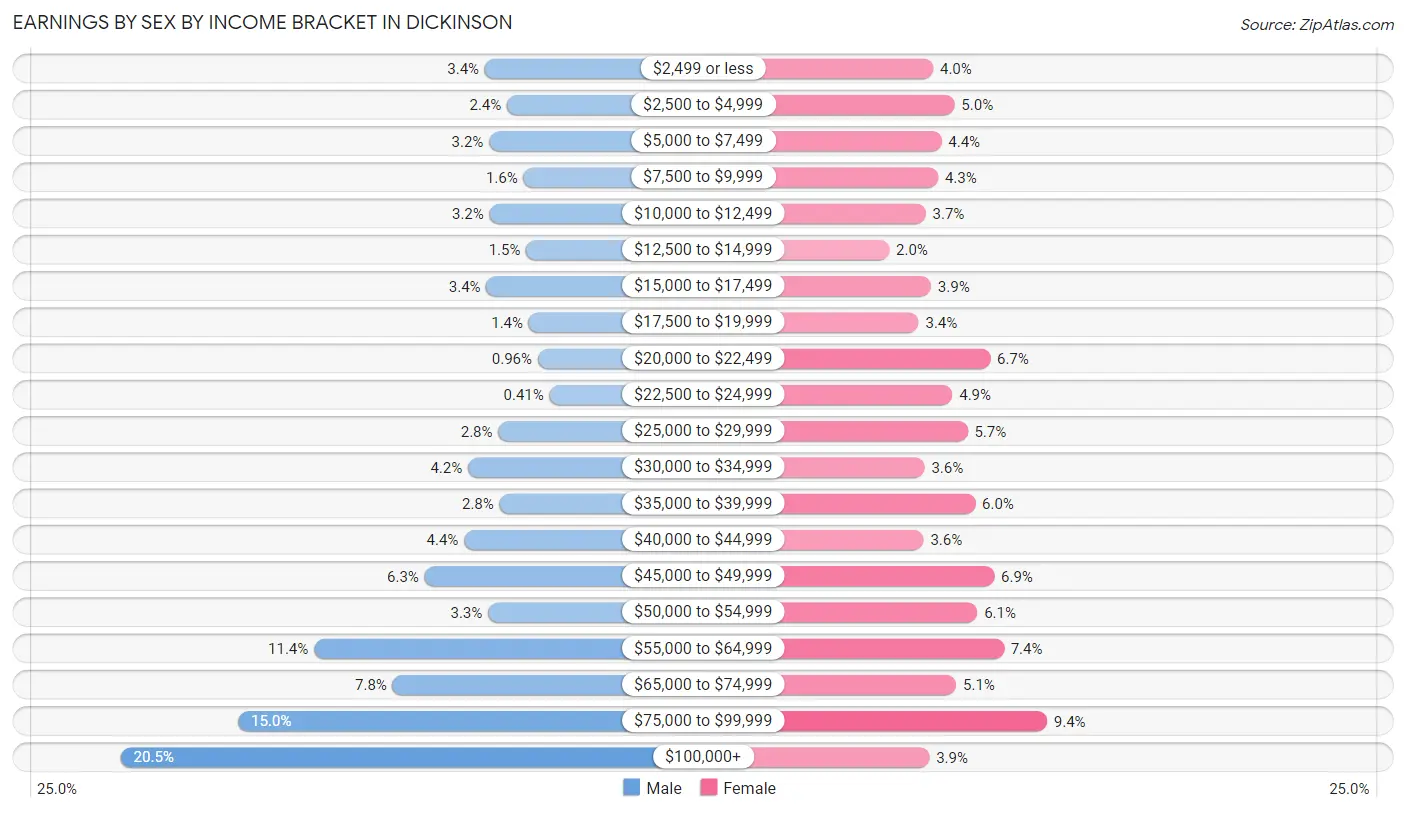
| Income | Male | Female |
| $2,499 or less | 284 (3.4%) | 245 (4.0%) |
| $2,500 to $4,999 | 198 (2.4%) | 306 (5.0%) |
| $5,000 to $7,499 | 268 (3.2%) | 269 (4.4%) |
| $7,500 to $9,999 | 135 (1.6%) | 259 (4.3%) |
| $10,000 to $12,499 | 266 (3.2%) | 224 (3.7%) |
| $12,500 to $14,999 | 124 (1.5%) | 120 (2.0%) |
| $15,000 to $17,499 | 278 (3.4%) | 239 (3.9%) |
| $17,500 to $19,999 | 114 (1.4%) | 204 (3.4%) |
| $20,000 to $22,499 | 79 (1.0%) | 407 (6.7%) |
| $22,500 to $24,999 | 34 (0.4%) | 300 (4.9%) |
| $25,000 to $29,999 | 232 (2.8%) | 343 (5.7%) |
| $30,000 to $34,999 | 349 (4.2%) | 221 (3.6%) |
| $35,000 to $39,999 | 227 (2.8%) | 365 (6.0%) |
| $40,000 to $44,999 | 364 (4.4%) | 218 (3.6%) |
| $45,000 to $49,999 | 517 (6.3%) | 419 (6.9%) |
| $50,000 to $54,999 | 272 (3.3%) | 371 (6.1%) |
| $55,000 to $64,999 | 945 (11.4%) | 446 (7.3%) |
| $65,000 to $74,999 | 641 (7.8%) | 311 (5.1%) |
| $75,000 to $99,999 | 1,239 (15.0%) | 569 (9.4%) |
| $100,000+ | 1,693 (20.5%) | 234 (3.9%) |
| Total | 8,259 (100.0%) | 6,070 (100.0%) |
Earnings by Sex by Educational Attainment in Dickinson
Average earnings in Dickinson are $65,177 for men and $39,834 for women, a difference of 38.9%. Men with an educational attainment of bachelor's degree enjoy the highest average annual earnings of $85,040, while those with high school diploma education earn the least with $49,516. Women with an educational attainment of graduate degree earn the most with the average annual earnings of $71,875, while those with high school diploma education have the smallest earnings of $35,539.
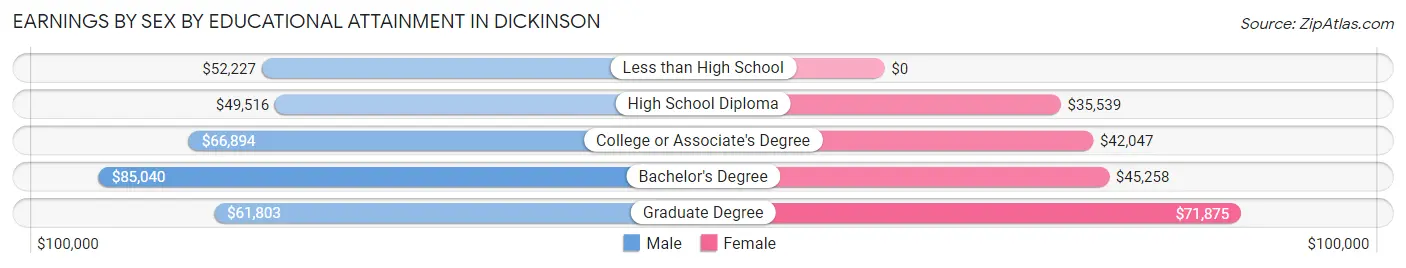
| Educational Attainment | Male Income | Female Income |
| Less than High School | $52,227 | $0 |
| High School Diploma | $49,516 | $35,539 |
| College or Associate's Degree | $66,894 | $42,047 |
| Bachelor's Degree | $85,040 | $45,258 |
| Graduate Degree | $61,803 | $71,875 |
| Total | $65,177 | $39,834 |
Family Income in Dickinson
Family Income Brackets in Dickinson
According to the Dickinson family income data, there are 1,643 families falling into the $100,000 to $149,999 income range, which is the most common income bracket and makes up 27.8% of all families. Conversely, the $10,000 to $14,999 income bracket is the least frequent group with only 71 families (1.2%) belonging to this category.
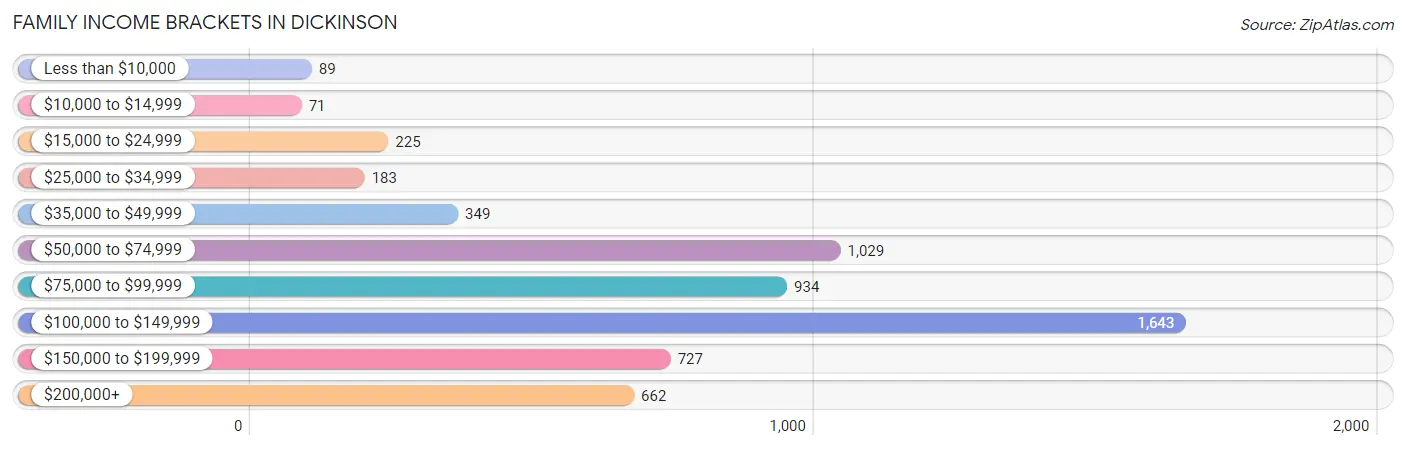
| Income Bracket | # Families | % Families |
| Less than $10,000 | 89 | 1.5% |
| $10,000 to $14,999 | 71 | 1.2% |
| $15,000 to $24,999 | 225 | 3.8% |
| $25,000 to $34,999 | 183 | 3.1% |
| $35,000 to $49,999 | 349 | 5.9% |
| $50,000 to $74,999 | 1,029 | 17.4% |
| $75,000 to $99,999 | 934 | 15.8% |
| $100,000 to $149,999 | 1,643 | 27.8% |
| $150,000 to $199,999 | 727 | 12.3% |
| $200,000+ | 662 | 11.2% |
Family Income by Famaliy Size in Dickinson
4-person families (985 | 16.7%) account for the highest median family income in Dickinson with $123,991 per family, while 2-person families (2,936 | 49.7%) have the highest median income of $48,792 per family member.
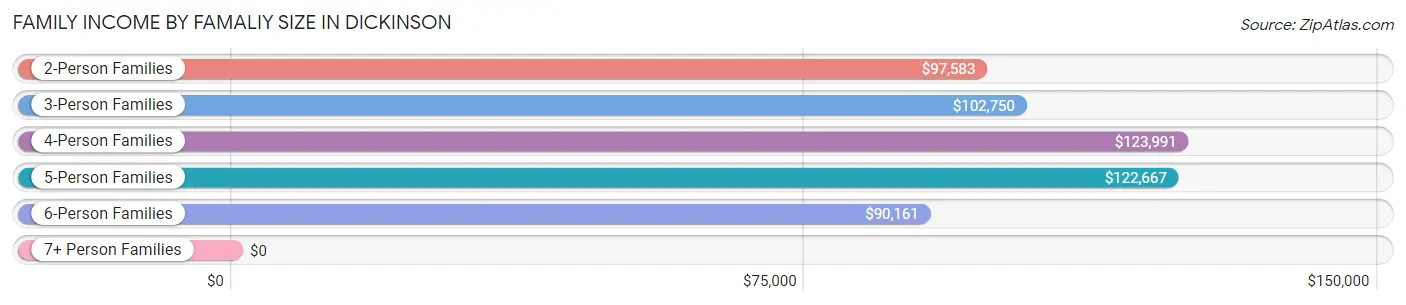
| Income Bracket | # Families | Median Income |
| 2-Person Families | 2,936 (49.7%) | $97,583 |
| 3-Person Families | 910 (15.4%) | $102,750 |
| 4-Person Families | 985 (16.7%) | $123,991 |
| 5-Person Families | 626 (10.6%) | $122,667 |
| 6-Person Families | 333 (5.6%) | $90,161 |
| 7+ Person Families | 121 (2.1%) | $0 |
| Total | 5,911 (100.0%) | $103,794 |
Family Income by Number of Earners in Dickinson
The median family income in Dickinson is $103,794, with families comprising 3+ earners (473) having the highest median family income of $156,250, while families with no earners (448) have the lowest median family income of $75,357, accounting for 8.0% and 7.6% of families, respectively.
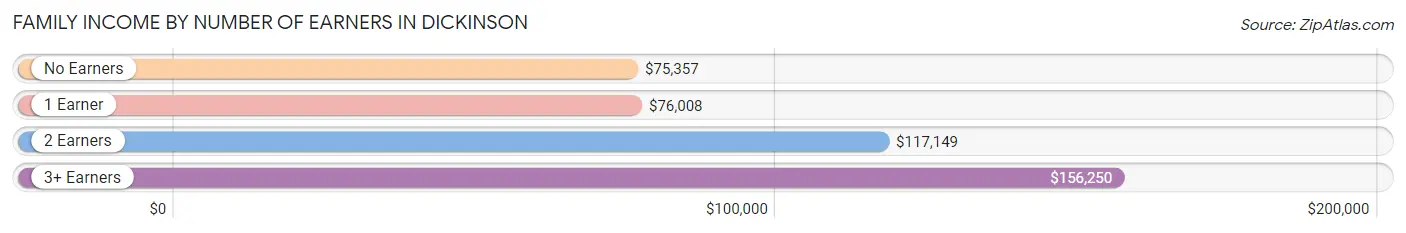
| Number of Earners | # Families | Median Income |
| No Earners | 448 (7.6%) | $75,357 |
| 1 Earner | 1,847 (31.2%) | $76,008 |
| 2 Earners | 3,143 (53.2%) | $117,149 |
| 3+ Earners | 473 (8.0%) | $156,250 |
| Total | 5,911 (100.0%) | $103,794 |
Household Income in Dickinson
Household Income Brackets in Dickinson
With 2,101 households falling in the category, the $100,000 to $149,999 income range is the most frequent in Dickinson, accounting for 20.5% of all households. In contrast, only 328 households (3.2%) fall into the $10,000 to $14,999 income bracket, making it the least populous group.
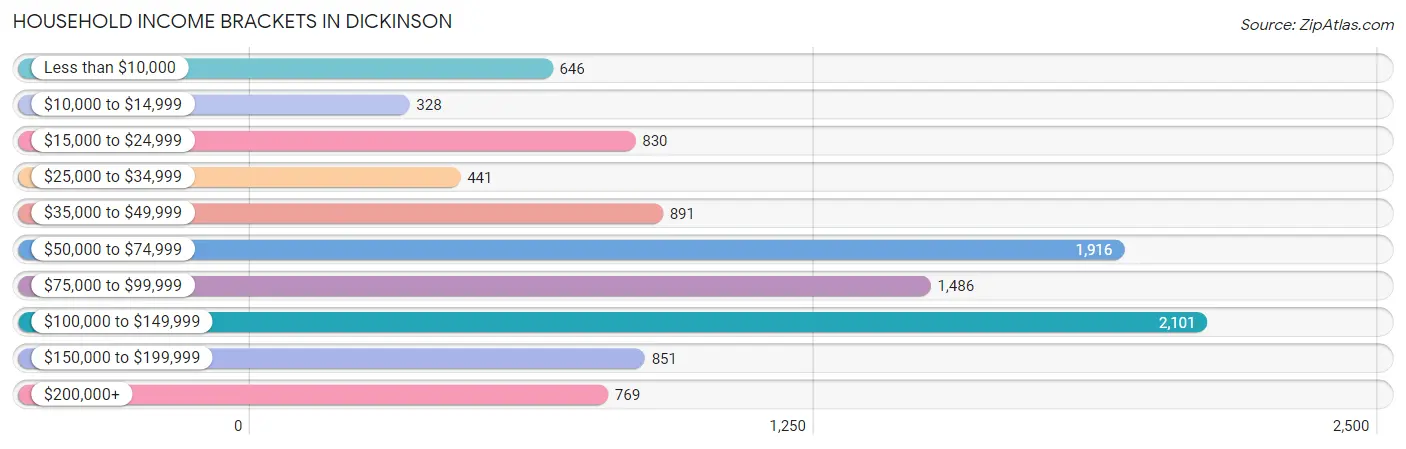
| Income Bracket | # Households | % Households |
| Less than $10,000 | 646 | 6.3% |
| $10,000 to $14,999 | 328 | 3.2% |
| $15,000 to $24,999 | 830 | 8.1% |
| $25,000 to $34,999 | 441 | 4.3% |
| $35,000 to $49,999 | 891 | 8.7% |
| $50,000 to $74,999 | 1,916 | 18.7% |
| $75,000 to $99,999 | 1,486 | 14.5% |
| $100,000 to $149,999 | 2,101 | 20.5% |
| $150,000 to $199,999 | 851 | 8.3% |
| $200,000+ | 769 | 7.5% |
Household Income by Householder Age in Dickinson
The median household income in Dickinson is $75,767, with the highest median household income of $87,166 found in the 25 to 44 years age bracket for the primary householder. A total of 4,369 households (42.6%) fall into this category. Meanwhile, the 15 to 24 years age bracket for the primary householder has the lowest median household income of $43,529, with 650 households (6.3%) in this group.
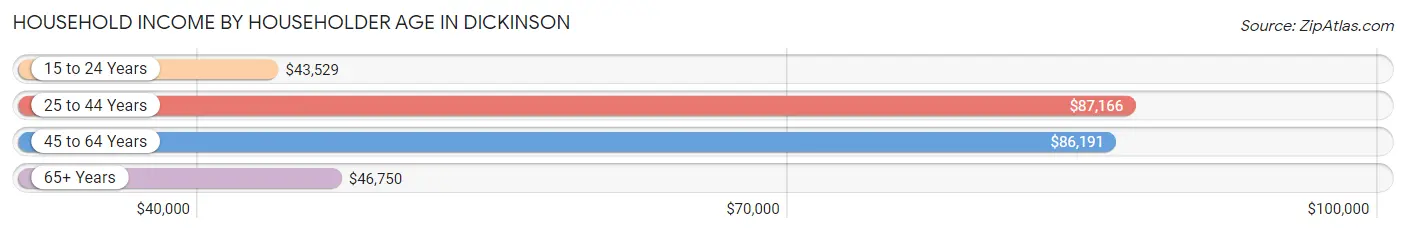
| Income Bracket | # Households | Median Income |
| 15 to 24 Years | 650 (6.3%) | $43,529 |
| 25 to 44 Years | 4,369 (42.6%) | $87,166 |
| 45 to 64 Years | 3,235 (31.6%) | $86,191 |
| 65+ Years | 1,993 (19.5%) | $46,750 |
| Total | 10,247 (100.0%) | $75,767 |
Poverty in Dickinson
Income Below Poverty by Sex and Age in Dickinson
With 10.5% poverty level for males and 10.9% for females among the residents of Dickinson, 18 to 24 year old males and 18 to 24 year old females are the most vulnerable to poverty, with 386 males (36.2%) and 309 females (30.8%) in their respective age groups living below the poverty level.
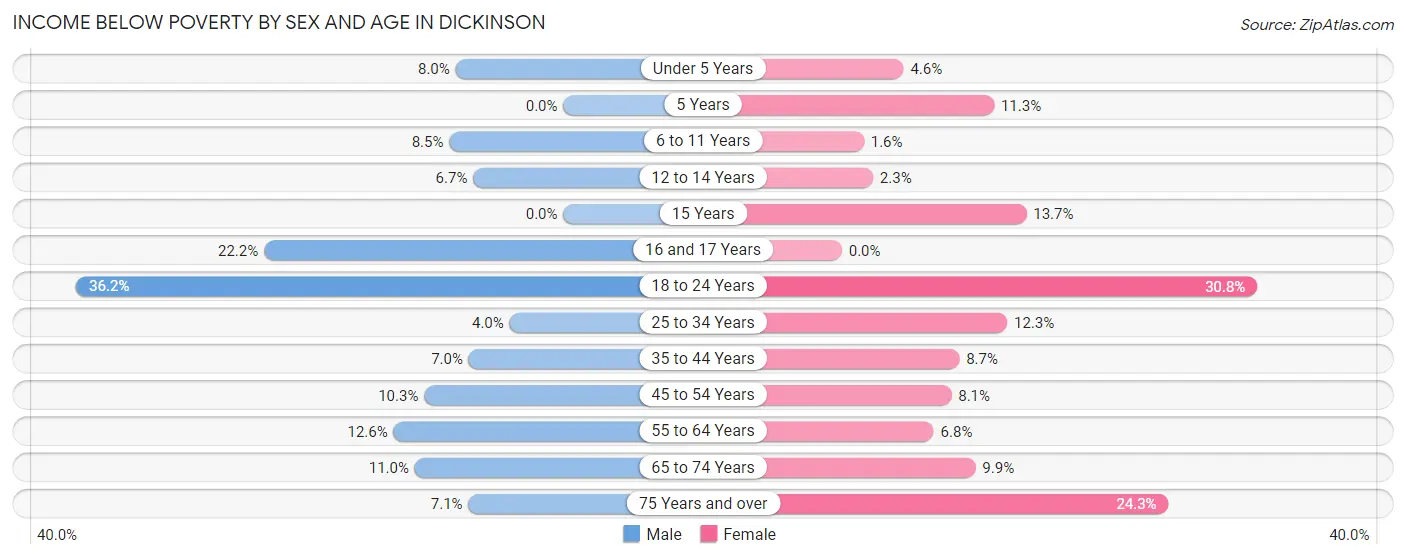
| Age Bracket | Male | Female |
| Under 5 Years | 74 (8.0%) | 51 (4.6%) |
| 5 Years | 0 (0.0%) | 33 (11.3%) |
| 6 to 11 Years | 96 (8.5%) | 17 (1.6%) |
| 12 to 14 Years | 38 (6.7%) | 5 (2.3%) |
| 15 Years | 0 (0.0%) | 10 (13.7%) |
| 16 and 17 Years | 72 (22.2%) | 0 (0.0%) |
| 18 to 24 Years | 386 (36.2%) | 309 (30.8%) |
| 25 to 34 Years | 95 (4.0%) | 247 (12.3%) |
| 35 to 44 Years | 126 (7.0%) | 125 (8.7%) |
| 45 to 54 Years | 143 (10.3%) | 99 (8.1%) |
| 55 to 64 Years | 181 (12.6%) | 90 (6.8%) |
| 65 to 74 Years | 77 (11.0%) | 70 (9.9%) |
| 75 Years and over | 36 (7.0%) | 210 (24.2%) |
| Total | 1,324 (10.5%) | 1,266 (10.9%) |
Income Above Poverty by Sex and Age in Dickinson
According to the poverty statistics in Dickinson, males aged 5 years and females aged 16 and 17 years are the age groups that are most secure financially, with 100.0% of males and 100.0% of females in these age groups living above the poverty line.
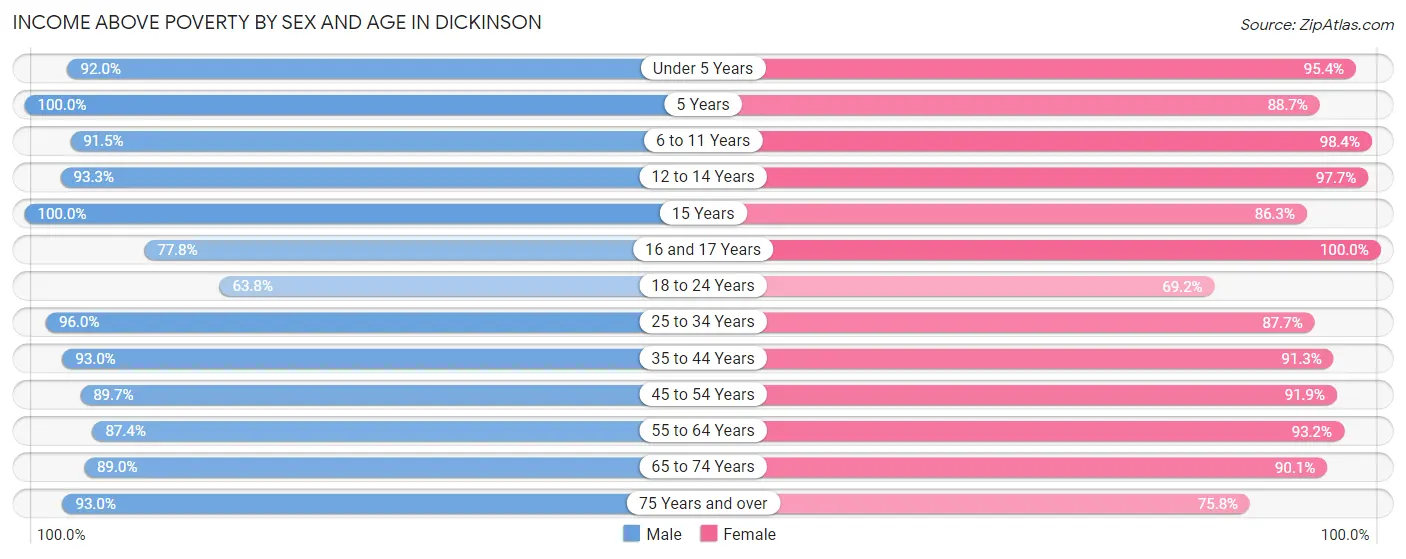
| Age Bracket | Male | Female |
| Under 5 Years | 851 (92.0%) | 1,063 (95.4%) |
| 5 Years | 240 (100.0%) | 259 (88.7%) |
| 6 to 11 Years | 1,037 (91.5%) | 1,023 (98.4%) |
| 12 to 14 Years | 530 (93.3%) | 211 (97.7%) |
| 15 Years | 138 (100.0%) | 63 (86.3%) |
| 16 and 17 Years | 252 (77.8%) | 364 (100.0%) |
| 18 to 24 Years | 681 (63.8%) | 693 (69.2%) |
| 25 to 34 Years | 2,287 (96.0%) | 1,766 (87.7%) |
| 35 to 44 Years | 1,670 (93.0%) | 1,308 (91.3%) |
| 45 to 54 Years | 1,241 (89.7%) | 1,119 (91.9%) |
| 55 to 64 Years | 1,254 (87.4%) | 1,230 (93.2%) |
| 65 to 74 Years | 621 (89.0%) | 636 (90.1%) |
| 75 Years and over | 475 (92.9%) | 656 (75.7%) |
| Total | 11,277 (89.5%) | 10,391 (89.1%) |
Income Below Poverty Among Married-Couple Families in Dickinson
The poverty statistics for married-couple families in Dickinson show that 4.3% or 203 of the total 4,664 families live below the poverty line. Families with 3 or 4 children have the highest poverty rate of 7.5%, comprising of 63 families. On the other hand, families with 5 or more children have the lowest poverty rate of 0.0%, which includes 0 families.
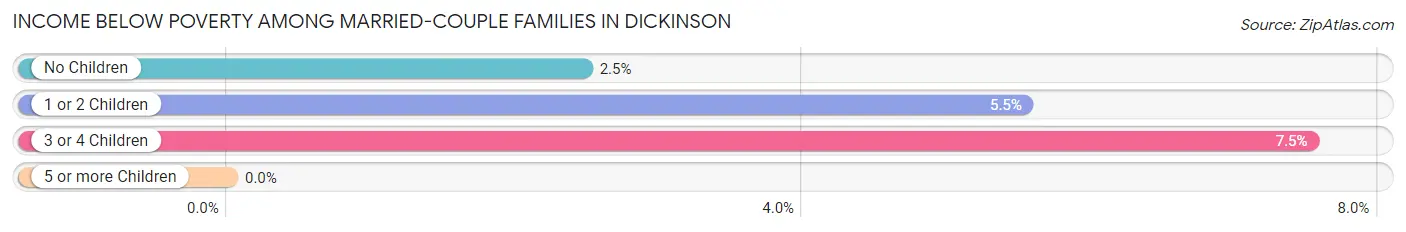
| Children | Above Poverty | Below Poverty |
| No Children | 2,249 (97.5%) | 57 (2.5%) |
| 1 or 2 Children | 1,414 (94.5%) | 83 (5.5%) |
| 3 or 4 Children | 774 (92.5%) | 63 (7.5%) |
| 5 or more Children | 24 (100.0%) | 0 (0.0%) |
| Total | 4,461 (95.7%) | 203 (4.3%) |
Income Below Poverty Among Single-Parent Households in Dickinson
According to the poverty data in Dickinson, 5.9% or 37 single-father households and 14.7% or 92 single-mother households are living below the poverty line. Among single-father households, those with 3 or 4 children have the highest poverty rate, with 6 households (54.5%) experiencing poverty. Likewise, among single-mother households, those with no children have the highest poverty rate, with 51 households (17.4%) falling below the poverty line.
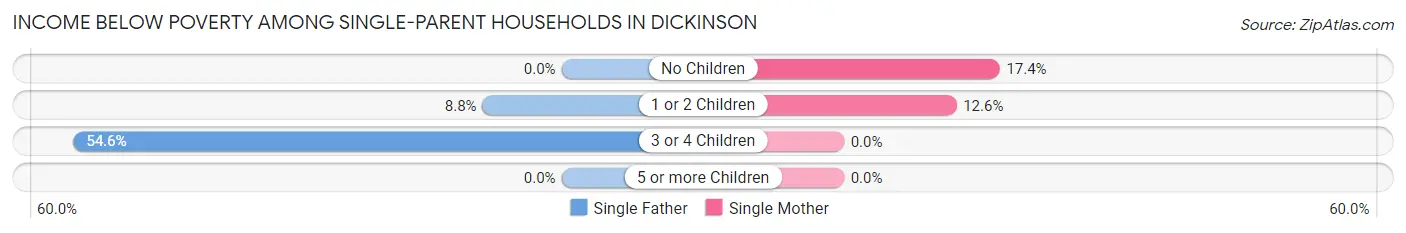
| Children | Single Father | Single Mother |
| No Children | 0 (0.0%) | 51 (17.4%) |
| 1 or 2 Children | 31 (8.8%) | 41 (12.6%) |
| 3 or 4 Children | 6 (54.5%) | 0 (0.0%) |
| 5 or more Children | 0 (0.0%) | 0 (0.0%) |
| Total | 37 (5.9%) | 92 (14.7%) |
Income Below Poverty Among Married-Couple vs Single-Parent Households in Dickinson
The poverty data for Dickinson shows that 203 of the married-couple family households (4.3%) and 129 of the single-parent households (10.3%) are living below the poverty level. Within the married-couple family households, those with 3 or 4 children have the highest poverty rate, with 63 households (7.5%) falling below the poverty line. Among the single-parent households, those with 3 or 4 children have the highest poverty rate, with 6 household (35.3%) living below poverty.
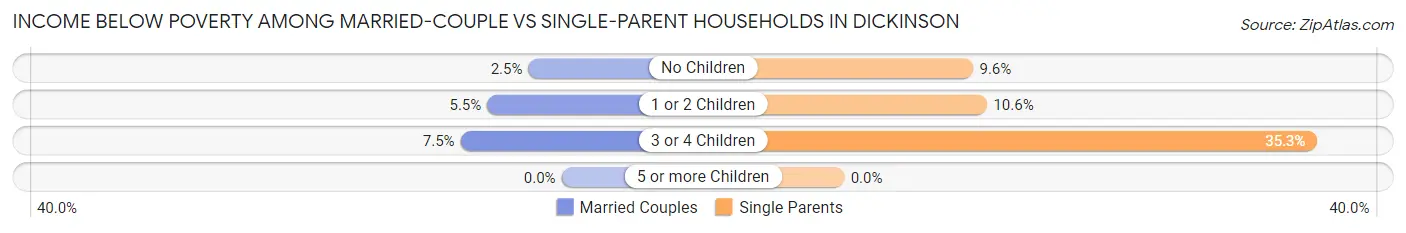
| Children | Married-Couple Families | Single-Parent Households |
| No Children | 57 (2.5%) | 51 (9.6%) |
| 1 or 2 Children | 83 (5.5%) | 72 (10.6%) |
| 3 or 4 Children | 63 (7.5%) | 6 (35.3%) |
| 5 or more Children | 0 (0.0%) | 0 (0.0%) |
| Total | 203 (4.3%) | 129 (10.3%) |
Employment Characteristics in Dickinson
Employment by Class of Employer in Dickinson
Among the 12,685 employed individuals in Dickinson, private company employees (8,817 | 69.5%), not-for-profit organizations (1,029 | 8.1%), and local government employees (809 | 6.4%) make up the most common classes of employment.
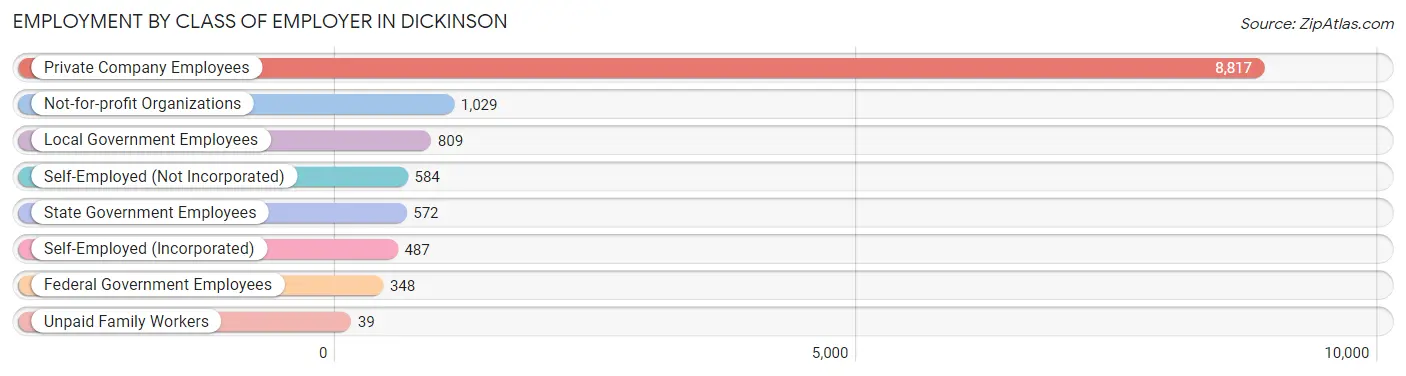
| Employer Class | # Employees | % Employees |
| Private Company Employees | 8,817 | 69.5% |
| Self-Employed (Incorporated) | 487 | 3.8% |
| Self-Employed (Not Incorporated) | 584 | 4.6% |
| Not-for-profit Organizations | 1,029 | 8.1% |
| Local Government Employees | 809 | 6.4% |
| State Government Employees | 572 | 4.5% |
| Federal Government Employees | 348 | 2.7% |
| Unpaid Family Workers | 39 | 0.3% |
| Total | 12,685 | 100.0% |
Employment Status by Age in Dickinson
According to the labor force statistics for Dickinson, out of the total population over 16 years of age (19,133), 69.5% or 13,297 individuals are in the labor force, with 3.0% or 399 of them unemployed. The age group with the highest labor force participation rate is 25 to 29 years, with 90.1% or 1,907 individuals in the labor force. Within the labor force, the 35 to 44 years age range has the highest percentage of unemployed individuals, with 7.3% or 210 of them being unemployed.
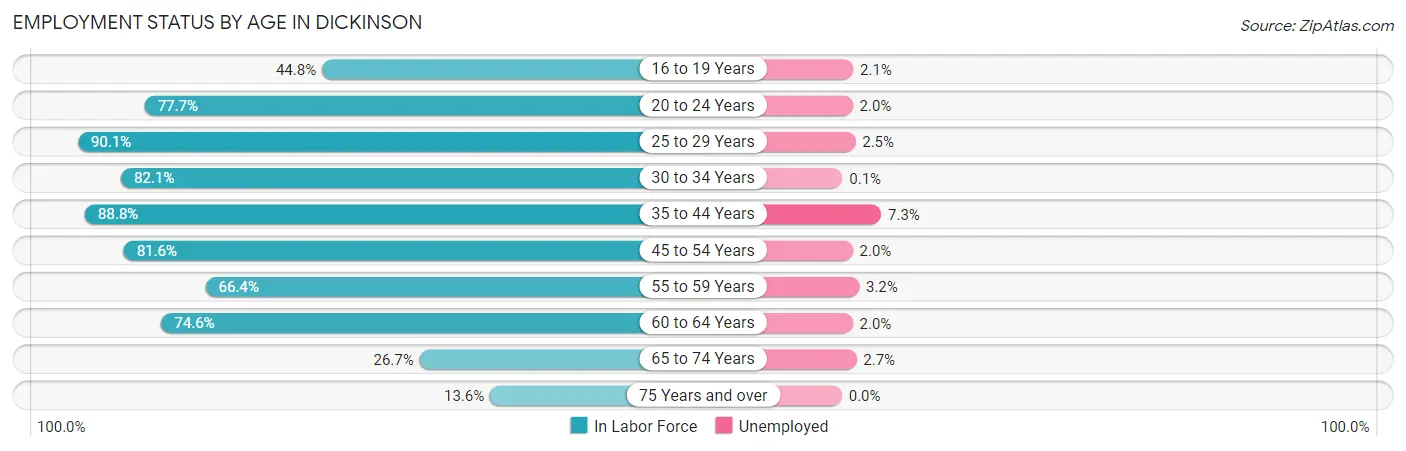
| Age Bracket | In Labor Force | Unemployed |
| 16 to 19 Years | 579 (44.8%) | 12 (2.1%) |
| 20 to 24 Years | 1,379 (77.7%) | 28 (2.0%) |
| 25 to 29 Years | 1,907 (90.1%) | 48 (2.5%) |
| 30 to 34 Years | 1,880 (82.1%) | 2 (0.1%) |
| 35 to 44 Years | 2,880 (88.8%) | 210 (7.3%) |
| 45 to 54 Years | 2,132 (81.6%) | 43 (2.0%) |
| 55 to 59 Years | 998 (66.4%) | 32 (3.2%) |
| 60 to 64 Years | 935 (74.6%) | 19 (2.0%) |
| 65 to 74 Years | 377 (26.7%) | 10 (2.7%) |
| 75 Years and over | 222 (13.6%) | 0 (0.0%) |
| Total | 13,297 (69.5%) | 399 (3.0%) |
Employment Status by Educational Attainment in Dickinson
According to labor force statistics for Dickinson, 82.4% of individuals (10,728) out of the total population between 25 and 64 years of age (13,020) are in the labor force, with 3.3% or 354 of them being unemployed. The group with the highest labor force participation rate are those with the educational attainment of college / associate degree, with 85.2% or 4,132 individuals in the labor force. Within the labor force, individuals with less than high school education have the highest percentage of unemployment, with 5.9% or 34 of them being unemployed.
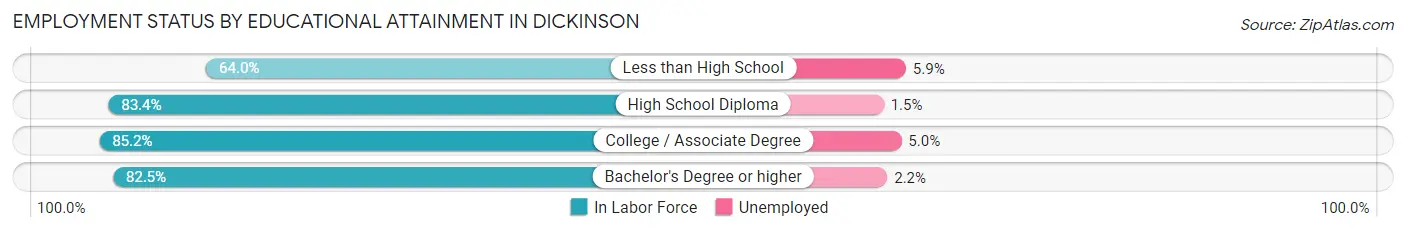
| Educational Attainment | In Labor Force | Unemployed |
| Less than High School | 577 (64.0%) | 53 (5.9%) |
| High School Diploma | 3,088 (83.4%) | 56 (1.5%) |
| College / Associate Degree | 4,132 (85.2%) | 242 (5.0%) |
| Bachelor's Degree or higher | 2,941 (82.5%) | 78 (2.2%) |
| Total | 10,728 (82.4%) | 430 (3.3%) |
Employment Occupations by Sex in Dickinson
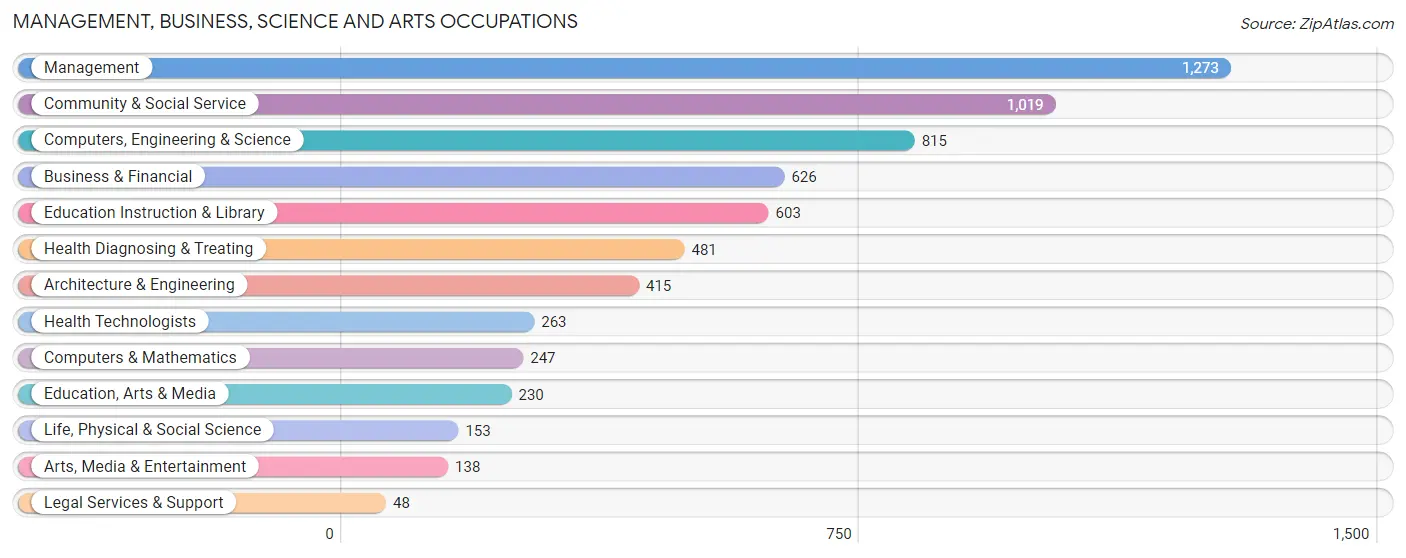
Management, Business, Science and Arts Occupations
The most common Management, Business, Science and Arts occupations in Dickinson are Management (1,273 | 9.9%), Community & Social Service (1,019 | 7.9%), Computers, Engineering & Science (815 | 6.3%), Business & Financial (626 | 4.9%), and Education Instruction & Library (603 | 4.7%).
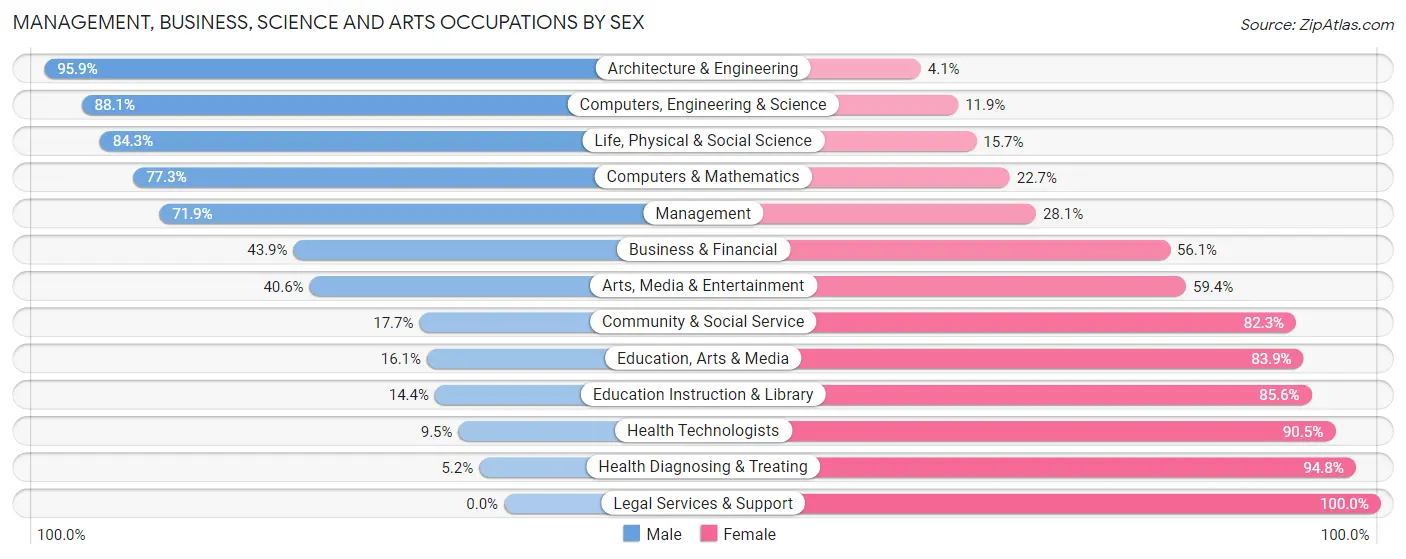
Management, Business, Science and Arts Occupations by Sex
Within the Management, Business, Science and Arts occupations in Dickinson, the most male-oriented occupations are Architecture & Engineering (95.9%), Computers, Engineering & Science (88.1%), and Life, Physical & Social Science (84.3%), while the most female-oriented occupations are Legal Services & Support (100.0%), Health Diagnosing & Treating (94.8%), and Health Technologists (90.5%).
| Occupation | Male | Female |
| Management | 915 (71.9%) | 358 (28.1%) |
| Business & Financial | 275 (43.9%) | 351 (56.1%) |
| Computers, Engineering & Science | 718 (88.1%) | 97 (11.9%) |
| Computers & Mathematics | 191 (77.3%) | 56 (22.7%) |
| Architecture & Engineering | 398 (95.9%) | 17 (4.1%) |
| Life, Physical & Social Science | 129 (84.3%) | 24 (15.7%) |
| Community & Social Service | 180 (17.7%) | 839 (82.3%) |
| Education, Arts & Media | 37 (16.1%) | 193 (83.9%) |
| Legal Services & Support | 0 (0.0%) | 48 (100.0%) |
| Education Instruction & Library | 87 (14.4%) | 516 (85.6%) |
| Arts, Media & Entertainment | 56 (40.6%) | 82 (59.4%) |
| Health Diagnosing & Treating | 25 (5.2%) | 456 (94.8%) |
| Health Technologists | 25 (9.5%) | 238 (90.5%) |
| Total (Category) | 2,113 (50.1%) | 2,101 (49.9%) |
| Total (Overall) | 7,415 (57.5%) | 5,476 (42.5%) |
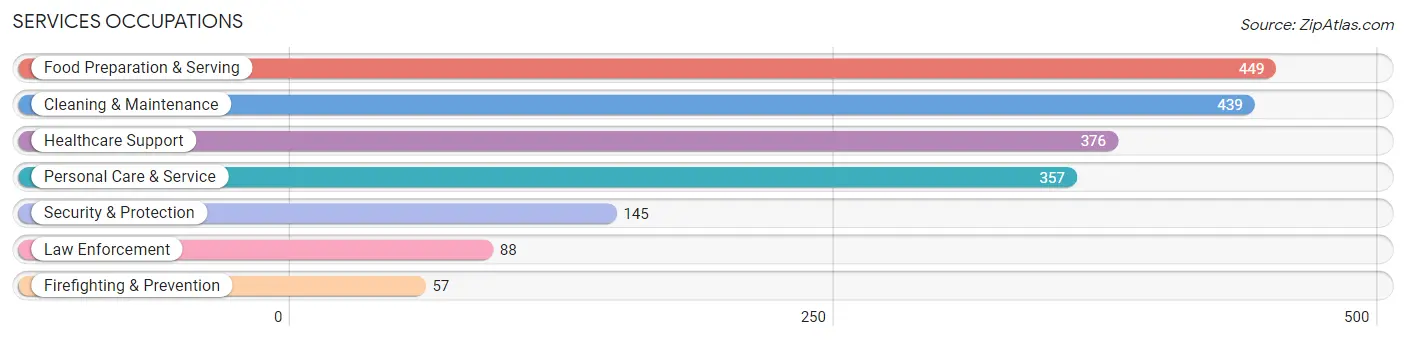
Services Occupations
The most common Services occupations in Dickinson are Food Preparation & Serving (449 | 3.5%), Cleaning & Maintenance (439 | 3.4%), Healthcare Support (376 | 2.9%), Personal Care & Service (357 | 2.8%), and Security & Protection (145 | 1.1%).
Services Occupations by Sex
Within the Services occupations in Dickinson, the most male-oriented occupations are Law Enforcement (100.0%), Security & Protection (95.2%), and Firefighting & Prevention (87.7%), while the most female-oriented occupations are Healthcare Support (88.6%), Personal Care & Service (78.4%), and Food Preparation & Serving (72.6%).

| Occupation | Male | Female |
| Healthcare Support | 43 (11.4%) | 333 (88.6%) |
| Security & Protection | 138 (95.2%) | 7 (4.8%) |
| Firefighting & Prevention | 50 (87.7%) | 7 (12.3%) |
| Law Enforcement | 88 (100.0%) | 0 (0.0%) |
| Food Preparation & Serving | 123 (27.4%) | 326 (72.6%) |
| Cleaning & Maintenance | 197 (44.9%) | 242 (55.1%) |
| Personal Care & Service | 77 (21.6%) | 280 (78.4%) |
| Total (Category) | 578 (32.7%) | 1,188 (67.3%) |
| Total (Overall) | 7,415 (57.5%) | 5,476 (42.5%) |
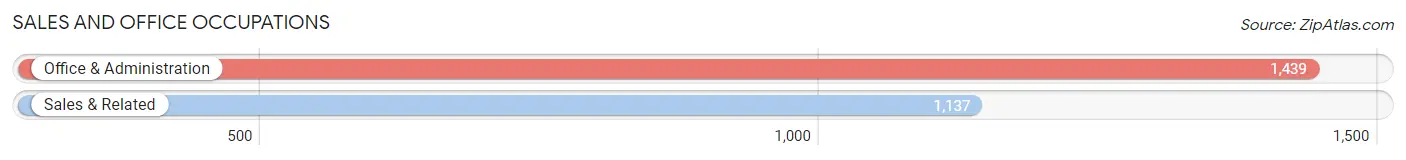
Sales and Office Occupations
The most common Sales and Office occupations in Dickinson are Office & Administration (1,439 | 11.2%), and Sales & Related (1,137 | 8.8%).
Sales and Office Occupations by Sex
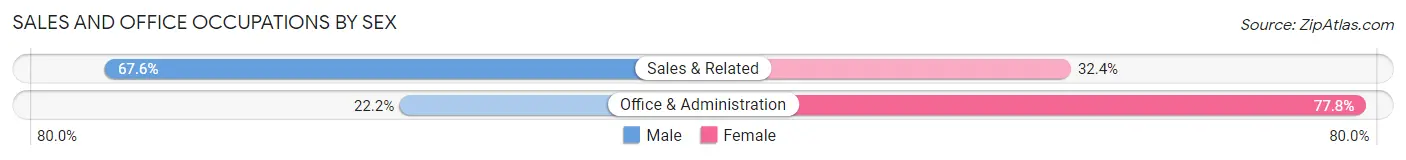
| Occupation | Male | Female |
| Sales & Related | 769 (67.6%) | 368 (32.4%) |
| Office & Administration | 320 (22.2%) | 1,119 (77.8%) |
| Total (Category) | 1,089 (42.3%) | 1,487 (57.7%) |
| Total (Overall) | 7,415 (57.5%) | 5,476 (42.5%) |
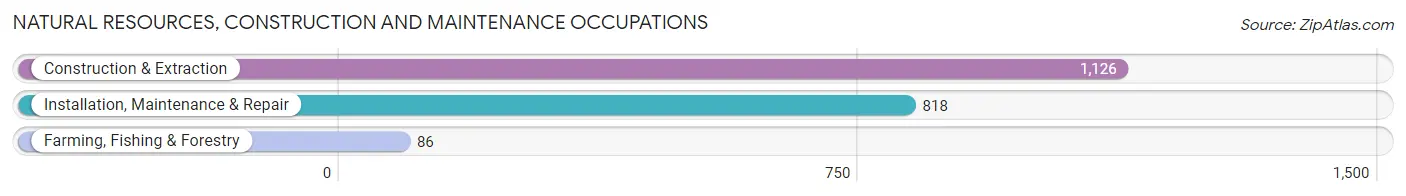
Natural Resources, Construction and Maintenance Occupations
The most common Natural Resources, Construction and Maintenance occupations in Dickinson are Construction & Extraction (1,126 | 8.7%), Installation, Maintenance & Repair (818 | 6.4%), and Farming, Fishing & Forestry (86 | 0.7%).
Natural Resources, Construction and Maintenance Occupations by Sex
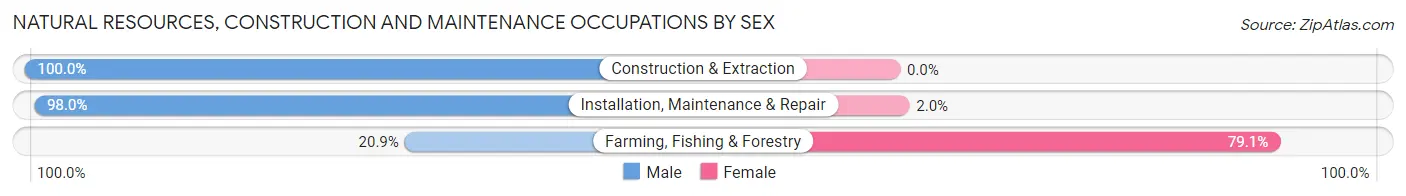
| Occupation | Male | Female |
| Farming, Fishing & Forestry | 18 (20.9%) | 68 (79.1%) |
| Construction & Extraction | 1,126 (100.0%) | 0 (0.0%) |
| Installation, Maintenance & Repair | 802 (98.0%) | 16 (2.0%) |
| Total (Category) | 1,946 (95.9%) | 84 (4.1%) |
| Total (Overall) | 7,415 (57.5%) | 5,476 (42.5%) |
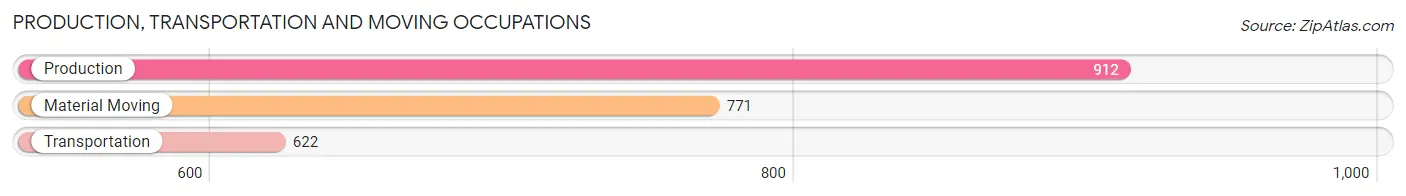
Production, Transportation and Moving Occupations
The most common Production, Transportation and Moving occupations in Dickinson are Production (912 | 7.1%), Material Moving (771 | 6.0%), and Transportation (622 | 4.8%).
Production, Transportation and Moving Occupations by Sex
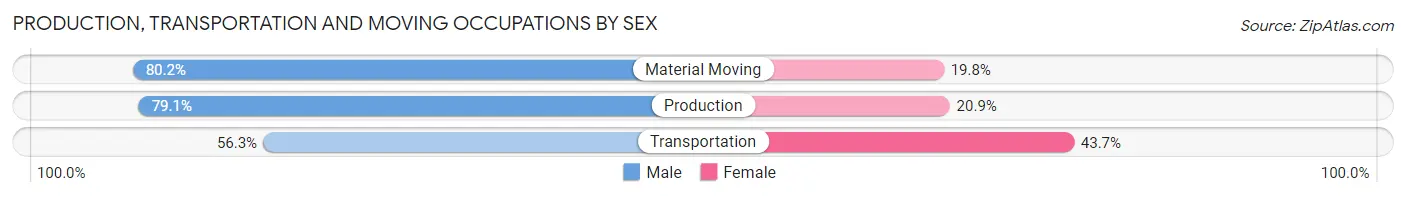
| Occupation | Male | Female |
| Production | 721 (79.1%) | 191 (20.9%) |
| Transportation | 350 (56.3%) | 272 (43.7%) |
| Material Moving | 618 (80.2%) | 153 (19.8%) |
| Total (Category) | 1,689 (73.3%) | 616 (26.7%) |
| Total (Overall) | 7,415 (57.5%) | 5,476 (42.5%) |
Employment Industries by Sex in Dickinson
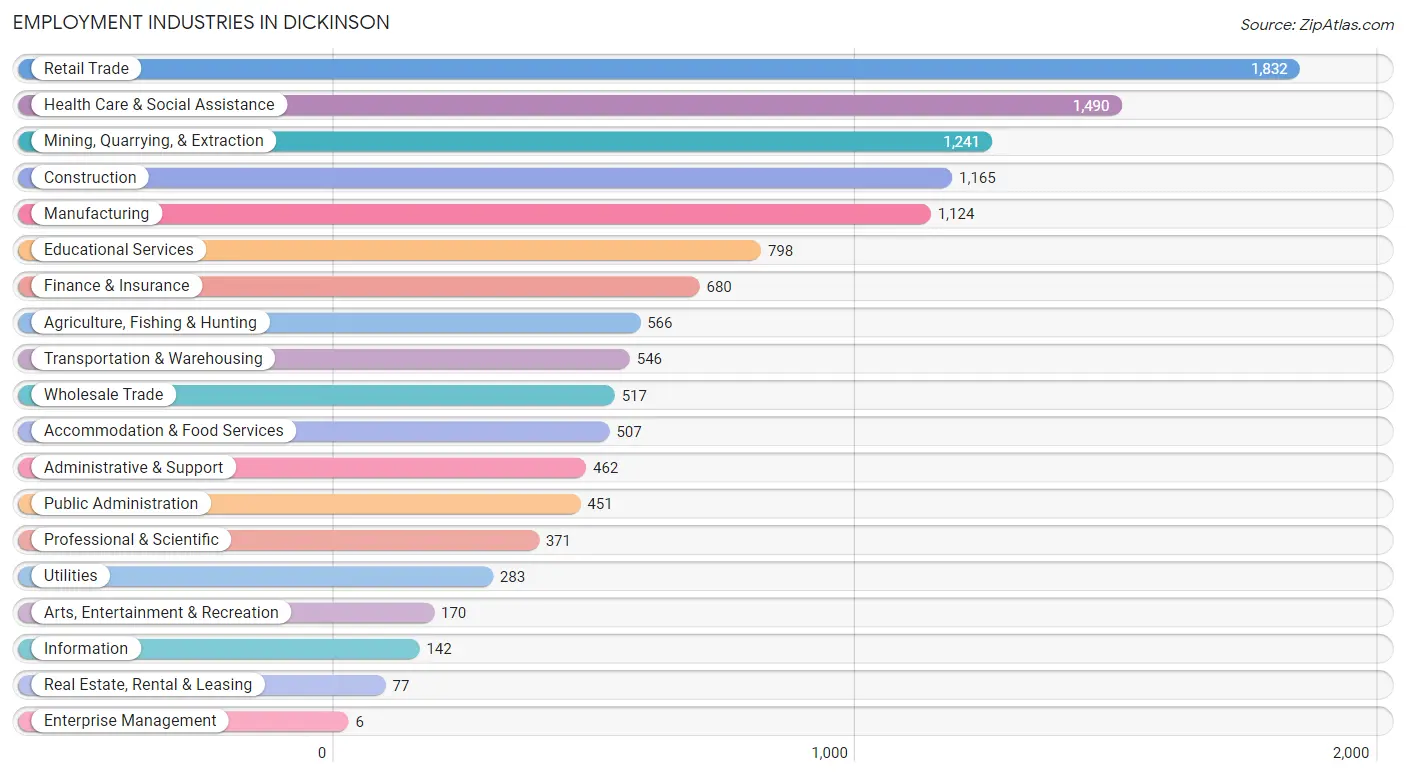
Employment Industries in Dickinson
The major employment industries in Dickinson include Retail Trade (1,832 | 14.2%), Health Care & Social Assistance (1,490 | 11.6%), Mining, Quarrying, & Extraction (1,241 | 9.6%), Construction (1,165 | 9.0%), and Manufacturing (1,124 | 8.7%).
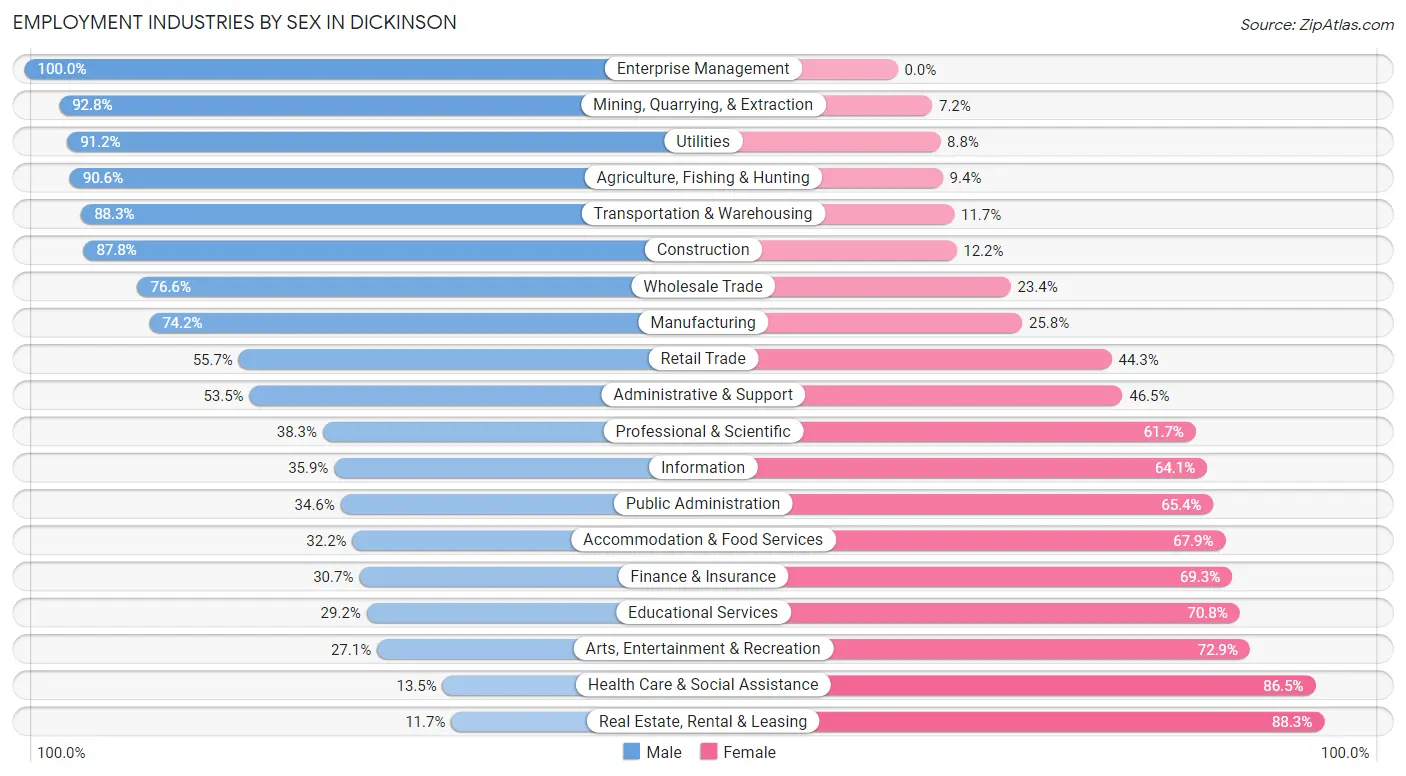
Employment Industries by Sex in Dickinson
The Dickinson industries that see more men than women are Enterprise Management (100.0%), Mining, Quarrying, & Extraction (92.8%), and Utilities (91.2%), whereas the industries that tend to have a higher number of women are Real Estate, Rental & Leasing (88.3%), Health Care & Social Assistance (86.5%), and Arts, Entertainment & Recreation (72.9%).
| Industry | Male | Female |
| Agriculture, Fishing & Hunting | 513 (90.6%) | 53 (9.4%) |
| Mining, Quarrying, & Extraction | 1,152 (92.8%) | 89 (7.2%) |
| Construction | 1,023 (87.8%) | 142 (12.2%) |
| Manufacturing | 834 (74.2%) | 290 (25.8%) |
| Wholesale Trade | 396 (76.6%) | 121 (23.4%) |
| Retail Trade | 1,020 (55.7%) | 812 (44.3%) |
| Transportation & Warehousing | 482 (88.3%) | 64 (11.7%) |
| Utilities | 258 (91.2%) | 25 (8.8%) |
| Information | 51 (35.9%) | 91 (64.1%) |
| Finance & Insurance | 209 (30.7%) | 471 (69.3%) |
| Real Estate, Rental & Leasing | 9 (11.7%) | 68 (88.3%) |
| Professional & Scientific | 142 (38.3%) | 229 (61.7%) |
| Enterprise Management | 6 (100.0%) | 0 (0.0%) |
| Administrative & Support | 247 (53.5%) | 215 (46.5%) |
| Educational Services | 233 (29.2%) | 565 (70.8%) |
| Health Care & Social Assistance | 201 (13.5%) | 1,289 (86.5%) |
| Arts, Entertainment & Recreation | 46 (27.1%) | 124 (72.9%) |
| Accommodation & Food Services | 163 (32.2%) | 344 (67.8%) |
| Public Administration | 156 (34.6%) | 295 (65.4%) |
| Total | 7,415 (57.5%) | 5,476 (42.5%) |
Education in Dickinson
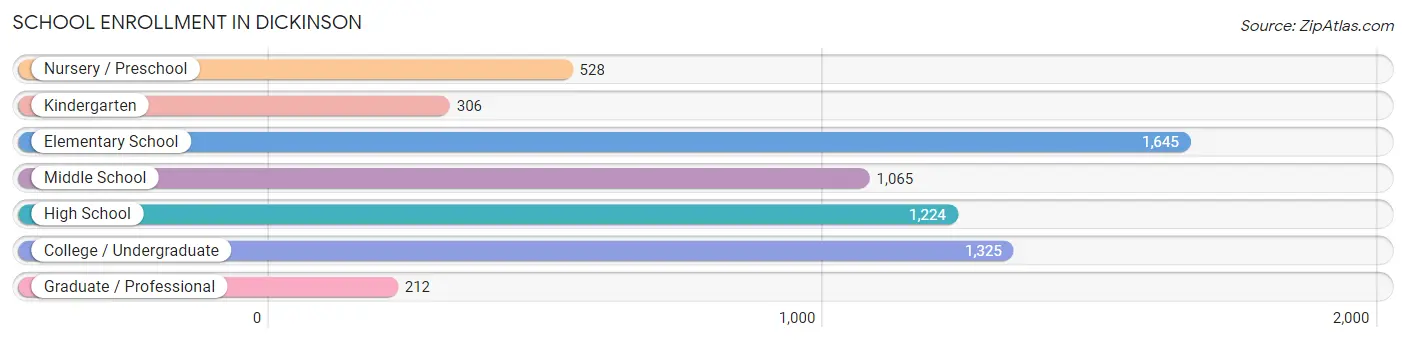
School Enrollment in Dickinson
The most common levels of schooling among the 6,305 students in Dickinson are elementary school (1,645 | 26.1%), college / undergraduate (1,325 | 21.0%), and high school (1,224 | 19.4%).
| School Level | # Students | % Students |
| Nursery / Preschool | 528 | 8.4% |
| Kindergarten | 306 | 4.9% |
| Elementary School | 1,645 | 26.1% |
| Middle School | 1,065 | 16.9% |
| High School | 1,224 | 19.4% |
| College / Undergraduate | 1,325 | 21.0% |
| Graduate / Professional | 212 | 3.4% |
| Total | 6,305 | 100.0% |
School Enrollment by Age by Funding Source in Dickinson
Out of a total of 6,305 students who are enrolled in schools in Dickinson, 1,286 (20.4%) attend a private institution, while the remaining 5,019 (79.6%) are enrolled in public schools. The age group of 3 to 4 year olds has the highest likelihood of being enrolled in private schools, with 121 (40.7% in the age bracket) enrolled. Conversely, the age group of 20 to 24 year olds has the lowest likelihood of being enrolled in a private school, with 686 (93.3% in the age bracket) attending a public institution.
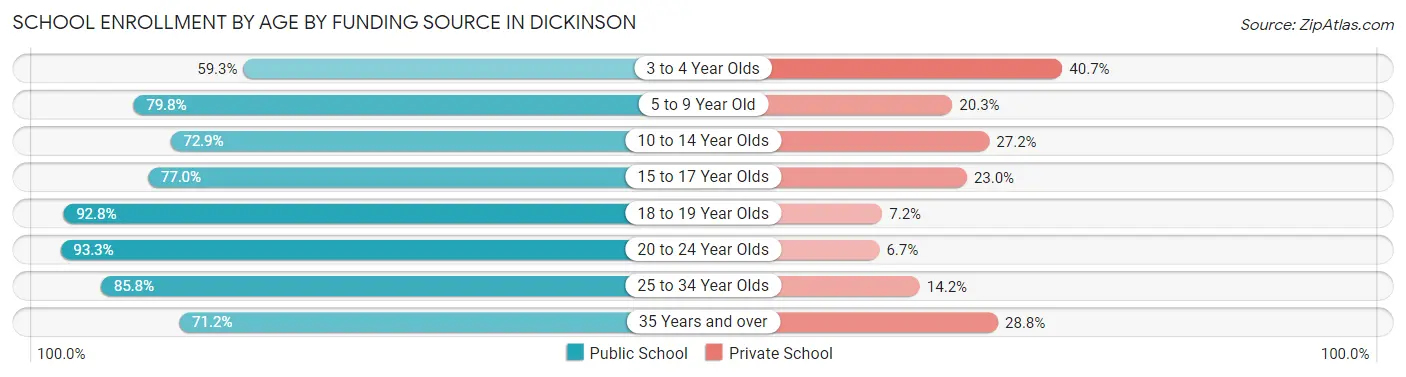
| Age Bracket | Public School | Private School |
| 3 to 4 Year Olds | 176 (59.3%) | 121 (40.7%) |
| 5 to 9 Year Old | 1,591 (79.7%) | 404 (20.3%) |
| 10 to 14 Year Olds | 974 (72.9%) | 363 (27.2%) |
| 15 to 17 Year Olds | 614 (77.0%) | 183 (23.0%) |
| 18 to 19 Year Olds | 503 (92.8%) | 39 (7.2%) |
| 20 to 24 Year Olds | 686 (93.3%) | 49 (6.7%) |
| 25 to 34 Year Olds | 272 (85.8%) | 45 (14.2%) |
| 35 Years and over | 203 (71.2%) | 82 (28.8%) |
| Total | 5,019 (79.6%) | 1,286 (20.4%) |
Educational Attainment by Field of Study in Dickinson
Business (961 | 21.6%), education (622 | 14.0%), science & technology (396 | 8.9%), engineering (350 | 7.9%), and arts & humanities (293 | 6.6%) are the most common fields of study among 4,443 individuals in Dickinson who have obtained a bachelor's degree or higher.
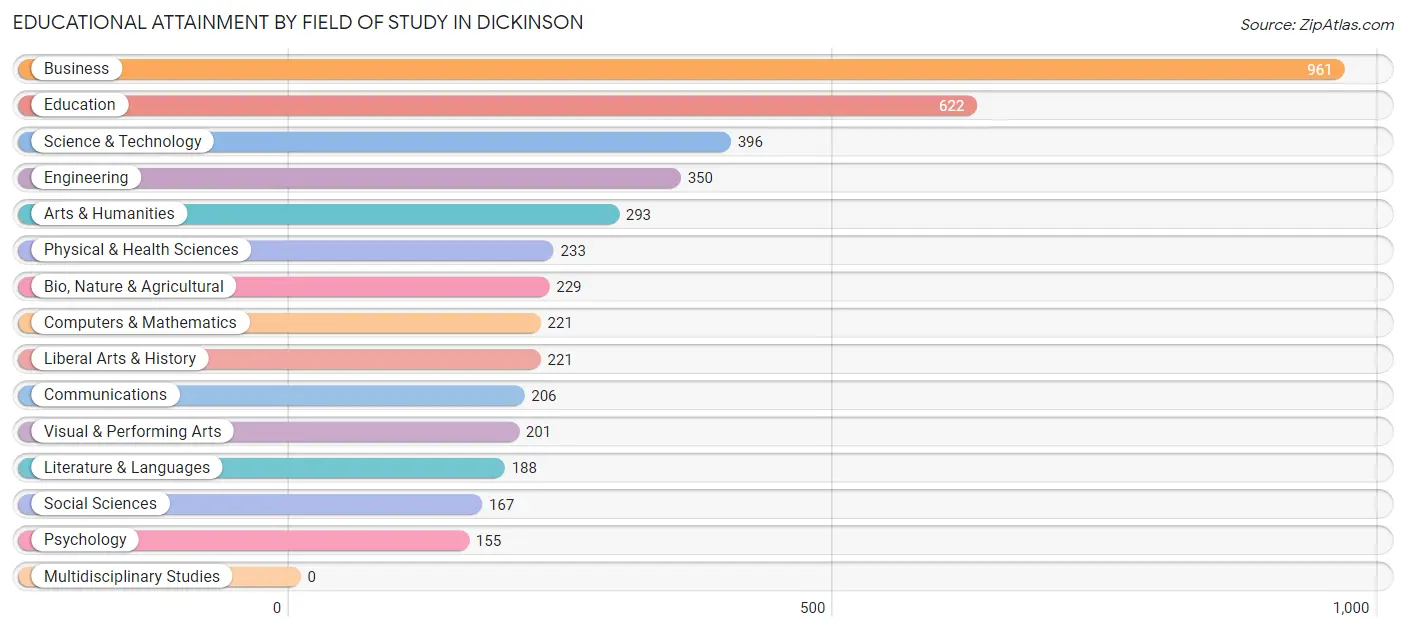
| Field of Study | # Graduates | % Graduates |
| Computers & Mathematics | 221 | 5.0% |
| Bio, Nature & Agricultural | 229 | 5.1% |
| Physical & Health Sciences | 233 | 5.2% |
| Psychology | 155 | 3.5% |
| Social Sciences | 167 | 3.8% |
| Engineering | 350 | 7.9% |
| Multidisciplinary Studies | 0 | 0.0% |
| Science & Technology | 396 | 8.9% |
| Business | 961 | 21.6% |
| Education | 622 | 14.0% |
| Literature & Languages | 188 | 4.2% |
| Liberal Arts & History | 221 | 5.0% |
| Visual & Performing Arts | 201 | 4.5% |
| Communications | 206 | 4.6% |
| Arts & Humanities | 293 | 6.6% |
| Total | 4,443 | 100.0% |
Transportation & Commute in Dickinson
Vehicle Availability by Sex in Dickinson
The most prevalent vehicle ownership categories in Dickinson are males with 2 vehicles (3,162, accounting for 43.7%) and females with 2 vehicles (2,112, making up 59.4%).
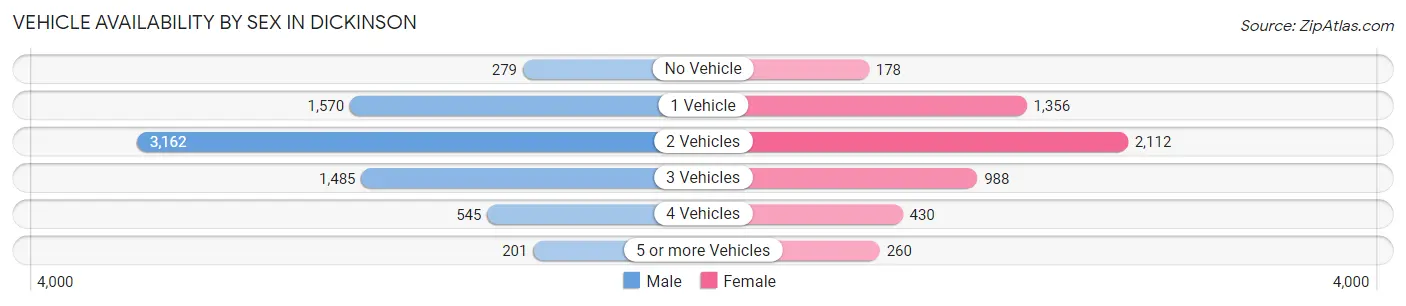
| Vehicles Available | Male | Female |
| No Vehicle | 279 (3.8%) | 178 (3.3%) |
| 1 Vehicle | 1,570 (21.7%) | 1,356 (25.5%) |
| 2 Vehicles | 3,162 (43.7%) | 2,112 (39.7%) |
| 3 Vehicles | 1,485 (20.5%) | 988 (18.6%) |
| 4 Vehicles | 545 (7.5%) | 430 (8.1%) |
| 5 or more Vehicles | 201 (2.8%) | 260 (4.9%) |
| Total | 7,242 (100.0%) | 5,324 (100.0%) |
Commute Time in Dickinson
The most frequently occuring commute durations in Dickinson are 5 to 9 minutes (3,862 commuters, 31.7%), 10 to 14 minutes (3,520 commuters, 28.9%), and 15 to 19 minutes (1,620 commuters, 13.3%).
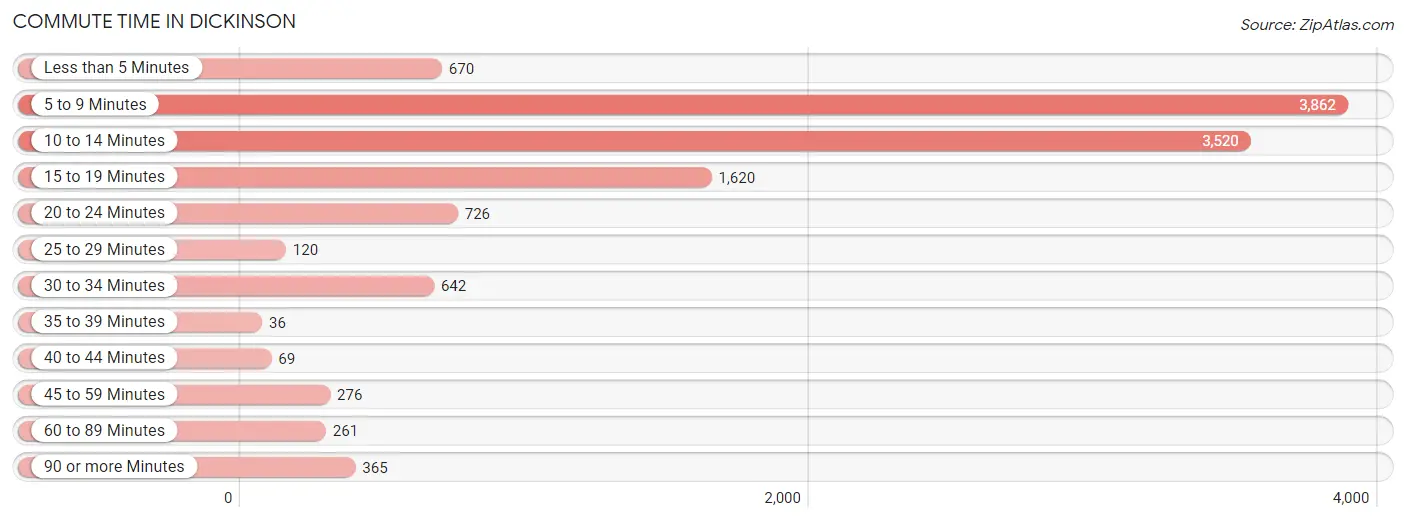
| Commute Time | # Commuters | % Commuters |
| Less than 5 Minutes | 670 | 5.5% |
| 5 to 9 Minutes | 3,862 | 31.7% |
| 10 to 14 Minutes | 3,520 | 28.9% |
| 15 to 19 Minutes | 1,620 | 13.3% |
| 20 to 24 Minutes | 726 | 6.0% |
| 25 to 29 Minutes | 120 | 1.0% |
| 30 to 34 Minutes | 642 | 5.3% |
| 35 to 39 Minutes | 36 | 0.3% |
| 40 to 44 Minutes | 69 | 0.6% |
| 45 to 59 Minutes | 276 | 2.3% |
| 60 to 89 Minutes | 261 | 2.1% |
| 90 or more Minutes | 365 | 3.0% |
Commute Time by Sex in Dickinson
The most common commute times in Dickinson are 5 to 9 minutes (1,939 commuters, 27.3%) for males and 5 to 9 minutes (1,923 commuters, 37.9%) for females.
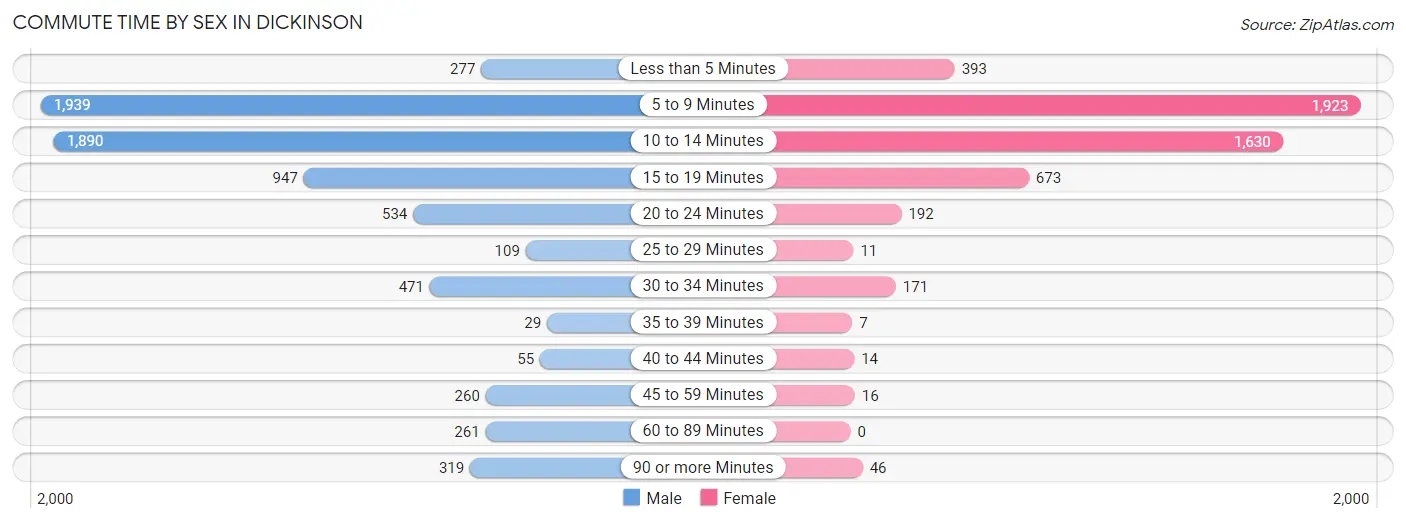
| Commute Time | Male | Female |
| Less than 5 Minutes | 277 (3.9%) | 393 (7.7%) |
| 5 to 9 Minutes | 1,939 (27.3%) | 1,923 (37.9%) |
| 10 to 14 Minutes | 1,890 (26.7%) | 1,630 (32.1%) |
| 15 to 19 Minutes | 947 (13.4%) | 673 (13.3%) |
| 20 to 24 Minutes | 534 (7.5%) | 192 (3.8%) |
| 25 to 29 Minutes | 109 (1.5%) | 11 (0.2%) |
| 30 to 34 Minutes | 471 (6.6%) | 171 (3.4%) |
| 35 to 39 Minutes | 29 (0.4%) | 7 (0.1%) |
| 40 to 44 Minutes | 55 (0.8%) | 14 (0.3%) |
| 45 to 59 Minutes | 260 (3.7%) | 16 (0.3%) |
| 60 to 89 Minutes | 261 (3.7%) | 0 (0.0%) |
| 90 or more Minutes | 319 (4.5%) | 46 (0.9%) |
Time of Departure to Work by Sex in Dickinson
The most frequent times of departure to work in Dickinson are 6:30 AM to 6:59 AM (1,144, 16.1%) for males and 7:30 AM to 7:59 AM (992, 19.5%) for females.
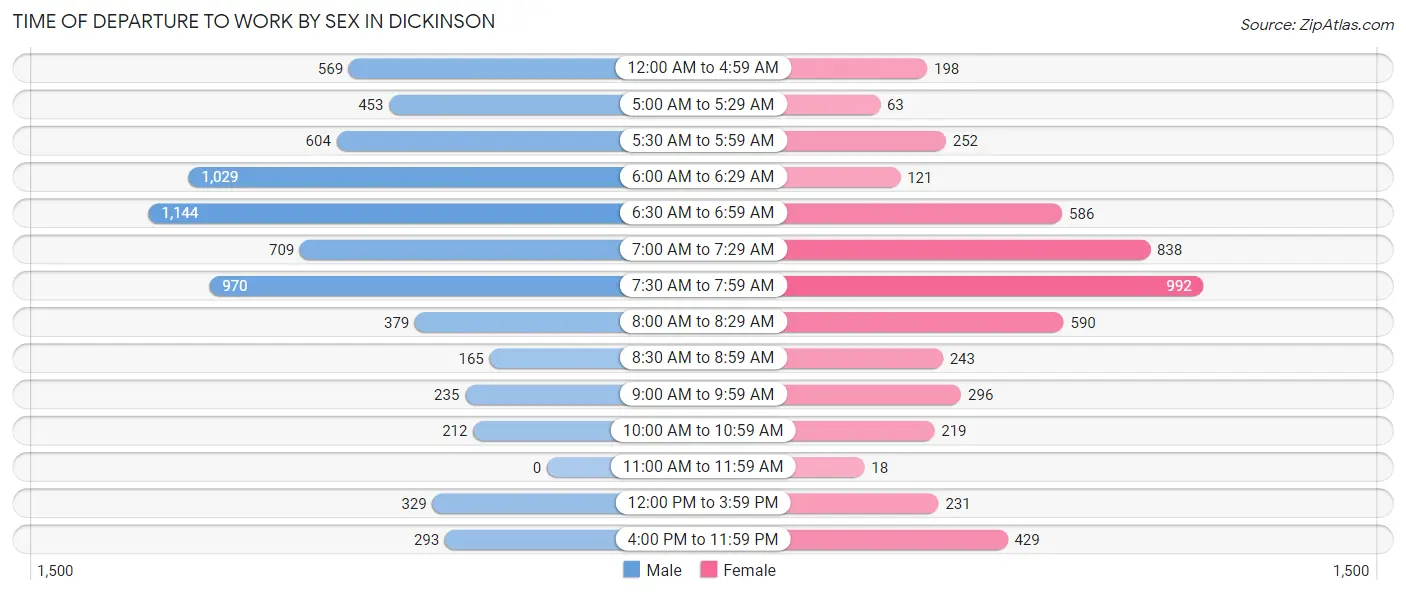
| Time of Departure | Male | Female |
| 12:00 AM to 4:59 AM | 569 (8.0%) | 198 (3.9%) |
| 5:00 AM to 5:29 AM | 453 (6.4%) | 63 (1.2%) |
| 5:30 AM to 5:59 AM | 604 (8.5%) | 252 (5.0%) |
| 6:00 AM to 6:29 AM | 1,029 (14.5%) | 121 (2.4%) |
| 6:30 AM to 6:59 AM | 1,144 (16.1%) | 586 (11.5%) |
| 7:00 AM to 7:29 AM | 709 (10.0%) | 838 (16.5%) |
| 7:30 AM to 7:59 AM | 970 (13.7%) | 992 (19.5%) |
| 8:00 AM to 8:29 AM | 379 (5.3%) | 590 (11.6%) |
| 8:30 AM to 8:59 AM | 165 (2.3%) | 243 (4.8%) |
| 9:00 AM to 9:59 AM | 235 (3.3%) | 296 (5.8%) |
| 10:00 AM to 10:59 AM | 212 (3.0%) | 219 (4.3%) |
| 11:00 AM to 11:59 AM | 0 (0.0%) | 18 (0.4%) |
| 12:00 PM to 3:59 PM | 329 (4.6%) | 231 (4.5%) |
| 4:00 PM to 11:59 PM | 293 (4.1%) | 429 (8.5%) |
| Total | 7,091 (100.0%) | 5,076 (100.0%) |
Housing Occupancy in Dickinson
Occupancy by Ownership in Dickinson
Of the total 10,247 dwellings in Dickinson, owner-occupied units account for 5,946 (58.0%), while renter-occupied units make up 4,301 (42.0%).
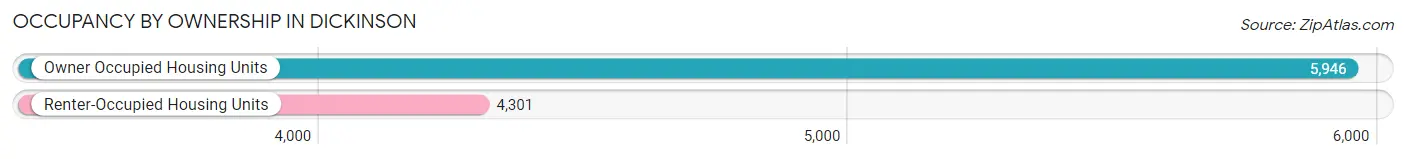
| Occupancy | # Housing Units | % Housing Units |
| Owner Occupied Housing Units | 5,946 | 58.0% |
| Renter-Occupied Housing Units | 4,301 | 42.0% |
| Total Occupied Housing Units | 10,247 | 100.0% |
Occupancy by Household Size in Dickinson
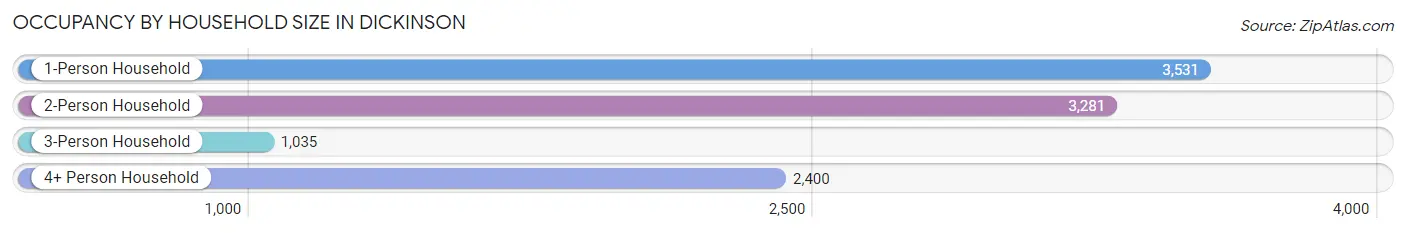
| Household Size | # Housing Units | % Housing Units |
| 1-Person Household | 3,531 | 34.5% |
| 2-Person Household | 3,281 | 32.0% |
| 3-Person Household | 1,035 | 10.1% |
| 4+ Person Household | 2,400 | 23.4% |
| Total Housing Units | 10,247 | 100.0% |
Occupancy by Ownership by Household Size in Dickinson
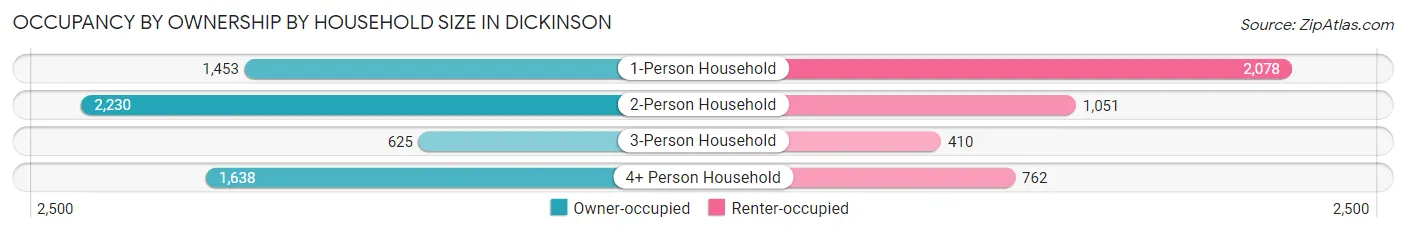
| Household Size | Owner-occupied | Renter-occupied |
| 1-Person Household | 1,453 (41.1%) | 2,078 (58.9%) |
| 2-Person Household | 2,230 (68.0%) | 1,051 (32.0%) |
| 3-Person Household | 625 (60.4%) | 410 (39.6%) |
| 4+ Person Household | 1,638 (68.2%) | 762 (31.8%) |
| Total Housing Units | 5,946 (58.0%) | 4,301 (42.0%) |
Occupancy by Educational Attainment in Dickinson
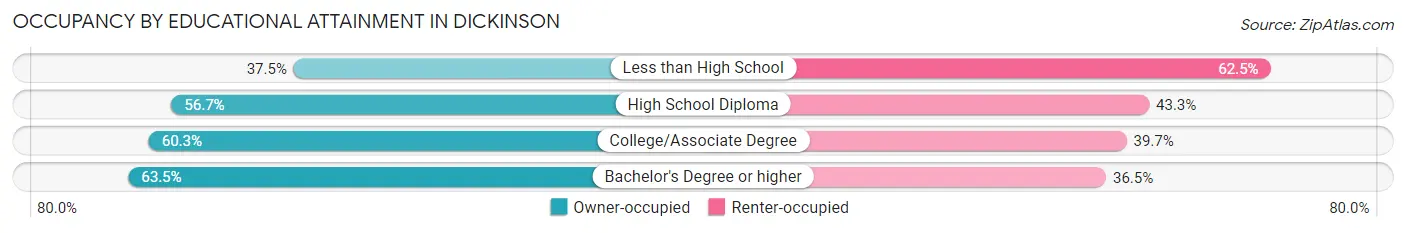
| Household Size | Owner-occupied | Renter-occupied |
| Less than High School | 329 (37.5%) | 549 (62.5%) |
| High School Diploma | 1,800 (56.7%) | 1,374 (43.3%) |
| College/Associate Degree | 2,217 (60.3%) | 1,460 (39.7%) |
| Bachelor's Degree or higher | 1,600 (63.5%) | 918 (36.5%) |
Occupancy by Age of Householder in Dickinson
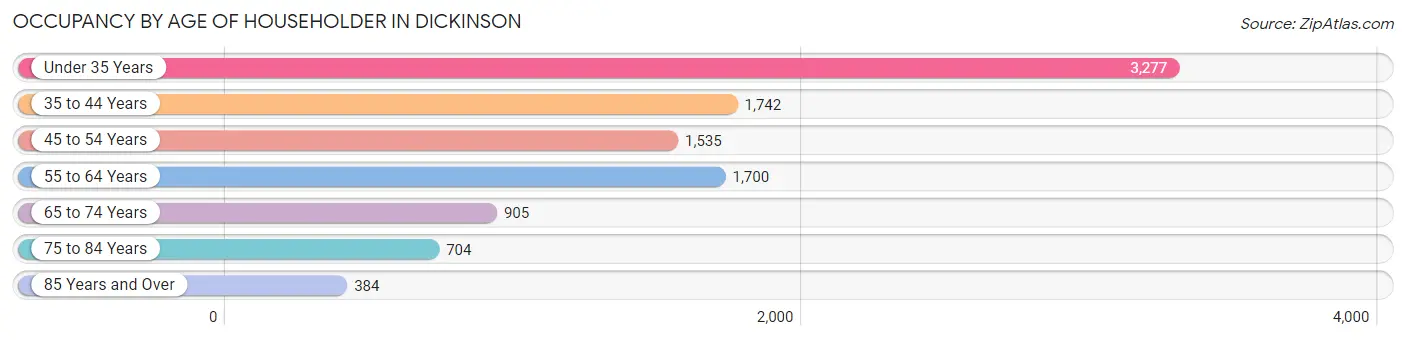
| Age Bracket | # Households | % Households |
| Under 35 Years | 3,277 | 32.0% |
| 35 to 44 Years | 1,742 | 17.0% |
| 45 to 54 Years | 1,535 | 15.0% |
| 55 to 64 Years | 1,700 | 16.6% |
| 65 to 74 Years | 905 | 8.8% |
| 75 to 84 Years | 704 | 6.9% |
| 85 Years and Over | 384 | 3.7% |
| Total | 10,247 | 100.0% |
Housing Finances in Dickinson
Median Income by Occupancy in Dickinson
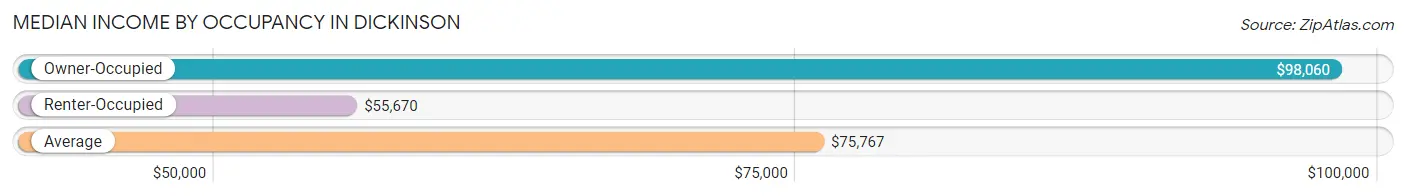
| Occupancy Type | # Households | Median Income |
| Owner-Occupied | 5,946 (58.0%) | $98,060 |
| Renter-Occupied | 4,301 (42.0%) | $55,670 |
| Average | 10,247 (100.0%) | $75,767 |
Occupancy by Householder Income Bracket in Dickinson
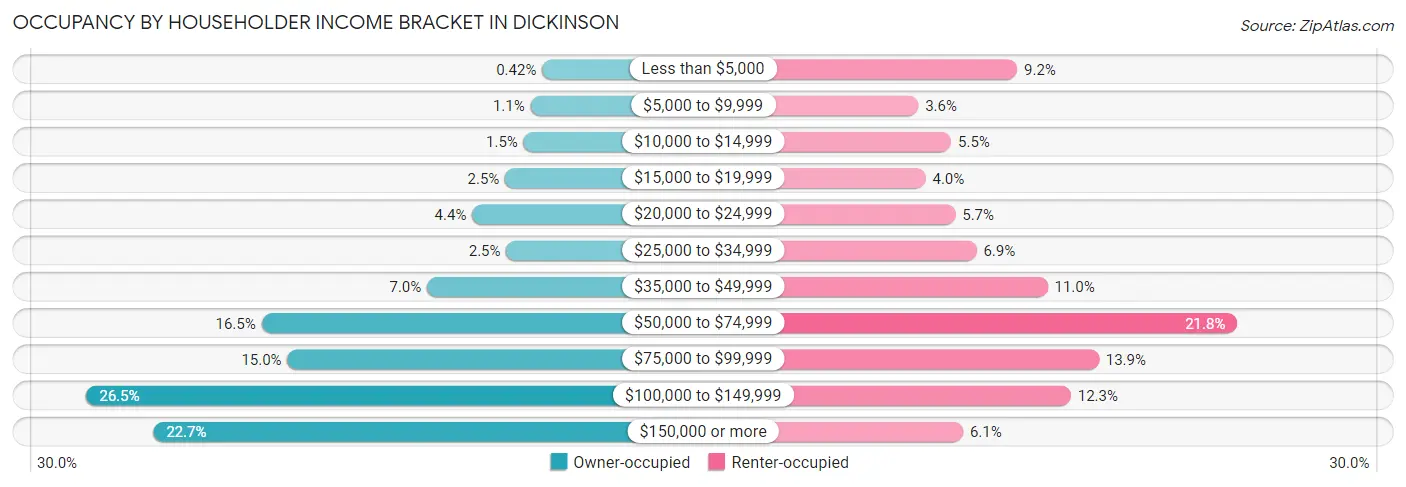
| Income Bracket | Owner-occupied | Renter-occupied |
| Less than $5,000 | 25 (0.4%) | 397 (9.2%) |
| $5,000 to $9,999 | 65 (1.1%) | 154 (3.6%) |
| $10,000 to $14,999 | 88 (1.5%) | 235 (5.5%) |
| $15,000 to $19,999 | 151 (2.5%) | 172 (4.0%) |
| $20,000 to $24,999 | 263 (4.4%) | 245 (5.7%) |
| $25,000 to $34,999 | 147 (2.5%) | 297 (6.9%) |
| $35,000 to $49,999 | 416 (7.0%) | 472 (11.0%) |
| $50,000 to $74,999 | 979 (16.5%) | 938 (21.8%) |
| $75,000 to $99,999 | 891 (15.0%) | 598 (13.9%) |
| $100,000 to $149,999 | 1,574 (26.5%) | 529 (12.3%) |
| $150,000 or more | 1,347 (22.7%) | 264 (6.1%) |
| Total | 5,946 (100.0%) | 4,301 (100.0%) |
Monthly Housing Cost Tiers in Dickinson
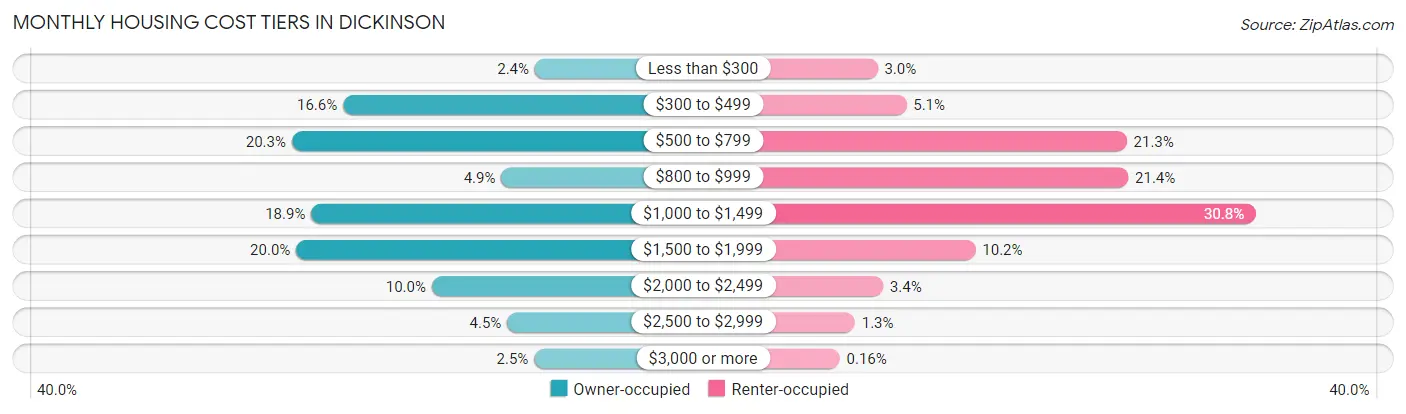
| Monthly Cost | Owner-occupied | Renter-occupied |
| Less than $300 | 144 (2.4%) | 127 (2.9%) |
| $300 to $499 | 984 (16.6%) | 218 (5.1%) |
| $500 to $799 | 1,208 (20.3%) | 916 (21.3%) |
| $800 to $999 | 291 (4.9%) | 921 (21.4%) |
| $1,000 to $1,499 | 1,123 (18.9%) | 1,326 (30.8%) |
| $1,500 to $1,999 | 1,189 (20.0%) | 437 (10.2%) |
| $2,000 to $2,499 | 595 (10.0%) | 144 (3.4%) |
| $2,500 to $2,999 | 265 (4.5%) | 55 (1.3%) |
| $3,000 or more | 147 (2.5%) | 7 (0.2%) |
| Total | 5,946 (100.0%) | 4,301 (100.0%) |
Physical Housing Characteristics in Dickinson
Housing Structures in Dickinson
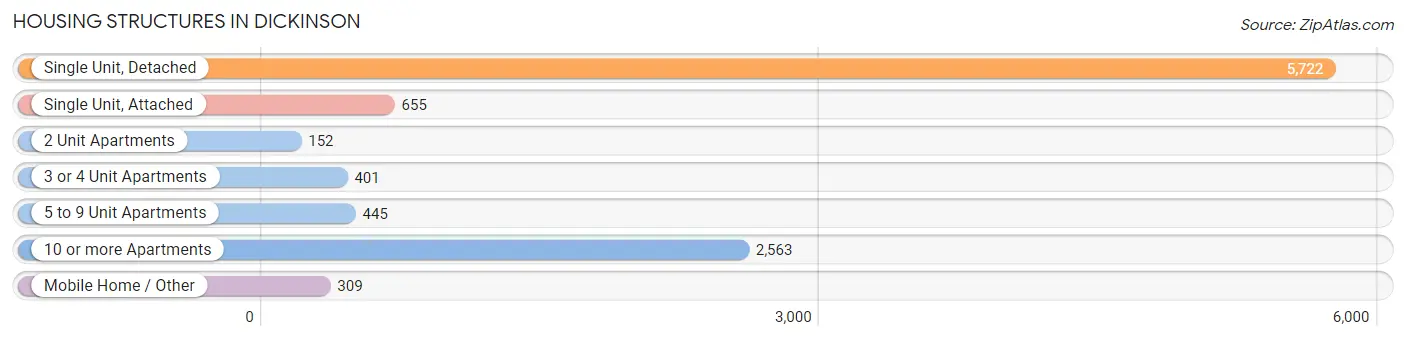
| Structure Type | # Housing Units | % Housing Units |
| Single Unit, Detached | 5,722 | 55.8% |
| Single Unit, Attached | 655 | 6.4% |
| 2 Unit Apartments | 152 | 1.5% |
| 3 or 4 Unit Apartments | 401 | 3.9% |
| 5 to 9 Unit Apartments | 445 | 4.3% |
| 10 or more Apartments | 2,563 | 25.0% |
| Mobile Home / Other | 309 | 3.0% |
| Total | 10,247 | 100.0% |
Housing Structures by Occupancy in Dickinson
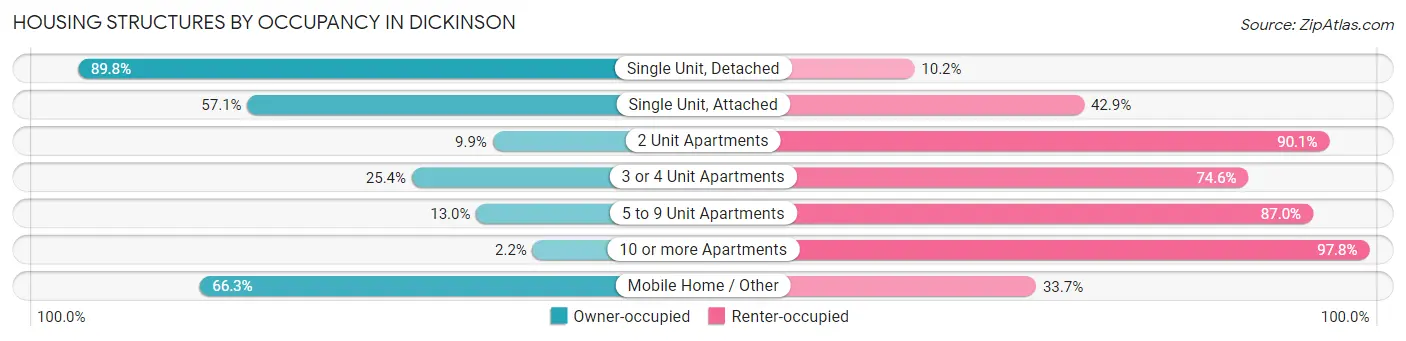
| Structure Type | Owner-occupied | Renter-occupied |
| Single Unit, Detached | 5,136 (89.8%) | 586 (10.2%) |
| Single Unit, Attached | 374 (57.1%) | 281 (42.9%) |
| 2 Unit Apartments | 15 (9.9%) | 137 (90.1%) |
| 3 or 4 Unit Apartments | 102 (25.4%) | 299 (74.6%) |
| 5 to 9 Unit Apartments | 58 (13.0%) | 387 (87.0%) |
| 10 or more Apartments | 56 (2.2%) | 2,507 (97.8%) |
| Mobile Home / Other | 205 (66.3%) | 104 (33.7%) |
| Total | 5,946 (58.0%) | 4,301 (42.0%) |
Housing Structures by Number of Rooms in Dickinson
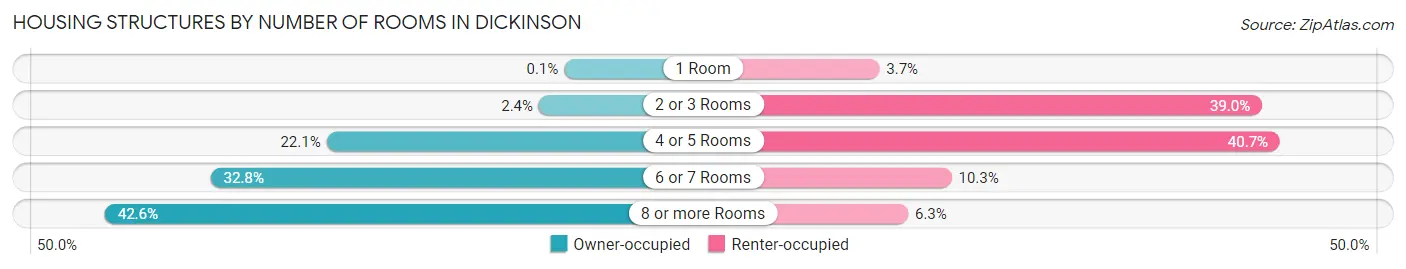
| Number of Rooms | Owner-occupied | Renter-occupied |
| 1 Room | 6 (0.1%) | 157 (3.6%) |
| 2 or 3 Rooms | 145 (2.4%) | 1,679 (39.0%) |
| 4 or 5 Rooms | 1,313 (22.1%) | 1,750 (40.7%) |
| 6 or 7 Rooms | 1,950 (32.8%) | 444 (10.3%) |
| 8 or more Rooms | 2,532 (42.6%) | 271 (6.3%) |
| Total | 5,946 (100.0%) | 4,301 (100.0%) |
Housing Structure by Heating Type in Dickinson
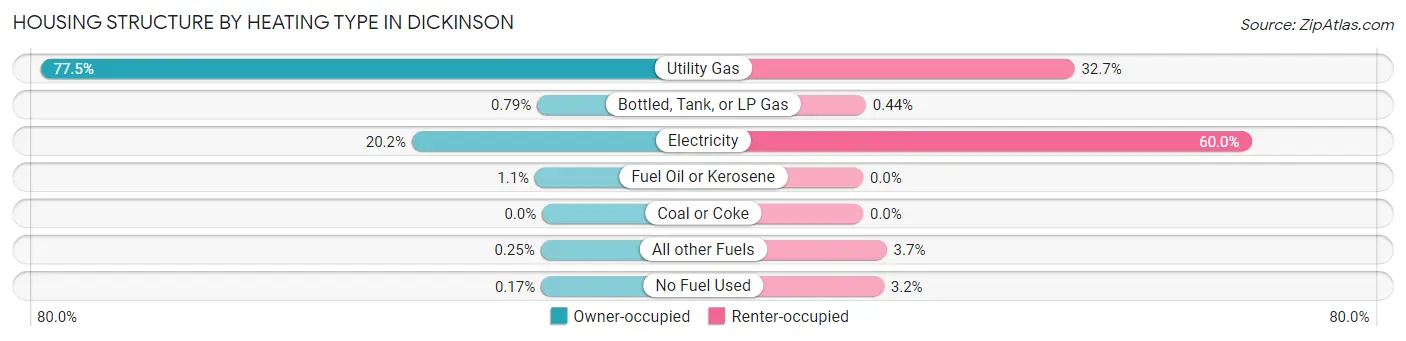
| Heating Type | Owner-occupied | Renter-occupied |
| Utility Gas | 4,610 (77.5%) | 1,406 (32.7%) |
| Bottled, Tank, or LP Gas | 47 (0.8%) | 19 (0.4%) |
| Electricity | 1,198 (20.2%) | 2,581 (60.0%) |
| Fuel Oil or Kerosene | 66 (1.1%) | 0 (0.0%) |
| Coal or Coke | 0 (0.0%) | 0 (0.0%) |
| All other Fuels | 15 (0.3%) | 157 (3.6%) |
| No Fuel Used | 10 (0.2%) | 138 (3.2%) |
| Total | 5,946 (100.0%) | 4,301 (100.0%) |
Household Vehicle Usage in Dickinson
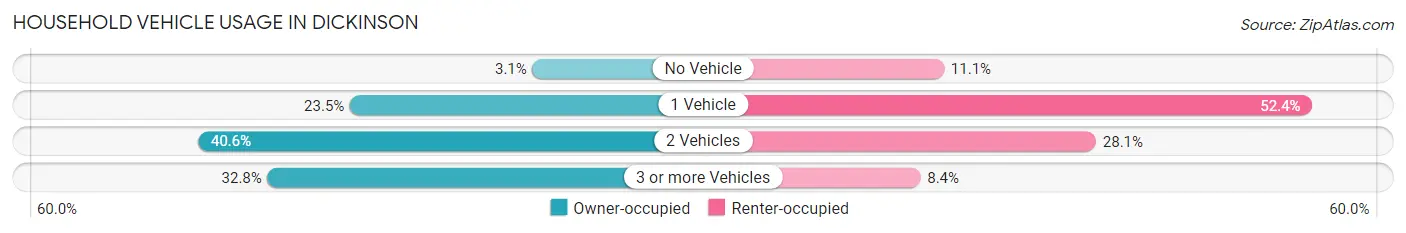
| Vehicles per Household | Owner-occupied | Renter-occupied |
| No Vehicle | 184 (3.1%) | 477 (11.1%) |
| 1 Vehicle | 1,399 (23.5%) | 2,252 (52.4%) |
| 2 Vehicles | 2,414 (40.6%) | 1,209 (28.1%) |
| 3 or more Vehicles | 1,949 (32.8%) | 363 (8.4%) |
| Total | 5,946 (100.0%) | 4,301 (100.0%) |
Real Estate & Mortgages in Dickinson
Real Estate and Mortgage Overview in Dickinson
| Characteristic | Without Mortgage | With Mortgage |
| Housing Units | 2,458 | 3,488 |
| Median Property Value | $235,600 | $266,600 |
| Median Household Income | $79,767 | $842 |
| Monthly Housing Costs | $528 | $147 |
| Real Estate Taxes | $2,148 | $69 |
Property Value by Mortgage Status in Dickinson
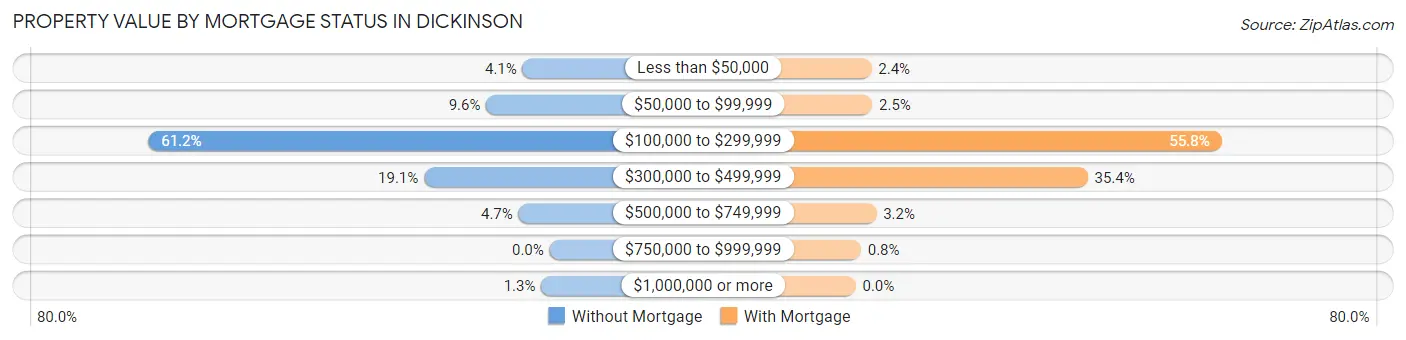
| Property Value | Without Mortgage | With Mortgage |
| Less than $50,000 | 101 (4.1%) | 84 (2.4%) |
| $50,000 to $99,999 | 237 (9.6%) | 88 (2.5%) |
| $100,000 to $299,999 | 1,503 (61.2%) | 1,945 (55.8%) |
| $300,000 to $499,999 | 470 (19.1%) | 1,233 (35.3%) |
| $500,000 to $749,999 | 116 (4.7%) | 110 (3.2%) |
| $750,000 to $999,999 | 0 (0.0%) | 28 (0.8%) |
| $1,000,000 or more | 31 (1.3%) | 0 (0.0%) |
| Total | 2,458 (100.0%) | 3,488 (100.0%) |
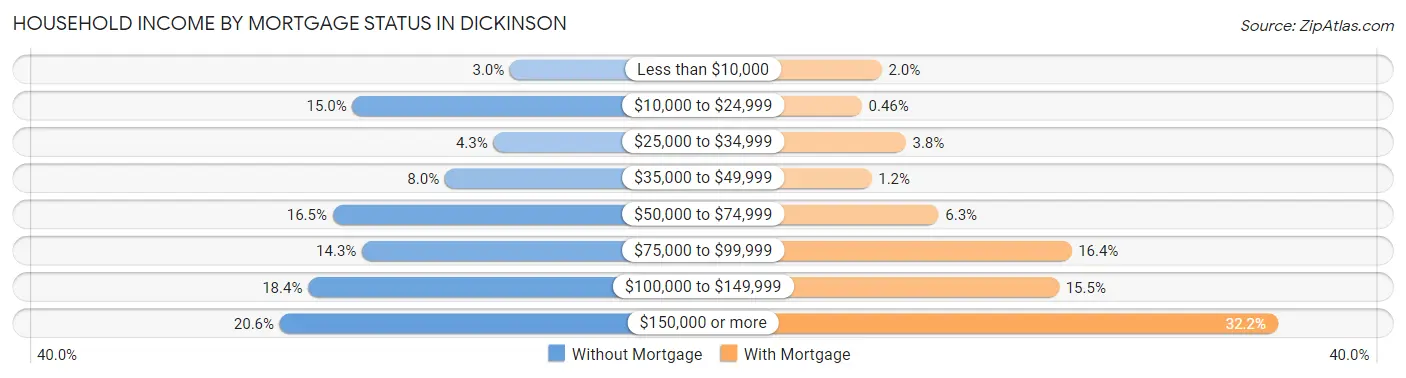
Household Income by Mortgage Status in Dickinson
| Household Income | Without Mortgage | With Mortgage |
| Less than $10,000 | 74 (3.0%) | 69 (2.0%) |
| $10,000 to $24,999 | 369 (15.0%) | 16 (0.5%) |
| $25,000 to $34,999 | 105 (4.3%) | 133 (3.8%) |
| $35,000 to $49,999 | 196 (8.0%) | 42 (1.2%) |
| $50,000 to $74,999 | 406 (16.5%) | 220 (6.3%) |
| $75,000 to $99,999 | 351 (14.3%) | 573 (16.4%) |
| $100,000 to $149,999 | 452 (18.4%) | 540 (15.5%) |
| $150,000 or more | 505 (20.5%) | 1,122 (32.2%) |
| Total | 2,458 (100.0%) | 3,488 (100.0%) |
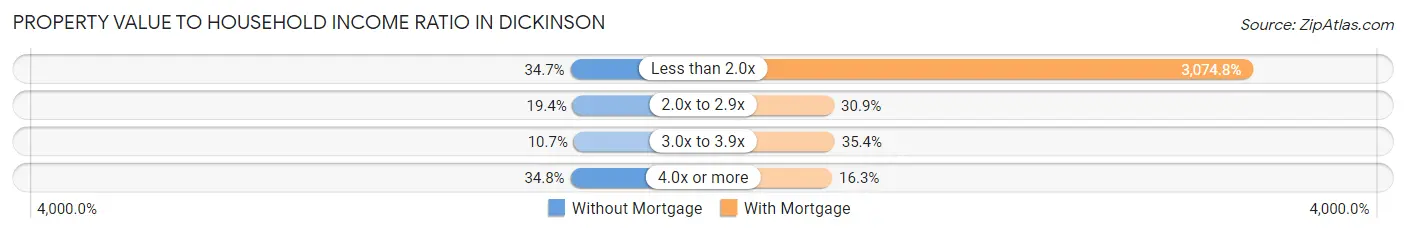
Property Value to Household Income Ratio in Dickinson
| Value-to-Income Ratio | Without Mortgage | With Mortgage |
| Less than 2.0x | 853 (34.7%) | 107,250 (3,074.8%) |
| 2.0x to 2.9x | 477 (19.4%) | 1,076 (30.8%) |
| 3.0x to 3.9x | 264 (10.7%) | 1,235 (35.4%) |
| 4.0x or more | 856 (34.8%) | 568 (16.3%) |
| Total | 2,458 (100.0%) | 3,488 (100.0%) |
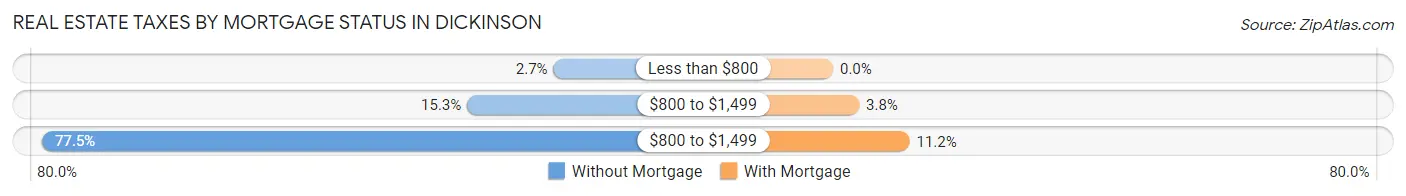
Real Estate Taxes by Mortgage Status in Dickinson
| Property Taxes | Without Mortgage | With Mortgage |
| Less than $800 | 67 (2.7%) | 0 (0.0%) |
| $800 to $1,499 | 377 (15.3%) | 133 (3.8%) |
| $800 to $1,499 | 1,904 (77.5%) | 390 (11.2%) |
| Total | 2,458 (100.0%) | 3,488 (100.0%) |
Health & Disability in Dickinson
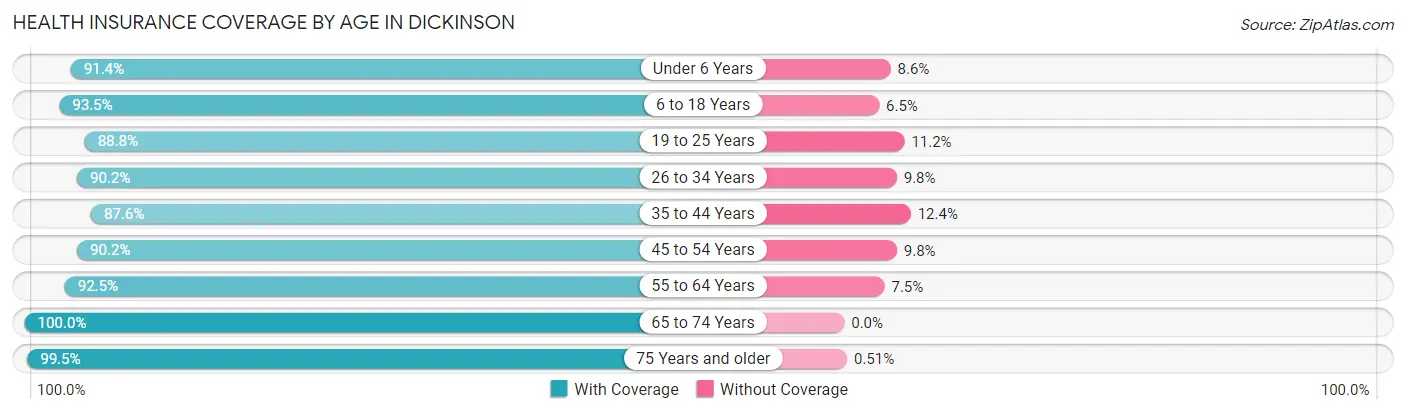
Health Insurance Coverage by Age in Dickinson
| Age Bracket | With Coverage | Without Coverage |
| Under 6 Years | 2,466 (91.4%) | 233 (8.6%) |
| 6 to 18 Years | 4,091 (93.5%) | 284 (6.5%) |
| 19 to 25 Years | 2,248 (88.8%) | 284 (11.2%) |
| 26 to 34 Years | 3,457 (90.2%) | 375 (9.8%) |
| 35 to 44 Years | 2,829 (87.6%) | 400 (12.4%) |
| 45 to 54 Years | 2,347 (90.2%) | 255 (9.8%) |
| 55 to 64 Years | 2,548 (92.5%) | 207 (7.5%) |
| 65 to 74 Years | 1,404 (100.0%) | 0 (0.0%) |
| 75 Years and older | 1,370 (99.5%) | 7 (0.5%) |
| Total | 22,760 (91.8%) | 2,045 (8.2%) |
Health Insurance Coverage by Citizenship Status in Dickinson
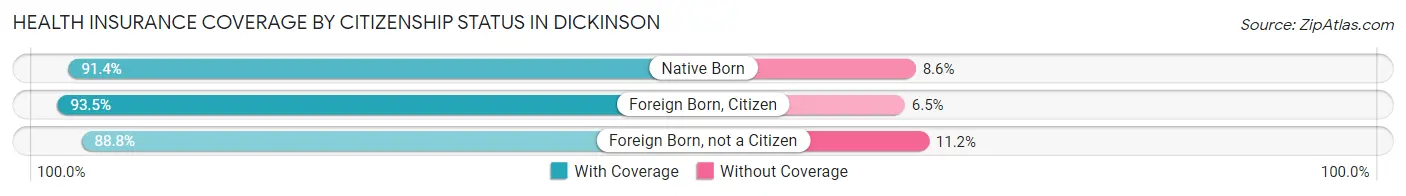
| Citizenship Status | With Coverage | Without Coverage |
| Native Born | 2,466 (91.4%) | 233 (8.6%) |
| Foreign Born, Citizen | 4,091 (93.5%) | 284 (6.5%) |
| Foreign Born, not a Citizen | 2,248 (88.8%) | 284 (11.2%) |
Health Insurance Coverage by Household Income in Dickinson
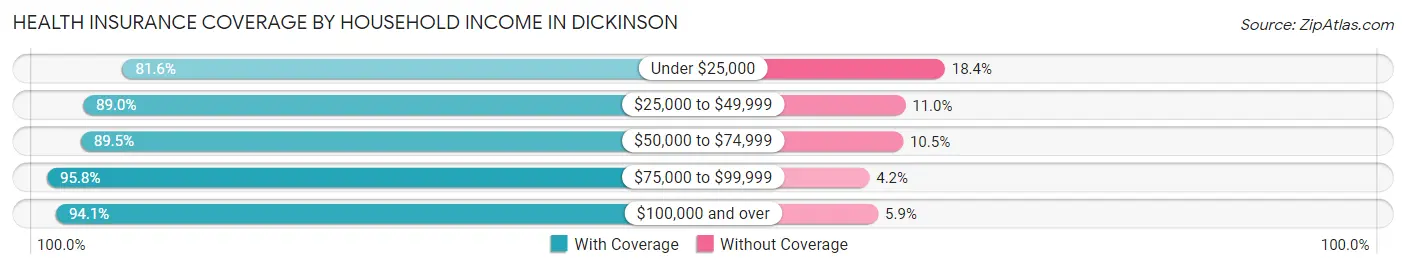
| Household Income | With Coverage | Without Coverage |
| Under $25,000 | 2,219 (81.6%) | 499 (18.4%) |
| $25,000 to $49,999 | 2,039 (89.0%) | 251 (11.0%) |
| $50,000 to $74,999 | 3,952 (89.5%) | 465 (10.5%) |
| $75,000 to $99,999 | 3,713 (95.8%) | 163 (4.2%) |
| $100,000 and over | 10,418 (94.1%) | 651 (5.9%) |
Public vs Private Health Insurance Coverage by Age in Dickinson
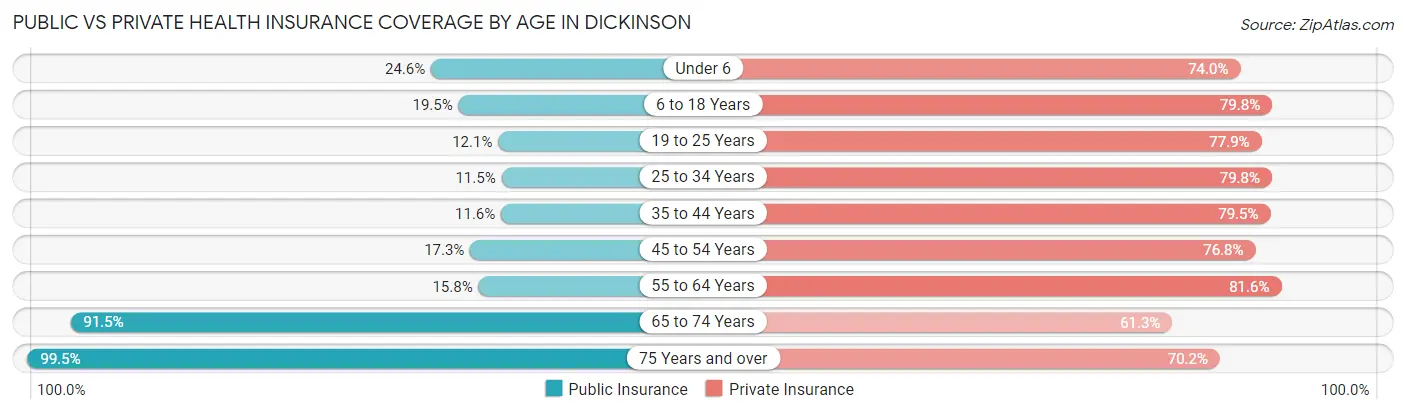
| Age Bracket | Public Insurance | Private Insurance |
| Under 6 | 663 (24.6%) | 1,996 (74.0%) |
| 6 to 18 Years | 851 (19.5%) | 3,493 (79.8%) |
| 19 to 25 Years | 306 (12.1%) | 1,972 (77.9%) |
| 25 to 34 Years | 440 (11.5%) | 3,058 (79.8%) |
| 35 to 44 Years | 373 (11.6%) | 2,568 (79.5%) |
| 45 to 54 Years | 450 (17.3%) | 1,997 (76.7%) |
| 55 to 64 Years | 434 (15.8%) | 2,247 (81.6%) |
| 65 to 74 Years | 1,285 (91.5%) | 861 (61.3%) |
| 75 Years and over | 1,370 (99.5%) | 966 (70.2%) |
| Total | 6,172 (24.9%) | 19,158 (77.2%) |
Disability Status by Sex by Age in Dickinson
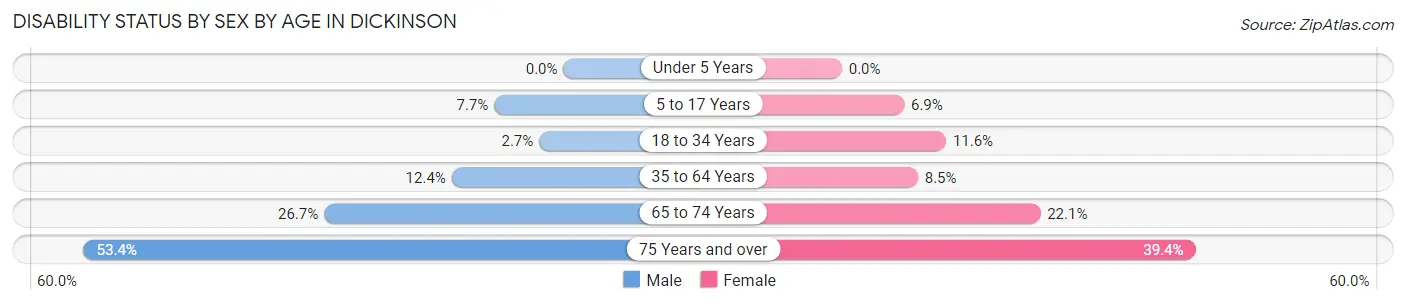
| Age Bracket | Male | Female |
| Under 5 Years | 0 (0.0%) | 0 (0.0%) |
| 5 to 17 Years | 195 (7.7%) | 141 (6.9%) |
| 18 to 34 Years | 98 (2.7%) | 364 (11.6%) |
| 35 to 64 Years | 574 (12.4%) | 336 (8.5%) |
| 65 to 74 Years | 186 (26.7%) | 156 (22.1%) |
| 75 Years and over | 273 (53.4%) | 341 (39.4%) |
Disability Class by Sex by Age in Dickinson
Disability Class: Hearing Difficulty
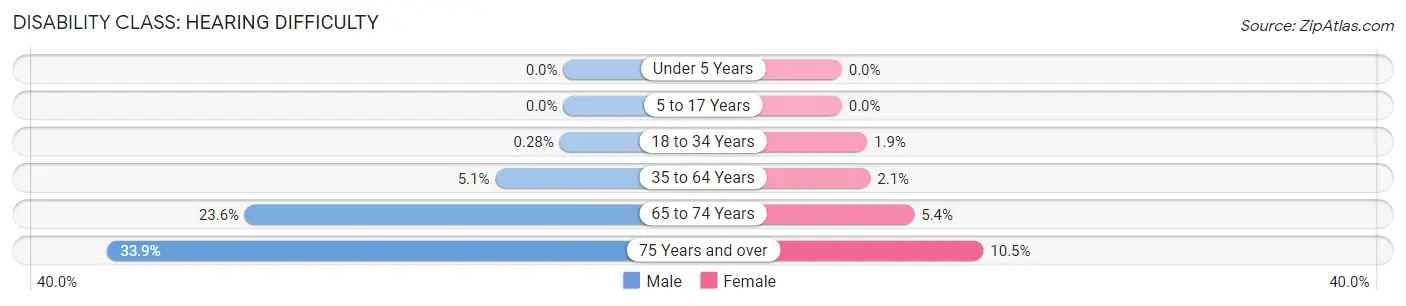
| Age Bracket | Male | Female |
| Under 5 Years | 0 (0.0%) | 0 (0.0%) |
| 5 to 17 Years | 0 (0.0%) | 0 (0.0%) |
| 18 to 34 Years | 10 (0.3%) | 59 (1.9%) |
| 35 to 64 Years | 233 (5.1%) | 84 (2.1%) |
| 65 to 74 Years | 165 (23.6%) | 38 (5.4%) |
| 75 Years and over | 173 (33.9%) | 91 (10.5%) |
Disability Class: Vision Difficulty
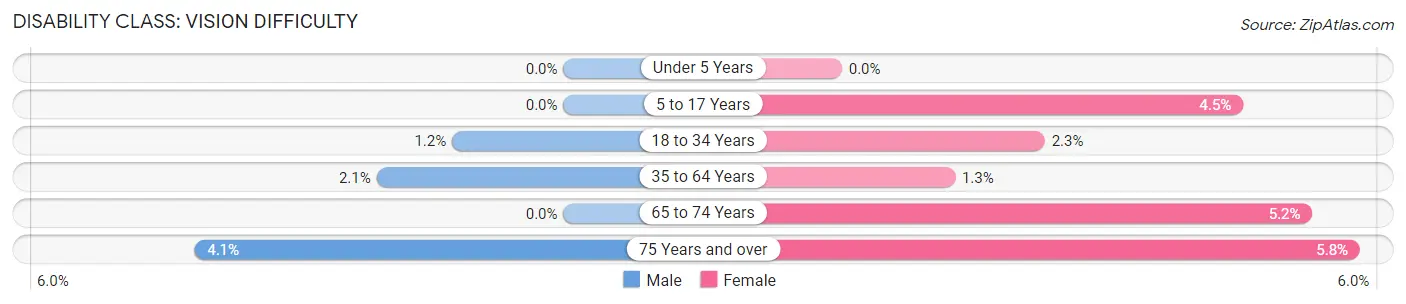
| Age Bracket | Male | Female |
| Under 5 Years | 0 (0.0%) | 0 (0.0%) |
| 5 to 17 Years | 0 (0.0%) | 91 (4.5%) |
| 18 to 34 Years | 45 (1.2%) | 71 (2.3%) |
| 35 to 64 Years | 96 (2.1%) | 50 (1.3%) |
| 65 to 74 Years | 0 (0.0%) | 37 (5.2%) |
| 75 Years and over | 21 (4.1%) | 50 (5.8%) |
Disability Class: Cognitive Difficulty
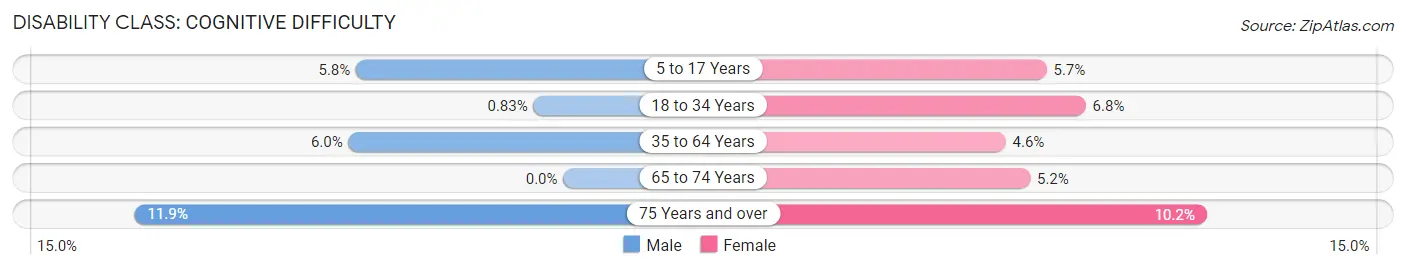
| Age Bracket | Male | Female |
| 5 to 17 Years | 146 (5.8%) | 116 (5.7%) |
| 18 to 34 Years | 30 (0.8%) | 213 (6.8%) |
| 35 to 64 Years | 276 (6.0%) | 181 (4.6%) |
| 65 to 74 Years | 0 (0.0%) | 37 (5.2%) |
| 75 Years and over | 61 (11.9%) | 88 (10.2%) |
Disability Class: Ambulatory Difficulty
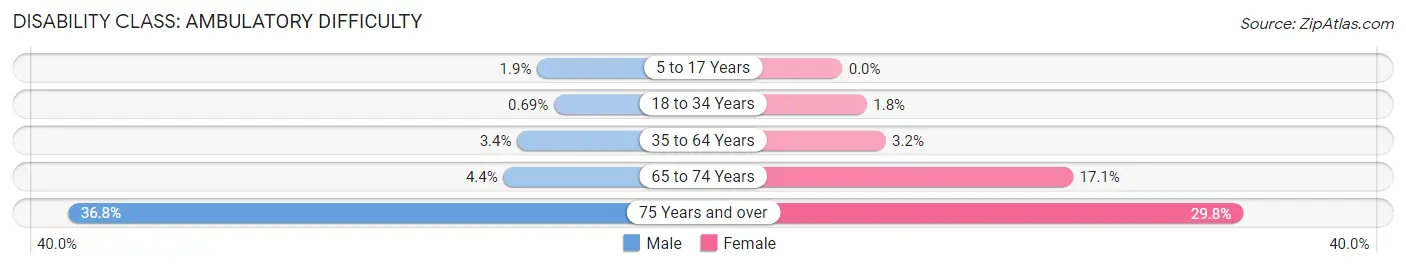
| Age Bracket | Male | Female |
| 5 to 17 Years | 49 (1.9%) | 0 (0.0%) |
| 18 to 34 Years | 25 (0.7%) | 57 (1.8%) |
| 35 to 64 Years | 158 (3.4%) | 128 (3.2%) |
| 65 to 74 Years | 31 (4.4%) | 121 (17.1%) |
| 75 Years and over | 188 (36.8%) | 258 (29.8%) |
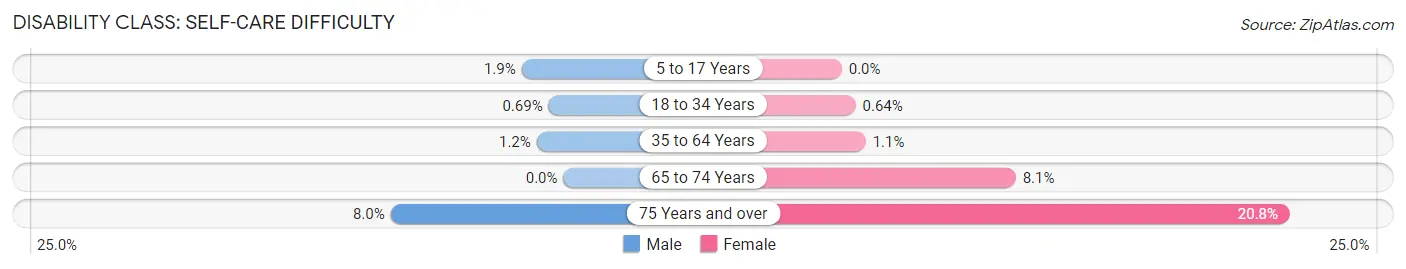
Disability Class: Self-Care Difficulty
| Age Bracket | Male | Female |
| 5 to 17 Years | 49 (1.9%) | 0 (0.0%) |
| 18 to 34 Years | 25 (0.7%) | 20 (0.6%) |
| 35 to 64 Years | 57 (1.2%) | 44 (1.1%) |
| 65 to 74 Years | 0 (0.0%) | 57 (8.1%) |
| 75 Years and over | 41 (8.0%) | 180 (20.8%) |
Technology Access in Dickinson
Computing Device Access in Dickinson
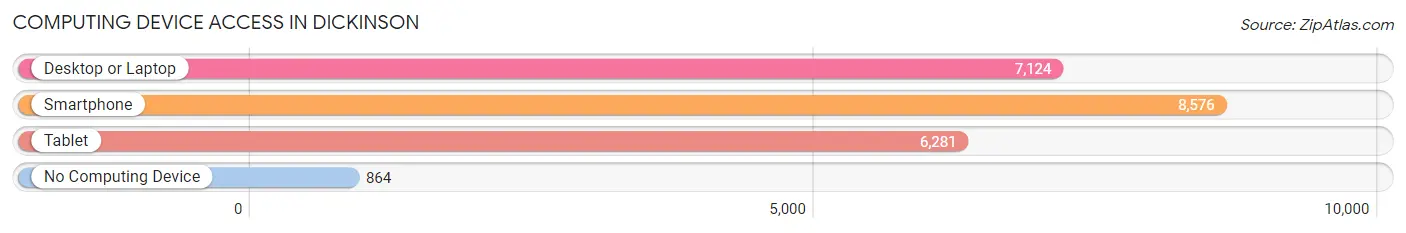
| Device Type | # Households | % Households |
| Desktop or Laptop | 7,124 | 69.5% |
| Smartphone | 8,576 | 83.7% |
| Tablet | 6,281 | 61.3% |
| No Computing Device | 864 | 8.4% |
| Total | 10,247 | 100.0% |
Internet Access in Dickinson
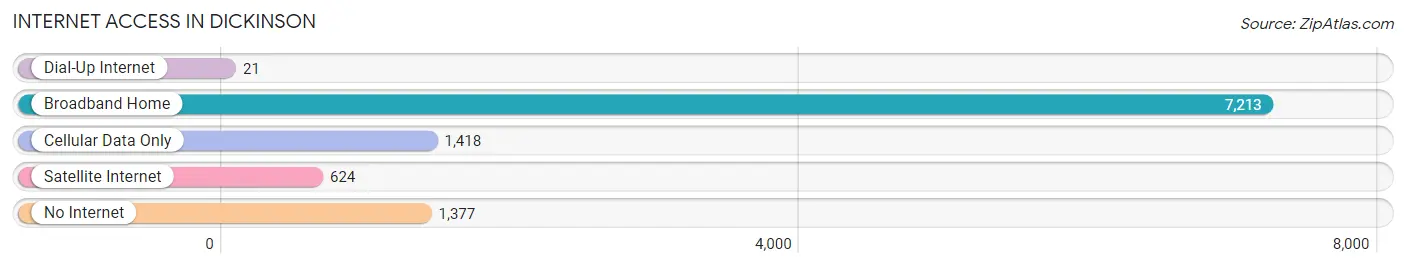
| Internet Type | # Households | % Households |
| Dial-Up Internet | 21 | 0.2% |
| Broadband Home | 7,213 | 70.4% |
| Cellular Data Only | 1,418 | 13.8% |
| Satellite Internet | 624 | 6.1% |
| No Internet | 1,377 | 13.4% |
| Total | 10,247 | 100.0% |
Dickinson Summary
Dickinson, North Dakota is a city located in Stark County in the southwestern part of the state. It is the county seat and the largest city in the county. The city is located along Interstate 94 and is the gateway to Theodore Roosevelt National Park. The city has a population of 23,765 as of the 2020 census.
History
The area that is now Dickinson was first settled in 1881 by a group of homesteaders from Wisconsin. The city was named after the first postmaster, George Dickinson. The city was incorporated in 1883 and was the first city in Stark County.
In the early 1900s, Dickinson was a major center for the cattle industry. The city was also a major hub for the Northern Pacific Railroad. The city was also home to a large number of German immigrants who worked in the area’s coal mines.
In the 1950s, Dickinson began to experience a population boom due to the discovery of oil in the area. This led to an economic boom in the city and the population grew to over 10,000 by the 1970s.
Geography
Dickinson is located in the southwestern part of North Dakota, in Stark County. The city is located along Interstate 94 and is the gateway to Theodore Roosevelt National Park. The city is located at an elevation of 2,072 feet and has an area of 11.3 square miles.
The city is located in the Badlands region of North Dakota and is surrounded by rolling hills and prairies. The city is located in the Missouri Plateau region and is part of the Great Plains.
Economy
Dickinson is the economic hub of Stark County and the surrounding region. The city is home to a number of businesses, including oil and gas companies, manufacturing companies, and retail stores.
The city is also home to Dickinson State University, which is a public university with an enrollment of over 3,000 students. The university is a major employer in the city and provides a number of educational and cultural opportunities for the community.
The city is also home to a number of healthcare facilities, including a hospital, a nursing home, and a number of clinics.
Demographics
As of the 2020 census, Dickinson had a population of 23,765. The city has a median age of 33.7 years and a median household income of $54,945. The city is predominantly white (90.2%) and has a small Hispanic population (4.2%).
The city is home to a number of religious denominations, including Catholic (37.2%), Lutheran (17.2%), and Methodist (7.2%).
Conclusion
Dickinson, North Dakota is a city located in Stark County in the southwestern part of the state. It is the county seat and the largest city in the county. The city is located along Interstate 94 and is the gateway to Theodore Roosevelt National Park. The city has a population of 23,765 as of the 2020 census and is the economic hub of the region. The city is predominantly white and has a median age of 33.7 years and a median household income of $54,945. The city is home to a number of businesses, educational institutions, and healthcare facilities.
Common Questions
What is the Total Population of Dickinson?
Total Population of Dickinson is 25,116.
What is the Total Male Population of Dickinson?
Total Male Population of Dickinson is 13,093.
What is the Total Female Population of Dickinson?
Total Female Population of Dickinson is 12,023.
What is the Ratio of Males per 100 Females in Dickinson?
There are 108.90 Males per 100 Females in Dickinson.
What is the Ratio of Females per 100 Males in Dickinson?
There are 91.83 Females per 100 Males in Dickinson.
What is the Median Population Age in Dickinson?
Median Population Age in Dickinson is 33.1 Years.
What is the Average Family Size in Dickinson
Average Family Size in Dickinson is 3.1 People.
What is the Average Household Size in Dickinson
Average Household Size in Dickinson is 2.4 People.
What is Per Capita Income in Dickinson?
Per Capita income in Dickinson is $39,128.
What is the Median Family Income in Dickinson?
Median Family Income in Dickinson is $103,794.
What is the Median Household income in Dickinson?
Median Household Income in Dickinson is $75,767.
What is Income or Wage Gap in Dickinson?
Income or Wage Gap in Dickinson is 43.1%.
Women in Dickinson earn 56.9 cents for every dollar earned by a man.
What is Inequality or Gini Index in Dickinson?
Inequality or Gini Index in Dickinson is 0.43.
How Large is the Labor Force in Dickinson?
There are 13,297 People in the Labor Forcein in Dickinson.
What is the Percentage of People in the Labor Force in Dickinson?
69.5% of People are in the Labor Force in Dickinson.
What is the Unemployment Rate in Dickinson?
Unemployment Rate in Dickinson is 3.0%.