Cities with the Highest Percentage of Population Employed in Architecture & Engineering in North Dakota
RELATED REPORTS & OPTIONS
Architecture & Engineering
North Dakota
Compare Cities
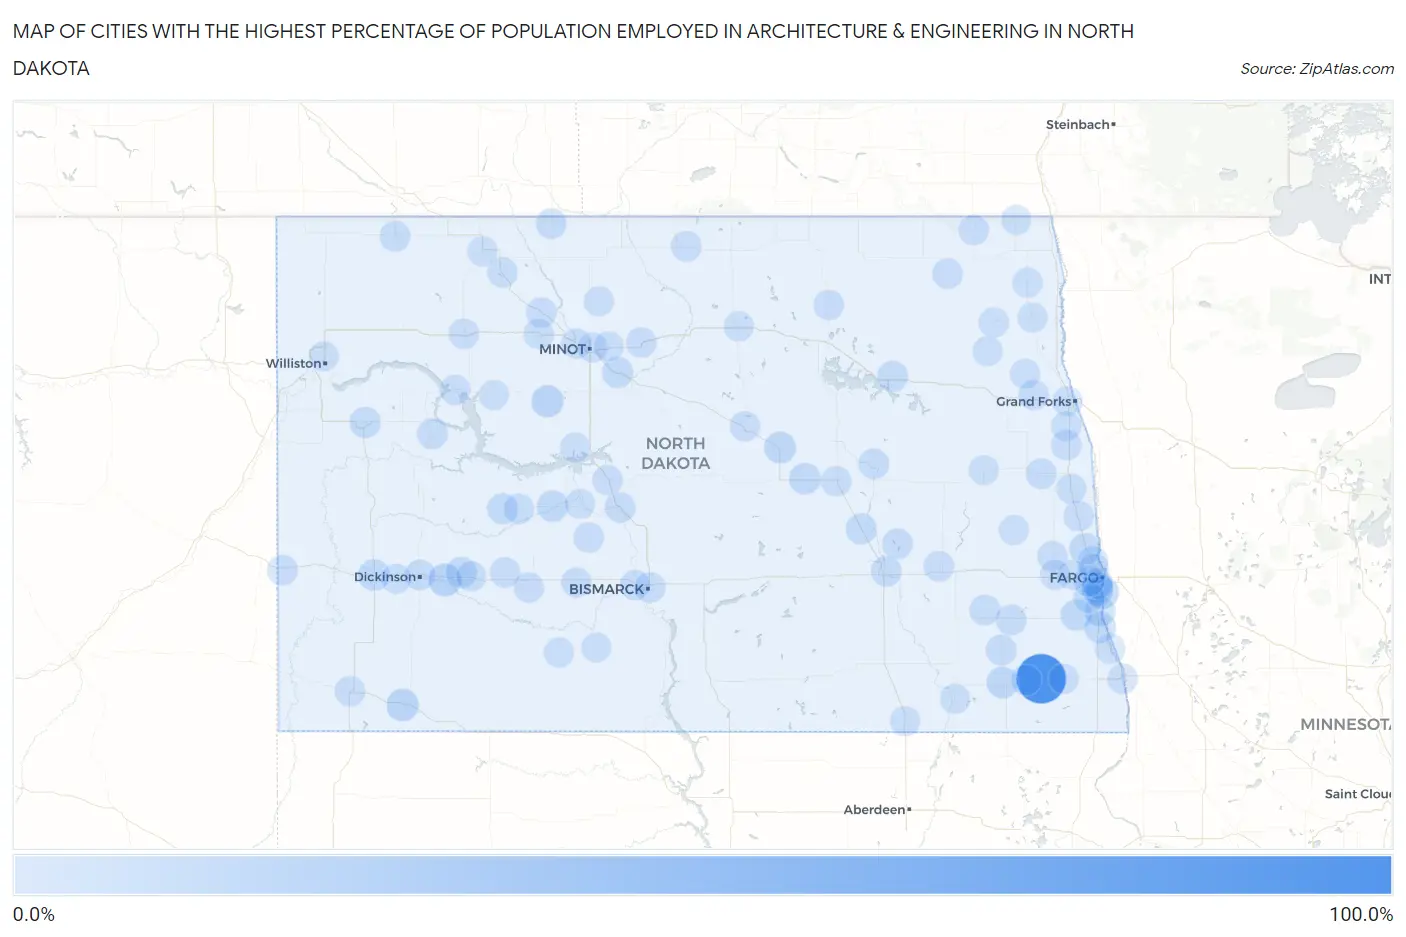
Map of Cities with the Highest Percentage of Population Employed in Architecture & Engineering in North Dakota
0.0%
100.0%
Cities with the Highest Percentage of Population Employed in Architecture & Engineering in North Dakota
| City | % Employed | vs State | vs National | |
| 1. | De Lamere | 100.0% | 2.0%(+98.0)#1 | 2.1%(+97.9)#9 |
| 2. | Gladstone | 13.7% | 2.0%(+11.7)#2 | 2.1%(+11.5)#279 |
| 3. | Briarwood | 12.9% | 2.0%(+10.9)#3 | 2.1%(+10.8)#310 |
| 4. | Reeder | 11.5% | 2.0%(+9.56)#4 | 2.1%(+9.39)#388 |
| 5. | Ryder | 9.8% | 2.0%(+7.78)#5 | 2.1%(+7.61)#519 |
| 6. | Frontier | 8.8% | 2.0%(+6.84)#6 | 2.1%(+6.67)#606 |
| 7. | Fessenden | 8.8% | 2.0%(+6.81)#7 | 2.1%(+6.64)#609 |
| 8. | Gwinner | 8.1% | 2.0%(+6.16)#8 | 2.1%(+5.99)#695 |
| 9. | Sykeston | 8.0% | 2.0%(+6.02)#9 | 2.1%(+5.85)#726 |
| 10. | Belfield | 7.6% | 2.0%(+5.59)#10 | 2.1%(+5.42)#797 |
| 11. | Kindred | 7.5% | 2.0%(+5.51)#11 | 2.1%(+5.34)#812 |
| 12. | Argusville | 7.4% | 2.0%(+5.38)#12 | 2.1%(+5.21)#835 |
| 13. | Hazen | 7.2% | 2.0%(+5.27)#13 | 2.1%(+5.10)#859 |
| 14. | Prairie Rose | 7.1% | 2.0%(+5.16)#14 | 2.1%(+4.99)#900 |
| 15. | Christine | 6.8% | 2.0%(+4.82)#15 | 2.1%(+4.65)#983 |
| 16. | Watford City | 6.2% | 2.0%(+4.19)#16 | 2.1%(+4.02)#1,174 |
| 17. | Taylor | 5.5% | 2.0%(+3.51)#17 | 2.1%(+3.35)#1,512 |
| 18. | Sawyer | 5.3% | 2.0%(+3.35)#18 | 2.1%(+3.18)#1,605 |
| 19. | Oxbow | 5.0% | 2.0%(+3.02)#19 | 2.1%(+2.85)#1,835 |
| 20. | Golden Valley | 5.0% | 2.0%(+3.02)#20 | 2.1%(+2.85)#1,838 |
| 21. | Pingree | 5.0% | 2.0%(+3.02)#21 | 2.1%(+2.85)#1,842 |
| 22. | Horace | 4.3% | 2.0%(+2.37)#22 | 2.1%(+2.20)#2,372 |
| 23. | Mandaree | 4.1% | 2.0%(+2.14)#23 | 2.1%(+1.97)#2,627 |
| 24. | West Fargo | 4.0% | 2.0%(+2.07)#24 | 2.1%(+1.90)#2,718 |
| 25. | Spiritwood Lake | 3.8% | 2.0%(+1.83)#25 | 2.1%(+1.66)#3,010 |
| 26. | Enderlin | 3.7% | 2.0%(+1.76)#26 | 2.1%(+1.59)#3,113 |
| 27. | Nome | 3.7% | 2.0%(+1.72)#27 | 2.1%(+1.55)#3,166 |
| 28. | Crary | 3.6% | 2.0%(+1.66)#28 | 2.1%(+1.49)#3,284 |
| 29. | Washburn | 3.4% | 2.0%(+1.38)#29 | 2.1%(+1.21)#3,807 |
| 30. | Grace City | 3.3% | 2.0%(+1.35)#30 | 2.1%(+1.18)#3,856 |
| 31. | Lisbon | 3.3% | 2.0%(+1.30)#31 | 2.1%(+1.14)#3,927 |
| 32. | Noonan | 3.2% | 2.0%(+1.25)#32 | 2.1%(+1.08)#4,054 |
| 33. | Dickinson | 3.2% | 2.0%(+1.24)#33 | 2.1%(+1.07)#4,062 |
| 34. | Jamestown | 3.2% | 2.0%(+1.20)#34 | 2.1%(+1.03)#4,142 |
| 35. | Mayville | 3.2% | 2.0%(+1.20)#35 | 2.1%(+1.03)#4,155 |
| 36. | Sherwood | 3.1% | 2.0%(+1.15)#36 | 2.1%(+0.976)#4,282 |
| 37. | Bottineau | 2.9% | 2.0%(+0.950)#37 | 2.1%(+0.780)#4,763 |
| 38. | Kenmare | 2.8% | 2.0%(+0.856)#38 | 2.1%(+0.686)#5,019 |
| 39. | Milnor | 2.8% | 2.0%(+0.837)#39 | 2.1%(+0.668)#5,065 |
| 40. | Fargo | 2.8% | 2.0%(+0.826)#40 | 2.1%(+0.656)#5,104 |
| 41. | Bismarck | 2.7% | 2.0%(+0.755)#41 | 2.1%(+0.585)#5,308 |
| 42. | Burlington | 2.7% | 2.0%(+0.744)#42 | 2.1%(+0.574)#5,350 |
| 43. | Glen Ullin | 2.7% | 2.0%(+0.692)#43 | 2.1%(+0.523)#5,521 |
| 44. | Carpio | 2.7% | 2.0%(+0.687)#44 | 2.1%(+0.517)#5,533 |
| 45. | Sanborn | 2.6% | 2.0%(+0.584)#45 | 2.1%(+0.415)#5,846 |
| 46. | Bowman | 2.5% | 2.0%(+0.557)#46 | 2.1%(+0.387)#5,930 |
| 47. | Carrington | 2.5% | 2.0%(+0.542)#47 | 2.1%(+0.373)#5,981 |
| 48. | Reynolds | 2.5% | 2.0%(+0.531)#48 | 2.1%(+0.361)#6,013 |
| 49. | Hebron | 2.5% | 2.0%(+0.528)#49 | 2.1%(+0.359)#6,023 |
| 50. | Center | 2.4% | 2.0%(+0.430)#50 | 2.1%(+0.260)#6,346 |
| 51. | Stanley | 2.4% | 2.0%(+0.429)#51 | 2.1%(+0.259)#6,352 |
| 52. | Grandin | 2.4% | 2.0%(+0.401)#52 | 2.1%(+0.232)#6,451 |
| 53. | Walhalla | 2.3% | 2.0%(+0.287)#53 | 2.1%(+0.117)#6,879 |
| 54. | Beach | 2.3% | 2.0%(+0.273)#54 | 2.1%(+0.103)#6,925 |
| 55. | Harvey | 2.2% | 2.0%(+0.215)#55 | 2.1%(+0.046)#7,147 |
| 56. | Harwood | 2.1% | 2.0%(+0.126)#56 | 2.1%(-0.044)#7,494 |
| 57. | Granville | 2.1% | 2.0%(+0.104)#57 | 2.1%(-0.066)#7,596 |
| 58. | Osnabrock | 2.1% | 2.0%(+0.104)#58 | 2.1%(-0.066)#7,598 |
| 59. | Cando | 2.1% | 2.0%(+0.096)#59 | 2.1%(-0.073)#7,621 |
| 60. | Amenia | 2.0% | 2.0%(+0.020)#60 | 2.1%(-0.149)#7,936 |
| 61. | Underwood | 2.0% | 2.0%(+0.015)#61 | 2.1%(-0.155)#7,945 |
| 62. | Richardton | 1.9% | 2.0%(-0.084)#62 | 2.1%(-0.253)#8,330 |
| 63. | Grand Forks Afb | 1.9% | 2.0%(-0.110)#63 | 2.1%(-0.280)#8,440 |
| 64. | New Town | 1.8% | 2.0%(-0.207)#64 | 2.1%(-0.377)#8,879 |
| 65. | New Salem | 1.8% | 2.0%(-0.221)#65 | 2.1%(-0.391)#8,948 |
| 66. | Reile S Acres | 1.8% | 2.0%(-0.229)#66 | 2.1%(-0.398)#8,979 |
| 67. | Mandan | 1.7% | 2.0%(-0.262)#67 | 2.1%(-0.431)#9,142 |
| 68. | Hillsboro | 1.7% | 2.0%(-0.283)#68 | 2.1%(-0.452)#9,243 |
| 69. | Zap | 1.6% | 2.0%(-0.340)#69 | 2.1%(-0.510)#9,524 |
| 70. | Wahpeton | 1.5% | 2.0%(-0.452)#70 | 2.1%(-0.621)#10,087 |
| 71. | Berthold | 1.5% | 2.0%(-0.472)#71 | 2.1%(-0.642)#10,172 |
| 72. | South Heart | 1.5% | 2.0%(-0.514)#72 | 2.1%(-0.684)#10,393 |
| 73. | Park River | 1.4% | 2.0%(-0.559)#73 | 2.1%(-0.729)#10,617 |
| 74. | Carson | 1.4% | 2.0%(-0.581)#74 | 2.1%(-0.751)#10,734 |
| 75. | Stanton | 1.4% | 2.0%(-0.616)#75 | 2.1%(-0.786)#10,902 |
| 76. | St Thomas | 1.4% | 2.0%(-0.619)#76 | 2.1%(-0.789)#10,922 |
| 77. | Grand Forks | 1.3% | 2.0%(-0.640)#77 | 2.1%(-0.809)#11,038 |
| 78. | Parshall | 1.3% | 2.0%(-0.706)#78 | 2.1%(-0.875)#11,383 |
| 79. | Mapleton | 1.2% | 2.0%(-0.805)#79 | 2.1%(-0.974)#11,913 |
| 80. | Garrison | 1.1% | 2.0%(-0.882)#80 | 2.1%(-1.05)#12,304 |
| 81. | Gilby | 1.1% | 2.0%(-0.887)#81 | 2.1%(-1.06)#12,329 |
| 82. | Bowbells | 1.1% | 2.0%(-0.910)#82 | 2.1%(-1.08)#12,460 |
| 83. | Minot | 1.1% | 2.0%(-0.929)#83 | 2.1%(-1.10)#12,556 |
| 84. | Oakes | 1.0% | 2.0%(-0.933)#84 | 2.1%(-1.10)#12,579 |
| 85. | Casselton | 1.0% | 2.0%(-0.976)#85 | 2.1%(-1.15)#12,815 |
| 86. | Flasher | 0.98% | 2.0%(-0.999)#86 | 2.1%(-1.17)#12,945 |
| 87. | Glenburn | 0.97% | 2.0%(-1.01)#87 | 2.1%(-1.18)#12,997 |
| 88. | Surrey | 0.96% | 2.0%(-1.02)#88 | 2.1%(-1.19)#13,066 |
| 89. | Page | 0.95% | 2.0%(-1.03)#89 | 2.1%(-1.20)#13,112 |
| 90. | Abercrombie | 0.85% | 2.0%(-1.12)#90 | 2.1%(-1.29)#13,668 |
| 91. | Wyndmere | 0.78% | 2.0%(-1.20)#91 | 2.1%(-1.37)#14,115 |
| 92. | Fordville | 0.77% | 2.0%(-1.21)#92 | 2.1%(-1.38)#14,170 |
| 93. | Grafton | 0.76% | 2.0%(-1.21)#93 | 2.1%(-1.38)#14,194 |
| 94. | Trenton | 0.67% | 2.0%(-1.31)#94 | 2.1%(-1.48)#14,722 |
| 95. | Finley | 0.67% | 2.0%(-1.31)#95 | 2.1%(-1.48)#14,726 |
| 96. | Williston | 0.65% | 2.0%(-1.33)#96 | 2.1%(-1.50)#14,827 |
| 97. | Ellendale | 0.64% | 2.0%(-1.34)#97 | 2.1%(-1.51)#14,892 |
| 98. | Rugby | 0.63% | 2.0%(-1.35)#98 | 2.1%(-1.52)#14,915 |
| 99. | Thompson | 0.63% | 2.0%(-1.35)#99 | 2.1%(-1.52)#14,927 |
| 100. | Neche | 0.63% | 2.0%(-1.35)#100 | 2.1%(-1.52)#14,961 |
Common Questions
What are the Top 10 Cities with the Highest Percentage of Population Employed in Architecture & Engineering in North Dakota?
Top 10 Cities with the Highest Percentage of Population Employed in Architecture & Engineering in North Dakota are:
What city has the Highest Percentage of Population Employed in Architecture & Engineering in North Dakota?
De Lamere has the Highest Percentage of Population Employed in Architecture & Engineering in North Dakota with 100.0%.
What is the Percentage of Population Employed in Architecture & Engineering in the State of North Dakota?
Percentage of Population Employed in Architecture & Engineering in North Dakota is 2.0%.
What is the Percentage of Population Employed in Architecture & Engineering in the United States?
Percentage of Population Employed in Architecture & Engineering in the United States is 2.1%.