West Fargo, ND
West Fargo Map
West Fargo Overview
38,653
TOTAL POPULATION
19,367
MALE POPULATION
19,286
FEMALE POPULATION
100.42
MALES / 100 FEMALES
99.58
FEMALES / 100 MALES
32.5
MEDIAN AGE
3.1
AVG FAMILY SIZE
2.5
AVG HOUSEHOLD SIZE
$46,528
PER CAPITA INCOME
$109,821
AVG FAMILY INCOME
$96,929
AVG HOUSEHOLD INCOME
32.5%
WAGE / INCOME GAP [ % ]
67.5¢/ $1
WAGE / INCOME GAP [ $ ]
$9,100
FAMILY INCOME DEFICIT
0.42
INEQUALITY / GINI INDEX
23,356
LABOR FORCE [ PEOPLE ]
80.1%
PERCENT IN LABOR FORCE
0.8%
UNEMPLOYMENT RATE
West Fargo Zip Codes
West Fargo Area Codes
Race in West Fargo
The most populous races in West Fargo are White / Caucasian (34,301 | 88.7%), Two or more Races (1,849 | 4.8%), and Black / African American (1,106 | 2.9%).
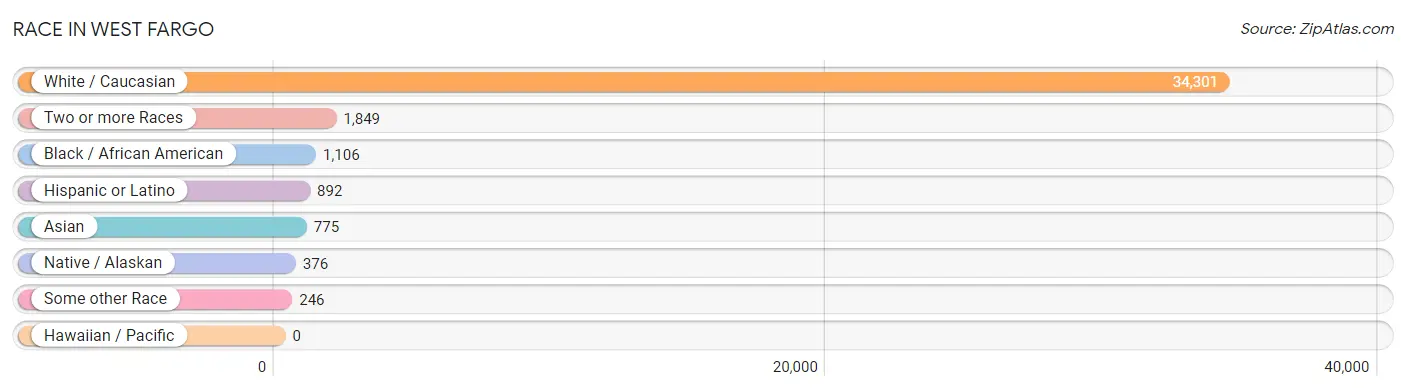
| Race | # Population | % Population |
| Asian | 775 | 2.0% |
| Black / African American | 1,106 | 2.9% |
| Hawaiian / Pacific | 0 | 0.0% |
| Hispanic or Latino | 892 | 2.3% |
| Native / Alaskan | 376 | 1.0% |
| White / Caucasian | 34,301 | 88.7% |
| Two or more Races | 1,849 | 4.8% |
| Some other Race | 246 | 0.6% |
| Total | 38,653 | 100.0% |
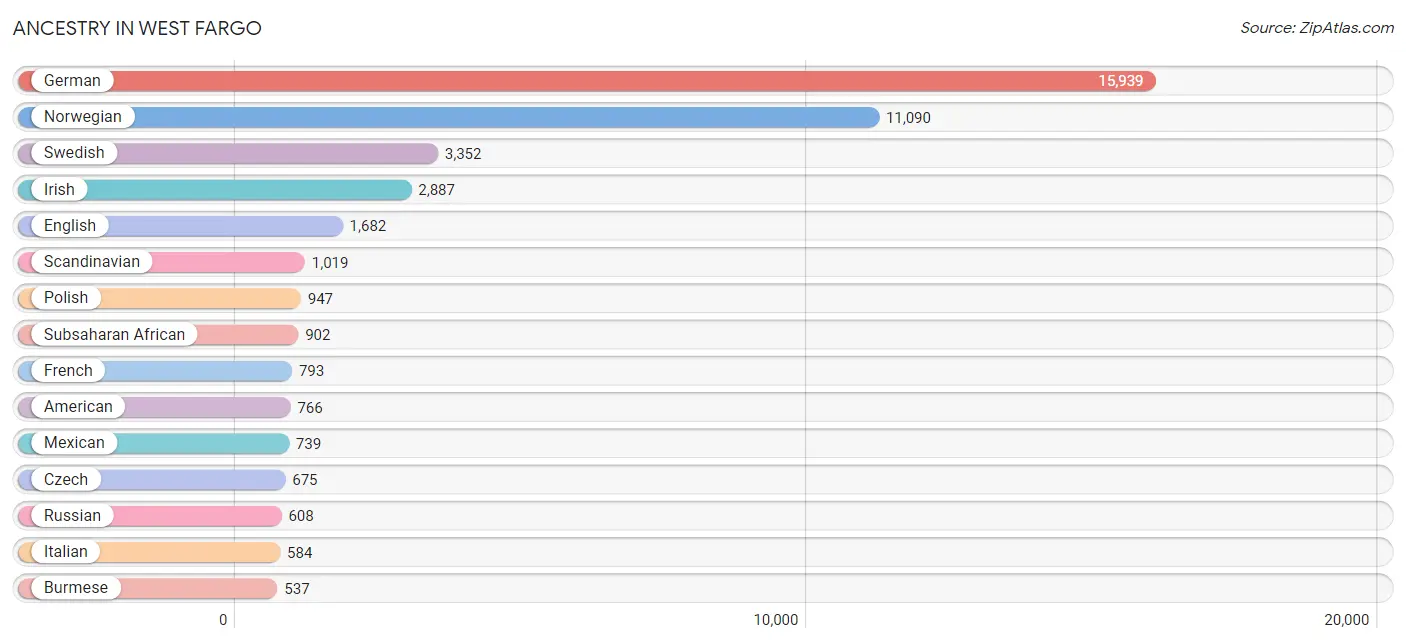
Ancestry in West Fargo
The most populous ancestries reported in West Fargo are German (15,939 | 41.2%), Norwegian (11,090 | 28.7%), Swedish (3,352 | 8.7%), Irish (2,887 | 7.5%), and English (1,682 | 4.3%), together accounting for 90.4% of all West Fargo residents.
| Ancestry | # Population | % Population |
| African | 17 | 0.0% |
| American | 766 | 2.0% |
| Arab | 450 | 1.2% |
| Argentinean | 23 | 0.1% |
| Armenian | 18 | 0.1% |
| Austrian | 18 | 0.1% |
| Belgian | 63 | 0.2% |
| Bhutanese | 13 | 0.0% |
| British | 50 | 0.1% |
| Bulgarian | 67 | 0.2% |
| Burmese | 537 | 1.4% |
| Central American | 23 | 0.1% |
| Cherokee | 26 | 0.1% |
| Cheyenne | 36 | 0.1% |
| Chippewa | 180 | 0.5% |
| Croatian | 64 | 0.2% |
| Crow | 88 | 0.2% |
| Czech | 675 | 1.8% |
| Danish | 314 | 0.8% |
| Dutch | 435 | 1.1% |
| English | 1,682 | 4.3% |
| European | 468 | 1.2% |
| Finnish | 352 | 0.9% |
| French | 793 | 2.1% |
| French Canadian | 240 | 0.6% |
| German | 15,939 | 41.2% |
| German Russian | 79 | 0.2% |
| Greek | 4 | 0.0% |
| Honduran | 23 | 0.1% |
| Hungarian | 45 | 0.1% |
| Icelander | 50 | 0.1% |
| Indian (Asian) | 299 | 0.8% |
| Inupiat | 56 | 0.1% |
| Iraqi | 10 | 0.0% |
| Irish | 2,887 | 7.5% |
| Italian | 584 | 1.5% |
| Japanese | 22 | 0.1% |
| Korean | 323 | 0.8% |
| Lebanese | 89 | 0.2% |
| Liberian | 81 | 0.2% |
| Lithuanian | 17 | 0.0% |
| Lumbee | 18 | 0.1% |
| Luxembourger | 58 | 0.2% |
| Mexican | 739 | 1.9% |
| Nigerian | 117 | 0.3% |
| Northern European | 78 | 0.2% |
| Norwegian | 11,090 | 28.7% |
| Pakistani | 20 | 0.1% |
| Pennsylvania German | 39 | 0.1% |
| Peruvian | 46 | 0.1% |
| Polish | 947 | 2.5% |
| Portuguese | 11 | 0.0% |
| Puerto Rican | 33 | 0.1% |
| Russian | 608 | 1.6% |
| Scandinavian | 1,019 | 2.6% |
| Scotch-Irish | 63 | 0.2% |
| Scottish | 362 | 0.9% |
| Serbian | 11 | 0.0% |
| Sioux | 488 | 1.3% |
| South American | 69 | 0.2% |
| Sri Lankan | 167 | 0.4% |
| Subsaharan African | 902 | 2.3% |
| Sudanese | 73 | 0.2% |
| Swedish | 3,352 | 8.7% |
| Swiss | 250 | 0.6% |
| Syrian | 232 | 0.6% |
| Thai | 154 | 0.4% |
| Ukrainian | 223 | 0.6% |
| Vietnamese | 17 | 0.0% |
| Welsh | 177 | 0.5% | View All 70 Rows |
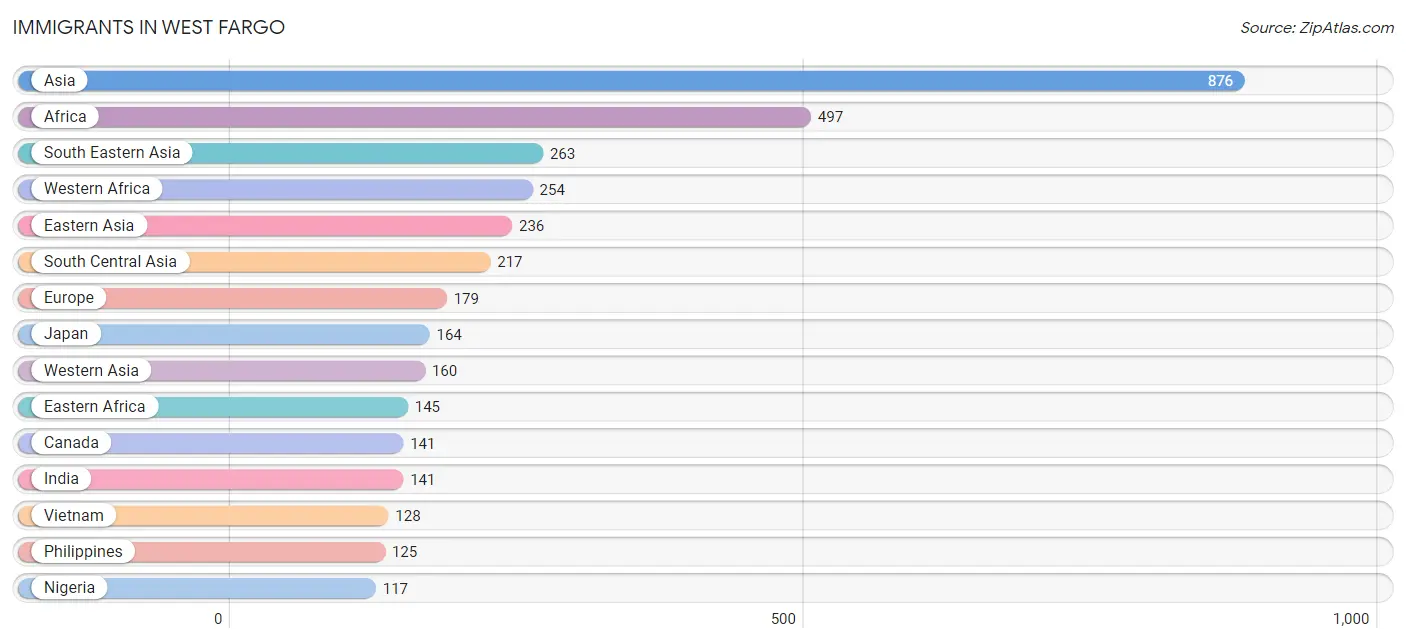
Immigrants in West Fargo
The most numerous immigrant groups reported in West Fargo came from Asia (876 | 2.3%), Africa (497 | 1.3%), South Eastern Asia (263 | 0.7%), Western Africa (254 | 0.7%), and Eastern Asia (236 | 0.6%), together accounting for 5.5% of all West Fargo residents.
| Immigration Origin | # Population | % Population |
| Africa | 497 | 1.3% |
| Argentina | 15 | 0.0% |
| Asia | 876 | 2.3% |
| Bangladesh | 17 | 0.0% |
| Canada | 141 | 0.4% |
| Central America | 51 | 0.1% |
| Congo | 98 | 0.3% |
| Denmark | 7 | 0.0% |
| Eastern Africa | 145 | 0.4% |
| Eastern Asia | 236 | 0.6% |
| Eastern Europe | 49 | 0.1% |
| Europe | 179 | 0.5% |
| France | 13 | 0.0% |
| Greece | 37 | 0.1% |
| India | 141 | 0.4% |
| Iraq | 10 | 0.0% |
| Israel | 19 | 0.1% |
| Japan | 164 | 0.4% |
| Jordan | 20 | 0.1% |
| Korea | 72 | 0.2% |
| Latin America | 112 | 0.3% |
| Liberia | 81 | 0.2% |
| Mexico | 51 | 0.1% |
| Middle Africa | 98 | 0.3% |
| Nepal | 59 | 0.2% |
| Nigeria | 117 | 0.3% |
| Northern Europe | 80 | 0.2% |
| Norway | 12 | 0.0% |
| Peru | 46 | 0.1% |
| Philippines | 125 | 0.3% |
| Russia | 49 | 0.1% |
| Sierra Leone | 45 | 0.1% |
| South America | 61 | 0.2% |
| South Central Asia | 217 | 0.6% |
| South Eastern Asia | 263 | 0.7% |
| Southern Europe | 37 | 0.1% |
| Syria | 111 | 0.3% |
| Thailand | 10 | 0.0% |
| Vietnam | 128 | 0.3% |
| Western Africa | 254 | 0.7% |
| Western Asia | 160 | 0.4% |
| Western Europe | 13 | 0.0% | View All 42 Rows |
Sex and Age in West Fargo
Sex and Age in West Fargo
The most populous age groups in West Fargo are 35 to 39 Years (1,902 | 9.8%) for men and 20 to 24 Years (2,006 | 10.4%) for women.
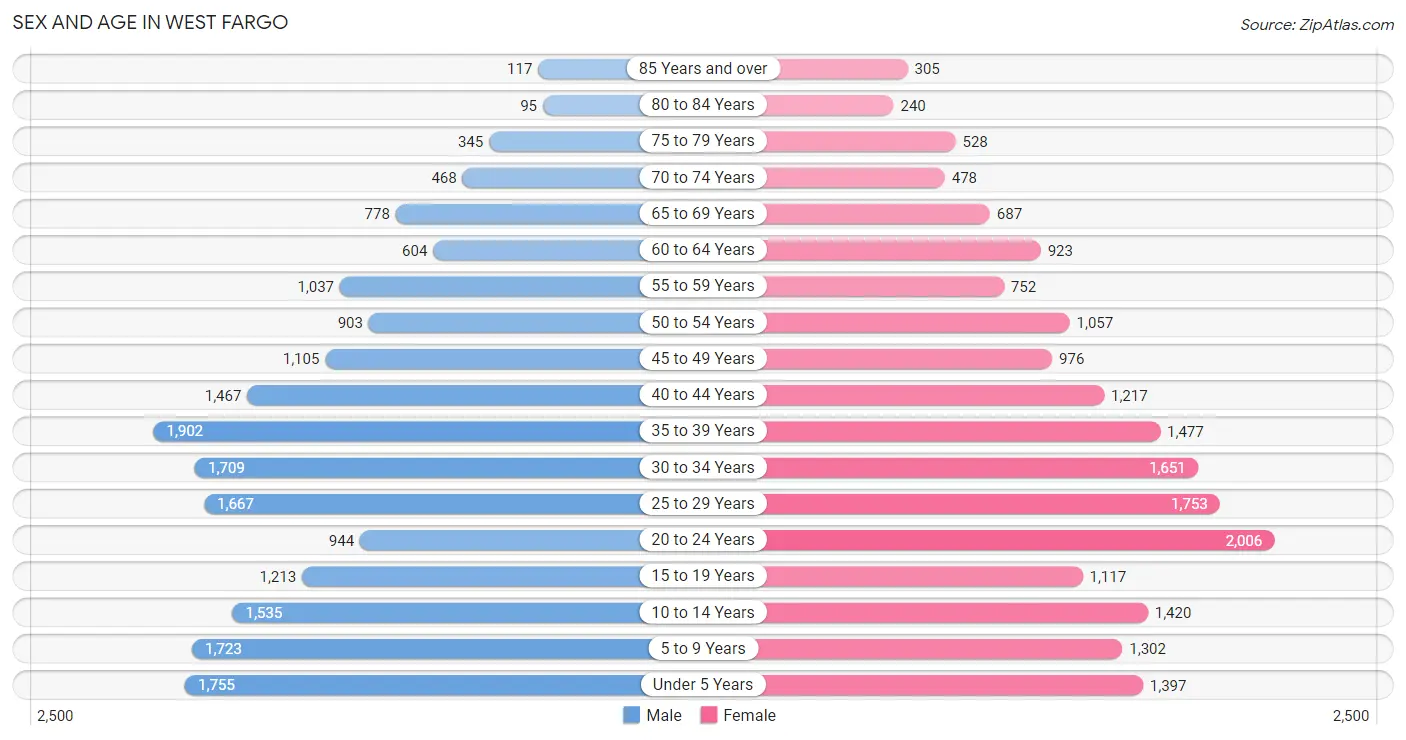
| Age Bracket | Male | Female |
| Under 5 Years | 1,755 (9.1%) | 1,397 (7.2%) |
| 5 to 9 Years | 1,723 (8.9%) | 1,302 (6.8%) |
| 10 to 14 Years | 1,535 (7.9%) | 1,420 (7.4%) |
| 15 to 19 Years | 1,213 (6.3%) | 1,117 (5.8%) |
| 20 to 24 Years | 944 (4.9%) | 2,006 (10.4%) |
| 25 to 29 Years | 1,667 (8.6%) | 1,753 (9.1%) |
| 30 to 34 Years | 1,709 (8.8%) | 1,651 (8.6%) |
| 35 to 39 Years | 1,902 (9.8%) | 1,477 (7.7%) |
| 40 to 44 Years | 1,467 (7.6%) | 1,217 (6.3%) |
| 45 to 49 Years | 1,105 (5.7%) | 976 (5.1%) |
| 50 to 54 Years | 903 (4.7%) | 1,057 (5.5%) |
| 55 to 59 Years | 1,037 (5.3%) | 752 (3.9%) |
| 60 to 64 Years | 604 (3.1%) | 923 (4.8%) |
| 65 to 69 Years | 778 (4.0%) | 687 (3.6%) |
| 70 to 74 Years | 468 (2.4%) | 478 (2.5%) |
| 75 to 79 Years | 345 (1.8%) | 528 (2.7%) |
| 80 to 84 Years | 95 (0.5%) | 240 (1.2%) |
| 85 Years and over | 117 (0.6%) | 305 (1.6%) |
| Total | 19,367 (100.0%) | 19,286 (100.0%) |
Families and Households in West Fargo
Median Family Size in West Fargo
The median family size in West Fargo is 3.12 persons per family, with married-couple families (8,391 | 84.1%) accounting for the largest median family size of 3.2 persons per family. On the other hand, single female/mother families (1,148 | 11.5%) represent the smallest median family size with 2.50 persons per family.
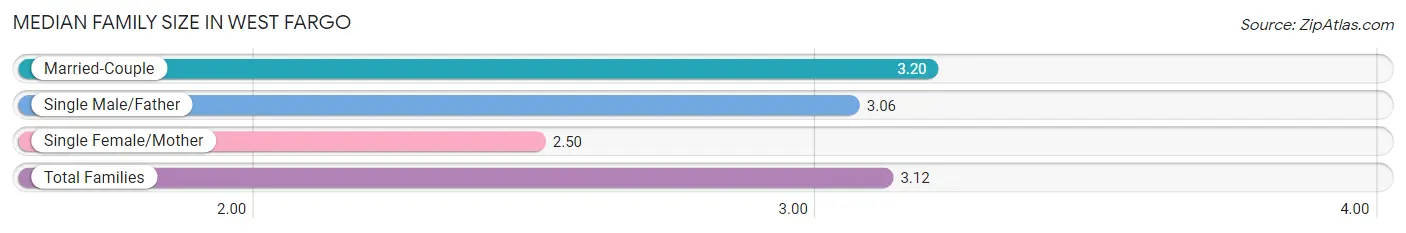
| Family Type | # Families | Family Size |
| Married-Couple | 8,391 (84.1%) | 3.20 |
| Single Male/Father | 435 (4.4%) | 3.06 |
| Single Female/Mother | 1,148 (11.5%) | 2.50 |
| Total Families | 9,974 (100.0%) | 3.12 |
Median Household Size in West Fargo
The median household size in West Fargo is 2.55 persons per household, with single male/father households (435 | 2.9%) accounting for the largest median household size of 3.61 persons per household. non-family households (5,129 | 34.0%) represent the smallest median household size with 1.31 persons per household.
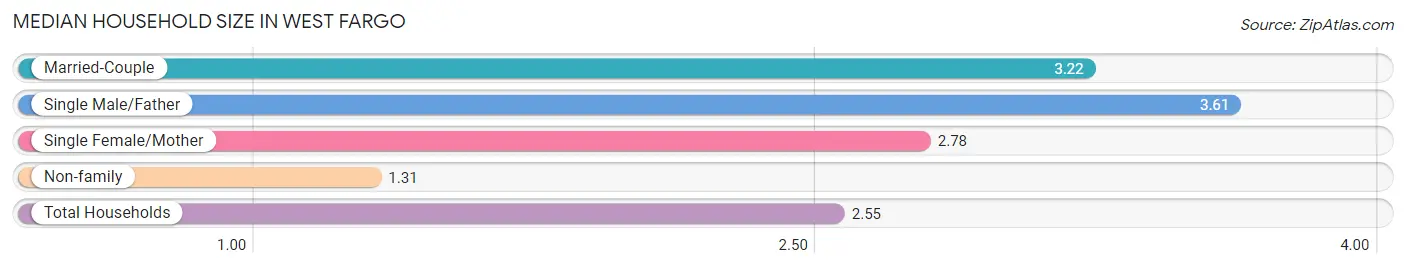
| Household Type | # Households | Household Size |
| Married-Couple | 8,391 (55.6%) | 3.22 |
| Single Male/Father | 435 (2.9%) | 3.61 |
| Single Female/Mother | 1,148 (7.6%) | 2.78 |
| Non-family | 5,129 (34.0%) | 1.31 |
| Total Households | 15,103 (100.0%) | 2.55 |
Household Size by Marriage Status in West Fargo
Out of a total of 15,103 households in West Fargo, 9,974 (66.0%) are family households, while 5,129 (34.0%) are nonfamily households. The most numerous type of family households are 2-person households, comprising 4,248, and the most common type of nonfamily households are 1-person households, comprising 3,809.
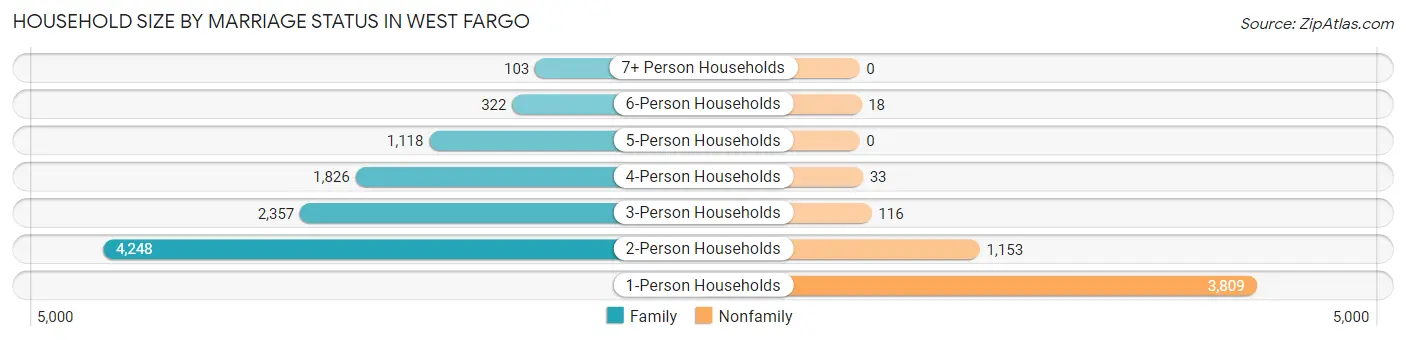
| Household Size | Family Households | Nonfamily Households |
| 1-Person Households | - | 3,809 (25.2%) |
| 2-Person Households | 4,248 (28.1%) | 1,153 (7.6%) |
| 3-Person Households | 2,357 (15.6%) | 116 (0.8%) |
| 4-Person Households | 1,826 (12.1%) | 33 (0.2%) |
| 5-Person Households | 1,118 (7.4%) | 0 (0.0%) |
| 6-Person Households | 322 (2.1%) | 18 (0.1%) |
| 7+ Person Households | 103 (0.7%) | 0 (0.0%) |
| Total | 9,974 (66.0%) | 5,129 (34.0%) |
Female Fertility in West Fargo
Fertility by Age in West Fargo
Average fertility rate in West Fargo is 82.0 births per 1,000 women. Women in the age bracket of 20 to 34 years have the highest fertility rate with 106.0 births per 1,000 women. Women in the age bracket of 20 to 34 years acount for 67.5% of all women with births.
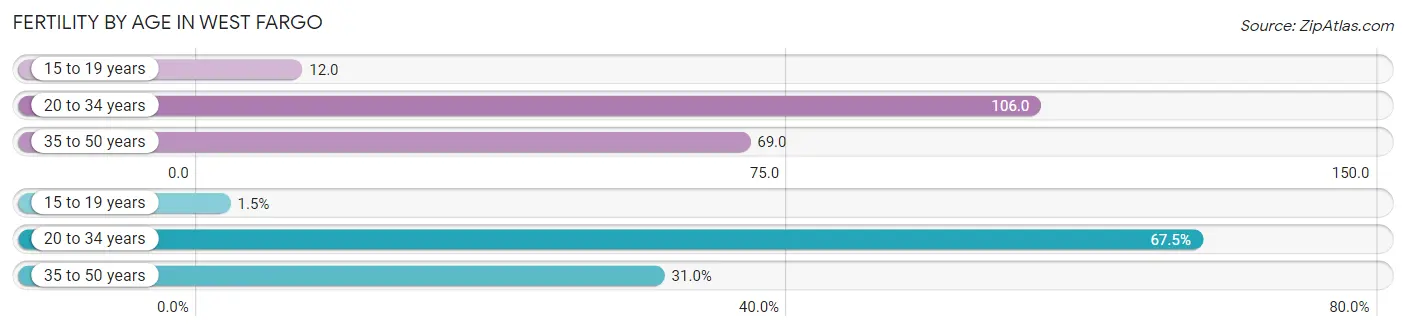
| Age Bracket | Women with Births | Births / 1,000 Women |
| 15 to 19 years | 13 (1.5%) | 12.0 |
| 20 to 34 years | 575 (67.5%) | 106.0 |
| 35 to 50 years | 264 (31.0%) | 69.0 |
| Total | 852 (100.0%) | 82.0 |
Fertility by Age by Marriage Status in West Fargo
85.0% of women with births (852) in West Fargo are married. The highest percentage of unmarried women with births falls into 15 to 19 years age bracket with 100.0% of them unmarried at the time of birth, while the lowest percentage of unmarried women with births belong to 20 to 34 years age bracket with 12.5% of them unmarried.
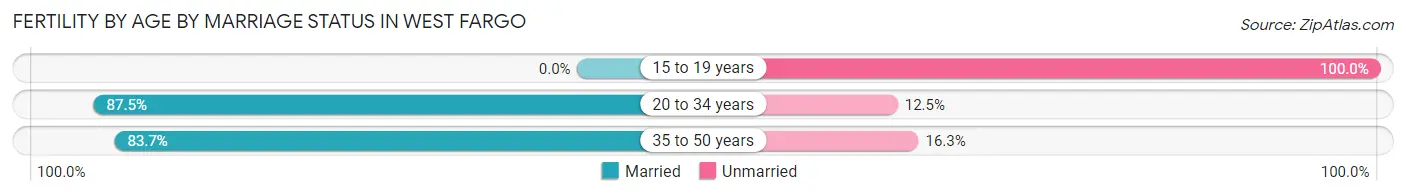
| Age Bracket | Married | Unmarried |
| 15 to 19 years | 0 (0.0%) | 13 (100.0%) |
| 20 to 34 years | 503 (87.5%) | 72 (12.5%) |
| 35 to 50 years | 221 (83.7%) | 43 (16.3%) |
| Total | 724 (85.0%) | 128 (15.0%) |
Fertility by Education in West Fargo
Average fertility rate in West Fargo is 82.0 births per 1,000 women. Women with the education attainment of graduate degree have the highest fertility rate of 184.0 births per 1,000 women, while women with the education attainment of bachelor's degree have the lowest fertility at 53.0 births per 1,000 women. Women with the education attainment of college or associate's degree represent 30.4% of all women with births.
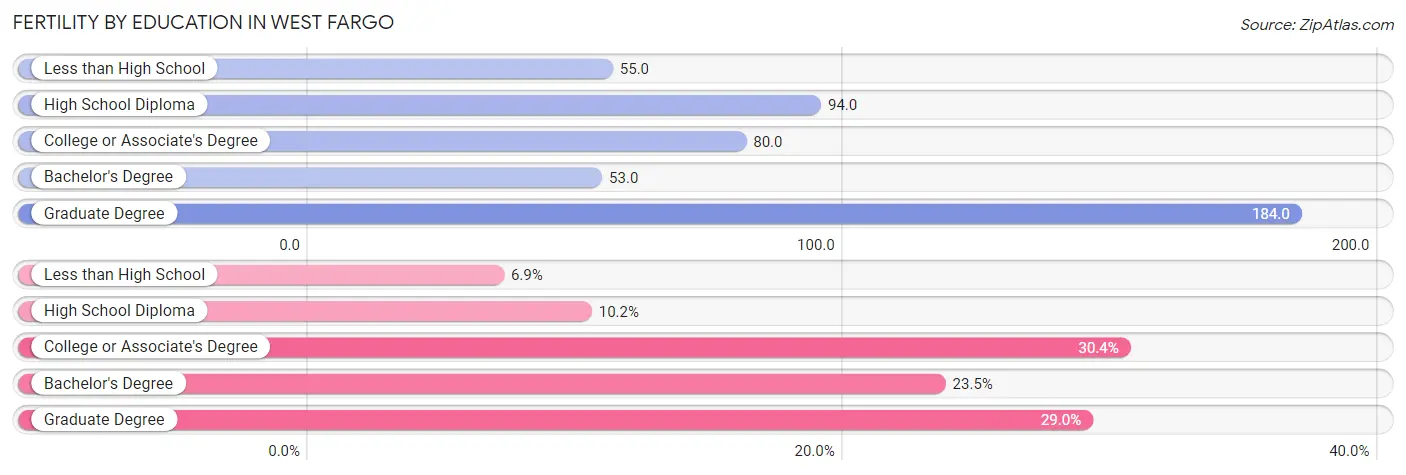
| Educational Attainment | Women with Births | Births / 1,000 Women |
| Less than High School | 59 (6.9%) | 55.0 |
| High School Diploma | 87 (10.2%) | 94.0 |
| College or Associate's Degree | 259 (30.4%) | 80.0 |
| Bachelor's Degree | 200 (23.5%) | 53.0 |
| Graduate Degree | 247 (29.0%) | 184.0 |
| Total | 852 (100.0%) | 82.0 |
Fertility by Education by Marriage Status in West Fargo
15.0% of women with births in West Fargo are unmarried. Women with the educational attainment of bachelor's degree are most likely to be married with 100.0% of them married at childbirth, while women with the educational attainment of high school diploma are least likely to be married with 52.9% of them unmarried at childbirth.
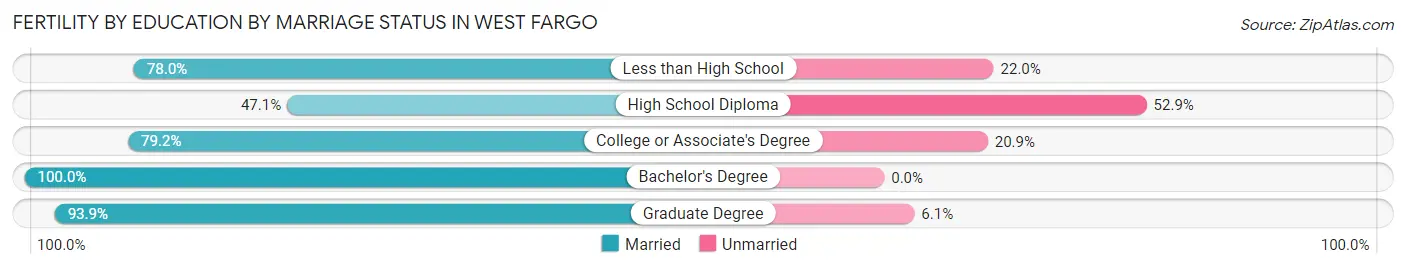
| Educational Attainment | Married | Unmarried |
| Less than High School | 46 (78.0%) | 13 (22.0%) |
| High School Diploma | 41 (47.1%) | 46 (52.9%) |
| College or Associate's Degree | 205 (79.1%) | 54 (20.8%) |
| Bachelor's Degree | 200 (100.0%) | 0 (0.0%) |
| Graduate Degree | 232 (93.9%) | 15 (6.1%) |
| Total | 724 (85.0%) | 128 (15.0%) |
Income in West Fargo
Income Overview in West Fargo
Per Capita Income in West Fargo is $46,528, while median incomes of families and households are $109,821 and $96,929 respectively.
| Characteristic | Number | Measure |
| Per Capita Income | 38,653 | $46,528 |
| Median Family Income | 9,974 | $109,821 |
| Mean Family Income | 9,974 | $147,626 |
| Median Household Income | 15,103 | $96,929 |
| Mean Household Income | 15,103 | $119,131 |
| Income Deficit | 9,974 | $9,100 |
| Wage / Income Gap (%) | 38,653 | 32.46% |
| Wage / Income Gap ($) | 38,653 | 67.54¢ per $1 |
| Gini / Inequality Index | 38,653 | 0.42 |
Earnings by Sex in West Fargo
Average Earnings in West Fargo are $49,414, $58,842 for men and $39,740 for women, a difference of 32.5%.
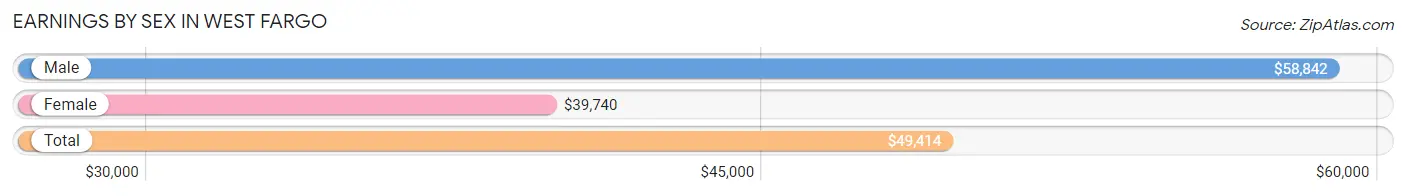
| Sex | Number | Average Earnings |
| Male | 12,476 (51.5%) | $58,842 |
| Female | 11,759 (48.5%) | $39,740 |
| Total | 24,235 (100.0%) | $49,414 |
Earnings by Sex by Income Bracket in West Fargo
The most common earnings brackets in West Fargo are $100,000+ for men (2,788 | 22.4%) and $30,000 to $34,999 for women (1,197 | 10.2%).
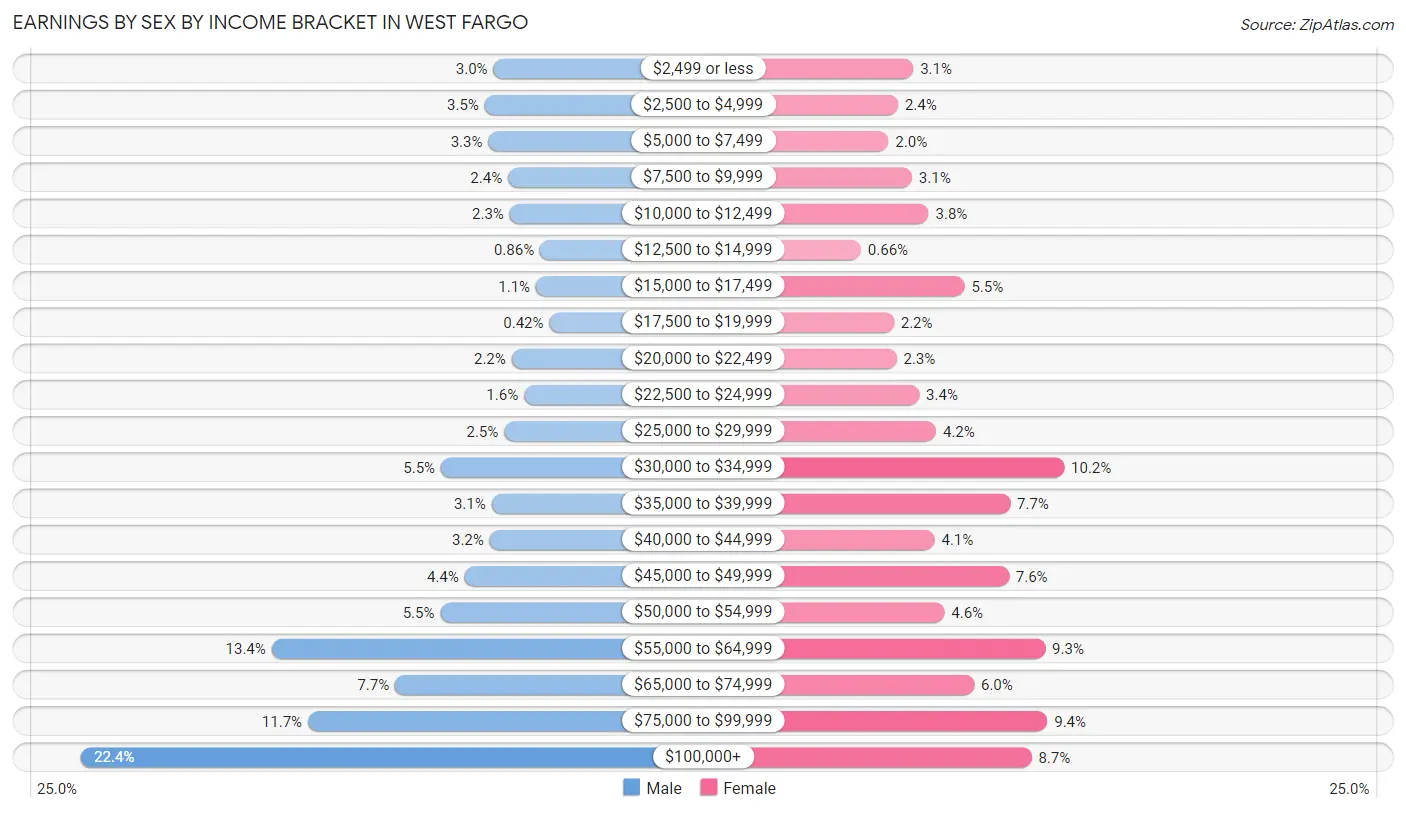
| Income | Male | Female |
| $2,499 or less | 379 (3.0%) | 366 (3.1%) |
| $2,500 to $4,999 | 430 (3.5%) | 282 (2.4%) |
| $5,000 to $7,499 | 409 (3.3%) | 229 (1.9%) |
| $7,500 to $9,999 | 295 (2.4%) | 359 (3.0%) |
| $10,000 to $12,499 | 284 (2.3%) | 450 (3.8%) |
| $12,500 to $14,999 | 107 (0.9%) | 78 (0.7%) |
| $15,000 to $17,499 | 131 (1.1%) | 648 (5.5%) |
| $17,500 to $19,999 | 52 (0.4%) | 259 (2.2%) |
| $20,000 to $22,499 | 273 (2.2%) | 274 (2.3%) |
| $22,500 to $24,999 | 201 (1.6%) | 399 (3.4%) |
| $25,000 to $29,999 | 317 (2.5%) | 492 (4.2%) |
| $30,000 to $34,999 | 686 (5.5%) | 1,197 (10.2%) |
| $35,000 to $39,999 | 390 (3.1%) | 899 (7.6%) |
| $40,000 to $44,999 | 402 (3.2%) | 483 (4.1%) |
| $45,000 to $49,999 | 548 (4.4%) | 893 (7.6%) |
| $50,000 to $54,999 | 690 (5.5%) | 537 (4.6%) |
| $55,000 to $64,999 | 1,676 (13.4%) | 1,092 (9.3%) |
| $65,000 to $74,999 | 954 (7.6%) | 701 (6.0%) |
| $75,000 to $99,999 | 1,464 (11.7%) | 1,104 (9.4%) |
| $100,000+ | 2,788 (22.4%) | 1,017 (8.6%) |
| Total | 12,476 (100.0%) | 11,759 (100.0%) |
Earnings by Sex by Educational Attainment in West Fargo
Average earnings in West Fargo are $63,732 for men and $47,228 for women, a difference of 25.9%. Men with an educational attainment of bachelor's degree enjoy the highest average annual earnings of $84,724, while those with less than high school education earn the least with $45,938. Women with an educational attainment of graduate degree earn the most with the average annual earnings of $76,358, while those with high school diploma education have the smallest earnings of $33,443.
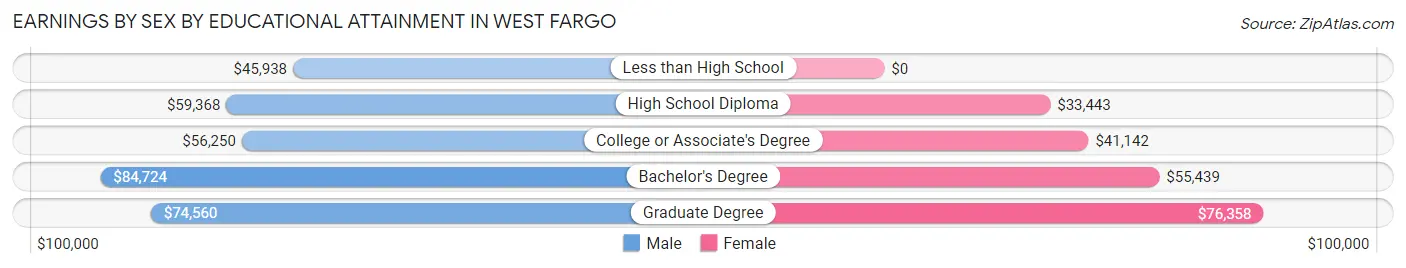
| Educational Attainment | Male Income | Female Income |
| Less than High School | $45,938 | $0 |
| High School Diploma | $59,368 | $33,443 |
| College or Associate's Degree | $56,250 | $41,142 |
| Bachelor's Degree | $84,724 | $55,439 |
| Graduate Degree | $74,560 | $76,358 |
| Total | $63,732 | $47,228 |
Family Income in West Fargo
Family Income Brackets in West Fargo
According to the West Fargo family income data, there are 2,563 families falling into the $100,000 to $149,999 income range, which is the most common income bracket and makes up 25.7% of all families. Conversely, the less than $10,000 income bracket is the least frequent group with only 50 families (0.5%) belonging to this category.
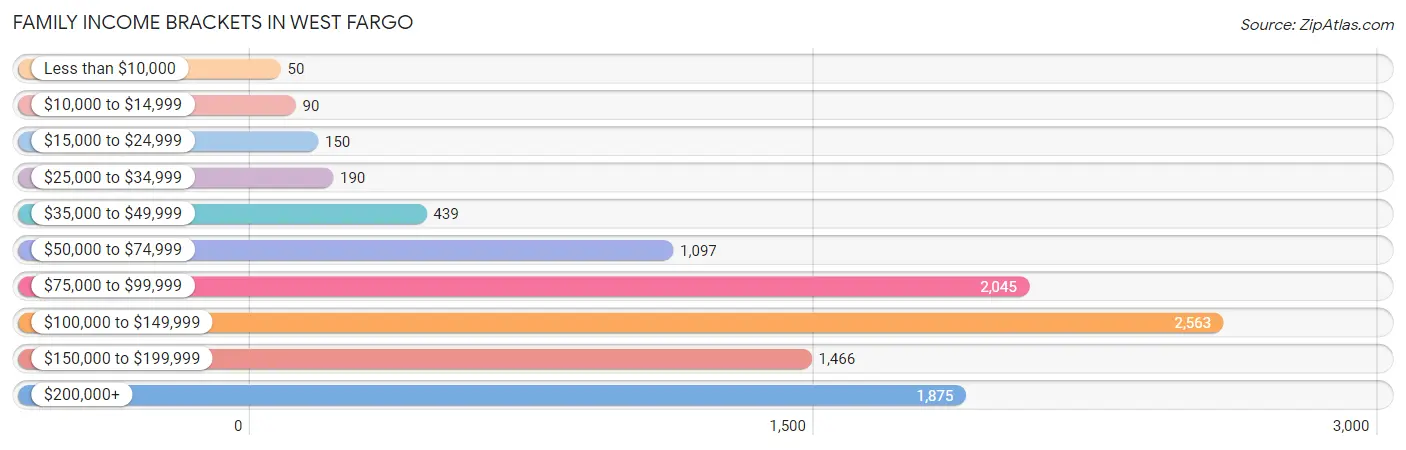
| Income Bracket | # Families | % Families |
| Less than $10,000 | 50 | 0.5% |
| $10,000 to $14,999 | 90 | 0.9% |
| $15,000 to $24,999 | 150 | 1.5% |
| $25,000 to $34,999 | 190 | 1.9% |
| $35,000 to $49,999 | 439 | 4.4% |
| $50,000 to $74,999 | 1,097 | 11.0% |
| $75,000 to $99,999 | 2,045 | 20.5% |
| $100,000 to $149,999 | 2,563 | 25.7% |
| $150,000 to $199,999 | 1,466 | 14.7% |
| $200,000+ | 1,875 | 18.8% |
Family Income by Famaliy Size in West Fargo
6-person families (281 | 2.8%) account for the highest median family income in West Fargo with $243,011 per family, while 2-person families (4,694 | 47.1%) have the highest median income of $48,850 per family member.
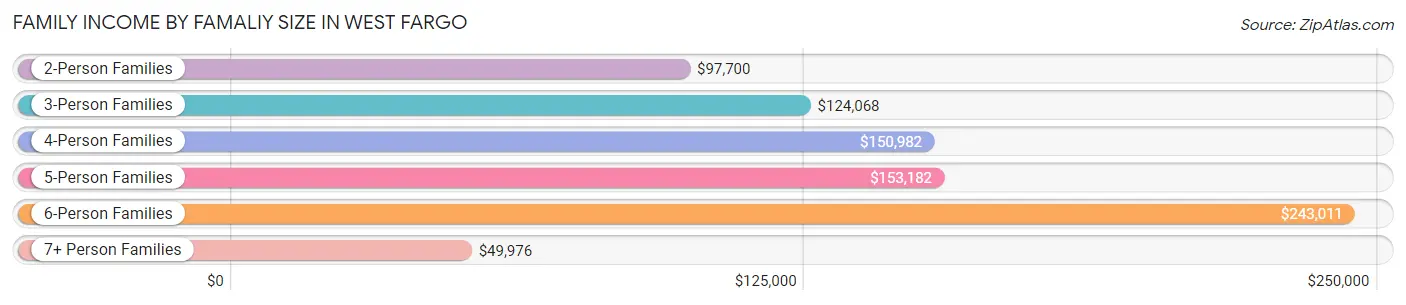
| Income Bracket | # Families | Median Income |
| 2-Person Families | 4,694 (47.1%) | $97,700 |
| 3-Person Families | 2,026 (20.3%) | $124,068 |
| 4-Person Families | 1,876 (18.8%) | $150,982 |
| 5-Person Families | 994 (10.0%) | $153,182 |
| 6-Person Families | 281 (2.8%) | $243,011 |
| 7+ Person Families | 103 (1.0%) | $49,976 |
| Total | 9,974 (100.0%) | $109,821 |
Family Income by Number of Earners in West Fargo
The median family income in West Fargo is $109,821, with families comprising 3+ earners (837) having the highest median family income of $152,313, while families with no earners (653) have the lowest median family income of $82,889, accounting for 8.4% and 6.6% of families, respectively.
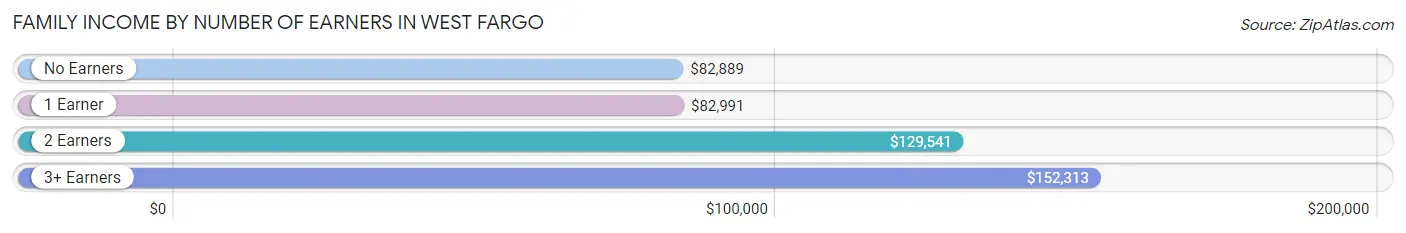
| Number of Earners | # Families | Median Income |
| No Earners | 653 (6.6%) | $82,889 |
| 1 Earner | 2,094 (21.0%) | $82,991 |
| 2 Earners | 6,390 (64.1%) | $129,541 |
| 3+ Earners | 837 (8.4%) | $152,313 |
| Total | 9,974 (100.0%) | $109,821 |
Household Income in West Fargo
Household Income Brackets in West Fargo
With 3,398 households falling in the category, the $100,000 to $149,999 income range is the most frequent in West Fargo, accounting for 22.5% of all households. In contrast, only 257 households (1.7%) fall into the less than $10,000 income bracket, making it the least populous group.
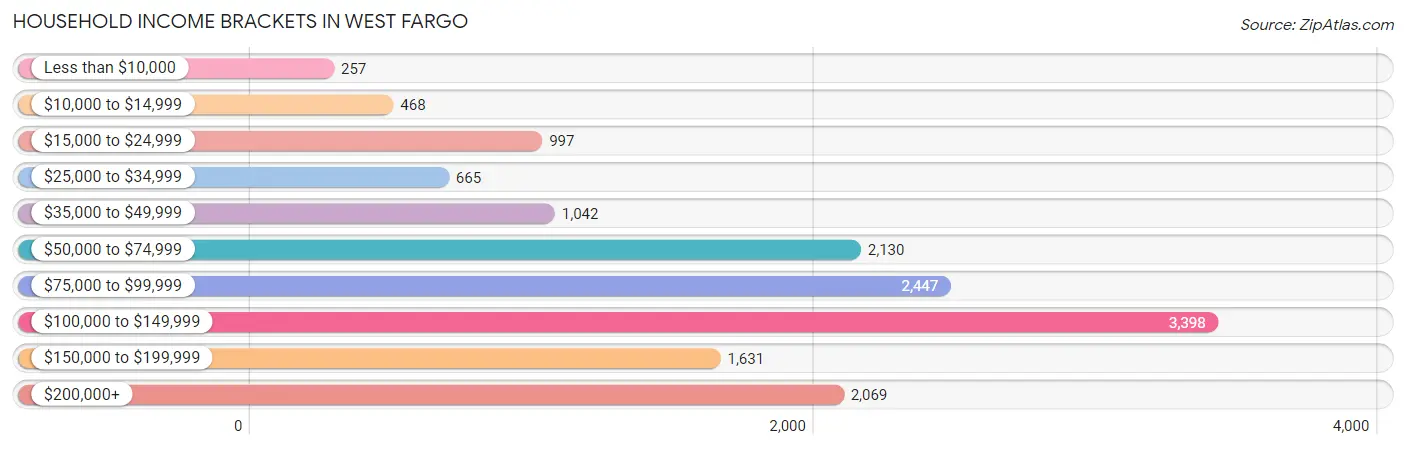
| Income Bracket | # Households | % Households |
| Less than $10,000 | 257 | 1.7% |
| $10,000 to $14,999 | 468 | 3.1% |
| $15,000 to $24,999 | 997 | 6.6% |
| $25,000 to $34,999 | 665 | 4.4% |
| $35,000 to $49,999 | 1,042 | 6.9% |
| $50,000 to $74,999 | 2,130 | 14.1% |
| $75,000 to $99,999 | 2,447 | 16.2% |
| $100,000 to $149,999 | 3,398 | 22.5% |
| $150,000 to $199,999 | 1,631 | 10.8% |
| $200,000+ | 2,069 | 13.7% |
Household Income by Householder Age in West Fargo
The median household income in West Fargo is $96,929, with the highest median household income of $113,343 found in the 45 to 64 years age bracket for the primary householder. A total of 4,015 households (26.6%) fall into this category. Meanwhile, the 15 to 24 years age bracket for the primary householder has the lowest median household income of $45,972, with 1,325 households (8.8%) in this group.
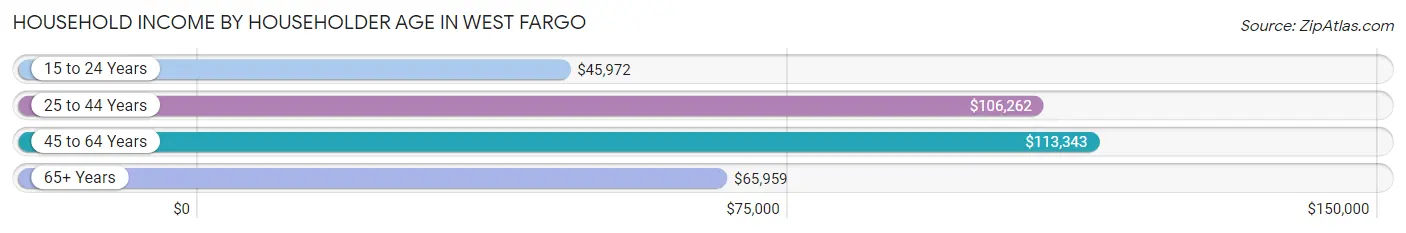
| Income Bracket | # Households | Median Income |
| 15 to 24 Years | 1,325 (8.8%) | $45,972 |
| 25 to 44 Years | 7,040 (46.6%) | $106,262 |
| 45 to 64 Years | 4,015 (26.6%) | $113,343 |
| 65+ Years | 2,723 (18.0%) | $65,959 |
| Total | 15,103 (100.0%) | $96,929 |
Poverty in West Fargo
Income Below Poverty by Sex and Age in West Fargo
With 7.9% poverty level for males and 5.6% for females among the residents of West Fargo, 18 to 24 year old males and 18 to 24 year old females are the most vulnerable to poverty, with 383 males (26.8%) and 463 females (19.3%) in their respective age groups living below the poverty level.
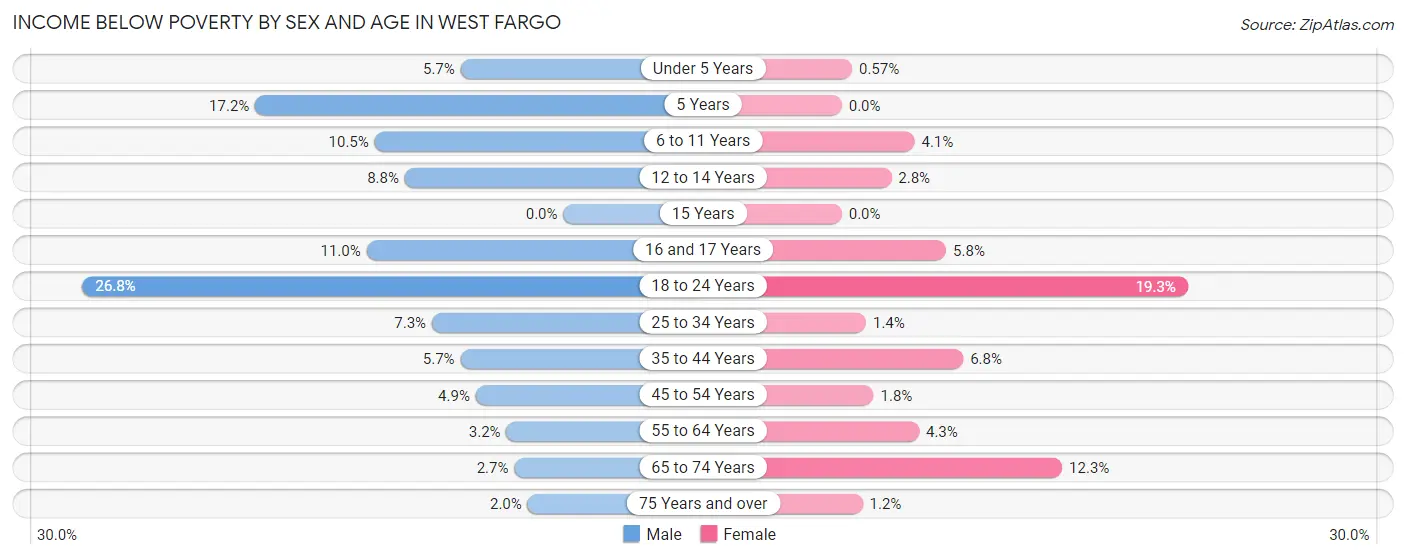
| Age Bracket | Male | Female |
| Under 5 Years | 98 (5.7%) | 8 (0.6%) |
| 5 Years | 52 (17.2%) | 0 (0.0%) |
| 6 to 11 Years | 218 (10.5%) | 62 (4.1%) |
| 12 to 14 Years | 75 (8.8%) | 24 (2.8%) |
| 15 Years | 0 (0.0%) | 0 (0.0%) |
| 16 and 17 Years | 64 (11.0%) | 29 (5.8%) |
| 18 to 24 Years | 383 (26.8%) | 463 (19.3%) |
| 25 to 34 Years | 247 (7.3%) | 46 (1.3%) |
| 35 to 44 Years | 193 (5.7%) | 182 (6.8%) |
| 45 to 54 Years | 98 (4.9%) | 36 (1.8%) |
| 55 to 64 Years | 52 (3.2%) | 72 (4.3%) |
| 65 to 74 Years | 34 (2.7%) | 143 (12.3%) |
| 75 Years and over | 11 (2.0%) | 12 (1.2%) |
| Total | 1,525 (7.9%) | 1,077 (5.6%) |
Income Above Poverty by Sex and Age in West Fargo
According to the poverty statistics in West Fargo, males aged 15 years and females aged 5 years are the age groups that are most secure financially, with 100.0% of males and 100.0% of females in these age groups living above the poverty line.
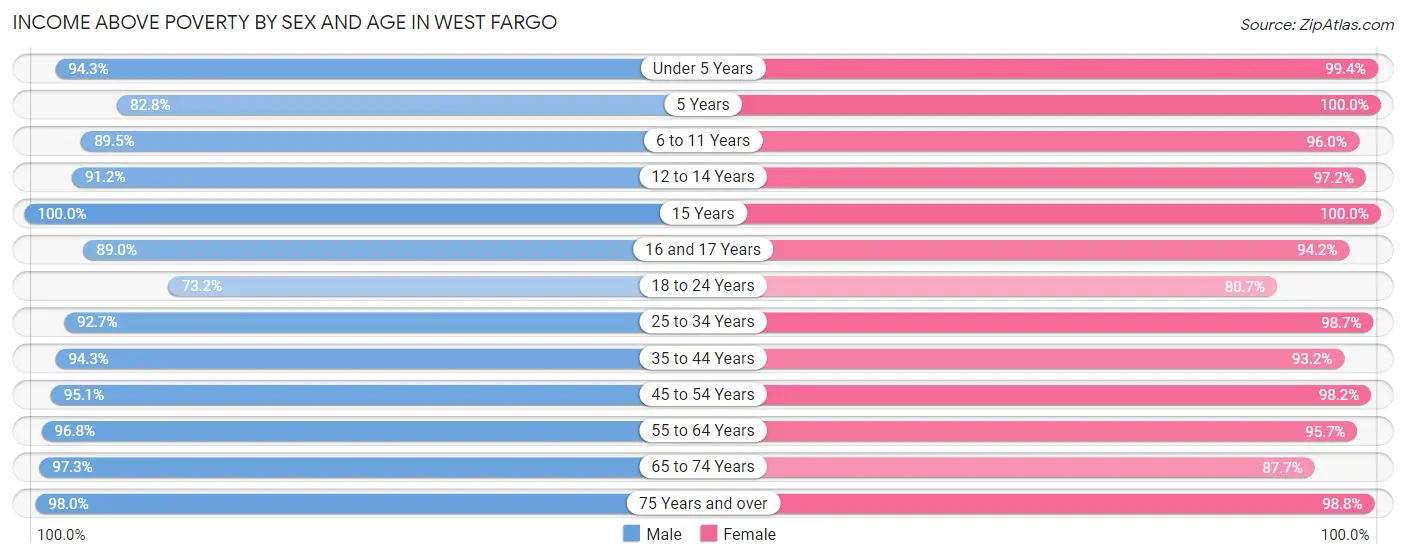
| Age Bracket | Male | Female |
| Under 5 Years | 1,614 (94.3%) | 1,389 (99.4%) |
| 5 Years | 251 (82.8%) | 299 (100.0%) |
| 6 to 11 Years | 1,857 (89.5%) | 1,467 (96.0%) |
| 12 to 14 Years | 774 (91.2%) | 845 (97.2%) |
| 15 Years | 143 (100.0%) | 220 (100.0%) |
| 16 and 17 Years | 520 (89.0%) | 470 (94.2%) |
| 18 to 24 Years | 1,047 (73.2%) | 1,941 (80.7%) |
| 25 to 34 Years | 3,129 (92.7%) | 3,358 (98.7%) |
| 35 to 44 Years | 3,176 (94.3%) | 2,512 (93.2%) |
| 45 to 54 Years | 1,910 (95.1%) | 1,997 (98.2%) |
| 55 to 64 Years | 1,589 (96.8%) | 1,603 (95.7%) |
| 65 to 74 Years | 1,212 (97.3%) | 1,022 (87.7%) |
| 75 Years and over | 541 (98.0%) | 1,023 (98.8%) |
| Total | 17,763 (92.1%) | 18,146 (94.4%) |
Income Below Poverty Among Married-Couple Families in West Fargo
The poverty statistics for married-couple families in West Fargo show that 1.3% or 105 of the total 8,391 families live below the poverty line. Families with no children have the highest poverty rate of 1.8%, comprising of 74 families. On the other hand, families with 5 or more children have the lowest poverty rate of 0.0%, which includes 0 families.
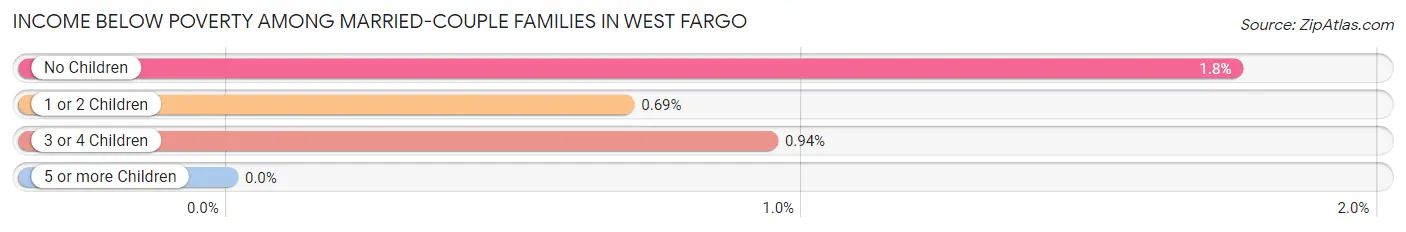
| Children | Above Poverty | Below Poverty |
| No Children | 4,166 (98.3%) | 74 (1.8%) |
| 1 or 2 Children | 3,025 (99.3%) | 21 (0.7%) |
| 3 or 4 Children | 1,053 (99.1%) | 10 (0.9%) |
| 5 or more Children | 42 (100.0%) | 0 (0.0%) |
| Total | 8,286 (98.8%) | 105 (1.3%) |
Income Below Poverty Among Single-Parent Households in West Fargo
According to the poverty data in West Fargo, 19.8% or 86 single-father households and 8.8% or 101 single-mother households are living below the poverty line. Among single-father households, those with 5 or more children have the highest poverty rate, with 52 households (85.3%) experiencing poverty. Likewise, among single-mother households, those with 3 or 4 children have the highest poverty rate, with 16 households (11.1%) falling below the poverty line.
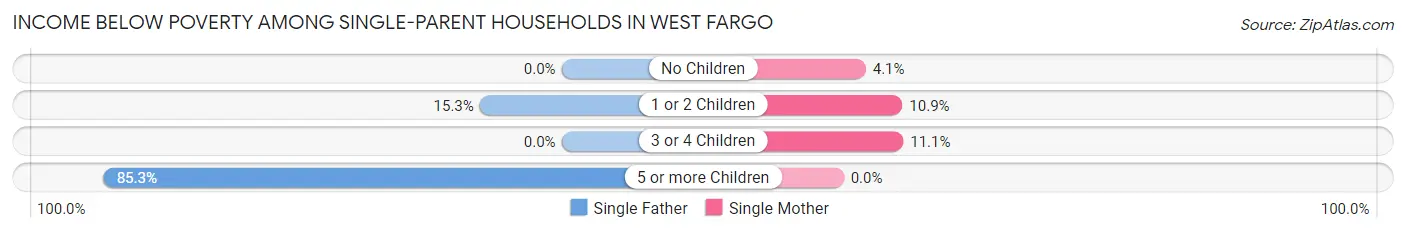
| Children | Single Father | Single Mother |
| No Children | 0 (0.0%) | 15 (4.1%) |
| 1 or 2 Children | 34 (15.2%) | 70 (10.9%) |
| 3 or 4 Children | 0 (0.0%) | 16 (11.1%) |
| 5 or more Children | 52 (85.3%) | 0 (0.0%) |
| Total | 86 (19.8%) | 101 (8.8%) |
Income Below Poverty Among Married-Couple vs Single-Parent Households in West Fargo
The poverty data for West Fargo shows that 105 of the married-couple family households (1.3%) and 187 of the single-parent households (11.8%) are living below the poverty level. Within the married-couple family households, those with no children have the highest poverty rate, with 74 households (1.8%) falling below the poverty line. Among the single-parent households, those with 5 or more children have the highest poverty rate, with 52 household (85.3%) living below poverty.
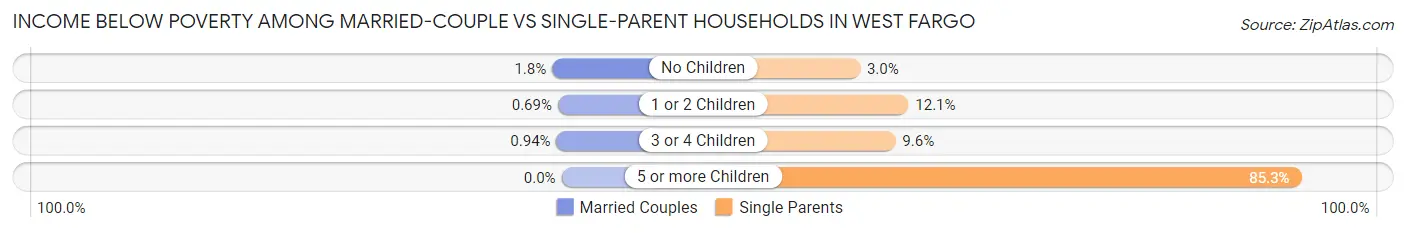
| Children | Married-Couple Families | Single-Parent Households |
| No Children | 74 (1.8%) | 15 (3.0%) |
| 1 or 2 Children | 21 (0.7%) | 104 (12.0%) |
| 3 or 4 Children | 10 (0.9%) | 16 (9.6%) |
| 5 or more Children | 0 (0.0%) | 52 (85.3%) |
| Total | 105 (1.3%) | 187 (11.8%) |
Employment Characteristics in West Fargo
Employment by Class of Employer in West Fargo
Among the 22,891 employed individuals in West Fargo, private company employees (15,621 | 68.2%), not-for-profit organizations (3,504 | 15.3%), and local government employees (1,477 | 6.5%) make up the most common classes of employment.
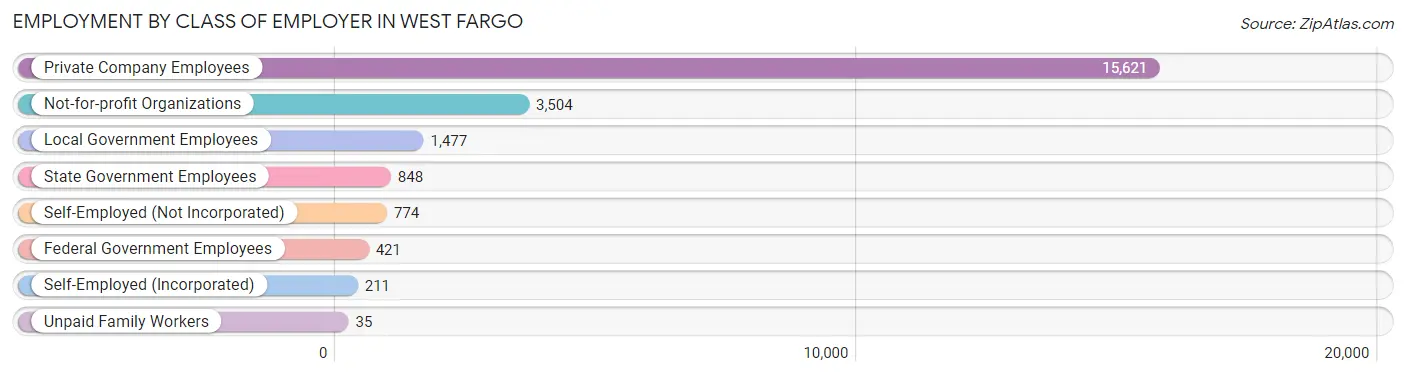
| Employer Class | # Employees | % Employees |
| Private Company Employees | 15,621 | 68.2% |
| Self-Employed (Incorporated) | 211 | 0.9% |
| Self-Employed (Not Incorporated) | 774 | 3.4% |
| Not-for-profit Organizations | 3,504 | 15.3% |
| Local Government Employees | 1,477 | 6.5% |
| State Government Employees | 848 | 3.7% |
| Federal Government Employees | 421 | 1.8% |
| Unpaid Family Workers | 35 | 0.2% |
| Total | 22,891 | 100.0% |
Employment Status by Age in West Fargo
According to the labor force statistics for West Fargo, out of the total population over 16 years of age (29,158), 80.1% or 23,356 individuals are in the labor force, with 0.8% or 187 of them unemployed. The age group with the highest labor force participation rate is 30 to 34 years, with 97.5% or 3,276 individuals in the labor force. Within the labor force, the 16 to 19 years age range has the highest percentage of unemployed individuals, with 7.9% or 81 of them being unemployed.
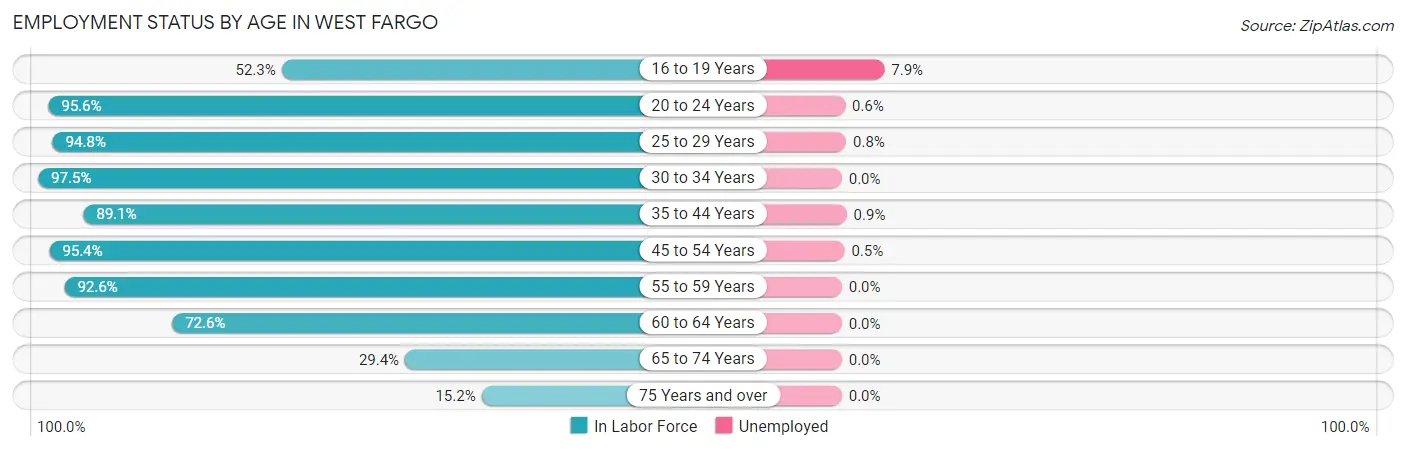
| Age Bracket | In Labor Force | Unemployed |
| 16 to 19 Years | 1,029 (52.3%) | 81 (7.9%) |
| 20 to 24 Years | 2,820 (95.6%) | 17 (0.6%) |
| 25 to 29 Years | 3,242 (94.8%) | 26 (0.8%) |
| 30 to 34 Years | 3,276 (97.5%) | 0 (0.0%) |
| 35 to 44 Years | 5,402 (89.1%) | 49 (0.9%) |
| 45 to 54 Years | 3,855 (95.4%) | 19 (0.5%) |
| 55 to 59 Years | 1,657 (92.6%) | 0 (0.0%) |
| 60 to 64 Years | 1,109 (72.6%) | 0 (0.0%) |
| 65 to 74 Years | 709 (29.4%) | 0 (0.0%) |
| 75 Years and over | 248 (15.2%) | 0 (0.0%) |
| Total | 23,356 (80.1%) | 187 (0.8%) |
Employment Status by Educational Attainment in West Fargo
According to labor force statistics for West Fargo, 91.8% of individuals (18,544) out of the total population between 25 and 64 years of age (20,200) are in the labor force, with 0.5% or 93 of them being unemployed. The group with the highest labor force participation rate are those with the educational attainment of college / associate degree, with 92.9% or 6,147 individuals in the labor force. Within the labor force, individuals with college / associate degree education have the highest percentage of unemployment, with 1.1% or 68 of them being unemployed.
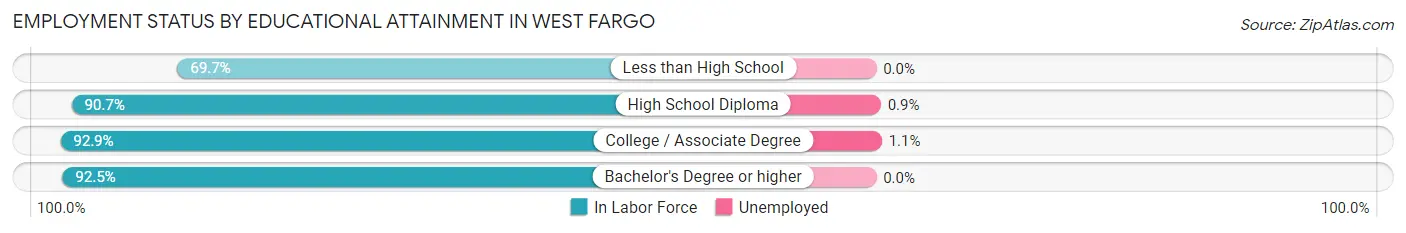
| Educational Attainment | In Labor Force | Unemployed |
| Less than High School | 325 (69.7%) | 0 (0.0%) |
| High School Diploma | 2,983 (90.7%) | 30 (0.9%) |
| College / Associate Degree | 6,147 (92.9%) | 73 (1.1%) |
| Bachelor's Degree or higher | 9,091 (92.5%) | 0 (0.0%) |
| Total | 18,544 (91.8%) | 101 (0.5%) |
Employment Occupations by Sex in West Fargo
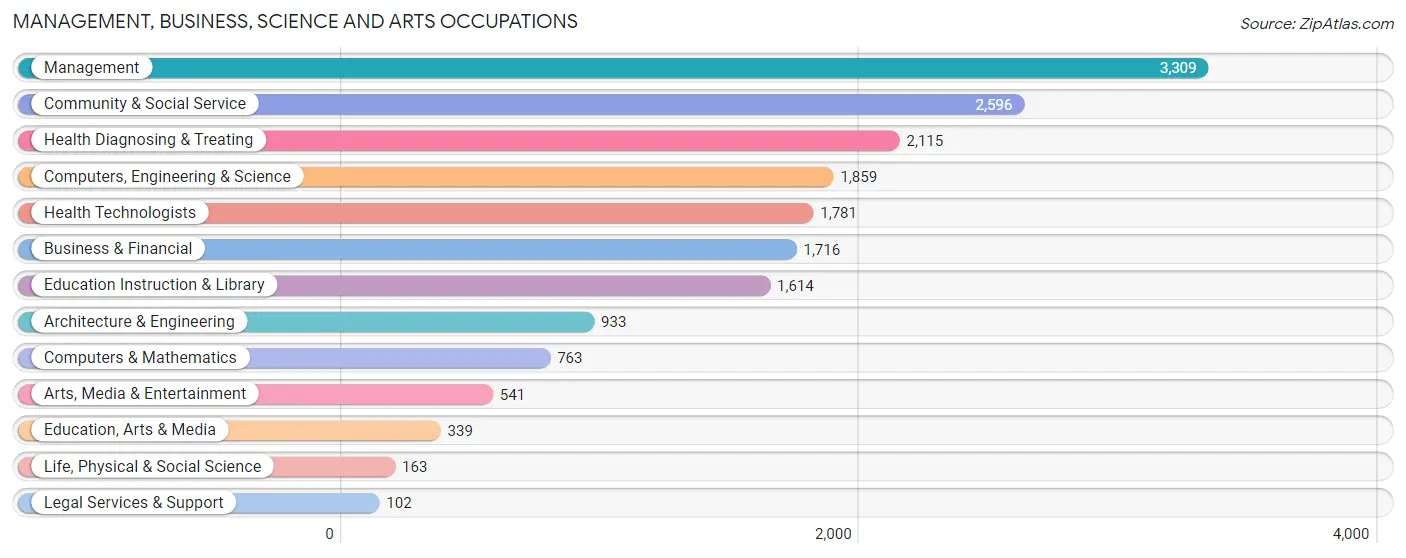
Management, Business, Science and Arts Occupations
The most common Management, Business, Science and Arts occupations in West Fargo are Management (3,309 | 14.3%), Community & Social Service (2,596 | 11.3%), Health Diagnosing & Treating (2,115 | 9.2%), Computers, Engineering & Science (1,859 | 8.1%), and Health Technologists (1,781 | 7.7%).
Management, Business, Science and Arts Occupations by Sex
Within the Management, Business, Science and Arts occupations in West Fargo, the most male-oriented occupations are Architecture & Engineering (98.0%), Computers, Engineering & Science (83.0%), and Computers & Mathematics (71.6%), while the most female-oriented occupations are Education, Arts & Media (97.4%), Education Instruction & Library (84.8%), and Community & Social Service (80.5%).
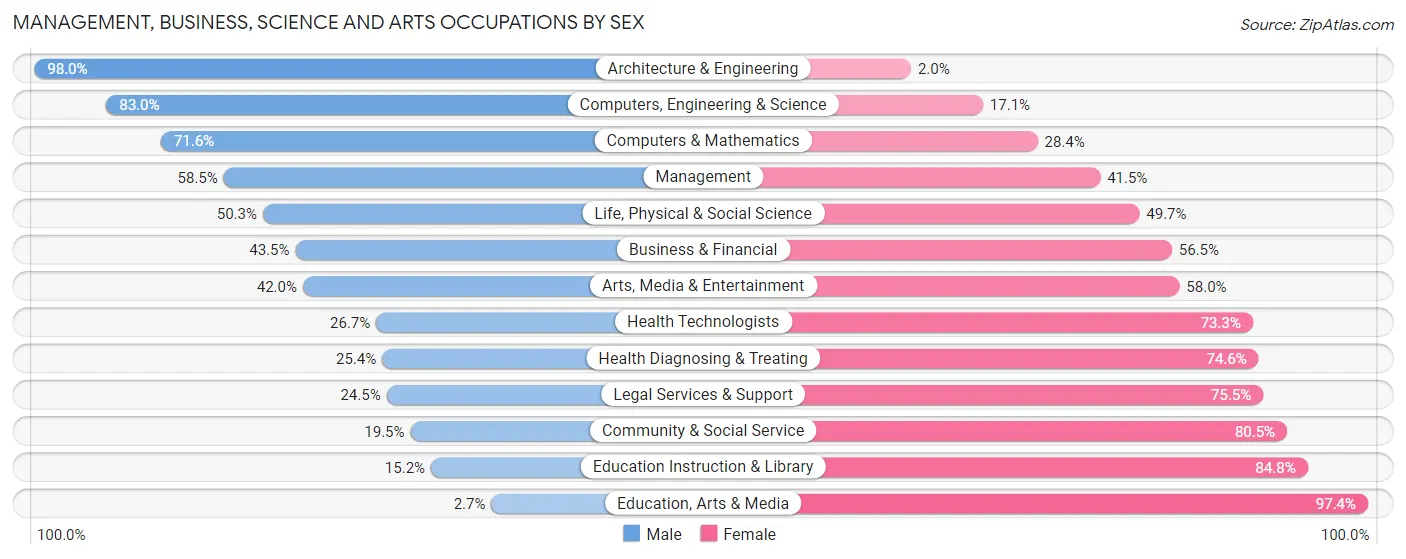
| Occupation | Male | Female |
| Management | 1,935 (58.5%) | 1,374 (41.5%) |
| Business & Financial | 747 (43.5%) | 969 (56.5%) |
| Computers, Engineering & Science | 1,542 (83.0%) | 317 (17.1%) |
| Computers & Mathematics | 546 (71.6%) | 217 (28.4%) |
| Architecture & Engineering | 914 (98.0%) | 19 (2.0%) |
| Life, Physical & Social Science | 82 (50.3%) | 81 (49.7%) |
| Community & Social Service | 507 (19.5%) | 2,089 (80.5%) |
| Education, Arts & Media | 9 (2.6%) | 330 (97.4%) |
| Legal Services & Support | 25 (24.5%) | 77 (75.5%) |
| Education Instruction & Library | 246 (15.2%) | 1,368 (84.8%) |
| Arts, Media & Entertainment | 227 (42.0%) | 314 (58.0%) |
| Health Diagnosing & Treating | 538 (25.4%) | 1,577 (74.6%) |
| Health Technologists | 475 (26.7%) | 1,306 (73.3%) |
| Total (Category) | 5,269 (45.4%) | 6,326 (54.6%) |
| Total (Overall) | 11,906 (51.6%) | 11,149 (48.4%) |
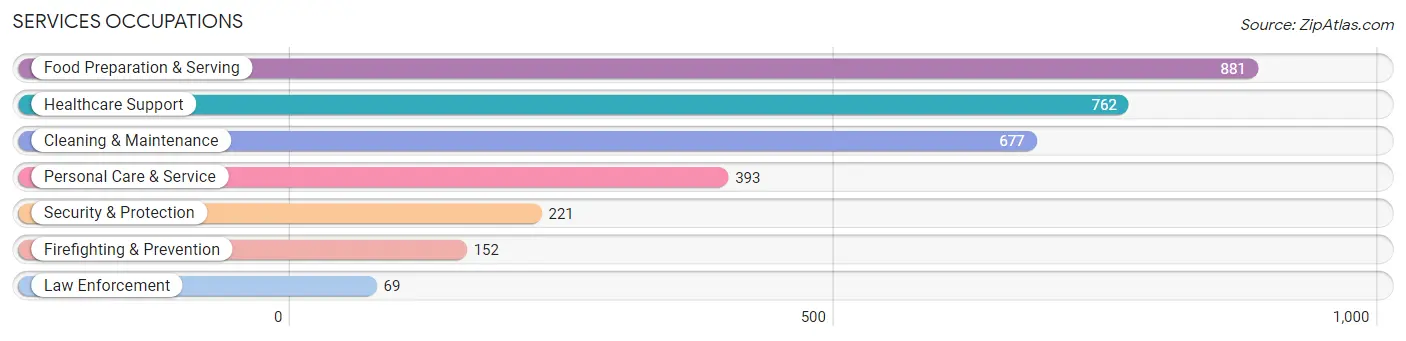
Services Occupations
The most common Services occupations in West Fargo are Food Preparation & Serving (881 | 3.8%), Healthcare Support (762 | 3.3%), Cleaning & Maintenance (677 | 2.9%), Personal Care & Service (393 | 1.7%), and Security & Protection (221 | 1.0%).
Services Occupations by Sex
Within the Services occupations in West Fargo, the most male-oriented occupations are Law Enforcement (100.0%), Security & Protection (74.2%), and Firefighting & Prevention (62.5%), while the most female-oriented occupations are Healthcare Support (90.8%), Personal Care & Service (82.4%), and Food Preparation & Serving (54.6%).
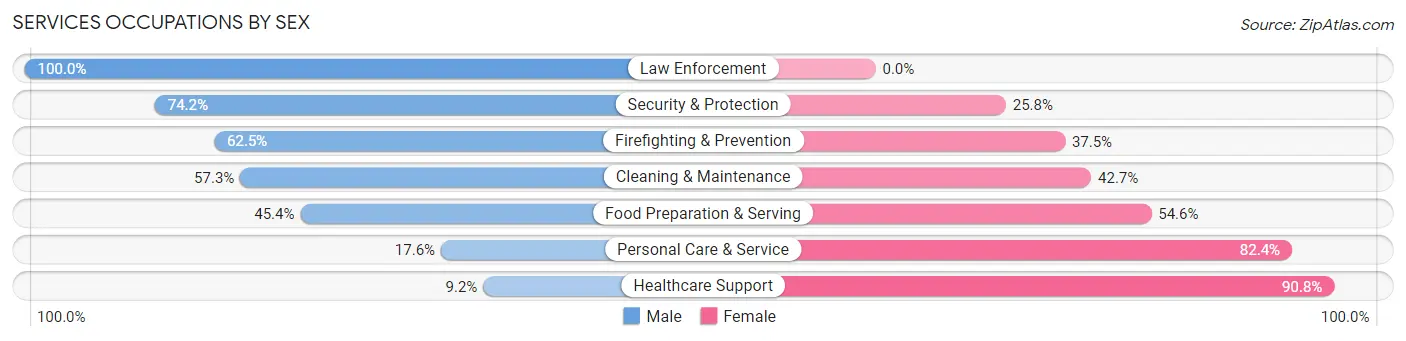
| Occupation | Male | Female |
| Healthcare Support | 70 (9.2%) | 692 (90.8%) |
| Security & Protection | 164 (74.2%) | 57 (25.8%) |
| Firefighting & Prevention | 95 (62.5%) | 57 (37.5%) |
| Law Enforcement | 69 (100.0%) | 0 (0.0%) |
| Food Preparation & Serving | 400 (45.4%) | 481 (54.6%) |
| Cleaning & Maintenance | 388 (57.3%) | 289 (42.7%) |
| Personal Care & Service | 69 (17.6%) | 324 (82.4%) |
| Total (Category) | 1,091 (37.2%) | 1,843 (62.8%) |
| Total (Overall) | 11,906 (51.6%) | 11,149 (48.4%) |
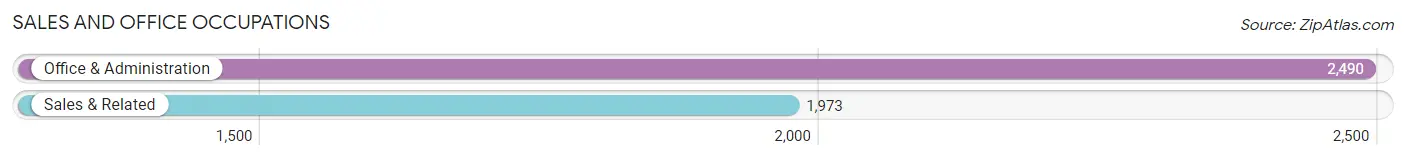
Sales and Office Occupations
The most common Sales and Office occupations in West Fargo are Office & Administration (2,490 | 10.8%), and Sales & Related (1,973 | 8.6%).
Sales and Office Occupations by Sex
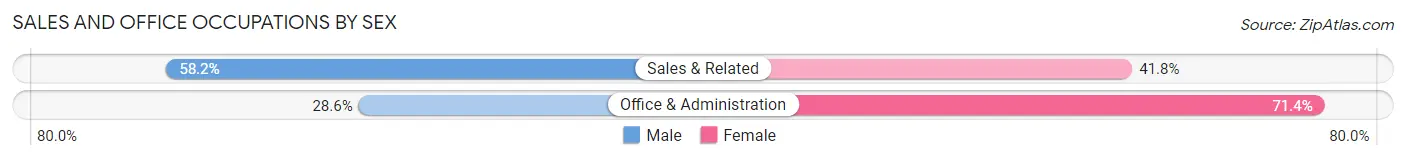
| Occupation | Male | Female |
| Sales & Related | 1,148 (58.2%) | 825 (41.8%) |
| Office & Administration | 713 (28.6%) | 1,777 (71.4%) |
| Total (Category) | 1,861 (41.7%) | 2,602 (58.3%) |
| Total (Overall) | 11,906 (51.6%) | 11,149 (48.4%) |
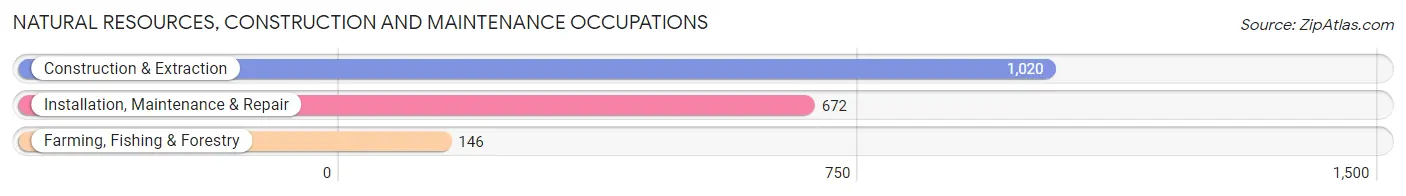
Natural Resources, Construction and Maintenance Occupations
The most common Natural Resources, Construction and Maintenance occupations in West Fargo are Construction & Extraction (1,020 | 4.4%), Installation, Maintenance & Repair (672 | 2.9%), and Farming, Fishing & Forestry (146 | 0.6%).
Natural Resources, Construction and Maintenance Occupations by Sex
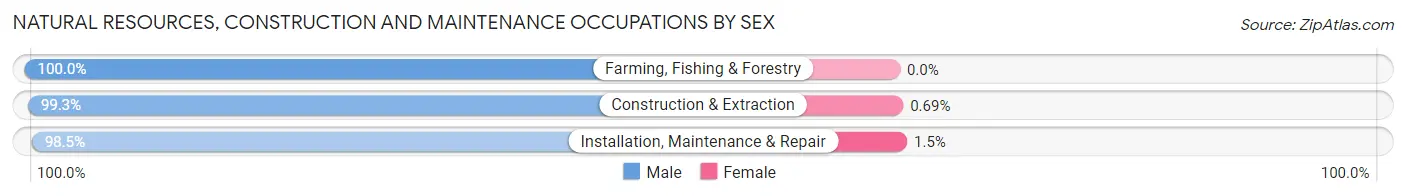
| Occupation | Male | Female |
| Farming, Fishing & Forestry | 146 (100.0%) | 0 (0.0%) |
| Construction & Extraction | 1,013 (99.3%) | 7 (0.7%) |
| Installation, Maintenance & Repair | 662 (98.5%) | 10 (1.5%) |
| Total (Category) | 1,821 (99.1%) | 17 (0.9%) |
| Total (Overall) | 11,906 (51.6%) | 11,149 (48.4%) |
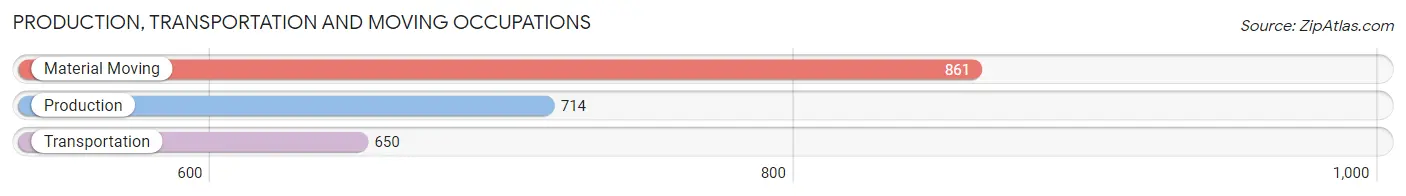
Production, Transportation and Moving Occupations
The most common Production, Transportation and Moving occupations in West Fargo are Material Moving (861 | 3.7%), Production (714 | 3.1%), and Transportation (650 | 2.8%).
Production, Transportation and Moving Occupations by Sex
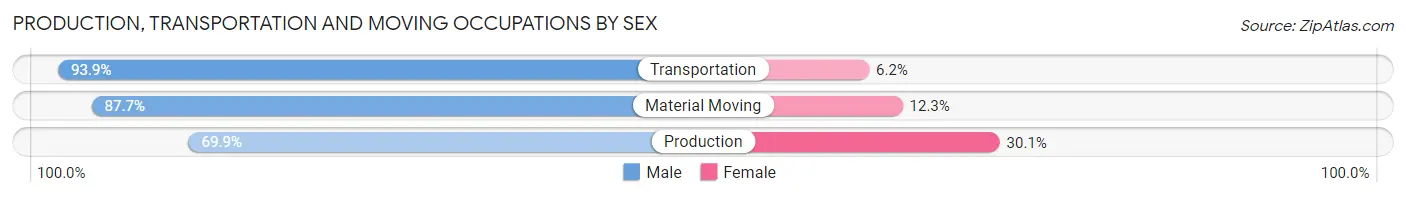
| Occupation | Male | Female |
| Production | 499 (69.9%) | 215 (30.1%) |
| Transportation | 610 (93.9%) | 40 (6.1%) |
| Material Moving | 755 (87.7%) | 106 (12.3%) |
| Total (Category) | 1,864 (83.8%) | 361 (16.2%) |
| Total (Overall) | 11,906 (51.6%) | 11,149 (48.4%) |
Employment Industries by Sex in West Fargo
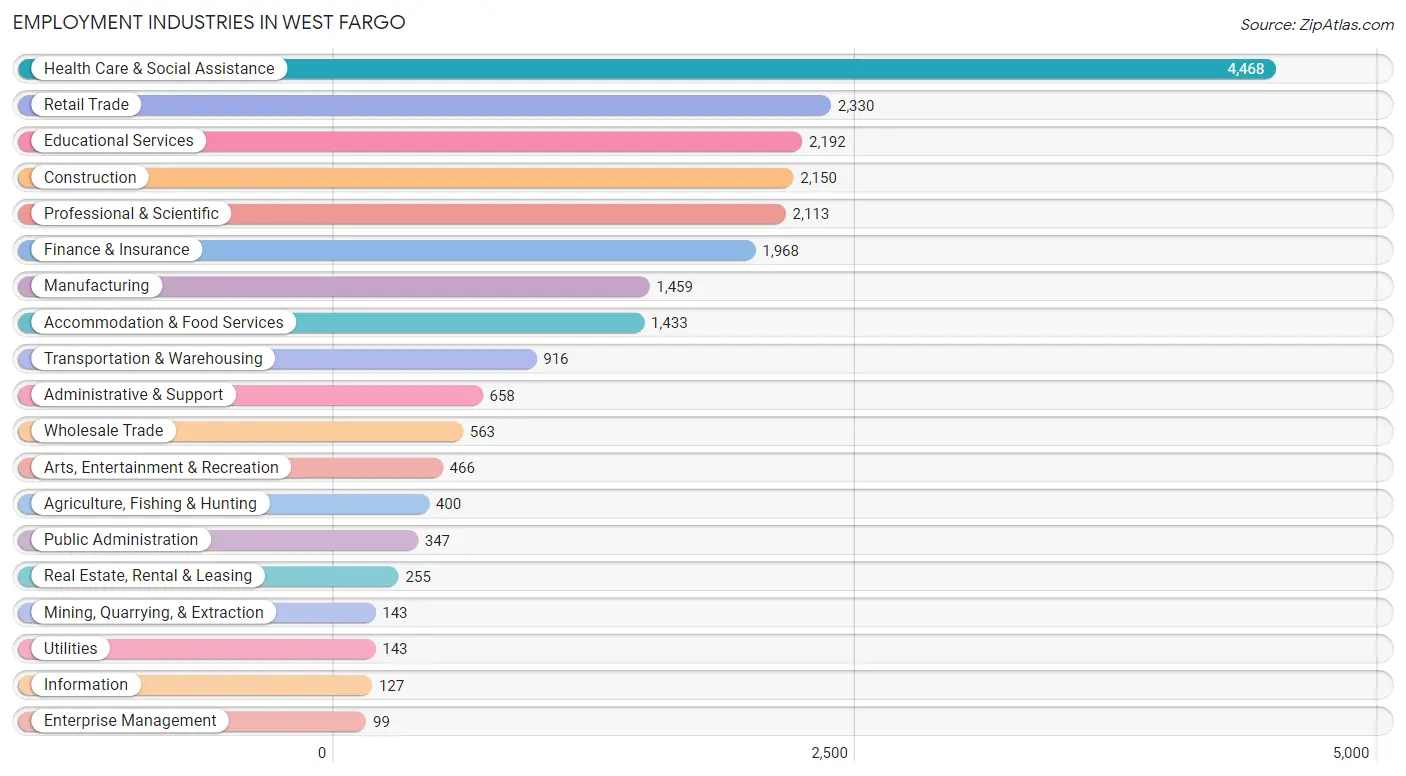
Employment Industries in West Fargo
The major employment industries in West Fargo include Health Care & Social Assistance (4,468 | 19.4%), Retail Trade (2,330 | 10.1%), Educational Services (2,192 | 9.5%), Construction (2,150 | 9.3%), and Professional & Scientific (2,113 | 9.2%).
Employment Industries by Sex in West Fargo
The West Fargo industries that see more men than women are Mining, Quarrying, & Extraction (100.0%), Transportation & Warehousing (92.2%), and Information (86.6%), whereas the industries that tend to have a higher number of women are Real Estate, Rental & Leasing (83.1%), Health Care & Social Assistance (78.4%), and Educational Services (69.7%).
| Industry | Male | Female |
| Agriculture, Fishing & Hunting | 341 (85.3%) | 59 (14.7%) |
| Mining, Quarrying, & Extraction | 143 (100.0%) | 0 (0.0%) |
| Construction | 1,776 (82.6%) | 374 (17.4%) |
| Manufacturing | 1,088 (74.6%) | 371 (25.4%) |
| Wholesale Trade | 379 (67.3%) | 184 (32.7%) |
| Retail Trade | 1,395 (59.9%) | 935 (40.1%) |
| Transportation & Warehousing | 845 (92.2%) | 71 (7.7%) |
| Utilities | 64 (44.8%) | 79 (55.2%) |
| Information | 110 (86.6%) | 17 (13.4%) |
| Finance & Insurance | 780 (39.6%) | 1,188 (60.4%) |
| Real Estate, Rental & Leasing | 43 (16.9%) | 212 (83.1%) |
| Professional & Scientific | 1,532 (72.5%) | 581 (27.5%) |
| Enterprise Management | 45 (45.5%) | 54 (54.5%) |
| Administrative & Support | 306 (46.5%) | 352 (53.5%) |
| Educational Services | 665 (30.3%) | 1,527 (69.7%) |
| Health Care & Social Assistance | 967 (21.6%) | 3,501 (78.4%) |
| Arts, Entertainment & Recreation | 329 (70.6%) | 137 (29.4%) |
| Accommodation & Food Services | 586 (40.9%) | 847 (59.1%) |
| Public Administration | 171 (49.3%) | 176 (50.7%) |
| Total | 11,906 (51.6%) | 11,149 (48.4%) |
Education in West Fargo
School Enrollment in West Fargo
The most common levels of schooling among the 10,629 students in West Fargo are middle school (2,486 | 23.4%), elementary school (2,328 | 21.9%), and college / undergraduate (2,097 | 19.7%).
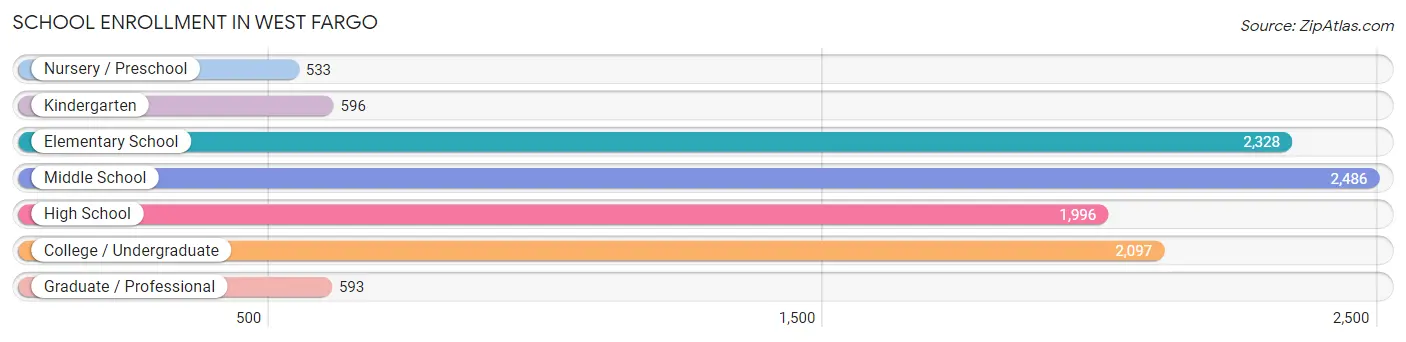
| School Level | # Students | % Students |
| Nursery / Preschool | 533 | 5.0% |
| Kindergarten | 596 | 5.6% |
| Elementary School | 2,328 | 21.9% |
| Middle School | 2,486 | 23.4% |
| High School | 1,996 | 18.8% |
| College / Undergraduate | 2,097 | 19.7% |
| Graduate / Professional | 593 | 5.6% |
| Total | 10,629 | 100.0% |
School Enrollment by Age by Funding Source in West Fargo
Out of a total of 10,629 students who are enrolled in schools in West Fargo, 1,244 (11.7%) attend a private institution, while the remaining 9,385 (88.3%) are enrolled in public schools. The age group of 3 to 4 year olds has the highest likelihood of being enrolled in private schools, with 200 (57.6% in the age bracket) enrolled. Conversely, the age group of 18 to 19 year olds has the lowest likelihood of being enrolled in a private school, with 649 (96.6% in the age bracket) attending a public institution.
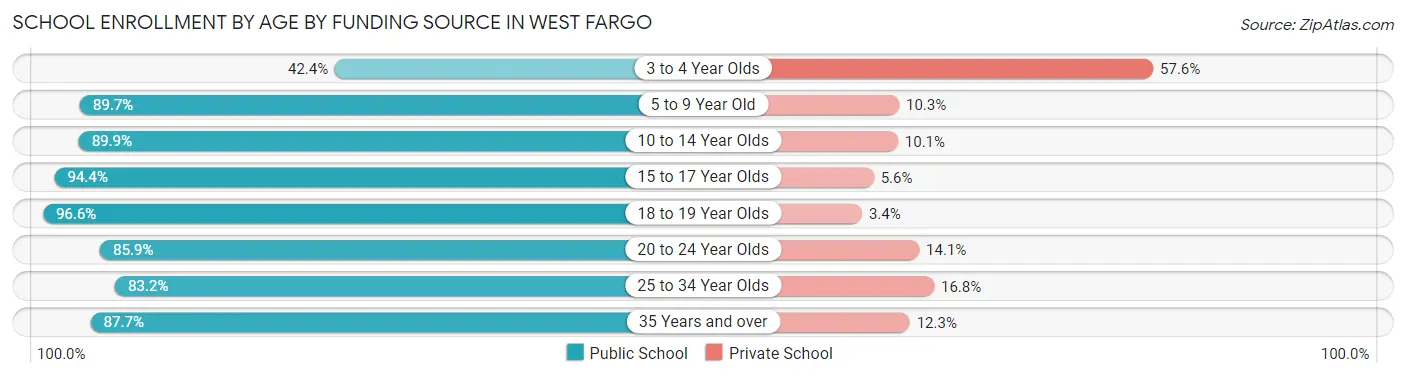
| Age Bracket | Public School | Private School |
| 3 to 4 Year Olds | 147 (42.4%) | 200 (57.6%) |
| 5 to 9 Year Old | 2,506 (89.7%) | 288 (10.3%) |
| 10 to 14 Year Olds | 2,575 (89.9%) | 289 (10.1%) |
| 15 to 17 Year Olds | 1,351 (94.4%) | 80 (5.6%) |
| 18 to 19 Year Olds | 649 (96.6%) | 23 (3.4%) |
| 20 to 24 Year Olds | 1,180 (85.9%) | 193 (14.1%) |
| 25 to 34 Year Olds | 563 (83.2%) | 114 (16.8%) |
| 35 Years and over | 413 (87.7%) | 58 (12.3%) |
| Total | 9,385 (88.3%) | 1,244 (11.7%) |
Educational Attainment by Field of Study in West Fargo
Business (2,705 | 23.0%), science & technology (2,055 | 17.4%), education (1,215 | 10.3%), arts & humanities (1,209 | 10.3%), and bio, nature & agricultural (1,075 | 9.1%) are the most common fields of study among 11,786 individuals in West Fargo who have obtained a bachelor's degree or higher.
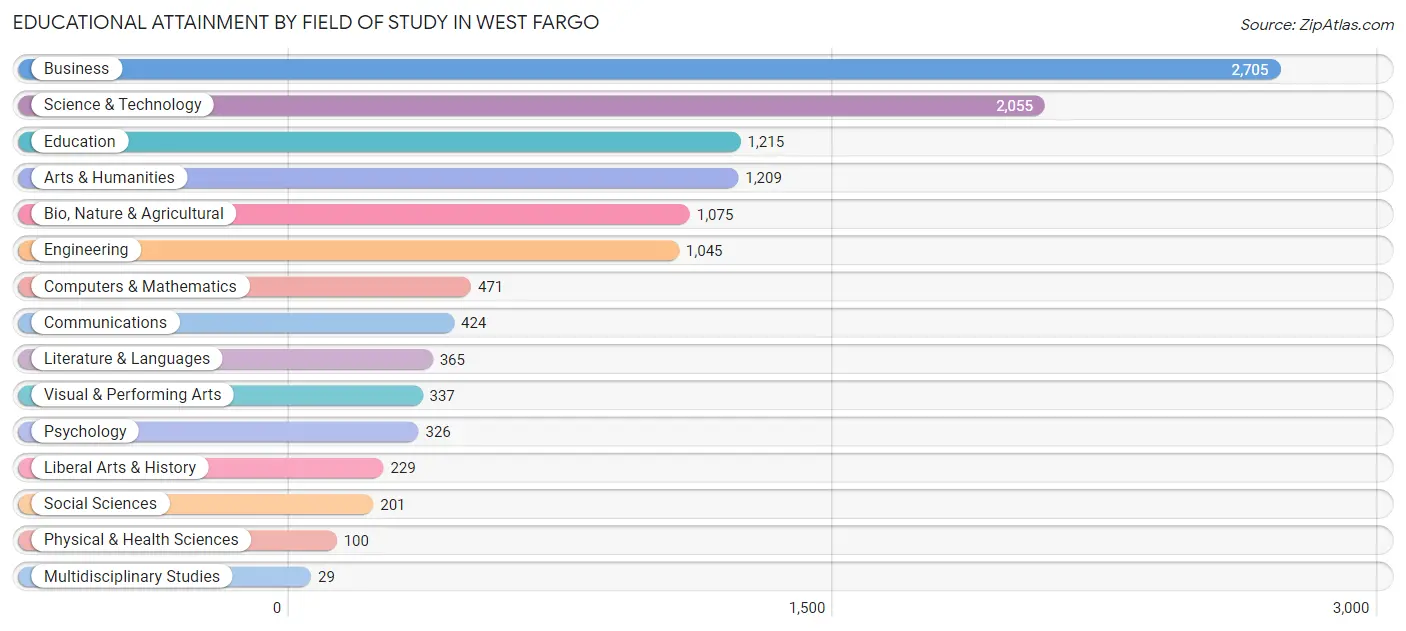
| Field of Study | # Graduates | % Graduates |
| Computers & Mathematics | 471 | 4.0% |
| Bio, Nature & Agricultural | 1,075 | 9.1% |
| Physical & Health Sciences | 100 | 0.9% |
| Psychology | 326 | 2.8% |
| Social Sciences | 201 | 1.7% |
| Engineering | 1,045 | 8.9% |
| Multidisciplinary Studies | 29 | 0.3% |
| Science & Technology | 2,055 | 17.4% |
| Business | 2,705 | 23.0% |
| Education | 1,215 | 10.3% |
| Literature & Languages | 365 | 3.1% |
| Liberal Arts & History | 229 | 1.9% |
| Visual & Performing Arts | 337 | 2.9% |
| Communications | 424 | 3.6% |
| Arts & Humanities | 1,209 | 10.3% |
| Total | 11,786 | 100.0% |
Transportation & Commute in West Fargo
Vehicle Availability by Sex in West Fargo
The most prevalent vehicle ownership categories in West Fargo are males with 2 vehicles (6,432, accounting for 54.3%) and females with 2 vehicles (6,388, making up 58.4%).
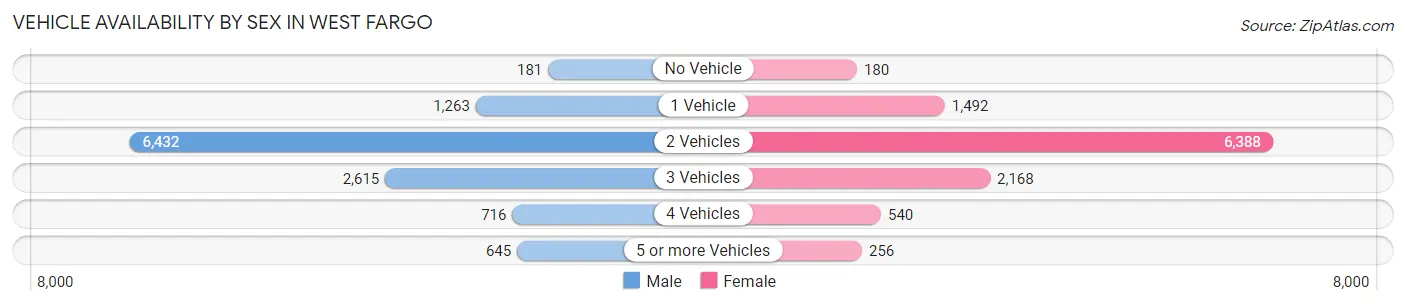
| Vehicles Available | Male | Female |
| No Vehicle | 181 (1.5%) | 180 (1.6%) |
| 1 Vehicle | 1,263 (10.7%) | 1,492 (13.5%) |
| 2 Vehicles | 6,432 (54.3%) | 6,388 (58.0%) |
| 3 Vehicles | 2,615 (22.1%) | 2,168 (19.7%) |
| 4 Vehicles | 716 (6.0%) | 540 (4.9%) |
| 5 or more Vehicles | 645 (5.4%) | 256 (2.3%) |
| Total | 11,852 (100.0%) | 11,024 (100.0%) |
Commute Time in West Fargo
The most frequently occuring commute durations in West Fargo are 15 to 19 minutes (6,869 commuters, 32.4%), 10 to 14 minutes (5,477 commuters, 25.8%), and 20 to 24 minutes (3,029 commuters, 14.3%).
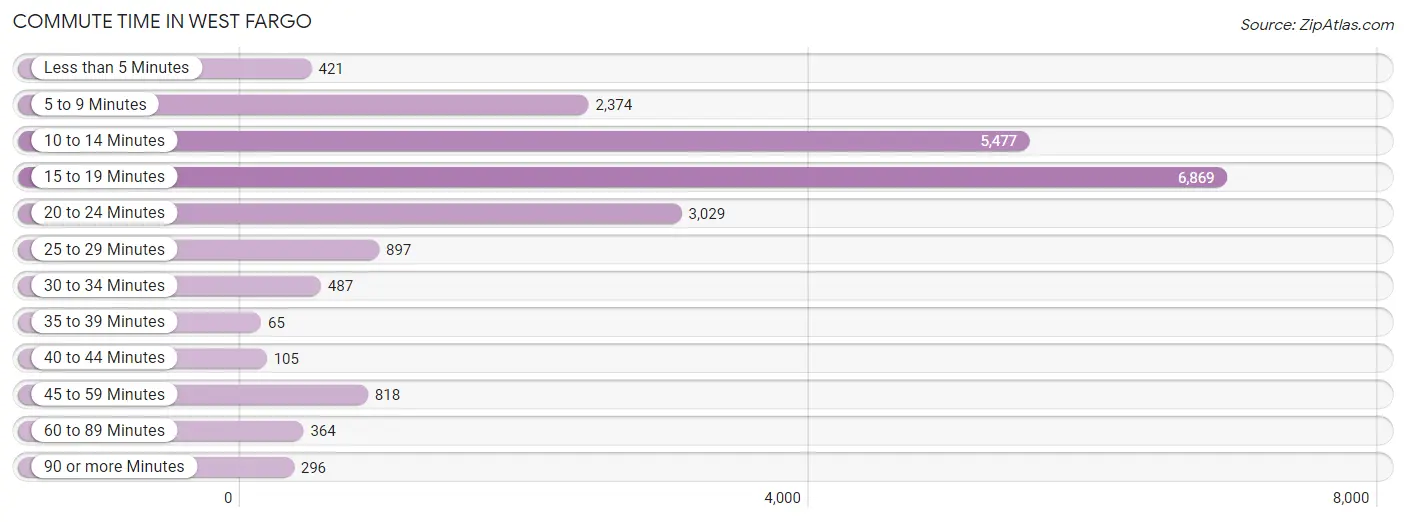
| Commute Time | # Commuters | % Commuters |
| Less than 5 Minutes | 421 | 2.0% |
| 5 to 9 Minutes | 2,374 | 11.2% |
| 10 to 14 Minutes | 5,477 | 25.8% |
| 15 to 19 Minutes | 6,869 | 32.4% |
| 20 to 24 Minutes | 3,029 | 14.3% |
| 25 to 29 Minutes | 897 | 4.2% |
| 30 to 34 Minutes | 487 | 2.3% |
| 35 to 39 Minutes | 65 | 0.3% |
| 40 to 44 Minutes | 105 | 0.5% |
| 45 to 59 Minutes | 818 | 3.9% |
| 60 to 89 Minutes | 364 | 1.7% |
| 90 or more Minutes | 296 | 1.4% |
Commute Time by Sex in West Fargo
The most common commute times in West Fargo are 15 to 19 minutes (3,683 commuters, 33.4%) for males and 15 to 19 minutes (3,186 commuters, 31.4%) for females.
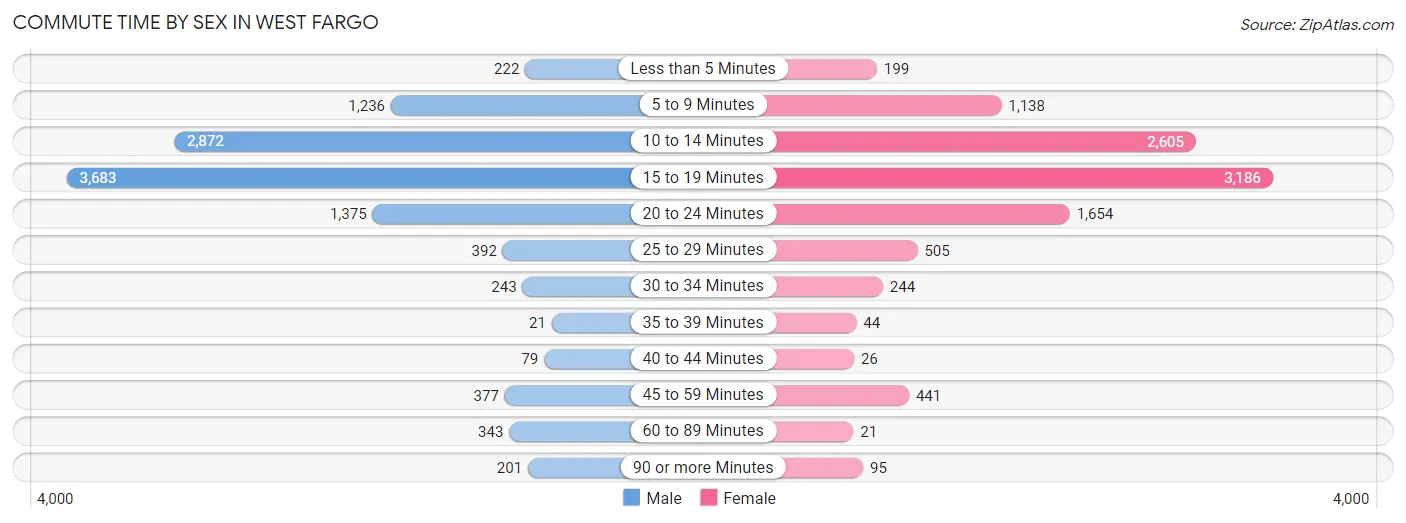
| Commute Time | Male | Female |
| Less than 5 Minutes | 222 (2.0%) | 199 (2.0%) |
| 5 to 9 Minutes | 1,236 (11.2%) | 1,138 (11.2%) |
| 10 to 14 Minutes | 2,872 (26.0%) | 2,605 (25.6%) |
| 15 to 19 Minutes | 3,683 (33.4%) | 3,186 (31.4%) |
| 20 to 24 Minutes | 1,375 (12.4%) | 1,654 (16.3%) |
| 25 to 29 Minutes | 392 (3.5%) | 505 (5.0%) |
| 30 to 34 Minutes | 243 (2.2%) | 244 (2.4%) |
| 35 to 39 Minutes | 21 (0.2%) | 44 (0.4%) |
| 40 to 44 Minutes | 79 (0.7%) | 26 (0.3%) |
| 45 to 59 Minutes | 377 (3.4%) | 441 (4.3%) |
| 60 to 89 Minutes | 343 (3.1%) | 21 (0.2%) |
| 90 or more Minutes | 201 (1.8%) | 95 (0.9%) |
Time of Departure to Work by Sex in West Fargo
The most frequent times of departure to work in West Fargo are 7:30 AM to 7:59 AM (2,179, 19.7%) for males and 7:30 AM to 7:59 AM (2,999, 29.5%) for females.
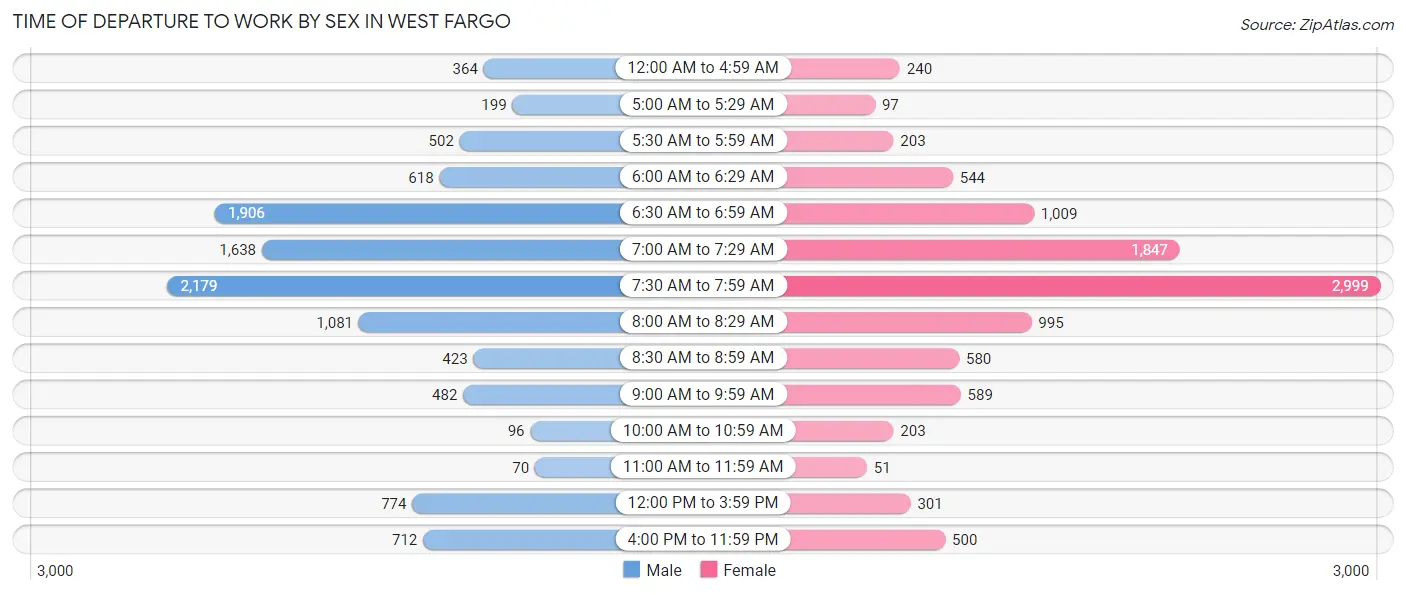
| Time of Departure | Male | Female |
| 12:00 AM to 4:59 AM | 364 (3.3%) | 240 (2.4%) |
| 5:00 AM to 5:29 AM | 199 (1.8%) | 97 (0.9%) |
| 5:30 AM to 5:59 AM | 502 (4.5%) | 203 (2.0%) |
| 6:00 AM to 6:29 AM | 618 (5.6%) | 544 (5.4%) |
| 6:30 AM to 6:59 AM | 1,906 (17.3%) | 1,009 (9.9%) |
| 7:00 AM to 7:29 AM | 1,638 (14.8%) | 1,847 (18.2%) |
| 7:30 AM to 7:59 AM | 2,179 (19.7%) | 2,999 (29.5%) |
| 8:00 AM to 8:29 AM | 1,081 (9.8%) | 995 (9.8%) |
| 8:30 AM to 8:59 AM | 423 (3.8%) | 580 (5.7%) |
| 9:00 AM to 9:59 AM | 482 (4.4%) | 589 (5.8%) |
| 10:00 AM to 10:59 AM | 96 (0.9%) | 203 (2.0%) |
| 11:00 AM to 11:59 AM | 70 (0.6%) | 51 (0.5%) |
| 12:00 PM to 3:59 PM | 774 (7.0%) | 301 (3.0%) |
| 4:00 PM to 11:59 PM | 712 (6.5%) | 500 (4.9%) |
| Total | 11,044 (100.0%) | 10,158 (100.0%) |
Housing Occupancy in West Fargo
Occupancy by Ownership in West Fargo
Of the total 15,103 dwellings in West Fargo, owner-occupied units account for 9,935 (65.8%), while renter-occupied units make up 5,168 (34.2%).
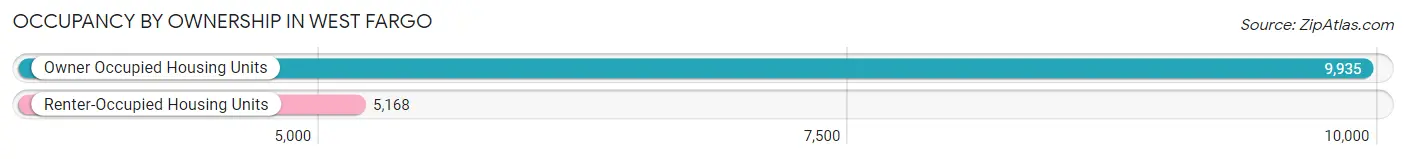
| Occupancy | # Housing Units | % Housing Units |
| Owner Occupied Housing Units | 9,935 | 65.8% |
| Renter-Occupied Housing Units | 5,168 | 34.2% |
| Total Occupied Housing Units | 15,103 | 100.0% |
Occupancy by Household Size in West Fargo
| Household Size | # Housing Units | % Housing Units |
| 1-Person Household | 3,809 | 25.2% |
| 2-Person Household | 5,401 | 35.8% |
| 3-Person Household | 2,473 | 16.4% |
| 4+ Person Household | 3,420 | 22.6% |
| Total Housing Units | 15,103 | 100.0% |
Occupancy by Ownership by Household Size in West Fargo
| Household Size | Owner-occupied | Renter-occupied |
| 1-Person Household | 1,426 (37.4%) | 2,383 (62.6%) |
| 2-Person Household | 3,855 (71.4%) | 1,546 (28.6%) |
| 3-Person Household | 1,848 (74.7%) | 625 (25.3%) |
| 4+ Person Household | 2,806 (82.1%) | 614 (17.9%) |
| Total Housing Units | 9,935 (65.8%) | 5,168 (34.2%) |
Occupancy by Educational Attainment in West Fargo
| Household Size | Owner-occupied | Renter-occupied |
| Less than High School | 99 (35.6%) | 179 (64.4%) |
| High School Diploma | 1,216 (52.0%) | 1,123 (48.0%) |
| College/Associate Degree | 3,695 (69.6%) | 1,611 (30.4%) |
| Bachelor's Degree or higher | 4,925 (68.6%) | 2,255 (31.4%) |
Occupancy by Age of Householder in West Fargo
| Age Bracket | # Households | % Households |
| Under 35 Years | 4,982 | 33.0% |
| 35 to 44 Years | 3,383 | 22.4% |
| 45 to 54 Years | 2,010 | 13.3% |
| 55 to 64 Years | 2,005 | 13.3% |
| 65 to 74 Years | 1,500 | 9.9% |
| 75 to 84 Years | 885 | 5.9% |
| 85 Years and Over | 338 | 2.2% |
| Total | 15,103 | 100.0% |
Housing Finances in West Fargo
Median Income by Occupancy in West Fargo
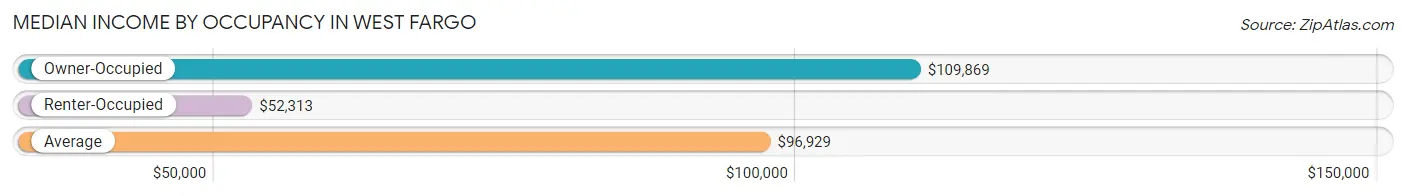
| Occupancy Type | # Households | Median Income |
| Owner-Occupied | 9,935 (65.8%) | $109,869 |
| Renter-Occupied | 5,168 (34.2%) | $52,313 |
| Average | 15,103 (100.0%) | $96,929 |
Occupancy by Householder Income Bracket in West Fargo
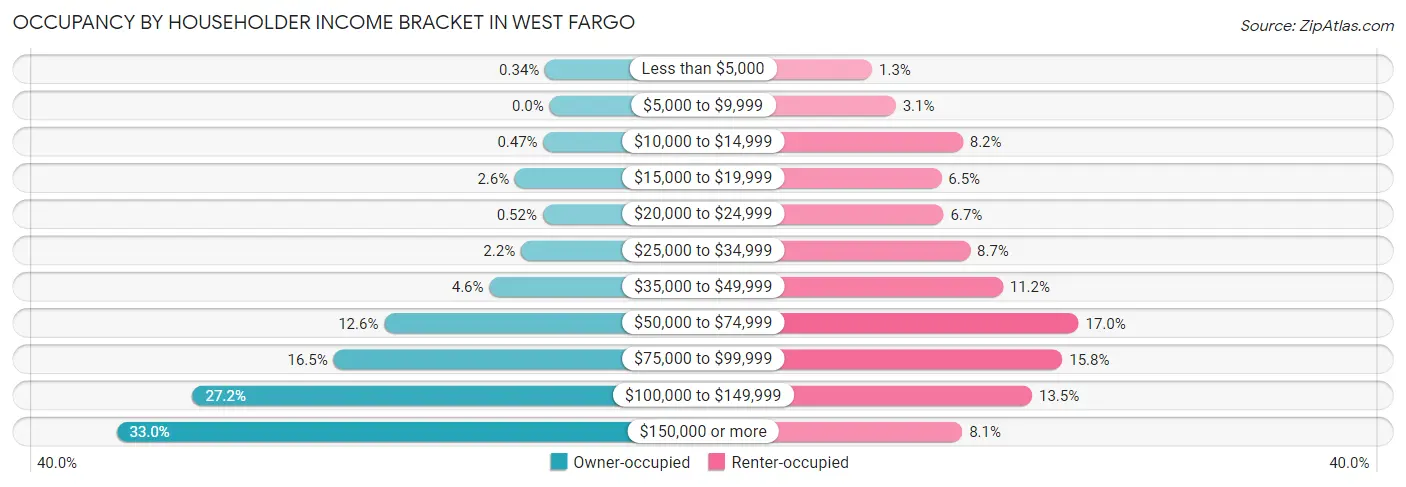
| Income Bracket | Owner-occupied | Renter-occupied |
| Less than $5,000 | 34 (0.3%) | 65 (1.3%) |
| $5,000 to $9,999 | 0 (0.0%) | 158 (3.1%) |
| $10,000 to $14,999 | 47 (0.5%) | 422 (8.2%) |
| $15,000 to $19,999 | 261 (2.6%) | 338 (6.5%) |
| $20,000 to $24,999 | 52 (0.5%) | 347 (6.7%) |
| $25,000 to $34,999 | 217 (2.2%) | 451 (8.7%) |
| $35,000 to $49,999 | 456 (4.6%) | 580 (11.2%) |
| $50,000 to $74,999 | 1,252 (12.6%) | 878 (17.0%) |
| $75,000 to $99,999 | 1,635 (16.5%) | 814 (15.8%) |
| $100,000 to $149,999 | 2,702 (27.2%) | 695 (13.5%) |
| $150,000 or more | 3,279 (33.0%) | 420 (8.1%) |
| Total | 9,935 (100.0%) | 5,168 (100.0%) |
Monthly Housing Cost Tiers in West Fargo
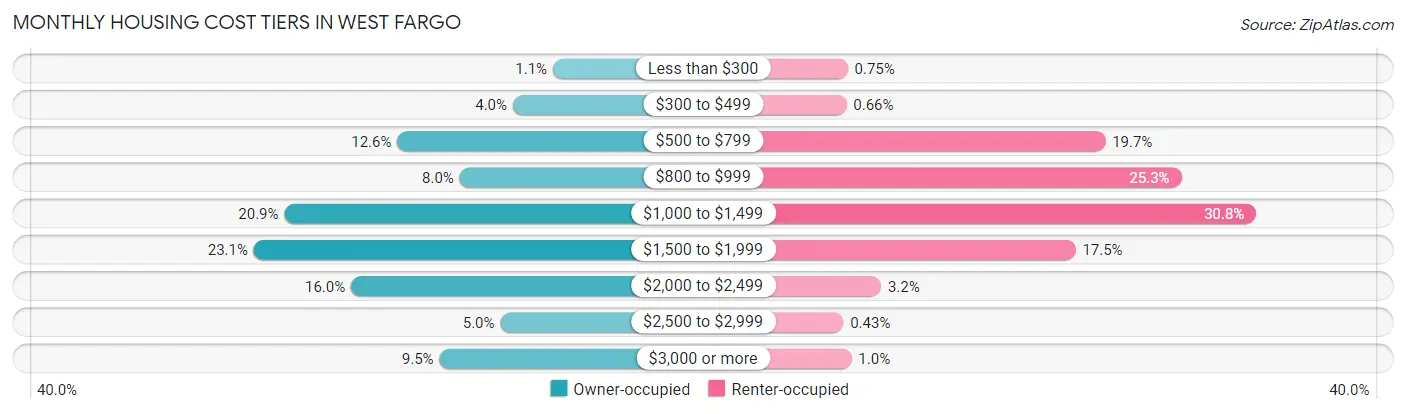
| Monthly Cost | Owner-occupied | Renter-occupied |
| Less than $300 | 108 (1.1%) | 39 (0.7%) |
| $300 to $499 | 401 (4.0%) | 34 (0.7%) |
| $500 to $799 | 1,247 (12.6%) | 1,019 (19.7%) |
| $800 to $999 | 791 (8.0%) | 1,309 (25.3%) |
| $1,000 to $1,499 | 2,073 (20.9%) | 1,594 (30.8%) |
| $1,500 to $1,999 | 2,297 (23.1%) | 906 (17.5%) |
| $2,000 to $2,499 | 1,586 (16.0%) | 166 (3.2%) |
| $2,500 to $2,999 | 493 (5.0%) | 22 (0.4%) |
| $3,000 or more | 939 (9.5%) | 53 (1.0%) |
| Total | 9,935 (100.0%) | 5,168 (100.0%) |
Physical Housing Characteristics in West Fargo
Housing Structures in West Fargo
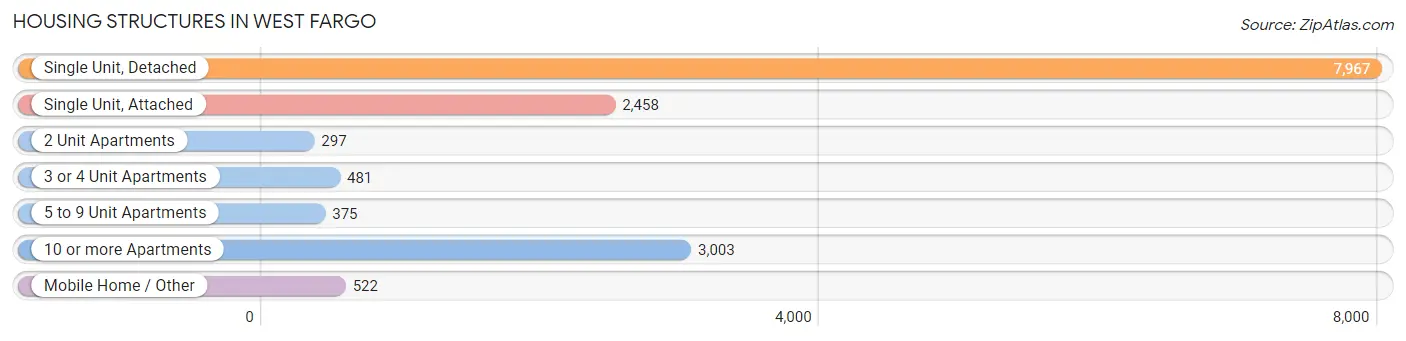
| Structure Type | # Housing Units | % Housing Units |
| Single Unit, Detached | 7,967 | 52.7% |
| Single Unit, Attached | 2,458 | 16.3% |
| 2 Unit Apartments | 297 | 2.0% |
| 3 or 4 Unit Apartments | 481 | 3.2% |
| 5 to 9 Unit Apartments | 375 | 2.5% |
| 10 or more Apartments | 3,003 | 19.9% |
| Mobile Home / Other | 522 | 3.5% |
| Total | 15,103 | 100.0% |
Housing Structures by Occupancy in West Fargo
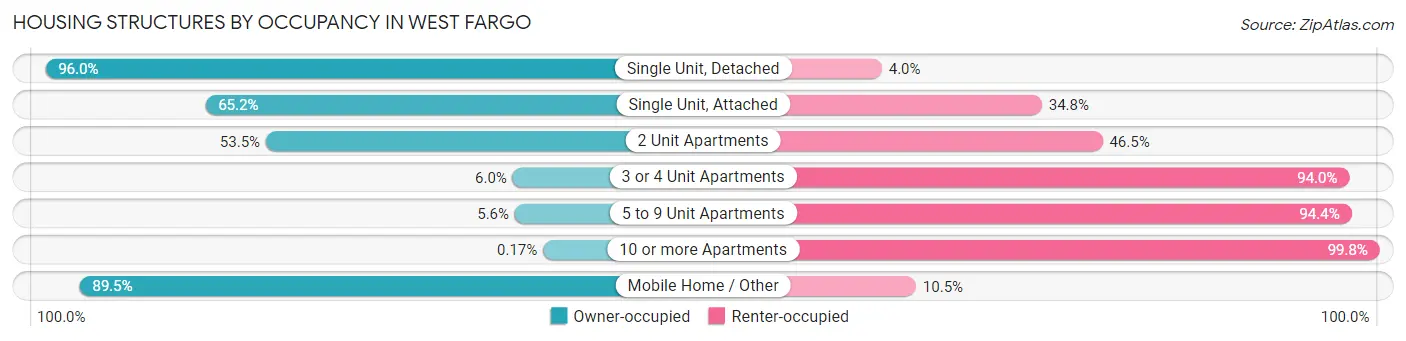
| Structure Type | Owner-occupied | Renter-occupied |
| Single Unit, Detached | 7,651 (96.0%) | 316 (4.0%) |
| Single Unit, Attached | 1,603 (65.2%) | 855 (34.8%) |
| 2 Unit Apartments | 159 (53.5%) | 138 (46.5%) |
| 3 or 4 Unit Apartments | 29 (6.0%) | 452 (94.0%) |
| 5 to 9 Unit Apartments | 21 (5.6%) | 354 (94.4%) |
| 10 or more Apartments | 5 (0.2%) | 2,998 (99.8%) |
| Mobile Home / Other | 467 (89.5%) | 55 (10.5%) |
| Total | 9,935 (65.8%) | 5,168 (34.2%) |
Housing Structures by Number of Rooms in West Fargo
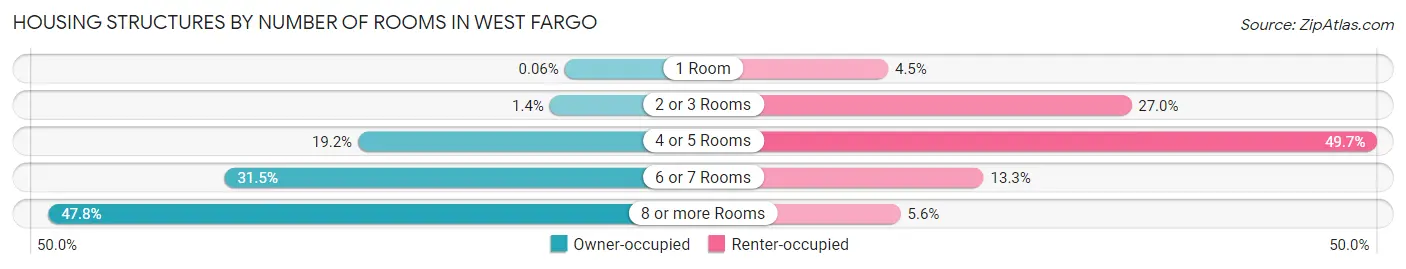
| Number of Rooms | Owner-occupied | Renter-occupied |
| 1 Room | 6 (0.1%) | 230 (4.4%) |
| 2 or 3 Rooms | 143 (1.4%) | 1,393 (27.0%) |
| 4 or 5 Rooms | 1,905 (19.2%) | 2,568 (49.7%) |
| 6 or 7 Rooms | 3,131 (31.5%) | 687 (13.3%) |
| 8 or more Rooms | 4,750 (47.8%) | 290 (5.6%) |
| Total | 9,935 (100.0%) | 5,168 (100.0%) |
Housing Structure by Heating Type in West Fargo
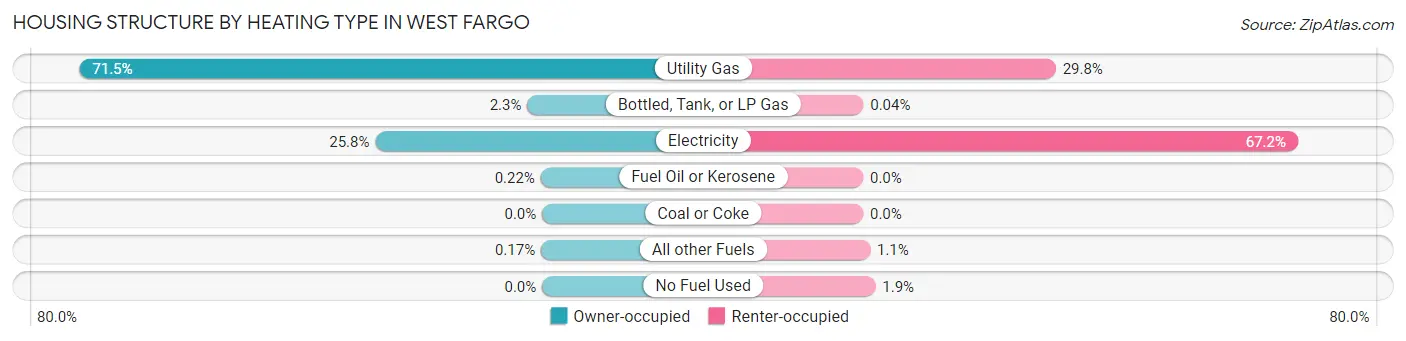
| Heating Type | Owner-occupied | Renter-occupied |
| Utility Gas | 7,107 (71.5%) | 1,539 (29.8%) |
| Bottled, Tank, or LP Gas | 228 (2.3%) | 2 (0.0%) |
| Electricity | 2,561 (25.8%) | 3,473 (67.2%) |
| Fuel Oil or Kerosene | 22 (0.2%) | 0 (0.0%) |
| Coal or Coke | 0 (0.0%) | 0 (0.0%) |
| All other Fuels | 17 (0.2%) | 56 (1.1%) |
| No Fuel Used | 0 (0.0%) | 98 (1.9%) |
| Total | 9,935 (100.0%) | 5,168 (100.0%) |
Household Vehicle Usage in West Fargo
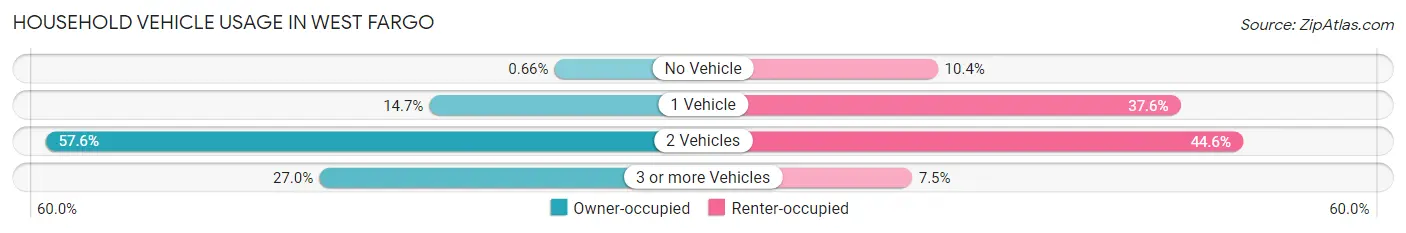
| Vehicles per Household | Owner-occupied | Renter-occupied |
| No Vehicle | 66 (0.7%) | 537 (10.4%) |
| 1 Vehicle | 1,458 (14.7%) | 1,941 (37.6%) |
| 2 Vehicles | 5,727 (57.6%) | 2,303 (44.6%) |
| 3 or more Vehicles | 2,684 (27.0%) | 387 (7.5%) |
| Total | 9,935 (100.0%) | 5,168 (100.0%) |
Real Estate & Mortgages in West Fargo
Real Estate and Mortgage Overview in West Fargo
| Characteristic | Without Mortgage | With Mortgage |
| Housing Units | 2,676 | 7,259 |
| Median Property Value | $266,800 | $286,800 |
| Median Household Income | $86,397 | $2,652 |
| Monthly Housing Costs | $716 | $939 |
| Real Estate Taxes | $3,618 | $49 |
Property Value by Mortgage Status in West Fargo
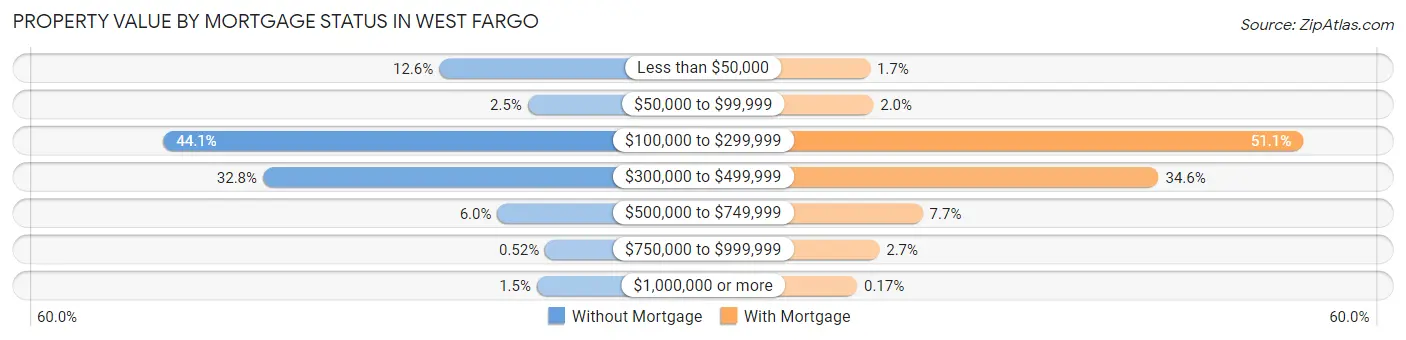
| Property Value | Without Mortgage | With Mortgage |
| Less than $50,000 | 338 (12.6%) | 120 (1.7%) |
| $50,000 to $99,999 | 67 (2.5%) | 147 (2.0%) |
| $100,000 to $299,999 | 1,181 (44.1%) | 3,712 (51.1%) |
| $300,000 to $499,999 | 877 (32.8%) | 2,514 (34.6%) |
| $500,000 to $749,999 | 160 (6.0%) | 557 (7.7%) |
| $750,000 to $999,999 | 14 (0.5%) | 197 (2.7%) |
| $1,000,000 or more | 39 (1.5%) | 12 (0.2%) |
| Total | 2,676 (100.0%) | 7,259 (100.0%) |
Household Income by Mortgage Status in West Fargo
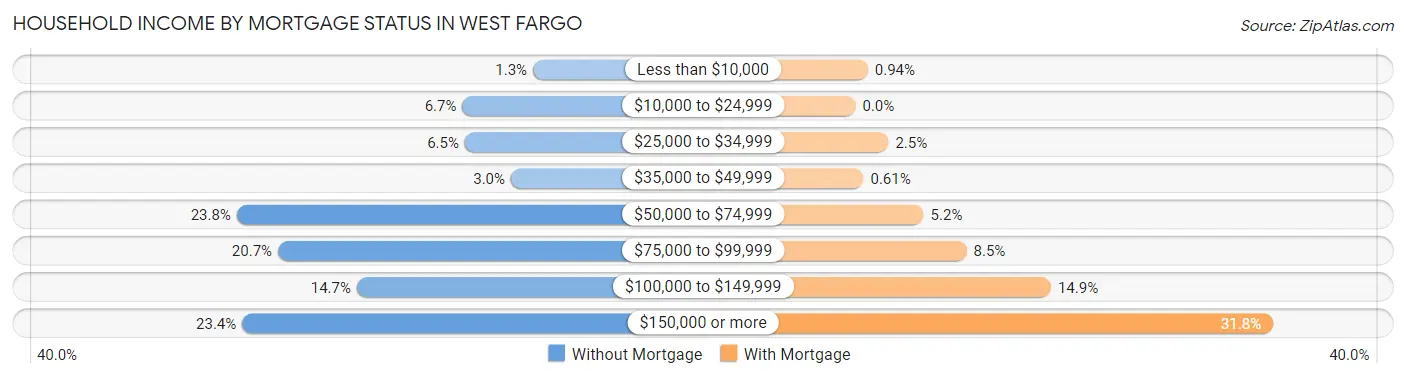
| Household Income | Without Mortgage | With Mortgage |
| Less than $10,000 | 34 (1.3%) | 68 (0.9%) |
| $10,000 to $24,999 | 178 (6.7%) | 0 (0.0%) |
| $25,000 to $34,999 | 173 (6.5%) | 182 (2.5%) |
| $35,000 to $49,999 | 79 (2.9%) | 44 (0.6%) |
| $50,000 to $74,999 | 638 (23.8%) | 377 (5.2%) |
| $75,000 to $99,999 | 554 (20.7%) | 614 (8.5%) |
| $100,000 to $149,999 | 393 (14.7%) | 1,081 (14.9%) |
| $150,000 or more | 627 (23.4%) | 2,309 (31.8%) |
| Total | 2,676 (100.0%) | 7,259 (100.0%) |
Property Value to Household Income Ratio in West Fargo
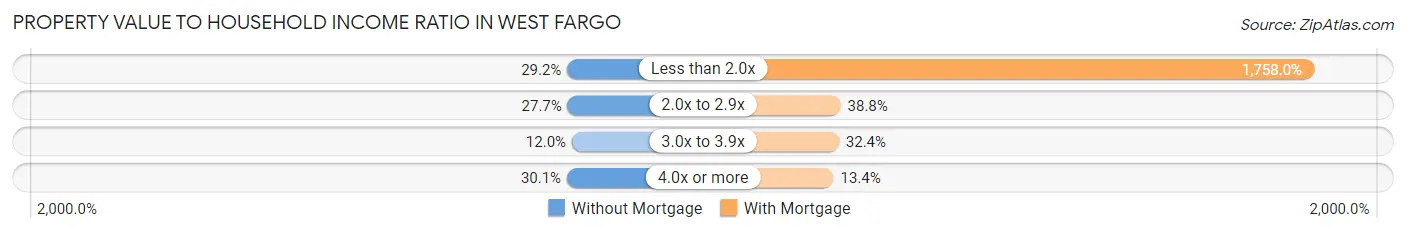
| Value-to-Income Ratio | Without Mortgage | With Mortgage |
| Less than 2.0x | 782 (29.2%) | 127,611 (1,758.0%) |
| 2.0x to 2.9x | 742 (27.7%) | 2,817 (38.8%) |
| 3.0x to 3.9x | 322 (12.0%) | 2,354 (32.4%) |
| 4.0x or more | 805 (30.1%) | 975 (13.4%) |
| Total | 2,676 (100.0%) | 7,259 (100.0%) |
Real Estate Taxes by Mortgage Status in West Fargo

| Property Taxes | Without Mortgage | With Mortgage |
| Less than $800 | 302 (11.3%) | 0 (0.0%) |
| $800 to $1,499 | 115 (4.3%) | 341 (4.7%) |
| $800 to $1,499 | 2,191 (81.9%) | 265 (3.6%) |
| Total | 2,676 (100.0%) | 7,259 (100.0%) |
Health & Disability in West Fargo
Health Insurance Coverage by Age in West Fargo
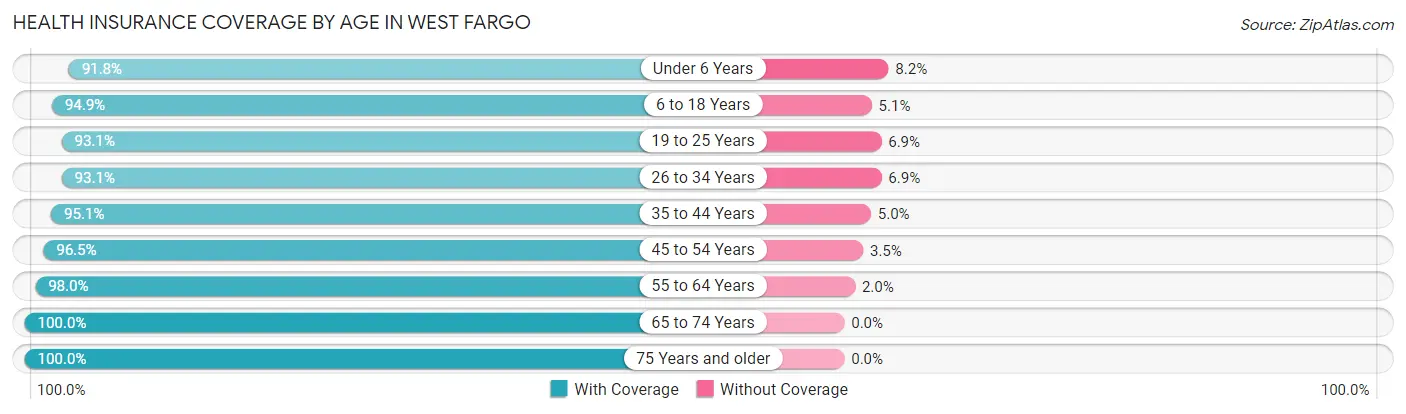
| Age Bracket | With Coverage | Without Coverage |
| Under 6 Years | 3,445 (91.8%) | 309 (8.2%) |
| 6 to 18 Years | 6,901 (94.9%) | 371 (5.1%) |
| 19 to 25 Years | 3,953 (93.1%) | 293 (6.9%) |
| 26 to 34 Years | 5,411 (93.1%) | 402 (6.9%) |
| 35 to 44 Years | 5,763 (95.1%) | 300 (5.0%) |
| 45 to 54 Years | 3,900 (96.5%) | 141 (3.5%) |
| 55 to 64 Years | 3,250 (98.0%) | 66 (2.0%) |
| 65 to 74 Years | 2,411 (100.0%) | 0 (0.0%) |
| 75 Years and older | 1,587 (100.0%) | 0 (0.0%) |
| Total | 36,621 (95.1%) | 1,882 (4.9%) |
Health Insurance Coverage by Citizenship Status in West Fargo
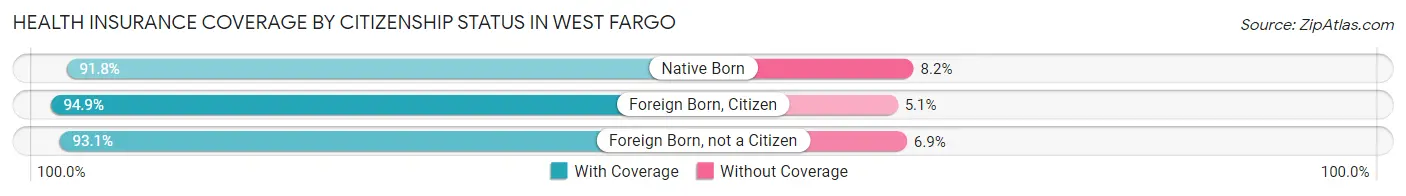
| Citizenship Status | With Coverage | Without Coverage |
| Native Born | 3,445 (91.8%) | 309 (8.2%) |
| Foreign Born, Citizen | 6,901 (94.9%) | 371 (5.1%) |
| Foreign Born, not a Citizen | 3,953 (93.1%) | 293 (6.9%) |
Health Insurance Coverage by Household Income in West Fargo
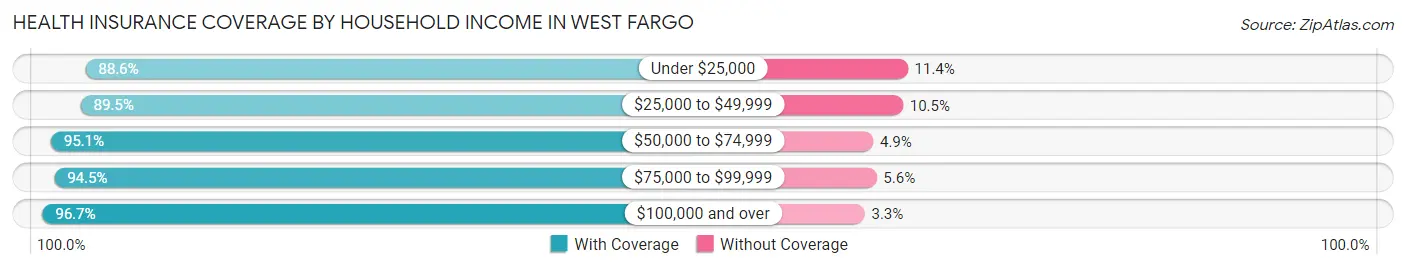
| Household Income | With Coverage | Without Coverage |
| Under $25,000 | 2,179 (88.6%) | 280 (11.4%) |
| $25,000 to $49,999 | 2,440 (89.5%) | 286 (10.5%) |
| $50,000 to $74,999 | 3,849 (95.1%) | 199 (4.9%) |
| $75,000 to $99,999 | 6,161 (94.5%) | 362 (5.6%) |
| $100,000 and over | 21,924 (96.7%) | 752 (3.3%) |
Public vs Private Health Insurance Coverage by Age in West Fargo
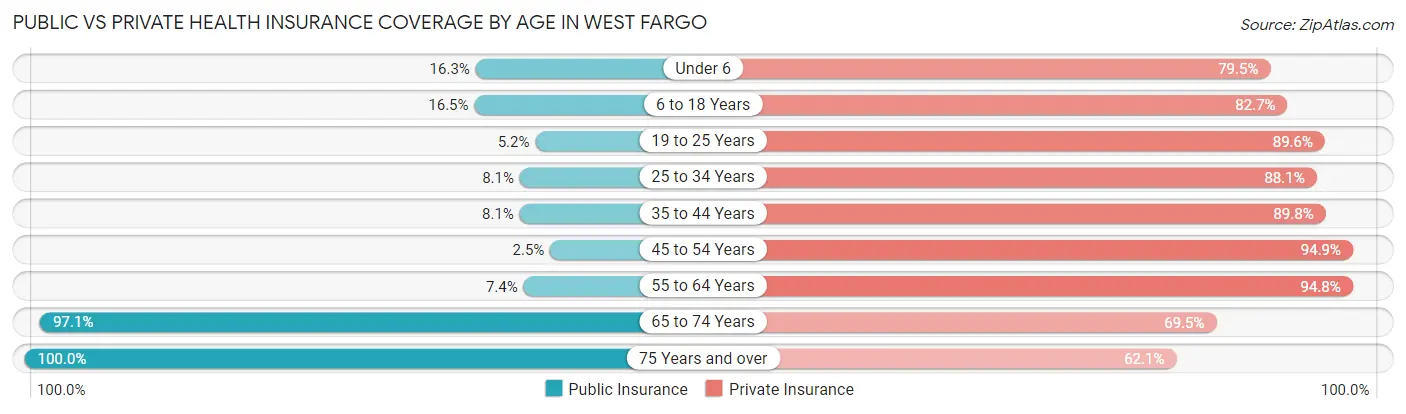
| Age Bracket | Public Insurance | Private Insurance |
| Under 6 | 611 (16.3%) | 2,985 (79.5%) |
| 6 to 18 Years | 1,201 (16.5%) | 6,015 (82.7%) |
| 19 to 25 Years | 221 (5.2%) | 3,806 (89.6%) |
| 25 to 34 Years | 470 (8.1%) | 5,121 (88.1%) |
| 35 to 44 Years | 491 (8.1%) | 5,443 (89.8%) |
| 45 to 54 Years | 99 (2.5%) | 3,833 (94.9%) |
| 55 to 64 Years | 245 (7.4%) | 3,144 (94.8%) |
| 65 to 74 Years | 2,342 (97.1%) | 1,676 (69.5%) |
| 75 Years and over | 1,587 (100.0%) | 985 (62.1%) |
| Total | 7,267 (18.9%) | 33,008 (85.7%) |
Disability Status by Sex by Age in West Fargo
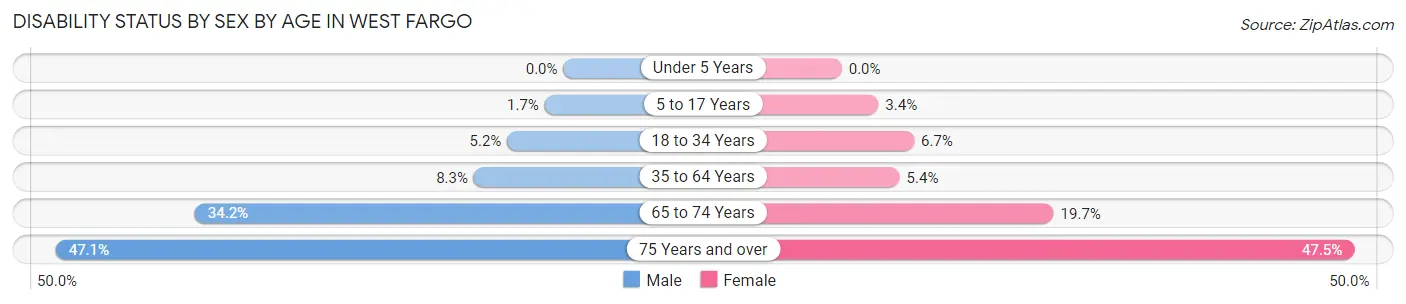
| Age Bracket | Male | Female |
| Under 5 Years | 0 (0.0%) | 0 (0.0%) |
| 5 to 17 Years | 69 (1.7%) | 117 (3.4%) |
| 18 to 34 Years | 246 (5.2%) | 388 (6.7%) |
| 35 to 64 Years | 583 (8.3%) | 344 (5.4%) |
| 65 to 74 Years | 426 (34.2%) | 229 (19.7%) |
| 75 Years and over | 260 (47.1%) | 492 (47.5%) |
Disability Class by Sex by Age in West Fargo
Disability Class: Hearing Difficulty
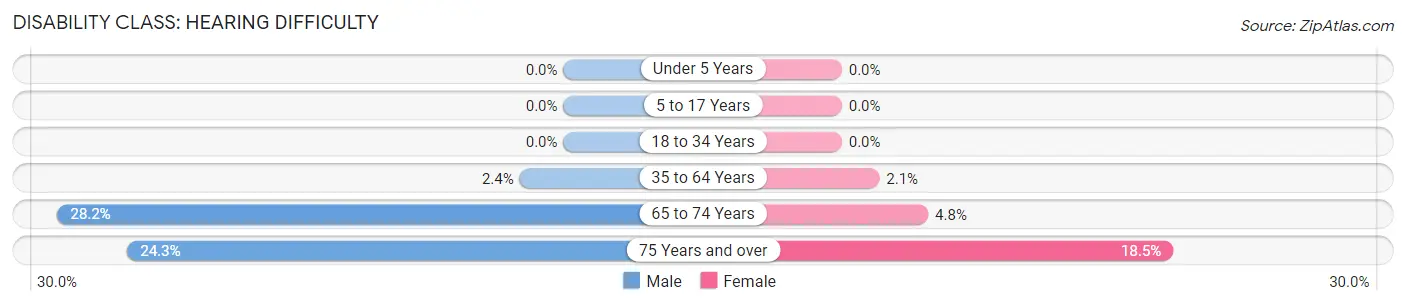
| Age Bracket | Male | Female |
| Under 5 Years | 0 (0.0%) | 0 (0.0%) |
| 5 to 17 Years | 0 (0.0%) | 0 (0.0%) |
| 18 to 34 Years | 0 (0.0%) | 0 (0.0%) |
| 35 to 64 Years | 171 (2.4%) | 134 (2.1%) |
| 65 to 74 Years | 351 (28.2%) | 56 (4.8%) |
| 75 Years and over | 134 (24.3%) | 191 (18.4%) |
Disability Class: Vision Difficulty
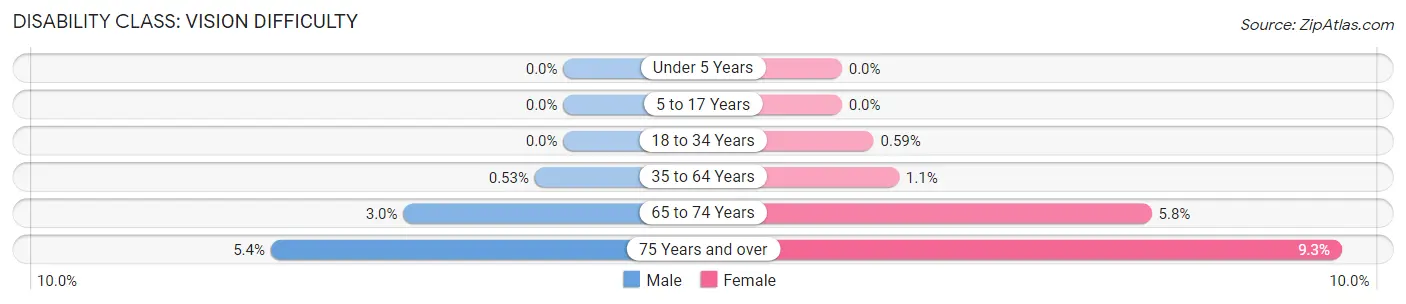
| Age Bracket | Male | Female |
| Under 5 Years | 0 (0.0%) | 0 (0.0%) |
| 5 to 17 Years | 0 (0.0%) | 0 (0.0%) |
| 18 to 34 Years | 0 (0.0%) | 34 (0.6%) |
| 35 to 64 Years | 37 (0.5%) | 68 (1.1%) |
| 65 to 74 Years | 37 (3.0%) | 67 (5.8%) |
| 75 Years and over | 30 (5.4%) | 96 (9.3%) |
Disability Class: Cognitive Difficulty
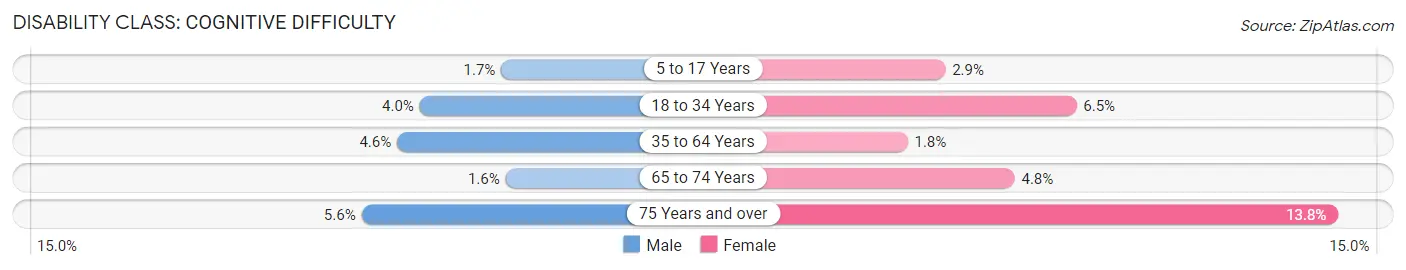
| Age Bracket | Male | Female |
| 5 to 17 Years | 69 (1.7%) | 99 (2.9%) |
| 18 to 34 Years | 189 (4.0%) | 378 (6.5%) |
| 35 to 64 Years | 325 (4.6%) | 117 (1.8%) |
| 65 to 74 Years | 20 (1.6%) | 56 (4.8%) |
| 75 Years and over | 31 (5.6%) | 143 (13.8%) |
Disability Class: Ambulatory Difficulty
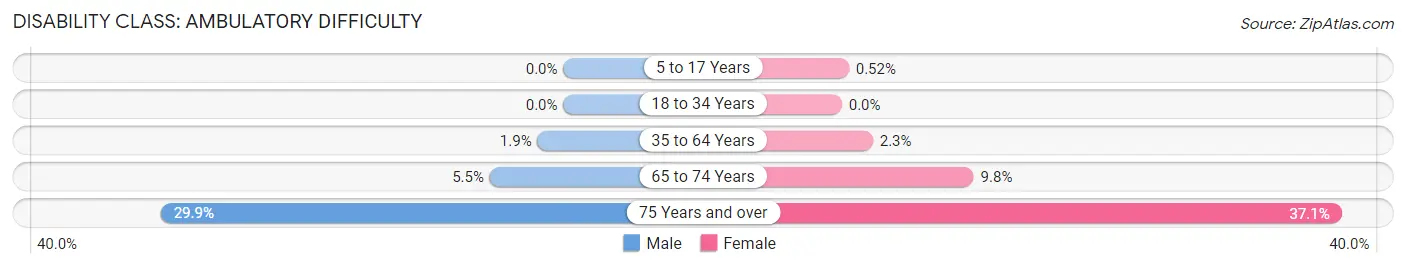
| Age Bracket | Male | Female |
| 5 to 17 Years | 0 (0.0%) | 18 (0.5%) |
| 18 to 34 Years | 0 (0.0%) | 0 (0.0%) |
| 35 to 64 Years | 135 (1.9%) | 147 (2.3%) |
| 65 to 74 Years | 68 (5.5%) | 114 (9.8%) |
| 75 Years and over | 165 (29.9%) | 384 (37.1%) |
Disability Class: Self-Care Difficulty
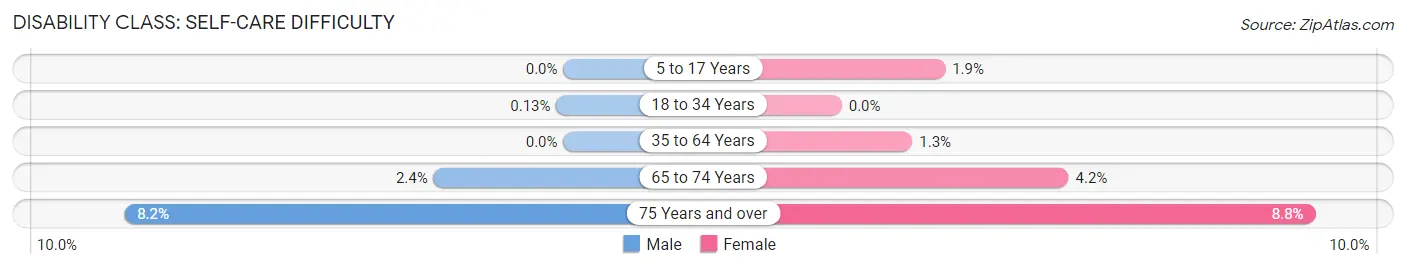
| Age Bracket | Male | Female |
| 5 to 17 Years | 0 (0.0%) | 66 (1.9%) |
| 18 to 34 Years | 6 (0.1%) | 0 (0.0%) |
| 35 to 64 Years | 0 (0.0%) | 84 (1.3%) |
| 65 to 74 Years | 30 (2.4%) | 49 (4.2%) |
| 75 Years and over | 45 (8.2%) | 91 (8.8%) |
Technology Access in West Fargo
Computing Device Access in West Fargo
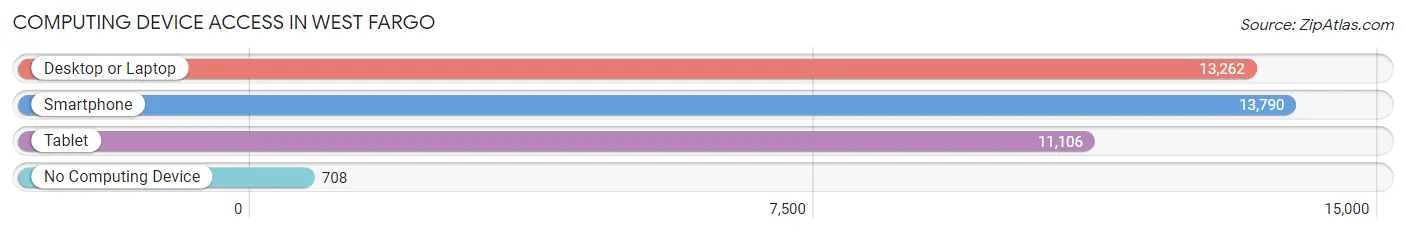
| Device Type | # Households | % Households |
| Desktop or Laptop | 13,262 | 87.8% |
| Smartphone | 13,790 | 91.3% |
| Tablet | 11,106 | 73.5% |
| No Computing Device | 708 | 4.7% |
| Total | 15,103 | 100.0% |
Internet Access in West Fargo
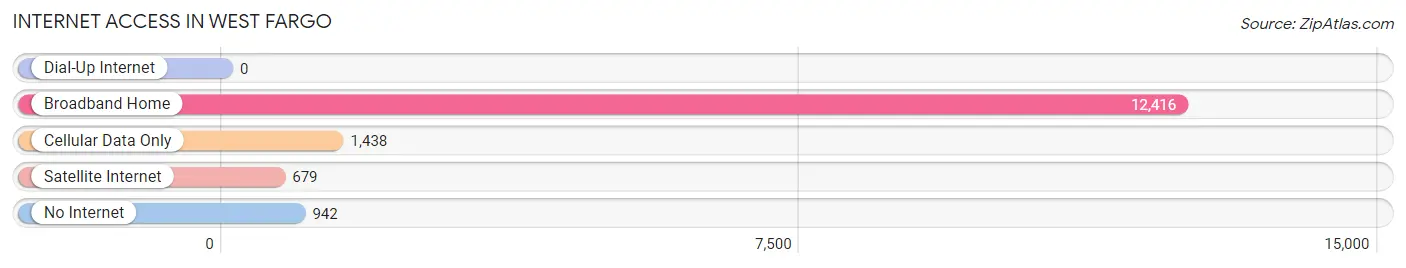
| Internet Type | # Households | % Households |
| Dial-Up Internet | 0 | 0.0% |
| Broadband Home | 12,416 | 82.2% |
| Cellular Data Only | 1,438 | 9.5% |
| Satellite Internet | 679 | 4.5% |
| No Internet | 942 | 6.2% |
| Total | 15,103 | 100.0% |
West Fargo Summary
History
West Fargo, North Dakota is a city located in Cass County, North Dakota. It is a suburb of Fargo, the largest city in the state. The city was founded in 1926 and was originally known as West Fargo Township. The city was incorporated in 1929 and was named after the nearby city of Fargo.
West Fargo has a rich history that dates back to the early 1800s. The area was first settled by Native Americans, who were later displaced by European settlers. The first settlers in the area were mostly of German and Scandinavian descent. The first permanent settlement in the area was established in 1871.
The city of West Fargo was founded in 1926 by a group of businessmen from Fargo. The city was originally known as West Fargo Township and was incorporated in 1929. The city was named after the nearby city of Fargo.
The city of West Fargo has grown significantly since its founding. In the 1950s, the city experienced a population boom due to the construction of the Red River Valley Fairgrounds. The fairgrounds were a major attraction for the city and helped to attract new businesses and residents.
In the 1960s, the city experienced another population boom due to the construction of the West Acres Shopping Center. The shopping center was the first of its kind in the area and helped to attract new businesses and residents.
The city of West Fargo has continued to grow and develop over the years. In the 1990s, the city experienced a population boom due to the construction of the West Acres Mall. The mall was the largest shopping center in the area and helped to attract new businesses and residents.
The city of West Fargo has continued to grow and develop over the years. In the 2000s, the city experienced a population boom due to the construction of the Sanford Health Medical Center. The medical center was the largest medical center in the area and helped to attract new businesses and residents.
Geography
West Fargo is located in Cass County, North Dakota. The city is located on the western edge of the Red River Valley, which is a large flat plain that stretches from the Canadian border to the Minnesota border. The city is located on the eastern edge of the Sheyenne River, which is a tributary of the Red River.
The city of West Fargo is located at an elevation of 1,072 feet above sea level. The city has a total area of 11.2 square miles, of which 11.1 square miles is land and 0.1 square miles is water.
The city of West Fargo is located in a humid continental climate zone. The city experiences hot summers and cold winters. The average temperature in the summer is around 75 degrees Fahrenheit and the average temperature in the winter is around 20 degrees Fahrenheit.
Economy
The economy of West Fargo is largely based on agriculture and manufacturing. The city is home to several large agricultural companies, including John Deere, Cargill, and Syngenta. The city is also home to several large manufacturing companies, including Bobcat, Case IH, and New Holland.
The city of West Fargo is also home to several large retail stores, including Target, Walmart, and Best Buy. The city is also home to several large restaurants, including Olive Garden, Red Lobster, and Applebee’s.
The city of West Fargo is also home to several large employers, including Sanford Health, Microsoft, and Amazon. The city is also home to several large educational institutions, including North Dakota State University and Minnesota State University Moorhead.
Demographics
The population of West Fargo, North Dakota was estimated to be 33,711 in 2019. The city has a population density of 3,000 people per square mile. The median age in the city is 35.7 years.
The racial makeup of the city is 87.3% White, 4.2% African American, 1.2% Native American, 2.3% Asian, 0.2% Pacific Islander, 2.2% from other races, and 2.7% from two or more races. The city has a Hispanic or Latino population of 5.3%.
The median household income in the city is $60,945 and the median family income is $71,945. The per capita income in the city is $27,945. The poverty rate in the city is 8.3%.
Common Questions
What is the Total Population of West Fargo?
Total Population of West Fargo is 38,653.
What is the Total Male Population of West Fargo?
Total Male Population of West Fargo is 19,367.
What is the Total Female Population of West Fargo?
Total Female Population of West Fargo is 19,286.
What is the Ratio of Males per 100 Females in West Fargo?
There are 100.42 Males per 100 Females in West Fargo.
What is the Ratio of Females per 100 Males in West Fargo?
There are 99.58 Females per 100 Males in West Fargo.
What is the Median Population Age in West Fargo?
Median Population Age in West Fargo is 32.5 Years.
What is the Average Family Size in West Fargo
Average Family Size in West Fargo is 3.1 People.
What is the Average Household Size in West Fargo
Average Household Size in West Fargo is 2.5 People.
What is Per Capita Income in West Fargo?
Per Capita income in West Fargo is $46,528.
What is the Median Family Income in West Fargo?
Median Family Income in West Fargo is $109,821.
What is the Median Household income in West Fargo?
Median Household Income in West Fargo is $96,929.
What is Income or Wage Gap in West Fargo?
Income or Wage Gap in West Fargo is 32.5%.
Women in West Fargo earn 67.5 cents for every dollar earned by a man.
What is Family Income Deficit in West Fargo?
Family Income Deficit in West Fargo is $9,100.
Families that are below poverty line in West Fargo earn $9,100 less on average than the poverty threshold level.
What is Inequality or Gini Index in West Fargo?
Inequality or Gini Index in West Fargo is 0.42.
How Large is the Labor Force in West Fargo?
There are 23,356 People in the Labor Forcein in West Fargo.
What is the Percentage of People in the Labor Force in West Fargo?
80.1% of People are in the Labor Force in West Fargo.
What is the Unemployment Rate in West Fargo?
Unemployment Rate in West Fargo is 0.8%.