Hebron, ND
Hebron Map
Hebron Overview
754
TOTAL POPULATION
332
MALE POPULATION
422
FEMALE POPULATION
78.67
MALES / 100 FEMALES
127.11
FEMALES / 100 MALES
36.7
MEDIAN AGE
3.5
AVG FAMILY SIZE
2.7
AVG HOUSEHOLD SIZE
$30,421
PER CAPITA INCOME
$79,896
AVG FAMILY INCOME
$55,781
AVG HOUSEHOLD INCOME
54.0%
WAGE / INCOME GAP [ % ]
46.0¢/ $1
WAGE / INCOME GAP [ $ ]
0.44
INEQUALITY / GINI INDEX
322
LABOR FORCE [ PEOPLE ]
59.5%
PERCENT IN LABOR FORCE
0.9%
UNEMPLOYMENT RATE
Hebron Zip Codes
Hebron Area Codes
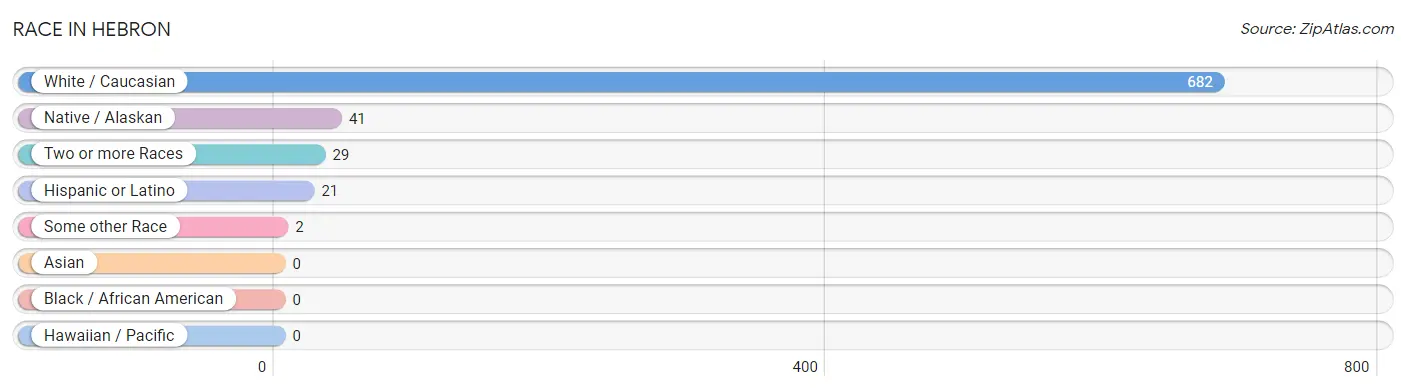
Race in Hebron
The most populous races in Hebron are White / Caucasian (682 | 90.4%), Native / Alaskan (41 | 5.4%), and Two or more Races (29 | 3.8%).
| Race | # Population | % Population |
| Asian | 0 | 0.0% |
| Black / African American | 0 | 0.0% |
| Hawaiian / Pacific | 0 | 0.0% |
| Hispanic or Latino | 21 | 2.8% |
| Native / Alaskan | 41 | 5.4% |
| White / Caucasian | 682 | 90.4% |
| Two or more Races | 29 | 3.8% |
| Some other Race | 2 | 0.3% |
| Total | 754 | 100.0% |
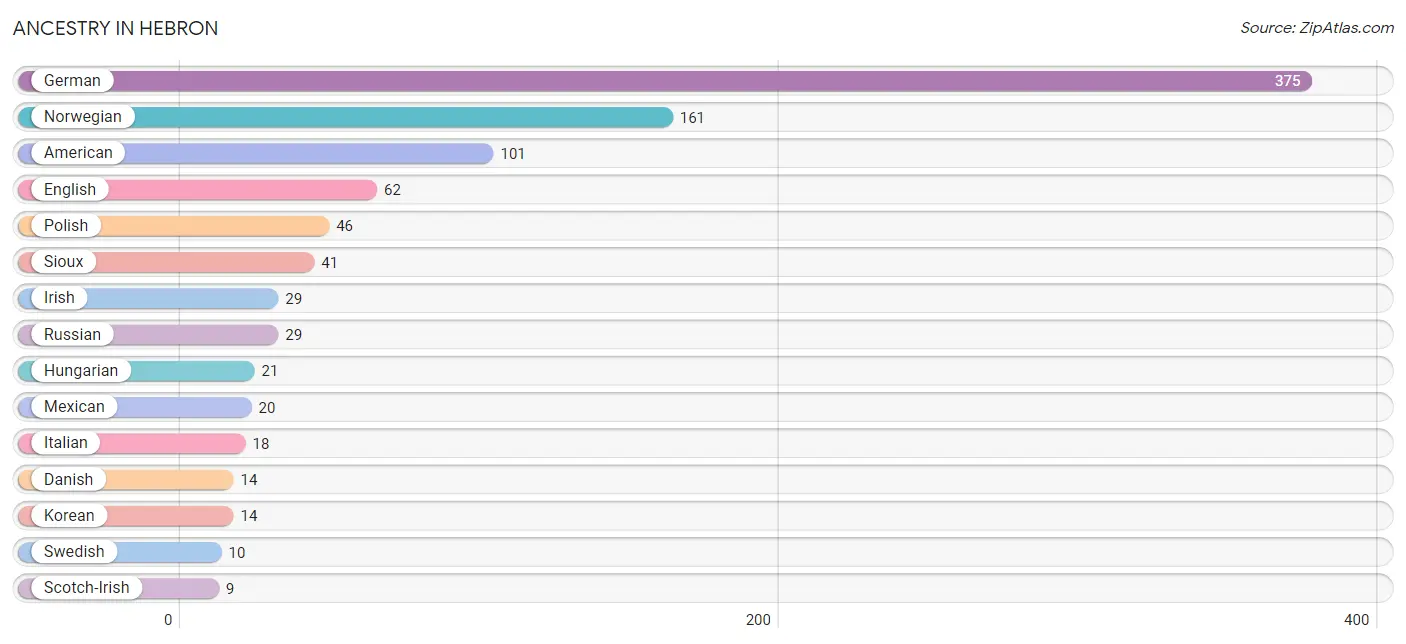
Ancestry in Hebron
The most populous ancestries reported in Hebron are German (375 | 49.7%), Norwegian (161 | 21.3%), American (101 | 13.4%), English (62 | 8.2%), and Polish (46 | 6.1%), together accounting for 98.8% of all Hebron residents.
| Ancestry | # Population | % Population |
| American | 101 | 13.4% |
| British | 2 | 0.3% |
| Celtic | 3 | 0.4% |
| Chippewa | 5 | 0.7% |
| Czechoslovakian | 6 | 0.8% |
| Danish | 14 | 1.9% |
| Dutch | 3 | 0.4% |
| Eastern European | 1 | 0.1% |
| English | 62 | 8.2% |
| European | 5 | 0.7% |
| Finnish | 1 | 0.1% |
| French | 8 | 1.1% |
| French Canadian | 2 | 0.3% |
| German | 375 | 49.7% |
| German Russian | 2 | 0.3% |
| Hungarian | 21 | 2.8% |
| Irish | 29 | 3.8% |
| Italian | 18 | 2.4% |
| Korean | 14 | 1.9% |
| Mexican | 20 | 2.6% |
| Norwegian | 161 | 21.3% |
| Polish | 46 | 6.1% |
| Puerto Rican | 1 | 0.1% |
| Russian | 29 | 3.8% |
| Samoan | 5 | 0.7% |
| Scotch-Irish | 9 | 1.2% |
| Scottish | 7 | 0.9% |
| Sioux | 41 | 5.4% |
| Swedish | 10 | 1.3% |
| Swiss | 1 | 0.1% | View All 30 Rows |
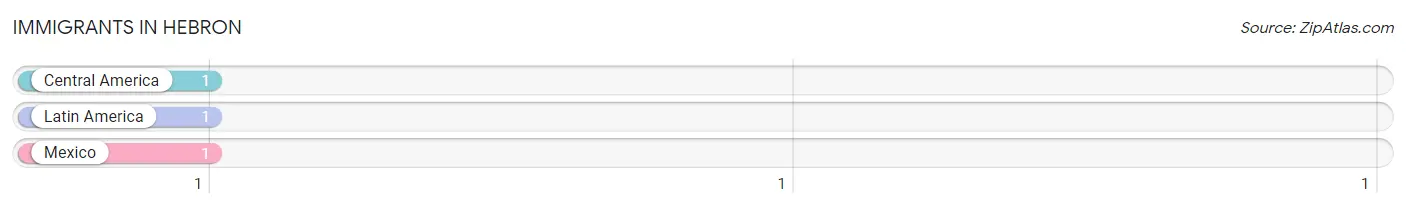
Immigrants in Hebron
The most numerous immigrant groups reported in Hebron came from Central America (1 | 0.1%), Latin America (1 | 0.1%), and Mexico (1 | 0.1%), together accounting for 0.4% of all Hebron residents.
| Immigration Origin | # Population | % Population |
| Central America | 1 | 0.1% |
| Latin America | 1 | 0.1% |
| Mexico | 1 | 0.1% | View All 3 Rows |
Sex and Age in Hebron
Sex and Age in Hebron
The most populous age groups in Hebron are 55 to 59 Years (36 | 10.8%) for men and 10 to 14 Years (75 | 17.8%) for women.
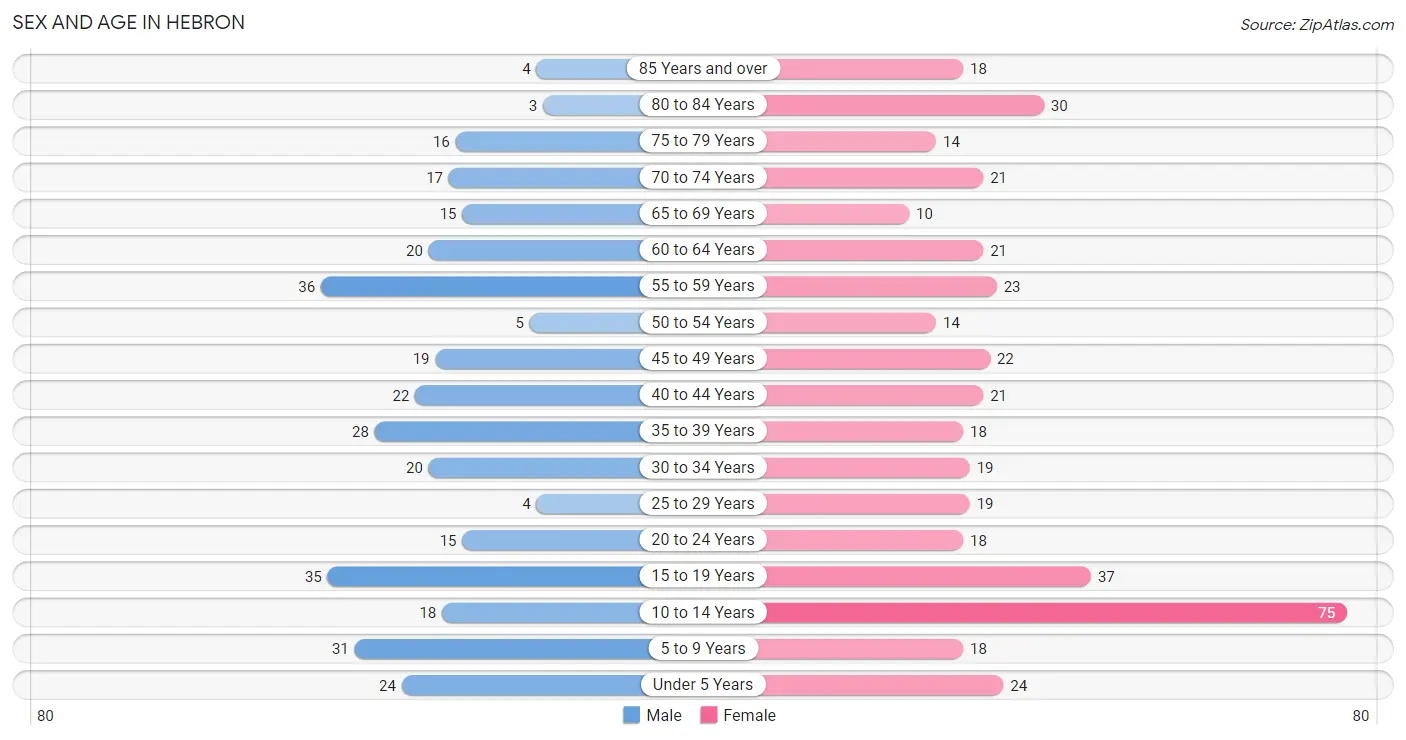
| Age Bracket | Male | Female |
| Under 5 Years | 24 (7.2%) | 24 (5.7%) |
| 5 to 9 Years | 31 (9.3%) | 18 (4.3%) |
| 10 to 14 Years | 18 (5.4%) | 75 (17.8%) |
| 15 to 19 Years | 35 (10.5%) | 37 (8.8%) |
| 20 to 24 Years | 15 (4.5%) | 18 (4.3%) |
| 25 to 29 Years | 4 (1.2%) | 19 (4.5%) |
| 30 to 34 Years | 20 (6.0%) | 19 (4.5%) |
| 35 to 39 Years | 28 (8.4%) | 18 (4.3%) |
| 40 to 44 Years | 22 (6.6%) | 21 (5.0%) |
| 45 to 49 Years | 19 (5.7%) | 22 (5.2%) |
| 50 to 54 Years | 5 (1.5%) | 14 (3.3%) |
| 55 to 59 Years | 36 (10.8%) | 23 (5.4%) |
| 60 to 64 Years | 20 (6.0%) | 21 (5.0%) |
| 65 to 69 Years | 15 (4.5%) | 10 (2.4%) |
| 70 to 74 Years | 17 (5.1%) | 21 (5.0%) |
| 75 to 79 Years | 16 (4.8%) | 14 (3.3%) |
| 80 to 84 Years | 3 (0.9%) | 30 (7.1%) |
| 85 Years and over | 4 (1.2%) | 18 (4.3%) |
| Total | 332 (100.0%) | 422 (100.0%) |
Families and Households in Hebron
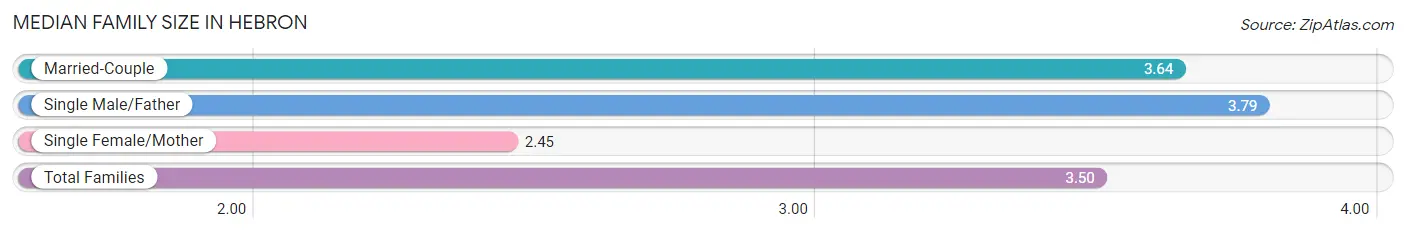
Median Family Size in Hebron
The median family size in Hebron is 3.50 persons per family, with single male/father families (14 | 7.9%) accounting for the largest median family size of 3.79 persons per family. On the other hand, single female/mother families (22 | 12.4%) represent the smallest median family size with 2.45 persons per family.
| Family Type | # Families | Family Size |
| Married-Couple | 141 (79.7%) | 3.64 |
| Single Male/Father | 14 (7.9%) | 3.79 |
| Single Female/Mother | 22 (12.4%) | 2.45 |
| Total Families | 177 (100.0%) | 3.50 |
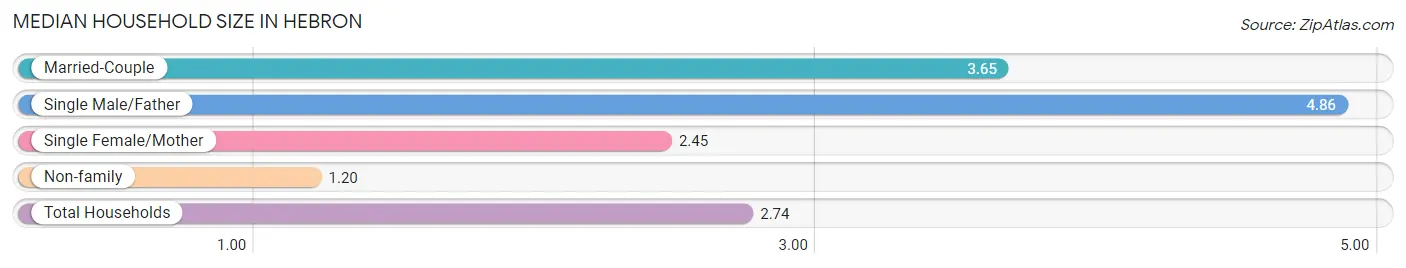
Median Household Size in Hebron
The median household size in Hebron is 2.74 persons per household, with single male/father households (14 | 5.1%) accounting for the largest median household size of 4.86 persons per household. non-family households (98 | 35.6%) represent the smallest median household size with 1.20 persons per household.
| Household Type | # Households | Household Size |
| Married-Couple | 141 (51.3%) | 3.65 |
| Single Male/Father | 14 (5.1%) | 4.86 |
| Single Female/Mother | 22 (8.0%) | 2.45 |
| Non-family | 98 (35.6%) | 1.20 |
| Total Households | 275 (100.0%) | 2.74 |
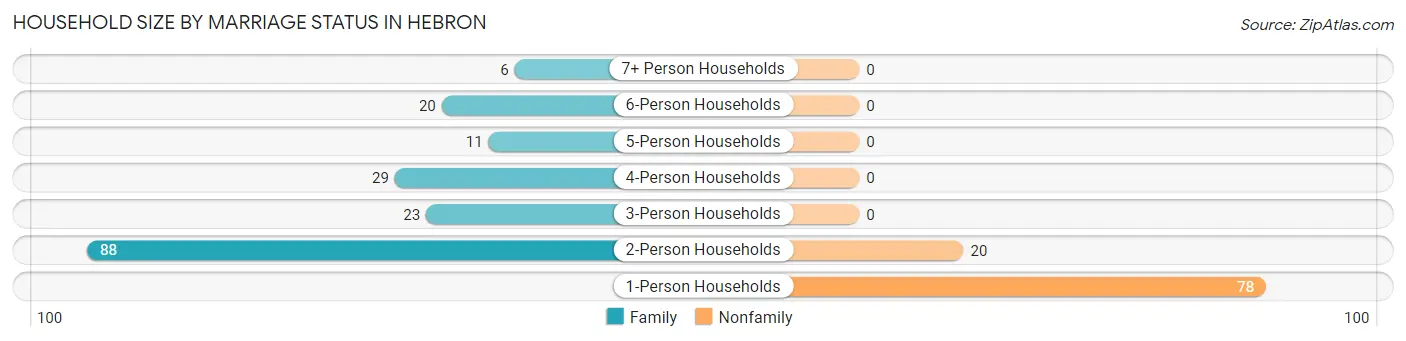
Household Size by Marriage Status in Hebron
Out of a total of 275 households in Hebron, 177 (64.4%) are family households, while 98 (35.6%) are nonfamily households. The most numerous type of family households are 2-person households, comprising 88, and the most common type of nonfamily households are 1-person households, comprising 78.
| Household Size | Family Households | Nonfamily Households |
| 1-Person Households | - | 78 (28.4%) |
| 2-Person Households | 88 (32.0%) | 20 (7.3%) |
| 3-Person Households | 23 (8.4%) | 0 (0.0%) |
| 4-Person Households | 29 (10.5%) | 0 (0.0%) |
| 5-Person Households | 11 (4.0%) | 0 (0.0%) |
| 6-Person Households | 20 (7.3%) | 0 (0.0%) |
| 7+ Person Households | 6 (2.2%) | 0 (0.0%) |
| Total | 177 (64.4%) | 98 (35.6%) |
Female Fertility in Hebron
Fertility by Age in Hebron
| Age Bracket | Women with Births | Births / 1,000 Women |
| 15 to 19 years | 0 (0.0%) | 0.0 |
| 20 to 34 years | 0 (0.0%) | 0.0 |
| 35 to 50 years | 0 (0.0%) | 0.0 |
| Total | 0 (0.0%) | 0.0 |
Fertility by Age by Marriage Status in Hebron
| Age Bracket | Married | Unmarried |
| 15 to 19 years | 0 (0.0%) | 0 (0.0%) |
| 20 to 34 years | 0 (0.0%) | 0 (0.0%) |
| 35 to 50 years | 0 (0.0%) | 0 (0.0%) |
| Total | 0 (0.0%) | 0 (0.0%) |
Fertility by Education in Hebron
| Educational Attainment | Women with Births | Births / 1,000 Women |
| Less than High School | 0 (0.0%) | 0.0 |
| High School Diploma | 0 (0.0%) | 0.0 |
| College or Associate's Degree | 0 (0.0%) | 0.0 |
| Bachelor's Degree | 0 (0.0%) | 0.0 |
| Graduate Degree | 0 (0.0%) | 0.0 |
| Total | 0 (0.0%) | 0.0 |
Fertility by Education by Marriage Status in Hebron
| Educational Attainment | Married | Unmarried |
| Less than High School | 0 (0.0%) | 0 (0.0%) |
| High School Diploma | 0 (0.0%) | 0 (0.0%) |
| College or Associate's Degree | 0 (0.0%) | 0 (0.0%) |
| Bachelor's Degree | 0 (0.0%) | 0 (0.0%) |
| Graduate Degree | 0 (0.0%) | 0 (0.0%) |
| Total | 0 (0.0%) | 0 (0.0%) |
Income in Hebron
Income Overview in Hebron
Per Capita Income in Hebron is $30,421, while median incomes of families and households are $79,896 and $55,781 respectively.
| Characteristic | Number | Measure |
| Per Capita Income | 754 | $30,421 |
| Median Family Income | 177 | $79,896 |
| Mean Family Income | 177 | $103,775 |
| Median Household Income | 275 | $55,781 |
| Mean Household Income | 275 | $83,953 |
| Income Deficit | 177 | $0 |
| Wage / Income Gap (%) | 754 | 54.03% |
| Wage / Income Gap ($) | 754 | 45.97¢ per $1 |
| Gini / Inequality Index | 754 | 0.44 |
Earnings by Sex in Hebron
Average Earnings in Hebron are $42,750, $52,344 for men and $24,063 for women, a difference of 54.0%.
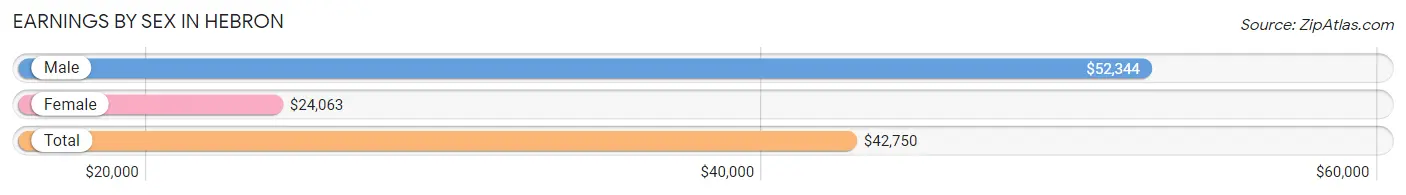
| Sex | Number | Average Earnings |
| Male | 170 (51.7%) | $52,344 |
| Female | 159 (48.3%) | $24,063 |
| Total | 329 (100.0%) | $42,750 |
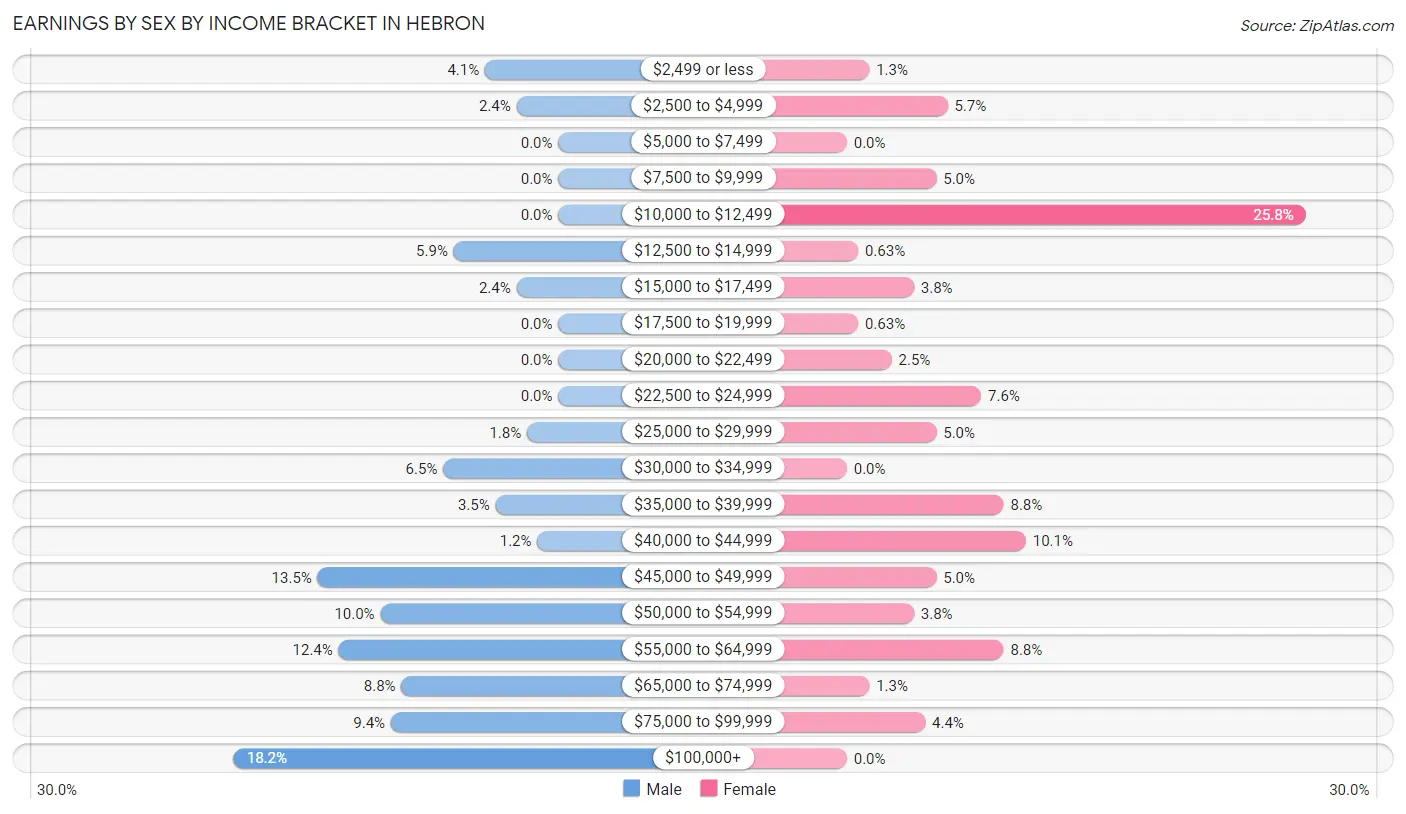
Earnings by Sex by Income Bracket in Hebron
The most common earnings brackets in Hebron are $100,000+ for men (31 | 18.2%) and $10,000 to $12,499 for women (41 | 25.8%).
| Income | Male | Female |
| $2,499 or less | 7 (4.1%) | 2 (1.3%) |
| $2,500 to $4,999 | 4 (2.4%) | 9 (5.7%) |
| $5,000 to $7,499 | 0 (0.0%) | 0 (0.0%) |
| $7,500 to $9,999 | 0 (0.0%) | 8 (5.0%) |
| $10,000 to $12,499 | 0 (0.0%) | 41 (25.8%) |
| $12,500 to $14,999 | 10 (5.9%) | 1 (0.6%) |
| $15,000 to $17,499 | 4 (2.4%) | 6 (3.8%) |
| $17,500 to $19,999 | 0 (0.0%) | 1 (0.6%) |
| $20,000 to $22,499 | 0 (0.0%) | 4 (2.5%) |
| $22,500 to $24,999 | 0 (0.0%) | 12 (7.5%) |
| $25,000 to $29,999 | 3 (1.8%) | 8 (5.0%) |
| $30,000 to $34,999 | 11 (6.5%) | 0 (0.0%) |
| $35,000 to $39,999 | 6 (3.5%) | 14 (8.8%) |
| $40,000 to $44,999 | 2 (1.2%) | 16 (10.1%) |
| $45,000 to $49,999 | 23 (13.5%) | 8 (5.0%) |
| $50,000 to $54,999 | 17 (10.0%) | 6 (3.8%) |
| $55,000 to $64,999 | 21 (12.3%) | 14 (8.8%) |
| $65,000 to $74,999 | 15 (8.8%) | 2 (1.3%) |
| $75,000 to $99,999 | 16 (9.4%) | 7 (4.4%) |
| $100,000+ | 31 (18.2%) | 0 (0.0%) |
| Total | 170 (100.0%) | 159 (100.0%) |
Earnings by Sex by Educational Attainment in Hebron
Average earnings in Hebron are $56,094 for men and $29,375 for women, a difference of 47.6%. Men with an educational attainment of bachelor's degree enjoy the highest average annual earnings of $106,875, while those with less than high school education earn the least with $47,188. Women with an educational attainment of bachelor's degree earn the most with the average annual earnings of $45,625, while those with less than high school education have the smallest earnings of $23,250.
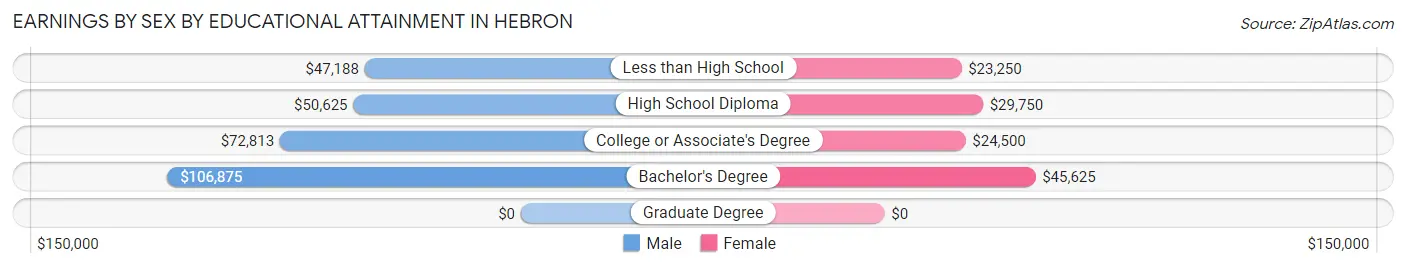
| Educational Attainment | Male Income | Female Income |
| Less than High School | $47,188 | $23,250 |
| High School Diploma | $50,625 | $29,750 |
| College or Associate's Degree | $72,813 | $24,500 |
| Bachelor's Degree | $106,875 | $45,625 |
| Graduate Degree | - | - |
| Total | $56,094 | $29,375 |
Family Income in Hebron
Family Income Brackets in Hebron
According to the Hebron family income data, there are 38 families falling into the $100,000 to $149,999 income range, which is the most common income bracket and makes up 21.5% of all families.
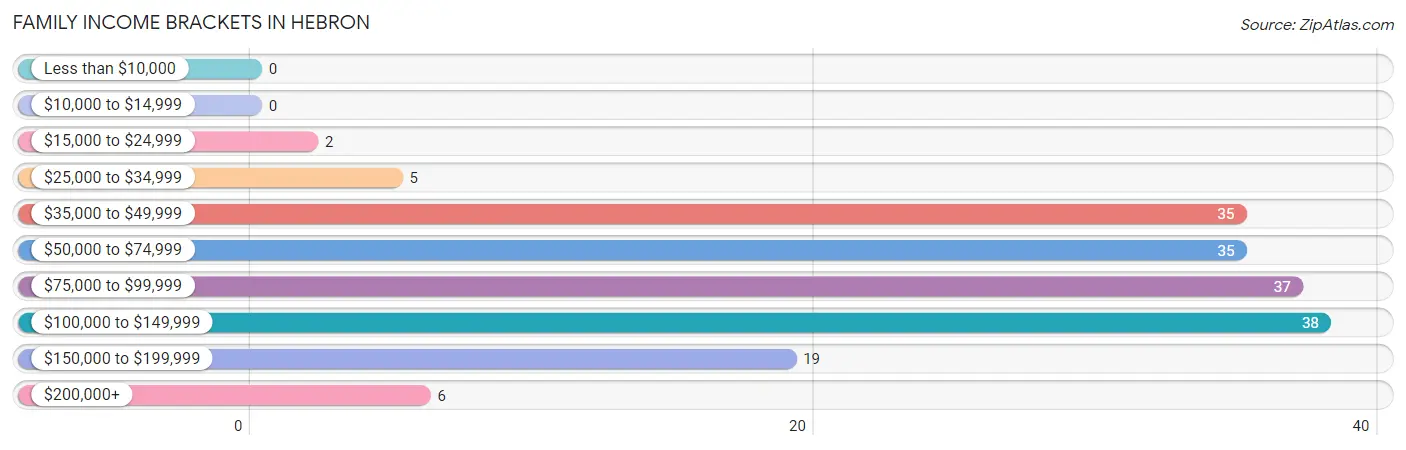
| Income Bracket | # Families | % Families |
| Less than $10,000 | 0 | 0.0% |
| $10,000 to $14,999 | 0 | 0.0% |
| $15,000 to $24,999 | 2 | 1.1% |
| $25,000 to $34,999 | 5 | 2.8% |
| $35,000 to $49,999 | 35 | 19.8% |
| $50,000 to $74,999 | 35 | 19.8% |
| $75,000 to $99,999 | 37 | 20.9% |
| $100,000 to $149,999 | 38 | 21.5% |
| $150,000 to $199,999 | 19 | 10.7% |
| $200,000+ | 6 | 3.4% |
Family Income by Famaliy Size in Hebron
6-person families (13 | 7.3%) account for the highest median family income in Hebron with $125,179 per family, while 3-person families (24 | 13.6%) have the highest median income of $30,476 per family member.
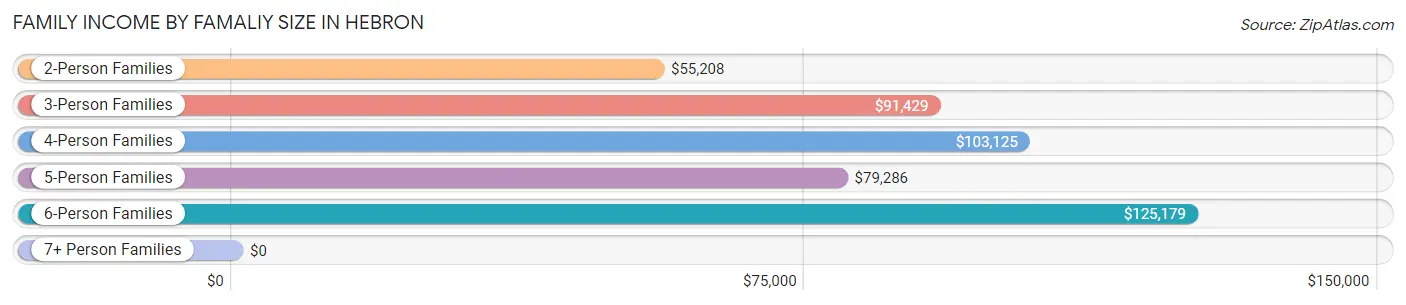
| Income Bracket | # Families | Median Income |
| 2-Person Families | 91 (51.4%) | $55,208 |
| 3-Person Families | 24 (13.6%) | $91,429 |
| 4-Person Families | 25 (14.1%) | $103,125 |
| 5-Person Families | 18 (10.2%) | $79,286 |
| 6-Person Families | 13 (7.3%) | $125,179 |
| 7+ Person Families | 6 (3.4%) | $0 |
| Total | 177 (100.0%) | $79,896 |
Family Income by Number of Earners in Hebron
The median family income in Hebron is $79,896, with families comprising 3+ earners (16) having the highest median family income of $123,750, while families with no earners (25) have the lowest median family income of $37,361, accounting for 9.0% and 14.1% of families, respectively.
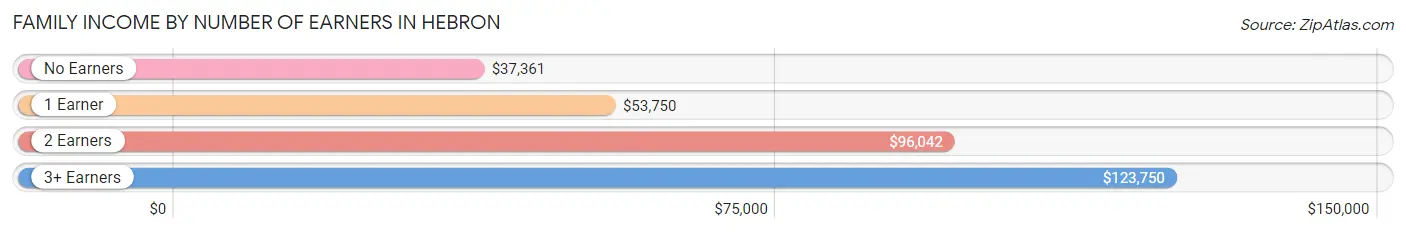
| Number of Earners | # Families | Median Income |
| No Earners | 25 (14.1%) | $37,361 |
| 1 Earner | 55 (31.1%) | $53,750 |
| 2 Earners | 81 (45.8%) | $96,042 |
| 3+ Earners | 16 (9.0%) | $123,750 |
| Total | 177 (100.0%) | $79,896 |
Household Income in Hebron
Household Income Brackets in Hebron
With 60 households falling in the category, the $50,000 to $74,999 income range is the most frequent in Hebron, accounting for 21.8% of all households. In contrast, only 7 households (2.5%) fall into the less than $10,000 income bracket, making it the least populous group.
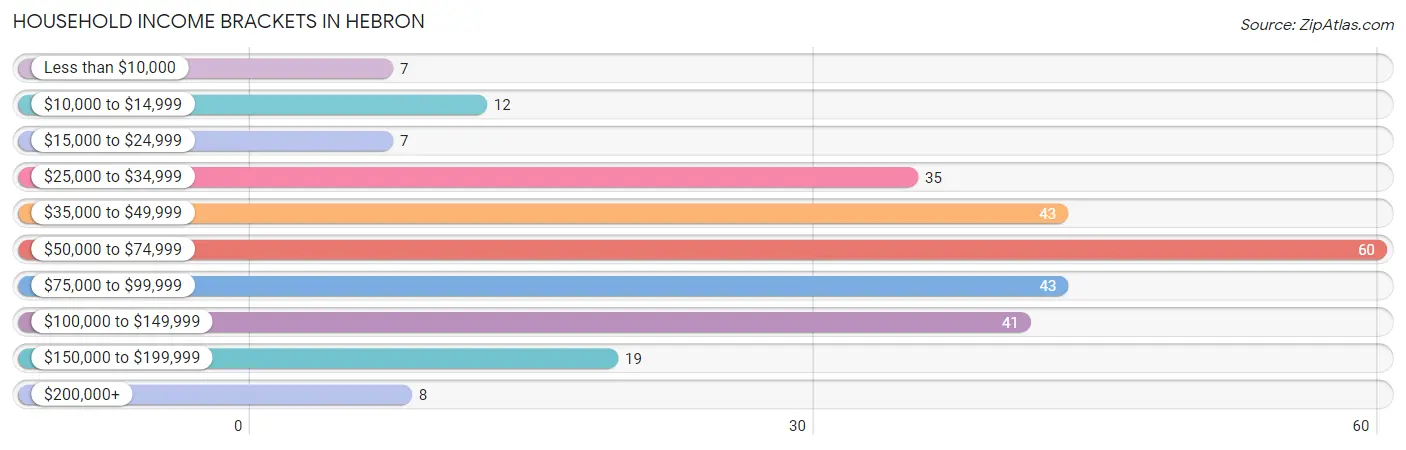
| Income Bracket | # Households | % Households |
| Less than $10,000 | 7 | 2.5% |
| $10,000 to $14,999 | 12 | 4.4% |
| $15,000 to $24,999 | 7 | 2.5% |
| $25,000 to $34,999 | 35 | 12.7% |
| $35,000 to $49,999 | 43 | 15.6% |
| $50,000 to $74,999 | 60 | 21.8% |
| $75,000 to $99,999 | 43 | 15.6% |
| $100,000 to $149,999 | 41 | 14.9% |
| $150,000 to $199,999 | 19 | 6.9% |
| $200,000+ | 8 | 2.9% |
Household Income by Householder Age in Hebron
The median household income in Hebron is $55,781, with the highest median household income of $92,054 found in the 25 to 44 years age bracket for the primary householder. A total of 79 households (28.7%) fall into this category. Meanwhile, the 15 to 24 years age bracket for the primary householder has the lowest median household income of $0, with 3 households (1.1%) in this group.
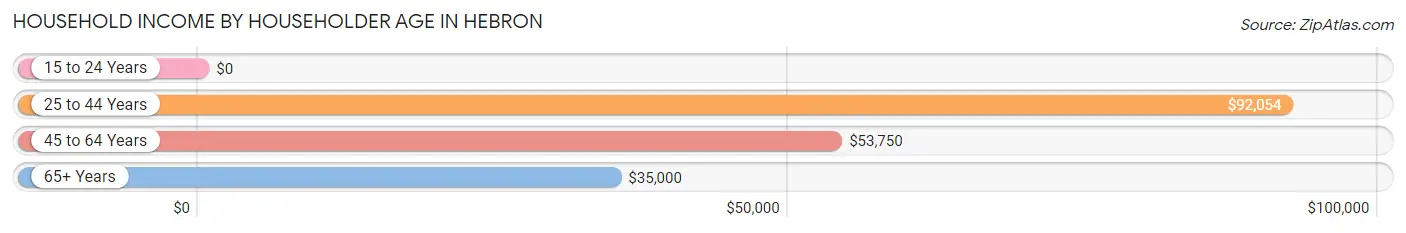
| Income Bracket | # Households | Median Income |
| 15 to 24 Years | 3 (1.1%) | $0 |
| 25 to 44 Years | 79 (28.7%) | $92,054 |
| 45 to 64 Years | 99 (36.0%) | $53,750 |
| 65+ Years | 94 (34.2%) | $35,000 |
| Total | 275 (100.0%) | $55,781 |
Poverty in Hebron
Income Below Poverty by Sex and Age in Hebron
With 6.6% poverty level for males and 8.8% for females among the residents of Hebron, 45 to 54 year old males and 18 to 24 year old females are the most vulnerable to poverty, with 6 males (25.0%) and 5 females (27.8%) in their respective age groups living below the poverty level.
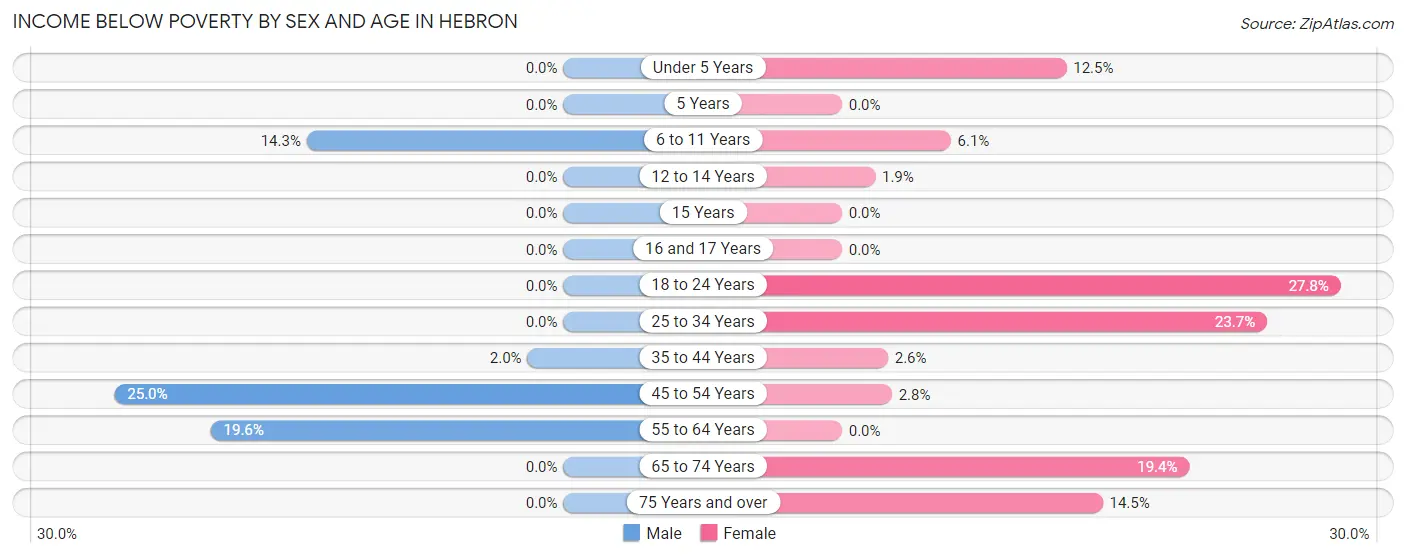
| Age Bracket | Male | Female |
| Under 5 Years | 0 (0.0%) | 3 (12.5%) |
| 5 Years | 0 (0.0%) | 0 (0.0%) |
| 6 to 11 Years | 4 (14.3%) | 2 (6.1%) |
| 12 to 14 Years | 0 (0.0%) | 1 (1.8%) |
| 15 Years | 0 (0.0%) | 0 (0.0%) |
| 16 and 17 Years | 0 (0.0%) | 0 (0.0%) |
| 18 to 24 Years | 0 (0.0%) | 5 (27.8%) |
| 25 to 34 Years | 0 (0.0%) | 9 (23.7%) |
| 35 to 44 Years | 1 (2.0%) | 1 (2.6%) |
| 45 to 54 Years | 6 (25.0%) | 1 (2.8%) |
| 55 to 64 Years | 11 (19.6%) | 0 (0.0%) |
| 65 to 74 Years | 0 (0.0%) | 6 (19.4%) |
| 75 Years and over | 0 (0.0%) | 9 (14.5%) |
| Total | 22 (6.6%) | 37 (8.8%) |
Income Above Poverty by Sex and Age in Hebron
According to the poverty statistics in Hebron, males aged under 5 years and females aged 5 years are the age groups that are most secure financially, with 100.0% of males and 100.0% of females in these age groups living above the poverty line.
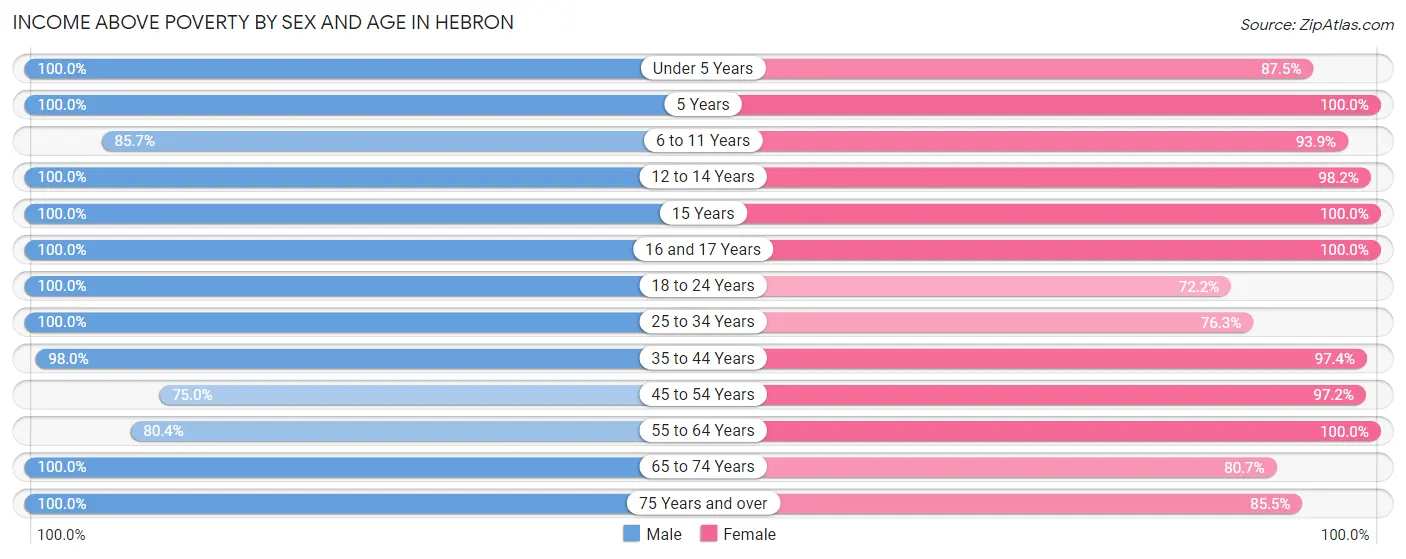
| Age Bracket | Male | Female |
| Under 5 Years | 24 (100.0%) | 21 (87.5%) |
| 5 Years | 5 (100.0%) | 6 (100.0%) |
| 6 to 11 Years | 24 (85.7%) | 31 (93.9%) |
| 12 to 14 Years | 16 (100.0%) | 53 (98.2%) |
| 15 Years | 22 (100.0%) | 1 (100.0%) |
| 16 and 17 Years | 2 (100.0%) | 36 (100.0%) |
| 18 to 24 Years | 26 (100.0%) | 13 (72.2%) |
| 25 to 34 Years | 24 (100.0%) | 29 (76.3%) |
| 35 to 44 Years | 49 (98.0%) | 38 (97.4%) |
| 45 to 54 Years | 18 (75.0%) | 35 (97.2%) |
| 55 to 64 Years | 45 (80.4%) | 44 (100.0%) |
| 65 to 74 Years | 32 (100.0%) | 25 (80.6%) |
| 75 Years and over | 23 (100.0%) | 53 (85.5%) |
| Total | 310 (93.4%) | 385 (91.2%) |
Income Below Poverty Among Married-Couple Families in Hebron
The poverty statistics for married-couple families in Hebron show that 0.7% or 1 of the total 141 families live below the poverty line. Families with 3 or 4 children have the highest poverty rate of 3.8%, comprising of 1 families. On the other hand, families with no children have the lowest poverty rate of 0.0%, which includes 0 families.
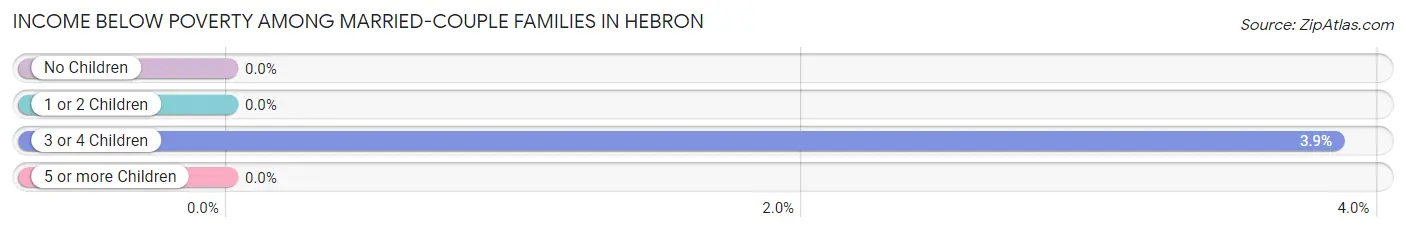
| Children | Above Poverty | Below Poverty |
| No Children | 73 (100.0%) | 0 (0.0%) |
| 1 or 2 Children | 42 (100.0%) | 0 (0.0%) |
| 3 or 4 Children | 25 (96.2%) | 1 (3.8%) |
| 5 or more Children | 0 (0.0%) | 0 (0.0%) |
| Total | 140 (99.3%) | 1 (0.7%) |
Income Below Poverty Among Single-Parent Households in Hebron
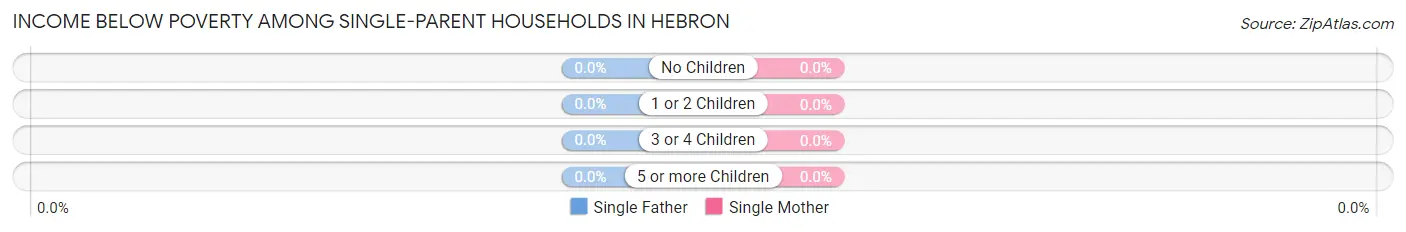
| Children | Single Father | Single Mother |
| No Children | 0 (0.0%) | 0 (0.0%) |
| 1 or 2 Children | 0 (0.0%) | 0 (0.0%) |
| 3 or 4 Children | 0 (0.0%) | 0 (0.0%) |
| 5 or more Children | 0 (0.0%) | 0 (0.0%) |
| Total | 0 (0.0%) | 0 (0.0%) |
Income Below Poverty Among Married-Couple vs Single-Parent Households in Hebron
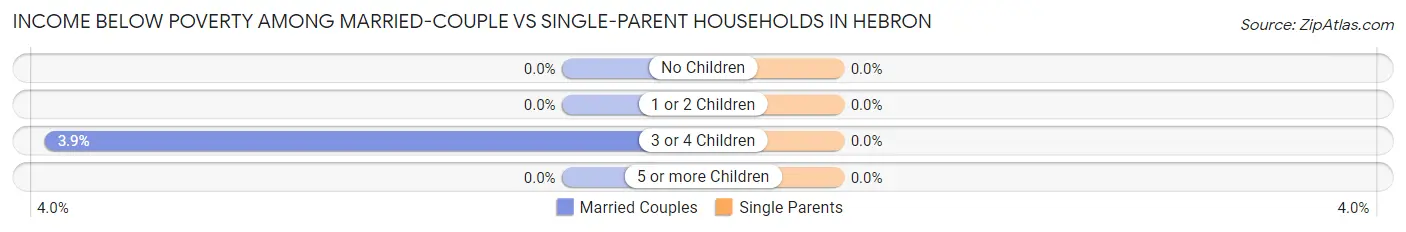
| Children | Married-Couple Families | Single-Parent Households |
| No Children | 0 (0.0%) | 0 (0.0%) |
| 1 or 2 Children | 0 (0.0%) | 0 (0.0%) |
| 3 or 4 Children | 1 (3.8%) | 0 (0.0%) |
| 5 or more Children | 0 (0.0%) | 0 (0.0%) |
| Total | 1 (0.7%) | 0 (0.0%) |
Employment Characteristics in Hebron
Employment by Class of Employer in Hebron
Among the 316 employed individuals in Hebron, private company employees (214 | 67.7%), self-employed (not incorporated) (41 | 13.0%), and not-for-profit organizations (30 | 9.5%) make up the most common classes of employment.
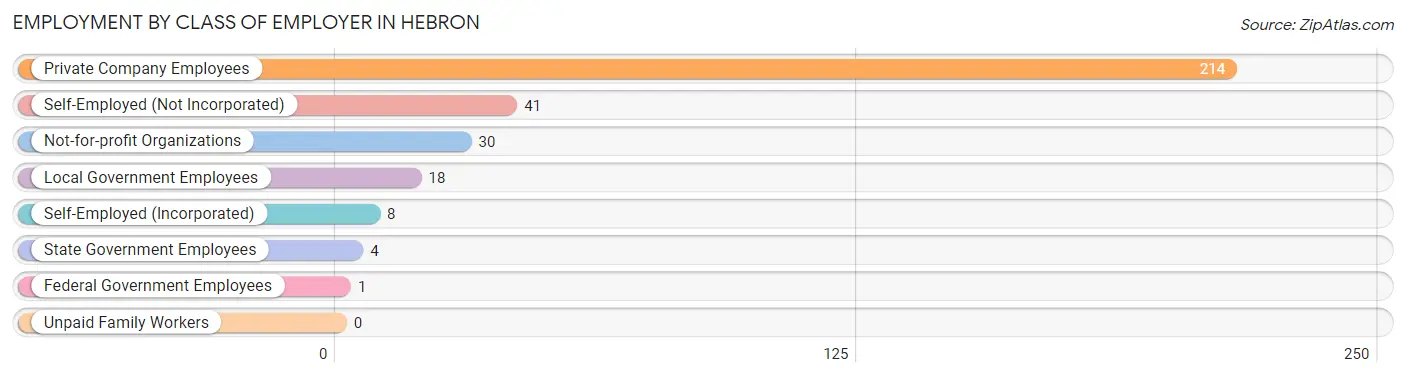
| Employer Class | # Employees | % Employees |
| Private Company Employees | 214 | 67.7% |
| Self-Employed (Incorporated) | 8 | 2.5% |
| Self-Employed (Not Incorporated) | 41 | 13.0% |
| Not-for-profit Organizations | 30 | 9.5% |
| Local Government Employees | 18 | 5.7% |
| State Government Employees | 4 | 1.3% |
| Federal Government Employees | 1 | 0.3% |
| Unpaid Family Workers | 0 | 0.0% |
| Total | 316 | 100.0% |
Employment Status by Age in Hebron
According to the labor force statistics for Hebron, out of the total population over 16 years of age (541), 59.5% or 322 individuals are in the labor force, with 0.9% or 3 of them unemployed. The age group with the highest labor force participation rate is 25 to 29 years, with 100.0% or 23 individuals in the labor force. Within the labor force, the 45 to 54 years age range has the highest percentage of unemployed individuals, with 3.9% or 2 of them being unemployed.
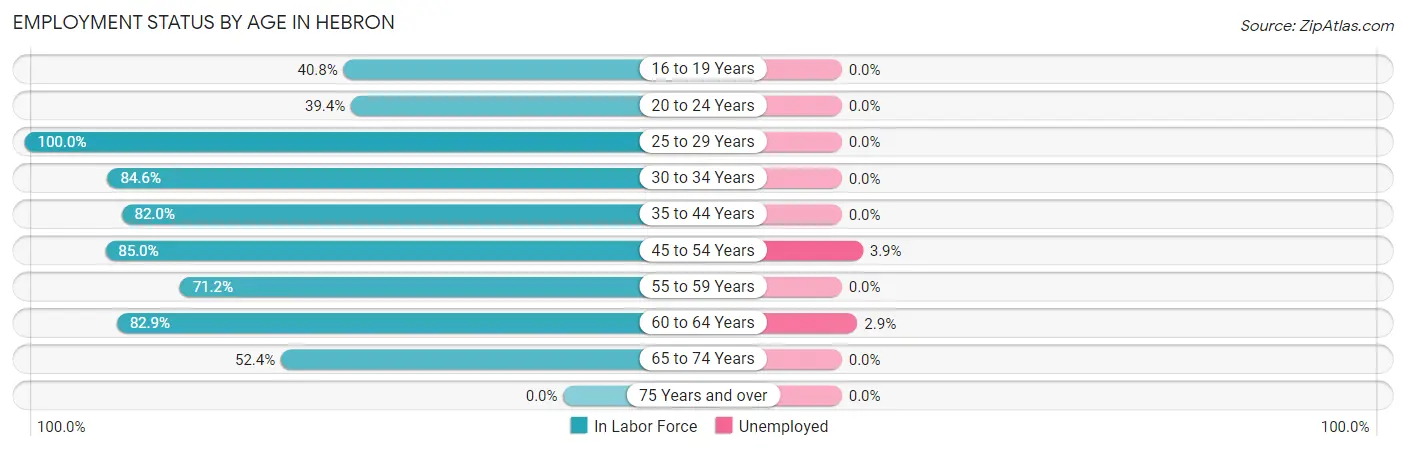
| Age Bracket | In Labor Force | Unemployed |
| 16 to 19 Years | 20 (40.8%) | 0 (0.0%) |
| 20 to 24 Years | 13 (39.4%) | 0 (0.0%) |
| 25 to 29 Years | 23 (100.0%) | 0 (0.0%) |
| 30 to 34 Years | 33 (84.6%) | 0 (0.0%) |
| 35 to 44 Years | 73 (82.0%) | 0 (0.0%) |
| 45 to 54 Years | 51 (85.0%) | 2 (3.9%) |
| 55 to 59 Years | 42 (71.2%) | 0 (0.0%) |
| 60 to 64 Years | 34 (82.9%) | 1 (2.9%) |
| 65 to 74 Years | 33 (52.4%) | 0 (0.0%) |
| 75 Years and over | 0 (0.0%) | 0 (0.0%) |
| Total | 322 (59.5%) | 3 (0.9%) |
Employment Status by Educational Attainment in Hebron
According to labor force statistics for Hebron, 82.3% of individuals (256) out of the total population between 25 and 64 years of age (311) are in the labor force, with 1.2% or 3 of them being unemployed. The group with the highest labor force participation rate are those with the educational attainment of bachelor's degree or higher, with 100.0% or 45 individuals in the labor force. Within the labor force, individuals with less than high school education have the highest percentage of unemployment, with 15.8% or 3 of them being unemployed.
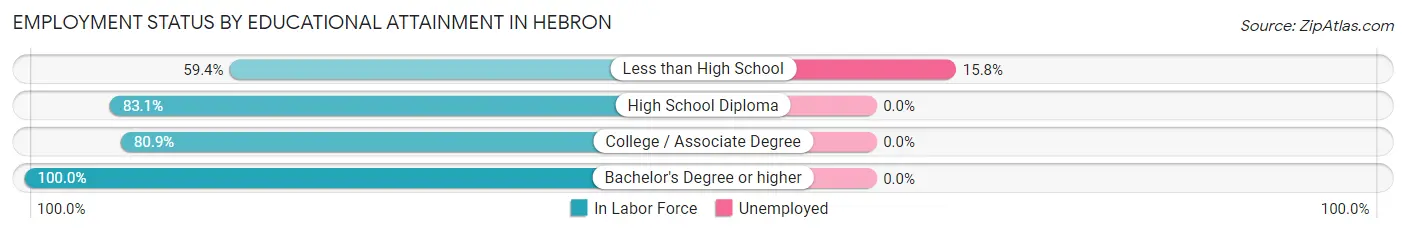
| Educational Attainment | In Labor Force | Unemployed |
| Less than High School | 19 (59.4%) | 5 (15.8%) |
| High School Diploma | 103 (83.1%) | 0 (0.0%) |
| College / Associate Degree | 89 (80.9%) | 0 (0.0%) |
| Bachelor's Degree or higher | 45 (100.0%) | 0 (0.0%) |
| Total | 256 (82.3%) | 4 (1.2%) |
Employment Occupations by Sex in Hebron
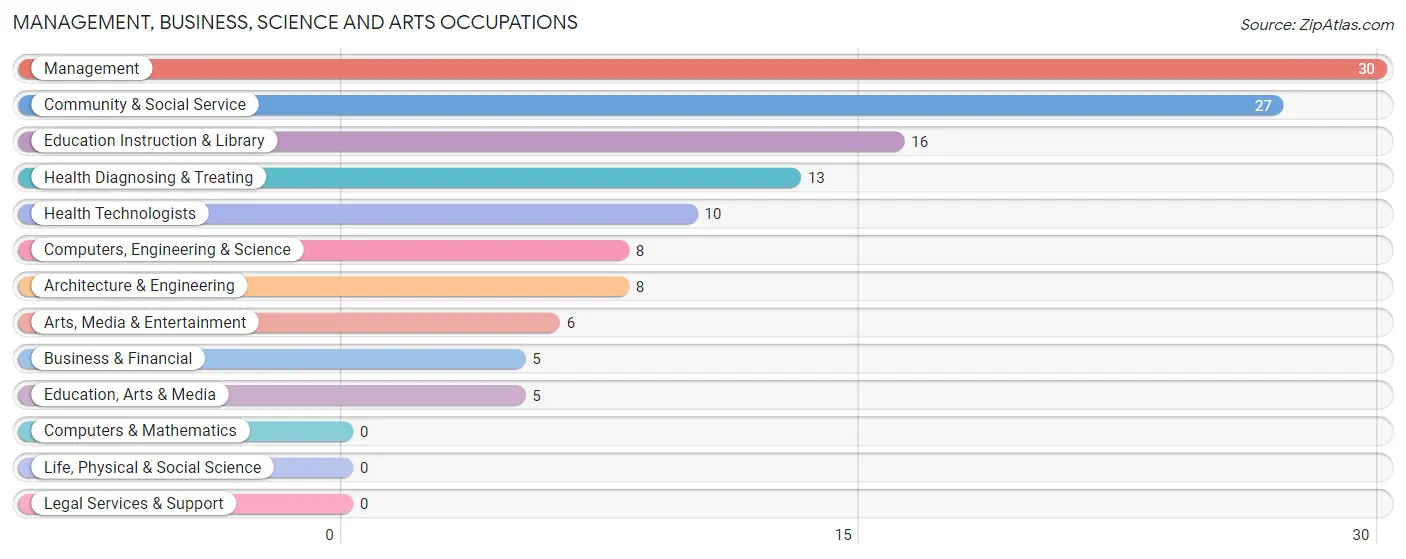
Management, Business, Science and Arts Occupations
The most common Management, Business, Science and Arts occupations in Hebron are Management (30 | 9.4%), Community & Social Service (27 | 8.5%), Education Instruction & Library (16 | 5.0%), Health Diagnosing & Treating (13 | 4.1%), and Health Technologists (10 | 3.1%).
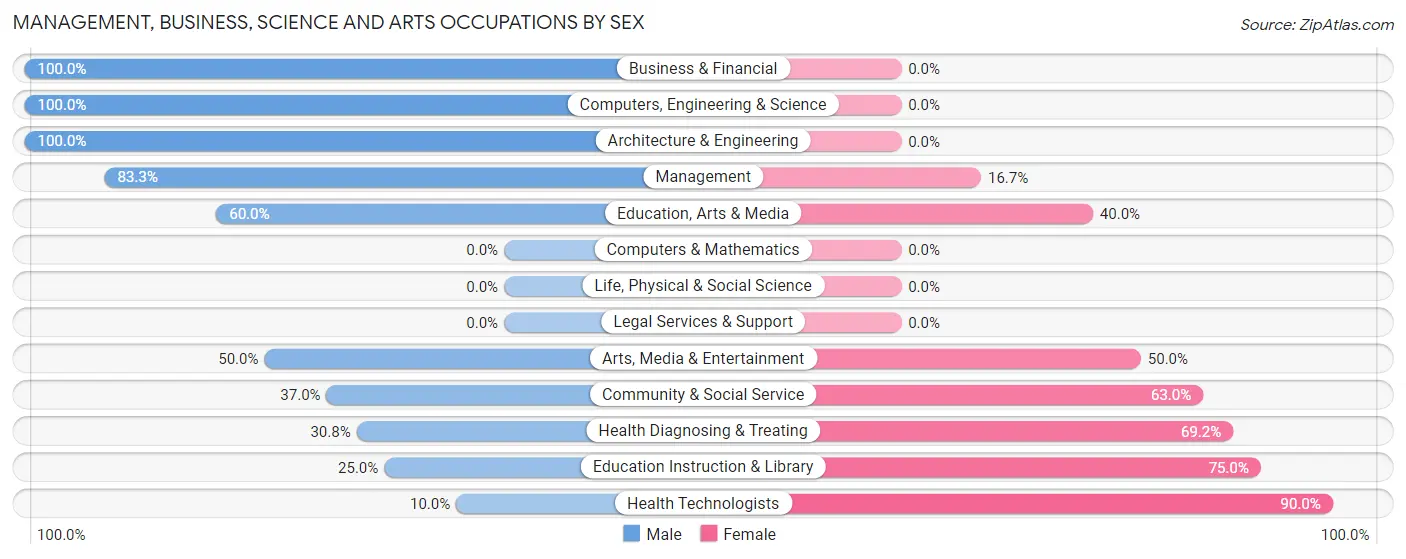
Management, Business, Science and Arts Occupations by Sex
Within the Management, Business, Science and Arts occupations in Hebron, the most male-oriented occupations are Business & Financial (100.0%), Computers, Engineering & Science (100.0%), and Architecture & Engineering (100.0%), while the most female-oriented occupations are Health Technologists (90.0%), Education Instruction & Library (75.0%), and Health Diagnosing & Treating (69.2%).
| Occupation | Male | Female |
| Management | 25 (83.3%) | 5 (16.7%) |
| Business & Financial | 5 (100.0%) | 0 (0.0%) |
| Computers, Engineering & Science | 8 (100.0%) | 0 (0.0%) |
| Computers & Mathematics | 0 (0.0%) | 0 (0.0%) |
| Architecture & Engineering | 8 (100.0%) | 0 (0.0%) |
| Life, Physical & Social Science | 0 (0.0%) | 0 (0.0%) |
| Community & Social Service | 10 (37.0%) | 17 (63.0%) |
| Education, Arts & Media | 3 (60.0%) | 2 (40.0%) |
| Legal Services & Support | 0 (0.0%) | 0 (0.0%) |
| Education Instruction & Library | 4 (25.0%) | 12 (75.0%) |
| Arts, Media & Entertainment | 3 (50.0%) | 3 (50.0%) |
| Health Diagnosing & Treating | 4 (30.8%) | 9 (69.2%) |
| Health Technologists | 1 (10.0%) | 9 (90.0%) |
| Total (Category) | 52 (62.6%) | 31 (37.3%) |
| Total (Overall) | 166 (52.0%) | 153 (48.0%) |
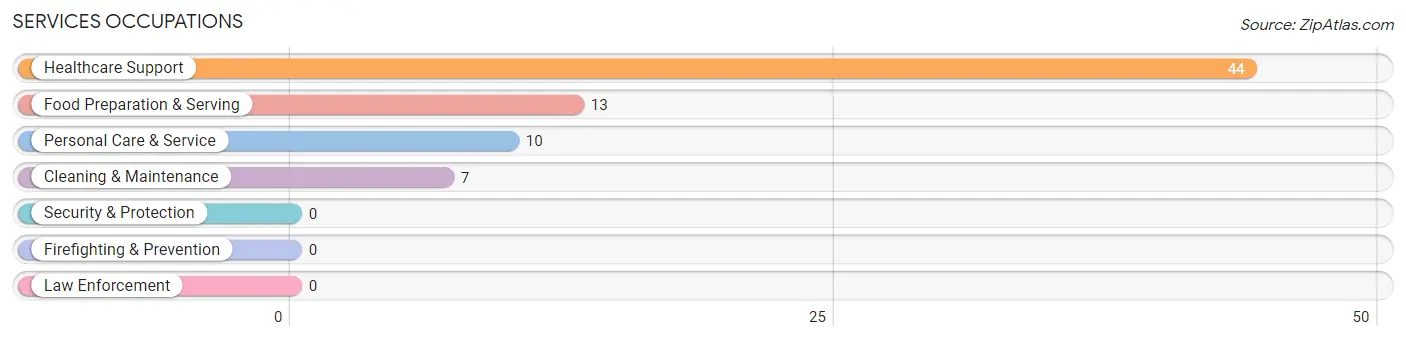
Services Occupations
The most common Services occupations in Hebron are Healthcare Support (44 | 13.8%), Food Preparation & Serving (13 | 4.1%), Personal Care & Service (10 | 3.1%), and Cleaning & Maintenance (7 | 2.2%).
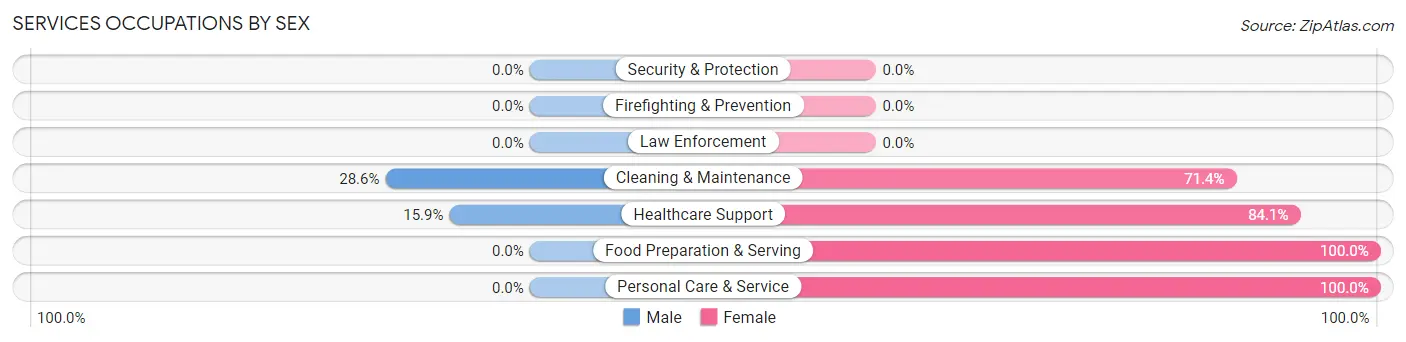
Services Occupations by Sex
Within the Services occupations in Hebron, the most male-oriented occupations are Cleaning & Maintenance (28.6%), and Healthcare Support (15.9%), while the most female-oriented occupations are Food Preparation & Serving (100.0%), Personal Care & Service (100.0%), and Healthcare Support (84.1%).
| Occupation | Male | Female |
| Healthcare Support | 7 (15.9%) | 37 (84.1%) |
| Security & Protection | 0 (0.0%) | 0 (0.0%) |
| Firefighting & Prevention | 0 (0.0%) | 0 (0.0%) |
| Law Enforcement | 0 (0.0%) | 0 (0.0%) |
| Food Preparation & Serving | 0 (0.0%) | 13 (100.0%) |
| Cleaning & Maintenance | 2 (28.6%) | 5 (71.4%) |
| Personal Care & Service | 0 (0.0%) | 10 (100.0%) |
| Total (Category) | 9 (12.2%) | 65 (87.8%) |
| Total (Overall) | 166 (52.0%) | 153 (48.0%) |
Sales and Office Occupations
The most common Sales and Office occupations in Hebron are Office & Administration (20 | 6.3%), and Sales & Related (9 | 2.8%).
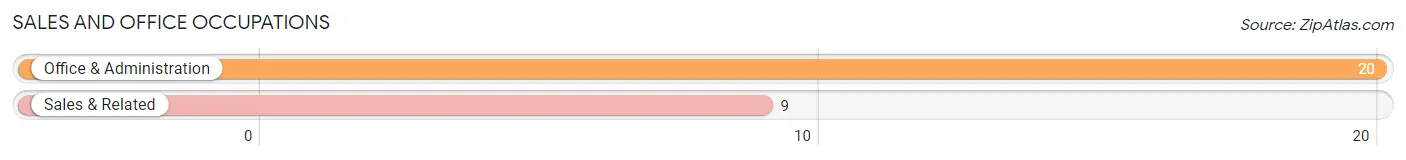
Sales and Office Occupations by Sex
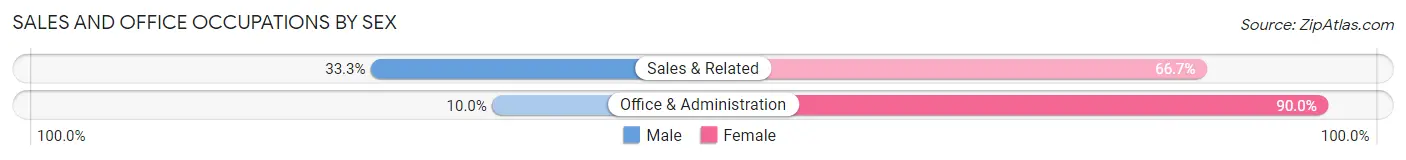
| Occupation | Male | Female |
| Sales & Related | 3 (33.3%) | 6 (66.7%) |
| Office & Administration | 2 (10.0%) | 18 (90.0%) |
| Total (Category) | 5 (17.2%) | 24 (82.8%) |
| Total (Overall) | 166 (52.0%) | 153 (48.0%) |
Natural Resources, Construction and Maintenance Occupations
The most common Natural Resources, Construction and Maintenance occupations in Hebron are Construction & Extraction (27 | 8.5%), and Installation, Maintenance & Repair (11 | 3.5%).
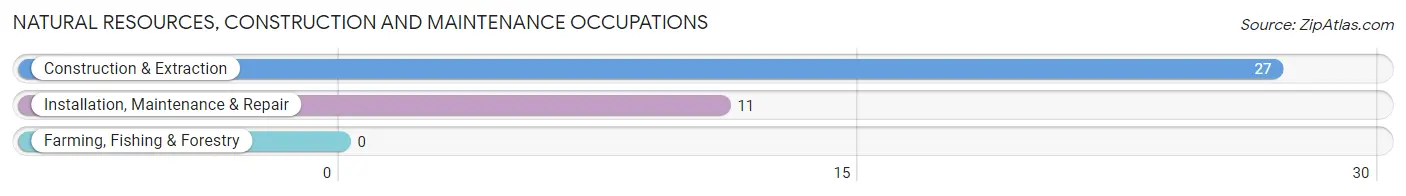
Natural Resources, Construction and Maintenance Occupations by Sex
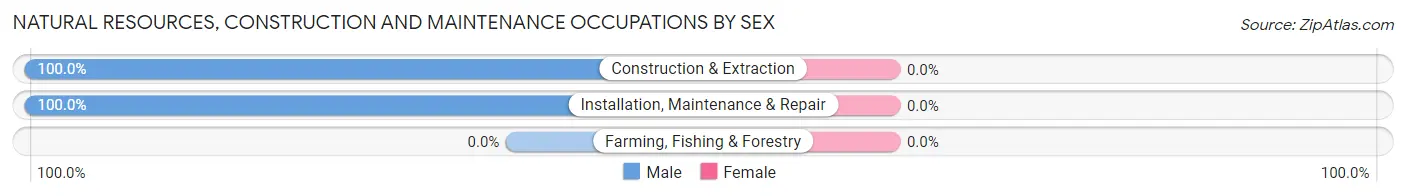
| Occupation | Male | Female |
| Farming, Fishing & Forestry | 0 (0.0%) | 0 (0.0%) |
| Construction & Extraction | 27 (100.0%) | 0 (0.0%) |
| Installation, Maintenance & Repair | 11 (100.0%) | 0 (0.0%) |
| Total (Category) | 38 (100.0%) | 0 (0.0%) |
| Total (Overall) | 166 (52.0%) | 153 (48.0%) |
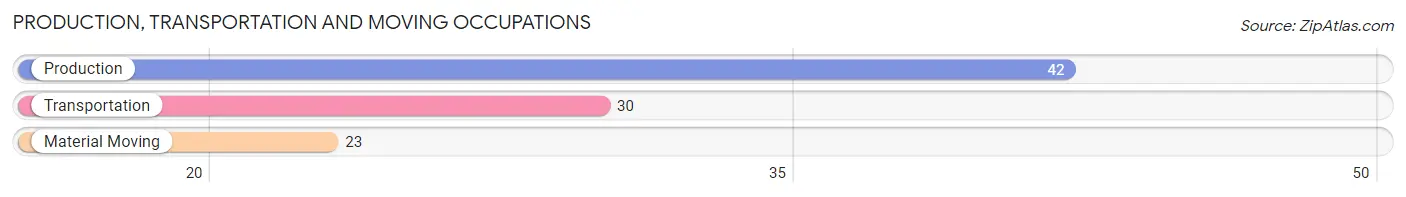
Production, Transportation and Moving Occupations
The most common Production, Transportation and Moving occupations in Hebron are Production (42 | 13.2%), Transportation (30 | 9.4%), and Material Moving (23 | 7.2%).
Production, Transportation and Moving Occupations by Sex
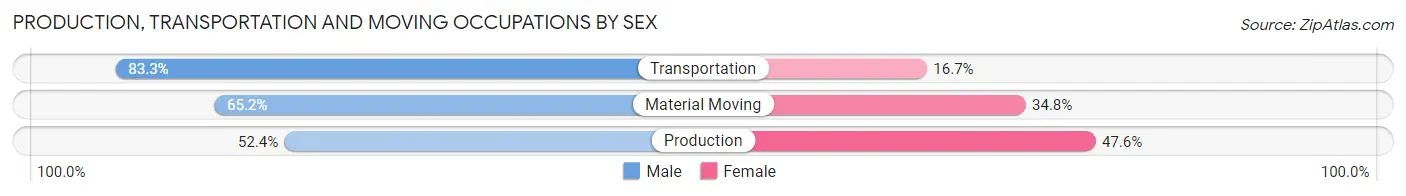
| Occupation | Male | Female |
| Production | 22 (52.4%) | 20 (47.6%) |
| Transportation | 25 (83.3%) | 5 (16.7%) |
| Material Moving | 15 (65.2%) | 8 (34.8%) |
| Total (Category) | 62 (65.3%) | 33 (34.7%) |
| Total (Overall) | 166 (52.0%) | 153 (48.0%) |
Employment Industries by Sex in Hebron
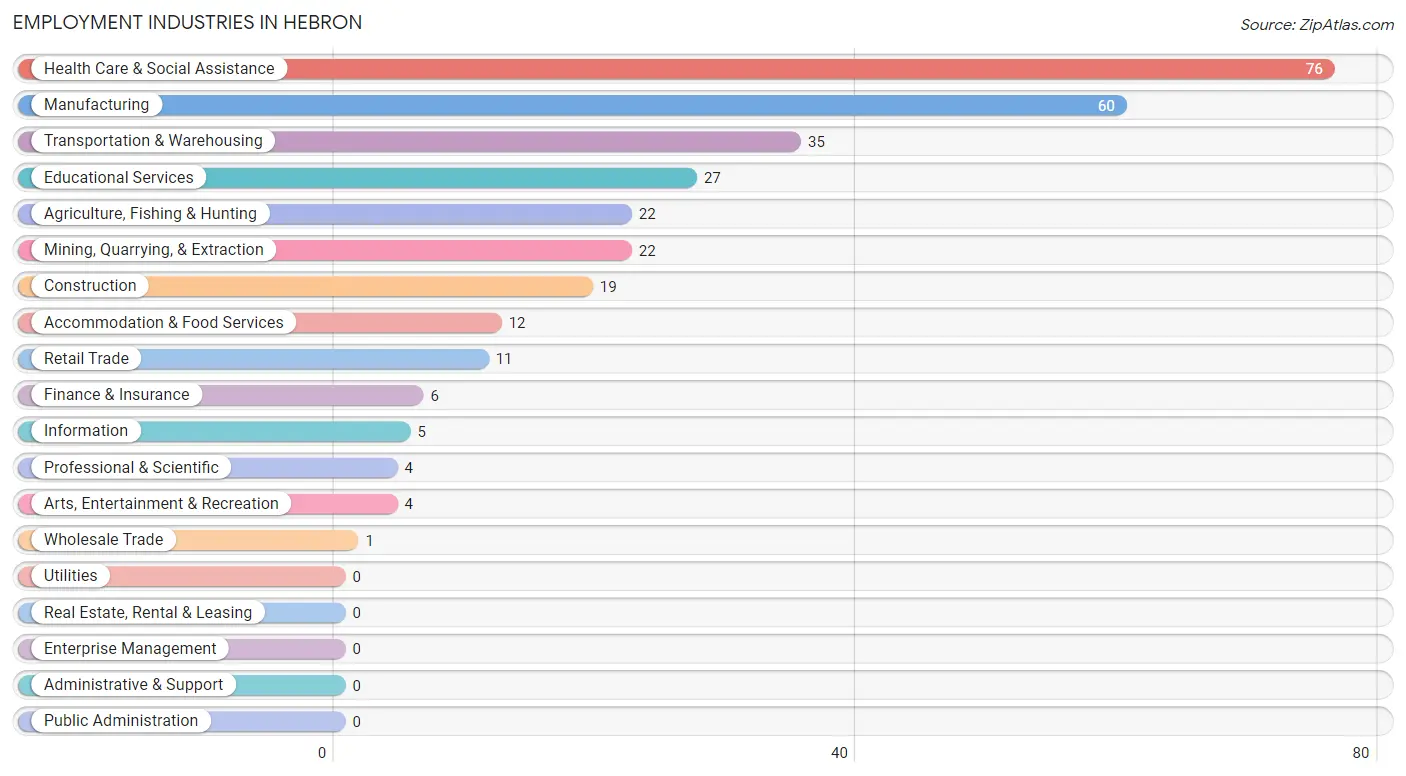
Employment Industries in Hebron
The major employment industries in Hebron include Health Care & Social Assistance (76 | 23.8%), Manufacturing (60 | 18.8%), Transportation & Warehousing (35 | 11.0%), Educational Services (27 | 8.5%), and Agriculture, Fishing & Hunting (22 | 6.9%).
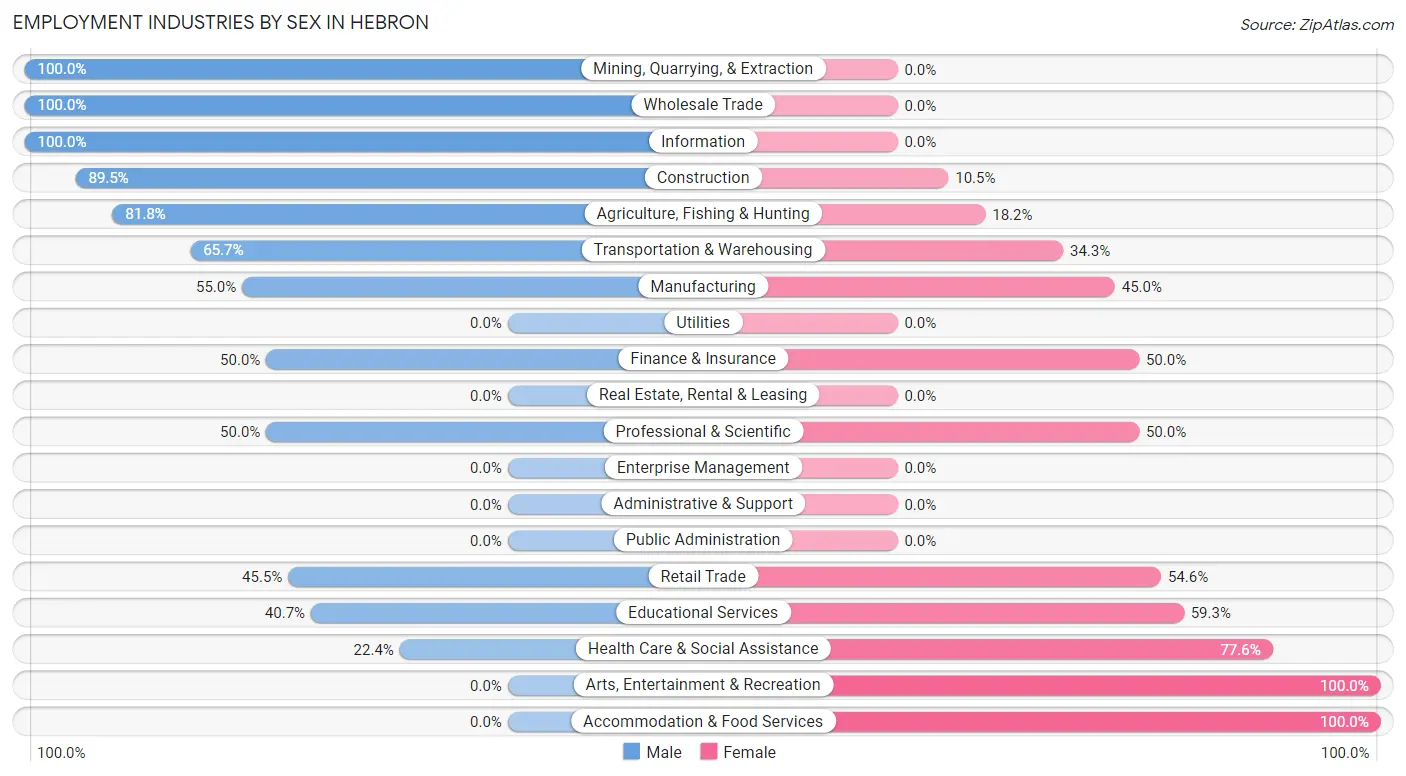
Employment Industries by Sex in Hebron
The Hebron industries that see more men than women are Mining, Quarrying, & Extraction (100.0%), Wholesale Trade (100.0%), and Information (100.0%), whereas the industries that tend to have a higher number of women are Arts, Entertainment & Recreation (100.0%), Accommodation & Food Services (100.0%), and Health Care & Social Assistance (77.6%).
| Industry | Male | Female |
| Agriculture, Fishing & Hunting | 18 (81.8%) | 4 (18.2%) |
| Mining, Quarrying, & Extraction | 22 (100.0%) | 0 (0.0%) |
| Construction | 17 (89.5%) | 2 (10.5%) |
| Manufacturing | 33 (55.0%) | 27 (45.0%) |
| Wholesale Trade | 1 (100.0%) | 0 (0.0%) |
| Retail Trade | 5 (45.5%) | 6 (54.5%) |
| Transportation & Warehousing | 23 (65.7%) | 12 (34.3%) |
| Utilities | 0 (0.0%) | 0 (0.0%) |
| Information | 5 (100.0%) | 0 (0.0%) |
| Finance & Insurance | 3 (50.0%) | 3 (50.0%) |
| Real Estate, Rental & Leasing | 0 (0.0%) | 0 (0.0%) |
| Professional & Scientific | 2 (50.0%) | 2 (50.0%) |
| Enterprise Management | 0 (0.0%) | 0 (0.0%) |
| Administrative & Support | 0 (0.0%) | 0 (0.0%) |
| Educational Services | 11 (40.7%) | 16 (59.3%) |
| Health Care & Social Assistance | 17 (22.4%) | 59 (77.6%) |
| Arts, Entertainment & Recreation | 0 (0.0%) | 4 (100.0%) |
| Accommodation & Food Services | 0 (0.0%) | 12 (100.0%) |
| Public Administration | 0 (0.0%) | 0 (0.0%) |
| Total | 166 (52.0%) | 153 (48.0%) |
Education in Hebron
School Enrollment in Hebron
The most common levels of schooling among the 230 students in Hebron are high school (77 | 33.5%), middle school (75 | 32.6%), and elementary school (35 | 15.2%).
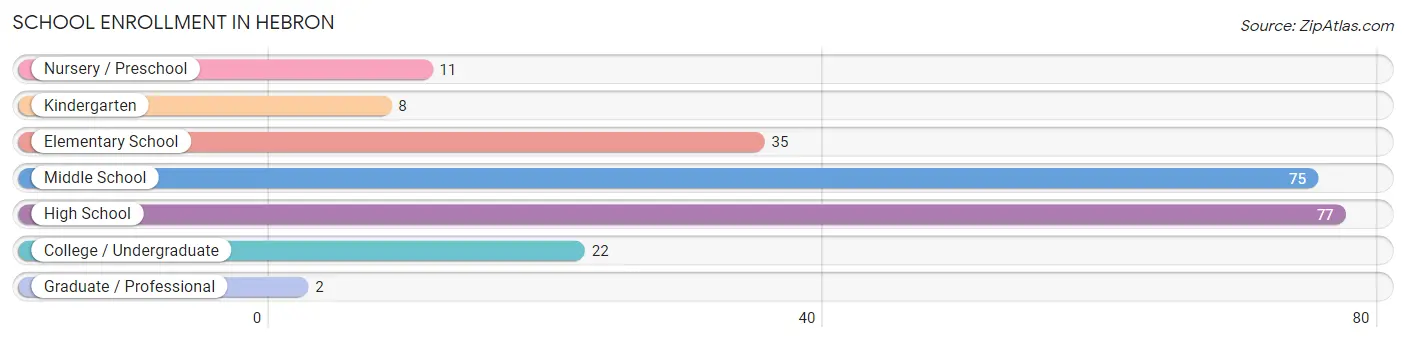
| School Level | # Students | % Students |
| Nursery / Preschool | 11 | 4.8% |
| Kindergarten | 8 | 3.5% |
| Elementary School | 35 | 15.2% |
| Middle School | 75 | 32.6% |
| High School | 77 | 33.5% |
| College / Undergraduate | 22 | 9.6% |
| Graduate / Professional | 2 | 0.9% |
| Total | 230 | 100.0% |
School Enrollment by Age by Funding Source in Hebron
Out of a total of 230 students who are enrolled in schools in Hebron, 15 (6.5%) attend a private institution, while the remaining 215 (93.5%) are enrolled in public schools. The age group of 35 years and over has the highest likelihood of being enrolled in private schools, with 2 (50.0% in the age bracket) enrolled. Conversely, the age group of 3 to 4 year olds has the lowest likelihood of being enrolled in a private school, with 6 (100.0% in the age bracket) attending a public institution.
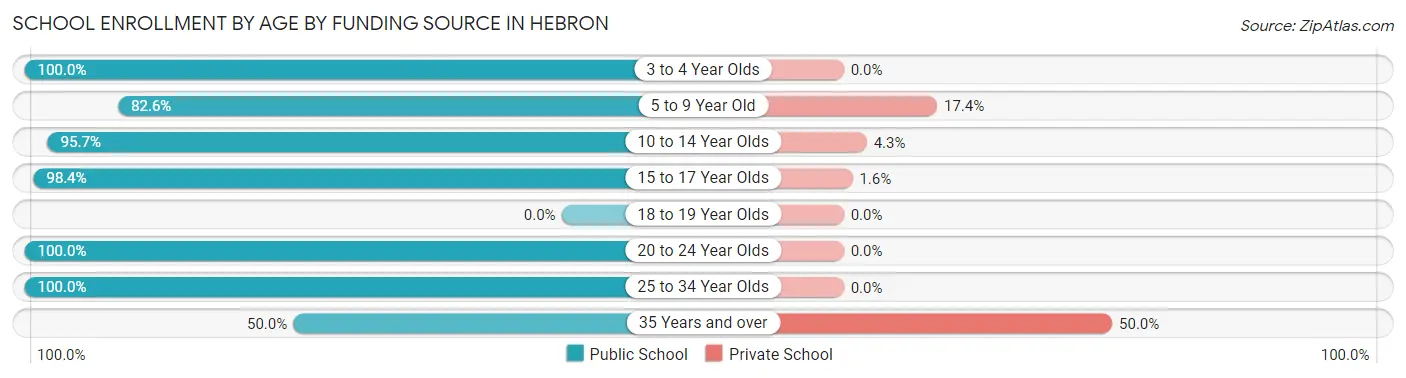
| Age Bracket | Public School | Private School |
| 3 to 4 Year Olds | 6 (100.0%) | 0 (0.0%) |
| 5 to 9 Year Old | 38 (82.6%) | 8 (17.4%) |
| 10 to 14 Year Olds | 89 (95.7%) | 4 (4.3%) |
| 15 to 17 Year Olds | 60 (98.4%) | 1 (1.6%) |
| 18 to 19 Year Olds | 0 (0.0%) | 0 (0.0%) |
| 20 to 24 Year Olds | 18 (100.0%) | 0 (0.0%) |
| 25 to 34 Year Olds | 2 (100.0%) | 0 (0.0%) |
| 35 Years and over | 2 (50.0%) | 2 (50.0%) |
| Total | 215 (93.5%) | 15 (6.5%) |
Educational Attainment by Field of Study in Hebron
Science & technology (34 | 35.4%), education (26 | 27.1%), liberal arts & history (9 | 9.4%), arts & humanities (6 | 6.2%), and bio, nature & agricultural (4 | 4.2%) are the most common fields of study among 96 individuals in Hebron who have obtained a bachelor's degree or higher.
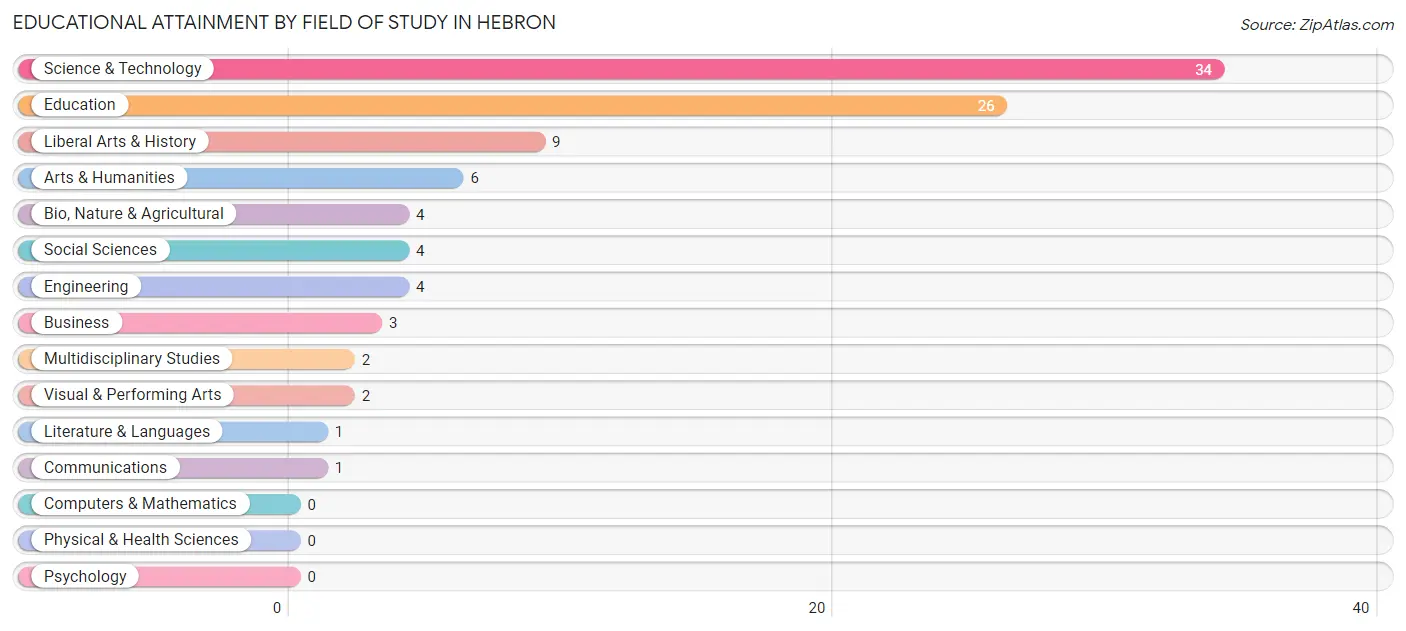
| Field of Study | # Graduates | % Graduates |
| Computers & Mathematics | 0 | 0.0% |
| Bio, Nature & Agricultural | 4 | 4.2% |
| Physical & Health Sciences | 0 | 0.0% |
| Psychology | 0 | 0.0% |
| Social Sciences | 4 | 4.2% |
| Engineering | 4 | 4.2% |
| Multidisciplinary Studies | 2 | 2.1% |
| Science & Technology | 34 | 35.4% |
| Business | 3 | 3.1% |
| Education | 26 | 27.1% |
| Literature & Languages | 1 | 1.0% |
| Liberal Arts & History | 9 | 9.4% |
| Visual & Performing Arts | 2 | 2.1% |
| Communications | 1 | 1.0% |
| Arts & Humanities | 6 | 6.2% |
| Total | 96 | 100.0% |
Transportation & Commute in Hebron
Vehicle Availability by Sex in Hebron
The most prevalent vehicle ownership categories in Hebron are males with 2 vehicles (70, accounting for 42.2%) and females with 2 vehicles (54, making up 46.7%).
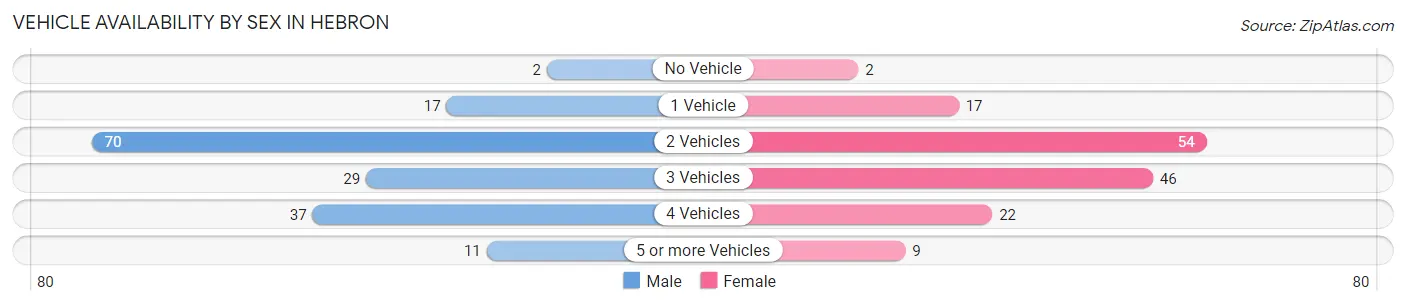
| Vehicles Available | Male | Female |
| No Vehicle | 2 (1.2%) | 2 (1.3%) |
| 1 Vehicle | 17 (10.2%) | 17 (11.3%) |
| 2 Vehicles | 70 (42.2%) | 54 (36.0%) |
| 3 Vehicles | 29 (17.5%) | 46 (30.7%) |
| 4 Vehicles | 37 (22.3%) | 22 (14.7%) |
| 5 or more Vehicles | 11 (6.6%) | 9 (6.0%) |
| Total | 166 (100.0%) | 150 (100.0%) |
Commute Time in Hebron
The most frequently occuring commute durations in Hebron are 5 to 9 minutes (70 commuters, 23.3%), 45 to 59 minutes (52 commuters, 17.3%), and 15 to 19 minutes (44 commuters, 14.6%).
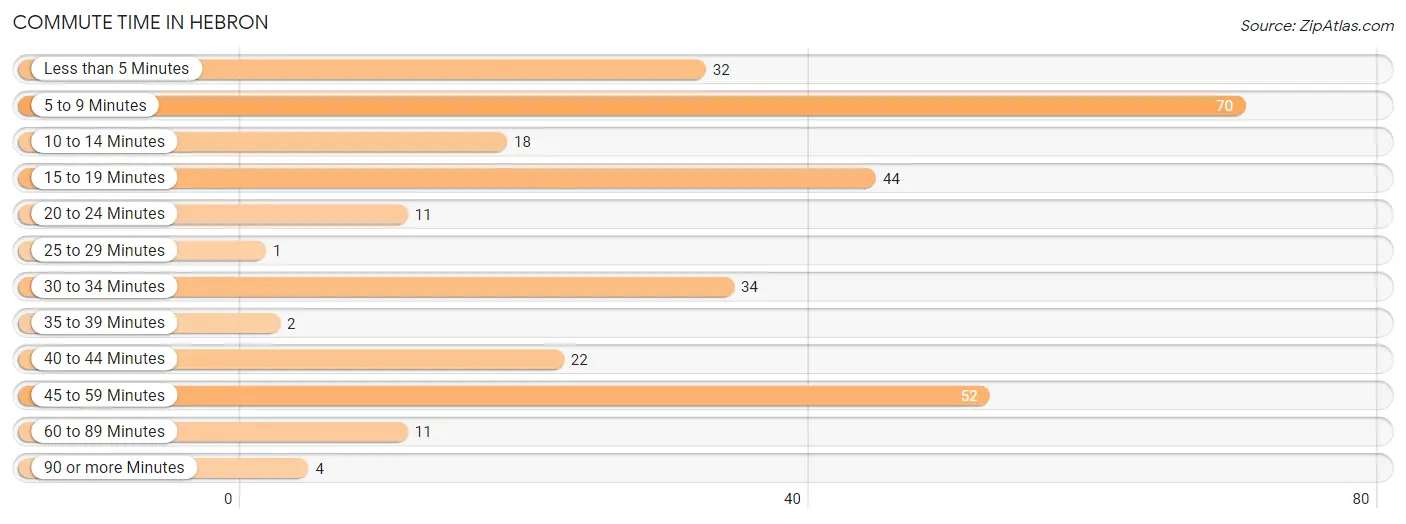
| Commute Time | # Commuters | % Commuters |
| Less than 5 Minutes | 32 | 10.6% |
| 5 to 9 Minutes | 70 | 23.3% |
| 10 to 14 Minutes | 18 | 6.0% |
| 15 to 19 Minutes | 44 | 14.6% |
| 20 to 24 Minutes | 11 | 3.6% |
| 25 to 29 Minutes | 1 | 0.3% |
| 30 to 34 Minutes | 34 | 11.3% |
| 35 to 39 Minutes | 2 | 0.7% |
| 40 to 44 Minutes | 22 | 7.3% |
| 45 to 59 Minutes | 52 | 17.3% |
| 60 to 89 Minutes | 11 | 3.6% |
| 90 or more Minutes | 4 | 1.3% |
Commute Time by Sex in Hebron
The most common commute times in Hebron are 45 to 59 minutes (40 commuters, 24.7%) for males and 5 to 9 minutes (37 commuters, 26.6%) for females.
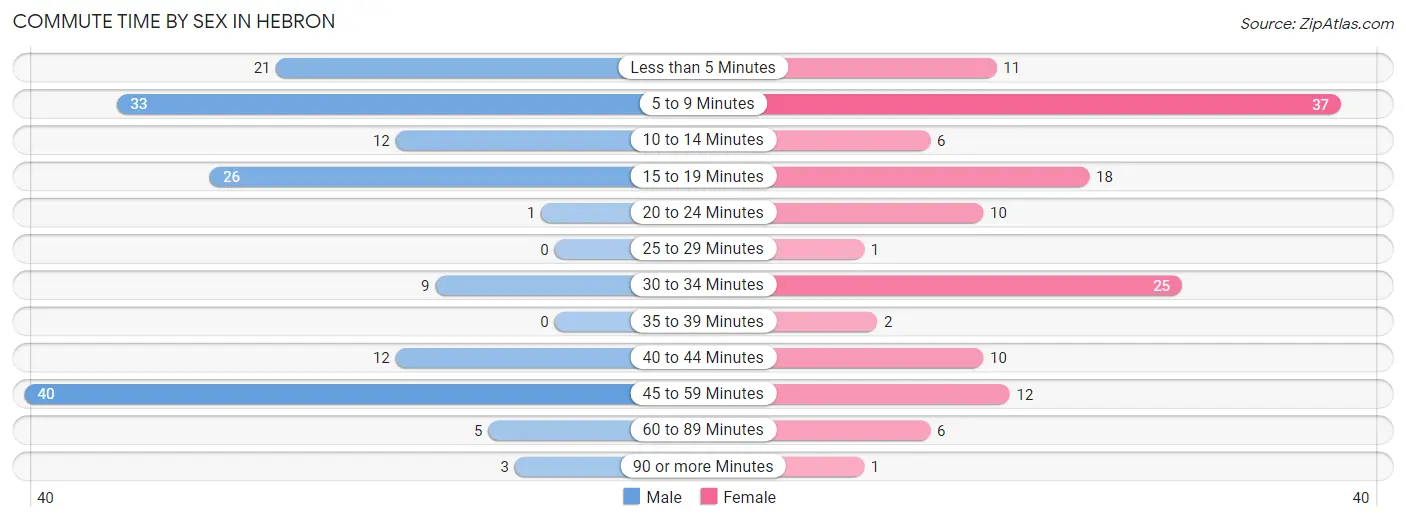
| Commute Time | Male | Female |
| Less than 5 Minutes | 21 (13.0%) | 11 (7.9%) |
| 5 to 9 Minutes | 33 (20.4%) | 37 (26.6%) |
| 10 to 14 Minutes | 12 (7.4%) | 6 (4.3%) |
| 15 to 19 Minutes | 26 (16.1%) | 18 (13.0%) |
| 20 to 24 Minutes | 1 (0.6%) | 10 (7.2%) |
| 25 to 29 Minutes | 0 (0.0%) | 1 (0.7%) |
| 30 to 34 Minutes | 9 (5.6%) | 25 (18.0%) |
| 35 to 39 Minutes | 0 (0.0%) | 2 (1.4%) |
| 40 to 44 Minutes | 12 (7.4%) | 10 (7.2%) |
| 45 to 59 Minutes | 40 (24.7%) | 12 (8.6%) |
| 60 to 89 Minutes | 5 (3.1%) | 6 (4.3%) |
| 90 or more Minutes | 3 (1.8%) | 1 (0.7%) |
Time of Departure to Work by Sex in Hebron
The most frequent times of departure to work in Hebron are 7:30 AM to 7:59 AM (34, 21.0%) for males and 12:00 PM to 3:59 PM (33, 23.7%) for females.
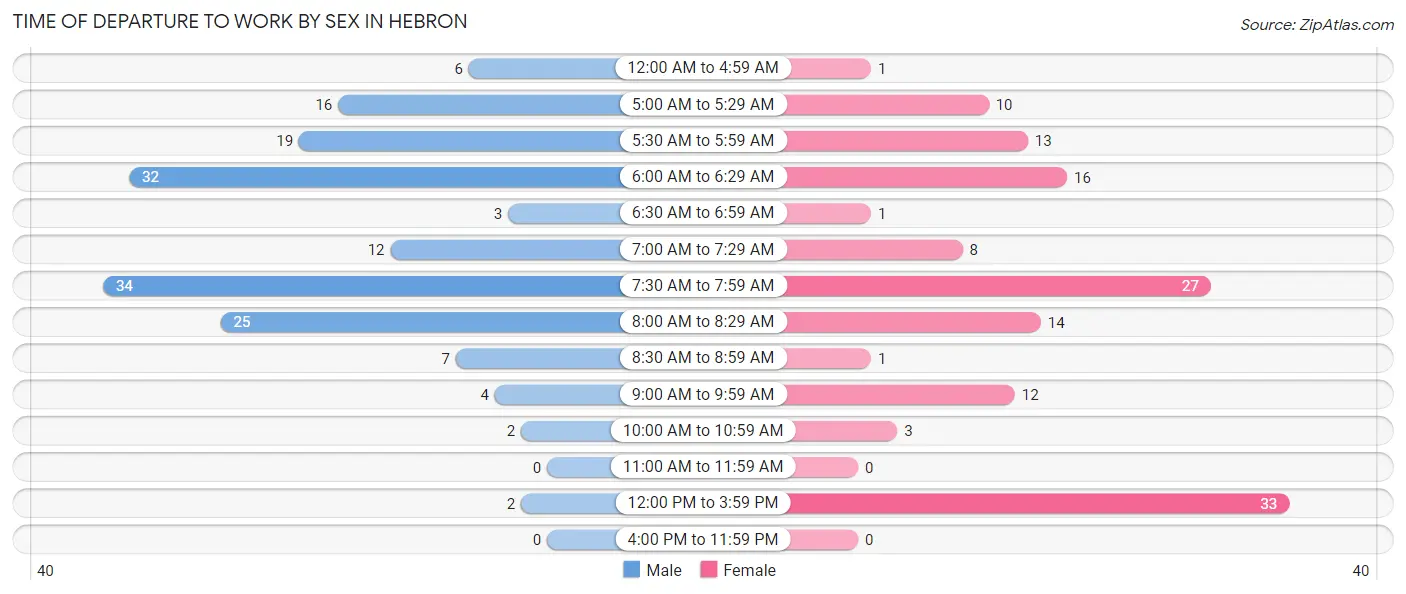
| Time of Departure | Male | Female |
| 12:00 AM to 4:59 AM | 6 (3.7%) | 1 (0.7%) |
| 5:00 AM to 5:29 AM | 16 (9.9%) | 10 (7.2%) |
| 5:30 AM to 5:59 AM | 19 (11.7%) | 13 (9.3%) |
| 6:00 AM to 6:29 AM | 32 (19.8%) | 16 (11.5%) |
| 6:30 AM to 6:59 AM | 3 (1.8%) | 1 (0.7%) |
| 7:00 AM to 7:29 AM | 12 (7.4%) | 8 (5.8%) |
| 7:30 AM to 7:59 AM | 34 (21.0%) | 27 (19.4%) |
| 8:00 AM to 8:29 AM | 25 (15.4%) | 14 (10.1%) |
| 8:30 AM to 8:59 AM | 7 (4.3%) | 1 (0.7%) |
| 9:00 AM to 9:59 AM | 4 (2.5%) | 12 (8.6%) |
| 10:00 AM to 10:59 AM | 2 (1.2%) | 3 (2.2%) |
| 11:00 AM to 11:59 AM | 0 (0.0%) | 0 (0.0%) |
| 12:00 PM to 3:59 PM | 2 (1.2%) | 33 (23.7%) |
| 4:00 PM to 11:59 PM | 0 (0.0%) | 0 (0.0%) |
| Total | 162 (100.0%) | 139 (100.0%) |
Housing Occupancy in Hebron
Occupancy by Ownership in Hebron
Of the total 275 dwellings in Hebron, owner-occupied units account for 216 (78.5%), while renter-occupied units make up 59 (21.4%).
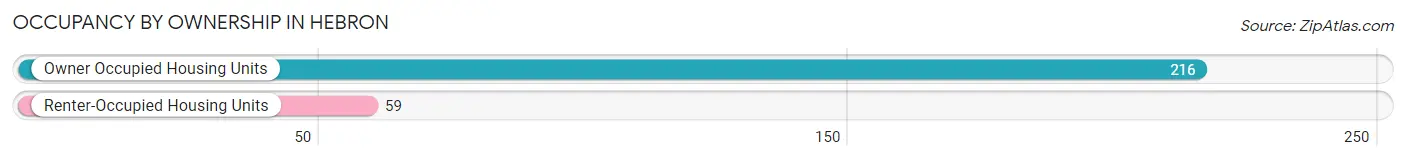
| Occupancy | # Housing Units | % Housing Units |
| Owner Occupied Housing Units | 216 | 78.5% |
| Renter-Occupied Housing Units | 59 | 21.4% |
| Total Occupied Housing Units | 275 | 100.0% |
Occupancy by Household Size in Hebron
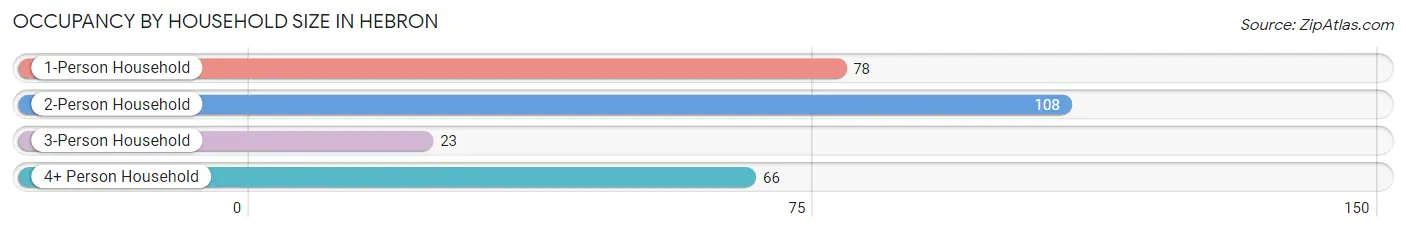
| Household Size | # Housing Units | % Housing Units |
| 1-Person Household | 78 | 28.4% |
| 2-Person Household | 108 | 39.3% |
| 3-Person Household | 23 | 8.4% |
| 4+ Person Household | 66 | 24.0% |
| Total Housing Units | 275 | 100.0% |
Occupancy by Ownership by Household Size in Hebron
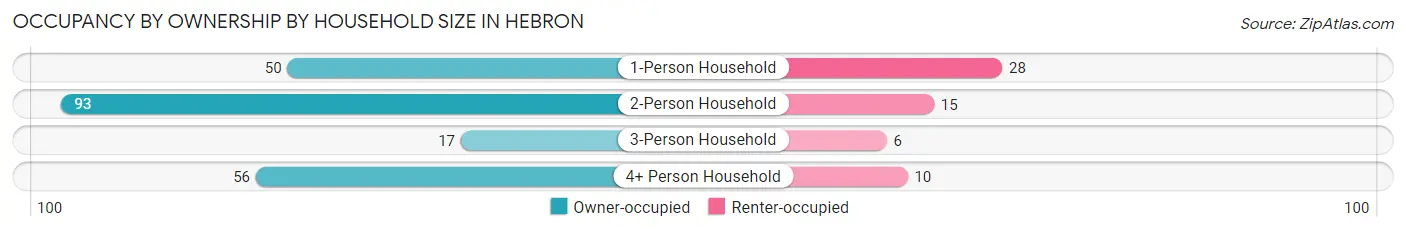
| Household Size | Owner-occupied | Renter-occupied |
| 1-Person Household | 50 (64.1%) | 28 (35.9%) |
| 2-Person Household | 93 (86.1%) | 15 (13.9%) |
| 3-Person Household | 17 (73.9%) | 6 (26.1%) |
| 4+ Person Household | 56 (84.9%) | 10 (15.1%) |
| Total Housing Units | 216 (78.5%) | 59 (21.4%) |
Occupancy by Educational Attainment in Hebron
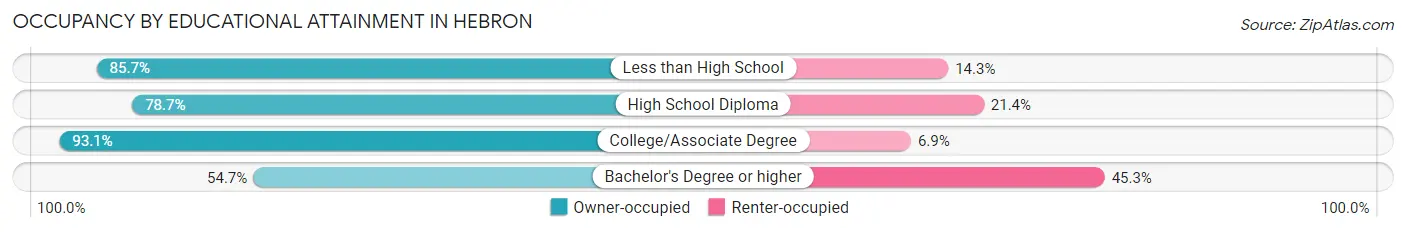
| Household Size | Owner-occupied | Renter-occupied |
| Less than High School | 30 (85.7%) | 5 (14.3%) |
| High School Diploma | 70 (78.6%) | 19 (21.3%) |
| College/Associate Degree | 81 (93.1%) | 6 (6.9%) |
| Bachelor's Degree or higher | 35 (54.7%) | 29 (45.3%) |
Occupancy by Age of Householder in Hebron
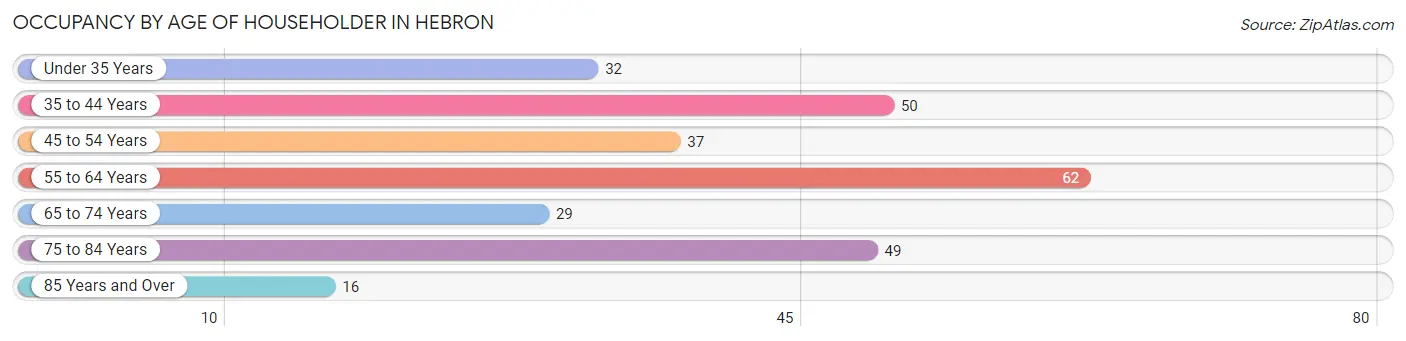
| Age Bracket | # Households | % Households |
| Under 35 Years | 32 | 11.6% |
| 35 to 44 Years | 50 | 18.2% |
| 45 to 54 Years | 37 | 13.5% |
| 55 to 64 Years | 62 | 22.6% |
| 65 to 74 Years | 29 | 10.5% |
| 75 to 84 Years | 49 | 17.8% |
| 85 Years and Over | 16 | 5.8% |
| Total | 275 | 100.0% |
Housing Finances in Hebron
Median Income by Occupancy in Hebron
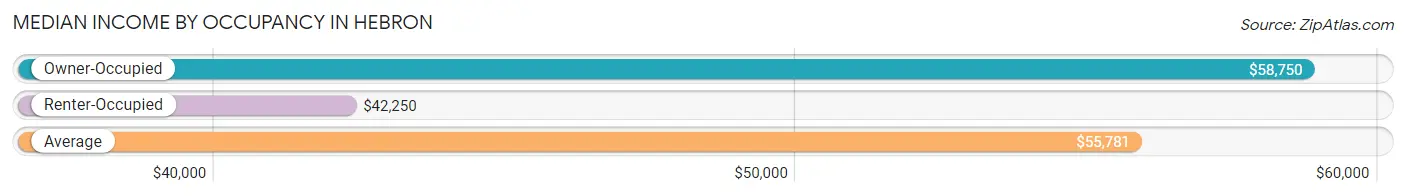
| Occupancy Type | # Households | Median Income |
| Owner-Occupied | 216 (78.5%) | $58,750 |
| Renter-Occupied | 59 (21.4%) | $42,250 |
| Average | 275 (100.0%) | $55,781 |
Occupancy by Householder Income Bracket in Hebron
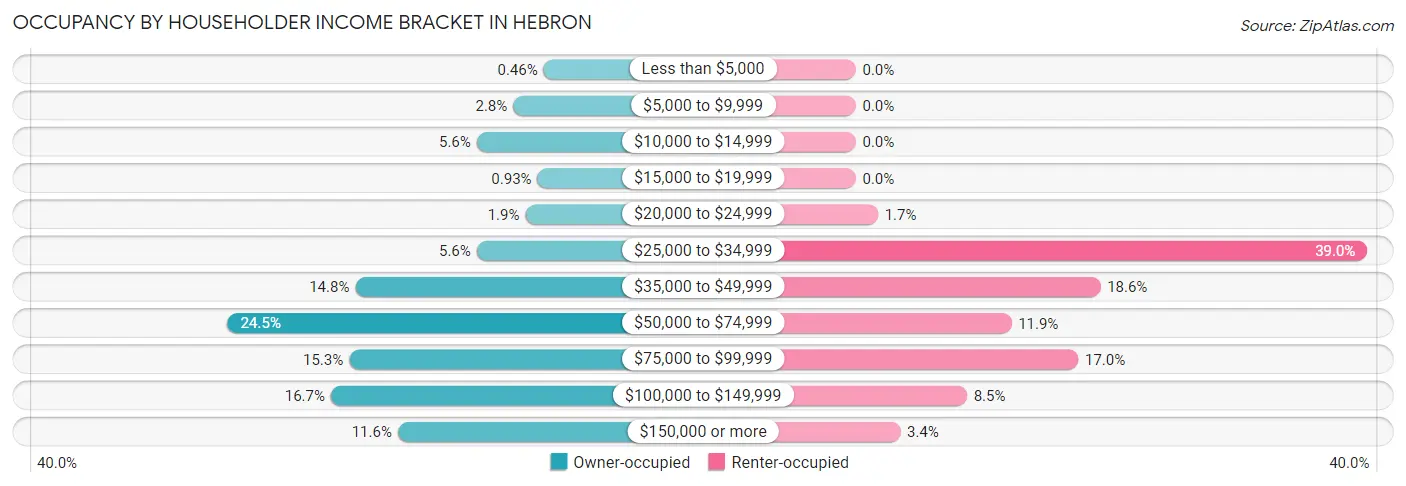
| Income Bracket | Owner-occupied | Renter-occupied |
| Less than $5,000 | 1 (0.5%) | 0 (0.0%) |
| $5,000 to $9,999 | 6 (2.8%) | 0 (0.0%) |
| $10,000 to $14,999 | 12 (5.6%) | 0 (0.0%) |
| $15,000 to $19,999 | 2 (0.9%) | 0 (0.0%) |
| $20,000 to $24,999 | 4 (1.8%) | 1 (1.7%) |
| $25,000 to $34,999 | 12 (5.6%) | 23 (39.0%) |
| $35,000 to $49,999 | 32 (14.8%) | 11 (18.6%) |
| $50,000 to $74,999 | 53 (24.5%) | 7 (11.9%) |
| $75,000 to $99,999 | 33 (15.3%) | 10 (17.0%) |
| $100,000 to $149,999 | 36 (16.7%) | 5 (8.5%) |
| $150,000 or more | 25 (11.6%) | 2 (3.4%) |
| Total | 216 (100.0%) | 59 (100.0%) |
Monthly Housing Cost Tiers in Hebron
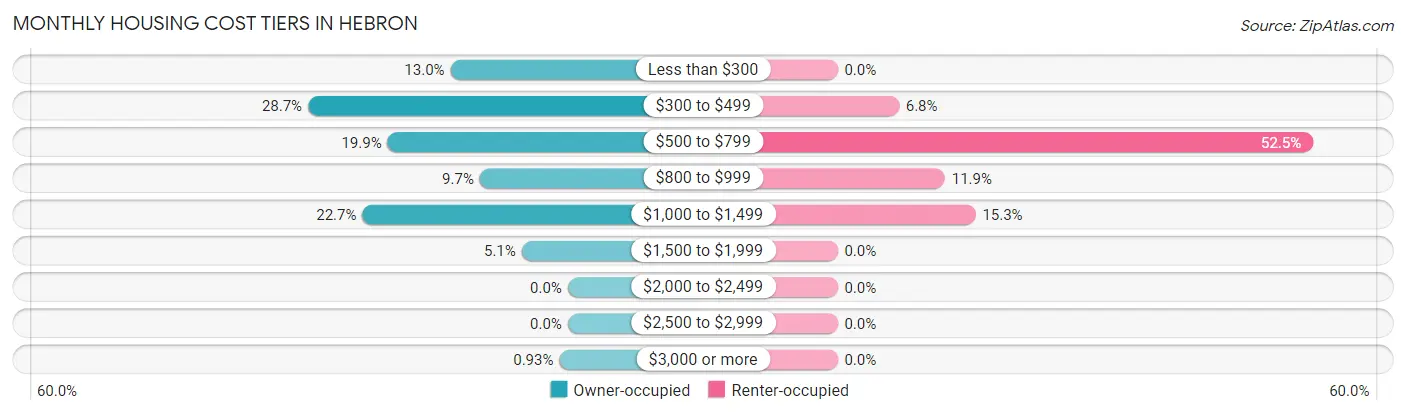
| Monthly Cost | Owner-occupied | Renter-occupied |
| Less than $300 | 28 (13.0%) | 0 (0.0%) |
| $300 to $499 | 62 (28.7%) | 4 (6.8%) |
| $500 to $799 | 43 (19.9%) | 31 (52.5%) |
| $800 to $999 | 21 (9.7%) | 7 (11.9%) |
| $1,000 to $1,499 | 49 (22.7%) | 9 (15.2%) |
| $1,500 to $1,999 | 11 (5.1%) | 0 (0.0%) |
| $2,000 to $2,499 | 0 (0.0%) | 0 (0.0%) |
| $2,500 to $2,999 | 0 (0.0%) | 0 (0.0%) |
| $3,000 or more | 2 (0.9%) | 0 (0.0%) |
| Total | 216 (100.0%) | 59 (100.0%) |
Physical Housing Characteristics in Hebron
Housing Structures in Hebron
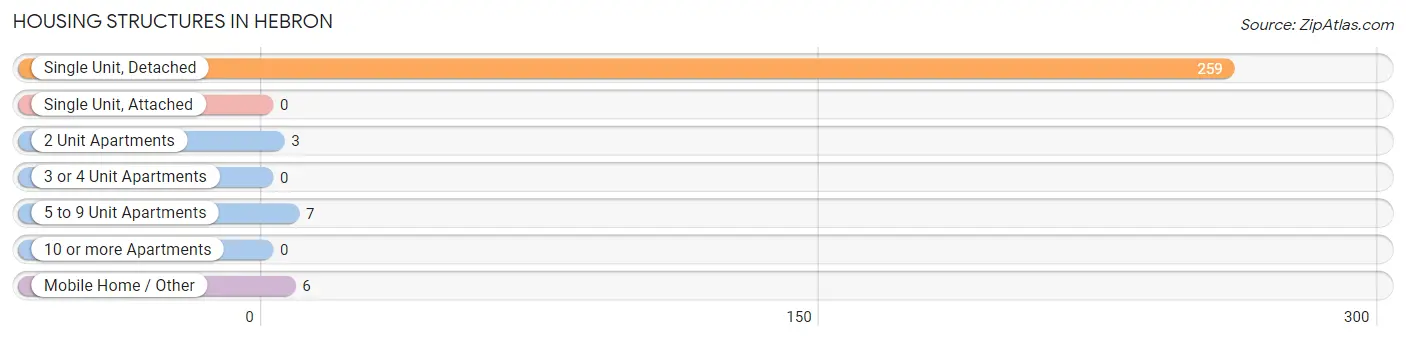
| Structure Type | # Housing Units | % Housing Units |
| Single Unit, Detached | 259 | 94.2% |
| Single Unit, Attached | 0 | 0.0% |
| 2 Unit Apartments | 3 | 1.1% |
| 3 or 4 Unit Apartments | 0 | 0.0% |
| 5 to 9 Unit Apartments | 7 | 2.5% |
| 10 or more Apartments | 0 | 0.0% |
| Mobile Home / Other | 6 | 2.2% |
| Total | 275 | 100.0% |
Housing Structures by Occupancy in Hebron
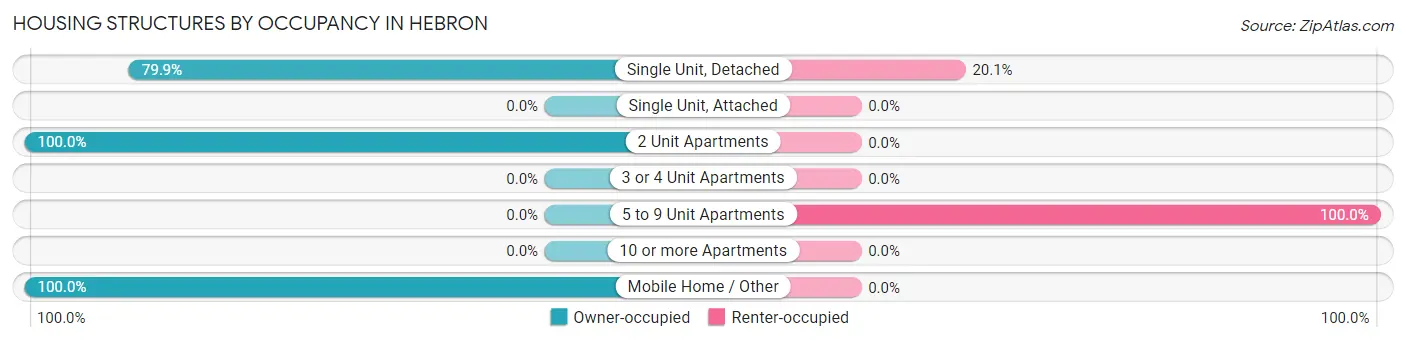
| Structure Type | Owner-occupied | Renter-occupied |
| Single Unit, Detached | 207 (79.9%) | 52 (20.1%) |
| Single Unit, Attached | 0 (0.0%) | 0 (0.0%) |
| 2 Unit Apartments | 3 (100.0%) | 0 (0.0%) |
| 3 or 4 Unit Apartments | 0 (0.0%) | 0 (0.0%) |
| 5 to 9 Unit Apartments | 0 (0.0%) | 7 (100.0%) |
| 10 or more Apartments | 0 (0.0%) | 0 (0.0%) |
| Mobile Home / Other | 6 (100.0%) | 0 (0.0%) |
| Total | 216 (78.5%) | 59 (21.4%) |
Housing Structures by Number of Rooms in Hebron
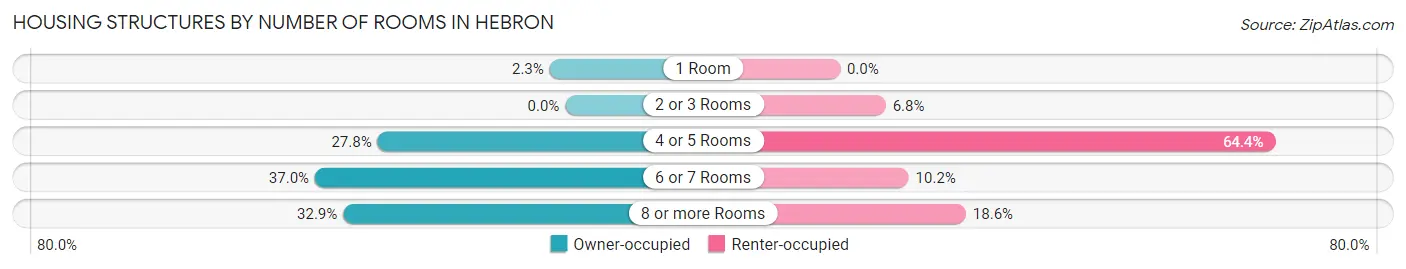
| Number of Rooms | Owner-occupied | Renter-occupied |
| 1 Room | 5 (2.3%) | 0 (0.0%) |
| 2 or 3 Rooms | 0 (0.0%) | 4 (6.8%) |
| 4 or 5 Rooms | 60 (27.8%) | 38 (64.4%) |
| 6 or 7 Rooms | 80 (37.0%) | 6 (10.2%) |
| 8 or more Rooms | 71 (32.9%) | 11 (18.6%) |
| Total | 216 (100.0%) | 59 (100.0%) |
Housing Structure by Heating Type in Hebron
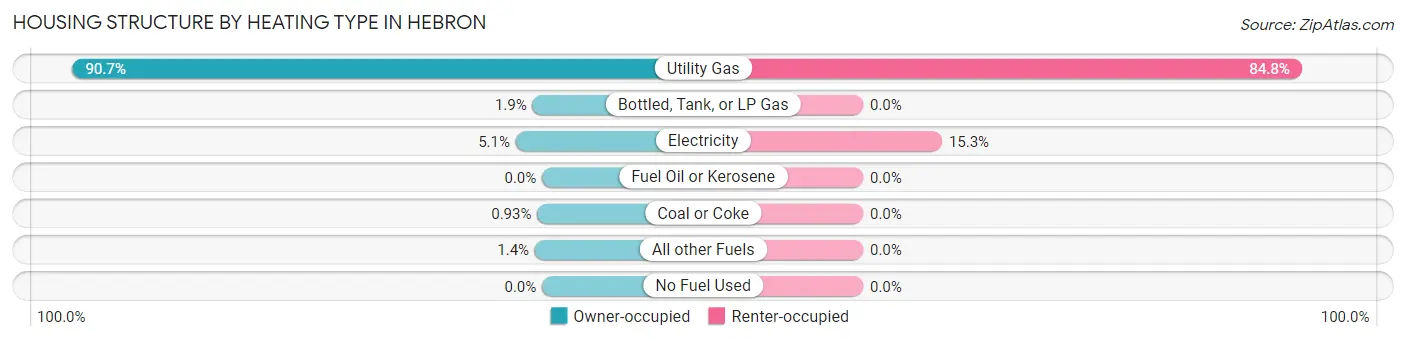
| Heating Type | Owner-occupied | Renter-occupied |
| Utility Gas | 196 (90.7%) | 50 (84.8%) |
| Bottled, Tank, or LP Gas | 4 (1.8%) | 0 (0.0%) |
| Electricity | 11 (5.1%) | 9 (15.2%) |
| Fuel Oil or Kerosene | 0 (0.0%) | 0 (0.0%) |
| Coal or Coke | 2 (0.9%) | 0 (0.0%) |
| All other Fuels | 3 (1.4%) | 0 (0.0%) |
| No Fuel Used | 0 (0.0%) | 0 (0.0%) |
| Total | 216 (100.0%) | 59 (100.0%) |
Household Vehicle Usage in Hebron
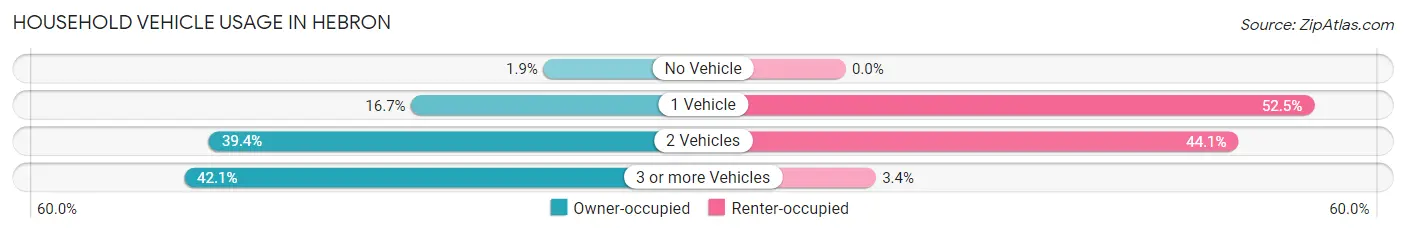
| Vehicles per Household | Owner-occupied | Renter-occupied |
| No Vehicle | 4 (1.8%) | 0 (0.0%) |
| 1 Vehicle | 36 (16.7%) | 31 (52.5%) |
| 2 Vehicles | 85 (39.4%) | 26 (44.1%) |
| 3 or more Vehicles | 91 (42.1%) | 2 (3.4%) |
| Total | 216 (100.0%) | 59 (100.0%) |
Real Estate & Mortgages in Hebron
Real Estate and Mortgage Overview in Hebron
| Characteristic | Without Mortgage | With Mortgage |
| Housing Units | 126 | 90 |
| Median Property Value | $83,800 | $136,100 |
| Median Household Income | $52,895 | $15 |
| Monthly Housing Costs | $391 | $2 |
| Real Estate Taxes | $940 | $0 |
Property Value by Mortgage Status in Hebron
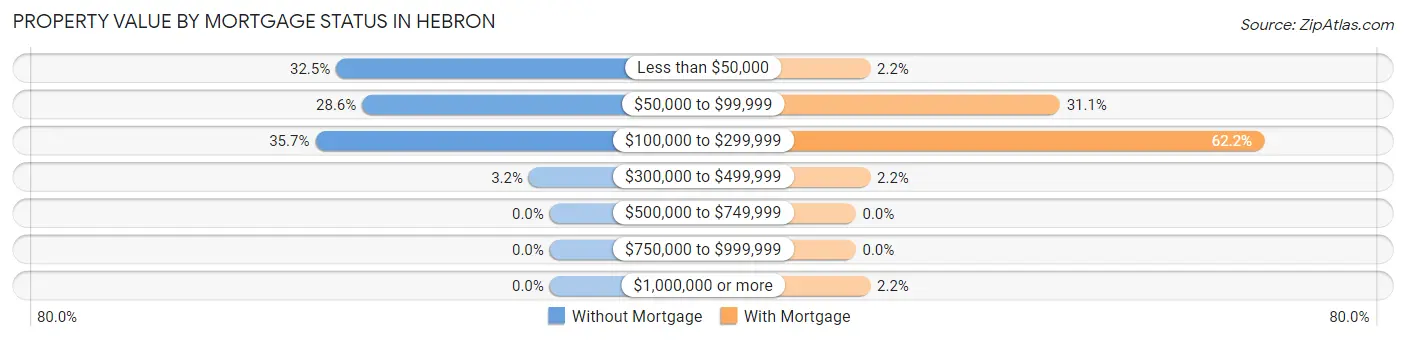
| Property Value | Without Mortgage | With Mortgage |
| Less than $50,000 | 41 (32.5%) | 2 (2.2%) |
| $50,000 to $99,999 | 36 (28.6%) | 28 (31.1%) |
| $100,000 to $299,999 | 45 (35.7%) | 56 (62.2%) |
| $300,000 to $499,999 | 4 (3.2%) | 2 (2.2%) |
| $500,000 to $749,999 | 0 (0.0%) | 0 (0.0%) |
| $750,000 to $999,999 | 0 (0.0%) | 0 (0.0%) |
| $1,000,000 or more | 0 (0.0%) | 2 (2.2%) |
| Total | 126 (100.0%) | 90 (100.0%) |
Household Income by Mortgage Status in Hebron
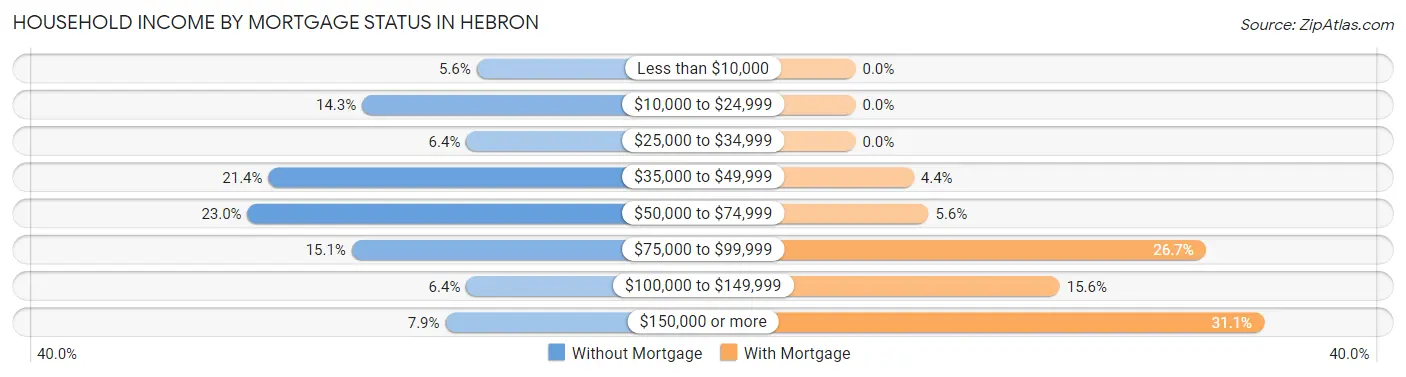
| Household Income | Without Mortgage | With Mortgage |
| Less than $10,000 | 7 (5.6%) | 0 (0.0%) |
| $10,000 to $24,999 | 18 (14.3%) | 0 (0.0%) |
| $25,000 to $34,999 | 8 (6.4%) | 0 (0.0%) |
| $35,000 to $49,999 | 27 (21.4%) | 4 (4.4%) |
| $50,000 to $74,999 | 29 (23.0%) | 5 (5.6%) |
| $75,000 to $99,999 | 19 (15.1%) | 24 (26.7%) |
| $100,000 to $149,999 | 8 (6.4%) | 14 (15.6%) |
| $150,000 or more | 10 (7.9%) | 28 (31.1%) |
| Total | 126 (100.0%) | 90 (100.0%) |
Property Value to Household Income Ratio in Hebron
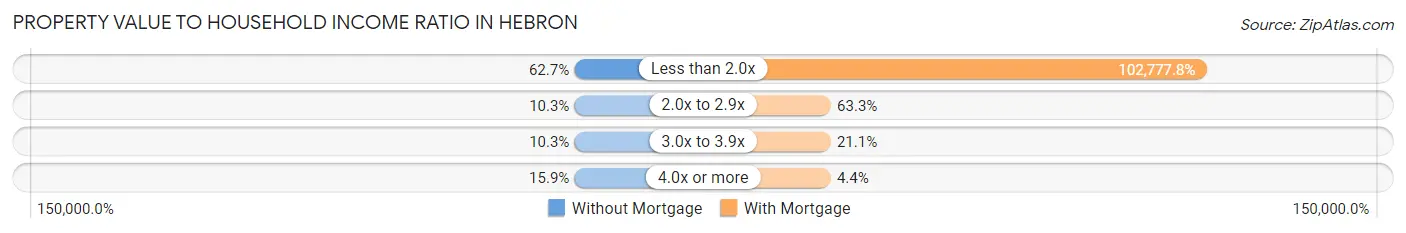
| Value-to-Income Ratio | Without Mortgage | With Mortgage |
| Less than 2.0x | 79 (62.7%) | 92,500 (102,777.8%) |
| 2.0x to 2.9x | 13 (10.3%) | 57 (63.3%) |
| 3.0x to 3.9x | 13 (10.3%) | 19 (21.1%) |
| 4.0x or more | 20 (15.9%) | 4 (4.4%) |
| Total | 126 (100.0%) | 90 (100.0%) |
Real Estate Taxes by Mortgage Status in Hebron
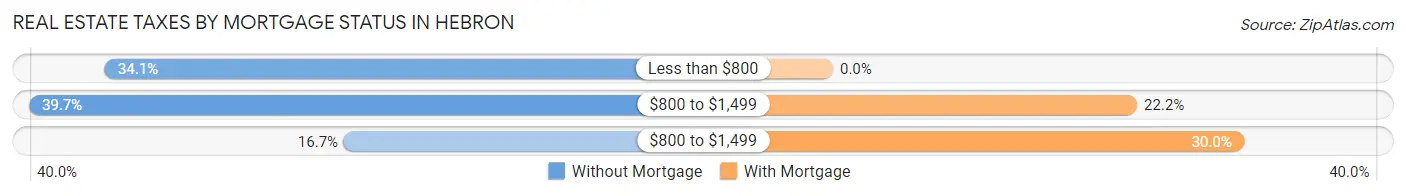
| Property Taxes | Without Mortgage | With Mortgage |
| Less than $800 | 43 (34.1%) | 0 (0.0%) |
| $800 to $1,499 | 50 (39.7%) | 20 (22.2%) |
| $800 to $1,499 | 21 (16.7%) | 27 (30.0%) |
| Total | 126 (100.0%) | 90 (100.0%) |
Health & Disability in Hebron
Health Insurance Coverage by Age in Hebron
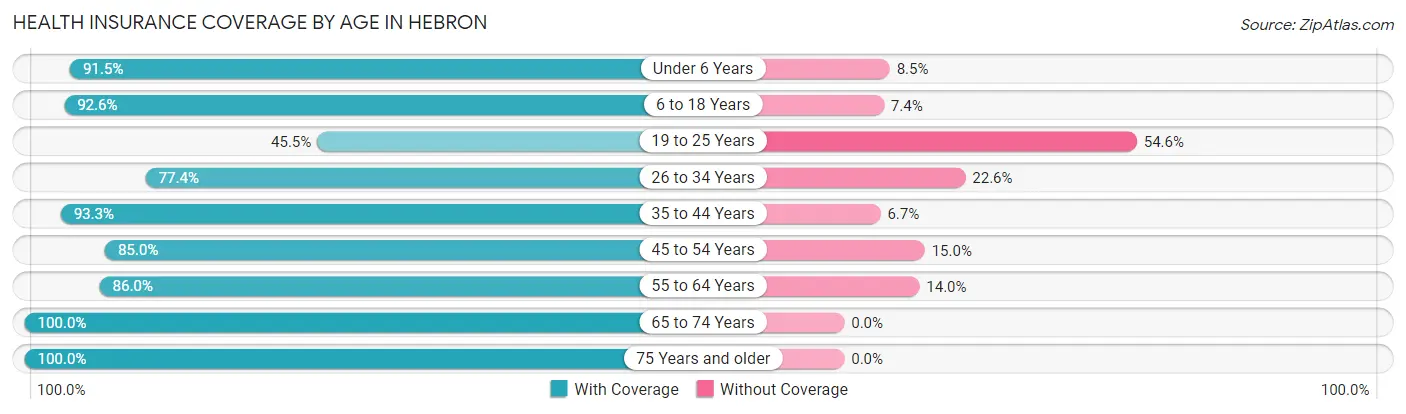
| Age Bracket | With Coverage | Without Coverage |
| Under 6 Years | 54 (91.5%) | 5 (8.5%) |
| 6 to 18 Years | 188 (92.6%) | 15 (7.4%) |
| 19 to 25 Years | 15 (45.5%) | 18 (54.5%) |
| 26 to 34 Years | 48 (77.4%) | 14 (22.6%) |
| 35 to 44 Years | 83 (93.3%) | 6 (6.7%) |
| 45 to 54 Years | 51 (85.0%) | 9 (15.0%) |
| 55 to 64 Years | 86 (86.0%) | 14 (14.0%) |
| 65 to 74 Years | 63 (100.0%) | 0 (0.0%) |
| 75 Years and older | 85 (100.0%) | 0 (0.0%) |
| Total | 673 (89.3%) | 81 (10.7%) |
Health Insurance Coverage by Citizenship Status in Hebron
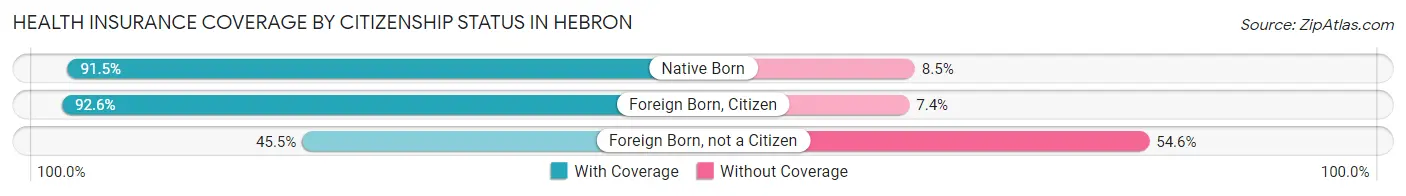
| Citizenship Status | With Coverage | Without Coverage |
| Native Born | 54 (91.5%) | 5 (8.5%) |
| Foreign Born, Citizen | 188 (92.6%) | 15 (7.4%) |
| Foreign Born, not a Citizen | 15 (45.5%) | 18 (54.5%) |
Health Insurance Coverage by Household Income in Hebron
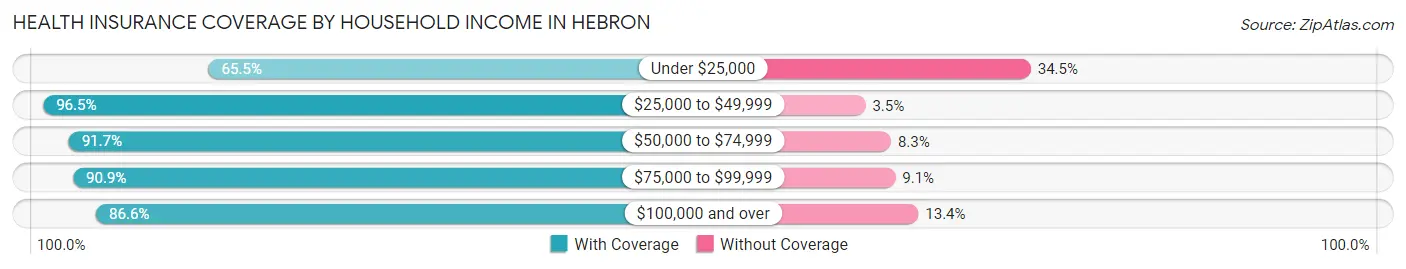
| Household Income | With Coverage | Without Coverage |
| Under $25,000 | 19 (65.5%) | 10 (34.5%) |
| $25,000 to $49,999 | 138 (96.5%) | 5 (3.5%) |
| $50,000 to $74,999 | 122 (91.7%) | 11 (8.3%) |
| $75,000 to $99,999 | 110 (90.9%) | 11 (9.1%) |
| $100,000 and over | 284 (86.6%) | 44 (13.4%) |
Public vs Private Health Insurance Coverage by Age in Hebron
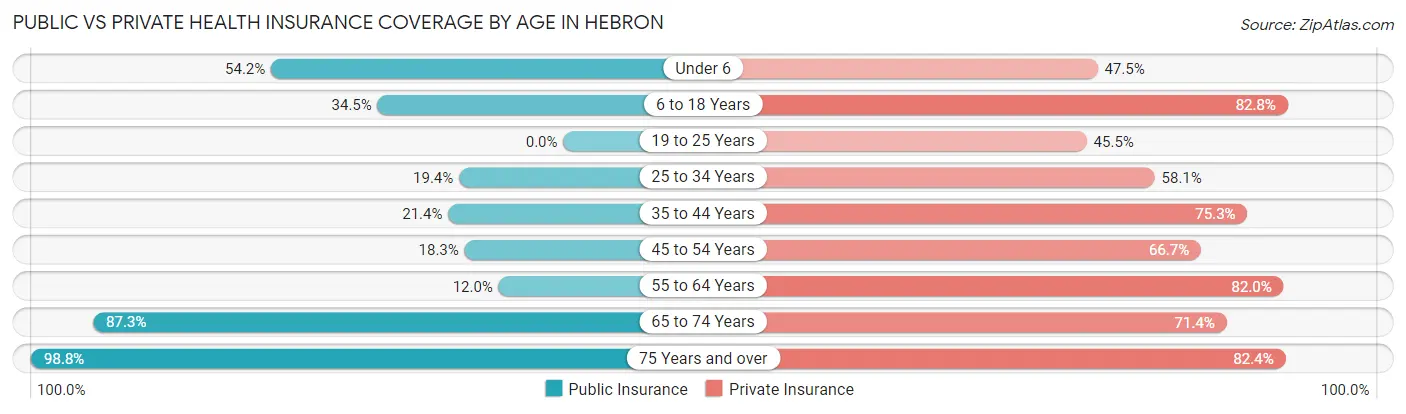
| Age Bracket | Public Insurance | Private Insurance |
| Under 6 | 32 (54.2%) | 28 (47.5%) |
| 6 to 18 Years | 70 (34.5%) | 168 (82.8%) |
| 19 to 25 Years | 0 (0.0%) | 15 (45.5%) |
| 25 to 34 Years | 12 (19.4%) | 36 (58.1%) |
| 35 to 44 Years | 19 (21.3%) | 67 (75.3%) |
| 45 to 54 Years | 11 (18.3%) | 40 (66.7%) |
| 55 to 64 Years | 12 (12.0%) | 82 (82.0%) |
| 65 to 74 Years | 55 (87.3%) | 45 (71.4%) |
| 75 Years and over | 84 (98.8%) | 70 (82.4%) |
| Total | 295 (39.1%) | 551 (73.1%) |
Disability Status by Sex by Age in Hebron
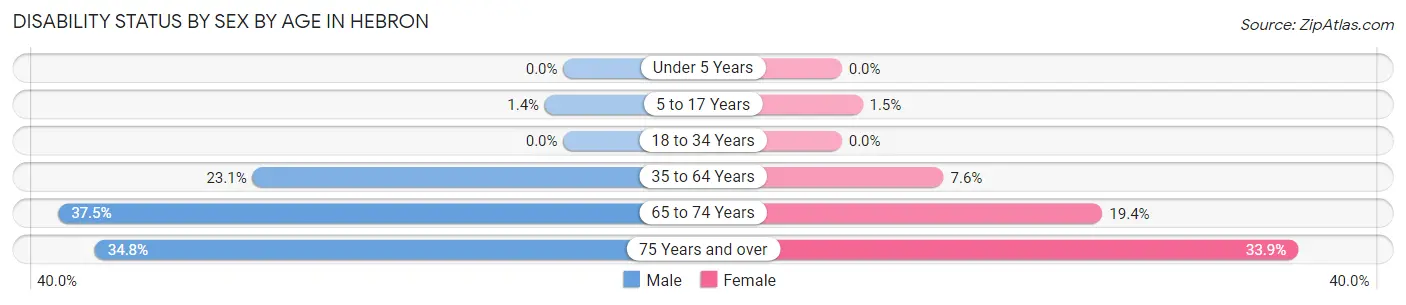
| Age Bracket | Male | Female |
| Under 5 Years | 0 (0.0%) | 0 (0.0%) |
| 5 to 17 Years | 1 (1.4%) | 2 (1.5%) |
| 18 to 34 Years | 0 (0.0%) | 0 (0.0%) |
| 35 to 64 Years | 30 (23.1%) | 9 (7.6%) |
| 65 to 74 Years | 12 (37.5%) | 6 (19.4%) |
| 75 Years and over | 8 (34.8%) | 21 (33.9%) |
Disability Class by Sex by Age in Hebron
Disability Class: Hearing Difficulty
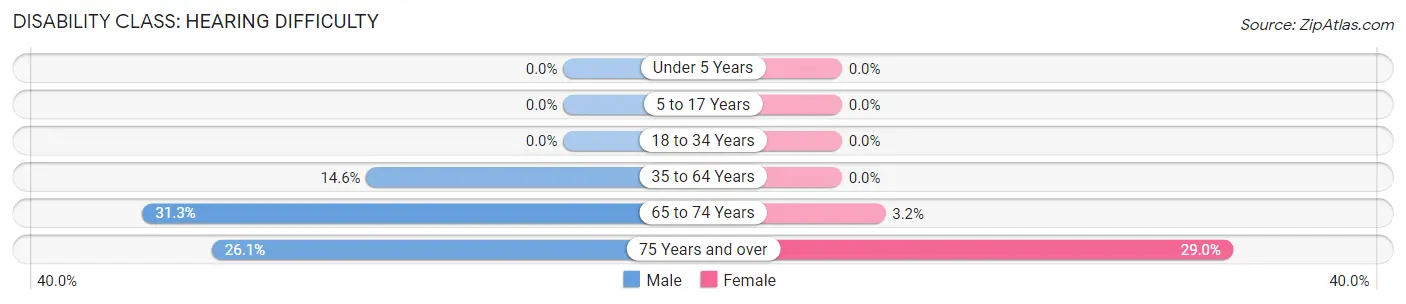
| Age Bracket | Male | Female |
| Under 5 Years | 0 (0.0%) | 0 (0.0%) |
| 5 to 17 Years | 0 (0.0%) | 0 (0.0%) |
| 18 to 34 Years | 0 (0.0%) | 0 (0.0%) |
| 35 to 64 Years | 19 (14.6%) | 0 (0.0%) |
| 65 to 74 Years | 10 (31.2%) | 1 (3.2%) |
| 75 Years and over | 6 (26.1%) | 18 (29.0%) |
Disability Class: Vision Difficulty
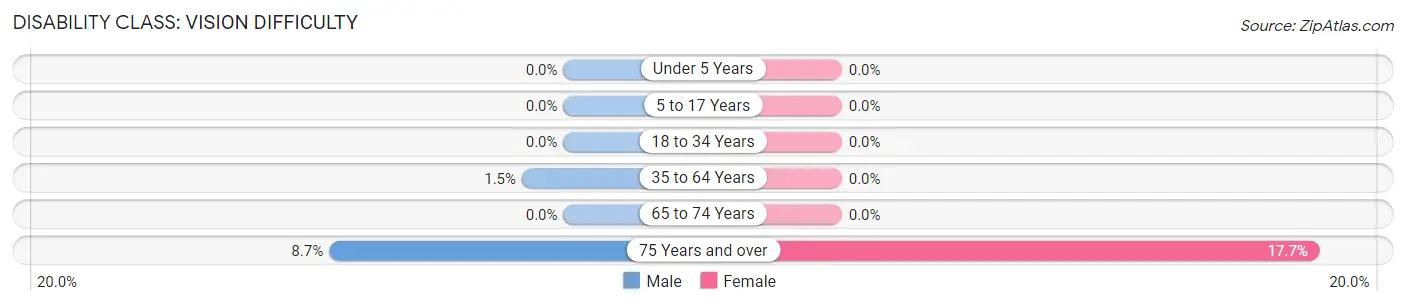
| Age Bracket | Male | Female |
| Under 5 Years | 0 (0.0%) | 0 (0.0%) |
| 5 to 17 Years | 0 (0.0%) | 0 (0.0%) |
| 18 to 34 Years | 0 (0.0%) | 0 (0.0%) |
| 35 to 64 Years | 2 (1.5%) | 0 (0.0%) |
| 65 to 74 Years | 0 (0.0%) | 0 (0.0%) |
| 75 Years and over | 2 (8.7%) | 11 (17.7%) |
Disability Class: Cognitive Difficulty
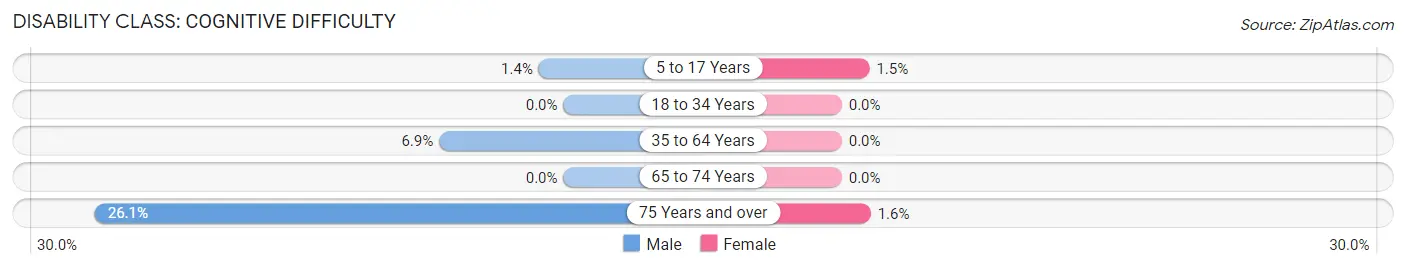
| Age Bracket | Male | Female |
| 5 to 17 Years | 1 (1.4%) | 2 (1.5%) |
| 18 to 34 Years | 0 (0.0%) | 0 (0.0%) |
| 35 to 64 Years | 9 (6.9%) | 0 (0.0%) |
| 65 to 74 Years | 0 (0.0%) | 0 (0.0%) |
| 75 Years and over | 6 (26.1%) | 1 (1.6%) |
Disability Class: Ambulatory Difficulty
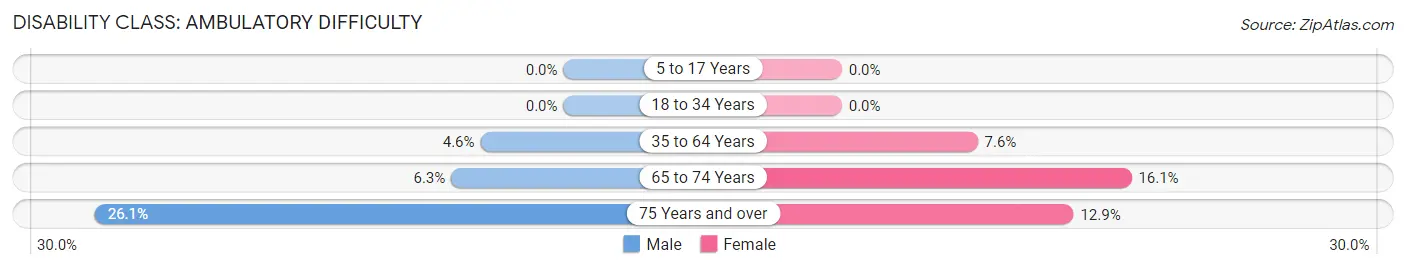
| Age Bracket | Male | Female |
| 5 to 17 Years | 0 (0.0%) | 0 (0.0%) |
| 18 to 34 Years | 0 (0.0%) | 0 (0.0%) |
| 35 to 64 Years | 6 (4.6%) | 9 (7.6%) |
| 65 to 74 Years | 2 (6.2%) | 5 (16.1%) |
| 75 Years and over | 6 (26.1%) | 8 (12.9%) |
Disability Class: Self-Care Difficulty
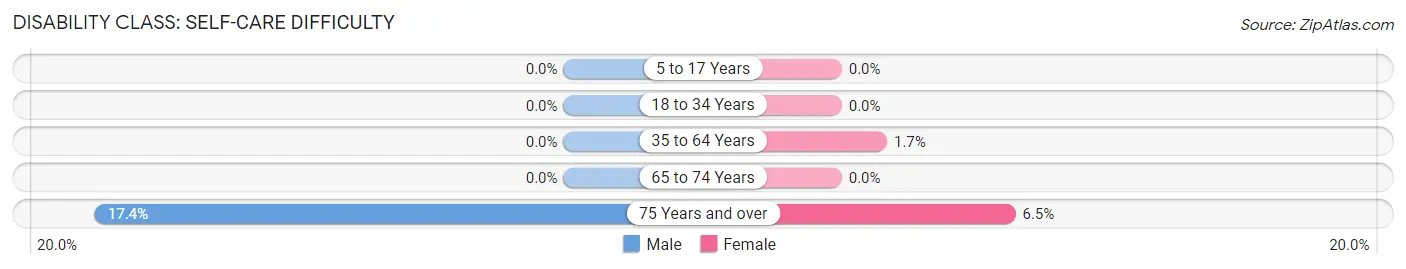
| Age Bracket | Male | Female |
| 5 to 17 Years | 0 (0.0%) | 0 (0.0%) |
| 18 to 34 Years | 0 (0.0%) | 0 (0.0%) |
| 35 to 64 Years | 0 (0.0%) | 2 (1.7%) |
| 65 to 74 Years | 0 (0.0%) | 0 (0.0%) |
| 75 Years and over | 4 (17.4%) | 4 (6.5%) |
Technology Access in Hebron
Computing Device Access in Hebron
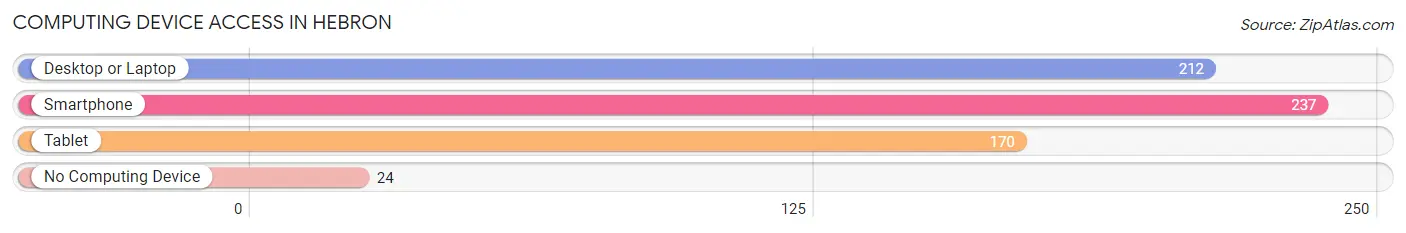
| Device Type | # Households | % Households |
| Desktop or Laptop | 212 | 77.1% |
| Smartphone | 237 | 86.2% |
| Tablet | 170 | 61.8% |
| No Computing Device | 24 | 8.7% |
| Total | 275 | 100.0% |
Internet Access in Hebron
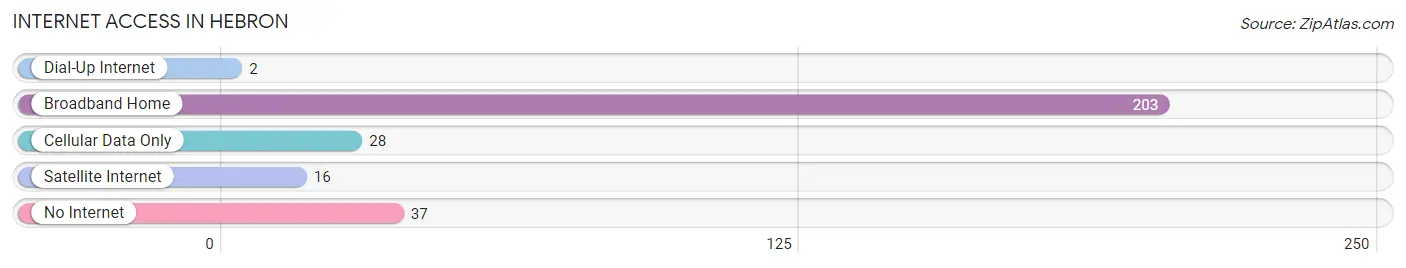
| Internet Type | # Households | % Households |
| Dial-Up Internet | 2 | 0.7% |
| Broadband Home | 203 | 73.8% |
| Cellular Data Only | 28 | 10.2% |
| Satellite Internet | 16 | 5.8% |
| No Internet | 37 | 13.5% |
| Total | 275 | 100.0% |
Hebron Summary
Hebron is a small town located in the state of North Dakota, in the United States. It is located in the southwestern part of the state, in the county of Morton. The town has a population of approximately 500 people, and is located on the banks of the Missouri River.
Hebron was founded in 1882, when the Northern Pacific Railroad was built through the area. The town was named after the biblical city of Hebron, which is located in the West Bank. The town was originally a farming community, and the main crops grown were wheat, corn, and oats.
The town of Hebron is located in an area of rolling hills and prairies. The climate is semi-arid, with hot summers and cold winters. The average annual temperature is around 50 degrees Fahrenheit. The town is located in an area of high winds, and is prone to severe thunderstorms and tornadoes.
The economy of Hebron is largely based on agriculture. The main crops grown in the area are wheat, corn, oats, and soybeans. The town also has a small manufacturing sector, which produces a variety of products, including furniture, clothing, and food products.
The demographics of Hebron are largely white, with a small percentage of African Americans, Hispanics, and Native Americans. The median household income is around $35,000, and the median home value is around $90,000. The town has a low unemployment rate, and the majority of the population is employed in the agricultural sector.
Hebron is served by a small airport, and is connected to the rest of the state by a network of highways and roads. The town is also served by a number of public schools, including a high school, a middle school, and an elementary school. The town also has a number of churches, and a library.
Hebron is a small town with a rich history and a strong sense of community. The town is a great place to live, work, and raise a family. The town is a great place to experience the beauty of the North Dakota prairies, and to enjoy the small-town atmosphere.
Common Questions
What is the Total Population of Hebron?
Total Population of Hebron is 754.
What is the Total Male Population of Hebron?
Total Male Population of Hebron is 332.
What is the Total Female Population of Hebron?
Total Female Population of Hebron is 422.
What is the Ratio of Males per 100 Females in Hebron?
There are 78.67 Males per 100 Females in Hebron.
What is the Ratio of Females per 100 Males in Hebron?
There are 127.11 Females per 100 Males in Hebron.
What is the Median Population Age in Hebron?
Median Population Age in Hebron is 36.7 Years.
What is the Average Family Size in Hebron
Average Family Size in Hebron is 3.5 People.
What is the Average Household Size in Hebron
Average Household Size in Hebron is 2.7 People.
What is Per Capita Income in Hebron?
Per Capita income in Hebron is $30,421.
What is the Median Family Income in Hebron?
Median Family Income in Hebron is $79,896.
What is the Median Household income in Hebron?
Median Household Income in Hebron is $55,781.
What is Income or Wage Gap in Hebron?
Income or Wage Gap in Hebron is 54.0%.
Women in Hebron earn 46.0 cents for every dollar earned by a man.
What is Inequality or Gini Index in Hebron?
Inequality or Gini Index in Hebron is 0.44.
How Large is the Labor Force in Hebron?
There are 322 People in the Labor Forcein in Hebron.
What is the Percentage of People in the Labor Force in Hebron?
59.5% of People are in the Labor Force in Hebron.
What is the Unemployment Rate in Hebron?
Unemployment Rate in Hebron is 0.9%.