Thompson, ND
Thompson Map
Thompson Overview
1,052
TOTAL POPULATION
536
MALE POPULATION
516
FEMALE POPULATION
103.88
MALES / 100 FEMALES
96.27
FEMALES / 100 MALES
41.5
MEDIAN AGE
3.1
AVG FAMILY SIZE
2.7
AVG HOUSEHOLD SIZE
$44,329
PER CAPITA INCOME
$123,750
AVG FAMILY INCOME
$108,333
AVG HOUSEHOLD INCOME
25.6%
WAGE / INCOME GAP [ % ]
74.4¢/ $1
WAGE / INCOME GAP [ $ ]
0.34
INEQUALITY / GINI INDEX
636
LABOR FORCE [ PEOPLE ]
78.9%
PERCENT IN LABOR FORCE
0.2%
UNEMPLOYMENT RATE
Thompson Zip Codes
Thompson Area Codes
Race in Thompson
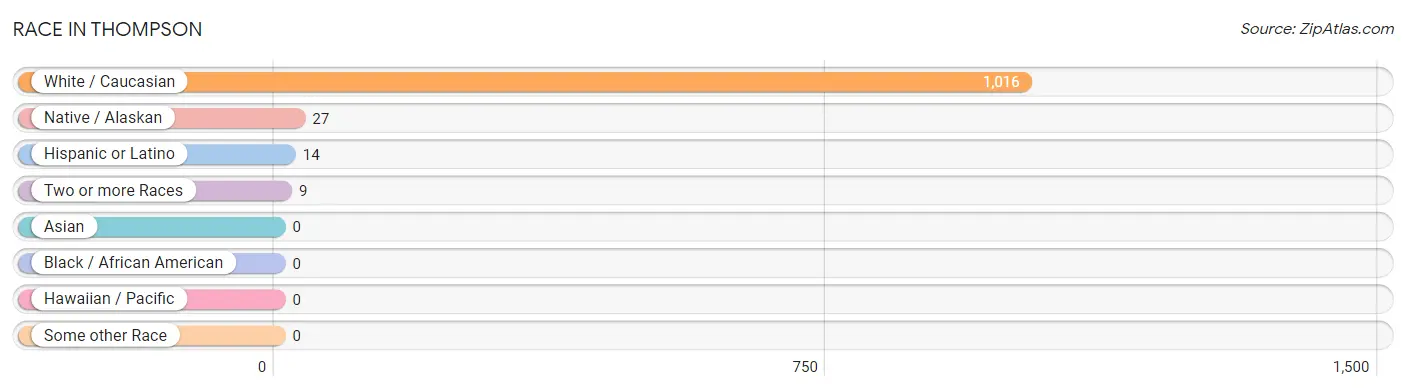
The most populous races in Thompson are White / Caucasian (1,016 | 96.6%), Native / Alaskan (27 | 2.6%), and Hispanic or Latino (14 | 1.3%).
| Race | # Population | % Population |
| Asian | 0 | 0.0% |
| Black / African American | 0 | 0.0% |
| Hawaiian / Pacific | 0 | 0.0% |
| Hispanic or Latino | 14 | 1.3% |
| Native / Alaskan | 27 | 2.6% |
| White / Caucasian | 1,016 | 96.6% |
| Two or more Races | 9 | 0.9% |
| Some other Race | 0 | 0.0% |
| Total | 1,052 | 100.0% |
Ancestry in Thompson
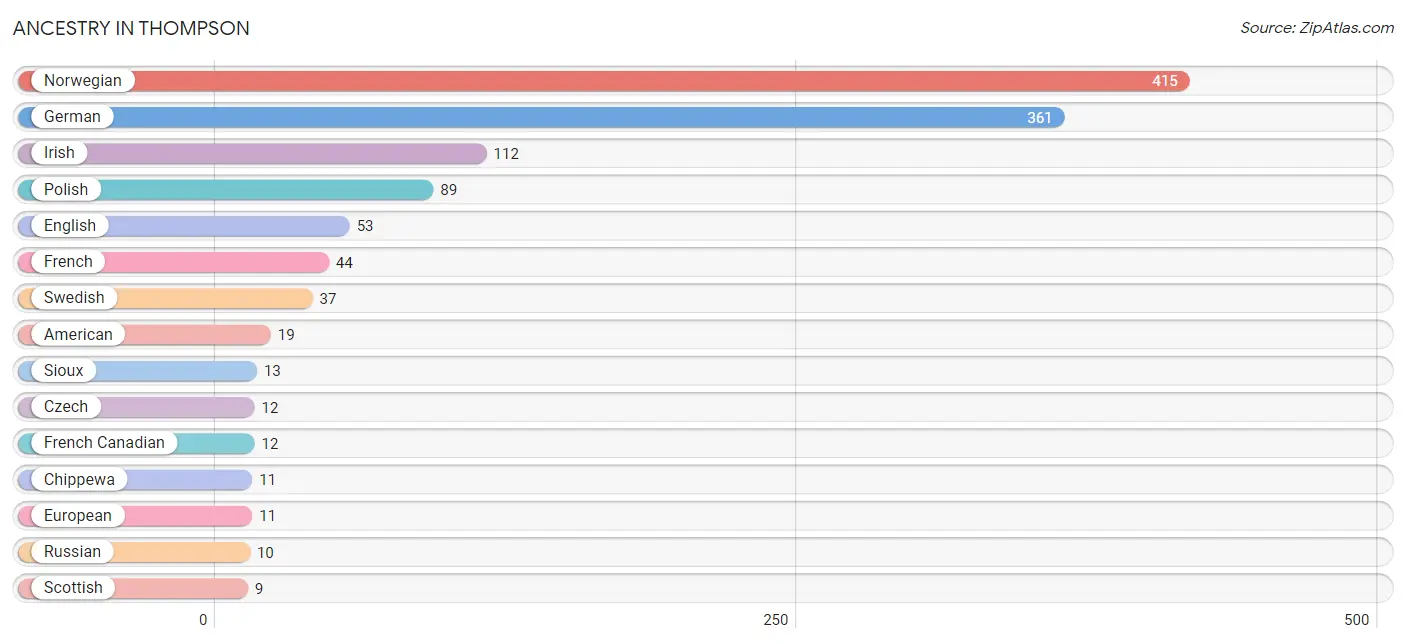
The most populous ancestries reported in Thompson are Norwegian (415 | 39.5%), German (361 | 34.3%), Irish (112 | 10.6%), Polish (89 | 8.5%), and English (53 | 5.0%), together accounting for 97.9% of all Thompson residents.
| Ancestry | # Population | % Population |
| American | 19 | 1.8% |
| British | 2 | 0.2% |
| Chippewa | 11 | 1.1% |
| Czech | 12 | 1.1% |
| Czechoslovakian | 6 | 0.6% |
| Danish | 2 | 0.2% |
| English | 53 | 5.0% |
| European | 11 | 1.1% |
| Finnish | 8 | 0.8% |
| French | 44 | 4.2% |
| French Canadian | 12 | 1.1% |
| German | 361 | 34.3% |
| Hungarian | 3 | 0.3% |
| Irish | 112 | 10.6% |
| Italian | 2 | 0.2% |
| Mexican | 7 | 0.7% |
| Norwegian | 415 | 39.5% |
| Polish | 89 | 8.5% |
| Puerto Rican | 7 | 0.7% |
| Romanian | 3 | 0.3% |
| Russian | 10 | 0.9% |
| Scandinavian | 4 | 0.4% |
| Scotch-Irish | 2 | 0.2% |
| Scottish | 9 | 0.9% |
| Sioux | 13 | 1.2% |
| Slovak | 4 | 0.4% |
| Swedish | 37 | 3.5% |
| Ukrainian | 4 | 0.4% | View All 28 Rows |
Immigrants in Thompson
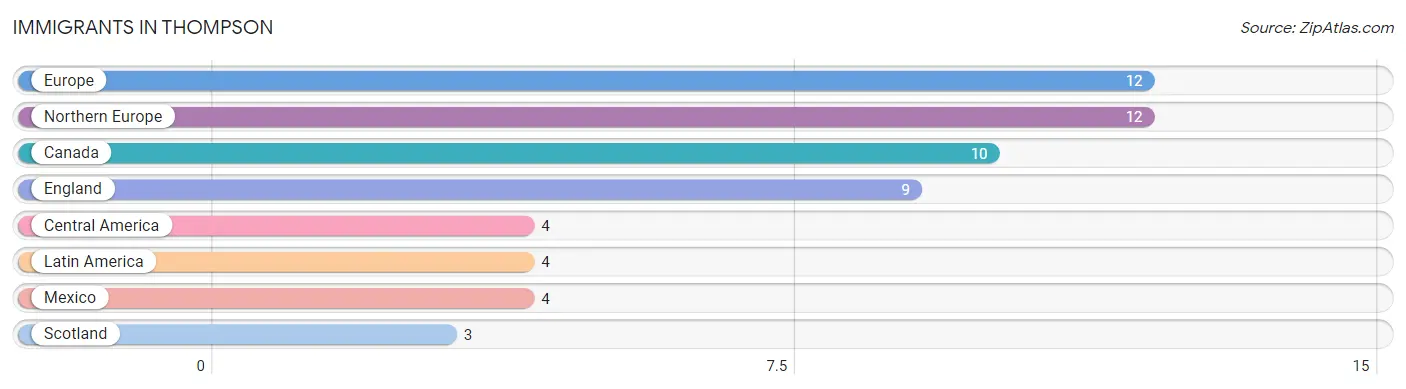
The most numerous immigrant groups reported in Thompson came from Europe (12 | 1.1%), Northern Europe (12 | 1.1%), Canada (10 | 0.9%), England (9 | 0.9%), and Central America (4 | 0.4%), together accounting for 4.5% of all Thompson residents.
| Immigration Origin | # Population | % Population |
| Canada | 10 | 0.9% |
| Central America | 4 | 0.4% |
| England | 9 | 0.9% |
| Europe | 12 | 1.1% |
| Latin America | 4 | 0.4% |
| Mexico | 4 | 0.4% |
| Northern Europe | 12 | 1.1% |
| Scotland | 3 | 0.3% | View All 8 Rows |
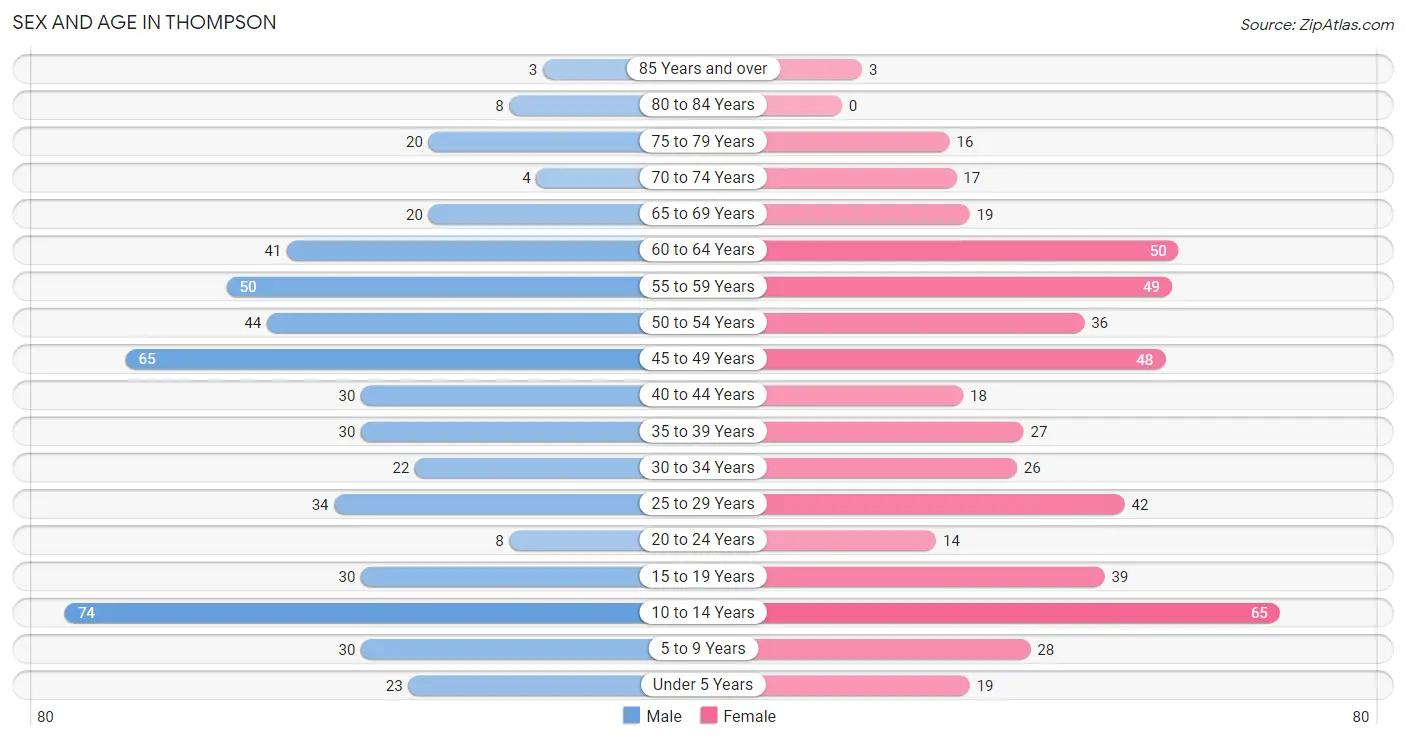
Sex and Age in Thompson
Sex and Age in Thompson
The most populous age groups in Thompson are 10 to 14 Years (74 | 13.8%) for men and 10 to 14 Years (65 | 12.6%) for women.
| Age Bracket | Male | Female |
| Under 5 Years | 23 (4.3%) | 19 (3.7%) |
| 5 to 9 Years | 30 (5.6%) | 28 (5.4%) |
| 10 to 14 Years | 74 (13.8%) | 65 (12.6%) |
| 15 to 19 Years | 30 (5.6%) | 39 (7.6%) |
| 20 to 24 Years | 8 (1.5%) | 14 (2.7%) |
| 25 to 29 Years | 34 (6.3%) | 42 (8.1%) |
| 30 to 34 Years | 22 (4.1%) | 26 (5.0%) |
| 35 to 39 Years | 30 (5.6%) | 27 (5.2%) |
| 40 to 44 Years | 30 (5.6%) | 18 (3.5%) |
| 45 to 49 Years | 65 (12.1%) | 48 (9.3%) |
| 50 to 54 Years | 44 (8.2%) | 36 (7.0%) |
| 55 to 59 Years | 50 (9.3%) | 49 (9.5%) |
| 60 to 64 Years | 41 (7.6%) | 50 (9.7%) |
| 65 to 69 Years | 20 (3.7%) | 19 (3.7%) |
| 70 to 74 Years | 4 (0.7%) | 17 (3.3%) |
| 75 to 79 Years | 20 (3.7%) | 16 (3.1%) |
| 80 to 84 Years | 8 (1.5%) | 0 (0.0%) |
| 85 Years and over | 3 (0.6%) | 3 (0.6%) |
| Total | 536 (100.0%) | 516 (100.0%) |
Families and Households in Thompson
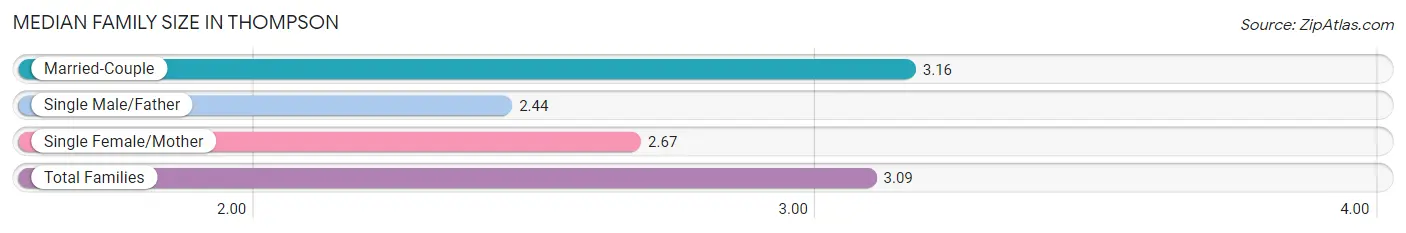
Median Family Size in Thompson
The median family size in Thompson is 3.09 persons per family, with married-couple families (262 | 87.6%) accounting for the largest median family size of 3.16 persons per family. On the other hand, single male/father families (16 | 5.3%) represent the smallest median family size with 2.44 persons per family.
| Family Type | # Families | Family Size |
| Married-Couple | 262 (87.6%) | 3.16 |
| Single Male/Father | 16 (5.3%) | 2.44 |
| Single Female/Mother | 21 (7.0%) | 2.67 |
| Total Families | 299 (100.0%) | 3.09 |
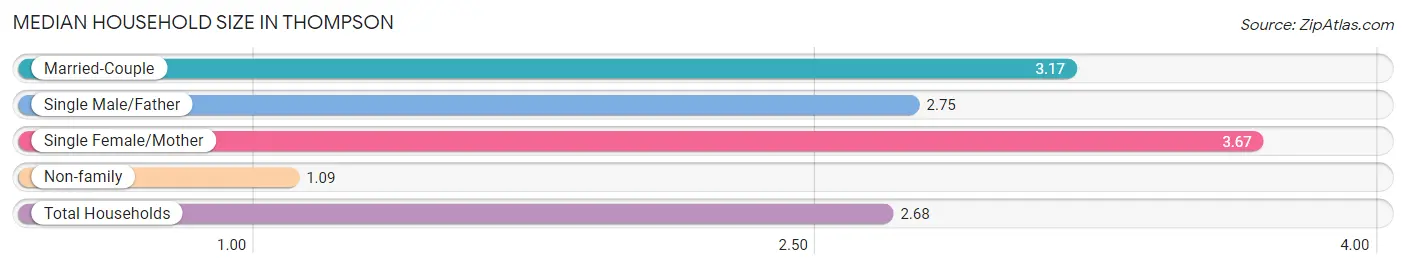
Median Household Size in Thompson
The median household size in Thompson is 2.68 persons per household, with single female/mother households (21 | 5.4%) accounting for the largest median household size of 3.67 persons per household. non-family households (93 | 23.7%) represent the smallest median household size with 1.09 persons per household.
| Household Type | # Households | Household Size |
| Married-Couple | 262 (66.8%) | 3.17 |
| Single Male/Father | 16 (4.1%) | 2.75 |
| Single Female/Mother | 21 (5.4%) | 3.67 |
| Non-family | 93 (23.7%) | 1.09 |
| Total Households | 392 (100.0%) | 2.68 |
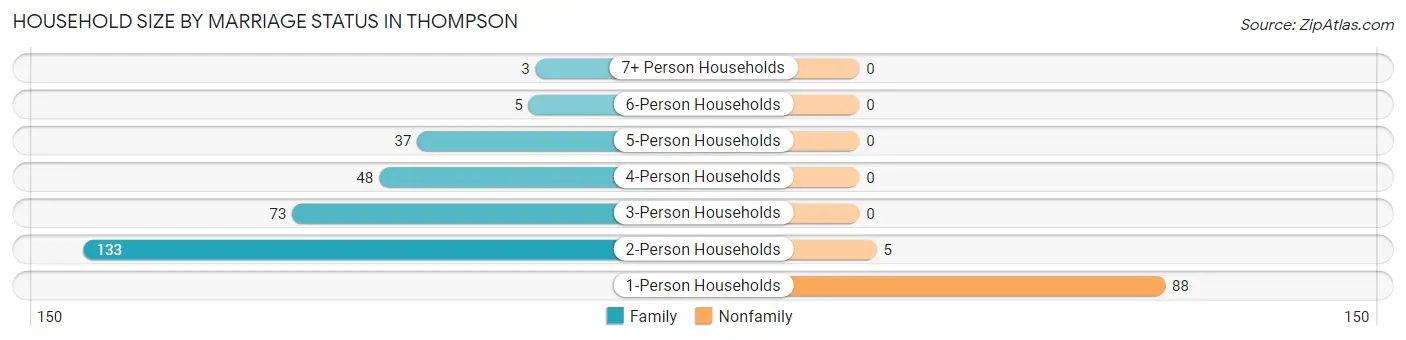
Household Size by Marriage Status in Thompson
Out of a total of 392 households in Thompson, 299 (76.3%) are family households, while 93 (23.7%) are nonfamily households. The most numerous type of family households are 2-person households, comprising 133, and the most common type of nonfamily households are 1-person households, comprising 88.
| Household Size | Family Households | Nonfamily Households |
| 1-Person Households | - | 88 (22.5%) |
| 2-Person Households | 133 (33.9%) | 5 (1.3%) |
| 3-Person Households | 73 (18.6%) | 0 (0.0%) |
| 4-Person Households | 48 (12.2%) | 0 (0.0%) |
| 5-Person Households | 37 (9.4%) | 0 (0.0%) |
| 6-Person Households | 5 (1.3%) | 0 (0.0%) |
| 7+ Person Households | 3 (0.8%) | 0 (0.0%) |
| Total | 299 (76.3%) | 93 (23.7%) |
Female Fertility in Thompson
Fertility by Age in Thompson
Average fertility rate in Thompson is 31.0 births per 1,000 women. Women in the age bracket of 20 to 34 years have the highest fertility rate with 85.0 births per 1,000 women. Women in the age bracket of 20 to 34 years acount for 100.0% of all women with births.
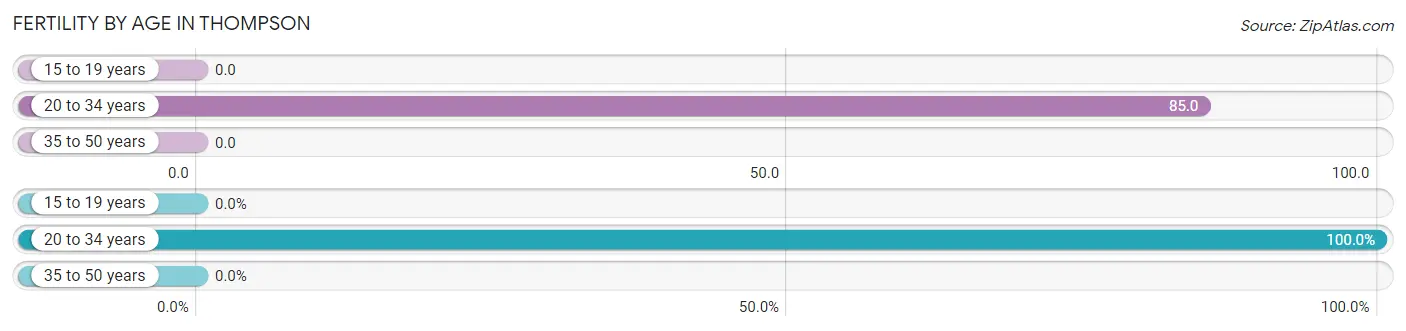
| Age Bracket | Women with Births | Births / 1,000 Women |
| 15 to 19 years | 0 (0.0%) | 0.0 |
| 20 to 34 years | 7 (100.0%) | 85.0 |
| 35 to 50 years | 0 (0.0%) | 0.0 |
| Total | 7 (100.0%) | 31.0 |
Fertility by Age by Marriage Status in Thompson
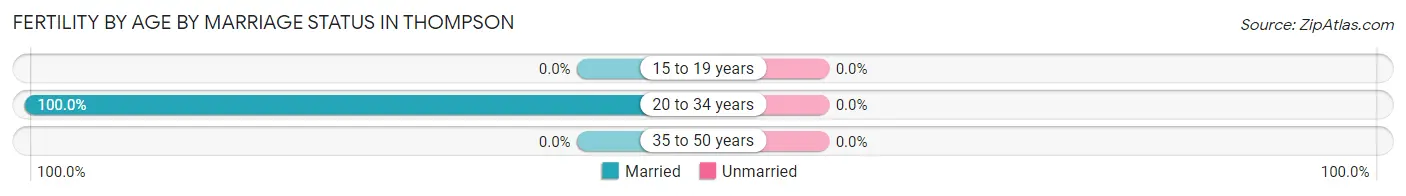
| Age Bracket | Married | Unmarried |
| 15 to 19 years | 0 (0.0%) | 0 (0.0%) |
| 20 to 34 years | 7 (100.0%) | 0 (0.0%) |
| 35 to 50 years | 0 (0.0%) | 0 (0.0%) |
| Total | 7 (100.0%) | 0 (0.0%) |
Fertility by Education in Thompson
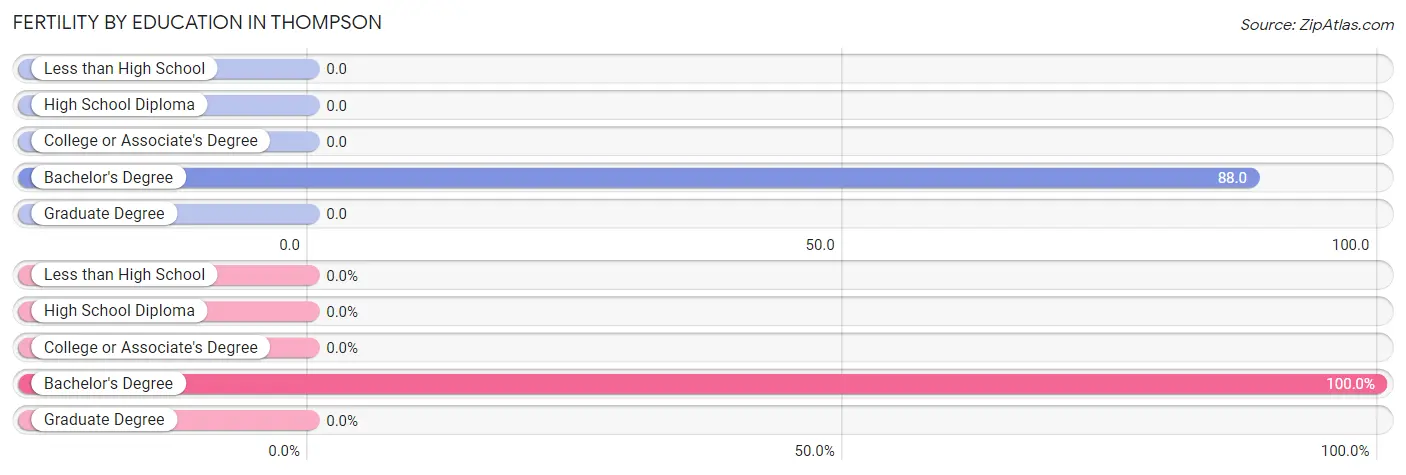
| Educational Attainment | Women with Births | Births / 1,000 Women |
| Less than High School | 0 (0.0%) | 0.0 |
| High School Diploma | 0 (0.0%) | 0.0 |
| College or Associate's Degree | 0 (0.0%) | 0.0 |
| Bachelor's Degree | 7 (100.0%) | 88.0 |
| Graduate Degree | 0 (0.0%) | 0.0 |
| Total | 7 (100.0%) | 31.0 |
Fertility by Education by Marriage Status in Thompson
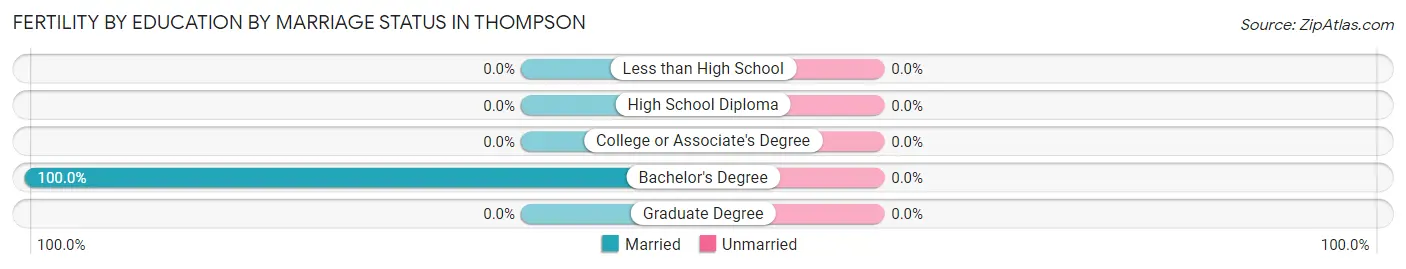
| Educational Attainment | Married | Unmarried |
| Less than High School | 0 (0.0%) | 0 (0.0%) |
| High School Diploma | 0 (0.0%) | 0 (0.0%) |
| College or Associate's Degree | 0 (0.0%) | 0 (0.0%) |
| Bachelor's Degree | 7 (100.0%) | 0 (0.0%) |
| Graduate Degree | 0 (0.0%) | 0 (0.0%) |
| Total | 7 (100.0%) | 0 (0.0%) |
Income in Thompson
Income Overview in Thompson
Per Capita Income in Thompson is $44,329, while median incomes of families and households are $123,750 and $108,333 respectively.
| Characteristic | Number | Measure |
| Per Capita Income | 1,052 | $44,329 |
| Median Family Income | 299 | $123,750 |
| Mean Family Income | 299 | $136,800 |
| Median Household Income | 392 | $108,333 |
| Mean Household Income | 392 | $118,378 |
| Income Deficit | 299 | $0 |
| Wage / Income Gap (%) | 1,052 | 25.63% |
| Wage / Income Gap ($) | 1,052 | 74.37¢ per $1 |
| Gini / Inequality Index | 1,052 | 0.34 |
Earnings by Sex in Thompson
Average Earnings in Thompson are $57,929, $65,461 for men and $48,681 for women, a difference of 25.6%.
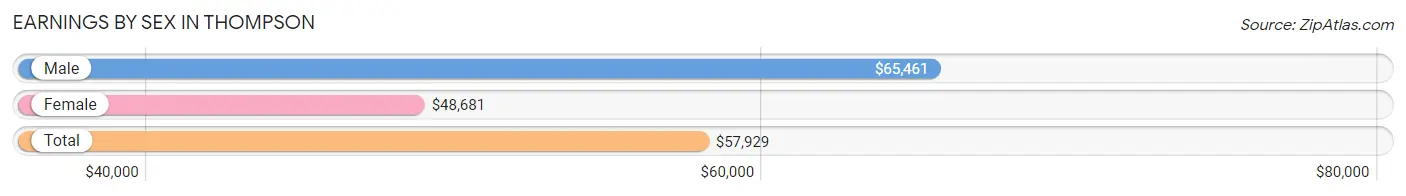
| Sex | Number | Average Earnings |
| Male | 345 (51.0%) | $65,461 |
| Female | 331 (49.0%) | $48,681 |
| Total | 676 (100.0%) | $57,929 |
Earnings by Sex by Income Bracket in Thompson
The most common earnings brackets in Thompson are $75,000 to $99,999 for men (65 | 18.8%) and $75,000 to $99,999 for women (42 | 12.7%).
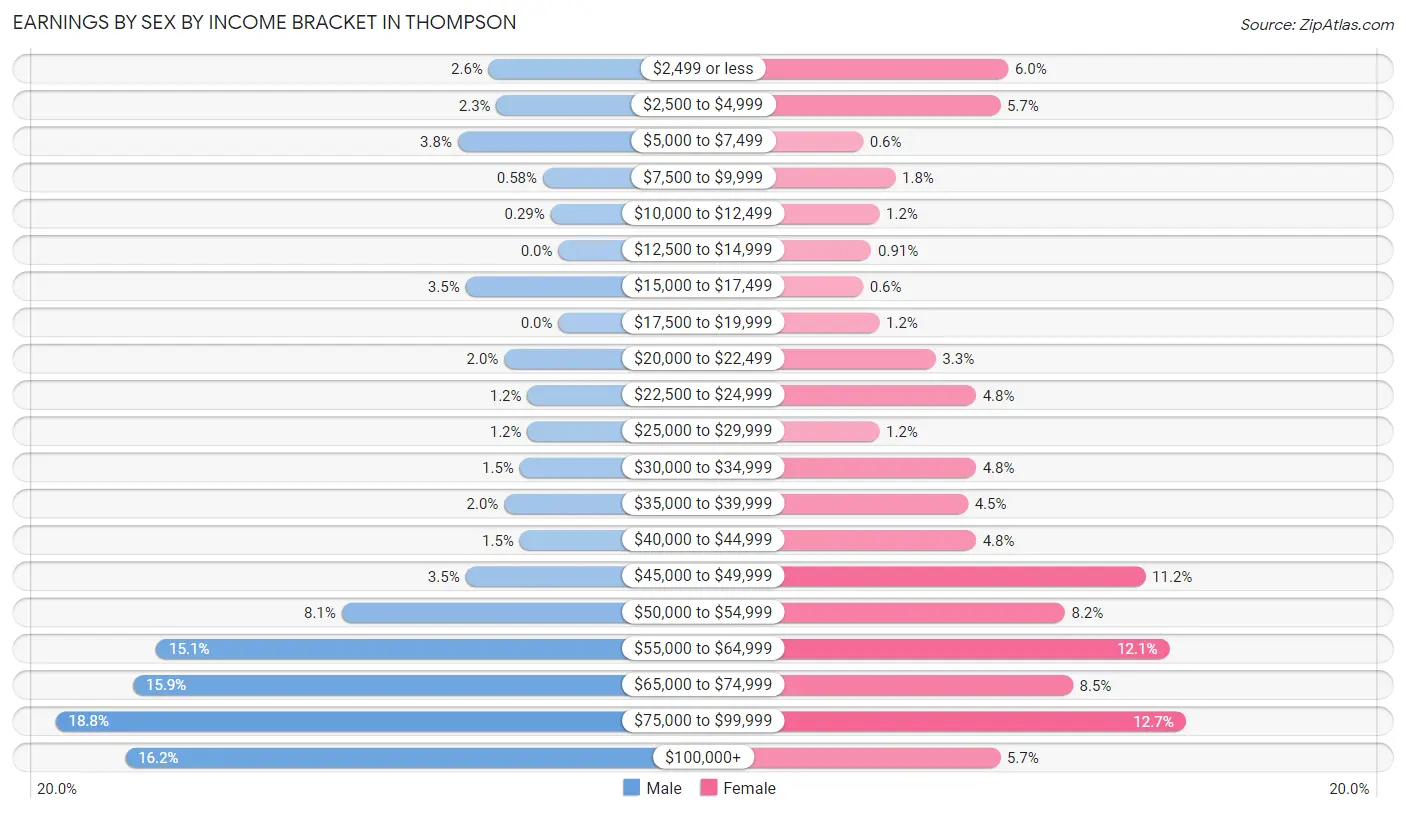
| Income | Male | Female |
| $2,499 or less | 9 (2.6%) | 20 (6.0%) |
| $2,500 to $4,999 | 8 (2.3%) | 19 (5.7%) |
| $5,000 to $7,499 | 13 (3.8%) | 2 (0.6%) |
| $7,500 to $9,999 | 2 (0.6%) | 6 (1.8%) |
| $10,000 to $12,499 | 1 (0.3%) | 4 (1.2%) |
| $12,500 to $14,999 | 0 (0.0%) | 3 (0.9%) |
| $15,000 to $17,499 | 12 (3.5%) | 2 (0.6%) |
| $17,500 to $19,999 | 0 (0.0%) | 4 (1.2%) |
| $20,000 to $22,499 | 7 (2.0%) | 11 (3.3%) |
| $22,500 to $24,999 | 4 (1.2%) | 16 (4.8%) |
| $25,000 to $29,999 | 4 (1.2%) | 4 (1.2%) |
| $30,000 to $34,999 | 5 (1.5%) | 16 (4.8%) |
| $35,000 to $39,999 | 7 (2.0%) | 15 (4.5%) |
| $40,000 to $44,999 | 5 (1.5%) | 16 (4.8%) |
| $45,000 to $49,999 | 12 (3.5%) | 37 (11.2%) |
| $50,000 to $54,999 | 28 (8.1%) | 27 (8.2%) |
| $55,000 to $64,999 | 52 (15.1%) | 40 (12.1%) |
| $65,000 to $74,999 | 55 (15.9%) | 28 (8.5%) |
| $75,000 to $99,999 | 65 (18.8%) | 42 (12.7%) |
| $100,000+ | 56 (16.2%) | 19 (5.7%) |
| Total | 345 (100.0%) | 331 (100.0%) |
Earnings by Sex by Educational Attainment in Thompson
Average earnings in Thompson are $67,171 for men and $51,750 for women, a difference of 23.0%. Men with an educational attainment of graduate degree enjoy the highest average annual earnings of $117,639, while those with less than high school education earn the least with $21,250. Women with an educational attainment of graduate degree earn the most with the average annual earnings of $71,250, while those with high school diploma education have the smallest earnings of $24,318.
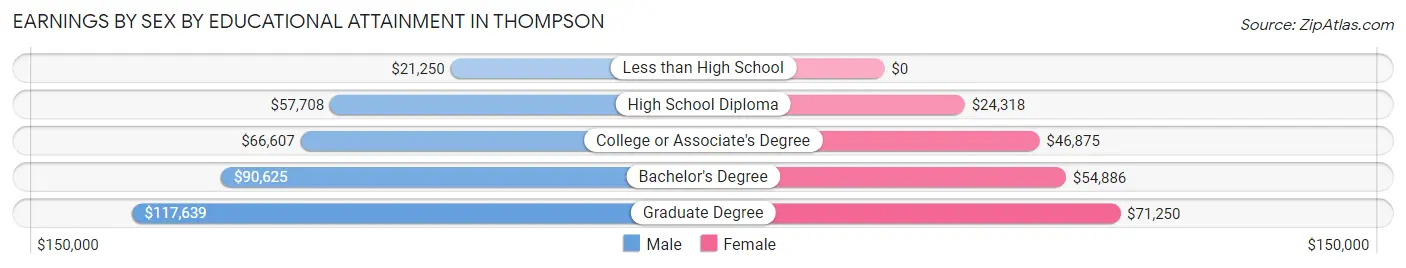
| Educational Attainment | Male Income | Female Income |
| Less than High School | $21,250 | $0 |
| High School Diploma | $57,708 | $24,318 |
| College or Associate's Degree | $66,607 | $46,875 |
| Bachelor's Degree | $90,625 | $54,886 |
| Graduate Degree | $117,639 | $71,250 |
| Total | $67,171 | $51,750 |
Family Income in Thompson
Family Income Brackets in Thompson
According to the Thompson family income data, there are 90 families falling into the $100,000 to $149,999 income range, which is the most common income bracket and makes up 30.1% of all families.
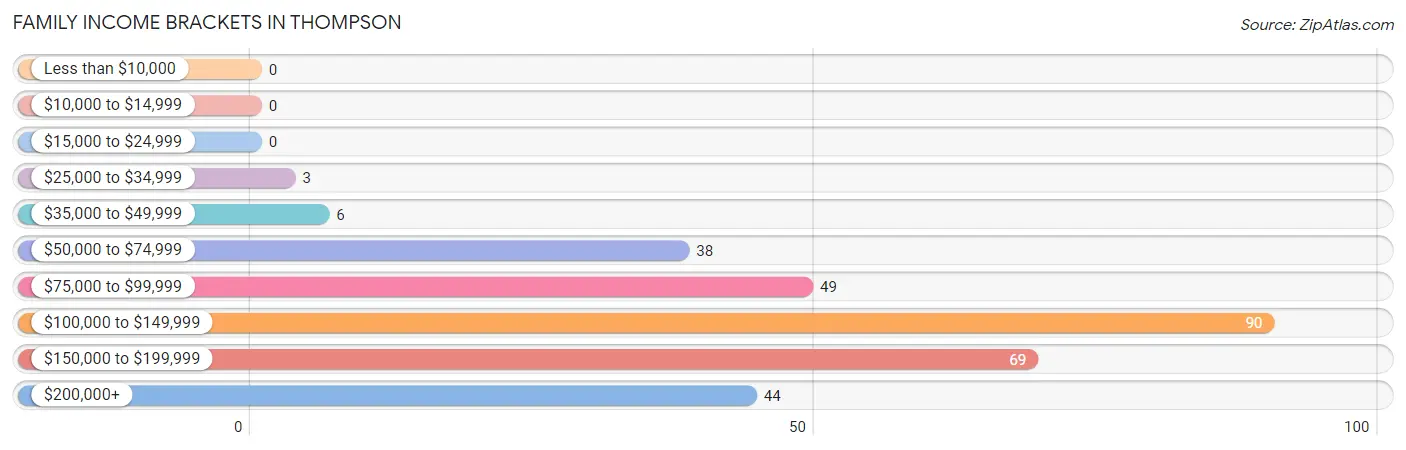
| Income Bracket | # Families | % Families |
| Less than $10,000 | 0 | 0.0% |
| $10,000 to $14,999 | 0 | 0.0% |
| $15,000 to $24,999 | 0 | 0.0% |
| $25,000 to $34,999 | 3 | 1.0% |
| $35,000 to $49,999 | 6 | 2.0% |
| $50,000 to $74,999 | 38 | 12.7% |
| $75,000 to $99,999 | 49 | 16.4% |
| $100,000 to $149,999 | 90 | 30.1% |
| $150,000 to $199,999 | 69 | 23.1% |
| $200,000+ | 44 | 14.7% |
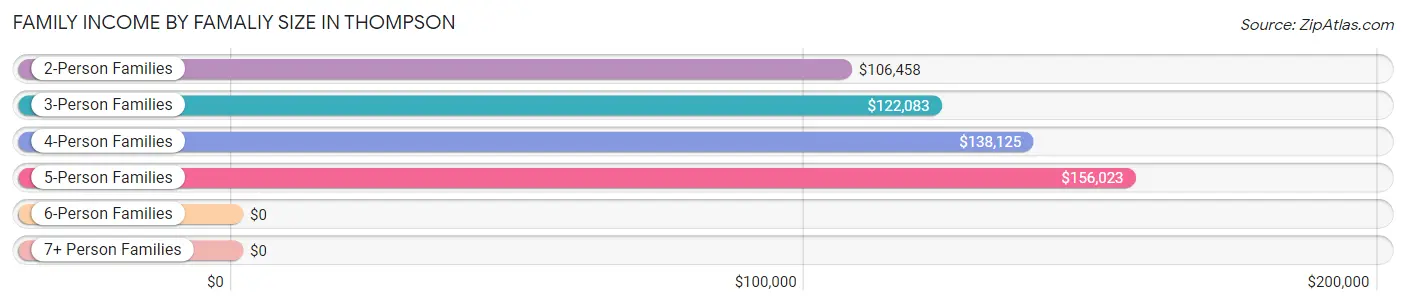
Family Income by Famaliy Size in Thompson
5-person families (29 | 9.7%) account for the highest median family income in Thompson with $156,023 per family, while 2-person families (145 | 48.5%) have the highest median income of $53,229 per family member.
| Income Bracket | # Families | Median Income |
| 2-Person Families | 145 (48.5%) | $106,458 |
| 3-Person Families | 67 (22.4%) | $122,083 |
| 4-Person Families | 51 (17.1%) | $138,125 |
| 5-Person Families | 29 (9.7%) | $156,023 |
| 6-Person Families | 4 (1.3%) | $0 |
| 7+ Person Families | 3 (1.0%) | $0 |
| Total | 299 (100.0%) | $123,750 |
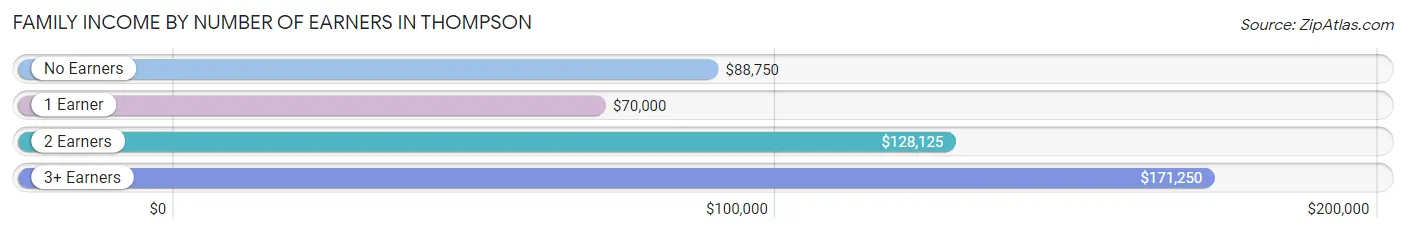
Family Income by Number of Earners in Thompson
The median family income in Thompson is $123,750, with families comprising 3+ earners (50) having the highest median family income of $171,250, while families with 1 earner (50) have the lowest median family income of $70,000, accounting for 16.7% and 16.7% of families, respectively.
| Number of Earners | # Families | Median Income |
| No Earners | 12 (4.0%) | $88,750 |
| 1 Earner | 50 (16.7%) | $70,000 |
| 2 Earners | 187 (62.5%) | $128,125 |
| 3+ Earners | 50 (16.7%) | $171,250 |
| Total | 299 (100.0%) | $123,750 |
Household Income in Thompson
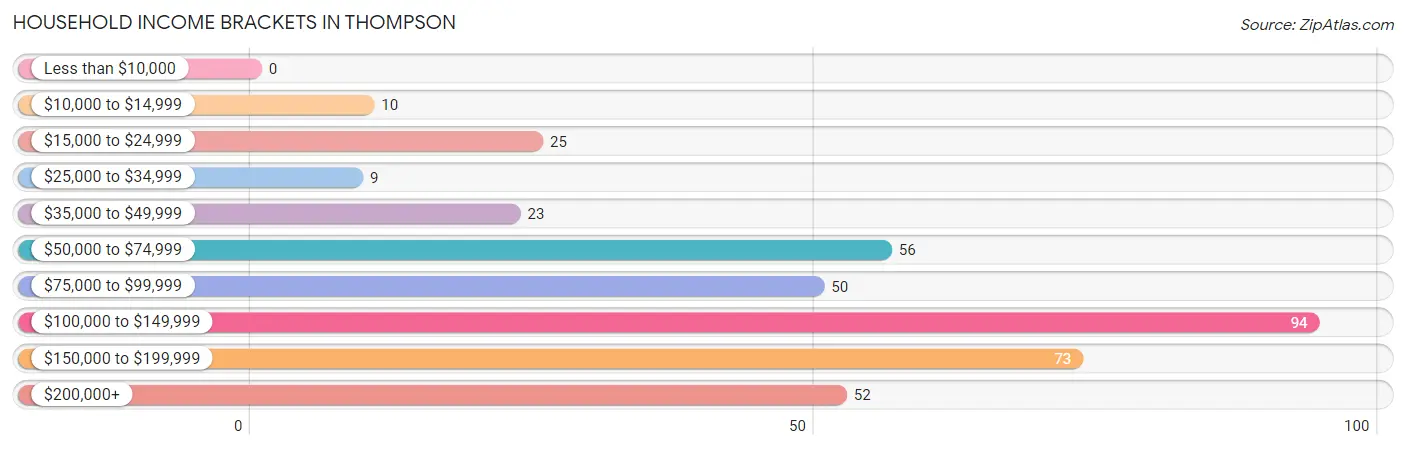
Household Income Brackets in Thompson
With 94 households falling in the category, the $100,000 to $149,999 income range is the most frequent in Thompson, accounting for 24.0% of all households.
| Income Bracket | # Households | % Households |
| Less than $10,000 | 0 | 0.0% |
| $10,000 to $14,999 | 10 | 2.6% |
| $15,000 to $24,999 | 25 | 6.4% |
| $25,000 to $34,999 | 9 | 2.3% |
| $35,000 to $49,999 | 23 | 5.9% |
| $50,000 to $74,999 | 56 | 14.3% |
| $75,000 to $99,999 | 50 | 12.8% |
| $100,000 to $149,999 | 94 | 24.0% |
| $150,000 to $199,999 | 73 | 18.6% |
| $200,000+ | 52 | 13.3% |
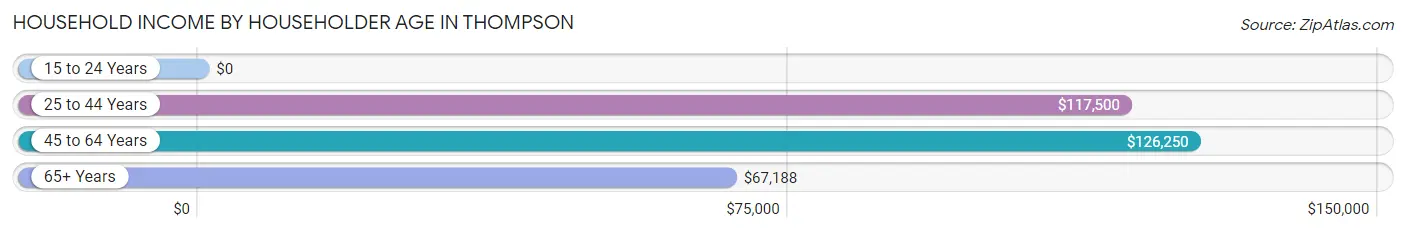
Household Income by Householder Age in Thompson
The median household income in Thompson is $108,333, with the highest median household income of $126,250 found in the 45 to 64 years age bracket for the primary householder. A total of 208 households (53.1%) fall into this category. Meanwhile, the 15 to 24 years age bracket for the primary householder has the lowest median household income of $0, with 3 households (0.8%) in this group.
| Income Bracket | # Households | Median Income |
| 15 to 24 Years | 3 (0.8%) | $0 |
| 25 to 44 Years | 106 (27.0%) | $117,500 |
| 45 to 64 Years | 208 (53.1%) | $126,250 |
| 65+ Years | 75 (19.1%) | $67,188 |
| Total | 392 (100.0%) | $108,333 |
Poverty in Thompson
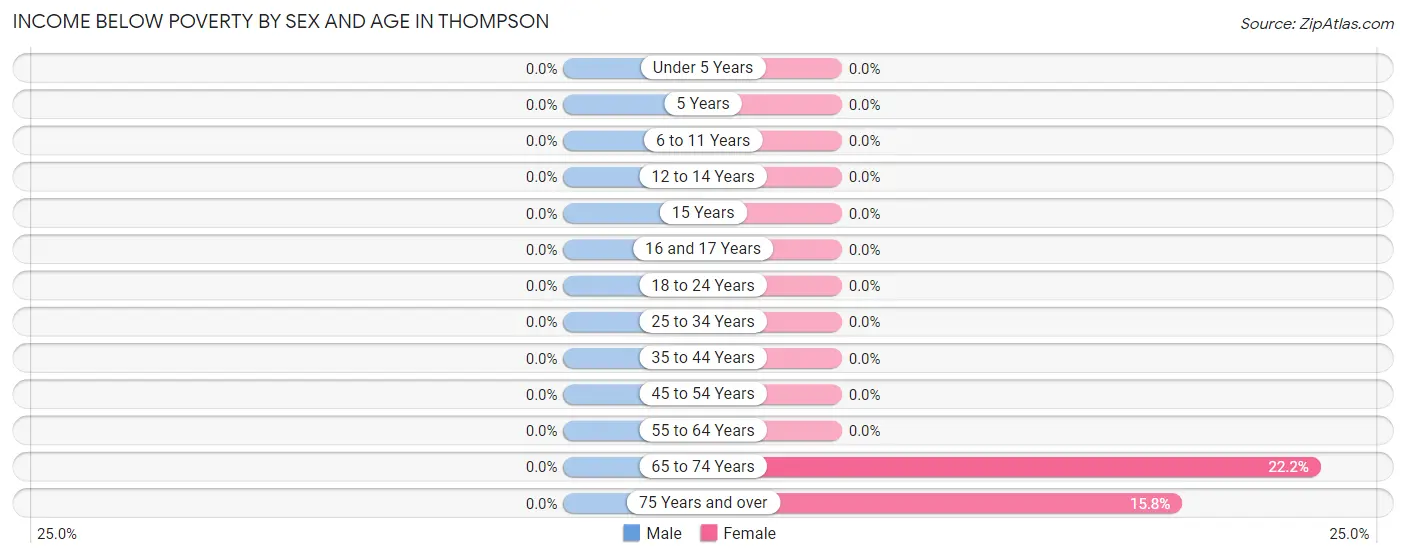
Income Below Poverty by Sex and Age in Thompson
| Age Bracket | Male | Female |
| Under 5 Years | 0 (0.0%) | 0 (0.0%) |
| 5 Years | 0 (0.0%) | 0 (0.0%) |
| 6 to 11 Years | 0 (0.0%) | 0 (0.0%) |
| 12 to 14 Years | 0 (0.0%) | 0 (0.0%) |
| 15 Years | 0 (0.0%) | 0 (0.0%) |
| 16 and 17 Years | 0 (0.0%) | 0 (0.0%) |
| 18 to 24 Years | 0 (0.0%) | 0 (0.0%) |
| 25 to 34 Years | 0 (0.0%) | 0 (0.0%) |
| 35 to 44 Years | 0 (0.0%) | 0 (0.0%) |
| 45 to 54 Years | 0 (0.0%) | 0 (0.0%) |
| 55 to 64 Years | 0 (0.0%) | 0 (0.0%) |
| 65 to 74 Years | 0 (0.0%) | 8 (22.2%) |
| 75 Years and over | 0 (0.0%) | 3 (15.8%) |
| Total | 0 (0.0%) | 11 (2.1%) |
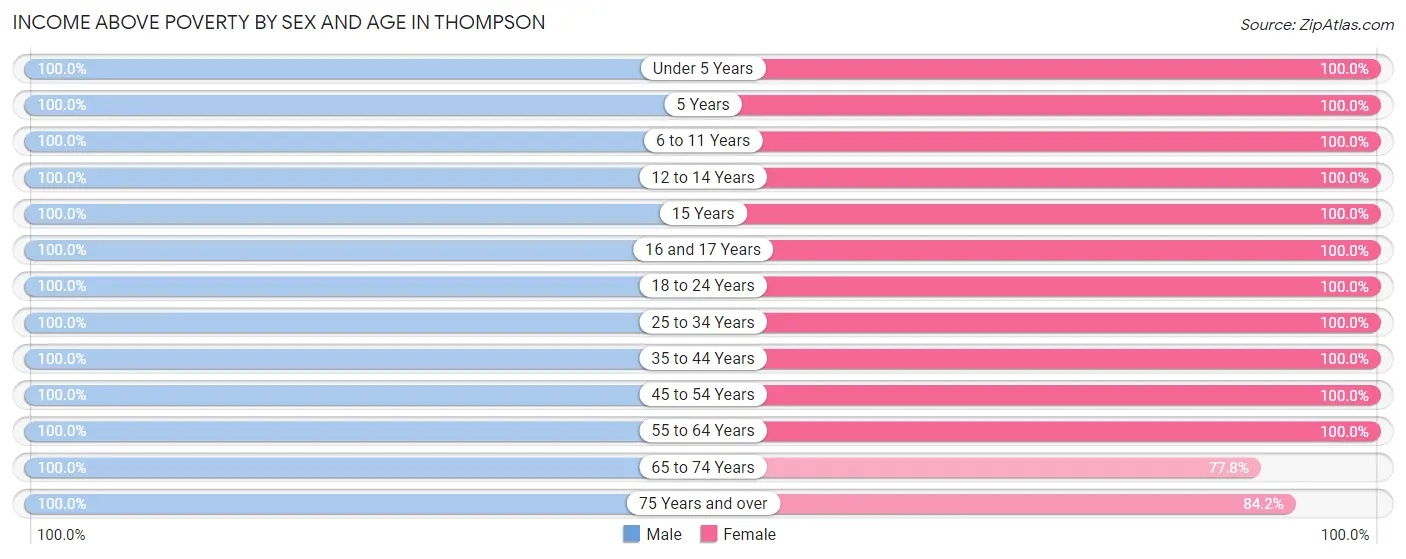
Income Above Poverty by Sex and Age in Thompson
According to the poverty statistics in Thompson, males aged under 5 years and females aged under 5 years are the age groups that are most secure financially, with 100.0% of males and 100.0% of females in these age groups living above the poverty line.
| Age Bracket | Male | Female |
| Under 5 Years | 23 (100.0%) | 17 (100.0%) |
| 5 Years | 6 (100.0%) | 5 (100.0%) |
| 6 to 11 Years | 41 (100.0%) | 38 (100.0%) |
| 12 to 14 Years | 52 (100.0%) | 50 (100.0%) |
| 15 Years | 5 (100.0%) | 2 (100.0%) |
| 16 and 17 Years | 20 (100.0%) | 20 (100.0%) |
| 18 to 24 Years | 13 (100.0%) | 31 (100.0%) |
| 25 to 34 Years | 56 (100.0%) | 68 (100.0%) |
| 35 to 44 Years | 60 (100.0%) | 45 (100.0%) |
| 45 to 54 Years | 109 (100.0%) | 84 (100.0%) |
| 55 to 64 Years | 91 (100.0%) | 99 (100.0%) |
| 65 to 74 Years | 24 (100.0%) | 28 (77.8%) |
| 75 Years and over | 31 (100.0%) | 16 (84.2%) |
| Total | 531 (100.0%) | 503 (97.9%) |
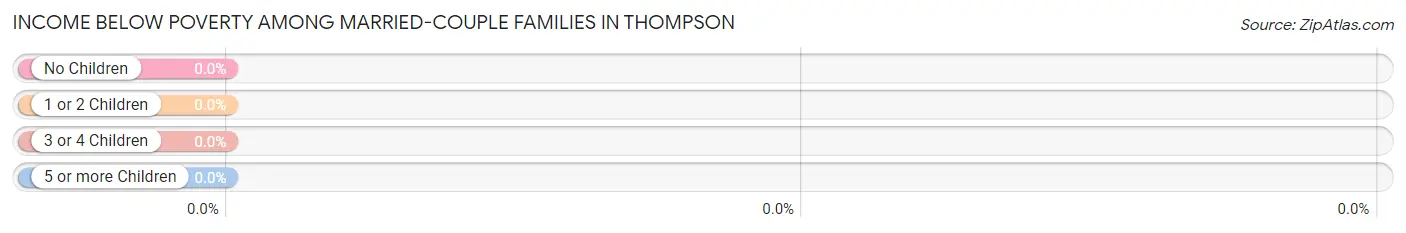
Income Below Poverty Among Married-Couple Families in Thompson
| Children | Above Poverty | Below Poverty |
| No Children | 153 (100.0%) | 0 (0.0%) |
| 1 or 2 Children | 76 (100.0%) | 0 (0.0%) |
| 3 or 4 Children | 30 (100.0%) | 0 (0.0%) |
| 5 or more Children | 3 (100.0%) | 0 (0.0%) |
| Total | 262 (100.0%) | 0 (0.0%) |
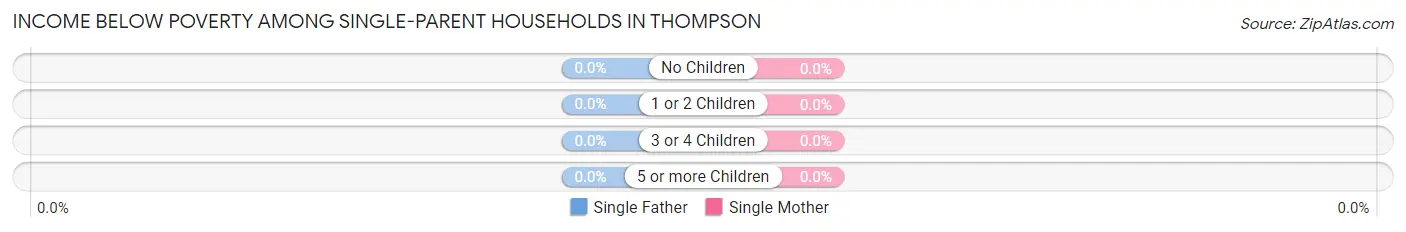
Income Below Poverty Among Single-Parent Households in Thompson
| Children | Single Father | Single Mother |
| No Children | 0 (0.0%) | 0 (0.0%) |
| 1 or 2 Children | 0 (0.0%) | 0 (0.0%) |
| 3 or 4 Children | 0 (0.0%) | 0 (0.0%) |
| 5 or more Children | 0 (0.0%) | 0 (0.0%) |
| Total | 0 (0.0%) | 0 (0.0%) |
Income Below Poverty Among Married-Couple vs Single-Parent Households in Thompson
| Children | Married-Couple Families | Single-Parent Households |
| No Children | 0 (0.0%) | 0 (0.0%) |
| 1 or 2 Children | 0 (0.0%) | 0 (0.0%) |
| 3 or 4 Children | 0 (0.0%) | 0 (0.0%) |
| 5 or more Children | 0 (0.0%) | 0 (0.0%) |
| Total | 0 (0.0%) | 0 (0.0%) |
Employment Characteristics in Thompson
Employment by Class of Employer in Thompson
Among the 626 employed individuals in Thompson, private company employees (368 | 58.8%), local government employees (74 | 11.8%), and state government employees (74 | 11.8%) make up the most common classes of employment.
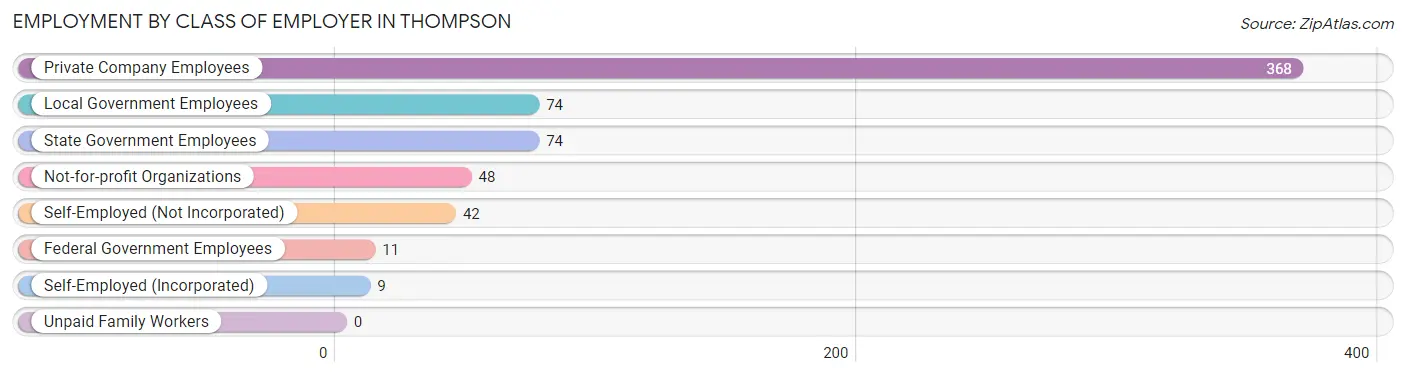
| Employer Class | # Employees | % Employees |
| Private Company Employees | 368 | 58.8% |
| Self-Employed (Incorporated) | 9 | 1.4% |
| Self-Employed (Not Incorporated) | 42 | 6.7% |
| Not-for-profit Organizations | 48 | 7.7% |
| Local Government Employees | 74 | 11.8% |
| State Government Employees | 74 | 11.8% |
| Federal Government Employees | 11 | 1.8% |
| Unpaid Family Workers | 0 | 0.0% |
| Total | 626 | 100.0% |
Employment Status by Age in Thompson
According to the labor force statistics for Thompson, out of the total population over 16 years of age (806), 78.9% or 636 individuals are in the labor force, with 0.2% or 1 of them unemployed. The age group with the highest labor force participation rate is 30 to 34 years, with 100.0% or 48 individuals in the labor force. Within the labor force, the 35 to 44 years age range has the highest percentage of unemployed individuals, with 1.0% or 1 of them being unemployed.
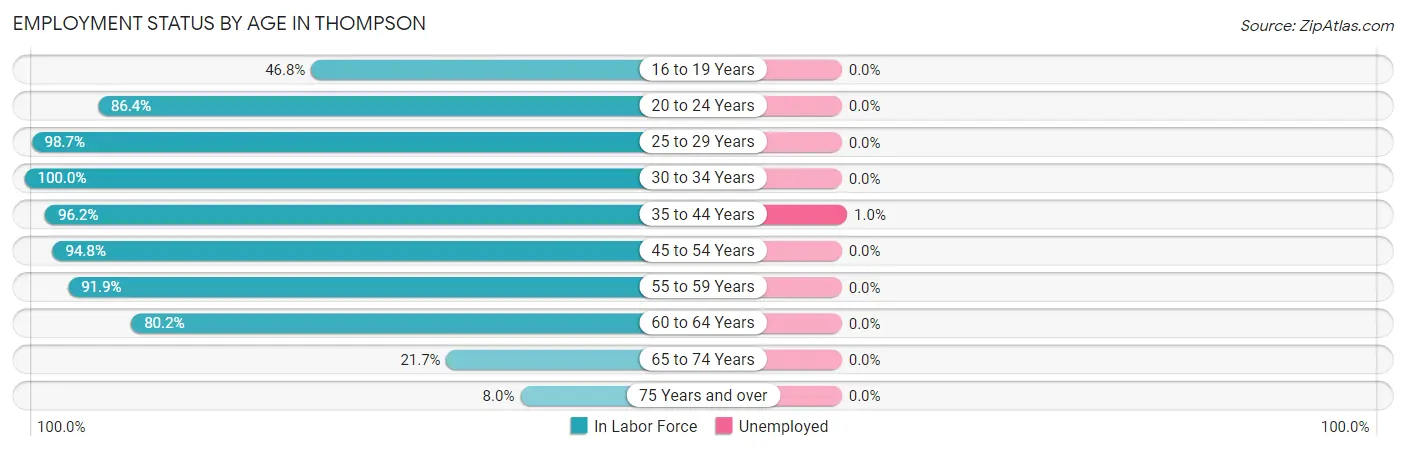
| Age Bracket | In Labor Force | Unemployed |
| 16 to 19 Years | 29 (46.8%) | 0 (0.0%) |
| 20 to 24 Years | 19 (86.4%) | 0 (0.0%) |
| 25 to 29 Years | 75 (98.7%) | 0 (0.0%) |
| 30 to 34 Years | 48 (100.0%) | 0 (0.0%) |
| 35 to 44 Years | 101 (96.2%) | 1 (1.0%) |
| 45 to 54 Years | 183 (94.8%) | 0 (0.0%) |
| 55 to 59 Years | 91 (91.9%) | 0 (0.0%) |
| 60 to 64 Years | 73 (80.2%) | 0 (0.0%) |
| 65 to 74 Years | 13 (21.7%) | 0 (0.0%) |
| 75 Years and over | 4 (8.0%) | 0 (0.0%) |
| Total | 636 (78.9%) | 1 (0.2%) |
Employment Status by Educational Attainment in Thompson
According to labor force statistics for Thompson, 93.3% of individuals (571) out of the total population between 25 and 64 years of age (612) are in the labor force, with 0.2% or 1 of them being unemployed. The group with the highest labor force participation rate are those with the educational attainment of less than high school, with 100.0% or 12 individuals in the labor force. Within the labor force, individuals with college / associate degree education have the highest percentage of unemployment, with 0.4% or 1 of them being unemployed.
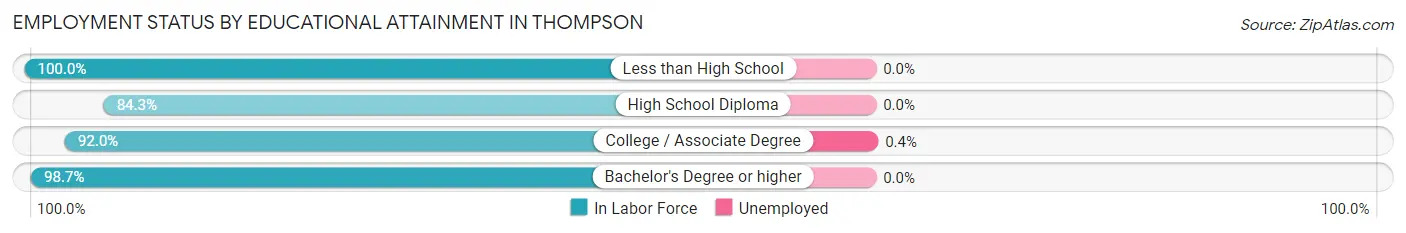
| Educational Attainment | In Labor Force | Unemployed |
| Less than High School | 12 (100.0%) | 0 (0.0%) |
| High School Diploma | 91 (84.3%) | 0 (0.0%) |
| College / Associate Degree | 240 (92.0%) | 1 (0.4%) |
| Bachelor's Degree or higher | 228 (98.7%) | 0 (0.0%) |
| Total | 571 (93.3%) | 1 (0.2%) |
Employment Occupations by Sex in Thompson
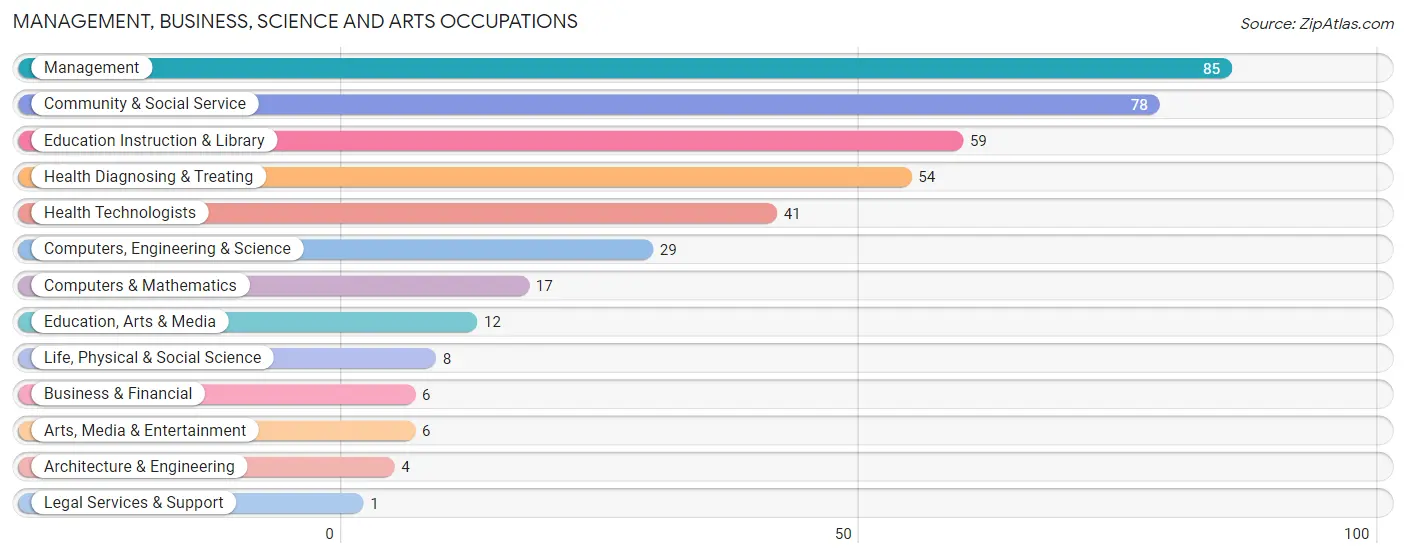
Management, Business, Science and Arts Occupations
The most common Management, Business, Science and Arts occupations in Thompson are Management (85 | 13.4%), Community & Social Service (78 | 12.3%), Education Instruction & Library (59 | 9.3%), Health Diagnosing & Treating (54 | 8.5%), and Health Technologists (41 | 6.5%).
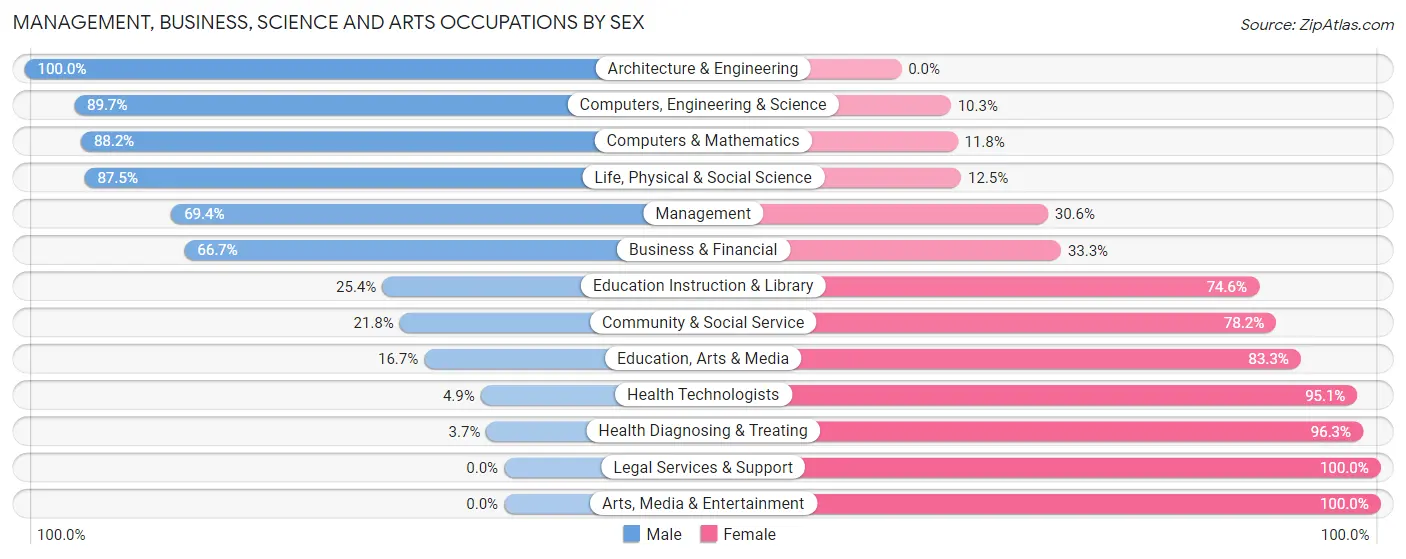
Management, Business, Science and Arts Occupations by Sex
Within the Management, Business, Science and Arts occupations in Thompson, the most male-oriented occupations are Architecture & Engineering (100.0%), Computers, Engineering & Science (89.7%), and Computers & Mathematics (88.2%), while the most female-oriented occupations are Legal Services & Support (100.0%), Arts, Media & Entertainment (100.0%), and Health Diagnosing & Treating (96.3%).
| Occupation | Male | Female |
| Management | 59 (69.4%) | 26 (30.6%) |
| Business & Financial | 4 (66.7%) | 2 (33.3%) |
| Computers, Engineering & Science | 26 (89.7%) | 3 (10.3%) |
| Computers & Mathematics | 15 (88.2%) | 2 (11.8%) |
| Architecture & Engineering | 4 (100.0%) | 0 (0.0%) |
| Life, Physical & Social Science | 7 (87.5%) | 1 (12.5%) |
| Community & Social Service | 17 (21.8%) | 61 (78.2%) |
| Education, Arts & Media | 2 (16.7%) | 10 (83.3%) |
| Legal Services & Support | 0 (0.0%) | 1 (100.0%) |
| Education Instruction & Library | 15 (25.4%) | 44 (74.6%) |
| Arts, Media & Entertainment | 0 (0.0%) | 6 (100.0%) |
| Health Diagnosing & Treating | 2 (3.7%) | 52 (96.3%) |
| Health Technologists | 2 (4.9%) | 39 (95.1%) |
| Total (Category) | 108 (42.9%) | 144 (57.1%) |
| Total (Overall) | 324 (51.2%) | 309 (48.8%) |
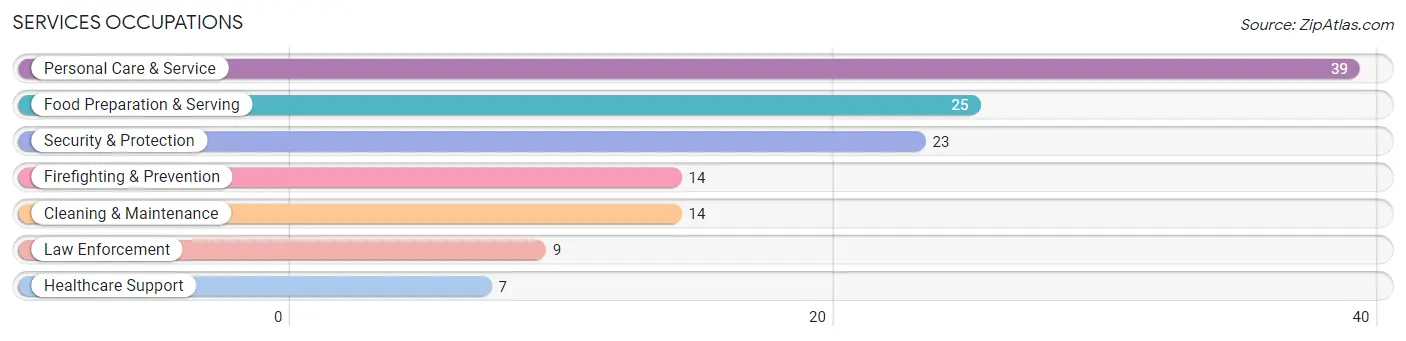
Services Occupations
The most common Services occupations in Thompson are Personal Care & Service (39 | 6.2%), Food Preparation & Serving (25 | 4.0%), Security & Protection (23 | 3.6%), Firefighting & Prevention (14 | 2.2%), and Cleaning & Maintenance (14 | 2.2%).
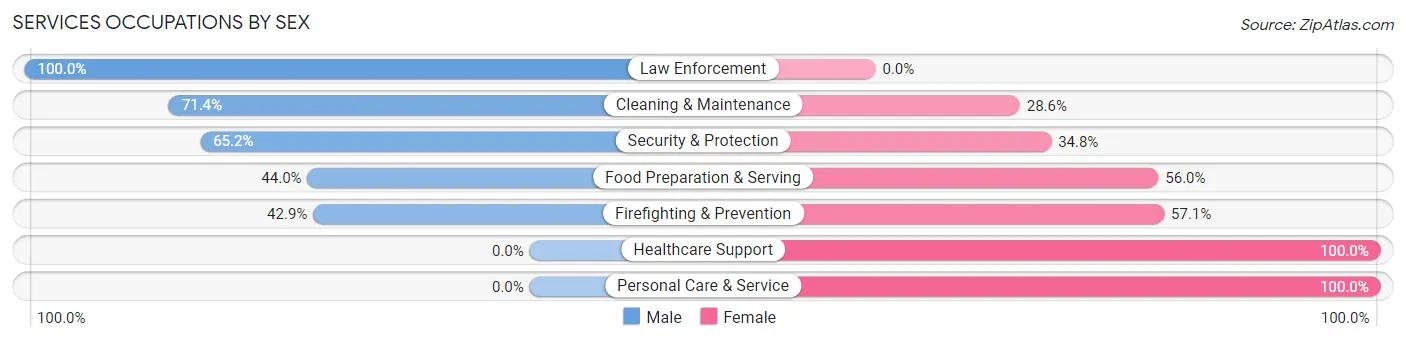
Services Occupations by Sex
Within the Services occupations in Thompson, the most male-oriented occupations are Law Enforcement (100.0%), Cleaning & Maintenance (71.4%), and Security & Protection (65.2%), while the most female-oriented occupations are Healthcare Support (100.0%), Personal Care & Service (100.0%), and Firefighting & Prevention (57.1%).
| Occupation | Male | Female |
| Healthcare Support | 0 (0.0%) | 7 (100.0%) |
| Security & Protection | 15 (65.2%) | 8 (34.8%) |
| Firefighting & Prevention | 6 (42.9%) | 8 (57.1%) |
| Law Enforcement | 9 (100.0%) | 0 (0.0%) |
| Food Preparation & Serving | 11 (44.0%) | 14 (56.0%) |
| Cleaning & Maintenance | 10 (71.4%) | 4 (28.6%) |
| Personal Care & Service | 0 (0.0%) | 39 (100.0%) |
| Total (Category) | 36 (33.3%) | 72 (66.7%) |
| Total (Overall) | 324 (51.2%) | 309 (48.8%) |
Sales and Office Occupations
The most common Sales and Office occupations in Thompson are Office & Administration (67 | 10.6%), and Sales & Related (54 | 8.5%).
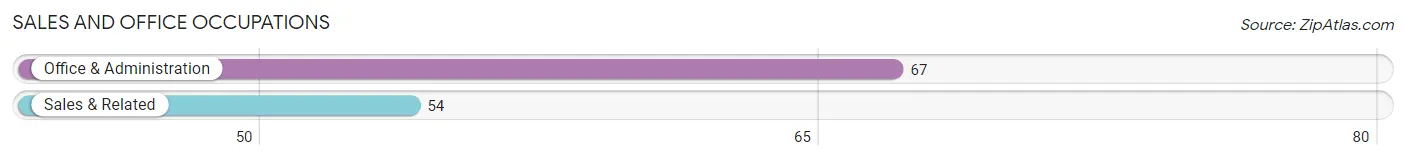
Sales and Office Occupations by Sex
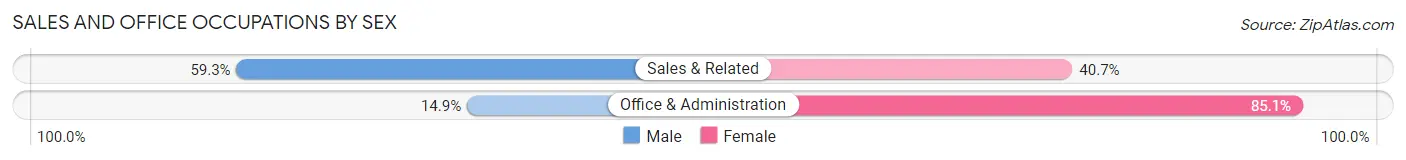
| Occupation | Male | Female |
| Sales & Related | 32 (59.3%) | 22 (40.7%) |
| Office & Administration | 10 (14.9%) | 57 (85.1%) |
| Total (Category) | 42 (34.7%) | 79 (65.3%) |
| Total (Overall) | 324 (51.2%) | 309 (48.8%) |
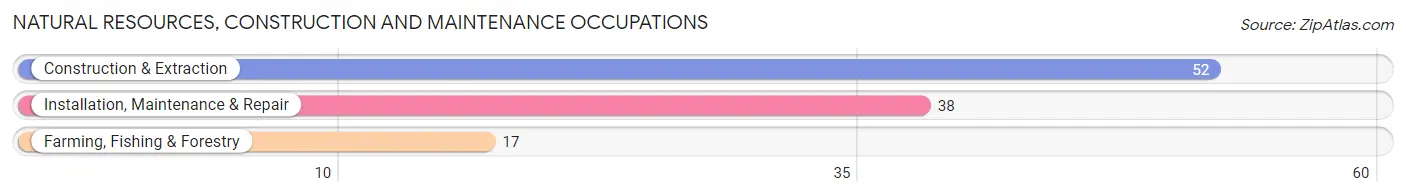
Natural Resources, Construction and Maintenance Occupations
The most common Natural Resources, Construction and Maintenance occupations in Thompson are Construction & Extraction (52 | 8.2%), Installation, Maintenance & Repair (38 | 6.0%), and Farming, Fishing & Forestry (17 | 2.7%).
Natural Resources, Construction and Maintenance Occupations by Sex
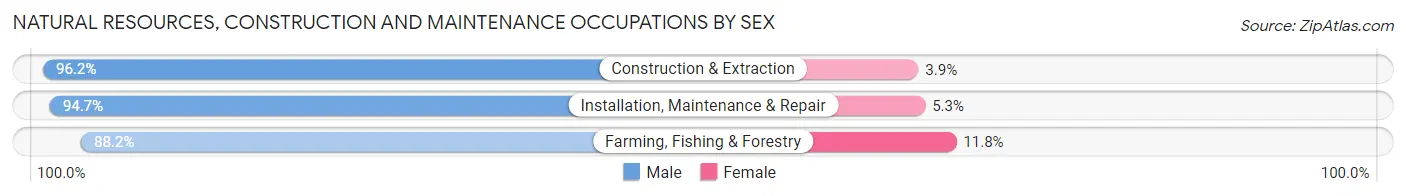
| Occupation | Male | Female |
| Farming, Fishing & Forestry | 15 (88.2%) | 2 (11.8%) |
| Construction & Extraction | 50 (96.2%) | 2 (3.8%) |
| Installation, Maintenance & Repair | 36 (94.7%) | 2 (5.3%) |
| Total (Category) | 101 (94.4%) | 6 (5.6%) |
| Total (Overall) | 324 (51.2%) | 309 (48.8%) |
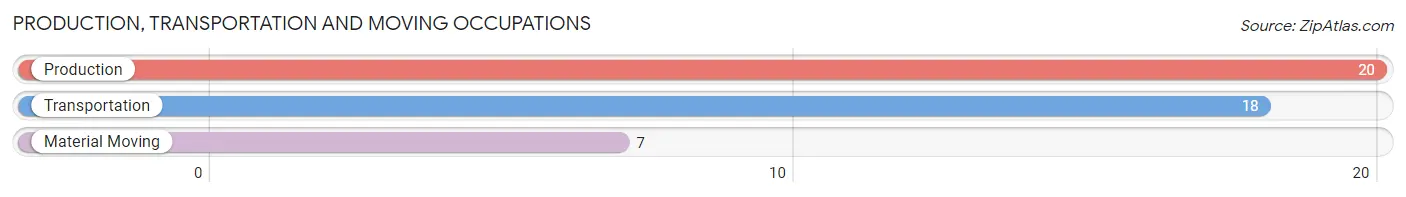
Production, Transportation and Moving Occupations
The most common Production, Transportation and Moving occupations in Thompson are Production (20 | 3.2%), Transportation (18 | 2.8%), and Material Moving (7 | 1.1%).
Production, Transportation and Moving Occupations by Sex
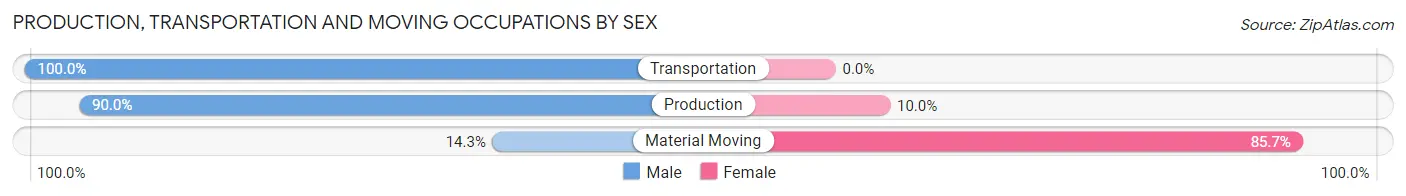
| Occupation | Male | Female |
| Production | 18 (90.0%) | 2 (10.0%) |
| Transportation | 18 (100.0%) | 0 (0.0%) |
| Material Moving | 1 (14.3%) | 6 (85.7%) |
| Total (Category) | 37 (82.2%) | 8 (17.8%) |
| Total (Overall) | 324 (51.2%) | 309 (48.8%) |
Employment Industries by Sex in Thompson
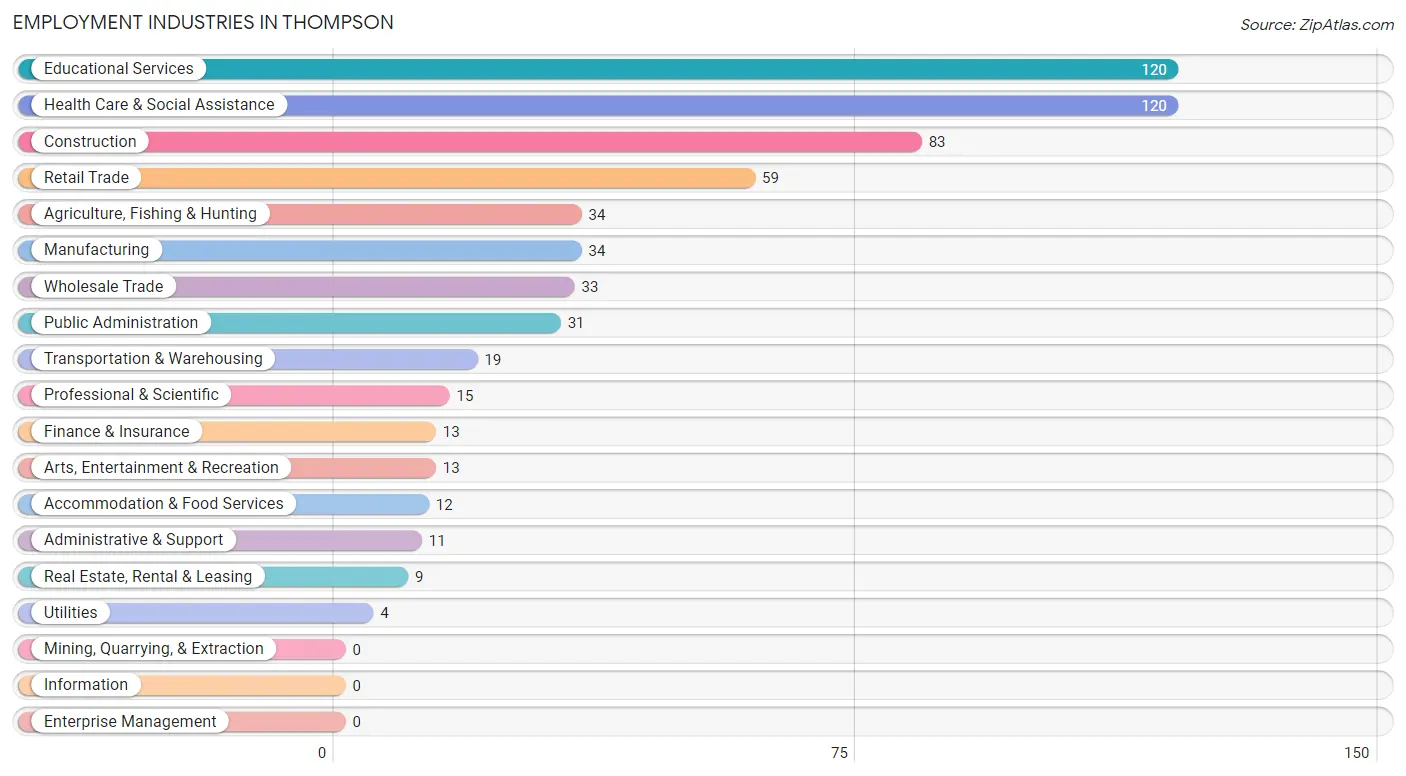
Employment Industries in Thompson
The major employment industries in Thompson include Educational Services (120 | 19.0%), Health Care & Social Assistance (120 | 19.0%), Construction (83 | 13.1%), Retail Trade (59 | 9.3%), and Agriculture, Fishing & Hunting (34 | 5.4%).
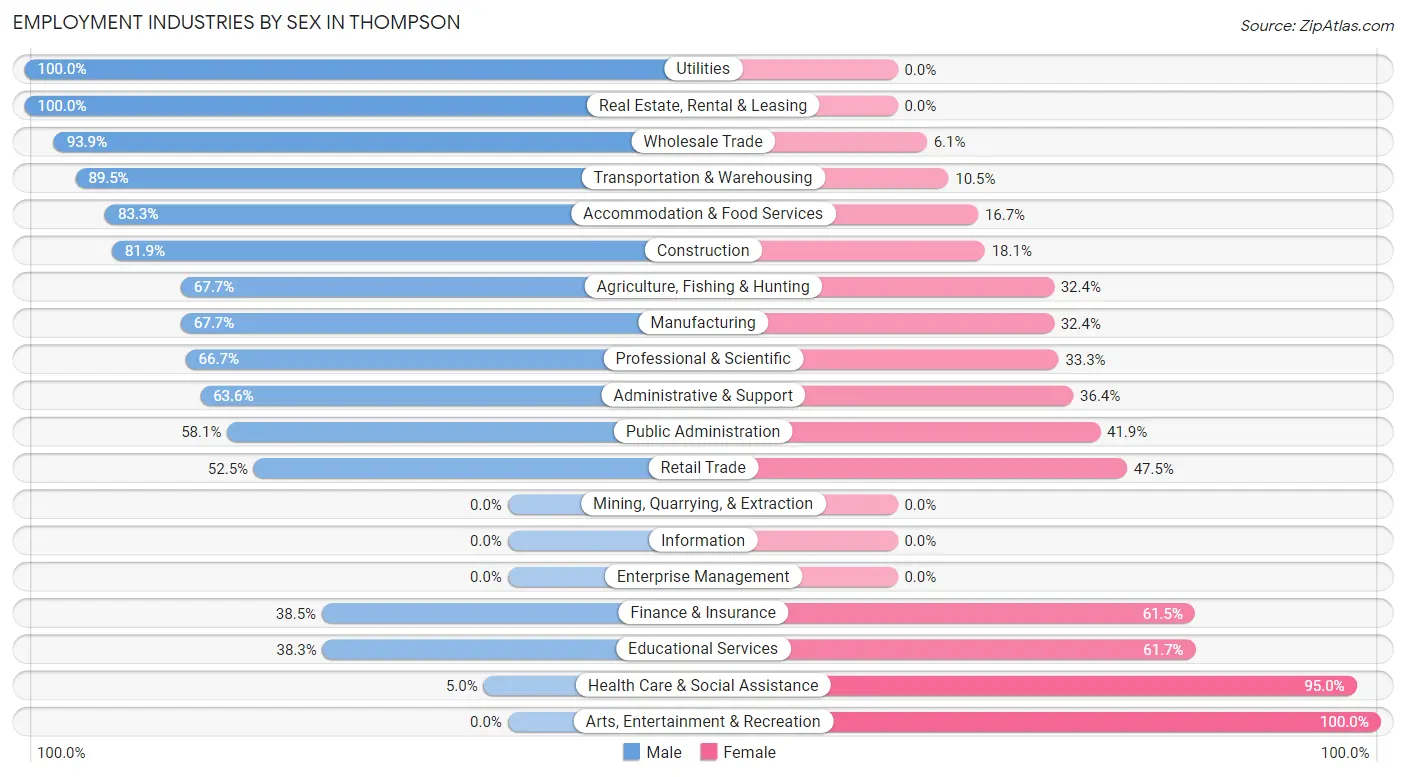
Employment Industries by Sex in Thompson
The Thompson industries that see more men than women are Utilities (100.0%), Real Estate, Rental & Leasing (100.0%), and Wholesale Trade (93.9%), whereas the industries that tend to have a higher number of women are Arts, Entertainment & Recreation (100.0%), Health Care & Social Assistance (95.0%), and Educational Services (61.7%).
| Industry | Male | Female |
| Agriculture, Fishing & Hunting | 23 (67.6%) | 11 (32.4%) |
| Mining, Quarrying, & Extraction | 0 (0.0%) | 0 (0.0%) |
| Construction | 68 (81.9%) | 15 (18.1%) |
| Manufacturing | 23 (67.6%) | 11 (32.4%) |
| Wholesale Trade | 31 (93.9%) | 2 (6.1%) |
| Retail Trade | 31 (52.5%) | 28 (47.5%) |
| Transportation & Warehousing | 17 (89.5%) | 2 (10.5%) |
| Utilities | 4 (100.0%) | 0 (0.0%) |
| Information | 0 (0.0%) | 0 (0.0%) |
| Finance & Insurance | 5 (38.5%) | 8 (61.5%) |
| Real Estate, Rental & Leasing | 9 (100.0%) | 0 (0.0%) |
| Professional & Scientific | 10 (66.7%) | 5 (33.3%) |
| Enterprise Management | 0 (0.0%) | 0 (0.0%) |
| Administrative & Support | 7 (63.6%) | 4 (36.4%) |
| Educational Services | 46 (38.3%) | 74 (61.7%) |
| Health Care & Social Assistance | 6 (5.0%) | 114 (95.0%) |
| Arts, Entertainment & Recreation | 0 (0.0%) | 13 (100.0%) |
| Accommodation & Food Services | 10 (83.3%) | 2 (16.7%) |
| Public Administration | 18 (58.1%) | 13 (41.9%) |
| Total | 324 (51.2%) | 309 (48.8%) |
Education in Thompson
School Enrollment in Thompson
The most common levels of schooling among the 303 students in Thompson are middle school (108 | 35.6%), high school (65 | 21.4%), and elementary school (62 | 20.5%).
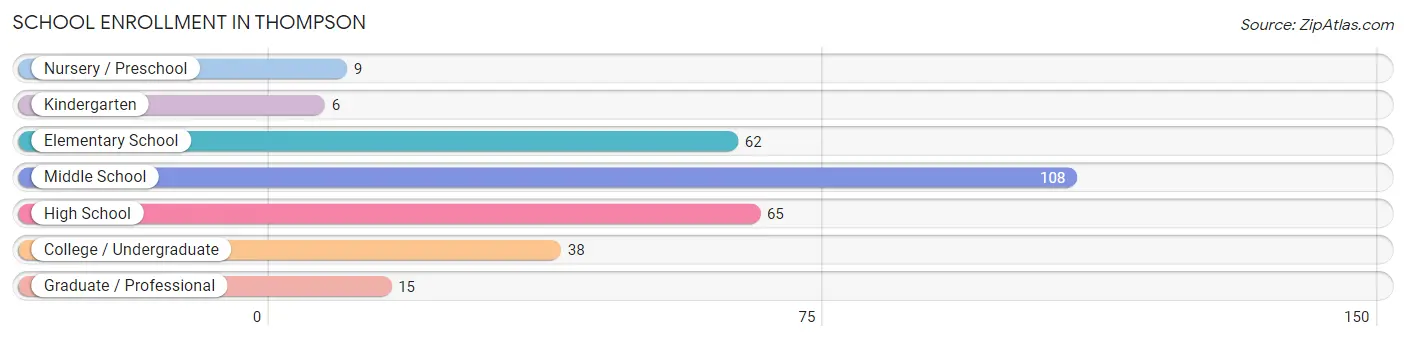
| School Level | # Students | % Students |
| Nursery / Preschool | 9 | 3.0% |
| Kindergarten | 6 | 2.0% |
| Elementary School | 62 | 20.5% |
| Middle School | 108 | 35.6% |
| High School | 65 | 21.4% |
| College / Undergraduate | 38 | 12.5% |
| Graduate / Professional | 15 | 5.0% |
| Total | 303 | 100.0% |
School Enrollment by Age by Funding Source in Thompson
Out of a total of 303 students who are enrolled in schools in Thompson, 8 (2.6%) attend a private institution, while the remaining 295 (97.4%) are enrolled in public schools. The age group of 20 to 24 year olds has the highest likelihood of being enrolled in private schools, with 3 (100.0% in the age bracket) enrolled. Conversely, the age group of 3 to 4 year olds has the lowest likelihood of being enrolled in a private school, with 6 (100.0% in the age bracket) attending a public institution.
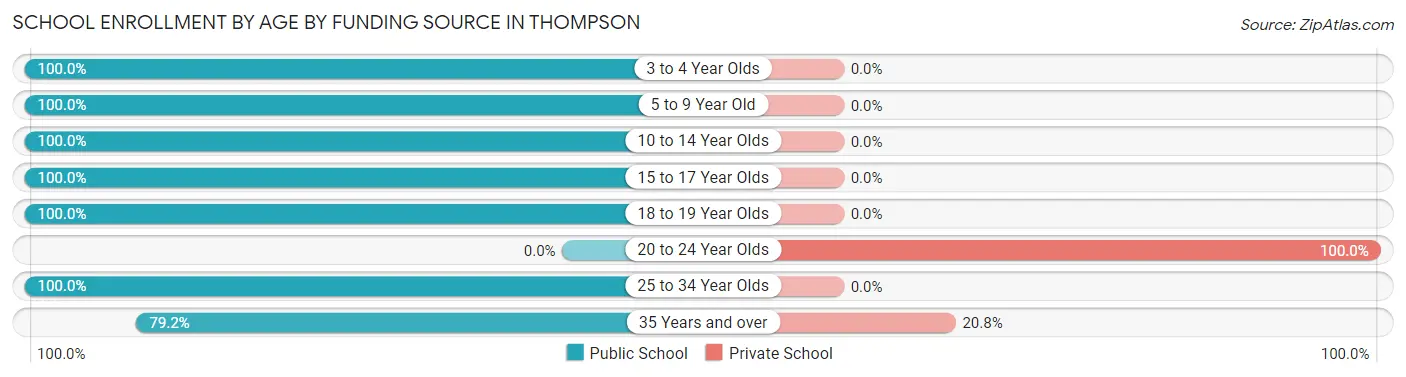
| Age Bracket | Public School | Private School |
| 3 to 4 Year Olds | 6 (100.0%) | 0 (0.0%) |
| 5 to 9 Year Old | 54 (100.0%) | 0 (0.0%) |
| 10 to 14 Year Olds | 139 (100.0%) | 0 (0.0%) |
| 15 to 17 Year Olds | 47 (100.0%) | 0 (0.0%) |
| 18 to 19 Year Olds | 14 (100.0%) | 0 (0.0%) |
| 20 to 24 Year Olds | 0 (0.0%) | 3 (100.0%) |
| 25 to 34 Year Olds | 16 (100.0%) | 0 (0.0%) |
| 35 Years and over | 19 (79.2%) | 5 (20.8%) |
| Total | 295 (97.4%) | 8 (2.6%) |
Educational Attainment by Field of Study in Thompson
Education (68 | 22.4%), science & technology (43 | 14.1%), business (35 | 11.5%), social sciences (29 | 9.5%), and arts & humanities (27 | 8.9%) are the most common fields of study among 304 individuals in Thompson who have obtained a bachelor's degree or higher.
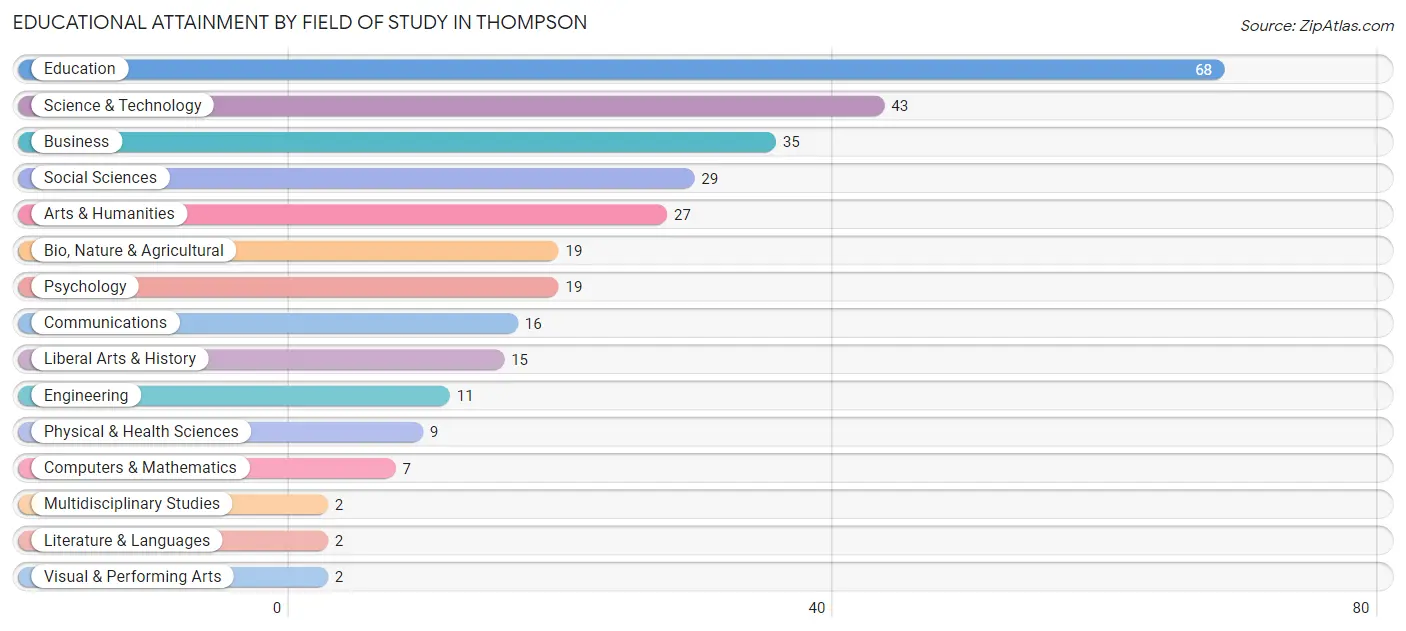
| Field of Study | # Graduates | % Graduates |
| Computers & Mathematics | 7 | 2.3% |
| Bio, Nature & Agricultural | 19 | 6.2% |
| Physical & Health Sciences | 9 | 3.0% |
| Psychology | 19 | 6.2% |
| Social Sciences | 29 | 9.5% |
| Engineering | 11 | 3.6% |
| Multidisciplinary Studies | 2 | 0.7% |
| Science & Technology | 43 | 14.1% |
| Business | 35 | 11.5% |
| Education | 68 | 22.4% |
| Literature & Languages | 2 | 0.7% |
| Liberal Arts & History | 15 | 4.9% |
| Visual & Performing Arts | 2 | 0.7% |
| Communications | 16 | 5.3% |
| Arts & Humanities | 27 | 8.9% |
| Total | 304 | 100.0% |
Transportation & Commute in Thompson
Vehicle Availability by Sex in Thompson
The most prevalent vehicle ownership categories in Thompson are males with 2 vehicles (130, accounting for 40.1%) and females with 2 vehicles (110, making up 43.0%).
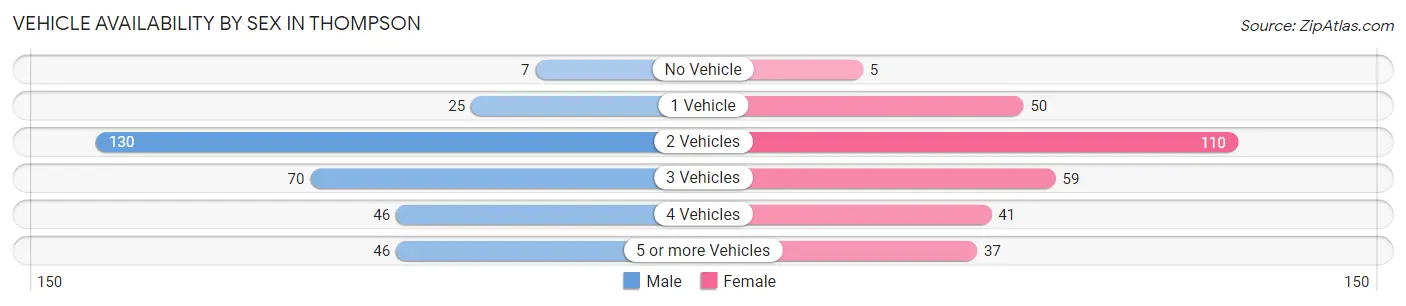
| Vehicles Available | Male | Female |
| No Vehicle | 7 (2.2%) | 5 (1.7%) |
| 1 Vehicle | 25 (7.7%) | 50 (16.6%) |
| 2 Vehicles | 130 (40.1%) | 110 (36.4%) |
| 3 Vehicles | 70 (21.6%) | 59 (19.5%) |
| 4 Vehicles | 46 (14.2%) | 41 (13.6%) |
| 5 or more Vehicles | 46 (14.2%) | 37 (12.2%) |
| Total | 324 (100.0%) | 302 (100.0%) |
Commute Time in Thompson
The most frequently occuring commute durations in Thompson are 15 to 19 minutes (197 commuters, 33.0%), 20 to 24 minutes (116 commuters, 19.4%), and 10 to 14 minutes (54 commuters, 9.0%).
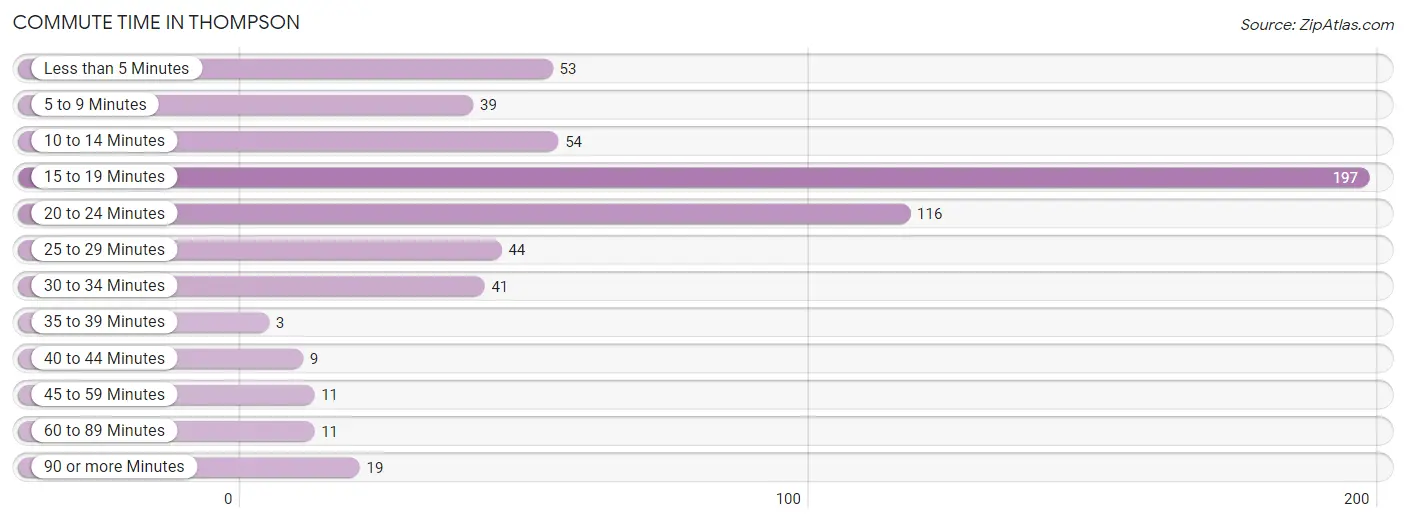
| Commute Time | # Commuters | % Commuters |
| Less than 5 Minutes | 53 | 8.9% |
| 5 to 9 Minutes | 39 | 6.5% |
| 10 to 14 Minutes | 54 | 9.0% |
| 15 to 19 Minutes | 197 | 33.0% |
| 20 to 24 Minutes | 116 | 19.4% |
| 25 to 29 Minutes | 44 | 7.4% |
| 30 to 34 Minutes | 41 | 6.9% |
| 35 to 39 Minutes | 3 | 0.5% |
| 40 to 44 Minutes | 9 | 1.5% |
| 45 to 59 Minutes | 11 | 1.8% |
| 60 to 89 Minutes | 11 | 1.8% |
| 90 or more Minutes | 19 | 3.2% |
Commute Time by Sex in Thompson
The most common commute times in Thompson are 15 to 19 minutes (117 commuters, 36.7%) for males and 15 to 19 minutes (80 commuters, 28.8%) for females.
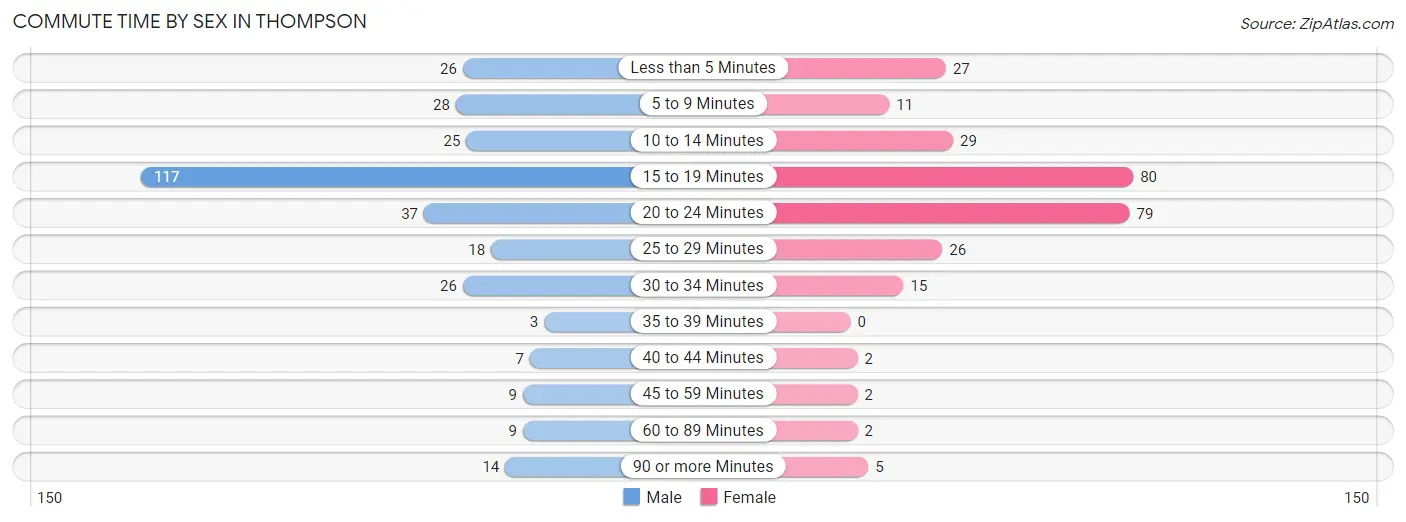
| Commute Time | Male | Female |
| Less than 5 Minutes | 26 (8.2%) | 27 (9.7%) |
| 5 to 9 Minutes | 28 (8.8%) | 11 (4.0%) |
| 10 to 14 Minutes | 25 (7.8%) | 29 (10.4%) |
| 15 to 19 Minutes | 117 (36.7%) | 80 (28.8%) |
| 20 to 24 Minutes | 37 (11.6%) | 79 (28.4%) |
| 25 to 29 Minutes | 18 (5.6%) | 26 (9.3%) |
| 30 to 34 Minutes | 26 (8.2%) | 15 (5.4%) |
| 35 to 39 Minutes | 3 (0.9%) | 0 (0.0%) |
| 40 to 44 Minutes | 7 (2.2%) | 2 (0.7%) |
| 45 to 59 Minutes | 9 (2.8%) | 2 (0.7%) |
| 60 to 89 Minutes | 9 (2.8%) | 2 (0.7%) |
| 90 or more Minutes | 14 (4.4%) | 5 (1.8%) |
Time of Departure to Work by Sex in Thompson
The most frequent times of departure to work in Thompson are 7:00 AM to 7:29 AM (81, 25.4%) for males and 7:30 AM to 7:59 AM (71, 25.5%) for females.
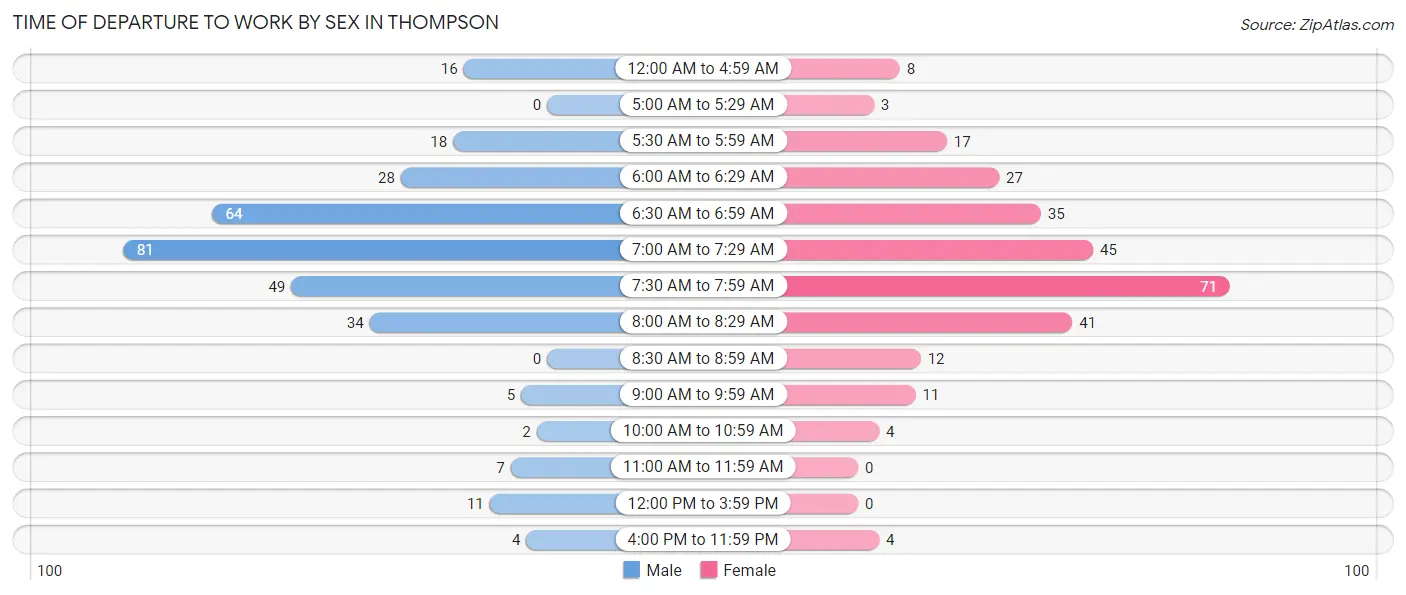
| Time of Departure | Male | Female |
| 12:00 AM to 4:59 AM | 16 (5.0%) | 8 (2.9%) |
| 5:00 AM to 5:29 AM | 0 (0.0%) | 3 (1.1%) |
| 5:30 AM to 5:59 AM | 18 (5.6%) | 17 (6.1%) |
| 6:00 AM to 6:29 AM | 28 (8.8%) | 27 (9.7%) |
| 6:30 AM to 6:59 AM | 64 (20.1%) | 35 (12.6%) |
| 7:00 AM to 7:29 AM | 81 (25.4%) | 45 (16.2%) |
| 7:30 AM to 7:59 AM | 49 (15.4%) | 71 (25.5%) |
| 8:00 AM to 8:29 AM | 34 (10.7%) | 41 (14.7%) |
| 8:30 AM to 8:59 AM | 0 (0.0%) | 12 (4.3%) |
| 9:00 AM to 9:59 AM | 5 (1.6%) | 11 (4.0%) |
| 10:00 AM to 10:59 AM | 2 (0.6%) | 4 (1.4%) |
| 11:00 AM to 11:59 AM | 7 (2.2%) | 0 (0.0%) |
| 12:00 PM to 3:59 PM | 11 (3.5%) | 0 (0.0%) |
| 4:00 PM to 11:59 PM | 4 (1.3%) | 4 (1.4%) |
| Total | 319 (100.0%) | 278 (100.0%) |
Housing Occupancy in Thompson
Occupancy by Ownership in Thompson
Of the total 392 dwellings in Thompson, owner-occupied units account for 354 (90.3%), while renter-occupied units make up 38 (9.7%).
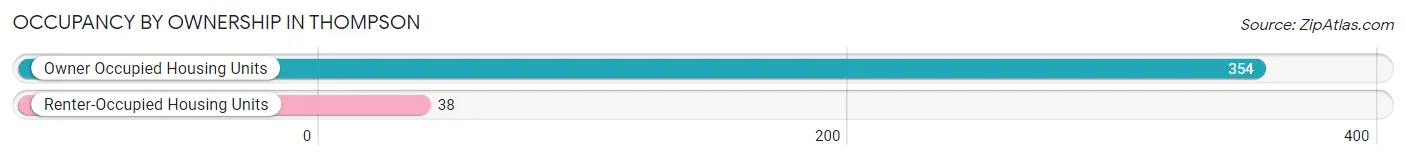
| Occupancy | # Housing Units | % Housing Units |
| Owner Occupied Housing Units | 354 | 90.3% |
| Renter-Occupied Housing Units | 38 | 9.7% |
| Total Occupied Housing Units | 392 | 100.0% |
Occupancy by Household Size in Thompson
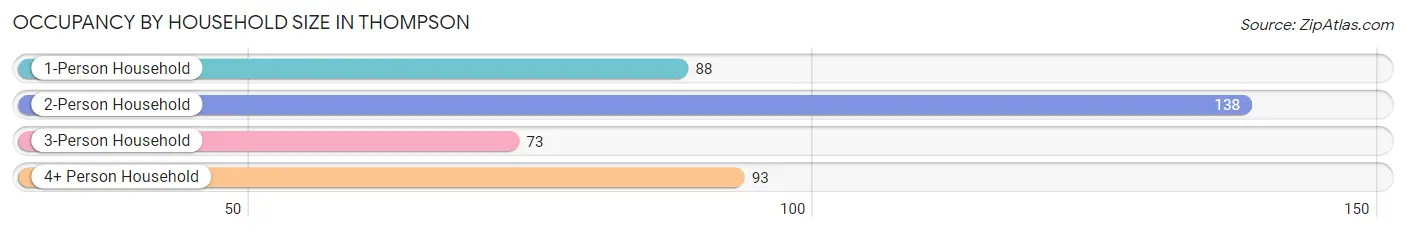
| Household Size | # Housing Units | % Housing Units |
| 1-Person Household | 88 | 22.5% |
| 2-Person Household | 138 | 35.2% |
| 3-Person Household | 73 | 18.6% |
| 4+ Person Household | 93 | 23.7% |
| Total Housing Units | 392 | 100.0% |
Occupancy by Ownership by Household Size in Thompson
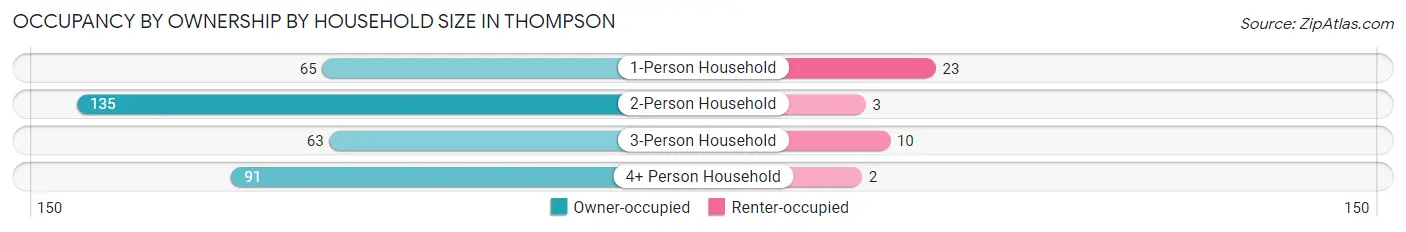
| Household Size | Owner-occupied | Renter-occupied |
| 1-Person Household | 65 (73.9%) | 23 (26.1%) |
| 2-Person Household | 135 (97.8%) | 3 (2.2%) |
| 3-Person Household | 63 (86.3%) | 10 (13.7%) |
| 4+ Person Household | 91 (97.9%) | 2 (2.1%) |
| Total Housing Units | 354 (90.3%) | 38 (9.7%) |
Occupancy by Educational Attainment in Thompson
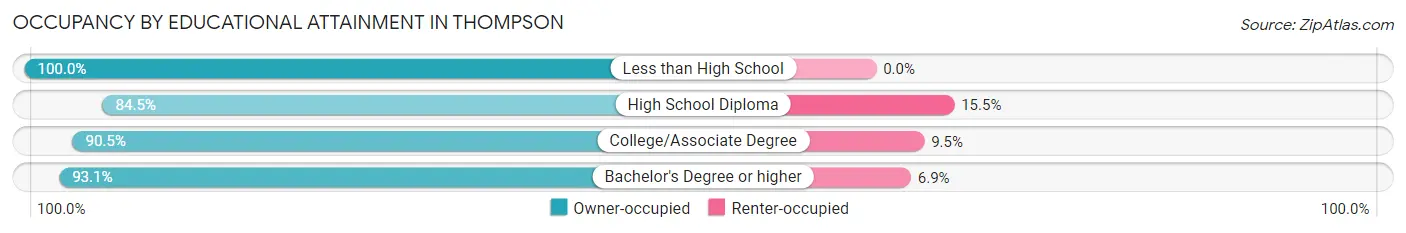
| Household Size | Owner-occupied | Renter-occupied |
| Less than High School | 9 (100.0%) | 0 (0.0%) |
| High School Diploma | 71 (84.5%) | 13 (15.5%) |
| College/Associate Degree | 152 (90.5%) | 16 (9.5%) |
| Bachelor's Degree or higher | 122 (93.1%) | 9 (6.9%) |
Occupancy by Age of Householder in Thompson
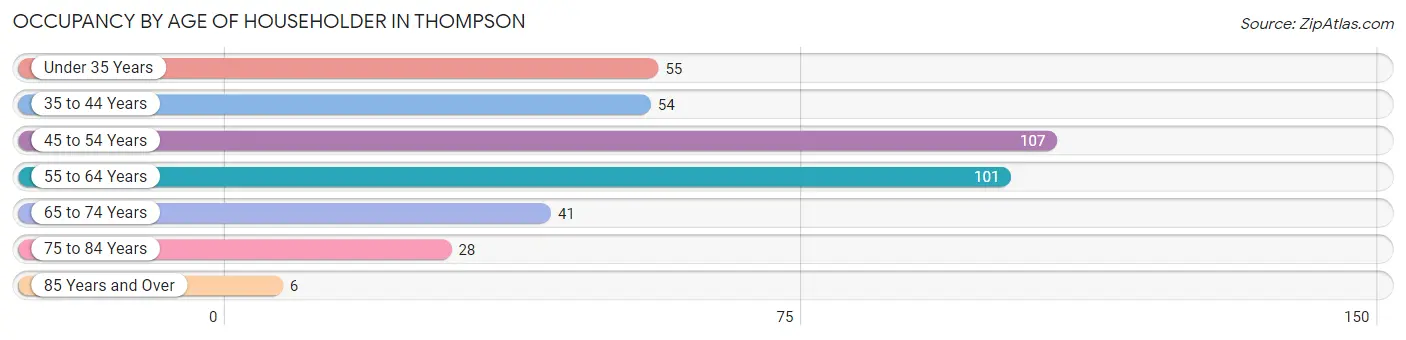
| Age Bracket | # Households | % Households |
| Under 35 Years | 55 | 14.0% |
| 35 to 44 Years | 54 | 13.8% |
| 45 to 54 Years | 107 | 27.3% |
| 55 to 64 Years | 101 | 25.8% |
| 65 to 74 Years | 41 | 10.5% |
| 75 to 84 Years | 28 | 7.1% |
| 85 Years and Over | 6 | 1.5% |
| Total | 392 | 100.0% |
Housing Finances in Thompson
Median Income by Occupancy in Thompson
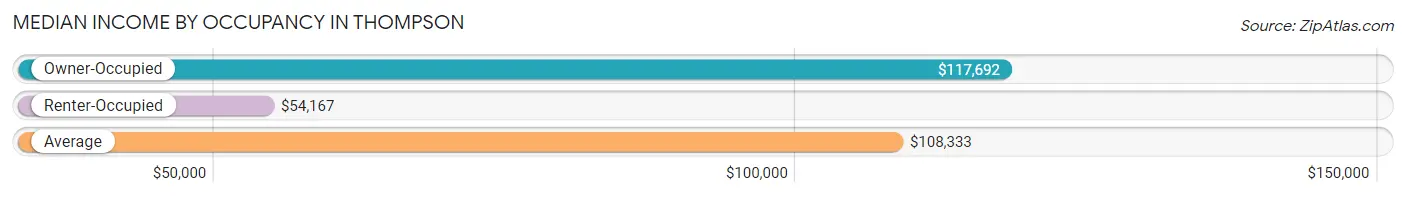
| Occupancy Type | # Households | Median Income |
| Owner-Occupied | 354 (90.3%) | $117,692 |
| Renter-Occupied | 38 (9.7%) | $54,167 |
| Average | 392 (100.0%) | $108,333 |
Occupancy by Householder Income Bracket in Thompson
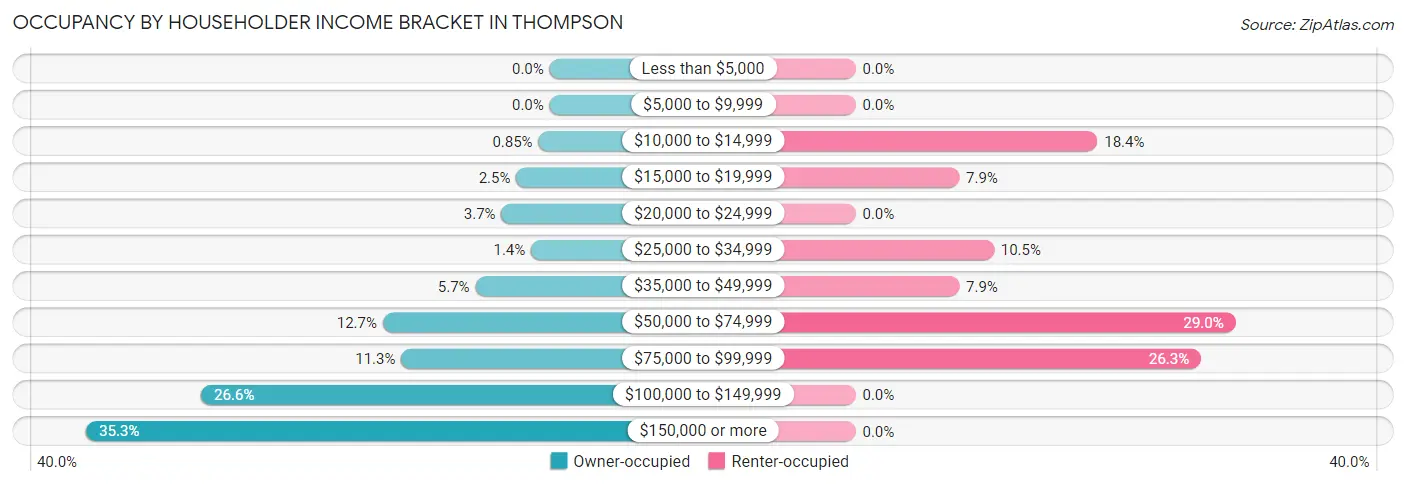
| Income Bracket | Owner-occupied | Renter-occupied |
| Less than $5,000 | 0 (0.0%) | 0 (0.0%) |
| $5,000 to $9,999 | 0 (0.0%) | 0 (0.0%) |
| $10,000 to $14,999 | 3 (0.9%) | 7 (18.4%) |
| $15,000 to $19,999 | 9 (2.5%) | 3 (7.9%) |
| $20,000 to $24,999 | 13 (3.7%) | 0 (0.0%) |
| $25,000 to $34,999 | 5 (1.4%) | 4 (10.5%) |
| $35,000 to $49,999 | 20 (5.7%) | 3 (7.9%) |
| $50,000 to $74,999 | 45 (12.7%) | 11 (28.9%) |
| $75,000 to $99,999 | 40 (11.3%) | 10 (26.3%) |
| $100,000 to $149,999 | 94 (26.6%) | 0 (0.0%) |
| $150,000 or more | 125 (35.3%) | 0 (0.0%) |
| Total | 354 (100.0%) | 38 (100.0%) |
Monthly Housing Cost Tiers in Thompson
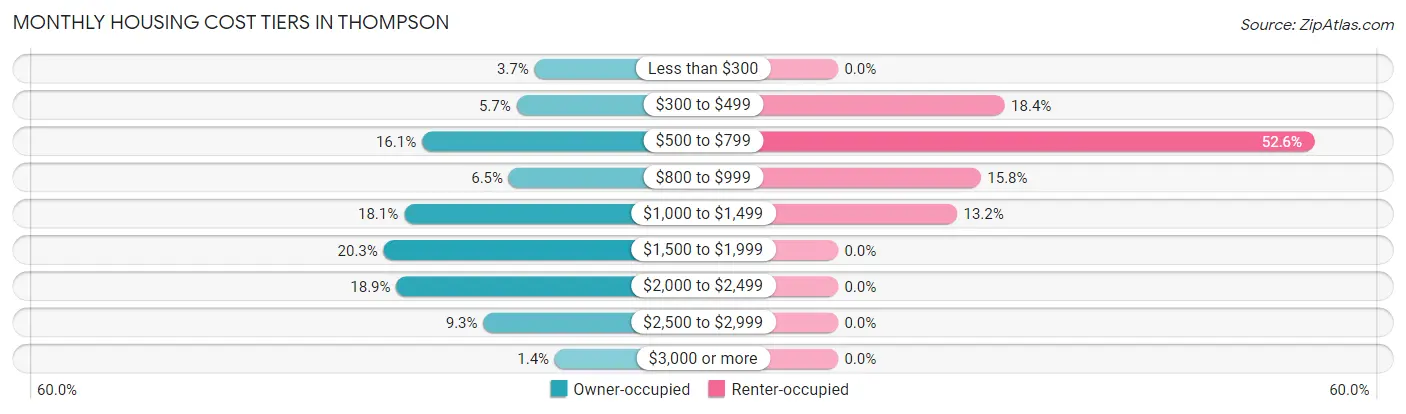
| Monthly Cost | Owner-occupied | Renter-occupied |
| Less than $300 | 13 (3.7%) | 0 (0.0%) |
| $300 to $499 | 20 (5.7%) | 7 (18.4%) |
| $500 to $799 | 57 (16.1%) | 20 (52.6%) |
| $800 to $999 | 23 (6.5%) | 6 (15.8%) |
| $1,000 to $1,499 | 64 (18.1%) | 5 (13.2%) |
| $1,500 to $1,999 | 72 (20.3%) | 0 (0.0%) |
| $2,000 to $2,499 | 67 (18.9%) | 0 (0.0%) |
| $2,500 to $2,999 | 33 (9.3%) | 0 (0.0%) |
| $3,000 or more | 5 (1.4%) | 0 (0.0%) |
| Total | 354 (100.0%) | 38 (100.0%) |
Physical Housing Characteristics in Thompson
Housing Structures in Thompson
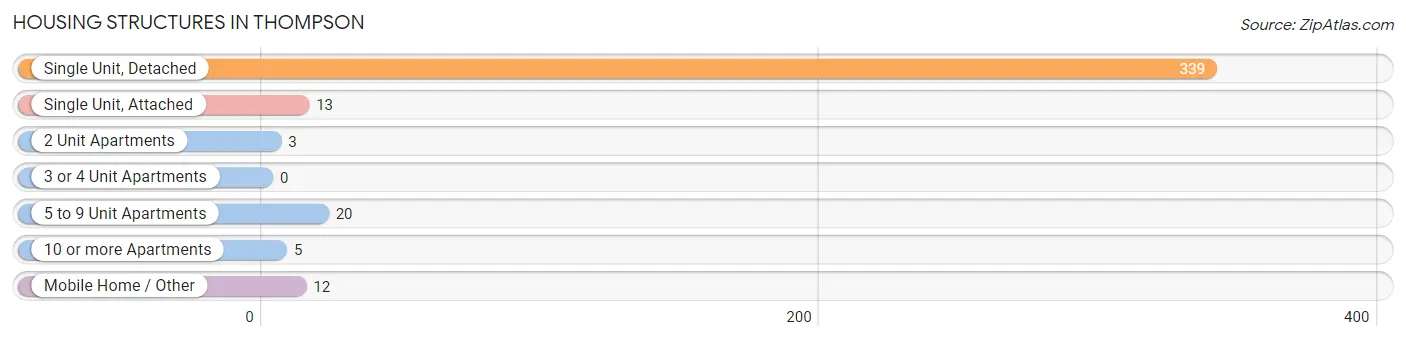
| Structure Type | # Housing Units | % Housing Units |
| Single Unit, Detached | 339 | 86.5% |
| Single Unit, Attached | 13 | 3.3% |
| 2 Unit Apartments | 3 | 0.8% |
| 3 or 4 Unit Apartments | 0 | 0.0% |
| 5 to 9 Unit Apartments | 20 | 5.1% |
| 10 or more Apartments | 5 | 1.3% |
| Mobile Home / Other | 12 | 3.1% |
| Total | 392 | 100.0% |
Housing Structures by Occupancy in Thompson
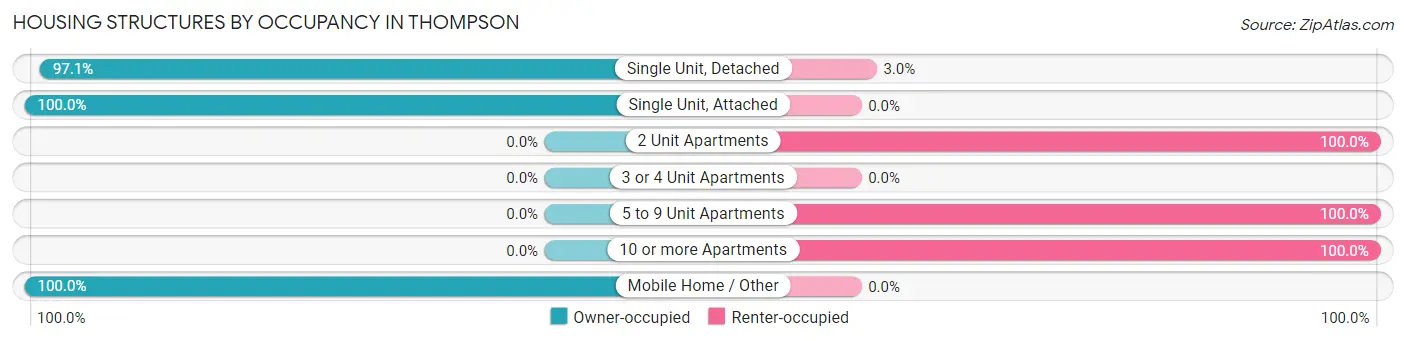
| Structure Type | Owner-occupied | Renter-occupied |
| Single Unit, Detached | 329 (97.1%) | 10 (2.9%) |
| Single Unit, Attached | 13 (100.0%) | 0 (0.0%) |
| 2 Unit Apartments | 0 (0.0%) | 3 (100.0%) |
| 3 or 4 Unit Apartments | 0 (0.0%) | 0 (0.0%) |
| 5 to 9 Unit Apartments | 0 (0.0%) | 20 (100.0%) |
| 10 or more Apartments | 0 (0.0%) | 5 (100.0%) |
| Mobile Home / Other | 12 (100.0%) | 0 (0.0%) |
| Total | 354 (90.3%) | 38 (9.7%) |
Housing Structures by Number of Rooms in Thompson
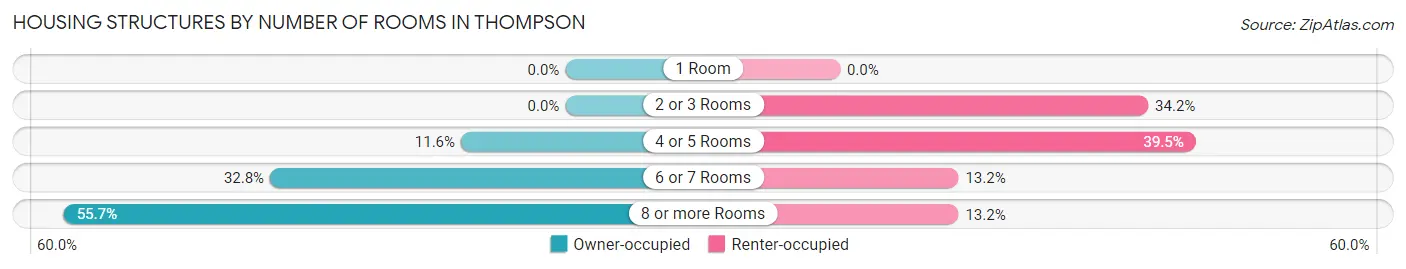
| Number of Rooms | Owner-occupied | Renter-occupied |
| 1 Room | 0 (0.0%) | 0 (0.0%) |
| 2 or 3 Rooms | 0 (0.0%) | 13 (34.2%) |
| 4 or 5 Rooms | 41 (11.6%) | 15 (39.5%) |
| 6 or 7 Rooms | 116 (32.8%) | 5 (13.2%) |
| 8 or more Rooms | 197 (55.6%) | 5 (13.2%) |
| Total | 354 (100.0%) | 38 (100.0%) |
Housing Structure by Heating Type in Thompson
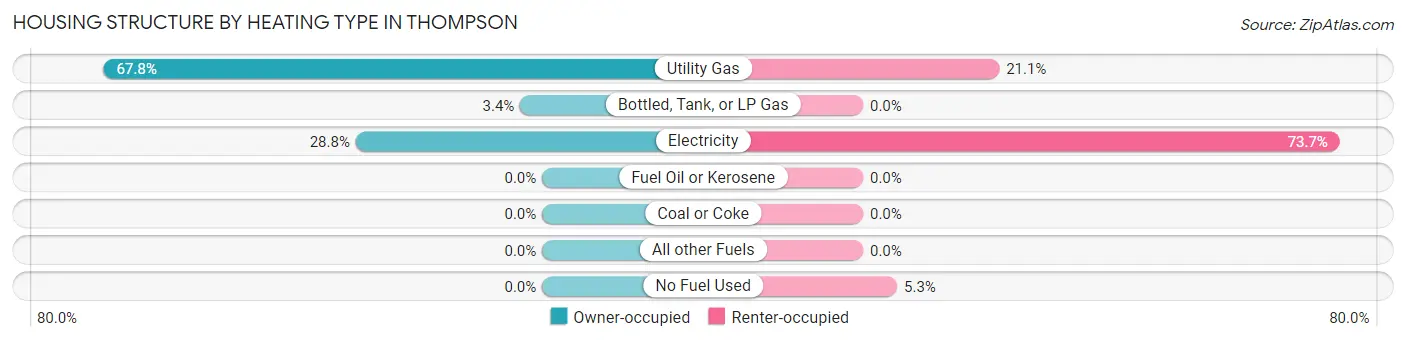
| Heating Type | Owner-occupied | Renter-occupied |
| Utility Gas | 240 (67.8%) | 8 (21.0%) |
| Bottled, Tank, or LP Gas | 12 (3.4%) | 0 (0.0%) |
| Electricity | 102 (28.8%) | 28 (73.7%) |
| Fuel Oil or Kerosene | 0 (0.0%) | 0 (0.0%) |
| Coal or Coke | 0 (0.0%) | 0 (0.0%) |
| All other Fuels | 0 (0.0%) | 0 (0.0%) |
| No Fuel Used | 0 (0.0%) | 2 (5.3%) |
| Total | 354 (100.0%) | 38 (100.0%) |
Household Vehicle Usage in Thompson
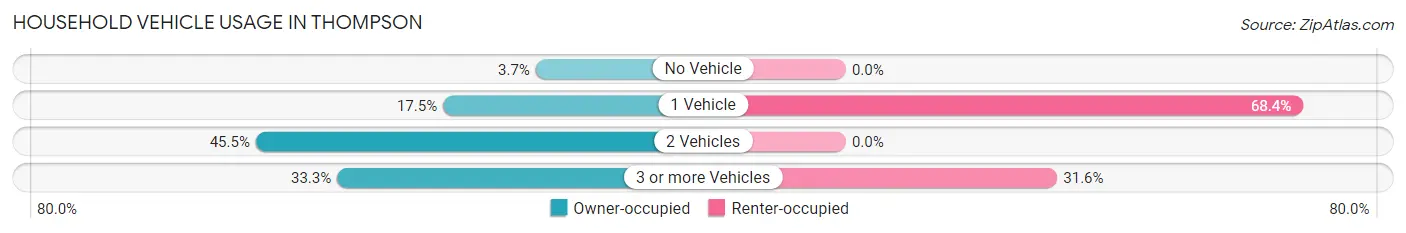
| Vehicles per Household | Owner-occupied | Renter-occupied |
| No Vehicle | 13 (3.7%) | 0 (0.0%) |
| 1 Vehicle | 62 (17.5%) | 26 (68.4%) |
| 2 Vehicles | 161 (45.5%) | 0 (0.0%) |
| 3 or more Vehicles | 118 (33.3%) | 12 (31.6%) |
| Total | 354 (100.0%) | 38 (100.0%) |
Real Estate & Mortgages in Thompson
Real Estate and Mortgage Overview in Thompson
| Characteristic | Without Mortgage | With Mortgage |
| Housing Units | 102 | 252 |
| Median Property Value | $220,400 | $274,500 |
| Median Household Income | $84,833 | $104 |
| Monthly Housing Costs | $582 | $5 |
| Real Estate Taxes | $2,583 | $0 |
Property Value by Mortgage Status in Thompson
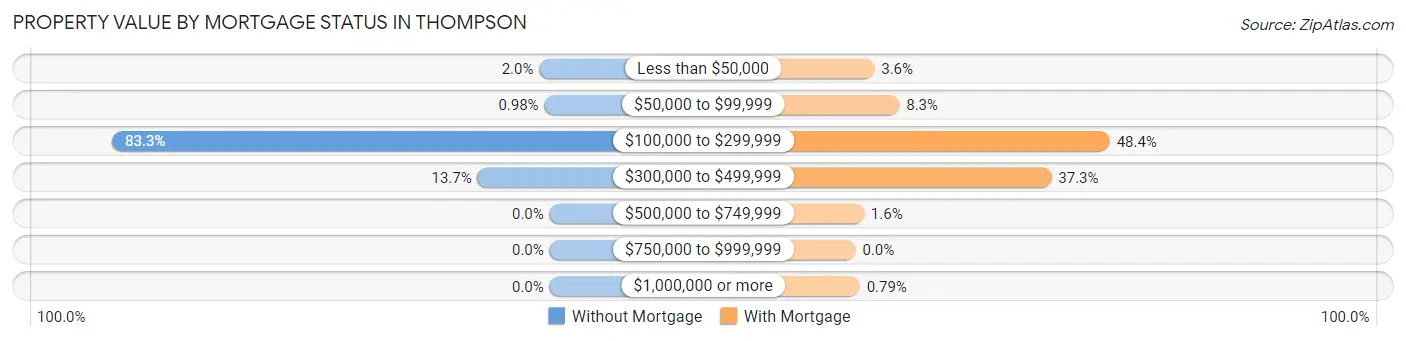
| Property Value | Without Mortgage | With Mortgage |
| Less than $50,000 | 2 (2.0%) | 9 (3.6%) |
| $50,000 to $99,999 | 1 (1.0%) | 21 (8.3%) |
| $100,000 to $299,999 | 85 (83.3%) | 122 (48.4%) |
| $300,000 to $499,999 | 14 (13.7%) | 94 (37.3%) |
| $500,000 to $749,999 | 0 (0.0%) | 4 (1.6%) |
| $750,000 to $999,999 | 0 (0.0%) | 0 (0.0%) |
| $1,000,000 or more | 0 (0.0%) | 2 (0.8%) |
| Total | 102 (100.0%) | 252 (100.0%) |
Household Income by Mortgage Status in Thompson
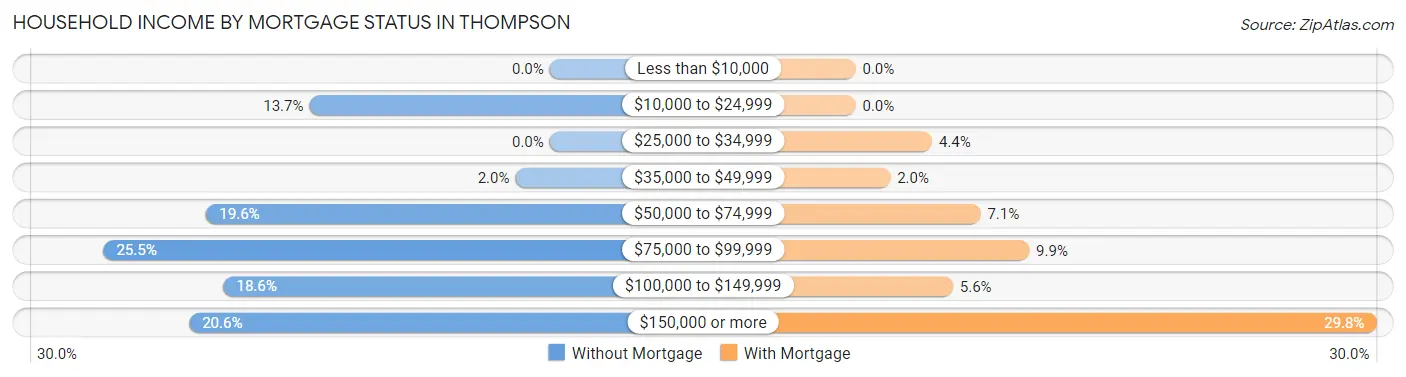
| Household Income | Without Mortgage | With Mortgage |
| Less than $10,000 | 0 (0.0%) | 0 (0.0%) |
| $10,000 to $24,999 | 14 (13.7%) | 0 (0.0%) |
| $25,000 to $34,999 | 0 (0.0%) | 11 (4.4%) |
| $35,000 to $49,999 | 2 (2.0%) | 5 (2.0%) |
| $50,000 to $74,999 | 20 (19.6%) | 18 (7.1%) |
| $75,000 to $99,999 | 26 (25.5%) | 25 (9.9%) |
| $100,000 to $149,999 | 19 (18.6%) | 14 (5.6%) |
| $150,000 or more | 21 (20.6%) | 75 (29.8%) |
| Total | 102 (100.0%) | 252 (100.0%) |
Property Value to Household Income Ratio in Thompson
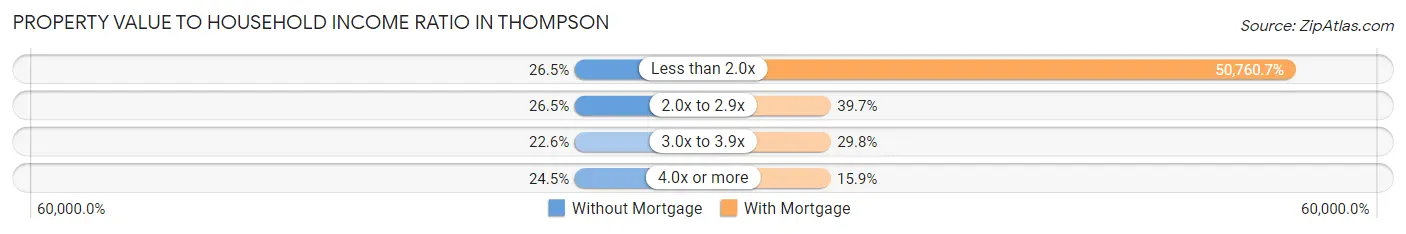
| Value-to-Income Ratio | Without Mortgage | With Mortgage |
| Less than 2.0x | 27 (26.5%) | 127,917 (50,760.7%) |
| 2.0x to 2.9x | 27 (26.5%) | 100 (39.7%) |
| 3.0x to 3.9x | 23 (22.6%) | 75 (29.8%) |
| 4.0x or more | 25 (24.5%) | 40 (15.9%) |
| Total | 102 (100.0%) | 252 (100.0%) |
Real Estate Taxes by Mortgage Status in Thompson
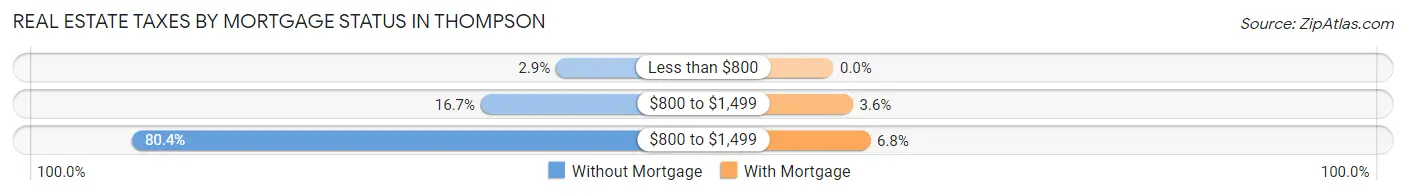
| Property Taxes | Without Mortgage | With Mortgage |
| Less than $800 | 3 (2.9%) | 0 (0.0%) |
| $800 to $1,499 | 17 (16.7%) | 9 (3.6%) |
| $800 to $1,499 | 82 (80.4%) | 17 (6.8%) |
| Total | 102 (100.0%) | 252 (100.0%) |
Health & Disability in Thompson
Health Insurance Coverage by Age in Thompson
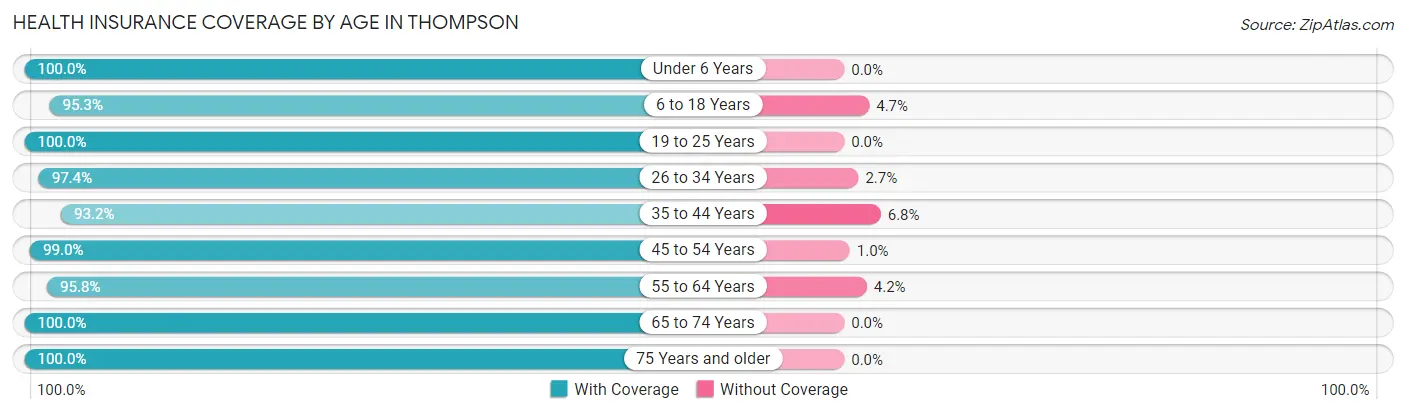
| Age Bracket | With Coverage | Without Coverage |
| Under 6 Years | 53 (100.0%) | 0 (0.0%) |
| 6 to 18 Years | 225 (95.3%) | 11 (4.7%) |
| 19 to 25 Years | 52 (100.0%) | 0 (0.0%) |
| 26 to 34 Years | 110 (97.4%) | 3 (2.6%) |
| 35 to 44 Years | 96 (93.2%) | 7 (6.8%) |
| 45 to 54 Years | 191 (99.0%) | 2 (1.0%) |
| 55 to 64 Years | 182 (95.8%) | 8 (4.2%) |
| 65 to 74 Years | 60 (100.0%) | 0 (0.0%) |
| 75 Years and older | 50 (100.0%) | 0 (0.0%) |
| Total | 1,019 (97.1%) | 31 (2.9%) |
Health Insurance Coverage by Citizenship Status in Thompson
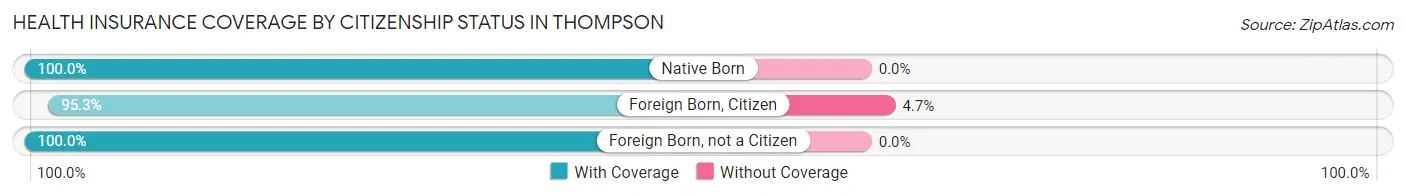
| Citizenship Status | With Coverage | Without Coverage |
| Native Born | 53 (100.0%) | 0 (0.0%) |
| Foreign Born, Citizen | 225 (95.3%) | 11 (4.7%) |
| Foreign Born, not a Citizen | 52 (100.0%) | 0 (0.0%) |
Health Insurance Coverage by Household Income in Thompson
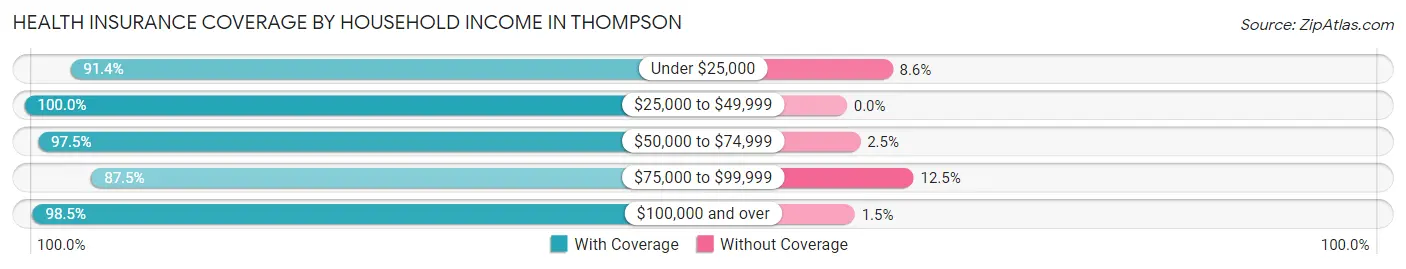
| Household Income | With Coverage | Without Coverage |
| Under $25,000 | 32 (91.4%) | 3 (8.6%) |
| $25,000 to $49,999 | 45 (100.0%) | 0 (0.0%) |
| $50,000 to $74,999 | 116 (97.5%) | 3 (2.5%) |
| $75,000 to $99,999 | 98 (87.5%) | 14 (12.5%) |
| $100,000 and over | 728 (98.5%) | 11 (1.5%) |
Public vs Private Health Insurance Coverage by Age in Thompson
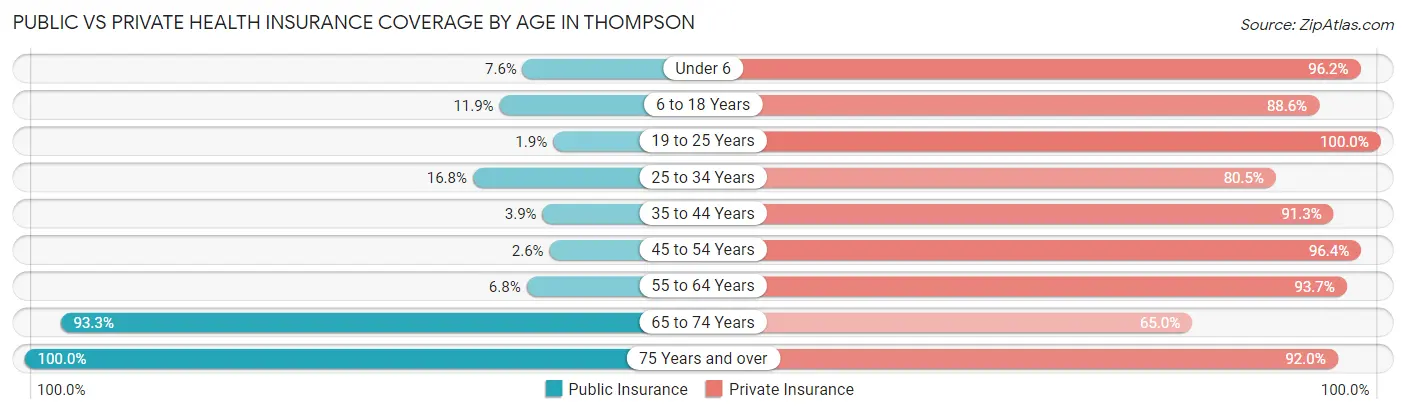
| Age Bracket | Public Insurance | Private Insurance |
| Under 6 | 4 (7.5%) | 51 (96.2%) |
| 6 to 18 Years | 28 (11.9%) | 209 (88.6%) |
| 19 to 25 Years | 1 (1.9%) | 52 (100.0%) |
| 25 to 34 Years | 19 (16.8%) | 91 (80.5%) |
| 35 to 44 Years | 4 (3.9%) | 94 (91.3%) |
| 45 to 54 Years | 5 (2.6%) | 186 (96.4%) |
| 55 to 64 Years | 13 (6.8%) | 178 (93.7%) |
| 65 to 74 Years | 56 (93.3%) | 39 (65.0%) |
| 75 Years and over | 50 (100.0%) | 46 (92.0%) |
| Total | 180 (17.1%) | 946 (90.1%) |
Disability Status by Sex by Age in Thompson
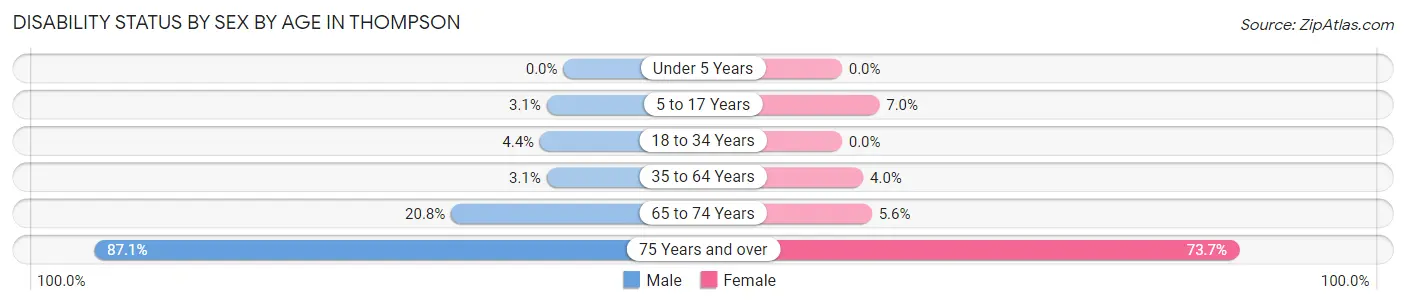
| Age Bracket | Male | Female |
| Under 5 Years | 0 (0.0%) | 0 (0.0%) |
| 5 to 17 Years | 4 (3.1%) | 8 (7.0%) |
| 18 to 34 Years | 3 (4.3%) | 0 (0.0%) |
| 35 to 64 Years | 8 (3.1%) | 9 (4.0%) |
| 65 to 74 Years | 5 (20.8%) | 2 (5.6%) |
| 75 Years and over | 27 (87.1%) | 14 (73.7%) |
Disability Class by Sex by Age in Thompson
Disability Class: Hearing Difficulty
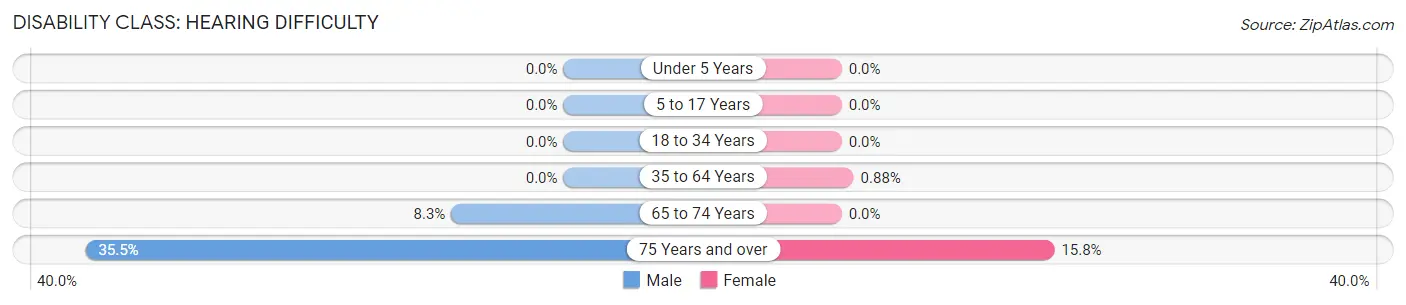
| Age Bracket | Male | Female |
| Under 5 Years | 0 (0.0%) | 0 (0.0%) |
| 5 to 17 Years | 0 (0.0%) | 0 (0.0%) |
| 18 to 34 Years | 0 (0.0%) | 0 (0.0%) |
| 35 to 64 Years | 0 (0.0%) | 2 (0.9%) |
| 65 to 74 Years | 2 (8.3%) | 0 (0.0%) |
| 75 Years and over | 11 (35.5%) | 3 (15.8%) |
Disability Class: Vision Difficulty
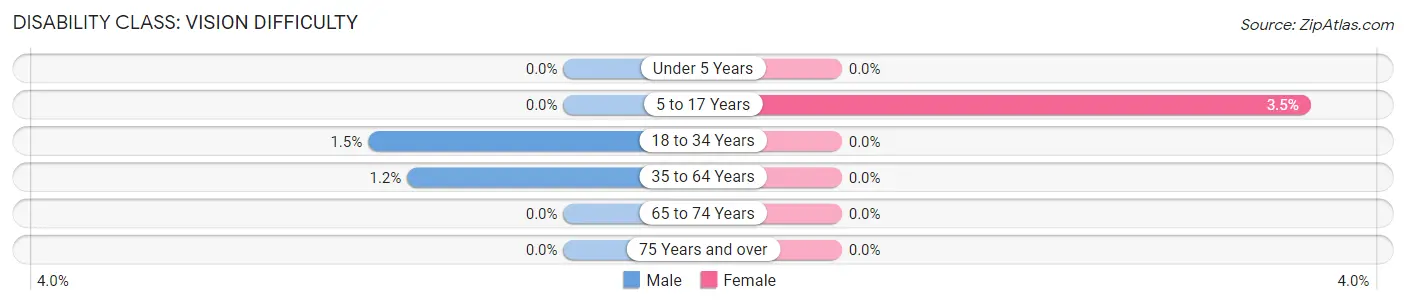
| Age Bracket | Male | Female |
| Under 5 Years | 0 (0.0%) | 0 (0.0%) |
| 5 to 17 Years | 0 (0.0%) | 4 (3.5%) |
| 18 to 34 Years | 1 (1.5%) | 0 (0.0%) |
| 35 to 64 Years | 3 (1.2%) | 0 (0.0%) |
| 65 to 74 Years | 0 (0.0%) | 0 (0.0%) |
| 75 Years and over | 0 (0.0%) | 0 (0.0%) |
Disability Class: Cognitive Difficulty
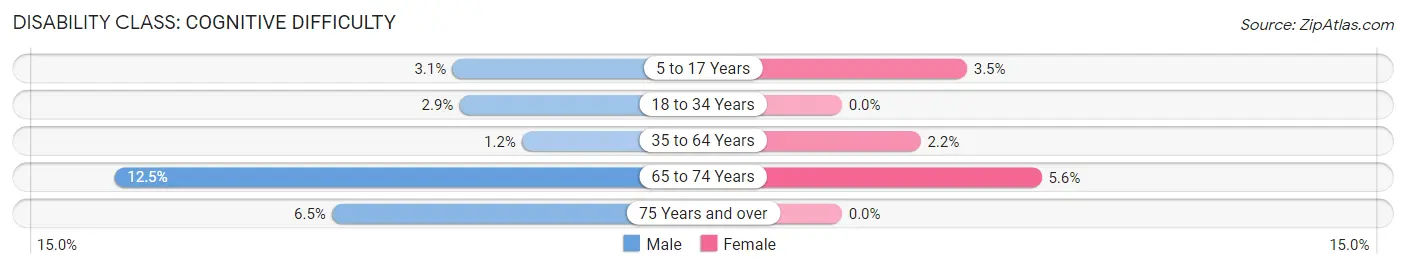
| Age Bracket | Male | Female |
| 5 to 17 Years | 4 (3.1%) | 4 (3.5%) |
| 18 to 34 Years | 2 (2.9%) | 0 (0.0%) |
| 35 to 64 Years | 3 (1.2%) | 5 (2.2%) |
| 65 to 74 Years | 3 (12.5%) | 2 (5.6%) |
| 75 Years and over | 2 (6.5%) | 0 (0.0%) |
Disability Class: Ambulatory Difficulty
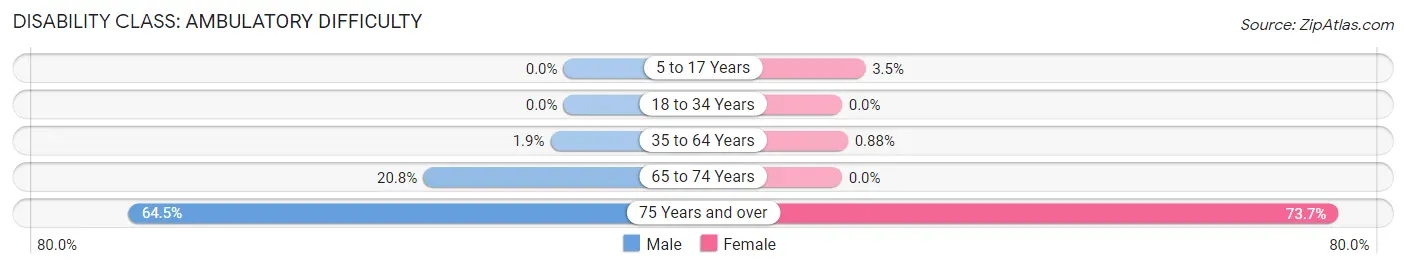
| Age Bracket | Male | Female |
| 5 to 17 Years | 0 (0.0%) | 4 (3.5%) |
| 18 to 34 Years | 0 (0.0%) | 0 (0.0%) |
| 35 to 64 Years | 5 (1.9%) | 2 (0.9%) |
| 65 to 74 Years | 5 (20.8%) | 0 (0.0%) |
| 75 Years and over | 20 (64.5%) | 14 (73.7%) |
Disability Class: Self-Care Difficulty
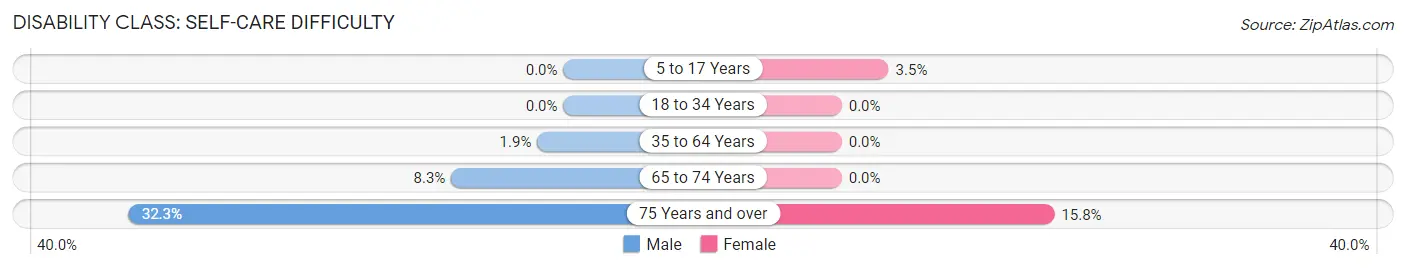
| Age Bracket | Male | Female |
| 5 to 17 Years | 0 (0.0%) | 4 (3.5%) |
| 18 to 34 Years | 0 (0.0%) | 0 (0.0%) |
| 35 to 64 Years | 5 (1.9%) | 0 (0.0%) |
| 65 to 74 Years | 2 (8.3%) | 0 (0.0%) |
| 75 Years and over | 10 (32.3%) | 3 (15.8%) |
Technology Access in Thompson
Computing Device Access in Thompson
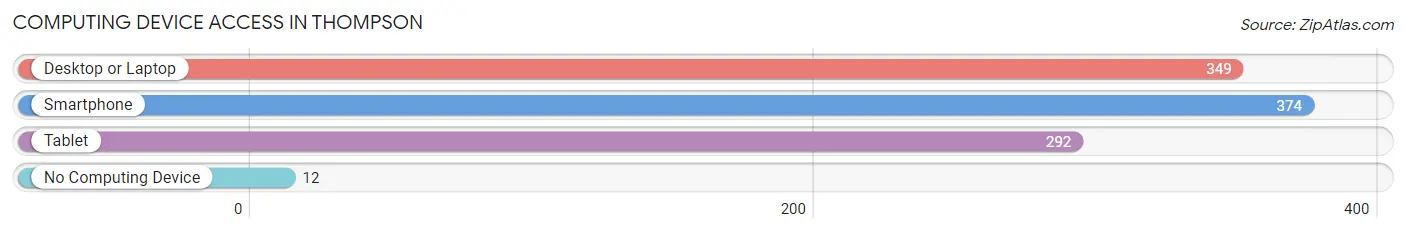
| Device Type | # Households | % Households |
| Desktop or Laptop | 349 | 89.0% |
| Smartphone | 374 | 95.4% |
| Tablet | 292 | 74.5% |
| No Computing Device | 12 | 3.1% |
| Total | 392 | 100.0% |
Internet Access in Thompson
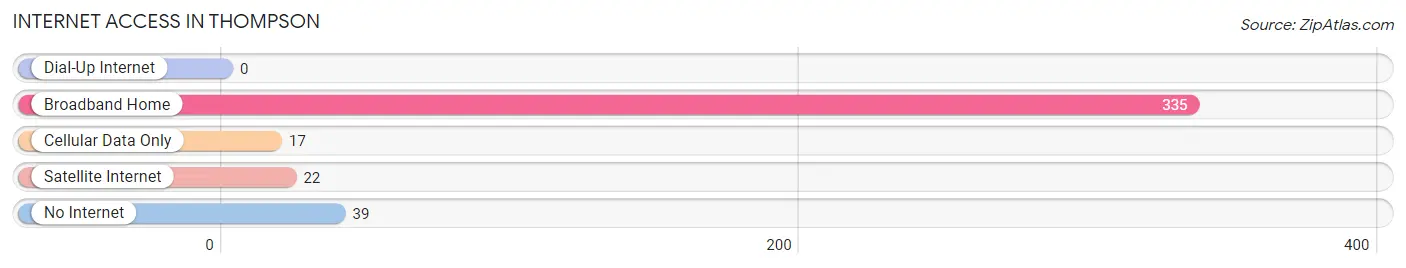
| Internet Type | # Households | % Households |
| Dial-Up Internet | 0 | 0.0% |
| Broadband Home | 335 | 85.5% |
| Cellular Data Only | 17 | 4.3% |
| Satellite Internet | 22 | 5.6% |
| No Internet | 39 | 10.0% |
| Total | 392 | 100.0% |
Thompson Summary
The state of North Dakota is located in the Midwestern and Northern regions of the United States. It is bordered by the Canadian provinces of Saskatchewan and Manitoba to the north, Minnesota to the east, South Dakota to the south, and Montana to the west. North Dakota is the 19th largest state in the United States, with an area of 70,700 square miles. It is the fourth least populous state in the country, with a population of 762,062 as of the 2020 census.
History
The area that is now North Dakota has been inhabited by various Native American tribes for thousands of years. The first Europeans to explore the area were French fur traders in the late 17th century. The area was part of the Louisiana Purchase in 1803, and was part of the Dakota Territory from 1861 to 1889. North Dakota became the 39th state in 1889.
The state’s economy was largely based on agriculture until the 1950s, when the discovery of oil and natural gas in the western part of the state led to an economic boom. The state’s economy has since diversified, and today it is home to a variety of industries, including energy, manufacturing, technology, and tourism.
Geography
North Dakota is located in the Great Plains region of the United States. It is bordered by the Canadian provinces of Saskatchewan and Manitoba to the north, Minnesota to the east, South Dakota to the south, and Montana to the west. The state is divided into 53 counties, and its capital is Bismarck.
The state is home to the Badlands, a region of rugged terrain and canyons in the western part of the state. The Missouri River forms the eastern border of the state, and the Red River forms the western border. The state is home to numerous lakes, including Lake Sakakawea, Lake Oahe, and Lake Audubon.
Economy
North Dakota’s economy is largely based on agriculture, energy, and manufacturing. The state is the second-largest producer of wheat in the United States, and is also a major producer of barley, oats, and other grains. The state is also a major producer of oil and natural gas, and is home to several large oil refineries.
Manufacturing is also an important part of the state’s economy. The state is home to several large manufacturing companies, including John Deere, 3M, and General Mills. The state is also home to several technology companies, including Microsoft and Amazon.
Demographics
As of the 2020 census, North Dakota had a population of 762,062. The state is predominantly white, with a population that is 87.2% non-Hispanic white. The state also has a large Native American population, with 5.2% of the population identifying as Native American. The state also has a small African American population, with 1.2% of the population identifying as African American.
The state’s largest city is Fargo, with a population of 122,359. Other major cities include Bismarck, Grand Forks, Minot, and Williston. The state’s capital is Bismarck, with a population of 72,865.
North Dakota is a largely rural state, with a population density of 11.2 people per square mile. The state’s median household income is $58,906, and the median home value is $179,400. The state’s unemployment rate is 3.2%.
Common Questions
What is the Total Population of Thompson?
Total Population of Thompson is 1,052.
What is the Total Male Population of Thompson?
Total Male Population of Thompson is 536.
What is the Total Female Population of Thompson?
Total Female Population of Thompson is 516.
What is the Ratio of Males per 100 Females in Thompson?
There are 103.88 Males per 100 Females in Thompson.
What is the Ratio of Females per 100 Males in Thompson?
There are 96.27 Females per 100 Males in Thompson.
What is the Median Population Age in Thompson?
Median Population Age in Thompson is 41.5 Years.
What is the Average Family Size in Thompson
Average Family Size in Thompson is 3.1 People.
What is the Average Household Size in Thompson
Average Household Size in Thompson is 2.7 People.
What is Per Capita Income in Thompson?
Per Capita income in Thompson is $44,329.
What is the Median Family Income in Thompson?
Median Family Income in Thompson is $123,750.
What is the Median Household income in Thompson?
Median Household Income in Thompson is $108,333.
What is Income or Wage Gap in Thompson?
Income or Wage Gap in Thompson is 25.6%.
Women in Thompson earn 74.4 cents for every dollar earned by a man.
What is Inequality or Gini Index in Thompson?
Inequality or Gini Index in Thompson is 0.34.
How Large is the Labor Force in Thompson?
There are 636 People in the Labor Forcein in Thompson.
What is the Percentage of People in the Labor Force in Thompson?
78.9% of People are in the Labor Force in Thompson.
What is the Unemployment Rate in Thompson?
Unemployment Rate in Thompson is 0.2%.