Shoal Creek Drive, MO
Shoal Creek Drive Map
Shoal Creek Drive Overview
598
TOTAL POPULATION
264
MALE POPULATION
334
FEMALE POPULATION
79.04
MALES / 100 FEMALES
126.52
FEMALES / 100 MALES
27.7
MEDIAN AGE
3.7
AVG FAMILY SIZE
3.3
AVG HOUSEHOLD SIZE
$28,846
PER CAPITA INCOME
$98,125
AVG FAMILY INCOME
$96,875
AVG HOUSEHOLD INCOME
49.3%
WAGE / INCOME GAP [ % ]
50.7¢/ $1
WAGE / INCOME GAP [ $ ]
0.34
INEQUALITY / GINI INDEX
287
LABOR FORCE [ PEOPLE ]
65.7%
PERCENT IN LABOR FORCE
2.4%
UNEMPLOYMENT RATE
Race in Shoal Creek Drive
The most populous races in Shoal Creek Drive are White / Caucasian (397 | 66.4%), Two or more Races (167 | 27.9%), and Hispanic or Latino (33 | 5.5%).
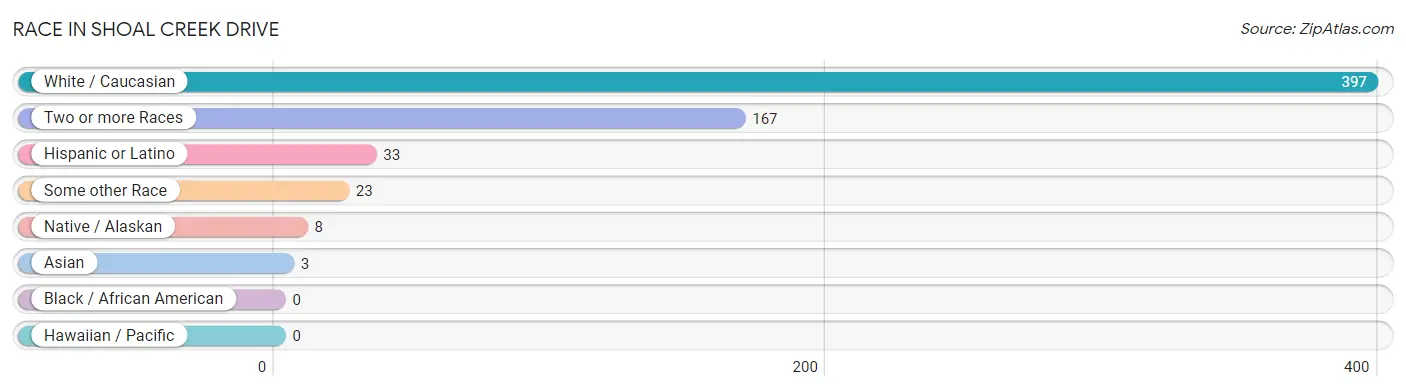
| Race | # Population | % Population |
| Asian | 3 | 0.5% |
| Black / African American | 0 | 0.0% |
| Hawaiian / Pacific | 0 | 0.0% |
| Hispanic or Latino | 33 | 5.5% |
| Native / Alaskan | 8 | 1.3% |
| White / Caucasian | 397 | 66.4% |
| Two or more Races | 167 | 27.9% |
| Some other Race | 23 | 3.8% |
| Total | 598 | 100.0% |
Ancestry in Shoal Creek Drive
The most populous ancestries reported in Shoal Creek Drive are German (183 | 30.6%), Irish (183 | 30.6%), Iroquois (64 | 10.7%), English (56 | 9.4%), and American (37 | 6.2%), together accounting for 87.4% of all Shoal Creek Drive residents.
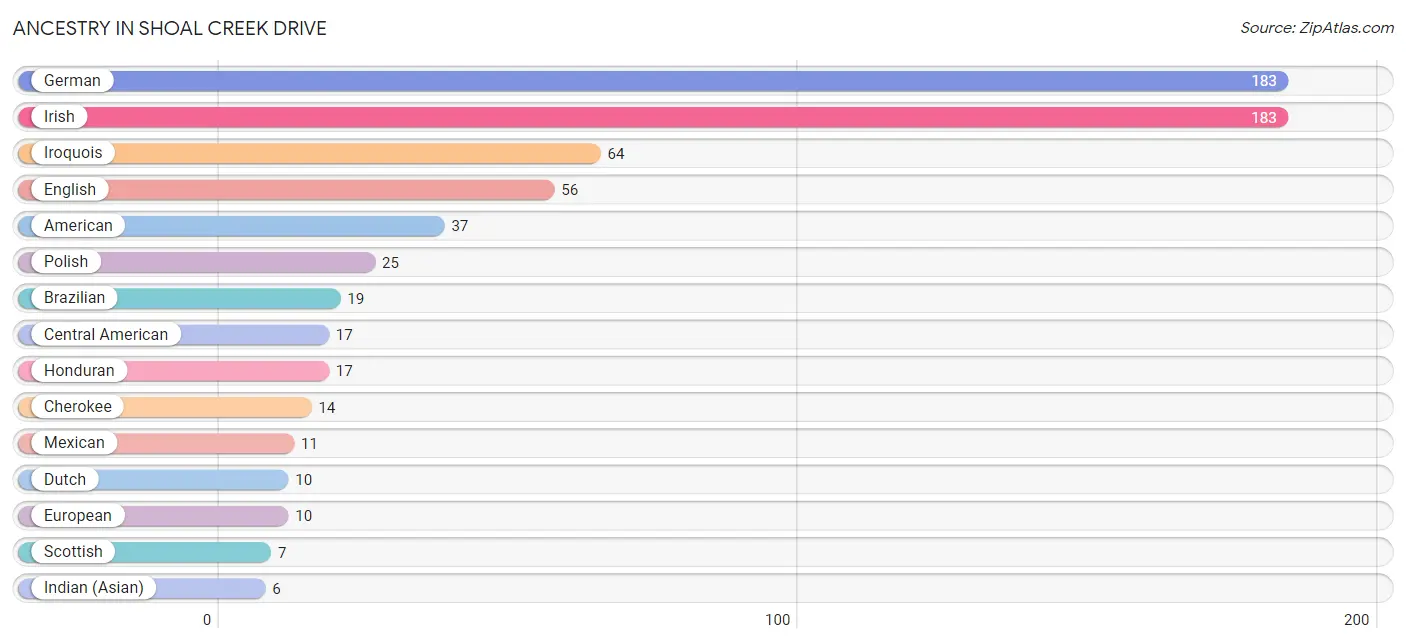
| Ancestry | # Population | % Population |
| American | 37 | 6.2% |
| Austrian | 3 | 0.5% |
| Blackfeet | 2 | 0.3% |
| Brazilian | 19 | 3.2% |
| British | 5 | 0.8% |
| Central American | 17 | 2.8% |
| Cherokee | 14 | 2.3% |
| Dutch | 10 | 1.7% |
| English | 56 | 9.4% |
| European | 10 | 1.7% |
| French | 1 | 0.2% |
| German | 183 | 30.6% |
| Honduran | 17 | 2.8% |
| Indian (Asian) | 6 | 1.0% |
| Irish | 183 | 30.6% |
| Iroquois | 64 | 10.7% |
| Italian | 6 | 1.0% |
| Korean | 2 | 0.3% |
| Mexican | 11 | 1.8% |
| Norwegian | 2 | 0.3% |
| Osage | 3 | 0.5% |
| Polish | 25 | 4.2% |
| Portuguese | 3 | 0.5% |
| Puerto Rican | 2 | 0.3% |
| Scotch-Irish | 1 | 0.2% |
| Scottish | 7 | 1.2% |
| Swedish | 1 | 0.2% |
| Welsh | 1 | 0.2% | View All 28 Rows |
Immigrants in Shoal Creek Drive
The most numerous immigrant groups reported in Shoal Creek Drive came from Latin America (32 | 5.3%), Brazil (19 | 3.2%), South America (19 | 3.2%), Central America (13 | 2.2%), and Mexico (8 | 1.3%), together accounting for 15.2% of all Shoal Creek Drive residents.
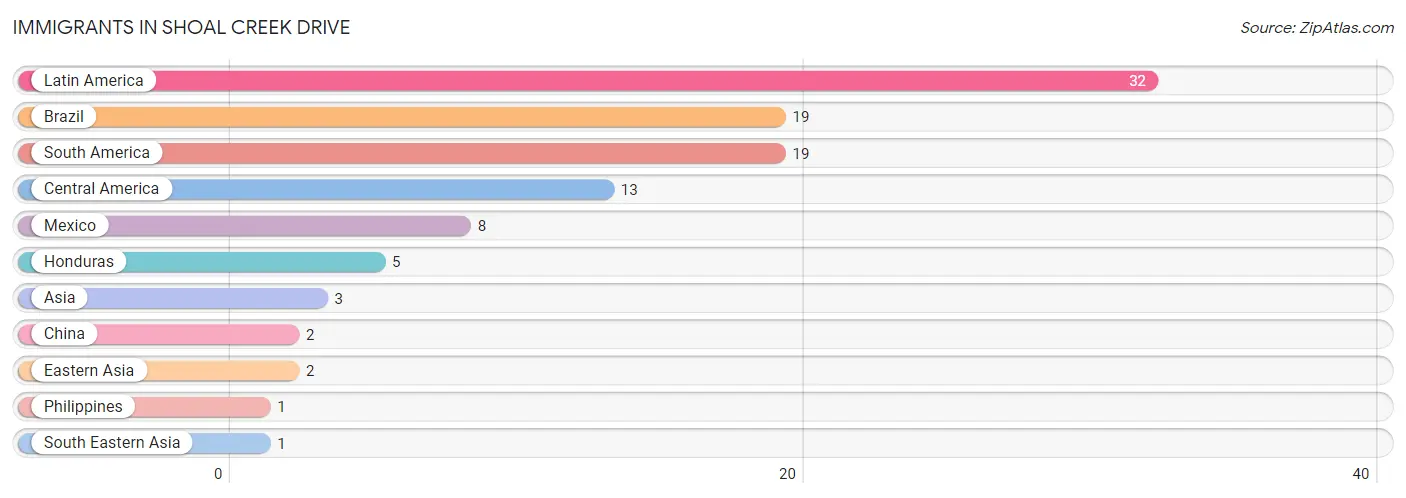
| Immigration Origin | # Population | % Population |
| Asia | 3 | 0.5% |
| Brazil | 19 | 3.2% |
| Central America | 13 | 2.2% |
| China | 2 | 0.3% |
| Eastern Asia | 2 | 0.3% |
| Honduras | 5 | 0.8% |
| Latin America | 32 | 5.3% |
| Mexico | 8 | 1.3% |
| Philippines | 1 | 0.2% |
| South America | 19 | 3.2% |
| South Eastern Asia | 1 | 0.2% | View All 11 Rows |
Sex and Age in Shoal Creek Drive
Sex and Age in Shoal Creek Drive
The most populous age groups in Shoal Creek Drive are 35 to 39 Years (36 | 13.6%) for men and 25 to 29 Years (43 | 12.9%) for women.
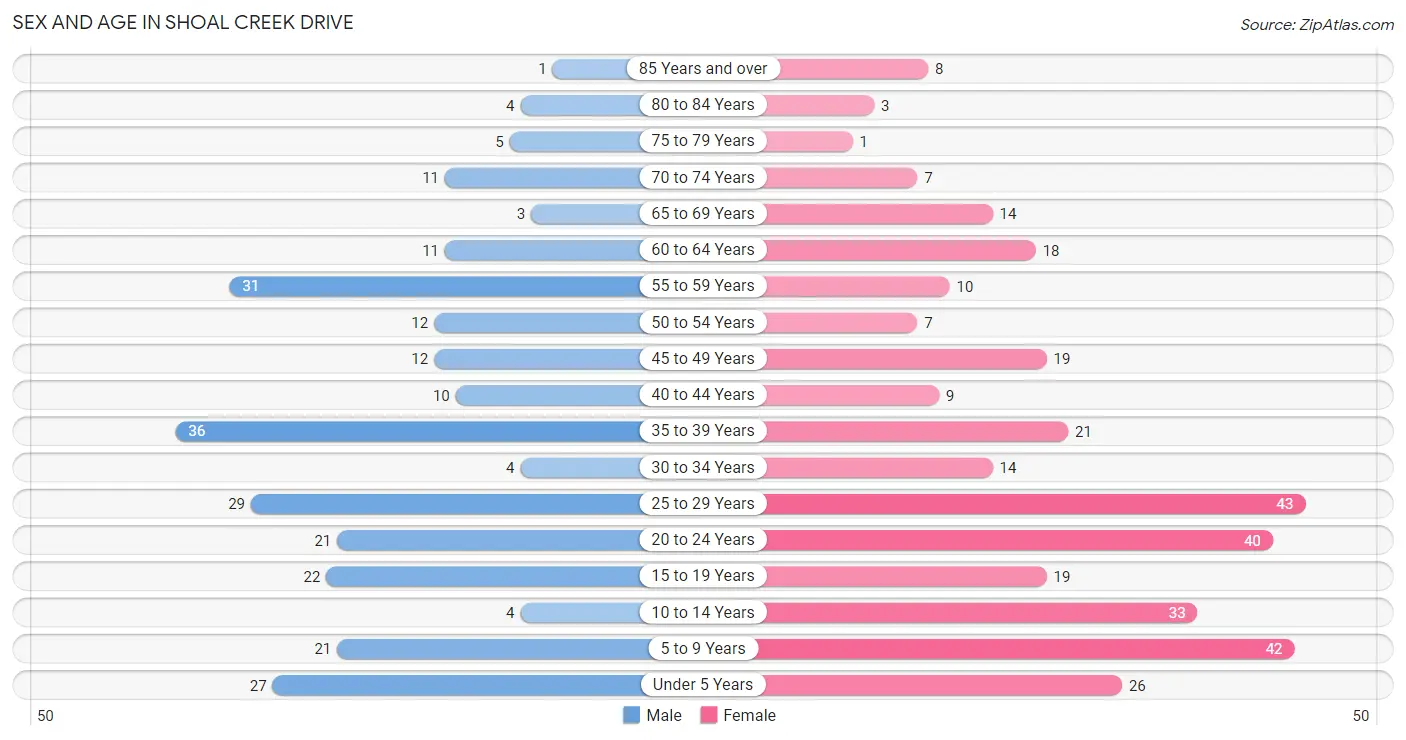
| Age Bracket | Male | Female |
| Under 5 Years | 27 (10.2%) | 26 (7.8%) |
| 5 to 9 Years | 21 (8.0%) | 42 (12.6%) |
| 10 to 14 Years | 4 (1.5%) | 33 (9.9%) |
| 15 to 19 Years | 22 (8.3%) | 19 (5.7%) |
| 20 to 24 Years | 21 (8.0%) | 40 (12.0%) |
| 25 to 29 Years | 29 (11.0%) | 43 (12.9%) |
| 30 to 34 Years | 4 (1.5%) | 14 (4.2%) |
| 35 to 39 Years | 36 (13.6%) | 21 (6.3%) |
| 40 to 44 Years | 10 (3.8%) | 9 (2.7%) |
| 45 to 49 Years | 12 (4.5%) | 19 (5.7%) |
| 50 to 54 Years | 12 (4.5%) | 7 (2.1%) |
| 55 to 59 Years | 31 (11.7%) | 10 (3.0%) |
| 60 to 64 Years | 11 (4.2%) | 18 (5.4%) |
| 65 to 69 Years | 3 (1.1%) | 14 (4.2%) |
| 70 to 74 Years | 11 (4.2%) | 7 (2.1%) |
| 75 to 79 Years | 5 (1.9%) | 1 (0.3%) |
| 80 to 84 Years | 4 (1.5%) | 3 (0.9%) |
| 85 Years and over | 1 (0.4%) | 8 (2.4%) |
| Total | 264 (100.0%) | 334 (100.0%) |
Families and Households in Shoal Creek Drive
Median Family Size in Shoal Creek Drive
The median family size in Shoal Creek Drive is 3.69 persons per family, with single male/father families (8 | 5.4%) accounting for the largest median family size of 4.5 persons per family. On the other hand, single female/mother families (19 | 12.9%) represent the smallest median family size with 2.89 persons per family.
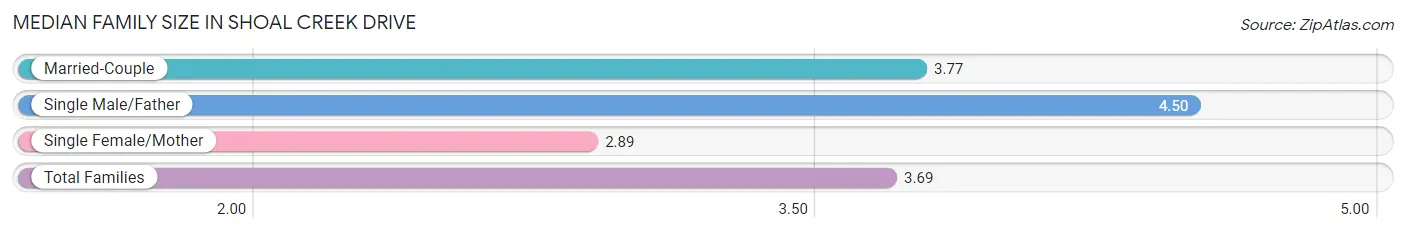
| Family Type | # Families | Family Size |
| Married-Couple | 120 (81.6%) | 3.77 |
| Single Male/Father | 8 (5.4%) | 4.50 |
| Single Female/Mother | 19 (12.9%) | 2.89 |
| Total Families | 147 (100.0%) | 3.69 |
Median Household Size in Shoal Creek Drive
The median household size in Shoal Creek Drive is 3.30 persons per household, with single male/father households (8 | 4.4%) accounting for the largest median household size of 4.5 persons per household. non-family households (34 | 18.8%) represent the smallest median household size with 1.41 persons per household.
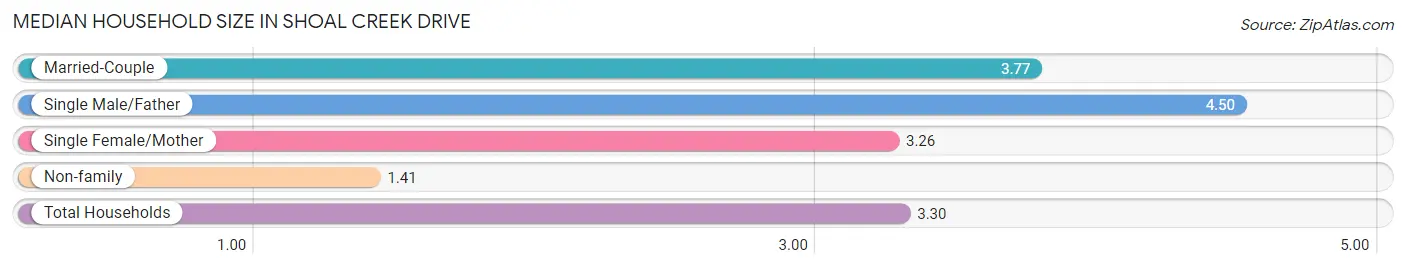
| Household Type | # Households | Household Size |
| Married-Couple | 120 (66.3%) | 3.77 |
| Single Male/Father | 8 (4.4%) | 4.50 |
| Single Female/Mother | 19 (10.5%) | 3.26 |
| Non-family | 34 (18.8%) | 1.41 |
| Total Households | 181 (100.0%) | 3.30 |
Household Size by Marriage Status in Shoal Creek Drive
Out of a total of 181 households in Shoal Creek Drive, 147 (81.2%) are family households, while 34 (18.8%) are nonfamily households. The most numerous type of family households are 4-person households, comprising 46, and the most common type of nonfamily households are 1-person households, comprising 25.
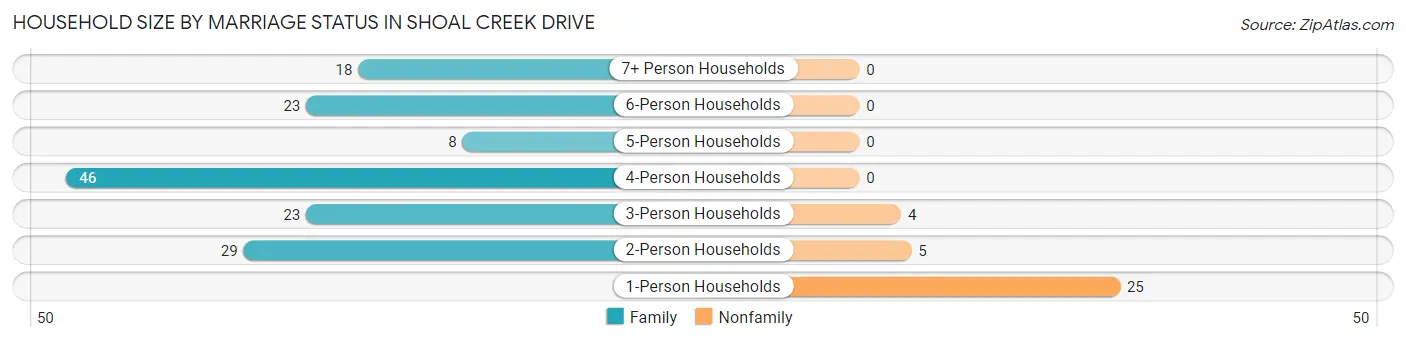
| Household Size | Family Households | Nonfamily Households |
| 1-Person Households | - | 25 (13.8%) |
| 2-Person Households | 29 (16.0%) | 5 (2.8%) |
| 3-Person Households | 23 (12.7%) | 4 (2.2%) |
| 4-Person Households | 46 (25.4%) | 0 (0.0%) |
| 5-Person Households | 8 (4.4%) | 0 (0.0%) |
| 6-Person Households | 23 (12.7%) | 0 (0.0%) |
| 7+ Person Households | 18 (9.9%) | 0 (0.0%) |
| Total | 147 (81.2%) | 34 (18.8%) |
Female Fertility in Shoal Creek Drive
Fertility by Age in Shoal Creek Drive
Average fertility rate in Shoal Creek Drive is 186.0 births per 1,000 women. Women in the age bracket of 20 to 34 years have the highest fertility rate with 320.0 births per 1,000 women. Women in the age bracket of 20 to 34 years acount for 100.0% of all women with births.
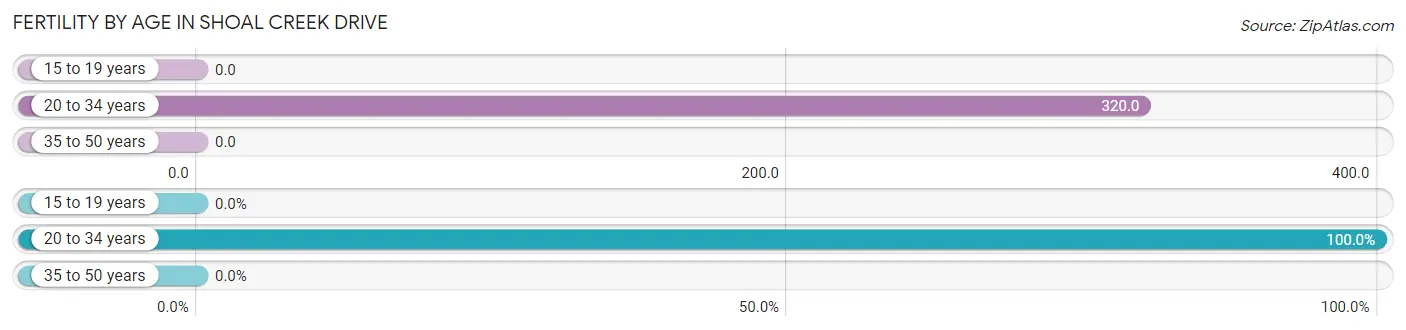
| Age Bracket | Women with Births | Births / 1,000 Women |
| 15 to 19 years | 0 (0.0%) | 0.0 |
| 20 to 34 years | 31 (100.0%) | 320.0 |
| 35 to 50 years | 0 (0.0%) | 0.0 |
| Total | 31 (100.0%) | 186.0 |
Fertility by Age by Marriage Status in Shoal Creek Drive
12.9% of women with births (31) in Shoal Creek Drive are married. The highest percentage of unmarried women with births falls into 20 to 34 years age bracket with 87.1% of them unmarried at the time of birth, while the lowest percentage of unmarried women with births belong to 20 to 34 years age bracket with 87.1% of them unmarried.
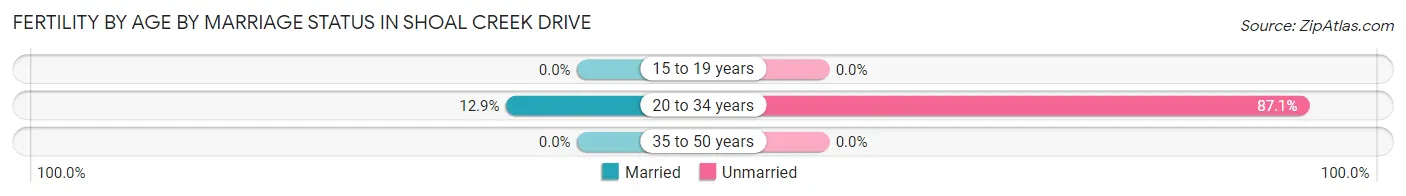
| Age Bracket | Married | Unmarried |
| 15 to 19 years | 0 (0.0%) | 0 (0.0%) |
| 20 to 34 years | 4 (12.9%) | 27 (87.1%) |
| 35 to 50 years | 0 (0.0%) | 0 (0.0%) |
| Total | 4 (12.9%) | 27 (87.1%) |
Fertility by Education in Shoal Creek Drive
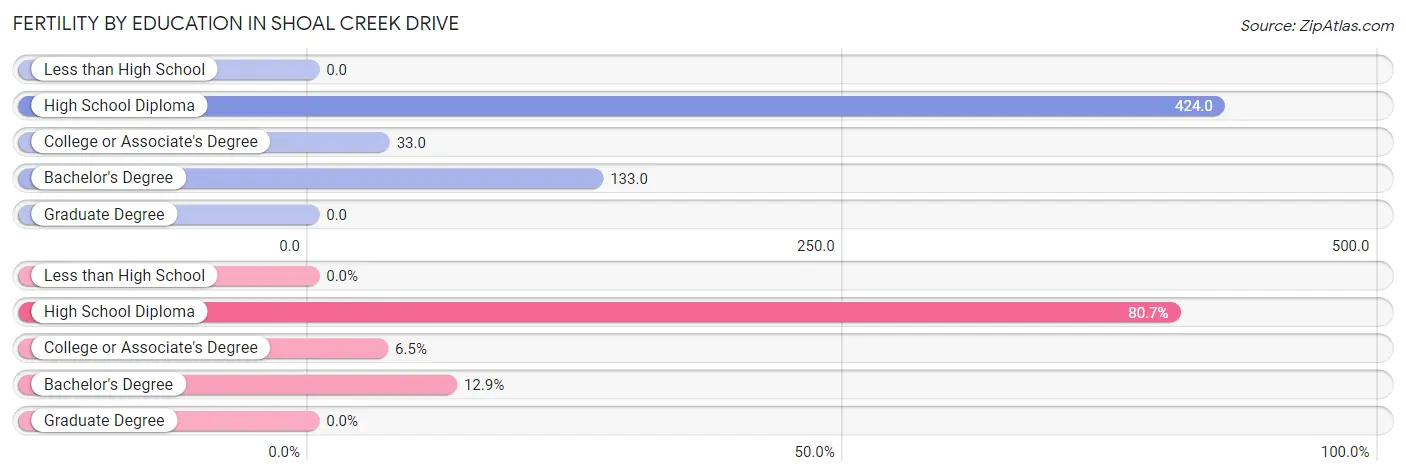
| Educational Attainment | Women with Births | Births / 1,000 Women |
| Less than High School | 0 (0.0%) | 0.0 |
| High School Diploma | 25 (80.6%) | 424.0 |
| College or Associate's Degree | 2 (6.5%) | 33.0 |
| Bachelor's Degree | 4 (12.9%) | 133.0 |
| Graduate Degree | 0 (0.0%) | 0.0 |
| Total | 31 (100.0%) | 186.0 |
Fertility by Education by Marriage Status in Shoal Creek Drive
87.1% of women with births in Shoal Creek Drive are unmarried. Women with the educational attainment of bachelor's degree are most likely to be married with 100.0% of them married at childbirth, while women with the educational attainment of high school diploma are least likely to be married with 100.0% of them unmarried at childbirth.
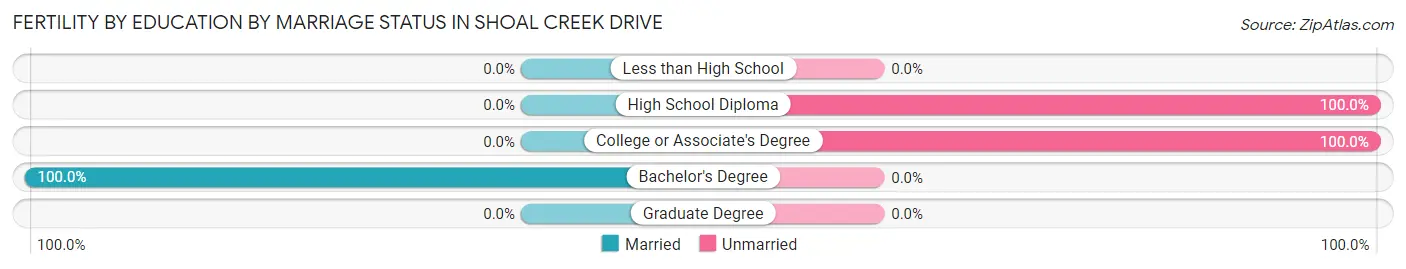
| Educational Attainment | Married | Unmarried |
| Less than High School | 0 (0.0%) | 0 (0.0%) |
| High School Diploma | 0 (0.0%) | 25 (100.0%) |
| College or Associate's Degree | 0 (0.0%) | 2 (100.0%) |
| Bachelor's Degree | 4 (100.0%) | 0 (0.0%) |
| Graduate Degree | 0 (0.0%) | 0 (0.0%) |
| Total | 4 (12.9%) | 27 (87.1%) |
Income in Shoal Creek Drive
Income Overview in Shoal Creek Drive
Per Capita Income in Shoal Creek Drive is $28,846, while median incomes of families and households are $98,125 and $96,875 respectively.
| Characteristic | Number | Measure |
| Per Capita Income | 598 | $28,846 |
| Median Family Income | 147 | $98,125 |
| Mean Family Income | 147 | $106,127 |
| Median Household Income | 181 | $96,875 |
| Mean Household Income | 181 | $108,170 |
| Income Deficit | 147 | $0 |
| Wage / Income Gap (%) | 598 | 49.35% |
| Wage / Income Gap ($) | 598 | 50.65¢ per $1 |
| Gini / Inequality Index | 598 | 0.34 |
Earnings by Sex in Shoal Creek Drive
Average Earnings in Shoal Creek Drive are $36,628, $41,953 for men and $21,250 for women, a difference of 49.3%.
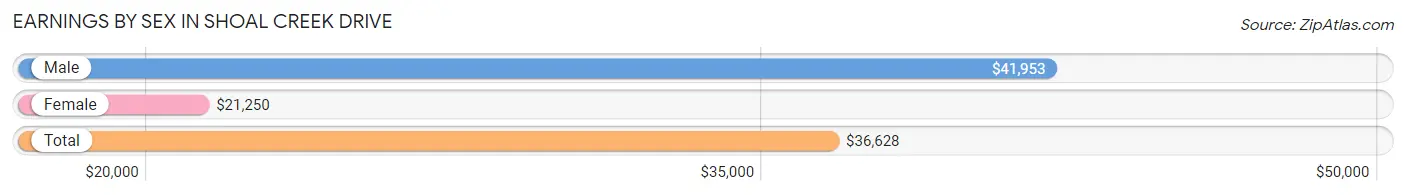
| Sex | Number | Average Earnings |
| Male | 155 (51.3%) | $41,953 |
| Female | 147 (48.7%) | $21,250 |
| Total | 302 (100.0%) | $36,628 |
Earnings by Sex by Income Bracket in Shoal Creek Drive
The most common earnings brackets in Shoal Creek Drive are $100,000+ for men (27 | 17.4%) and $12,500 to $14,999 for women (28 | 19.1%).
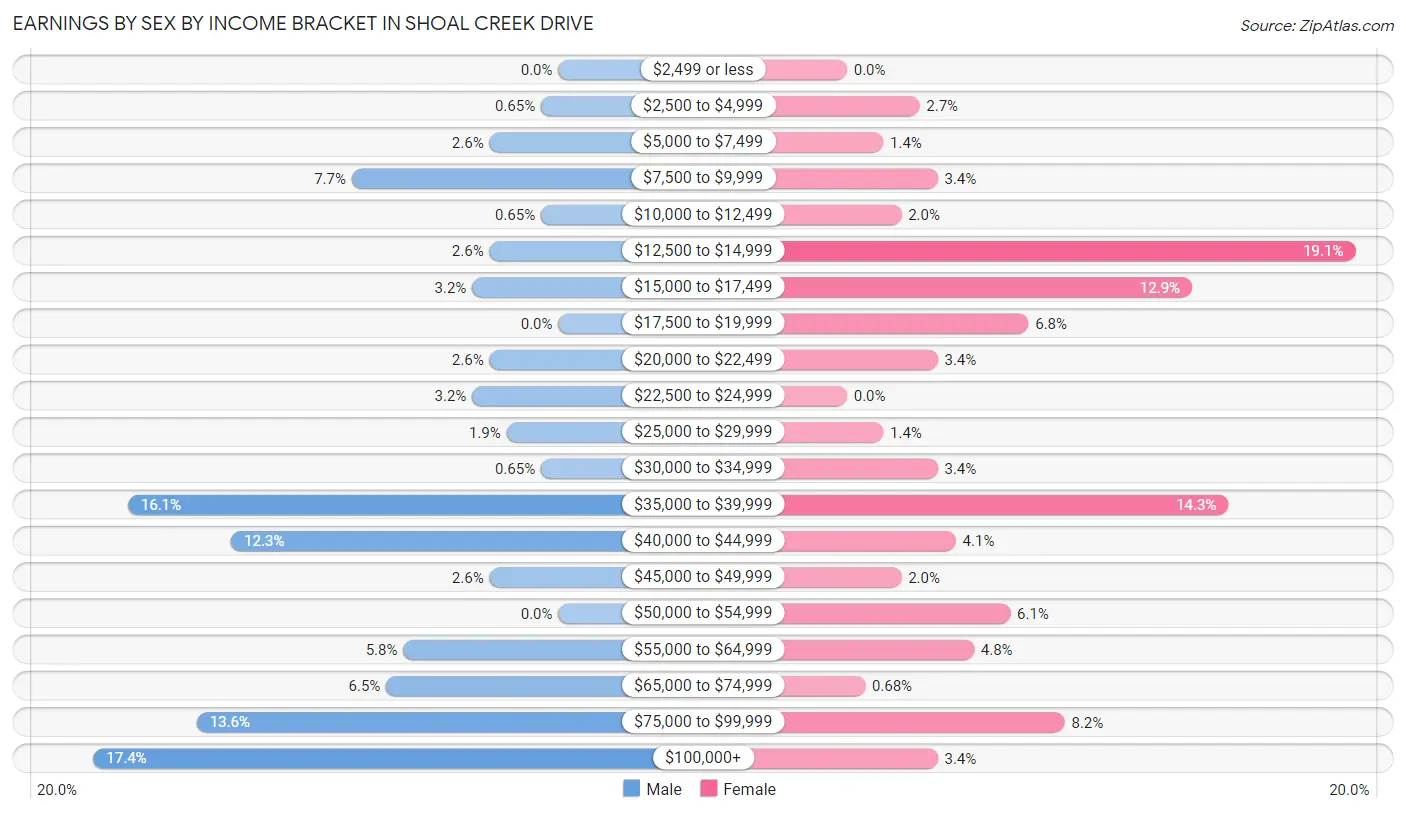
| Income | Male | Female |
| $2,499 or less | 0 (0.0%) | 0 (0.0%) |
| $2,500 to $4,999 | 1 (0.6%) | 4 (2.7%) |
| $5,000 to $7,499 | 4 (2.6%) | 2 (1.4%) |
| $7,500 to $9,999 | 12 (7.7%) | 5 (3.4%) |
| $10,000 to $12,499 | 1 (0.6%) | 3 (2.0%) |
| $12,500 to $14,999 | 4 (2.6%) | 28 (19.1%) |
| $15,000 to $17,499 | 5 (3.2%) | 19 (12.9%) |
| $17,500 to $19,999 | 0 (0.0%) | 10 (6.8%) |
| $20,000 to $22,499 | 4 (2.6%) | 5 (3.4%) |
| $22,500 to $24,999 | 5 (3.2%) | 0 (0.0%) |
| $25,000 to $29,999 | 3 (1.9%) | 2 (1.4%) |
| $30,000 to $34,999 | 1 (0.6%) | 5 (3.4%) |
| $35,000 to $39,999 | 25 (16.1%) | 21 (14.3%) |
| $40,000 to $44,999 | 19 (12.3%) | 6 (4.1%) |
| $45,000 to $49,999 | 4 (2.6%) | 3 (2.0%) |
| $50,000 to $54,999 | 0 (0.0%) | 9 (6.1%) |
| $55,000 to $64,999 | 9 (5.8%) | 7 (4.8%) |
| $65,000 to $74,999 | 10 (6.5%) | 1 (0.7%) |
| $75,000 to $99,999 | 21 (13.6%) | 12 (8.2%) |
| $100,000+ | 27 (17.4%) | 5 (3.4%) |
| Total | 155 (100.0%) | 147 (100.0%) |
Earnings by Sex by Educational Attainment in Shoal Creek Drive
Average earnings in Shoal Creek Drive are $48,333 for men and $36,190 for women, a difference of 25.1%. Men with an educational attainment of high school diploma enjoy the highest average annual earnings of $75,000, while those with bachelor's degree education earn the least with $60,000. Women with an educational attainment of graduate degree earn the most with the average annual earnings of $143,750, while those with high school diploma education have the smallest earnings of $18,750.
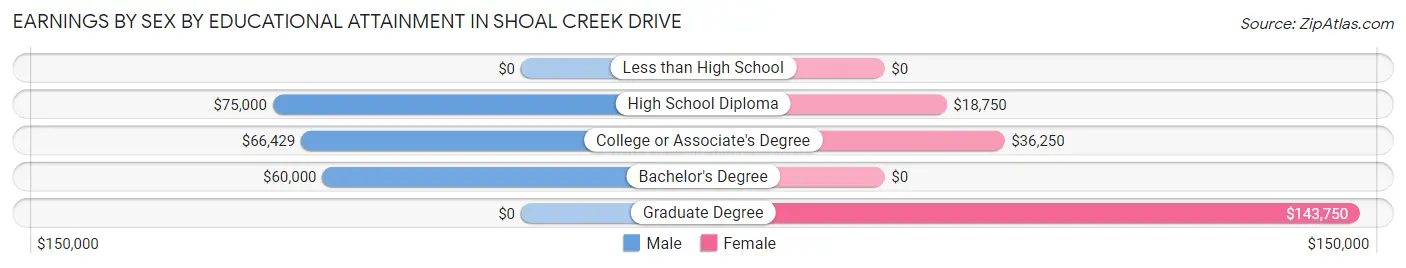
| Educational Attainment | Male Income | Female Income |
| Less than High School | - | - |
| High School Diploma | $75,000 | $18,750 |
| College or Associate's Degree | $66,429 | $36,250 |
| Bachelor's Degree | $60,000 | $0 |
| Graduate Degree | - | - |
| Total | $48,333 | $36,190 |
Family Income in Shoal Creek Drive
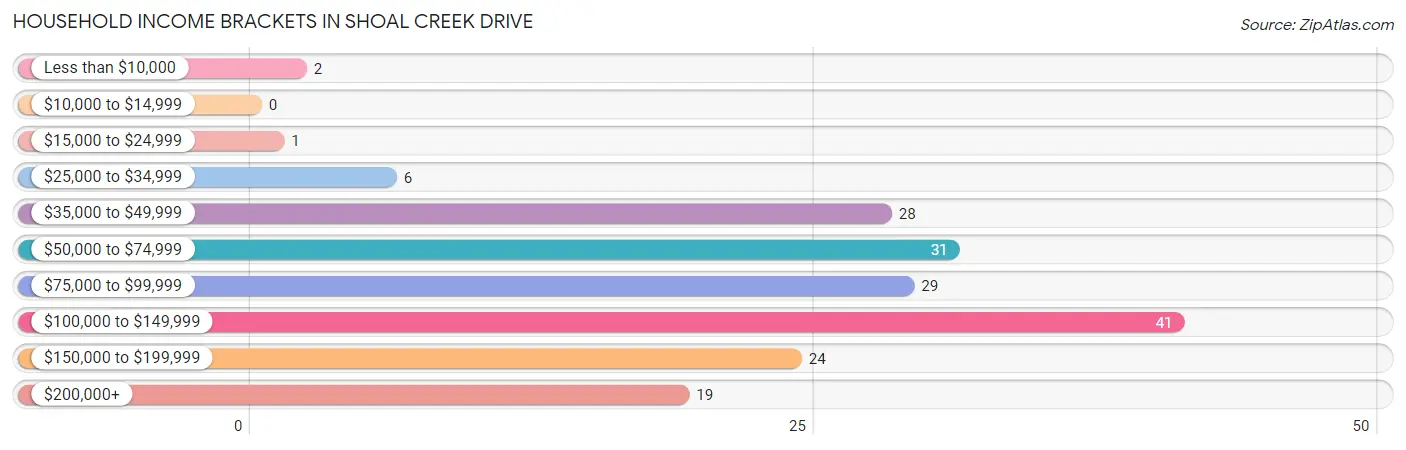
Family Income Brackets in Shoal Creek Drive
According to the Shoal Creek Drive family income data, there are 31 families falling into the $100,000 to $149,999 income range, which is the most common income bracket and makes up 21.1% of all families. Conversely, the less than $10,000 income bracket is the least frequent group with only 2 families (1.4%) belonging to this category.
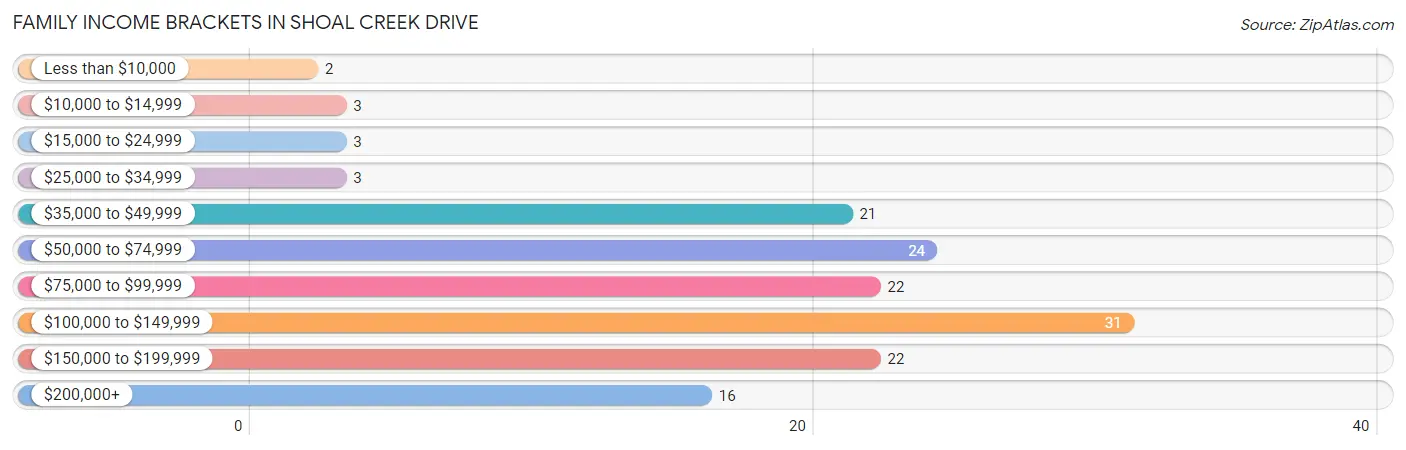
| Income Bracket | # Families | % Families |
| Less than $10,000 | 2 | 1.4% |
| $10,000 to $14,999 | 3 | 2.0% |
| $15,000 to $24,999 | 3 | 2.0% |
| $25,000 to $34,999 | 3 | 2.0% |
| $35,000 to $49,999 | 21 | 14.3% |
| $50,000 to $74,999 | 24 | 16.3% |
| $75,000 to $99,999 | 22 | 15.0% |
| $100,000 to $149,999 | 31 | 21.1% |
| $150,000 to $199,999 | 22 | 15.0% |
| $200,000+ | 16 | 10.9% |
Family Income by Famaliy Size in Shoal Creek Drive
4-person families (43 | 29.2%) account for the highest median family income in Shoal Creek Drive with $98,125 per family, while 4-person families (43 | 29.2%) have the highest median income of $24,531 per family member.
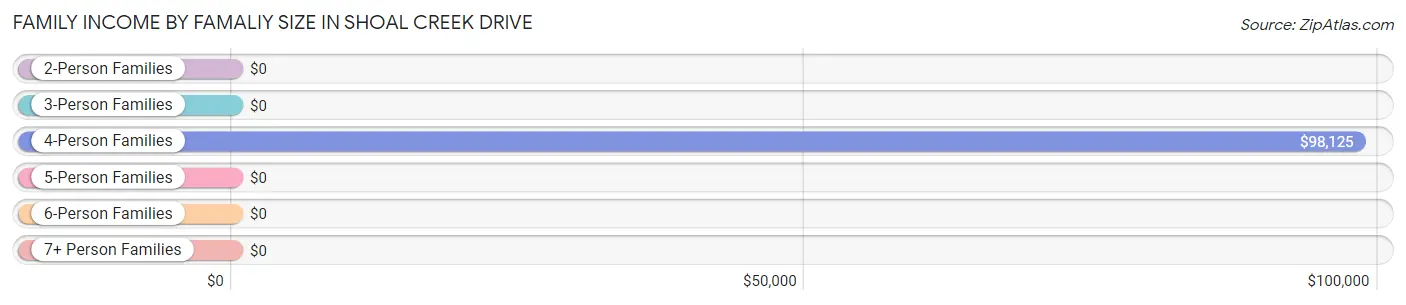
| Income Bracket | # Families | Median Income |
| 2-Person Families | 36 (24.5%) | $0 |
| 3-Person Families | 19 (12.9%) | $0 |
| 4-Person Families | 43 (29.2%) | $98,125 |
| 5-Person Families | 8 (5.4%) | $0 |
| 6-Person Families | 23 (15.7%) | $0 |
| 7+ Person Families | 18 (12.2%) | $0 |
| Total | 147 (100.0%) | $98,125 |
Family Income by Number of Earners in Shoal Creek Drive
The median family income in Shoal Creek Drive is $98,125, with families comprising 3+ earners (53) having the highest median family income of $163,047, while families with no earners (22) have the lowest median family income of $44,286, accounting for 36.0% and 15.0% of families, respectively.
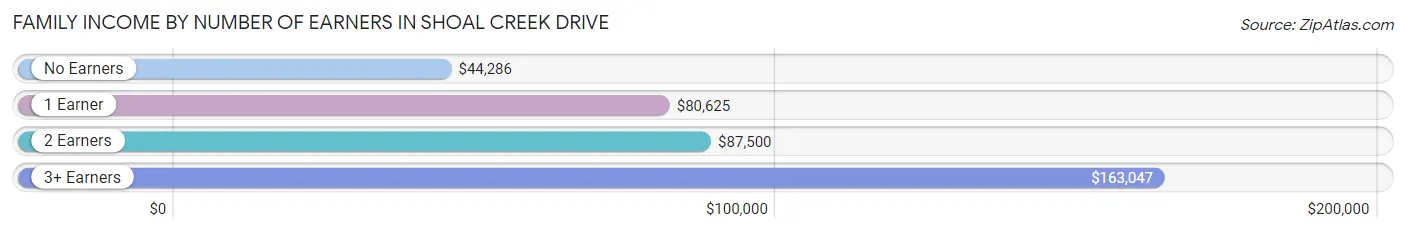
| Number of Earners | # Families | Median Income |
| No Earners | 22 (15.0%) | $44,286 |
| 1 Earner | 30 (20.4%) | $80,625 |
| 2 Earners | 42 (28.6%) | $87,500 |
| 3+ Earners | 53 (36.0%) | $163,047 |
| Total | 147 (100.0%) | $98,125 |
Household Income in Shoal Creek Drive
Household Income Brackets in Shoal Creek Drive
With 41 households falling in the category, the $100,000 to $149,999 income range is the most frequent in Shoal Creek Drive, accounting for 22.7% of all households.
| Income Bracket | # Households | % Households |
| Less than $10,000 | 2 | 1.1% |
| $10,000 to $14,999 | 0 | 0.0% |
| $15,000 to $24,999 | 1 | 0.6% |
| $25,000 to $34,999 | 6 | 3.3% |
| $35,000 to $49,999 | 28 | 15.5% |
| $50,000 to $74,999 | 31 | 17.1% |
| $75,000 to $99,999 | 29 | 16.0% |
| $100,000 to $149,999 | 41 | 22.7% |
| $150,000 to $199,999 | 24 | 13.3% |
| $200,000+ | 19 | 10.5% |
Household Income by Householder Age in Shoal Creek Drive
The median household income in Shoal Creek Drive is $96,875, with the highest median household income of $110,197 found in the 25 to 44 years age bracket for the primary householder. A total of 79 households (43.6%) fall into this category. Meanwhile, the 15 to 24 years age bracket for the primary householder has the lowest median household income of $0, with 2 households (1.1%) in this group.
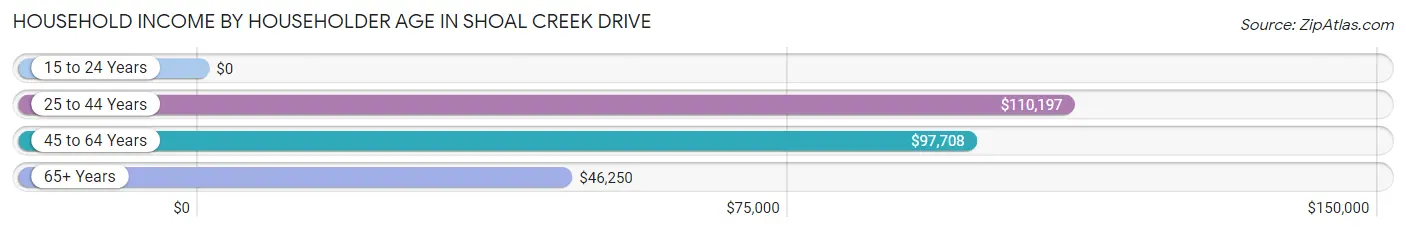
| Income Bracket | # Households | Median Income |
| 15 to 24 Years | 2 (1.1%) | $0 |
| 25 to 44 Years | 79 (43.6%) | $110,197 |
| 45 to 64 Years | 69 (38.1%) | $97,708 |
| 65+ Years | 31 (17.1%) | $46,250 |
| Total | 181 (100.0%) | $96,875 |
Poverty in Shoal Creek Drive
Income Below Poverty by Sex and Age in Shoal Creek Drive
With 4.2% poverty level for males and 4.5% for females among the residents of Shoal Creek Drive, 6 to 11 year old males and under 5 year old females are the most vulnerable to poverty, with 8 males (32.0%) and 4 females (15.4%) in their respective age groups living below the poverty level.
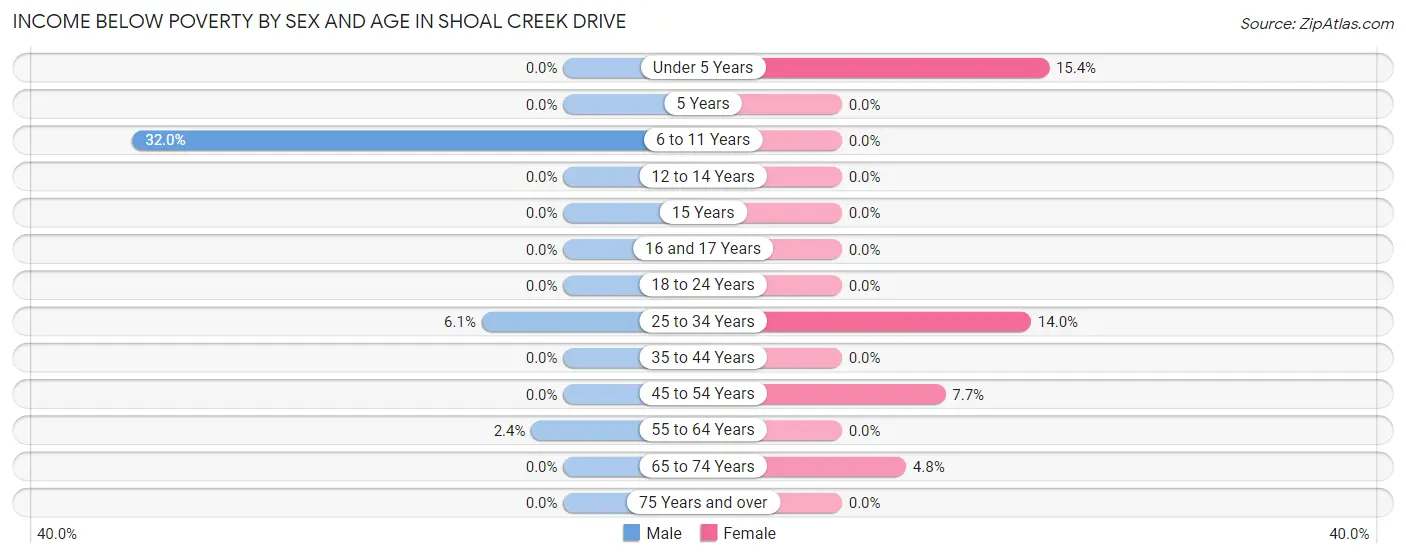
| Age Bracket | Male | Female |
| Under 5 Years | 0 (0.0%) | 4 (15.4%) |
| 5 Years | 0 (0.0%) | 0 (0.0%) |
| 6 to 11 Years | 8 (32.0%) | 0 (0.0%) |
| 12 to 14 Years | 0 (0.0%) | 0 (0.0%) |
| 15 Years | 0 (0.0%) | 0 (0.0%) |
| 16 and 17 Years | 0 (0.0%) | 0 (0.0%) |
| 18 to 24 Years | 0 (0.0%) | 0 (0.0%) |
| 25 to 34 Years | 2 (6.1%) | 8 (14.0%) |
| 35 to 44 Years | 0 (0.0%) | 0 (0.0%) |
| 45 to 54 Years | 0 (0.0%) | 2 (7.7%) |
| 55 to 64 Years | 1 (2.4%) | 0 (0.0%) |
| 65 to 74 Years | 0 (0.0%) | 1 (4.8%) |
| 75 Years and over | 0 (0.0%) | 0 (0.0%) |
| Total | 11 (4.2%) | 15 (4.5%) |
Income Above Poverty by Sex and Age in Shoal Creek Drive
According to the poverty statistics in Shoal Creek Drive, males aged under 5 years and females aged 6 to 11 years are the age groups that are most secure financially, with 100.0% of males and 100.0% of females in these age groups living above the poverty line.
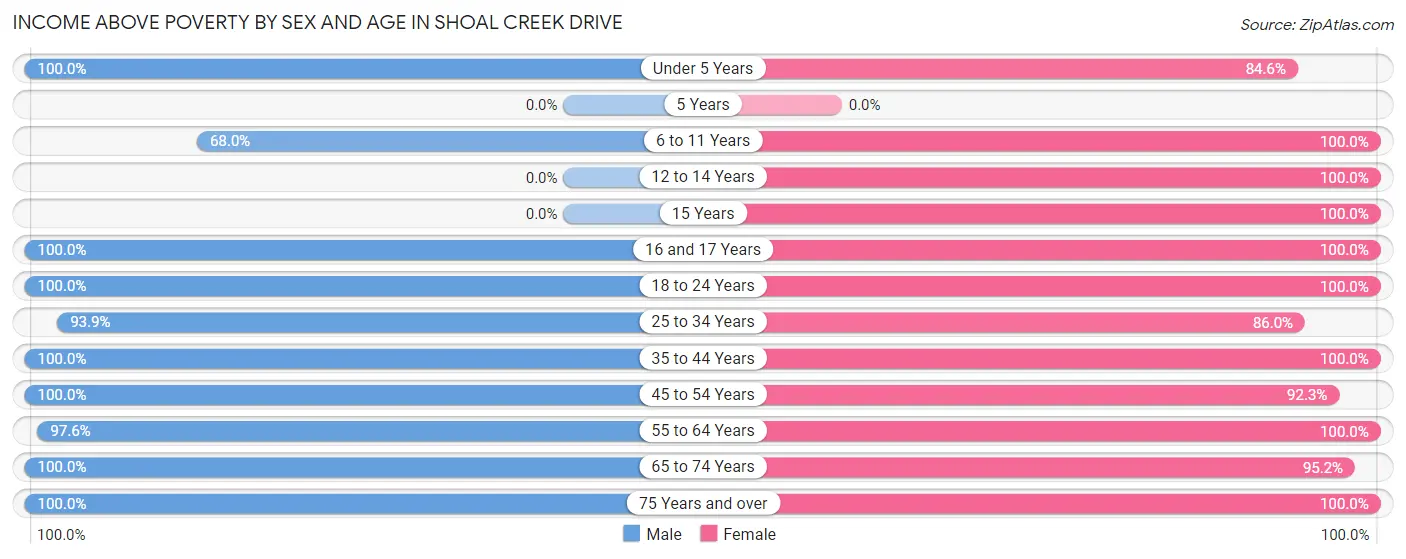
| Age Bracket | Male | Female |
| Under 5 Years | 27 (100.0%) | 22 (84.6%) |
| 5 Years | 0 (0.0%) | 0 (0.0%) |
| 6 to 11 Years | 17 (68.0%) | 69 (100.0%) |
| 12 to 14 Years | 0 (0.0%) | 6 (100.0%) |
| 15 Years | 0 (0.0%) | 8 (100.0%) |
| 16 and 17 Years | 6 (100.0%) | 7 (100.0%) |
| 18 to 24 Years | 37 (100.0%) | 44 (100.0%) |
| 25 to 34 Years | 31 (93.9%) | 49 (86.0%) |
| 35 to 44 Years | 46 (100.0%) | 30 (100.0%) |
| 45 to 54 Years | 24 (100.0%) | 24 (92.3%) |
| 55 to 64 Years | 41 (97.6%) | 28 (100.0%) |
| 65 to 74 Years | 14 (100.0%) | 20 (95.2%) |
| 75 Years and over | 10 (100.0%) | 12 (100.0%) |
| Total | 253 (95.8%) | 319 (95.5%) |
Income Below Poverty Among Married-Couple Families in Shoal Creek Drive
The poverty statistics for married-couple families in Shoal Creek Drive show that 3.3% or 4 of the total 120 families live below the poverty line. Families with 1 or 2 children have the highest poverty rate of 6.2%, comprising of 2 families. On the other hand, families with 3 or 4 children have the lowest poverty rate of 0.0%, which includes 0 families.
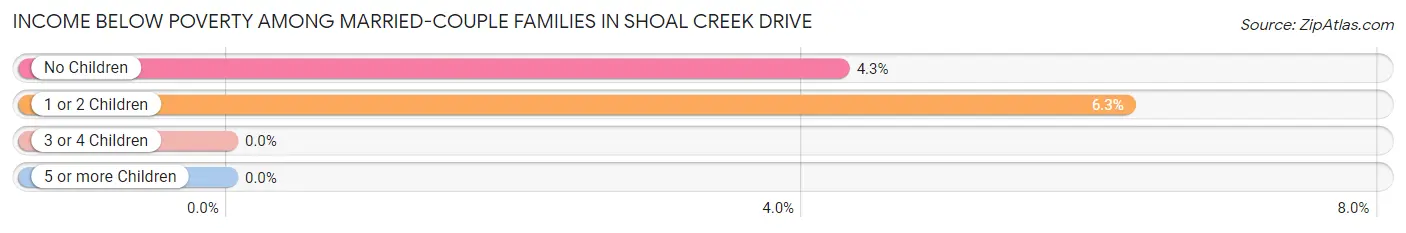
| Children | Above Poverty | Below Poverty |
| No Children | 45 (95.7%) | 2 (4.3%) |
| 1 or 2 Children | 30 (93.8%) | 2 (6.2%) |
| 3 or 4 Children | 39 (100.0%) | 0 (0.0%) |
| 5 or more Children | 2 (100.0%) | 0 (0.0%) |
| Total | 116 (96.7%) | 4 (3.3%) |
Income Below Poverty Among Single-Parent Households in Shoal Creek Drive
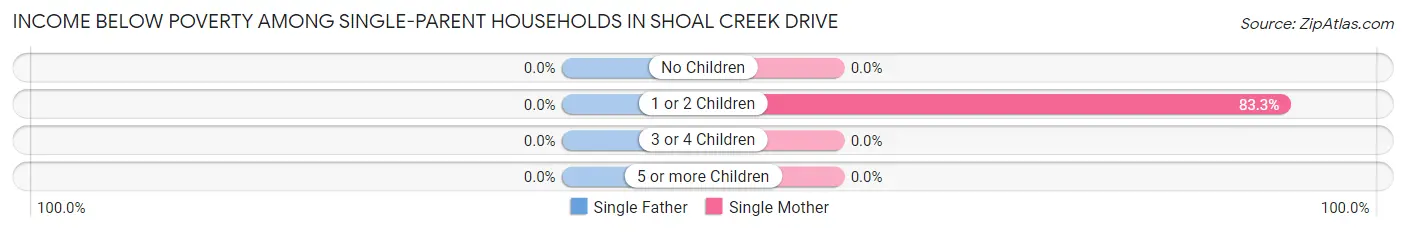
| Children | Single Father | Single Mother |
| No Children | 0 (0.0%) | 0 (0.0%) |
| 1 or 2 Children | 0 (0.0%) | 5 (83.3%) |
| 3 or 4 Children | 0 (0.0%) | 0 (0.0%) |
| 5 or more Children | 0 (0.0%) | 0 (0.0%) |
| Total | 0 (0.0%) | 5 (26.3%) |
Income Below Poverty Among Married-Couple vs Single-Parent Households in Shoal Creek Drive
The poverty data for Shoal Creek Drive shows that 4 of the married-couple family households (3.3%) and 5 of the single-parent households (18.5%) are living below the poverty level. Within the married-couple family households, those with 1 or 2 children have the highest poverty rate, with 2 households (6.2%) falling below the poverty line. Among the single-parent households, those with 1 or 2 children have the highest poverty rate, with 5 household (41.7%) living below poverty.
| Children | Married-Couple Families | Single-Parent Households |
| No Children | 2 (4.3%) | 0 (0.0%) |
| 1 or 2 Children | 2 (6.2%) | 5 (41.7%) |
| 3 or 4 Children | 0 (0.0%) | 0 (0.0%) |
| 5 or more Children | 0 (0.0%) | 0 (0.0%) |
| Total | 4 (3.3%) | 5 (18.5%) |
Employment Characteristics in Shoal Creek Drive
Employment by Class of Employer in Shoal Creek Drive
Among the 279 employed individuals in Shoal Creek Drive, private company employees (194 | 69.5%), not-for-profit organizations (39 | 14.0%), and self-employed (not incorporated) (30 | 10.7%) make up the most common classes of employment.
| Employer Class | # Employees | % Employees |
| Private Company Employees | 194 | 69.5% |
| Self-Employed (Incorporated) | 11 | 3.9% |
| Self-Employed (Not Incorporated) | 30 | 10.7% |
| Not-for-profit Organizations | 39 | 14.0% |
| Local Government Employees | 2 | 0.7% |
| State Government Employees | 2 | 0.7% |
| Federal Government Employees | 1 | 0.4% |
| Unpaid Family Workers | 0 | 0.0% |
| Total | 279 | 100.0% |
Employment Status by Age in Shoal Creek Drive
According to the labor force statistics for Shoal Creek Drive, out of the total population over 16 years of age (437), 65.7% or 287 individuals are in the labor force, with 2.4% or 7 of them unemployed. The age group with the highest labor force participation rate is 35 to 44 years, with 94.7% or 72 individuals in the labor force. Within the labor force, the 16 to 19 years age range has the highest percentage of unemployed individuals, with 36.4% or 4 of them being unemployed.
| Age Bracket | In Labor Force | Unemployed |
| 16 to 19 Years | 11 (33.3%) | 4 (36.4%) |
| 20 to 24 Years | 45 (73.8%) | 2 (4.4%) |
| 25 to 29 Years | 57 (79.2%) | 0 (0.0%) |
| 30 to 34 Years | 12 (66.7%) | 0 (0.0%) |
| 35 to 44 Years | 72 (94.7%) | 0 (0.0%) |
| 45 to 54 Years | 39 (78.0%) | 0 (0.0%) |
| 55 to 59 Years | 27 (65.9%) | 0 (0.0%) |
| 60 to 64 Years | 17 (58.6%) | 1 (5.9%) |
| 65 to 74 Years | 4 (11.4%) | 0 (0.0%) |
| 75 Years and over | 3 (13.6%) | 0 (0.0%) |
| Total | 287 (65.7%) | 7 (2.4%) |
Employment Status by Educational Attainment in Shoal Creek Drive
According to labor force statistics for Shoal Creek Drive, 78.3% of individuals (224) out of the total population between 25 and 64 years of age (286) are in the labor force, with 0.4% or 1 of them being unemployed. The group with the highest labor force participation rate are those with the educational attainment of college / associate degree, with 90.5% or 105 individuals in the labor force. Within the labor force, individuals with bachelor's degree or higher education have the highest percentage of unemployment, with 1.8% or 1 of them being unemployed.
| Educational Attainment | In Labor Force | Unemployed |
| Less than High School | 32 (78.0%) | 0 (0.0%) |
| High School Diploma | 31 (47.7%) | 0 (0.0%) |
| College / Associate Degree | 105 (90.5%) | 0 (0.0%) |
| Bachelor's Degree or higher | 56 (87.5%) | 1 (1.8%) |
| Total | 224 (78.3%) | 1 (0.4%) |
Employment Occupations by Sex in Shoal Creek Drive
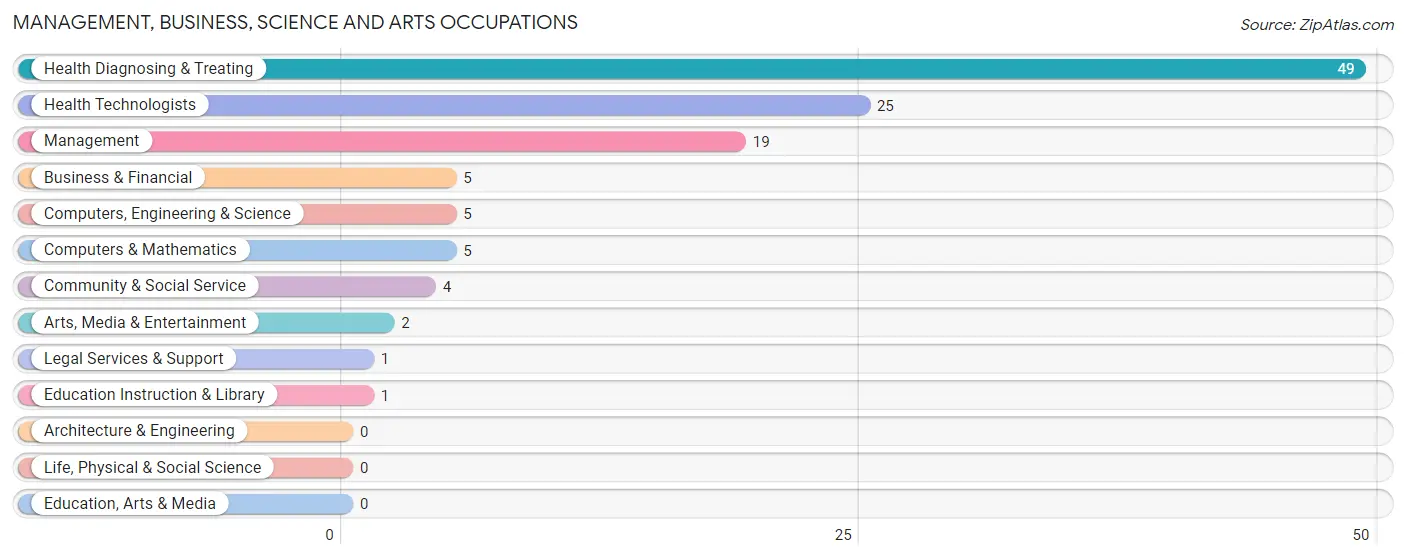
Management, Business, Science and Arts Occupations
The most common Management, Business, Science and Arts occupations in Shoal Creek Drive are Health Diagnosing & Treating (49 | 17.5%), Health Technologists (25 | 8.9%), Management (19 | 6.8%), Business & Financial (5 | 1.8%), and Computers, Engineering & Science (5 | 1.8%).
Management, Business, Science and Arts Occupations by Sex
Within the Management, Business, Science and Arts occupations in Shoal Creek Drive, the most male-oriented occupations are Legal Services & Support (100.0%), Arts, Media & Entertainment (100.0%), and Community & Social Service (75.0%), while the most female-oriented occupations are Education Instruction & Library (100.0%), Health Diagnosing & Treating (89.8%), and Health Technologists (88.0%).
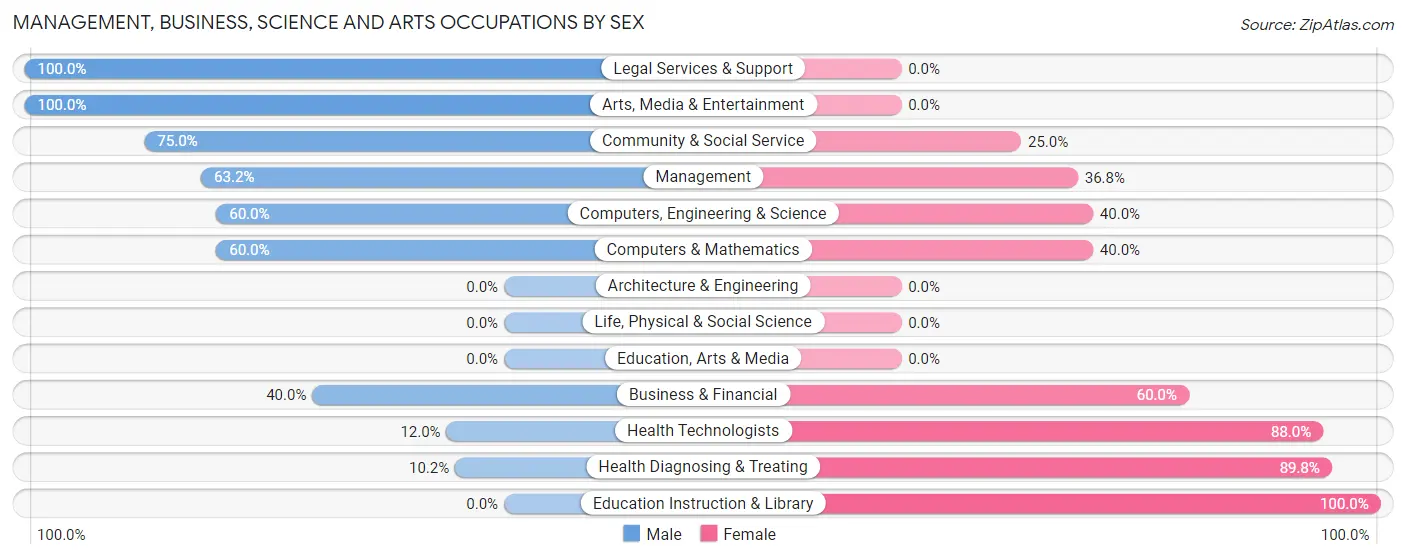
| Occupation | Male | Female |
| Management | 12 (63.2%) | 7 (36.8%) |
| Business & Financial | 2 (40.0%) | 3 (60.0%) |
| Computers, Engineering & Science | 3 (60.0%) | 2 (40.0%) |
| Computers & Mathematics | 3 (60.0%) | 2 (40.0%) |
| Architecture & Engineering | 0 (0.0%) | 0 (0.0%) |
| Life, Physical & Social Science | 0 (0.0%) | 0 (0.0%) |
| Community & Social Service | 3 (75.0%) | 1 (25.0%) |
| Education, Arts & Media | 0 (0.0%) | 0 (0.0%) |
| Legal Services & Support | 1 (100.0%) | 0 (0.0%) |
| Education Instruction & Library | 0 (0.0%) | 1 (100.0%) |
| Arts, Media & Entertainment | 2 (100.0%) | 0 (0.0%) |
| Health Diagnosing & Treating | 5 (10.2%) | 44 (89.8%) |
| Health Technologists | 3 (12.0%) | 22 (88.0%) |
| Total (Category) | 25 (30.5%) | 57 (69.5%) |
| Total (Overall) | 142 (50.7%) | 138 (49.3%) |
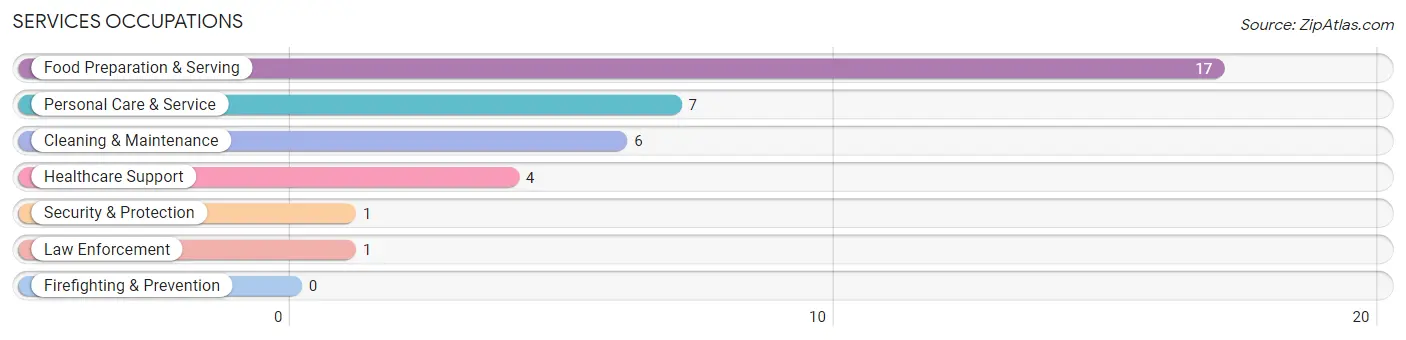
Services Occupations
The most common Services occupations in Shoal Creek Drive are Food Preparation & Serving (17 | 6.1%), Personal Care & Service (7 | 2.5%), Cleaning & Maintenance (6 | 2.1%), Healthcare Support (4 | 1.4%), and Security & Protection (1 | 0.4%).
Services Occupations by Sex
Within the Services occupations in Shoal Creek Drive, the most male-oriented occupations are Security & Protection (100.0%), Law Enforcement (100.0%), and Cleaning & Maintenance (50.0%), while the most female-oriented occupations are Healthcare Support (100.0%), Personal Care & Service (100.0%), and Food Preparation & Serving (64.7%).
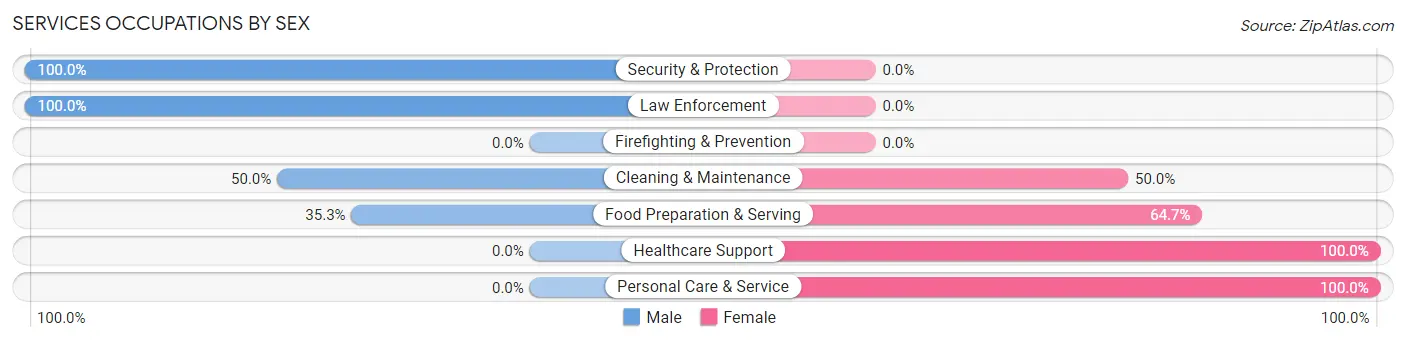
| Occupation | Male | Female |
| Healthcare Support | 0 (0.0%) | 4 (100.0%) |
| Security & Protection | 1 (100.0%) | 0 (0.0%) |
| Firefighting & Prevention | 0 (0.0%) | 0 (0.0%) |
| Law Enforcement | 1 (100.0%) | 0 (0.0%) |
| Food Preparation & Serving | 6 (35.3%) | 11 (64.7%) |
| Cleaning & Maintenance | 3 (50.0%) | 3 (50.0%) |
| Personal Care & Service | 0 (0.0%) | 7 (100.0%) |
| Total (Category) | 10 (28.6%) | 25 (71.4%) |
| Total (Overall) | 142 (50.7%) | 138 (49.3%) |
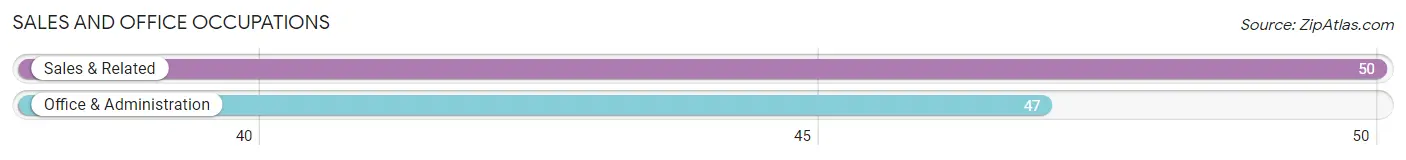
Sales and Office Occupations
The most common Sales and Office occupations in Shoal Creek Drive are Sales & Related (50 | 17.9%), and Office & Administration (47 | 16.8%).
Sales and Office Occupations by Sex
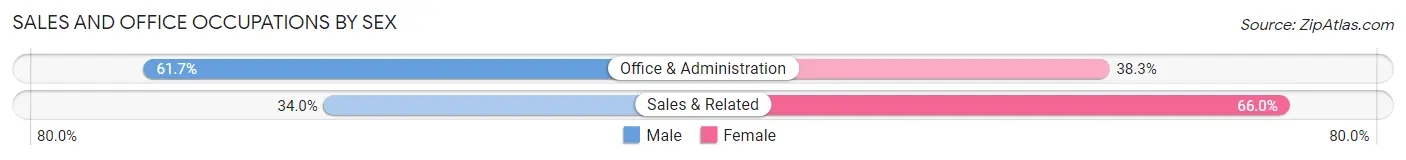
| Occupation | Male | Female |
| Sales & Related | 17 (34.0%) | 33 (66.0%) |
| Office & Administration | 29 (61.7%) | 18 (38.3%) |
| Total (Category) | 46 (47.4%) | 51 (52.6%) |
| Total (Overall) | 142 (50.7%) | 138 (49.3%) |
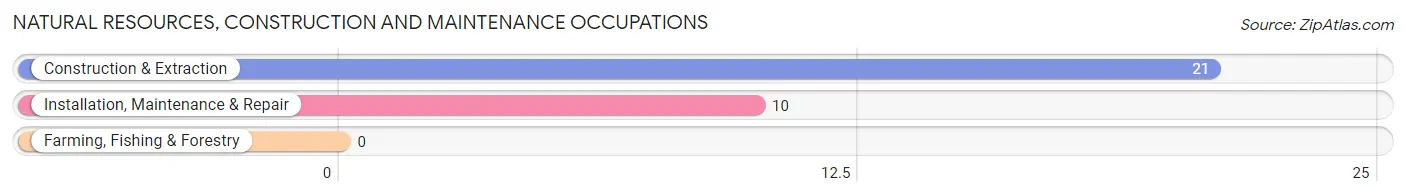
Natural Resources, Construction and Maintenance Occupations
The most common Natural Resources, Construction and Maintenance occupations in Shoal Creek Drive are Construction & Extraction (21 | 7.5%), and Installation, Maintenance & Repair (10 | 3.6%).
Natural Resources, Construction and Maintenance Occupations by Sex
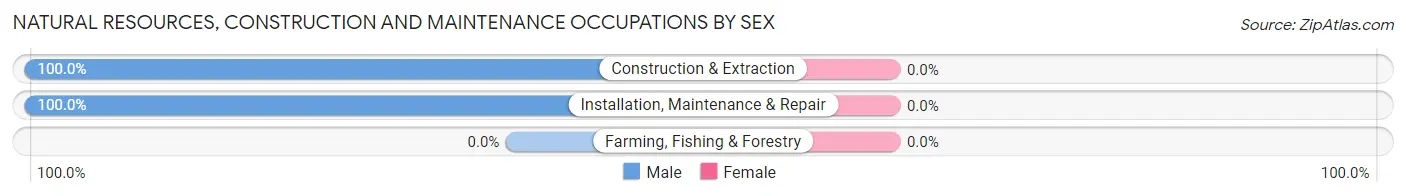
| Occupation | Male | Female |
| Farming, Fishing & Forestry | 0 (0.0%) | 0 (0.0%) |
| Construction & Extraction | 21 (100.0%) | 0 (0.0%) |
| Installation, Maintenance & Repair | 10 (100.0%) | 0 (0.0%) |
| Total (Category) | 31 (100.0%) | 0 (0.0%) |
| Total (Overall) | 142 (50.7%) | 138 (49.3%) |
Production, Transportation and Moving Occupations
The most common Production, Transportation and Moving occupations in Shoal Creek Drive are Production (27 | 9.6%), Material Moving (6 | 2.1%), and Transportation (2 | 0.7%).
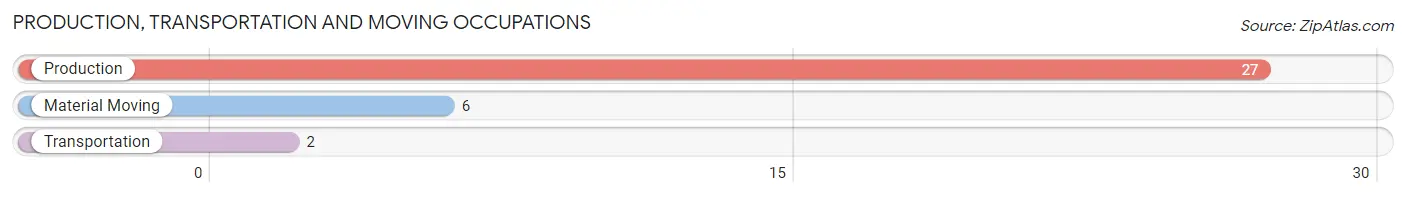
Production, Transportation and Moving Occupations by Sex
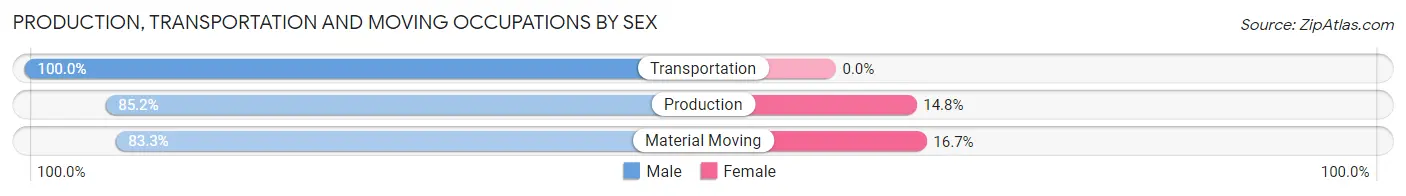
| Occupation | Male | Female |
| Production | 23 (85.2%) | 4 (14.8%) |
| Transportation | 2 (100.0%) | 0 (0.0%) |
| Material Moving | 5 (83.3%) | 1 (16.7%) |
| Total (Category) | 30 (85.7%) | 5 (14.3%) |
| Total (Overall) | 142 (50.7%) | 138 (49.3%) |
Employment Industries by Sex in Shoal Creek Drive
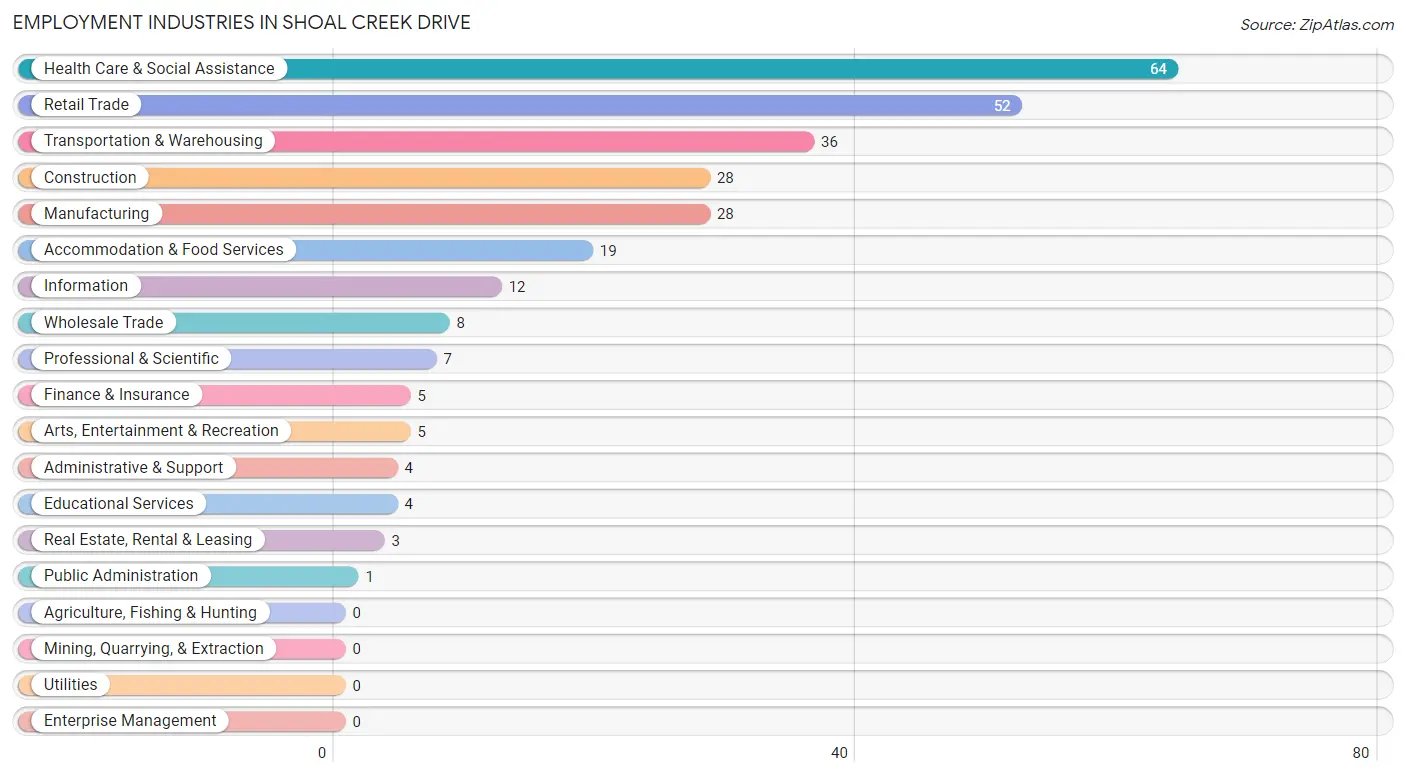
Employment Industries in Shoal Creek Drive
The major employment industries in Shoal Creek Drive include Health Care & Social Assistance (64 | 22.9%), Retail Trade (52 | 18.6%), Transportation & Warehousing (36 | 12.9%), Construction (28 | 10.0%), and Manufacturing (28 | 10.0%).
Employment Industries by Sex in Shoal Creek Drive
The Shoal Creek Drive industries that see more men than women are Construction (100.0%), Information (100.0%), and Administrative & Support (100.0%), whereas the industries that tend to have a higher number of women are Finance & Insurance (100.0%), Educational Services (100.0%), and Health Care & Social Assistance (92.2%).
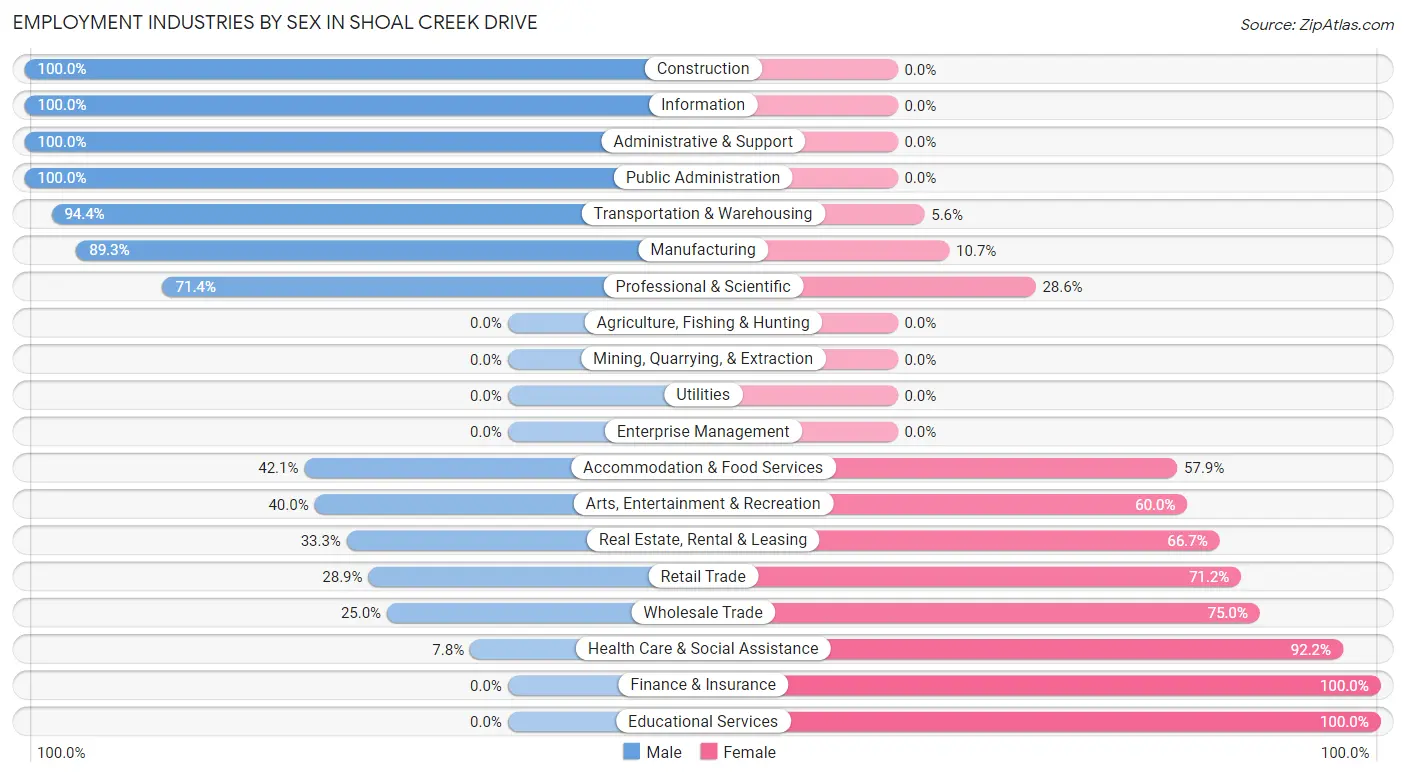
| Industry | Male | Female |
| Agriculture, Fishing & Hunting | 0 (0.0%) | 0 (0.0%) |
| Mining, Quarrying, & Extraction | 0 (0.0%) | 0 (0.0%) |
| Construction | 28 (100.0%) | 0 (0.0%) |
| Manufacturing | 25 (89.3%) | 3 (10.7%) |
| Wholesale Trade | 2 (25.0%) | 6 (75.0%) |
| Retail Trade | 15 (28.8%) | 37 (71.2%) |
| Transportation & Warehousing | 34 (94.4%) | 2 (5.6%) |
| Utilities | 0 (0.0%) | 0 (0.0%) |
| Information | 12 (100.0%) | 0 (0.0%) |
| Finance & Insurance | 0 (0.0%) | 5 (100.0%) |
| Real Estate, Rental & Leasing | 1 (33.3%) | 2 (66.7%) |
| Professional & Scientific | 5 (71.4%) | 2 (28.6%) |
| Enterprise Management | 0 (0.0%) | 0 (0.0%) |
| Administrative & Support | 4 (100.0%) | 0 (0.0%) |
| Educational Services | 0 (0.0%) | 4 (100.0%) |
| Health Care & Social Assistance | 5 (7.8%) | 59 (92.2%) |
| Arts, Entertainment & Recreation | 2 (40.0%) | 3 (60.0%) |
| Accommodation & Food Services | 8 (42.1%) | 11 (57.9%) |
| Public Administration | 1 (100.0%) | 0 (0.0%) |
| Total | 142 (50.7%) | 138 (49.3%) |
Education in Shoal Creek Drive
School Enrollment in Shoal Creek Drive
The most common levels of schooling among the 160 students in Shoal Creek Drive are elementary school (56 | 35.0%), middle school (37 | 23.1%), and high school (23 | 14.4%).
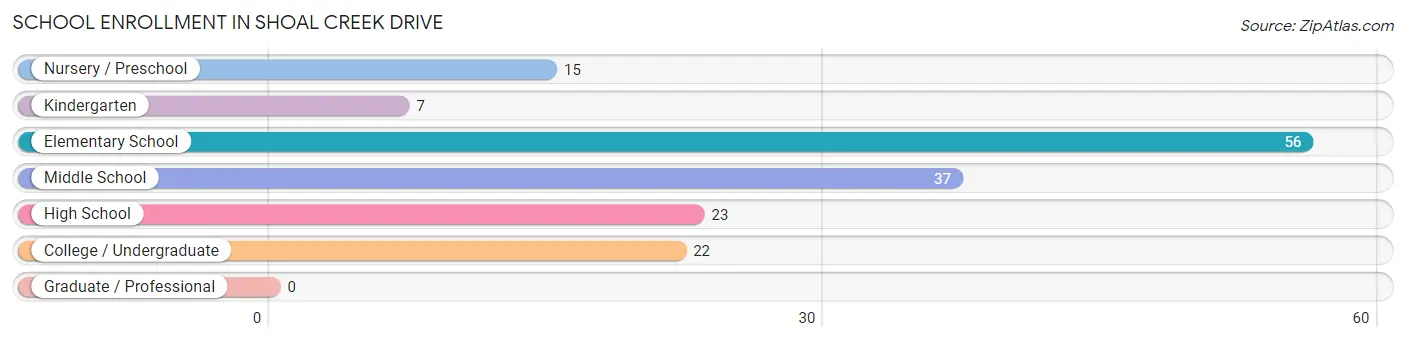
| School Level | # Students | % Students |
| Nursery / Preschool | 15 | 9.4% |
| Kindergarten | 7 | 4.4% |
| Elementary School | 56 | 35.0% |
| Middle School | 37 | 23.1% |
| High School | 23 | 14.4% |
| College / Undergraduate | 22 | 13.8% |
| Graduate / Professional | 0 | 0.0% |
| Total | 160 | 100.0% |
School Enrollment by Age by Funding Source in Shoal Creek Drive
Out of a total of 160 students who are enrolled in schools in Shoal Creek Drive, 10 (6.3%) attend a private institution, while the remaining 150 (93.7%) are enrolled in public schools. The age group of 20 to 24 year olds has the highest likelihood of being enrolled in private schools, with 4 (28.6% in the age bracket) enrolled. Conversely, the age group of 15 to 17 year olds has the lowest likelihood of being enrolled in a private school, with 21 (100.0% in the age bracket) attending a public institution.
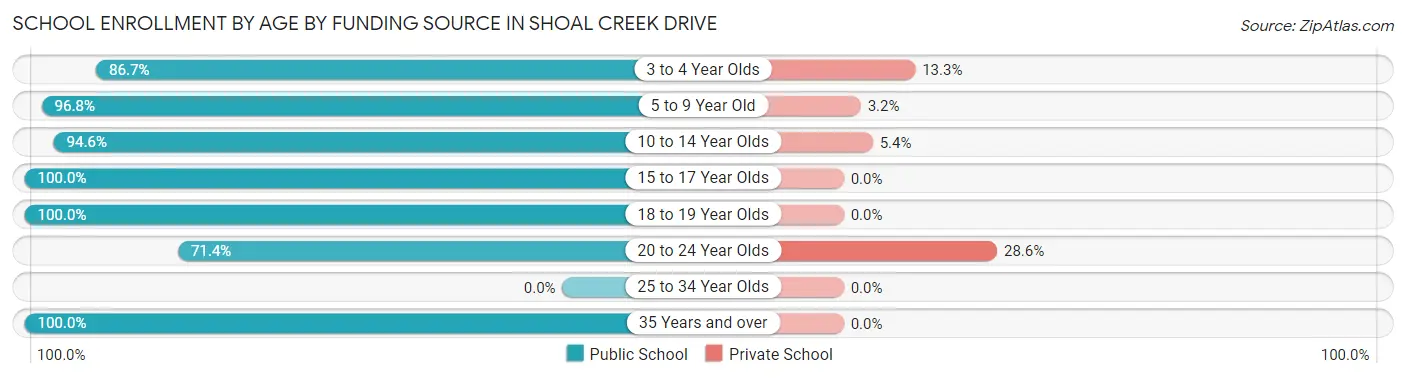
| Age Bracket | Public School | Private School |
| 3 to 4 Year Olds | 13 (86.7%) | 2 (13.3%) |
| 5 to 9 Year Old | 61 (96.8%) | 2 (3.2%) |
| 10 to 14 Year Olds | 35 (94.6%) | 2 (5.4%) |
| 15 to 17 Year Olds | 21 (100.0%) | 0 (0.0%) |
| 18 to 19 Year Olds | 2 (100.0%) | 0 (0.0%) |
| 20 to 24 Year Olds | 10 (71.4%) | 4 (28.6%) |
| 25 to 34 Year Olds | 0 (0.0%) | 0 (0.0%) |
| 35 Years and over | 8 (100.0%) | 0 (0.0%) |
| Total | 150 (93.8%) | 10 (6.3%) |
Educational Attainment by Field of Study in Shoal Creek Drive
Science & technology (17 | 21.5%), liberal arts & history (17 | 21.5%), business (15 | 19.0%), social sciences (9 | 11.4%), and bio, nature & agricultural (4 | 5.1%) are the most common fields of study among 79 individuals in Shoal Creek Drive who have obtained a bachelor's degree or higher.
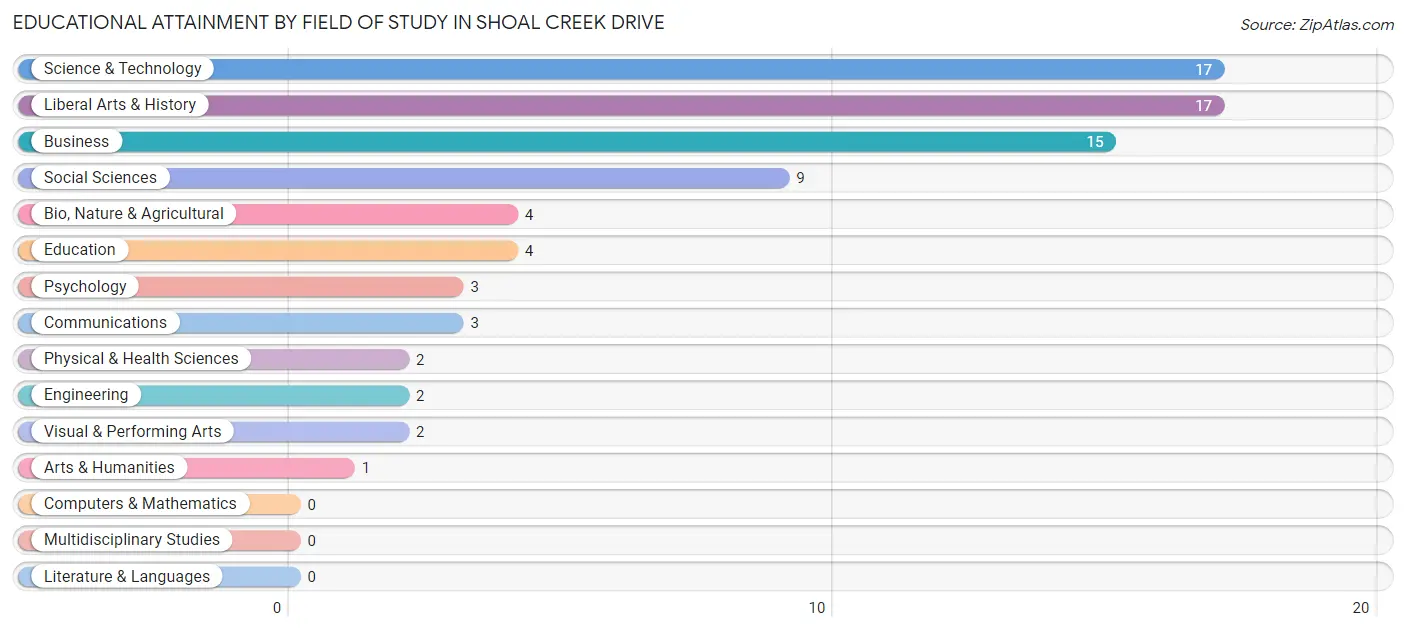
| Field of Study | # Graduates | % Graduates |
| Computers & Mathematics | 0 | 0.0% |
| Bio, Nature & Agricultural | 4 | 5.1% |
| Physical & Health Sciences | 2 | 2.5% |
| Psychology | 3 | 3.8% |
| Social Sciences | 9 | 11.4% |
| Engineering | 2 | 2.5% |
| Multidisciplinary Studies | 0 | 0.0% |
| Science & Technology | 17 | 21.5% |
| Business | 15 | 19.0% |
| Education | 4 | 5.1% |
| Literature & Languages | 0 | 0.0% |
| Liberal Arts & History | 17 | 21.5% |
| Visual & Performing Arts | 2 | 2.5% |
| Communications | 3 | 3.8% |
| Arts & Humanities | 1 | 1.3% |
| Total | 79 | 100.0% |
Transportation & Commute in Shoal Creek Drive
Vehicle Availability by Sex in Shoal Creek Drive
The most prevalent vehicle ownership categories in Shoal Creek Drive are males with 2 vehicles (69, accounting for 48.9%) and females with 2 vehicles (77, making up 50.0%).
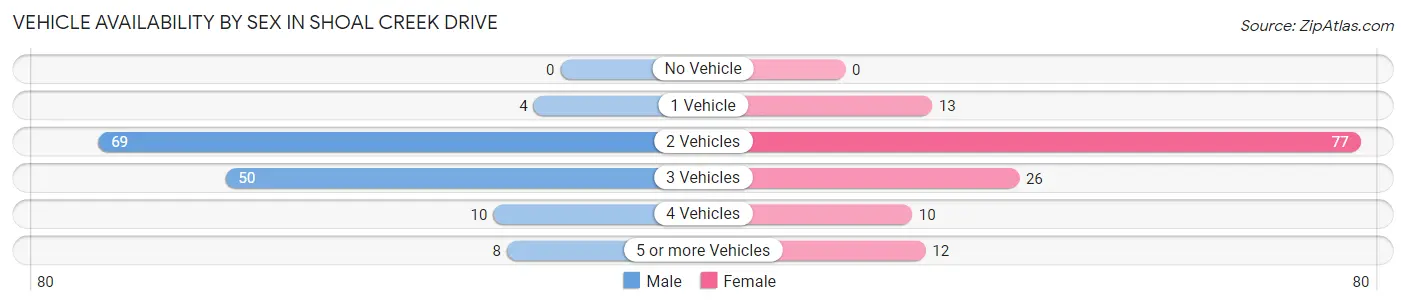
| Vehicles Available | Male | Female |
| No Vehicle | 0 (0.0%) | 0 (0.0%) |
| 1 Vehicle | 4 (2.8%) | 13 (9.4%) |
| 2 Vehicles | 69 (48.9%) | 77 (55.8%) |
| 3 Vehicles | 50 (35.5%) | 26 (18.8%) |
| 4 Vehicles | 10 (7.1%) | 10 (7.2%) |
| 5 or more Vehicles | 8 (5.7%) | 12 (8.7%) |
| Total | 141 (100.0%) | 138 (100.0%) |
Commute Time in Shoal Creek Drive
The most frequently occuring commute durations in Shoal Creek Drive are 10 to 14 minutes (88 commuters, 32.4%), 15 to 19 minutes (54 commuters, 19.9%), and 20 to 24 minutes (45 commuters, 16.5%).
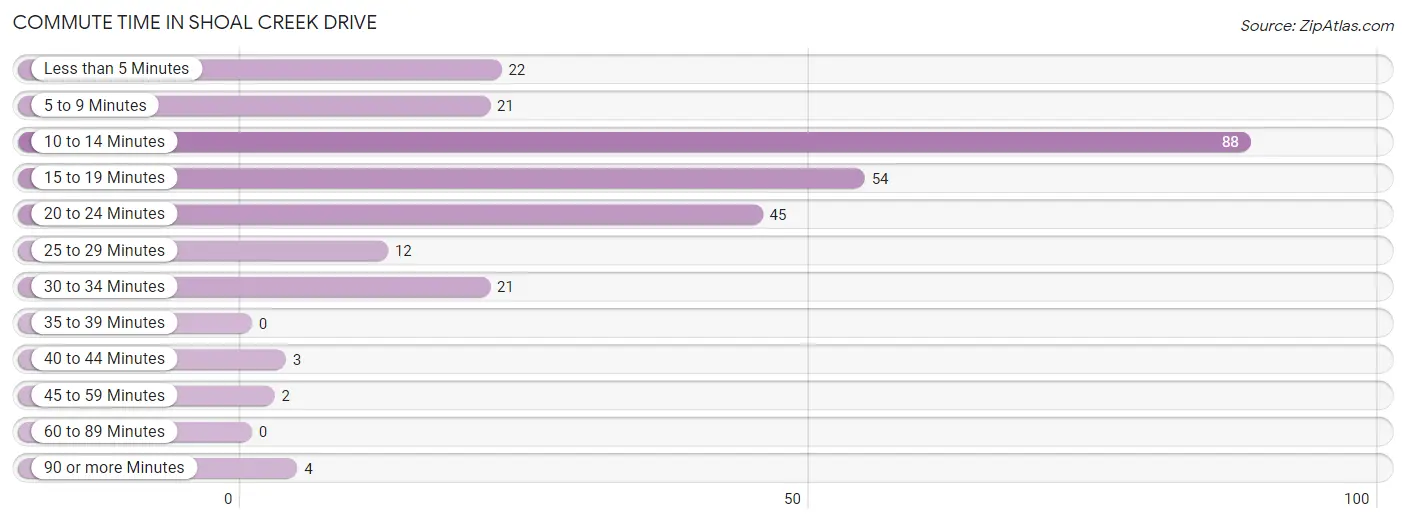
| Commute Time | # Commuters | % Commuters |
| Less than 5 Minutes | 22 | 8.1% |
| 5 to 9 Minutes | 21 | 7.7% |
| 10 to 14 Minutes | 88 | 32.4% |
| 15 to 19 Minutes | 54 | 19.9% |
| 20 to 24 Minutes | 45 | 16.5% |
| 25 to 29 Minutes | 12 | 4.4% |
| 30 to 34 Minutes | 21 | 7.7% |
| 35 to 39 Minutes | 0 | 0.0% |
| 40 to 44 Minutes | 3 | 1.1% |
| 45 to 59 Minutes | 2 | 0.7% |
| 60 to 89 Minutes | 0 | 0.0% |
| 90 or more Minutes | 4 | 1.5% |
Commute Time by Sex in Shoal Creek Drive
The most common commute times in Shoal Creek Drive are 10 to 14 minutes (48 commuters, 34.8%) for males and 10 to 14 minutes (40 commuters, 29.8%) for females.
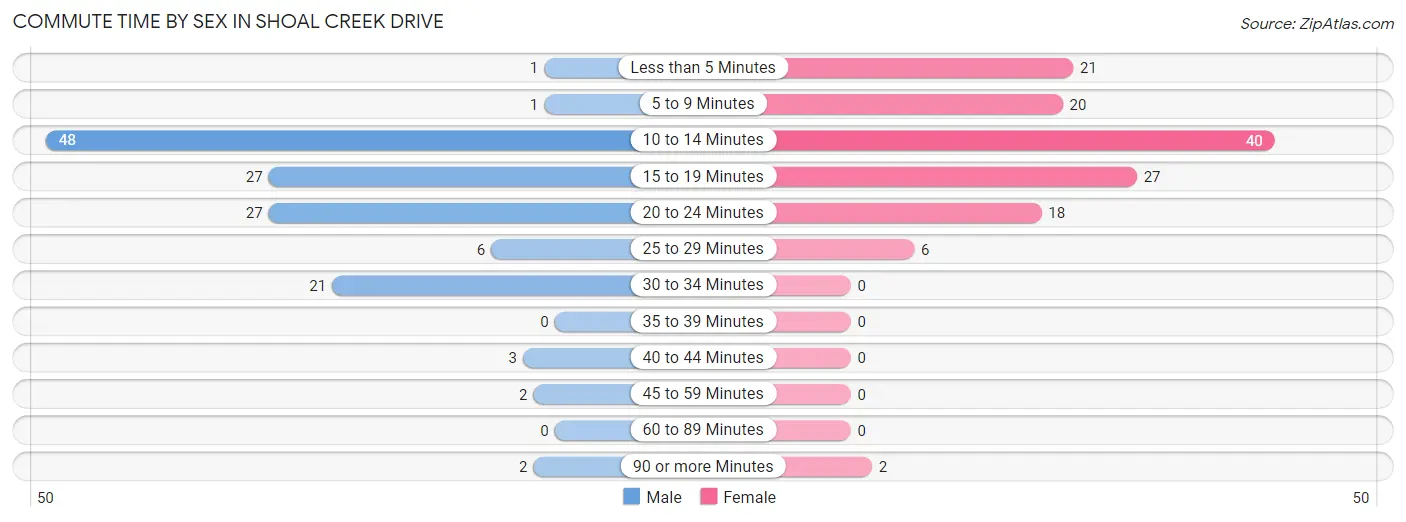
| Commute Time | Male | Female |
| Less than 5 Minutes | 1 (0.7%) | 21 (15.7%) |
| 5 to 9 Minutes | 1 (0.7%) | 20 (14.9%) |
| 10 to 14 Minutes | 48 (34.8%) | 40 (29.8%) |
| 15 to 19 Minutes | 27 (19.6%) | 27 (20.2%) |
| 20 to 24 Minutes | 27 (19.6%) | 18 (13.4%) |
| 25 to 29 Minutes | 6 (4.3%) | 6 (4.5%) |
| 30 to 34 Minutes | 21 (15.2%) | 0 (0.0%) |
| 35 to 39 Minutes | 0 (0.0%) | 0 (0.0%) |
| 40 to 44 Minutes | 3 (2.2%) | 0 (0.0%) |
| 45 to 59 Minutes | 2 (1.5%) | 0 (0.0%) |
| 60 to 89 Minutes | 0 (0.0%) | 0 (0.0%) |
| 90 or more Minutes | 2 (1.5%) | 2 (1.5%) |
Time of Departure to Work by Sex in Shoal Creek Drive
The most frequent times of departure to work in Shoal Creek Drive are 8:00 AM to 8:29 AM (31, 22.5%) for males and 4:00 PM to 11:59 PM (34, 25.4%) for females.
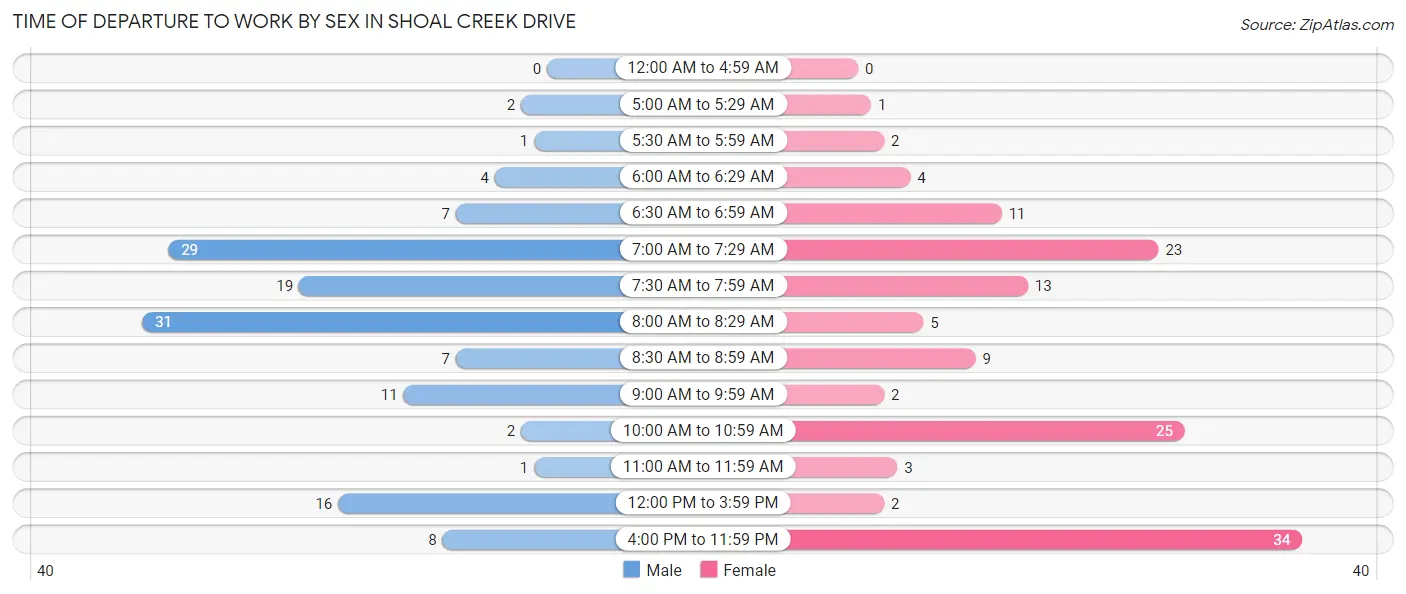
| Time of Departure | Male | Female |
| 12:00 AM to 4:59 AM | 0 (0.0%) | 0 (0.0%) |
| 5:00 AM to 5:29 AM | 2 (1.5%) | 1 (0.7%) |
| 5:30 AM to 5:59 AM | 1 (0.7%) | 2 (1.5%) |
| 6:00 AM to 6:29 AM | 4 (2.9%) | 4 (3.0%) |
| 6:30 AM to 6:59 AM | 7 (5.1%) | 11 (8.2%) |
| 7:00 AM to 7:29 AM | 29 (21.0%) | 23 (17.2%) |
| 7:30 AM to 7:59 AM | 19 (13.8%) | 13 (9.7%) |
| 8:00 AM to 8:29 AM | 31 (22.5%) | 5 (3.7%) |
| 8:30 AM to 8:59 AM | 7 (5.1%) | 9 (6.7%) |
| 9:00 AM to 9:59 AM | 11 (8.0%) | 2 (1.5%) |
| 10:00 AM to 10:59 AM | 2 (1.5%) | 25 (18.7%) |
| 11:00 AM to 11:59 AM | 1 (0.7%) | 3 (2.2%) |
| 12:00 PM to 3:59 PM | 16 (11.6%) | 2 (1.5%) |
| 4:00 PM to 11:59 PM | 8 (5.8%) | 34 (25.4%) |
| Total | 138 (100.0%) | 134 (100.0%) |
Housing Occupancy in Shoal Creek Drive
Occupancy by Ownership in Shoal Creek Drive
Of the total 181 dwellings in Shoal Creek Drive, owner-occupied units account for 155 (85.6%), while renter-occupied units make up 26 (14.4%).
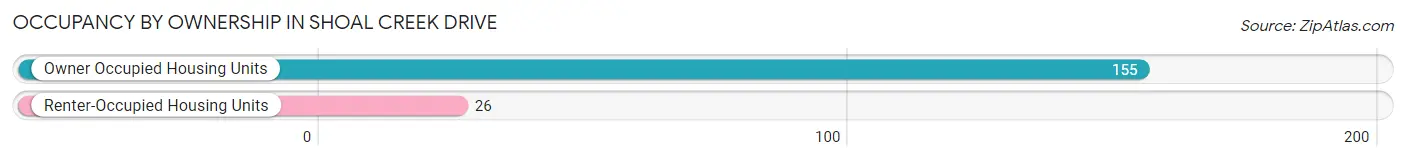
| Occupancy | # Housing Units | % Housing Units |
| Owner Occupied Housing Units | 155 | 85.6% |
| Renter-Occupied Housing Units | 26 | 14.4% |
| Total Occupied Housing Units | 181 | 100.0% |
Occupancy by Household Size in Shoal Creek Drive
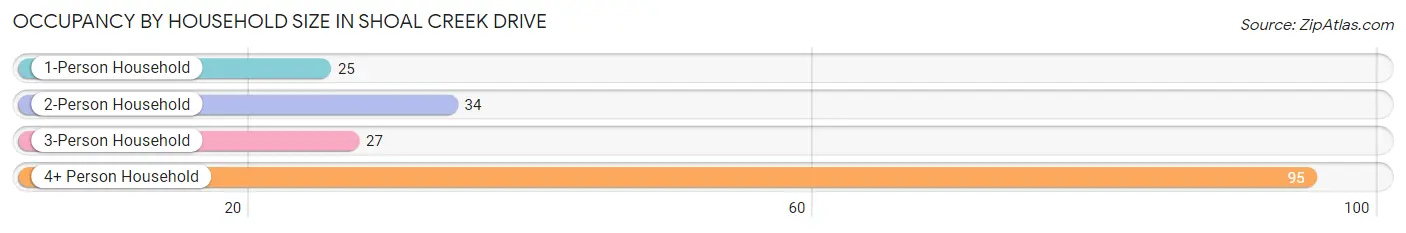
| Household Size | # Housing Units | % Housing Units |
| 1-Person Household | 25 | 13.8% |
| 2-Person Household | 34 | 18.8% |
| 3-Person Household | 27 | 14.9% |
| 4+ Person Household | 95 | 52.5% |
| Total Housing Units | 181 | 100.0% |
Occupancy by Ownership by Household Size in Shoal Creek Drive
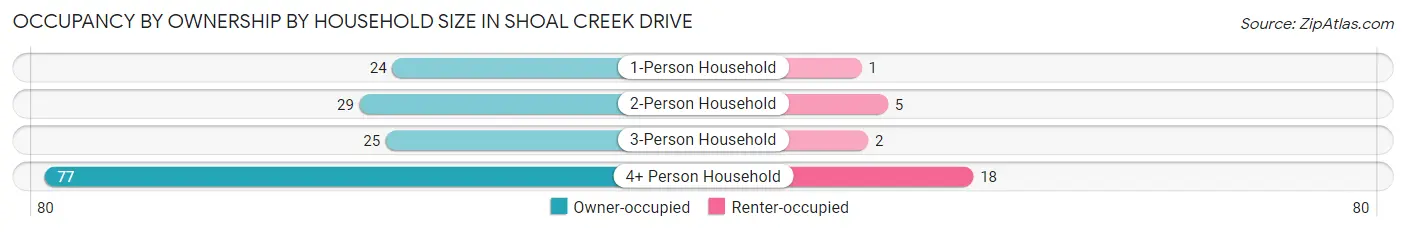
| Household Size | Owner-occupied | Renter-occupied |
| 1-Person Household | 24 (96.0%) | 1 (4.0%) |
| 2-Person Household | 29 (85.3%) | 5 (14.7%) |
| 3-Person Household | 25 (92.6%) | 2 (7.4%) |
| 4+ Person Household | 77 (81.0%) | 18 (19.0%) |
| Total Housing Units | 155 (85.6%) | 26 (14.4%) |
Occupancy by Educational Attainment in Shoal Creek Drive
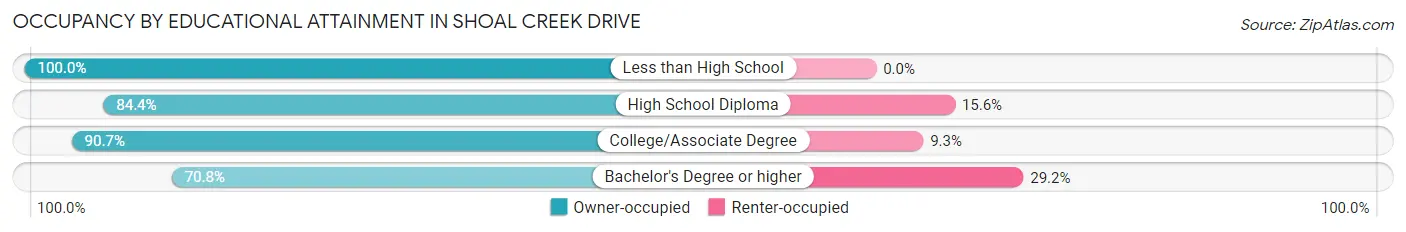
| Household Size | Owner-occupied | Renter-occupied |
| Less than High School | 26 (100.0%) | 0 (0.0%) |
| High School Diploma | 27 (84.4%) | 5 (15.6%) |
| College/Associate Degree | 68 (90.7%) | 7 (9.3%) |
| Bachelor's Degree or higher | 34 (70.8%) | 14 (29.2%) |
Occupancy by Age of Householder in Shoal Creek Drive
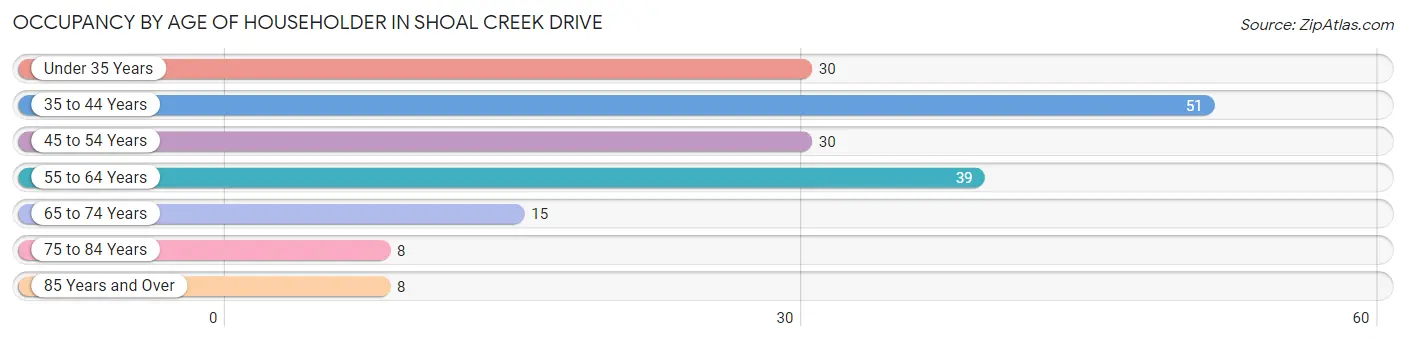
| Age Bracket | # Households | % Households |
| Under 35 Years | 30 | 16.6% |
| 35 to 44 Years | 51 | 28.2% |
| 45 to 54 Years | 30 | 16.6% |
| 55 to 64 Years | 39 | 21.5% |
| 65 to 74 Years | 15 | 8.3% |
| 75 to 84 Years | 8 | 4.4% |
| 85 Years and Over | 8 | 4.4% |
| Total | 181 | 100.0% |
Housing Finances in Shoal Creek Drive
Median Income by Occupancy in Shoal Creek Drive
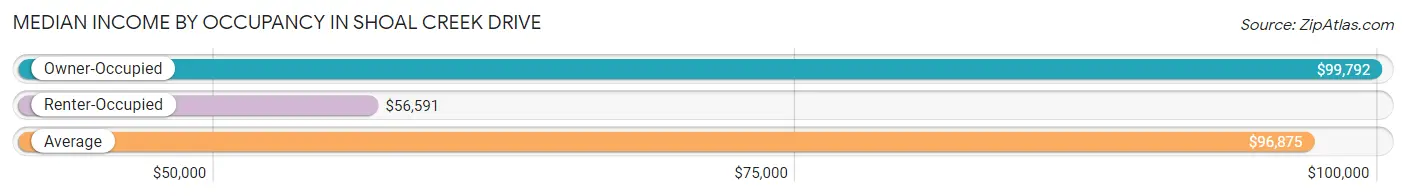
| Occupancy Type | # Households | Median Income |
| Owner-Occupied | 155 (85.6%) | $99,792 |
| Renter-Occupied | 26 (14.4%) | $56,591 |
| Average | 181 (100.0%) | $96,875 |
Occupancy by Householder Income Bracket in Shoal Creek Drive
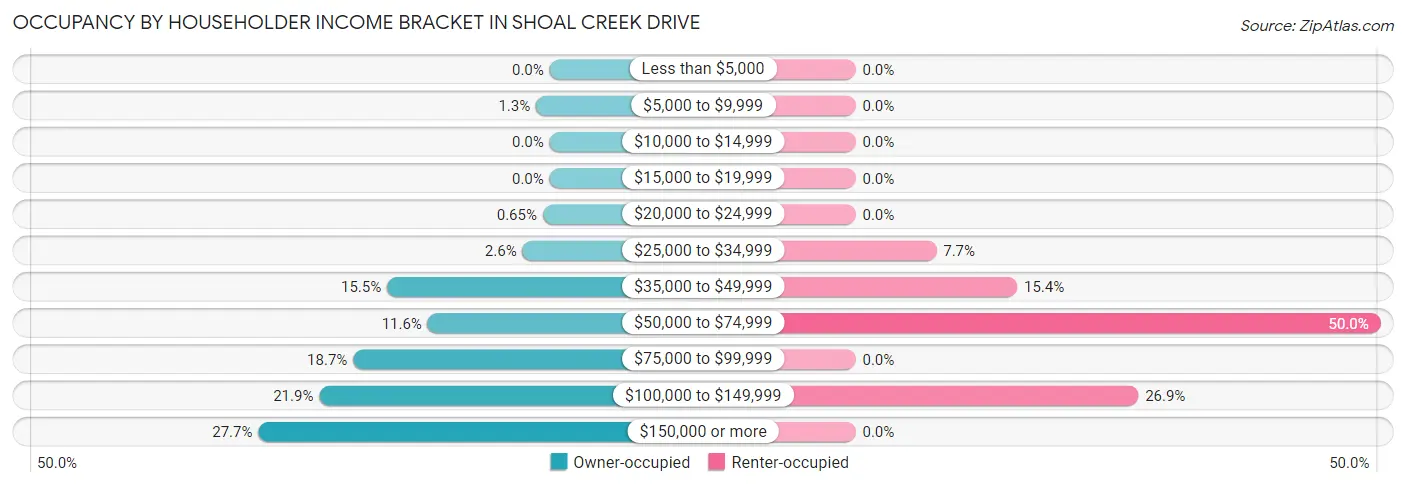
| Income Bracket | Owner-occupied | Renter-occupied |
| Less than $5,000 | 0 (0.0%) | 0 (0.0%) |
| $5,000 to $9,999 | 2 (1.3%) | 0 (0.0%) |
| $10,000 to $14,999 | 0 (0.0%) | 0 (0.0%) |
| $15,000 to $19,999 | 0 (0.0%) | 0 (0.0%) |
| $20,000 to $24,999 | 1 (0.6%) | 0 (0.0%) |
| $25,000 to $34,999 | 4 (2.6%) | 2 (7.7%) |
| $35,000 to $49,999 | 24 (15.5%) | 4 (15.4%) |
| $50,000 to $74,999 | 18 (11.6%) | 13 (50.0%) |
| $75,000 to $99,999 | 29 (18.7%) | 0 (0.0%) |
| $100,000 to $149,999 | 34 (21.9%) | 7 (26.9%) |
| $150,000 or more | 43 (27.7%) | 0 (0.0%) |
| Total | 155 (100.0%) | 26 (100.0%) |
Monthly Housing Cost Tiers in Shoal Creek Drive
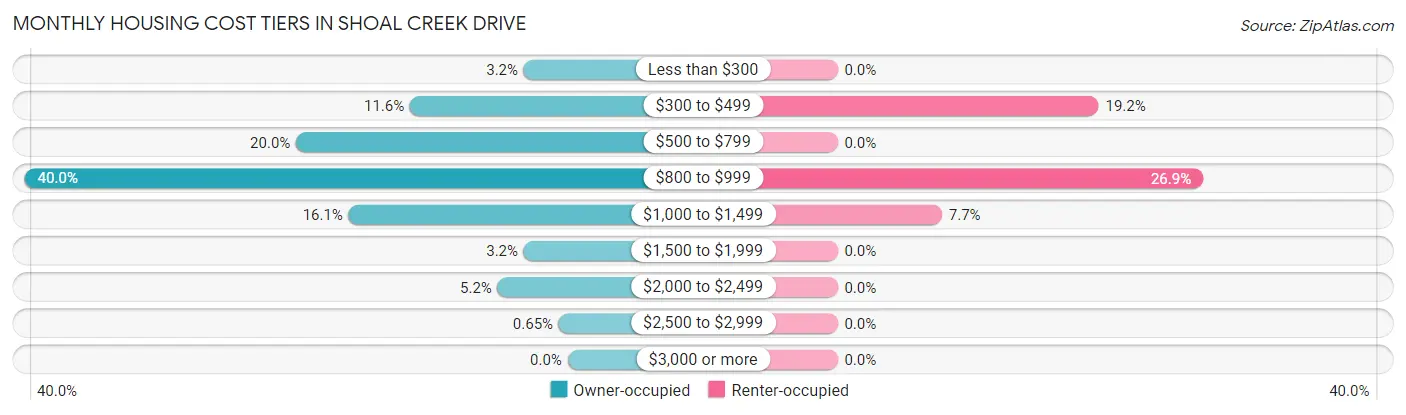
| Monthly Cost | Owner-occupied | Renter-occupied |
| Less than $300 | 5 (3.2%) | 0 (0.0%) |
| $300 to $499 | 18 (11.6%) | 5 (19.2%) |
| $500 to $799 | 31 (20.0%) | 0 (0.0%) |
| $800 to $999 | 62 (40.0%) | 7 (26.9%) |
| $1,000 to $1,499 | 25 (16.1%) | 2 (7.7%) |
| $1,500 to $1,999 | 5 (3.2%) | 0 (0.0%) |
| $2,000 to $2,499 | 8 (5.2%) | 0 (0.0%) |
| $2,500 to $2,999 | 1 (0.6%) | 0 (0.0%) |
| $3,000 or more | 0 (0.0%) | 0 (0.0%) |
| Total | 155 (100.0%) | 26 (100.0%) |
Physical Housing Characteristics in Shoal Creek Drive
Housing Structures in Shoal Creek Drive
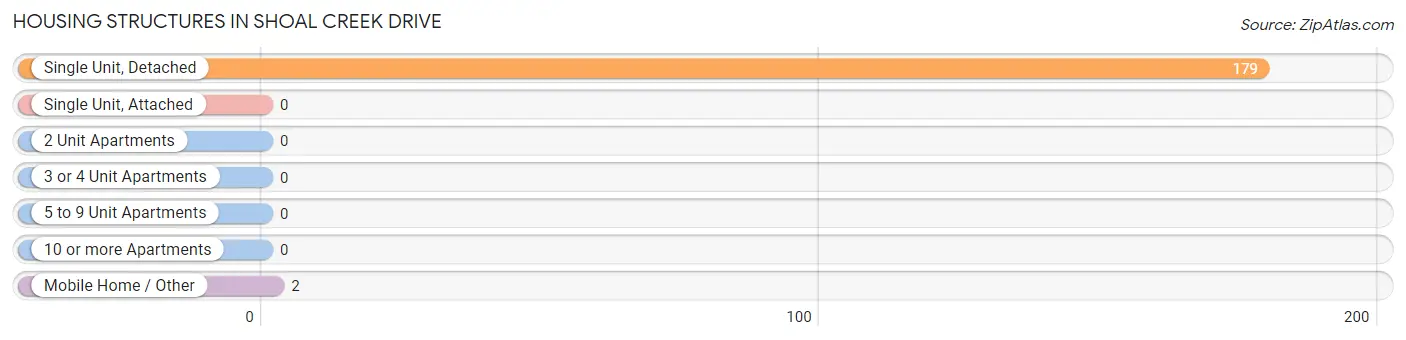
| Structure Type | # Housing Units | % Housing Units |
| Single Unit, Detached | 179 | 98.9% |
| Single Unit, Attached | 0 | 0.0% |
| 2 Unit Apartments | 0 | 0.0% |
| 3 or 4 Unit Apartments | 0 | 0.0% |
| 5 to 9 Unit Apartments | 0 | 0.0% |
| 10 or more Apartments | 0 | 0.0% |
| Mobile Home / Other | 2 | 1.1% |
| Total | 181 | 100.0% |
Housing Structures by Occupancy in Shoal Creek Drive
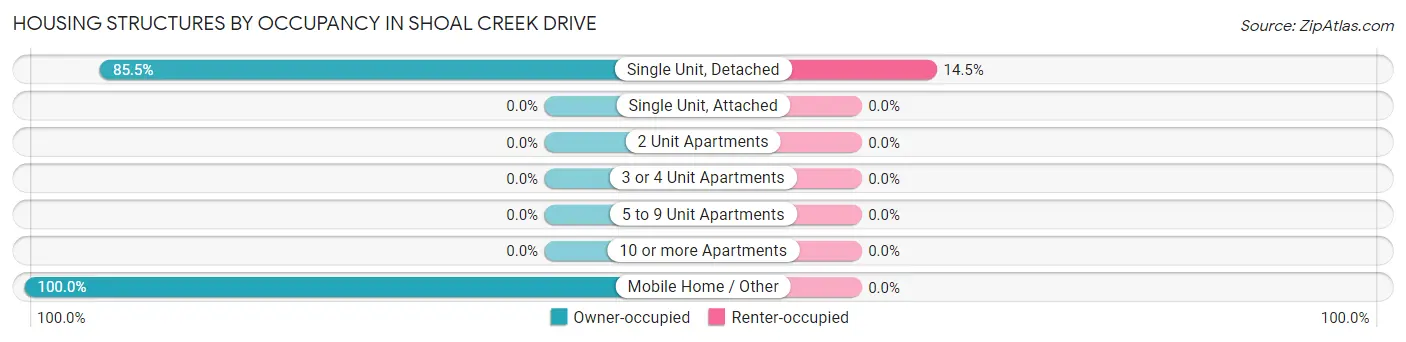
| Structure Type | Owner-occupied | Renter-occupied |
| Single Unit, Detached | 153 (85.5%) | 26 (14.5%) |
| Single Unit, Attached | 0 (0.0%) | 0 (0.0%) |
| 2 Unit Apartments | 0 (0.0%) | 0 (0.0%) |
| 3 or 4 Unit Apartments | 0 (0.0%) | 0 (0.0%) |
| 5 to 9 Unit Apartments | 0 (0.0%) | 0 (0.0%) |
| 10 or more Apartments | 0 (0.0%) | 0 (0.0%) |
| Mobile Home / Other | 2 (100.0%) | 0 (0.0%) |
| Total | 155 (85.6%) | 26 (14.4%) |
Housing Structures by Number of Rooms in Shoal Creek Drive
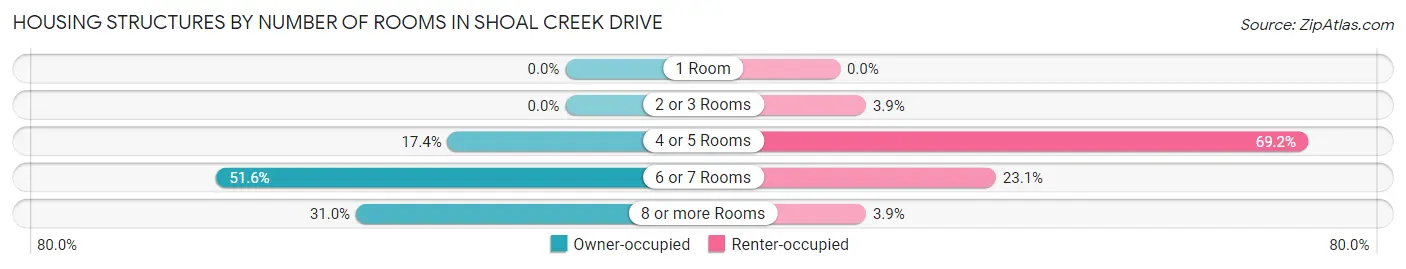
| Number of Rooms | Owner-occupied | Renter-occupied |
| 1 Room | 0 (0.0%) | 0 (0.0%) |
| 2 or 3 Rooms | 0 (0.0%) | 1 (3.8%) |
| 4 or 5 Rooms | 27 (17.4%) | 18 (69.2%) |
| 6 or 7 Rooms | 80 (51.6%) | 6 (23.1%) |
| 8 or more Rooms | 48 (31.0%) | 1 (3.8%) |
| Total | 155 (100.0%) | 26 (100.0%) |
Housing Structure by Heating Type in Shoal Creek Drive
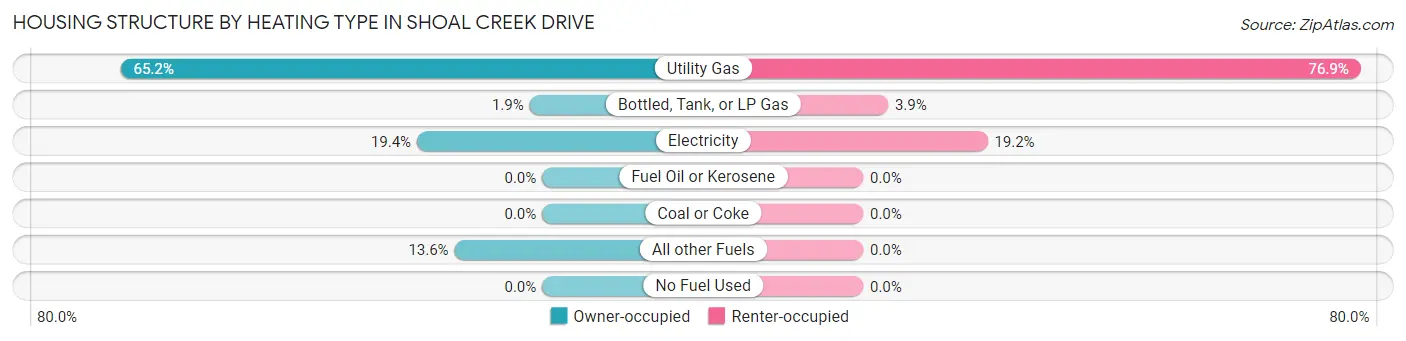
| Heating Type | Owner-occupied | Renter-occupied |
| Utility Gas | 101 (65.2%) | 20 (76.9%) |
| Bottled, Tank, or LP Gas | 3 (1.9%) | 1 (3.8%) |
| Electricity | 30 (19.4%) | 5 (19.2%) |
| Fuel Oil or Kerosene | 0 (0.0%) | 0 (0.0%) |
| Coal or Coke | 0 (0.0%) | 0 (0.0%) |
| All other Fuels | 21 (13.6%) | 0 (0.0%) |
| No Fuel Used | 0 (0.0%) | 0 (0.0%) |
| Total | 155 (100.0%) | 26 (100.0%) |
Household Vehicle Usage in Shoal Creek Drive
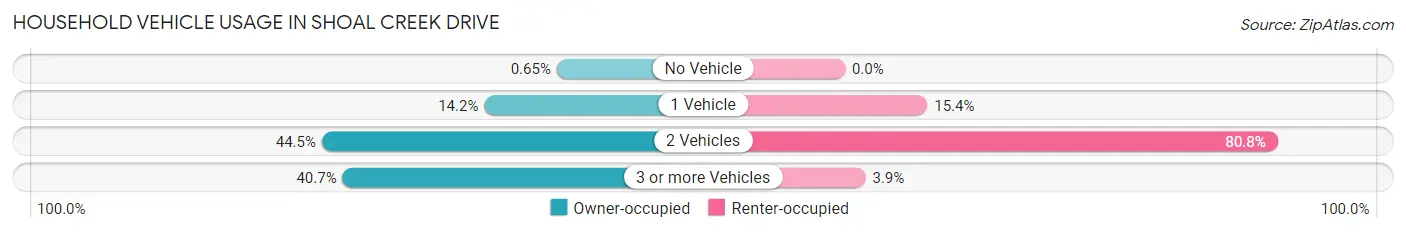
| Vehicles per Household | Owner-occupied | Renter-occupied |
| No Vehicle | 1 (0.6%) | 0 (0.0%) |
| 1 Vehicle | 22 (14.2%) | 4 (15.4%) |
| 2 Vehicles | 69 (44.5%) | 21 (80.8%) |
| 3 or more Vehicles | 63 (40.6%) | 1 (3.8%) |
| Total | 155 (100.0%) | 26 (100.0%) |
Real Estate & Mortgages in Shoal Creek Drive
Real Estate and Mortgage Overview in Shoal Creek Drive
| Characteristic | Without Mortgage | With Mortgage |
| Housing Units | 62 | 93 |
| Median Property Value | $109,400 | $133,100 |
| Median Household Income | - | - |
| Monthly Housing Costs | $617 | $0 |
| Real Estate Taxes | $862 | $0 |
Property Value by Mortgage Status in Shoal Creek Drive
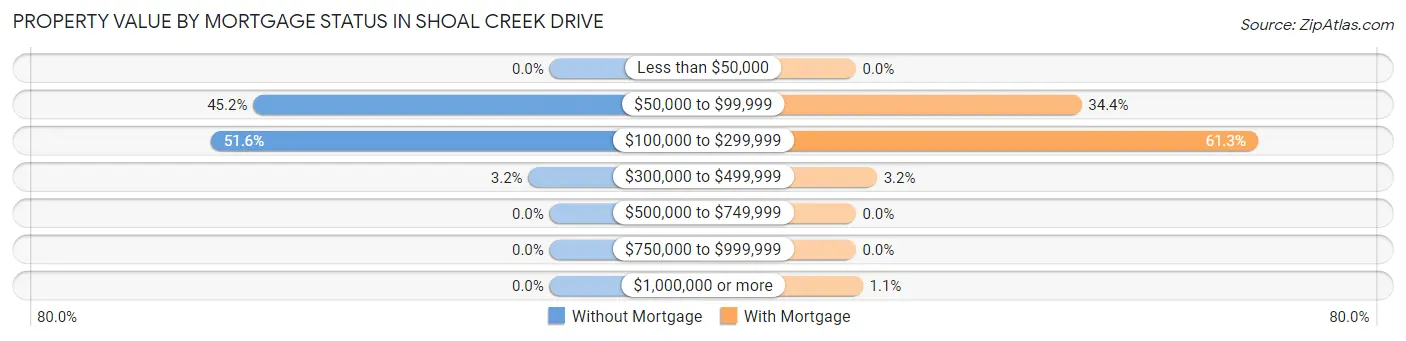
| Property Value | Without Mortgage | With Mortgage |
| Less than $50,000 | 0 (0.0%) | 0 (0.0%) |
| $50,000 to $99,999 | 28 (45.2%) | 32 (34.4%) |
| $100,000 to $299,999 | 32 (51.6%) | 57 (61.3%) |
| $300,000 to $499,999 | 2 (3.2%) | 3 (3.2%) |
| $500,000 to $749,999 | 0 (0.0%) | 0 (0.0%) |
| $750,000 to $999,999 | 0 (0.0%) | 0 (0.0%) |
| $1,000,000 or more | 0 (0.0%) | 1 (1.1%) |
| Total | 62 (100.0%) | 93 (100.0%) |
Household Income by Mortgage Status in Shoal Creek Drive
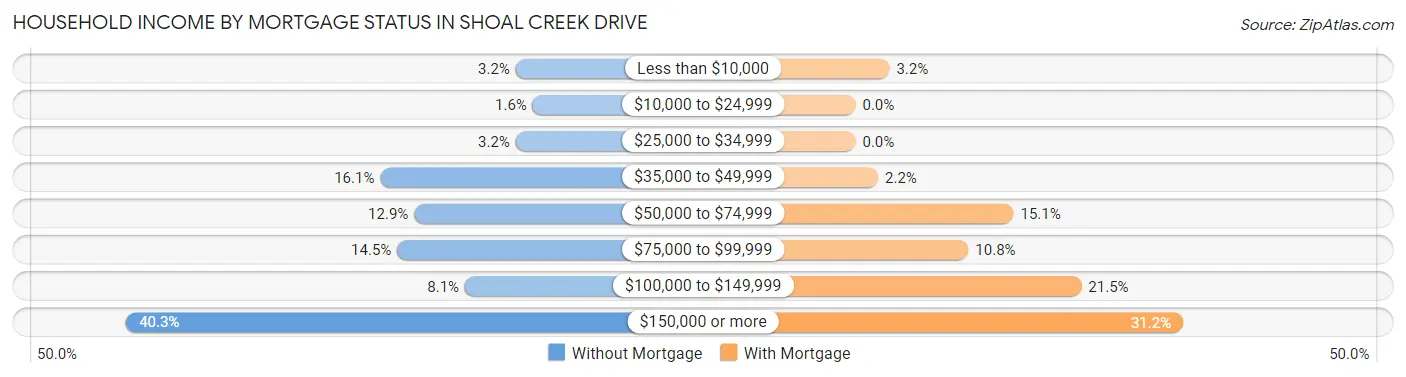
| Household Income | Without Mortgage | With Mortgage |
| Less than $10,000 | 2 (3.2%) | 3 (3.2%) |
| $10,000 to $24,999 | 1 (1.6%) | 0 (0.0%) |
| $25,000 to $34,999 | 2 (3.2%) | 0 (0.0%) |
| $35,000 to $49,999 | 10 (16.1%) | 2 (2.1%) |
| $50,000 to $74,999 | 8 (12.9%) | 14 (15.0%) |
| $75,000 to $99,999 | 9 (14.5%) | 10 (10.7%) |
| $100,000 to $149,999 | 5 (8.1%) | 20 (21.5%) |
| $150,000 or more | 25 (40.3%) | 29 (31.2%) |
| Total | 62 (100.0%) | 93 (100.0%) |
Property Value to Household Income Ratio in Shoal Creek Drive
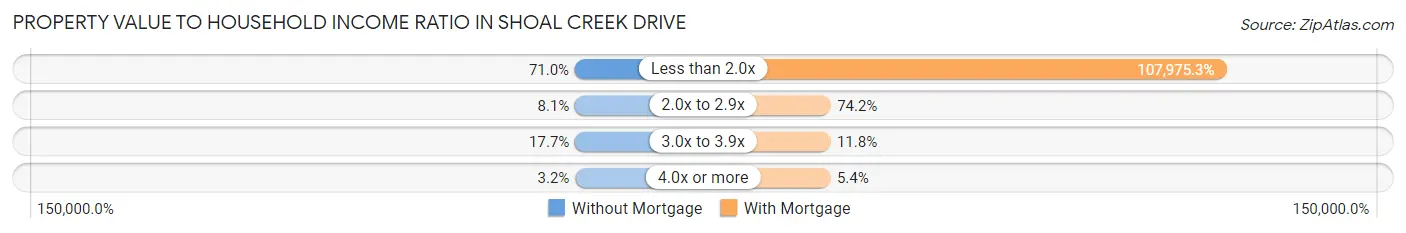
| Value-to-Income Ratio | Without Mortgage | With Mortgage |
| Less than 2.0x | 44 (71.0%) | 100,417 (107,975.3%) |
| 2.0x to 2.9x | 5 (8.1%) | 69 (74.2%) |
| 3.0x to 3.9x | 11 (17.7%) | 11 (11.8%) |
| 4.0x or more | 2 (3.2%) | 5 (5.4%) |
| Total | 62 (100.0%) | 93 (100.0%) |
Real Estate Taxes by Mortgage Status in Shoal Creek Drive
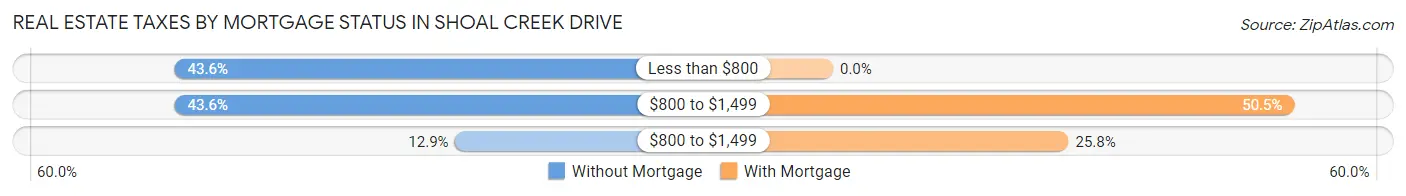
| Property Taxes | Without Mortgage | With Mortgage |
| Less than $800 | 27 (43.5%) | 0 (0.0%) |
| $800 to $1,499 | 27 (43.5%) | 47 (50.5%) |
| $800 to $1,499 | 8 (12.9%) | 24 (25.8%) |
| Total | 62 (100.0%) | 93 (100.0%) |
Health & Disability in Shoal Creek Drive
Health Insurance Coverage by Age in Shoal Creek Drive
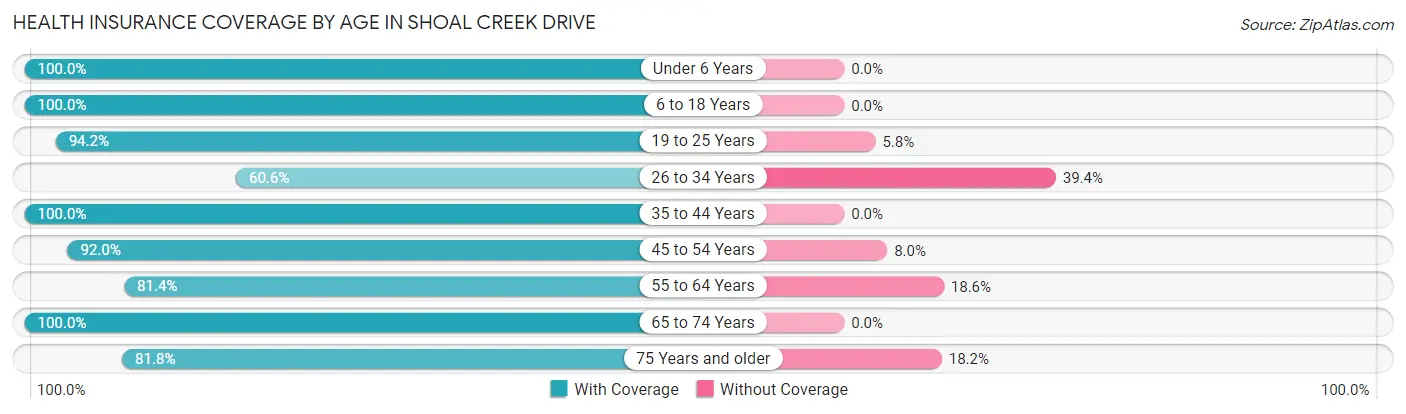
| Age Bracket | With Coverage | Without Coverage |
| Under 6 Years | 53 (100.0%) | 0 (0.0%) |
| 6 to 18 Years | 135 (100.0%) | 0 (0.0%) |
| 19 to 25 Years | 81 (94.2%) | 5 (5.8%) |
| 26 to 34 Years | 43 (60.6%) | 28 (39.4%) |
| 35 to 44 Years | 76 (100.0%) | 0 (0.0%) |
| 45 to 54 Years | 46 (92.0%) | 4 (8.0%) |
| 55 to 64 Years | 57 (81.4%) | 13 (18.6%) |
| 65 to 74 Years | 35 (100.0%) | 0 (0.0%) |
| 75 Years and older | 18 (81.8%) | 4 (18.2%) |
| Total | 544 (91.0%) | 54 (9.0%) |
Health Insurance Coverage by Citizenship Status in Shoal Creek Drive
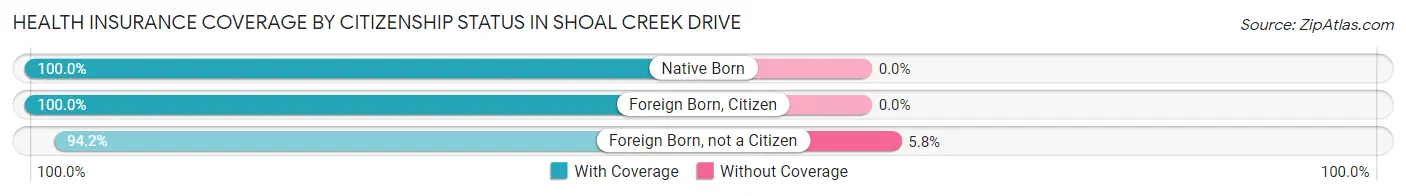
| Citizenship Status | With Coverage | Without Coverage |
| Native Born | 53 (100.0%) | 0 (0.0%) |
| Foreign Born, Citizen | 135 (100.0%) | 0 (0.0%) |
| Foreign Born, not a Citizen | 81 (94.2%) | 5 (5.8%) |
Health Insurance Coverage by Household Income in Shoal Creek Drive
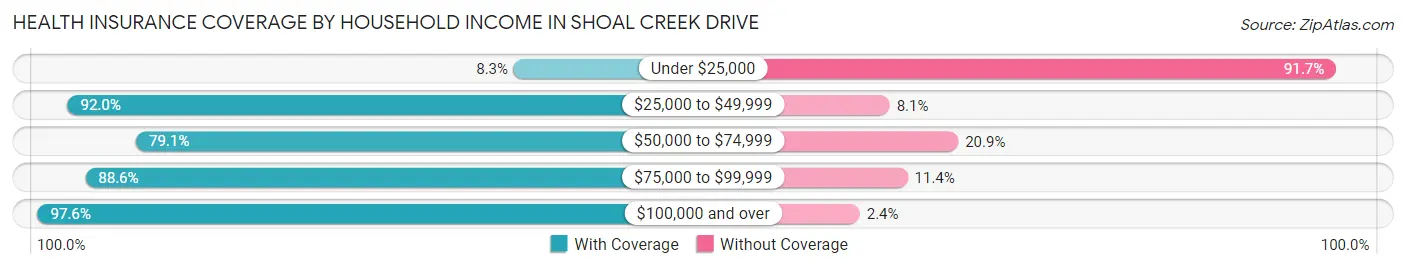
| Household Income | With Coverage | Without Coverage |
| Under $25,000 | 1 (8.3%) | 11 (91.7%) |
| $25,000 to $49,999 | 80 (91.9%) | 7 (8.1%) |
| $50,000 to $74,999 | 72 (79.1%) | 19 (20.9%) |
| $75,000 to $99,999 | 70 (88.6%) | 9 (11.4%) |
| $100,000 and over | 321 (97.6%) | 8 (2.4%) |
Public vs Private Health Insurance Coverage by Age in Shoal Creek Drive
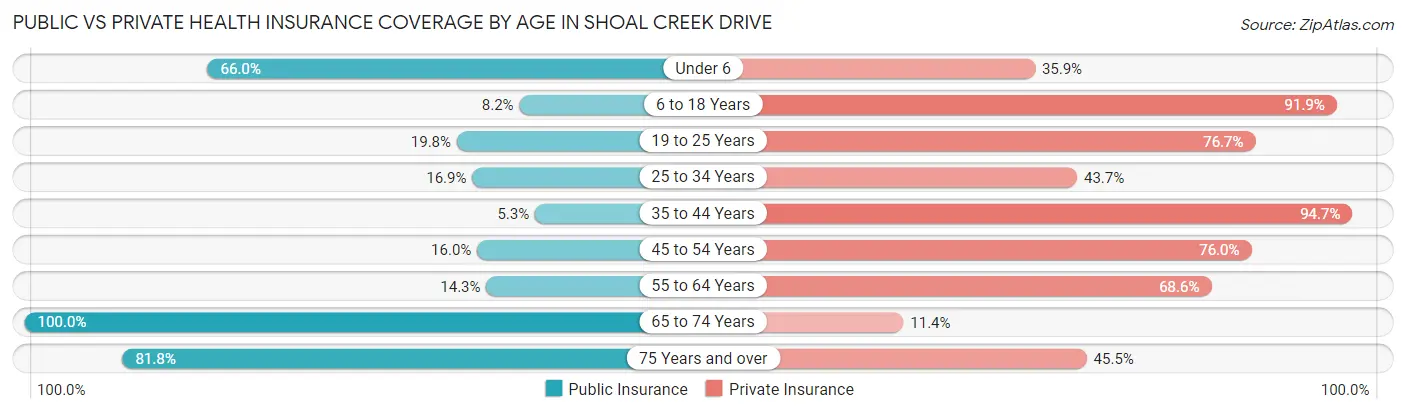
| Age Bracket | Public Insurance | Private Insurance |
| Under 6 | 35 (66.0%) | 19 (35.8%) |
| 6 to 18 Years | 11 (8.2%) | 124 (91.8%) |
| 19 to 25 Years | 17 (19.8%) | 66 (76.7%) |
| 25 to 34 Years | 12 (16.9%) | 31 (43.7%) |
| 35 to 44 Years | 4 (5.3%) | 72 (94.7%) |
| 45 to 54 Years | 8 (16.0%) | 38 (76.0%) |
| 55 to 64 Years | 10 (14.3%) | 48 (68.6%) |
| 65 to 74 Years | 35 (100.0%) | 4 (11.4%) |
| 75 Years and over | 18 (81.8%) | 10 (45.5%) |
| Total | 150 (25.1%) | 412 (68.9%) |
Disability Status by Sex by Age in Shoal Creek Drive
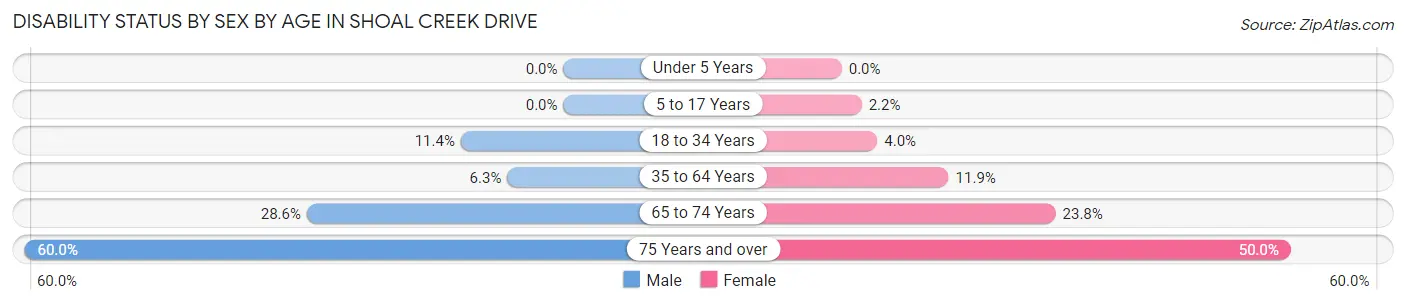
| Age Bracket | Male | Female |
| Under 5 Years | 0 (0.0%) | 0 (0.0%) |
| 5 to 17 Years | 0 (0.0%) | 2 (2.2%) |
| 18 to 34 Years | 8 (11.4%) | 4 (4.0%) |
| 35 to 64 Years | 7 (6.2%) | 10 (11.9%) |
| 65 to 74 Years | 4 (28.6%) | 5 (23.8%) |
| 75 Years and over | 6 (60.0%) | 6 (50.0%) |
Disability Class by Sex by Age in Shoal Creek Drive
Disability Class: Hearing Difficulty
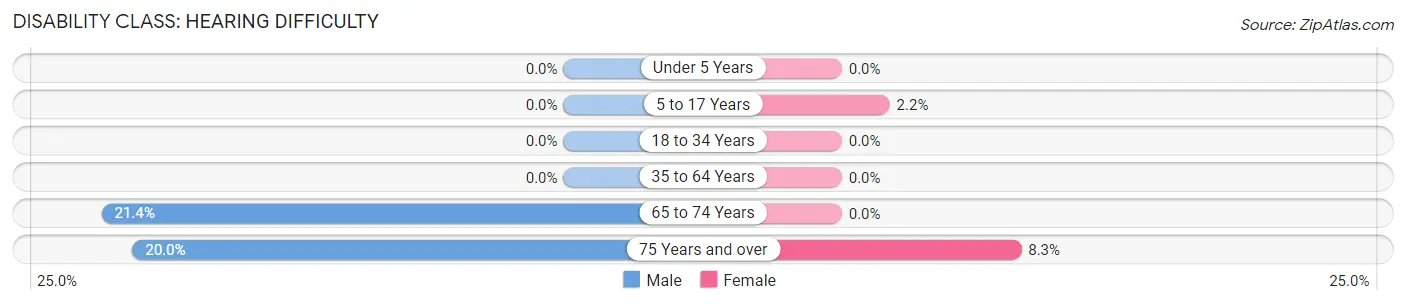
| Age Bracket | Male | Female |
| Under 5 Years | 0 (0.0%) | 0 (0.0%) |
| 5 to 17 Years | 0 (0.0%) | 2 (2.2%) |
| 18 to 34 Years | 0 (0.0%) | 0 (0.0%) |
| 35 to 64 Years | 0 (0.0%) | 0 (0.0%) |
| 65 to 74 Years | 3 (21.4%) | 0 (0.0%) |
| 75 Years and over | 2 (20.0%) | 1 (8.3%) |
Disability Class: Vision Difficulty
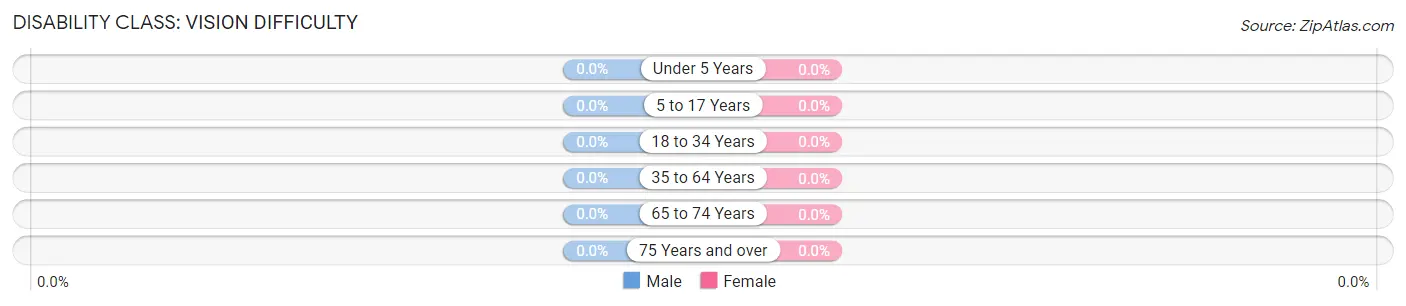
| Age Bracket | Male | Female |
| Under 5 Years | 0 (0.0%) | 0 (0.0%) |
| 5 to 17 Years | 0 (0.0%) | 0 (0.0%) |
| 18 to 34 Years | 0 (0.0%) | 0 (0.0%) |
| 35 to 64 Years | 0 (0.0%) | 0 (0.0%) |
| 65 to 74 Years | 0 (0.0%) | 0 (0.0%) |
| 75 Years and over | 0 (0.0%) | 0 (0.0%) |
Disability Class: Cognitive Difficulty
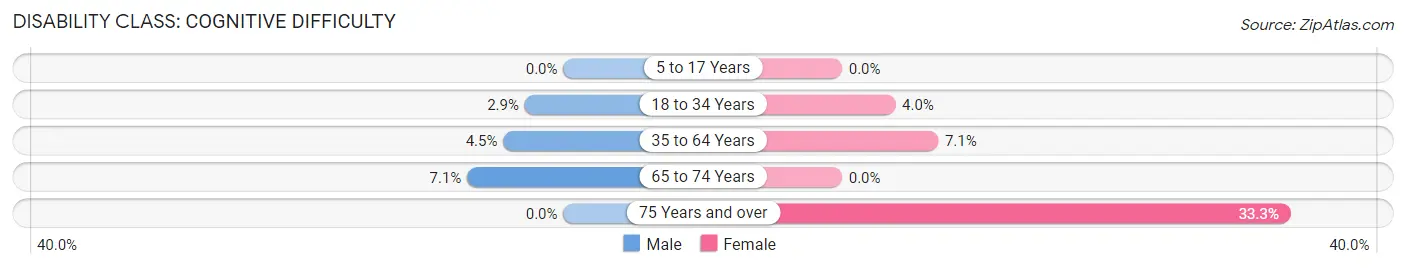
| Age Bracket | Male | Female |
| 5 to 17 Years | 0 (0.0%) | 0 (0.0%) |
| 18 to 34 Years | 2 (2.9%) | 4 (4.0%) |
| 35 to 64 Years | 5 (4.5%) | 6 (7.1%) |
| 65 to 74 Years | 1 (7.1%) | 0 (0.0%) |
| 75 Years and over | 0 (0.0%) | 4 (33.3%) |
Disability Class: Ambulatory Difficulty
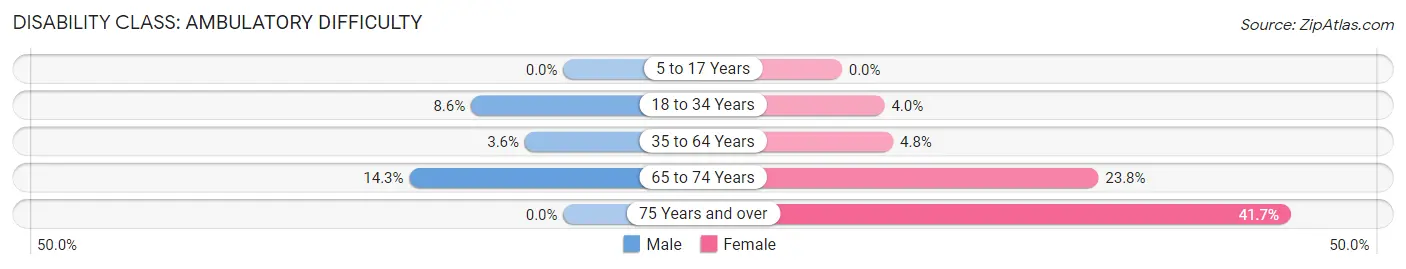
| Age Bracket | Male | Female |
| 5 to 17 Years | 0 (0.0%) | 0 (0.0%) |
| 18 to 34 Years | 6 (8.6%) | 4 (4.0%) |
| 35 to 64 Years | 4 (3.6%) | 4 (4.8%) |
| 65 to 74 Years | 2 (14.3%) | 5 (23.8%) |
| 75 Years and over | 0 (0.0%) | 5 (41.7%) |
Disability Class: Self-Care Difficulty
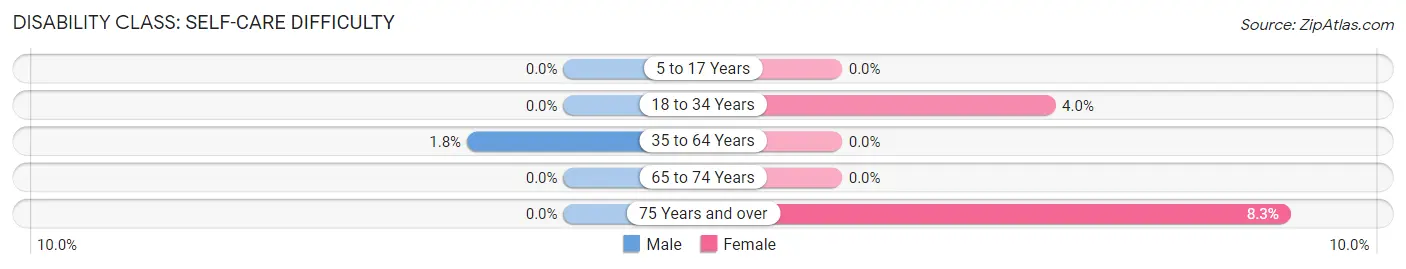
| Age Bracket | Male | Female |
| 5 to 17 Years | 0 (0.0%) | 0 (0.0%) |
| 18 to 34 Years | 0 (0.0%) | 4 (4.0%) |
| 35 to 64 Years | 2 (1.8%) | 0 (0.0%) |
| 65 to 74 Years | 0 (0.0%) | 0 (0.0%) |
| 75 Years and over | 0 (0.0%) | 1 (8.3%) |
Technology Access in Shoal Creek Drive
Computing Device Access in Shoal Creek Drive
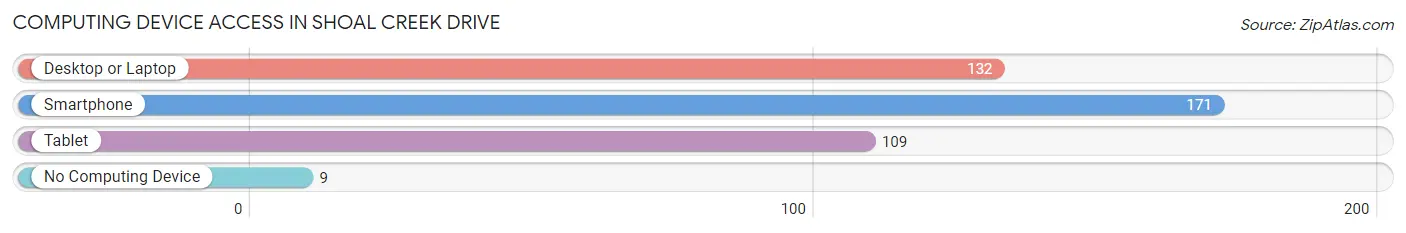
| Device Type | # Households | % Households |
| Desktop or Laptop | 132 | 72.9% |
| Smartphone | 171 | 94.5% |
| Tablet | 109 | 60.2% |
| No Computing Device | 9 | 5.0% |
| Total | 181 | 100.0% |
Internet Access in Shoal Creek Drive
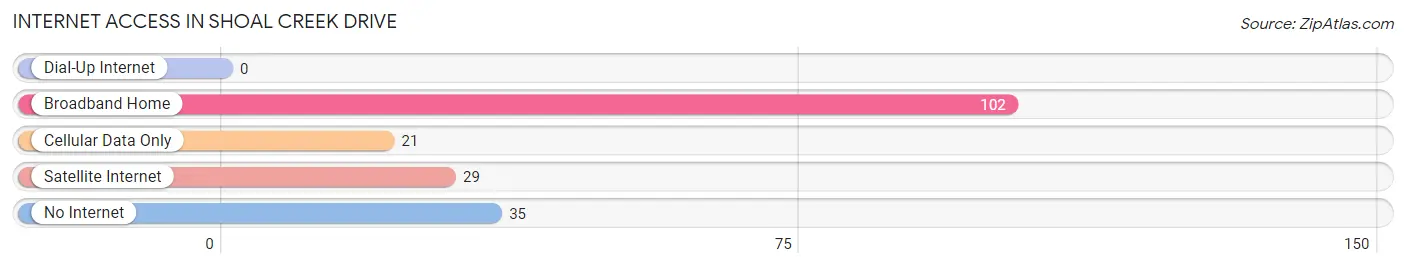
| Internet Type | # Households | % Households |
| Dial-Up Internet | 0 | 0.0% |
| Broadband Home | 102 | 56.4% |
| Cellular Data Only | 21 | 11.6% |
| Satellite Internet | 29 | 16.0% |
| No Internet | 35 | 19.3% |
| Total | 181 | 100.0% |
Shoal Creek Drive Summary
Shoal Creek Drive is a major thoroughfare in the city of Kansas City, Missouri. It is a major artery that connects the city’s downtown area to the suburbs of North Kansas City, Claycomo, and Liberty. The road is a major hub for commuters, businesses, and tourists alike.
History
Shoal Creek Drive was originally constructed in the late 1800s as a dirt road. It was used primarily as a route for farmers to transport their goods to the city. In the early 1900s, the road was paved and became a major thoroughfare for the city. It was also used as a route for the streetcar system that ran through the city.
In the 1950s, the road was widened and improved to accommodate the increasing traffic. In the 1960s, the road was further improved and widened to accommodate the growing number of cars and trucks. In the 1970s, the road was widened again to accommodate the increasing number of commuters.
In the 1980s, the road was widened yet again to accommodate the increasing number of businesses and tourists. In the 1990s, the road was widened yet again to accommodate the increasing number of commuters and businesses.
Geography
Shoal Creek Drive is located in the heart of Kansas City, Missouri. It is a major artery that connects the city’s downtown area to the suburbs of North Kansas City, Claycomo, and Liberty. The road is a major hub for commuters, businesses, and tourists alike.
The road is bordered by the Missouri River to the north and the Kansas City Zoo to the south. It is also bordered by the Country Club Plaza to the east and the Westport area to the west. The road is also bordered by the University of Missouri-Kansas City to the northeast and the Kansas City International Airport to the southwest.
Economy
Shoal Creek Drive is a major hub for businesses and tourists alike. The road is home to a variety of businesses, including restaurants, hotels, retail stores, and entertainment venues. The road is also home to a variety of tourist attractions, including the Country Club Plaza, the Kansas City Zoo, and the Westport area.
The road is also home to a variety of corporate headquarters, including Hallmark Cards, Sprint, and H&R Block. The road is also home to a variety of medical facilities, including the University of Missouri-Kansas City Medical Center and the Truman Medical Center.
Demographics
Shoal Creek Drive is home to a diverse population. According to the 2010 census, the population of the area was approximately 28,000. The population is primarily composed of African Americans, Hispanics, and Caucasians. The median household income in the area is approximately $45,000.
The area is also home to a variety of educational institutions, including the University of Missouri-Kansas City, the Kansas City Art Institute, and the Kansas City University of Medicine and Biosciences. The area is also home to a variety of cultural attractions, including the Nelson-Atkins Museum of Art, the Kansas City Symphony, and the Kansas City Repertory Theatre.
Conclusion
Shoal Creek Drive is a major thoroughfare in the city of Kansas City, Missouri. It is a major artery that connects the city’s downtown area to the suburbs of North Kansas City, Claycomo, and Liberty. The road is a major hub for commuters, businesses, and tourists alike. The road is home to a diverse population and a variety of businesses, educational institutions, and cultural attractions. The road is also home to a variety of corporate headquarters and medical facilities.
Common Questions
What is the Total Population of Shoal Creek Drive?
Total Population of Shoal Creek Drive is 598.
What is the Total Male Population of Shoal Creek Drive?
Total Male Population of Shoal Creek Drive is 264.
What is the Total Female Population of Shoal Creek Drive?
Total Female Population of Shoal Creek Drive is 334.
What is the Ratio of Males per 100 Females in Shoal Creek Drive?
There are 79.04 Males per 100 Females in Shoal Creek Drive.
What is the Ratio of Females per 100 Males in Shoal Creek Drive?
There are 126.52 Females per 100 Males in Shoal Creek Drive.
What is the Median Population Age in Shoal Creek Drive?
Median Population Age in Shoal Creek Drive is 27.7 Years.
What is the Average Family Size in Shoal Creek Drive
Average Family Size in Shoal Creek Drive is 3.7 People.
What is the Average Household Size in Shoal Creek Drive
Average Household Size in Shoal Creek Drive is 3.3 People.
What is Per Capita Income in Shoal Creek Drive?
Per Capita income in Shoal Creek Drive is $28,846.
What is the Median Family Income in Shoal Creek Drive?
Median Family Income in Shoal Creek Drive is $98,125.
What is the Median Household income in Shoal Creek Drive?
Median Household Income in Shoal Creek Drive is $96,875.
What is Income or Wage Gap in Shoal Creek Drive?
Income or Wage Gap in Shoal Creek Drive is 49.3%.
Women in Shoal Creek Drive earn 50.7 cents for every dollar earned by a man.
What is Inequality or Gini Index in Shoal Creek Drive?
Inequality or Gini Index in Shoal Creek Drive is 0.34.
How Large is the Labor Force in Shoal Creek Drive?
There are 287 People in the Labor Forcein in Shoal Creek Drive.
What is the Percentage of People in the Labor Force in Shoal Creek Drive?
65.7% of People are in the Labor Force in Shoal Creek Drive.
What is the Unemployment Rate in Shoal Creek Drive?
Unemployment Rate in Shoal Creek Drive is 2.4%.